Embed Size (px)
Citation preview
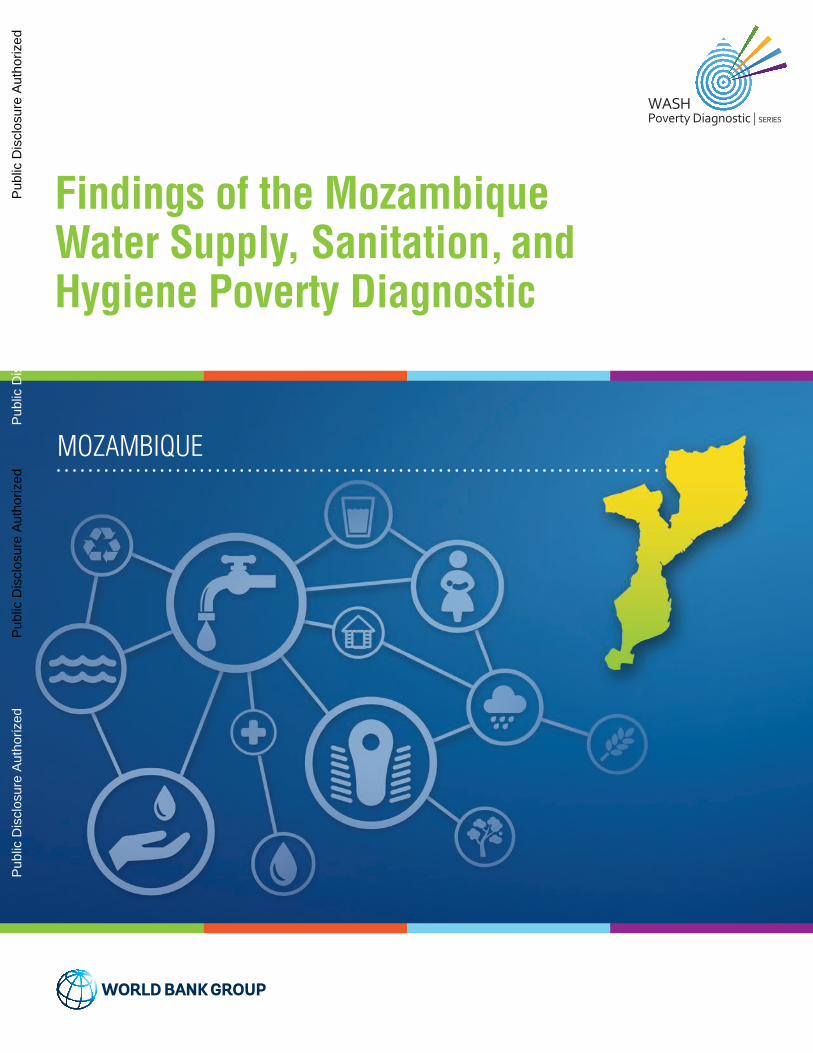
Findings of the Mozambique Water Supply, Sanitation, and Hygiene Poverty Diagnostic
MOZAMBIQUE
Findings of the Mozam
bique Water Supply, Sanitation, and Hygiene Poverty Diagnostic
Pub
lic D
iscl
osur
e A
utho
rized
Pub
lic D
iscl
osur
e A
utho
rized
Pub
lic D
iscl
osur
e A
utho
rized
Pub
lic D
iscl
osur
e A
utho
rized
This work was financed by the World Bank Water and Sanitation Program and the Swedish International Development Cooperation Agency and was a multi-Global Practice initiative led by Water and Poverty with significant support from Governance and Health, Nutrition, and Population.

Findings of the Mozambique Water Supply, Sanitation, and Hygiene Poverty Diagnostic
© 2018 International Bank for Reconstruction and Development / The World Bank1818 H Street NW, Washington, DC 20433Telephone: 202-473-1000; Internet: www.worldbank.org
This work is a product of the staff of The World Bank with external contributions. The findings, interpretations, and conclusions expressed in this work do not necessarily reflect the views of The World Bank, its Board of Executive Directors, or the governments they represent.
The World Bank does not guarantee the accuracy of the data included in this work. The boundaries, colors, denominations, and other information shown on any map in this work do not imply any judgment on the part of The World Bank concerning the legal status of any territory or the endorsement or acceptance of such boundaries.
Rights and Permissions
The material in this work is subject to copyright. Because The World Bank encourages dissemination of its knowledge, this work may be reproduced, in whole or in part, for noncommercial purposes as long as full attribution to this work is given.
Please cite the work as follows: World Bank. 2018. Findings of the Mozambique Water Supply,
Sanitation, and Hygiene Poverty Diagnostic. WASH Poverty Diagnostic. World Bank, Washington, DC.
Any queries on rights and licenses, including subsidiary rights, should be addressed to World Bank Publications, The World Bank Group, 1818 H Street NW, Washington, DC 20433, USA; fax: 202-522-2625; e-mail: pubrights @ worldbank.org.
Cover design: Bill Pragluski, Critical Stages LLC.
Findings of the Mozambique Water Supply, Sanitation, and Hygiene Poverty Diagnostic iii
Acknowledgments vii
Executive Summary 1Poverty and Access to Basic Services 1Water and Sanitation Key Messages 2Water Supply and Sanitation Institutional Challenges 4WASH and Health Linkages 5Lessons Learned and Recommendations 6
Lesson 1 6Lesson 2 7Lesson 3 7Lesson 4 7Lesson 5 8
Tables of Findings 9References 14
Chapter 1 Country Background and Introduction 15Political and Sociodemographic Transformations 15Poverty, Economic Growth, and Human Development 16Water and Sanitation, Sickness, Child Nutrition, and Health Risks 18Linkages between Water Supply and Sanitation Access, Poverty, and Inequity 20WASH Service Delivery 22Governance and Rural Constraints 23
Constraints to Achieving Better Sector Results 23Notes 24References 24
Chapter 2 Impact of Poor WASH on Health 27Interrelated Burdens of Nutrition and Disease 27WASH Poverty-Risk Model 32
Susceptibility Factors 34Lessons and Important Messages 37Notes 37References 37
Chapter 3 Trends in Access to Improved Water Supply and Sanitation 39Water Access and Coverage Trends 39
Provincial Water-Supply Coverage Inequities 41Sanitation Access and Coverage Trends 43Open Defecation and Hygiene 46Key Messages 48Notes 49References 49
Chapter 4 Service Quality, Availability, and Affordability 51Drinking-Water Quality Regulations 51
Urban Water Quality 51Availability 54Affordability 56Key Messages 59Notes 59References 60
Contents

iv Findings of the Mozambique Water Supply, Sanitation, and Hygiene Poverty Diagnostic
Chapter 5 Institutional Impact on Service Delivery 61Institutional Arrangements and Guiding Legislation for Service Delivery 62
Urban Water in Fast-Growing Cities 65Urban Water in Small Towns 66Rural Water 66Sanitation: Urban versus Rural 68
Funding of the Water Supply and Sanitation Sectors 69Budget Overview: Water and Sanitation 70Urban Water 71Rural Water 73Urban and Rural Sanitation 74
Constraints on Reaching the Poorest: Rural Water Services 75Constraints on Needs-Based Budgetary Allocations and Effective Planning and Management 75Constraints on Oversight and Accountability of Budget Execution and Service Delivery 76
Key Messages 77References 78
BoxesBox 2.1: PRM Findings: Informing the Country Partnership Framework of
Mozambique 32Box 2.2: Recommendations for WASH Data Improvements in National
Surveys and Census 35Box 5.1: Planning Policies and Targets of the WASH Sector to 2025 62Box 5.2: Fiscal Decentralization Related to Rural Service Delivery 64Box 5.3: Delegated Management Framework in Small Towns 67Box 5.4: Why Invest in Sanitation and Drainage in Mozambique? 69
FiguresFigure ES.1: Water-Access Trends Relative to Comparable Countries 2Figure ES.2: Sanitation-Access Trends Relative to Comparable Countries 3Figure 1.1: Bottom 40 Percent, by Province, 2015 17Figure 1.2: Percentage of the Population Using Improved Drinking Water:
Mozambique and the Region, 2012 21Figure 1.3: Access to Sanitation, Selected Countries 21Figure 2.1: Child Malnutrition in the UNICEF Conceptual Framework 28Figure 2.2: Child Malnutrition Indicators, by Province and B40 and T60, 2011 29Figure 2.3: Mozambique’s Estimated Number of Stunted Children and
Projections to 2025 30Figure 2.4: Conceptual Framework of Susceptibility, Exposure, and Overall
Risk Indexes 34Figure 3.1: Trends in Water Access, by Type and Area, 2003–15 39Figure 3.2: Access to Improved Water, by Wealth Quintiles 41Figure 3.3: Access to Piped Water in Urban and Rural Areas for B40 and T60 42Figure 3.4: Access Rates for Water, by Province and B40 and T60, 2015 42Figure 3.5: Access to Piped Water or Surface Water, by Province and B40
and T60, 2015 43Figure 3.6: Sanitation-Access Trends, by Type and Area, 2003–15 44FIgure 3.7: Sanitation Service Chain 45Figure 3.8: Improved Sanitation Access Rates: National, Urban, Rural for
B40 and T60 46
Findings of the Mozambique Water Supply, Sanitation, and Hygiene Poverty Diagnostic v
Figure 3.9: Open Defecation Rates, Rural Areas, B40 and T60 47Figure 3.10: Access to Improved Sanitation and Use of Open Defecation, by
Province, 2015 47Figure 3.11: Proportion of Households with a Place for Handwashing
with Soap, 2011 48Figure 4.1: Evolution of Compliance of Water-Quality Parameters 52Figure 4.2: Reduction in the Incidence of Diarrhea through WASH
Interventions 53Figure 4.3: Time to Reach Water Supply or Sanitation Facilities
(Rural Areas), Mozambique 55Figure 4.4: Reasons for Not Being Connected 58Figure 5.1: Mozambique Public Sector Structure 63Figure B5.3.1: Number of Systems Delegated and People Served Per System 67Figure 5.2: Historical Development of Delegated Management in Small Towns 68Figure 5.3: Annual Investment Requirements and Anticipated Funding Source 71Figure 5.4: Annotated Schematic of Subsector Financial Flows 72
MapsMap 1.1: Poverty Headcount and Open-Defecation Rates, by
Administrative Post 16Map 1.2: WASH-Related Enteric Burden, by Province 19Map 1.3: Proportion of the Population with Access to Improved Water and
Improved Sanitation, by Administrative Post 19Map 2.1: Exposure, Susceptibility, and Risk Indexes 35
TablesTable ES.1: Provincial Summary 9Table ES.2: Subsector Summary 12Table 2.1: Basic Primary Health and Child Health Indicators, 2009–13 27Table 3.1: Trends in Water Access, by B40 and T60, 2003–15 40Table 3.2: Joint Monitoring Programme Drinking-Water Coverage 41Table 4.1: 2014 Customer Feedback Survey for Public Water Providers 52Table 4.2: Evolution of Household Tariffs 57Table 5.1: Distribution of Responsibilities for Central Government
Water Agencies 66Table 5.2: Proportion of External Funding to Total Funding 70Table 5.3: Comparative Expenditure on Rural and Urban Water Services
(National Budget 2013–15) 73Table 5.4: Coverage Needs and Investments for WASH in Mozambique 74


Findings of the Mozambique Water Supply, Sanitation, and Hygiene Poverty Diagnostic vii
AcknowledgmentsThe task team was led by Christian Borja-Vega (Economist, Water Practice). This piece was drafted by Kim Murrell (Consultant, Water Practice), with valuable comments from Craig Kullmann, Senior Water Supply and Sanitation Specialist; Shomikho Raha, Senior Public Sector Specialist, Governance Practice; and Vivek Srivastava, Lead Public Sector Development Specialist. Also, early drafts of this document received feedback from Luis Andres (Lead Economist, Water Practice), Heather Skilling (Consultant, Water Practice), and Pavel Luengas (Oxford University).

Findings of the Mozambique Water Supply, Sanitation, and Hygiene Poverty Diagnostic 1
Executive Summary
Poverty and Access to Basic Services
The poor are not benefiting equally from economic growth in Mozambique. Mozambique’s economy has expanded at an accelerated pace in recent years, with real, per capita gross domestic product (GDP) growing between 5 and 7 percent in the last decade, and the country’s Human Development Index (HDI) steadily rising over the last 20 years. Yet growth has not been even in the country, and the government still faces the challenge of reducing poverty and inequality across regions and provinces. In 2015 Mozambique’s population totaled an estimated 25 million, with almost half (11.2 million) living in poverty and 10 million falling in the bottom 40 percent (B40) of the wealth distribution in the country.
Persistent poverty is “regionalized” in two provinces that claim a disproportionate number and proportion of the poor. This condition has led to wide, regional variations in poverty across the country. Specifically, Mozambique’s poor are overrepresented in two provinces, Nampula and Zambezia. These provinces together account for 38 percent of the total population, and represent 48 percent of the 11.2 million Mozambicans living in poverty. Inequities at the provincial level grew the most between 1996 and 2003. The poverty gap has continued to grow within some southern and central provinces since 2003. In Gaza and Zambezia, for example, the poverty gap has widened over the last 20 years.
Significant disparities distinguish urban and rural poverty. The B40 in terms of wealth distribution is concentrated in the central region of the country, while wealthy households increasingly tend to live in urban areas. For instance, between 1996 and 2015, the proportion of people in the bottom group in rural areas of Niassa and Cabo Delgado increased from 41 percent and 36 percent of the provincial population, respectively, to 57 percent and 55 percent. In urban areas, the proportion of people who fell in the B40 category did not increase in any province over this same period. In contrast, urban poverty rates experienced large decreases overall, in particular in Nampula, Manica, and Tete Provinces. The smallest gaps between rural and urban poverty are found in the south of the country, specifically in Gaza, Inhambane, and Maputo Provinces, and Maputo City. The more disaggregated the information, the larger the heterogeneity in water and sanitation coverage and poverty ratios, particularly in less-poor provinces.
The ability of the poor to access improved water and sanitation services remains stagnant. The B40 has seen little change over the last five years in terms of its access to improved water sources and the gap is growing between this group and the top 60 (T60) percent in terms of access to piped water. In 1996, that gap was 27 percentage points, but by 2015, it had grown to 54 percentage points. The gaps in the rate of access to improved sanitation remained practically unchanged across all quintiles of the wealth distribution between 2002 and 2015. While access to improved sanitation remains low throughout the country, these low rates mask large inequalities in access that are borne mostly by the B40. These inequities are even larger in rural areas, with households headed by females, or individuals without primary education, affected the most.
Most Mozambicans live in districts with below-average or unchanged rates of access to improved water and sanitation. In 2007, some 97 of Mozambique’s 129 districts had improved water or sanitation coverage rates that were below the national average. Only 35 percent of the population live in districts with improved rates of water and sanitation coverage above the national average. Nampula and Zambezia, the poorest provinces, have some of the lowest district-level access rates.
2 Findings of the Mozambique Water Supply, Sanitation, and Hygiene Poverty Diagnostic
And access to basic WASH services has spillover effects on the educational outcomes of children. In Mozambique, school attendance is slightly higher in male and female school-aged children with improved sanitation access, improved water access, and a distance to water of less than 30 minutes’ round-trip from the household, compared with children with unimproved WASH characteristics. The closer the access to water sources by poor households, the higher the school attendance of children dwelling in those same poor households, especially in the provinces of Tete and Cabo Delgado.
Water and Sanitation Key Messages
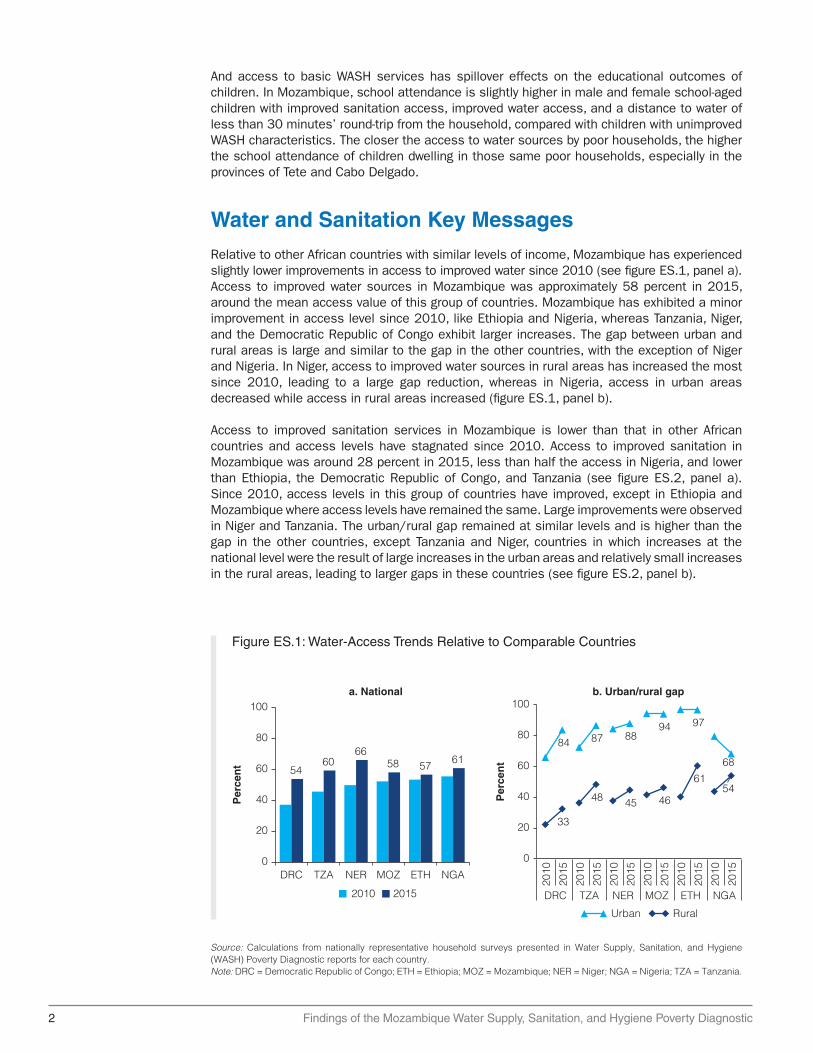
Relative to other African countries with similar levels of income, Mozambique has experienced slightly lower improvements in access to improved water since 2010 (see figure ES.1, panel a). Access to improved water sources in Mozambique was approximately 58 percent in 2015, around the mean access value of this group of countries. Mozambique has exhibited a minor improvement in access level since 2010, like Ethiopia and Nigeria, whereas Tanzania, Niger, and the Democratic Republic of Congo exhibit larger increases. The gap between urban and rural areas is large and similar to the gap in the other countries, with the exception of Niger and Nigeria. In Niger, access to improved water sources in rural areas has increased the most since 2010, leading to a large gap reduction, whereas in Nigeria, access in urban areas decreased while access in rural areas increased (figure ES.1, panel b).
Access to improved sanitation services in Mozambique is lower than that in other African countries and access levels have stagnated since 2010. Access to improved sanitation in Mozambique was around 28 percent in 2015, less than half the access in Nigeria, and lower than Ethiopia, the Democratic Republic of Congo, and Tanzania (see figure ES.2, panel a). Since 2010, access levels in this group of countries have improved, except in Ethiopia and Mozambique where access levels have remained the same. Large improvements were observed in Niger and Tanzania. The urban/rural gap remained at similar levels and is higher than the gap in the other countries, except Tanzania and Niger, countries in which increases at the national level were the result of large increases in the urban areas and relatively small increases in the rural areas, leading to larger gaps in these countries (see figure ES.2, panel b).
Source: Calculations from nationally representative household surveys presented in Water Supply, Sanitation, and Hygiene (WASH) Poverty Diagnostic reports for each country.Note: DRC = Democratic Republic of Congo; ETH = Ethiopia; MOZ = Mozambique; NER = Niger; NGA = Nigeria; TZA = Tanzania.
Figure ES.1: Water-Access Trends Relative to Comparable Countries
54
DRC TZA NER MOZ ETH NGA
6066
a. National
Per
cen
t 58 5761
0
20
40
60
80
100
2010 2015
Per
cen
t
b. Urban/rural gap
84 87 8894 97
68
33
48 45 46
6154
0
20
40
60
80
100
DRC TZA NER MOZ ETH NGA
2010
2015
2010
2015
2010
2015
2010
2015
2010
2015
2010
2015
Urban Rural

Findings of the Mozambique Water Supply, Sanitation, and Hygiene Poverty Diagnostic 3
Evidence shows significant disparities in water supply and sanitation services between rural and urban, bottom 40 percent and top 60 percent of the wealth distribution, and regions within Mozambique. This requires investments to be rebalanced and better targeted to increase shared prosperity, end poverty, and achieve the SDGs. Recent data (2015) show the following gaps in coverage goals: rural water coverage reached 6.3 million people, against the 11 million coverage goal set for 2015; urban water, in contrast, reached a coverage of 6.6 million against a goal of 6 million people with coverage by 2015. Improved sanitation coverage has increased only 1 percent per year, on average, over the last 13 years. To achieve the government’s coverage goals the country needs to increase coverage by between 2.5 and 3.5 percent a year. In particular, sanitation must be placed at the forefront of strategic objectives for poverty reduction because of the strong and negative public health impacts when coverage is low, particularly for the poorest.
Water-coverage rates are generally higher in urban areas than rural ones, but providers in urban areas have also put limited emphasis on service and water quality. Investments have been increasing in Mozambique for the development and expansion of infrastructure to provide drinking water, mainly through external donor funding. However, projects have mostly focused on increasing production and availability, with little attention paid to other, equally important aspects of delivery, such as water quality or the quality of service. The availability of piped water (to premises or neighborhoods) is declining in four provinces (Niassa, Cabo Delgado, Zambezia, and Manica). Two of these provinces have the greatest percentages of poor populations (Zambezia, with 70 percent, and Cabo Delgado, with 62 percent).
Access to improved sanitation is more the exception in urban areas than the norm. The share of households with access to improved sanitation facilities increased from 14 percent to 28 percent nationally between 2003 and 2015. Urban coverage increased from 38 percent to 59 percent over the same period. Increasing urban sanitation coverage is critical to tackling diseases in densely populated areas.
Source: Calculations from nationally representative household surveys presented in Water Supply, Sanitation, and Hygiene (WASH) Poverty Diagnostic reports for each country.Note: DRC = Democratic Republic of Congo; ETH = Ethiopia; MOZ = Mozambique; NER = Niger; NGA = Nigeria; TZA = Tanzania.
Figure ES.2: Sanitation-Access Trends Relative to Comparable Countries
20
32 28
4338
73
0
20
40
60
80
100
2010 2015
NER TZA MOZ DRC ETH NGA
a. National
Per
cen
t
78 75
59 6356
82
914 14
32 33
63
0
20
40
60
80
100
Urban Rural
NER TZA MOZ ETH DRC NGA
2010
2015
2010
2015
2010
2015
2010
2015
2010
2015
2010
2015
b. Urban/rural gap
Per
cen
t
4 Findings of the Mozambique Water Supply, Sanitation, and Hygiene Poverty Diagnostic
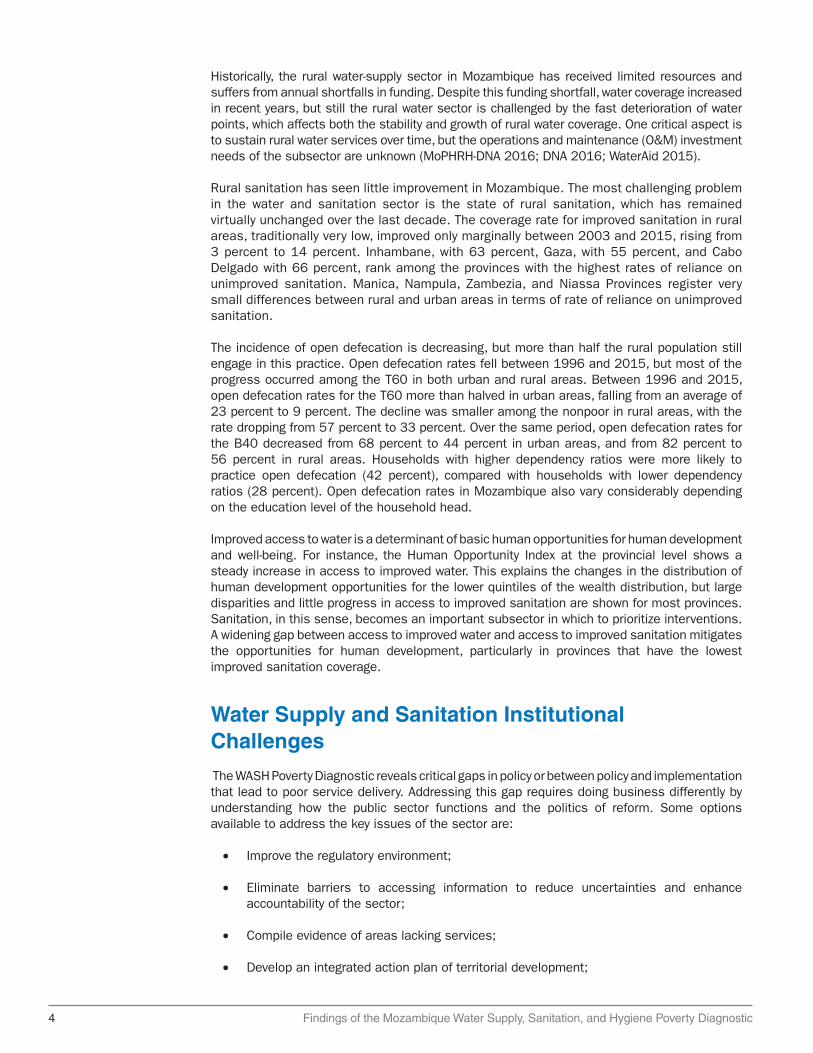
Historically, the rural water-supply sector in Mozambique has received limited resources and suffers from annual shortfalls in funding. Despite this funding shortfall, water coverage increased in recent years, but still the rural water sector is challenged by the fast deterioration of water points, which affects both the stability and growth of rural water coverage. One critical aspect is to sustain rural water services over time, but the operations and maintenance (O&M) investment needs of the subsector are unknown (MoPHRH-DNA 2016; DNA 2016; WaterAid 2015).
Rural sanitation has seen little improvement in Mozambique. The most challenging problem in the water and sanitation sector is the state of rural sanitation, which has remained virtually unchanged over the last decade. The coverage rate for improved sanitation in rural areas, traditionally very low, improved only marginally between 2003 and 2015, rising from 3 percent to 14 percent. Inhambane, with 63 percent, Gaza, with 55 percent, and Cabo Delgado with 66 percent, rank among the provinces with the highest rates of reliance on unimproved sanitation. Manica, Nampula, Zambezia, and Niassa Provinces register very small differences between rural and urban areas in terms of rate of reliance on unimproved sanitation.
The incidence of open defecation is decreasing, but more than half the rural population still engage in this practice. Open defecation rates fell between 1996 and 2015, but most of the progress occurred among the T60 in both urban and rural areas. Between 1996 and 2015, open defecation rates for the T60 more than halved in urban areas, falling from an average of 23 percent to 9 percent. The decline was smaller among the nonpoor in rural areas, with the rate dropping from 57 percent to 33 percent. Over the same period, open defecation rates for the B40 decreased from 68 percent to 44 percent in urban areas, and from 82 percent to 56 percent in rural areas. Households with higher dependency ratios were more likely to practice open defecation (42 percent), compared with households with lower dependency ratios (28 percent). Open defecation rates in Mozambique also vary considerably depending on the education level of the household head.
Improved access to water is a determinant of basic human opportunities for human development and well-being. For instance, the Human Opportunity Index at the provincial level shows a steady increase in access to improved water. This explains the changes in the distribution of human development opportunities for the lower quintiles of the wealth distribution, but large disparities and little progress in access to improved sanitation are shown for most provinces. Sanitation, in this sense, becomes an important subsector in which to prioritize interventions. A widening gap between access to improved water and access to improved sanitation mitigates the opportunities for human development, particularly in provinces that have the lowest improved sanitation coverage.
Water Supply and Sanitation Institutional Challenges
The WASH Poverty Diagnostic reveals critical gaps in policy or between policy and implementation that lead to poor service delivery. Addressing this gap requires doing business differently by understanding how the public sector functions and the politics of reform. Some options available to address the key issues of the sector are:
• Improve the regulatory environment;
• Eliminate barriers to accessing information to reduce uncertainties and enhance accountability of the sector;
• Compile evidence of areas lacking services;
• Develop an integrated action plan of territorial development;
Findings of the Mozambique Water Supply, Sanitation, and Hygiene Poverty Diagnostic 5
• Enhance the capacity of municipal staff to plan and implement service delivery initiatives;
• Enhance the capacity of microenterprises to deliver financing options to the poorest to cover water tariffs and sanitation surcharges.
The dispersed nature of rural water-supply assets and infrastructure means a central government or provincial entity would be extremely disconnected from local asset management needs and would be unlikely to be responsive. In accordance with the “gradualism” policy of the central government, the coming years are likely to see greater fiscal resources and functions decentralized to district agencies.
For both the rural water and the sanitation subsectors it is necessary to adapt an implementation structure of projects that allows the rural water subsector to benefit from the decentralization process and increase coverage at a faster pace. There are concrete steps that can be taken to bridge policy strategies and implementation activities to speed up the pace of the basic coverage with improved water and sanitation services. First, the sector needs to review and assess rural water and sanitation interventions to map the strategies and implementing roles that local governments play and the degree in which the private sector can collaborate with communities to address low coverage in remote areas. Second, the sector can reshape its strategy to tackle more aggressively the geographic inequities of service delivery by planning interventions that roll out across rural clusters with low coverage. Third, the sector can advance its implementation capacity by developing a rural water intervention framework that could be delegated to local governments to address procurement, management, and quality of service issues locally.
One critical aspect in engaging local entities to design and implement rural water and sanitation projects is to make intergovernmental transfers more agile. Sector allocations could be streamlined, simplified, and made considerably more transparent by implementing a formula-based transfer system, which is understood by all stakeholders. In the short and medium term this simple approach will promote equity in rural water allocations, as this will lead to proportionally higher allocations to the most populous provinces, which are also the poorest, and least well served by rural water services.
WASH and Health Linkages
The WASH Poverty Diagnostic demonstrates why and how investments need to be coordinated across sectors to improve human development outcomes, such as reduced childhood stunting. The country needs to improve sector coordination and the consolidation of water and sanitation investments in areas with identified poverty pockets. These investments can bring higher value for money in areas with complementary investments for improving basic health care and sustainable livelihoods.
Mozambique only met the Millennium Development Goal (MDG) target related to urban water, while missing targets related to rural water access and all targets related to sanitation. Regional disparities in accessing water and sanitation services remain significant, with some provinces demonstrating severe and enduring deficiencies, along with chronic poverty and severe health issues, including stunting.
The geographical concentration of poverty among children living in rural areas demands targeted investments that can attend the multiple challenges of the early years of life. This potential cross-sectoral coordination and integration of interventions (health, nutrition, water, and sanitation) requires investment directed to at-risk areas for those Mozambican households with certain characteristics, including those with a higher proportion of young children, pregnant women, and with limited access to basic health services.

6 Findings of the Mozambique Water Supply, Sanitation, and Hygiene Poverty Diagnostic
Poor sanitation is linked with the substantial, existing disease burdens in Mozambique. Diseases associated with poor sanitation and unsafe water account for about 20 percent of the burden of disease in the country. The low coverage rate for improved sanitation facilities contributes to health problems for both individuals and communities, by creating a breeding ground for disease, including diarrhea, dysentery, and cholera.
Key relationships between water supply and sanitation coverage rates and child health indicators help to identify areas with the highest intervention priorities. At the village level, increases in access to improved water are statistically related to decreases in the stunting rates of children while increases are also related to reductions in children’s wasting, but only when average access increases from zero up to 40 percent and remains stable after that point. Also, these patterns highlight that increases in the rates of access to improved sanitation are related to decreases in child malnutrition rates. Open defecation has a clear, increasing relation with wasting and a limited relation with stunting. Stunting rates increase from 25 percent to 45 percent when the average open defecation rates increase from zero up to 25 percent, and remain stable after that point. Such non-linear relationships shed light on the priority areas where water and sanitation services are the lowest.
A regression analysis taking into account a rich set of household sociodemographic characteristics, maternal characteristics, and child characteristics shows that inadequate access to sanitation worsens child malnutrition indicators in urban areas and in older children. The practice of unsafe disposal of child feces has consistently negative effects for all groups considered and is the only factor affecting wasting. Adequate access to improved water sources has positive effects in both urban and rural areas and for younger children.
Unimproved sanitation plays a significant adverse role in maternal and women’s health. Nearly 90 percent of the poorest mothers who received poor antenatal care (ANC) and 90 percent of underweight mothers only have access to unimproved sanitation. Approximately 75 percent who received poor ANC and 80 percent of underweight women in the poorest households have access to unimproved water sources. Provinces in northern and central Mozambique have overlapping high levels of both poor maternal health and exposure risk.
This document contains the summary of the findings from three background reports of the WASH Poverty Diagnostic in Mozambique. The structure of the document is as follows. Chapter 1 offers a snapshot of the country background and an introduction, explaining recent poverty and economic trends, and adding a perspective on the water supply and sanitation sector. Chapter 2 summarizes the findings obtained with respect to the links between water supply and sanitation and the health sector, laying out the results from a poverty-risk model. Chapter 3 offers the details of the trends in coverage and the outcomes of the water supply and sanitation sectors. Chapter 4 synthesizes the findings in terms of water-supply service quality, affordability, and availability. Finally, chapter 5 offers a synopsis of the institutional diagnostic applied to the rural water sector, where services have been lagging in terms of coverage. Two summary tables are included in this document to summarize the finding in each water supply and sanitation subsector, and a table of findings per province.
Lessons Learned and RecommendationsLesson 1
There is growing momentum around further decentralization reforms in rural areas, where most of the poor live. The designation of the District Services of Planning and Infrastructure (SDPI) as an independent budgeting unit is indicative of the acceleration of the central government’s existing “gradualism” approach to rural decentralization. This represents a unique opportunity to open the rural sector to higher levels of development finance.
Findings of the Mozambique Water Supply, Sanitation, and Hygiene Poverty Diagnostic 7
Recommendations
To advance rural water and sanitation coverage it is necessary to adapt an implementation framework of new projects that allows the rural areas to benefit from the decentralization process and increase coverage at a faster pace. National WASH sector actors pointed out that districts are preparing in the next two to four years to be empowered with greater fiscal autonomy and broader service delivery mandates for enhanced responsibilities and accountability to service users.
Lesson 2
The WASH sector faces pressing financing gaps and geographic inequities in coverage. The sector’s reliance on external funding poses risks and uncertainties for budget planning, long-term financing, and spending efficiency. Financing of basic infrastructure services, including WASH, shows a high dependency on donor financing, making funding streams fluctuate over short periods of time. The water and sanitation sector registered a 13 percent underspend—a higher level than in other social sectors. The financing constraints in the WASH sector that have accumulated over the last 15 years have resulted in a widening of the geographic disparities in terms of improved service coverage.
Recommendations
Financing of the WASH sector can improve efficiency by pursuing independent budget classifications for WASH, and separating its financial allocations and budget cycles from other sectors that are currently pooled under the Ministry of Public Works and Housing. The geographical concentration of poverty among children living in rural areas demands targeted investments that can address multiple challenges in the early years of life. This potential cross-sectoral coordination and integration requires that the investment needs in the water and sanitation sector and the health challenges of the B40 be addressed. The country has an opportunity to prioritize and bundle interventions in the districts with the highest poverty and lowest WASH and health services coverage.
Lesson 3
Mozambique accumulated valuable experience with the urban water’s Delegated Management Framework (DMF) that can be further applied to the rest of the WASH subsectors. This vital change in policy allowed the asset management capabilities of the sector’s entities to be increased, permitted the private sector’s participation in service delivery, and contributed to the consolidation of an independent regulator.
Recommendations
Delegated management frameworks (DMFs) for rural water and sanitation can create conditions to accelerate the pace of coverage. By clustering service areas in small towns and priority rural areas, local governments can facilitate the implementation of the DMFs to induce better enabling conditions for program implementation, promote commercial and financial sustainability of services, and incorporate better quality standards.
Lesson 4
In Mozambique, the national enteric burden associated with inadequate WASH is 7,824 disability-adjusted life years (DALYs) per 100,000 children per year, which is approximately 74 percent of the total burden of disease (BD) from enteric disease estimated for the country.

8 Findings of the Mozambique Water Supply, Sanitation, and Hygiene Poverty Diagnostic
The health burden of inadequate WASH is disproportionately borne by poorer children and those in vulnerable geographic areas, particularly the northern and central provinces. The burden of inadequate WASH is disproportionately borne by the poorest women with high maternal health vulnerability. Nearly 90 percent of the poorest mothers who received poor antenatal care (ANC) and 90 percent of underweight mothers only have access to unimproved sanitation. Approximately 75 percent who received poor ANC and 80 percent of underweight women in the poorest households have access to unimproved water sources.
Recommendations
There has been a large effort globally to understand and document the impact of WASH investments. This analysis suggests that overlapping vulnerabilities may substantially modify the impact of WASH investments. Analyses to understand how other vulnerabilities (for example environmental, health, and social) may change the impact of WASH interventions could provide new insights in identifying the impact of WASH investments on poverty reduction. The country could further assess whether the most vulnerable children are able to benefit from WASH services as they are offered or available, and if not, understand why.
Lesson 5
Mozambique has an opportunity to improve WASH sector statistics to better inform planning, targeting programs, and tracking of the SDGs in the future. The Access plus framework captures, besides access, other desirable dimensions—delivery, quality, availability, and affordability—of water and sanitation services. The framework proposes indicators along tiers that start from the basic MDG indicator of access to improved water or sanitation to indicators that require minimum standards in other desirable dimensions of water and sanitation services.
Recommendations
There are concrete recommendations to improve nationally representative surveys to capture the Access plus information of the WASH sector and improve the Census’s WASH questions, in the advent of the 2017 Census.
National surveys improvements. Incorporate the question of continuity of water supply service available in the DHS Phase 7 (2013–18) questionnaires. The analysis of compliance with fecal and priority chemical standards can be complemented with quality perception of drinking water used by the household (available in the IOF 2014/15) and with whether households treat water before consumption (and how). A simple question available in older questionnaires could provide a rough estimate of expenditure on water.
Census changes. Update the response categories of the question “Source of water?” to distinguish between protected or unprotected wells. Add a simple question on the time taken to reach the water source. Incorporate in the Census water questions whether the sanitation facilities are shared with other households or not. Finally, if budget and logistics allow, incorporate the question “In the past two weeks, was the water from this source not available for at least one full day?” to assess service continuity.
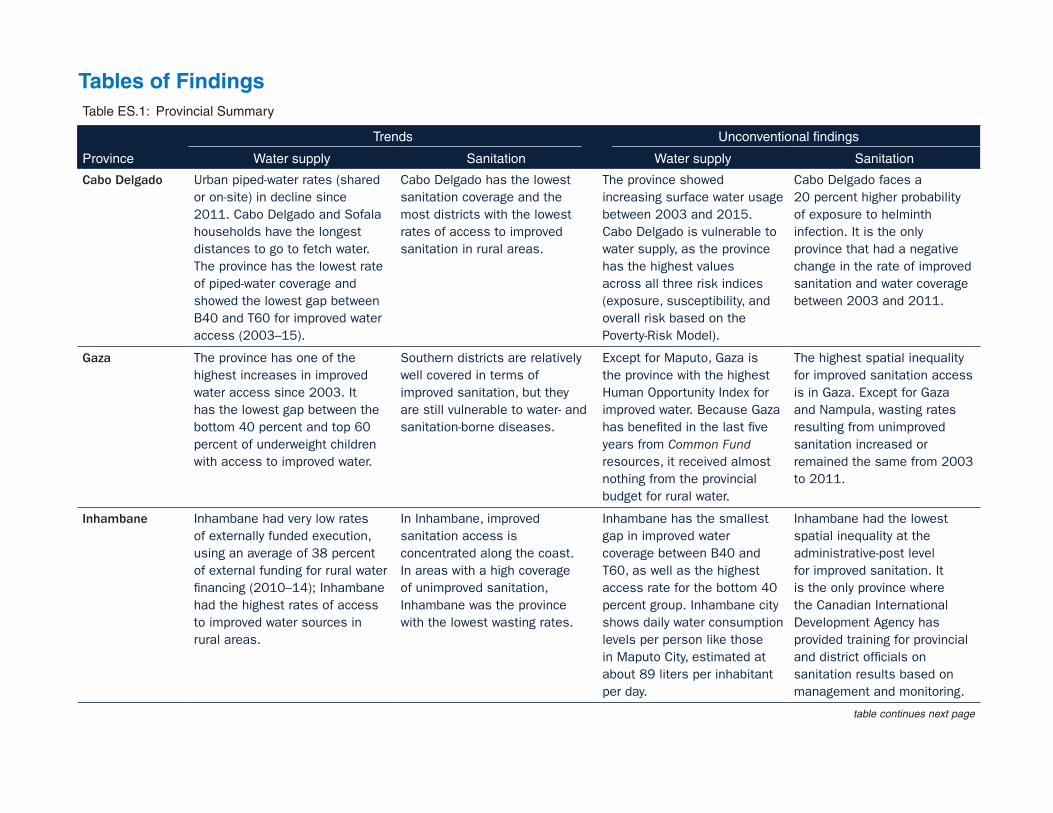
Table ES.1: Provincial Summary
Province
Trends Unconventional findings
Water supply Sanitation Water supply Sanitation
Cabo Delgado Urban piped-water rates (shared or on-site) in decline since 2011. Cabo Delgado and Sofala households have the longest distances to go to fetch water. The province has the lowest rate of piped-water coverage and showed the lowest gap between B40 and T60 for improved water access (2003–15).
Cabo Delgado has the lowest sanitation coverage and the most districts with the lowest rates of access to improved sanitation in rural areas.
The province showed increasing surface water usage between 2003 and 2015. Cabo Delgado is vulnerable to water supply, as the province has the highest values across all three risk indices (exposure, susceptibility, and overall risk based on the Poverty-Risk Model).
Cabo Delgado faces a 20 percent higher probability of exposure to helminth infection. It is the only province that had a negative change in the rate of improved sanitation and water coverage between 2003 and 2011.
Gaza The province has one of the highest increases in improved water access since 2003. It has the lowest gap between the bottom 40 percent and top 60 percent of underweight children with access to improved water.
Southern districts are relatively well covered in terms of improved sanitation, but they are still vulnerable to water- and sanitation-borne diseases.
Except for Maputo, Gaza is the province with the highest Human Opportunity Index for improved water. Because Gaza has benefited in the last five years from Common Fund resources, it received almost nothing from the provincial budget for rural water.
The highest spatial inequality for improved sanitation access is in Gaza. Except for Gaza and Nampula, wasting rates resulting from unimproved sanitation increased or remained the same from 2003 to 2011.
Inhambane Inhambane had very low rates of externally funded execution, using an average of 38 percent of external funding for rural water financing (2010–14); Inhambane had the highest rates of access to improved water sources in rural areas.
In Inhambane, improved sanitation access is concentrated along the coast. In areas with a high coverage of unimproved sanitation, Inhambane was the province with the lowest wasting rates.
Inhambane has the smallest gap in improved water coverage between B40 and T60, as well as the highest access rate for the bottom 40 percent group. Inhambane city shows daily water consumption levels per person like those in Maputo City, estimated at about 89 liters per inhabitant per day.
Inhambane had the lowest spatial inequality at the administrative-post level for improved sanitation. It is the only province where the Canadian International Development Agency has provided training for provincial and district officials on sanitation results based on management and monitoring.
table continues next page
Tables of Findings

Table ES.1: Continued
Province
Trends Unconventional findings
Water supply Sanitation Water supply Sanitation
Manica Manica has the largest gap between the bottom 40 percent and top 60 percent with unimproved water for underweight children. The province has specific locations with piped-water increases—Manica City, and Espungabera in Mossurize District—located in the southeastern part of the province.
Manica has the lowest rate of externally funded execution for sanitation (16 percent). It is the province with highest prevalence of stunting (reaching almost 60 percent).
Access rates for improved water in Manica were virtually unchanged between 2003 and 2015 for the bottom 40 percent. Manica has one of the lowest piped-water coverages and the rate of access declined between 2011 and 2015.
Manica was the only province where access to improved sanitation did not change for either group (B40 and T60). The province has one of the highest proportions of children under five years of age who have never been immunized or who have suffered from a severe episode of acute respiratory infection that was not treated.
Maputo City The locality with the lowest poverty headcount was Maputo City (10 percent). It has one of the highest improved water coverage rates.
Maputo City has the lowest rate of open defecation and the highest coverage (greater than 75 percent) of improved sanitation.
Maputo City has the smallest gap between B40 and T60 for the rates of access to improved water. It was the first city to reach universal coverage for improved water in 2015.
Between 2003 and 2011, Maputo City showed the largest positive change in improved sanitation coverage, but the lowest change in stunting in the same period. The level of stunting is thought to be the lowest in the country.
Maputo Province This province has a relatively high performance of improved water provision.
Maputo Province still has large disparities in access to improved sanitation.
Maputo Province has the largest gap in piped-water access between B40 and T60.
This is the only province with improved sanitation steadily reaching a coverage of more or more coverage since 2003.
Nampula Nampula is the province with the largest gap between urban and rural access to improved water. Nampula has the lowest coverage for improved water in rural areas.
The province has the highest spatial inequality of access to improved water and sanitation at the district level. Nampula was the only province where stunting increased between 2003 and 2011.
Despite droughts and water scarcity, Nampula is the province with highest rate of reliance on surface water. This province’s Human Opportunity Index for improved water is the second lowest of all provinces.
Between 2003 and 2011, the increase in improved sanitation coverage was average, yet the increase in stunting in the same period was the highest. Nampula and Tete have the highest inadequate- WASH-related burden (greater than 9,000 DALYs per 100,000 children).
table continues next page

Table ES.1: Continued
Province
Trends Unconventional findings
Water supply Sanitation Water supply Sanitation
Niassa The province has been tackling inequities in improved water access between rural and urban districts in recent years, although it needs to place more emphasis on increasing overall access to improved sanitation.
The province has a coverage of less than 20 percent for improved sanitation.
The connections to piped water (to premises or neighborhoods) are declining.
The province had the second highest rate of increase in improved sanitation between 2003 and 2011. Niassa had the same coverage rate for improved sanitation in both rural and urban areas.
Sofala The districts of Nhamatanda and Gorongosa have the lowest rates of rural water coverage.
Sofala experienced a rise in inequality and the widest gap in improved sanitation. The highest rate of open defecation is for the B40 in rural areas (like Zambezia).
Two of the three poverty clusters identified through the Systemic Country Diagnostic—the ones in Tete and Sofala—overlap with clusters where the bottom 40 percent is located and access to improved water is less than 30 percent.
The province failed to use all the available funding for rural sanitation because of capacity issues; insufficient ability to execute large contracts created delays in implementation.
Tete Manica and Tete Provinces have shown stagnating coverage in the rates of improved water in rural areas since 2011. Access to water and child school attendance are highly correlated in Tete and Cabo Delgado.
Tete shows the lowest access rate to improved sanitation in rural areas for the bottom 40 percent group (5 percent).
Tete was the only province that between 2003 and 2011 showed a larger change in the B40 improved water coverage in relation to the T60.
Tete was the province that showed the highest number of cases of cholera resulting from low sanitation and high vulnerability to floods.
Zambezia Water infrastructure is particularly weak in the northern and inland provinces (such as Niassa, Sofala, Nampula, Zambezia, and Tete). The water infrastructure in rural areas in Zambezia is the most vulnerable to floods and droughts.
Zambezia and Tete have low improved sanitation coverage and the highest average total enteric disease burden for children living in T60 households.
Changes in the coverage for improved water are the same for B40 and T60.
Maternal health vulnerabilities resulting from unimproved sanitation is led by Zambezia followed by Tete.
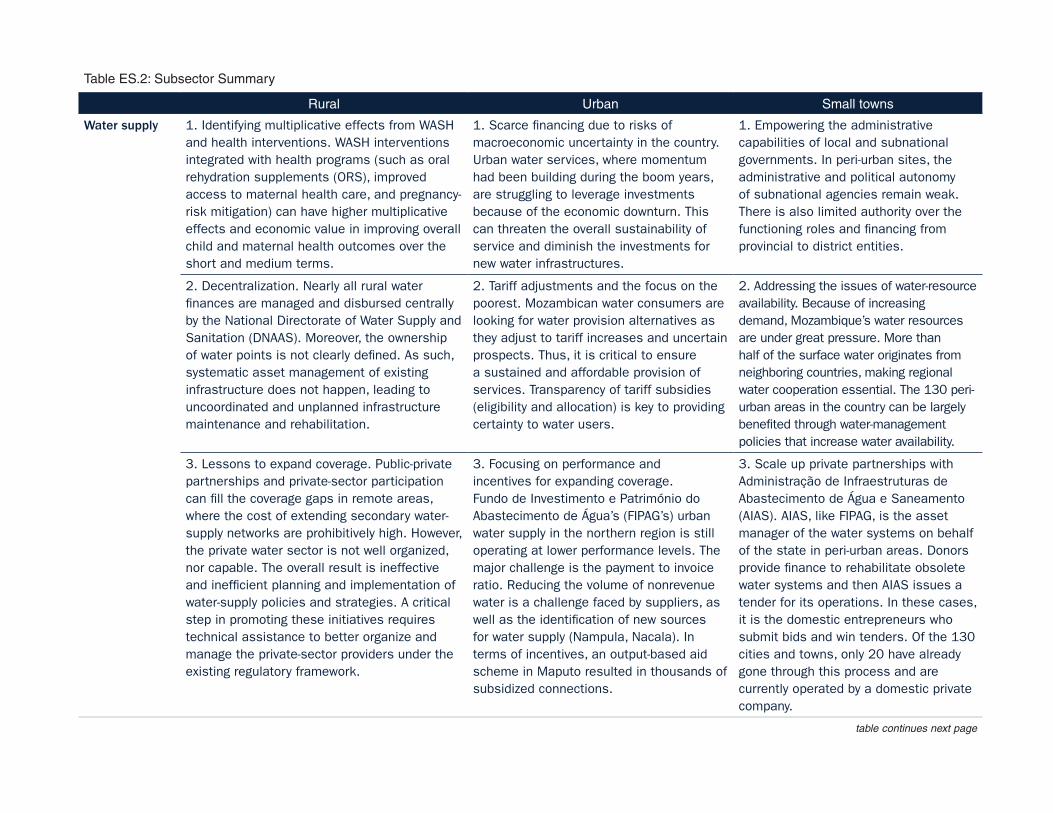
Table ES.2: Subsector Summary
Rural Urban Small towns
Water supply 1. Identifying multiplicative effects from WASH and health interventions. WASH interventions integrated with health programs (such as oral rehydration supplements (ORS), improved access to maternal health care, and pregnancy-risk mitigation) can have higher multiplicative effects and economic value in improving overall child and maternal health outcomes over the short and medium terms.
1. Scarce financing due to risks of macroeconomic uncertainty in the country. Urban water services, where momentum had been building during the boom years, are struggling to leverage investments because of the economic downturn. This can threaten the overall sustainability of service and diminish the investments for new water infrastructures.
1. Empowering the administrative capabilities of local and subnational governments. In peri-urban sites, the administrative and political autonomy of subnational agencies remain weak. There is also limited authority over the functioning roles and financing from provincial to district entities.
2. Decentralization. Nearly all rural water finances are managed and disbursed centrally by the National Directorate of Water Supply and Sanitation (DNAAS). Moreover, the ownership of water points is not clearly defined. As such, systematic asset management of existing infrastructure does not happen, leading to uncoordinated and unplanned infrastructure maintenance and rehabilitation.
2. Tariff adjustments and the focus on the poorest. Mozambican water consumers are looking for water provision alternatives as they adjust to tariff increases and uncertain prospects. Thus, it is critical to ensure a sustained and affordable provision of services. Transparency of tariff subsidies (eligibility and allocation) is key to providing certainty to water users.
2. Addressing the issues of water-resource availability. Because of increasing demand, Mozambique’s water resources are under great pressure. More than half of the surface water originates from neighboring countries, making regional water cooperation essential. The 130 peri-urban areas in the country can be largely benefited through water-management policies that increase water availability.
3. Lessons to expand coverage. Public-private partnerships and private-sector participation can fill the coverage gaps in remote areas, where the cost of extending secondary water-supply networks are prohibitively high. However, the private water sector is not well organized, nor capable. The overall result is ineffective and inefficient planning and implementation of water-supply policies and strategies. A critical step in promoting these initiatives requires technical assistance to better organize and manage the private-sector providers under the existing regulatory framework.
3. Focusing on performance and incentives for expanding coverage. Fundo de Investimento e Património do Abastecimento de Água’s (FIPAG’s) urban water supply in the northern region is still operating at lower performance levels. The major challenge is the payment to invoice ratio. Reducing the volume of nonrevenue water is a challenge faced by suppliers, as well as the identification of new sources for water supply (Nampula, Nacala). In terms of incentives, an output-based aid scheme in Maputo resulted in thousands of subsidized connections.
3. Scale up private partnerships with Administração de Infraestruturas de Abastecimento de Água e Saneamento (AIAS). AIAS, like FIPAG, is the asset manager of the water systems on behalf of the state in peri-urban areas. Donors provide finance to rehabilitate obsolete water systems and then AIAS issues a tender for its operations. In these cases, it is the domestic entrepreneurs who submit bids and win tenders. Of the 130 cities and towns, only 20 have already gone through this process and are currently operated by a domestic private company.
table continues next page
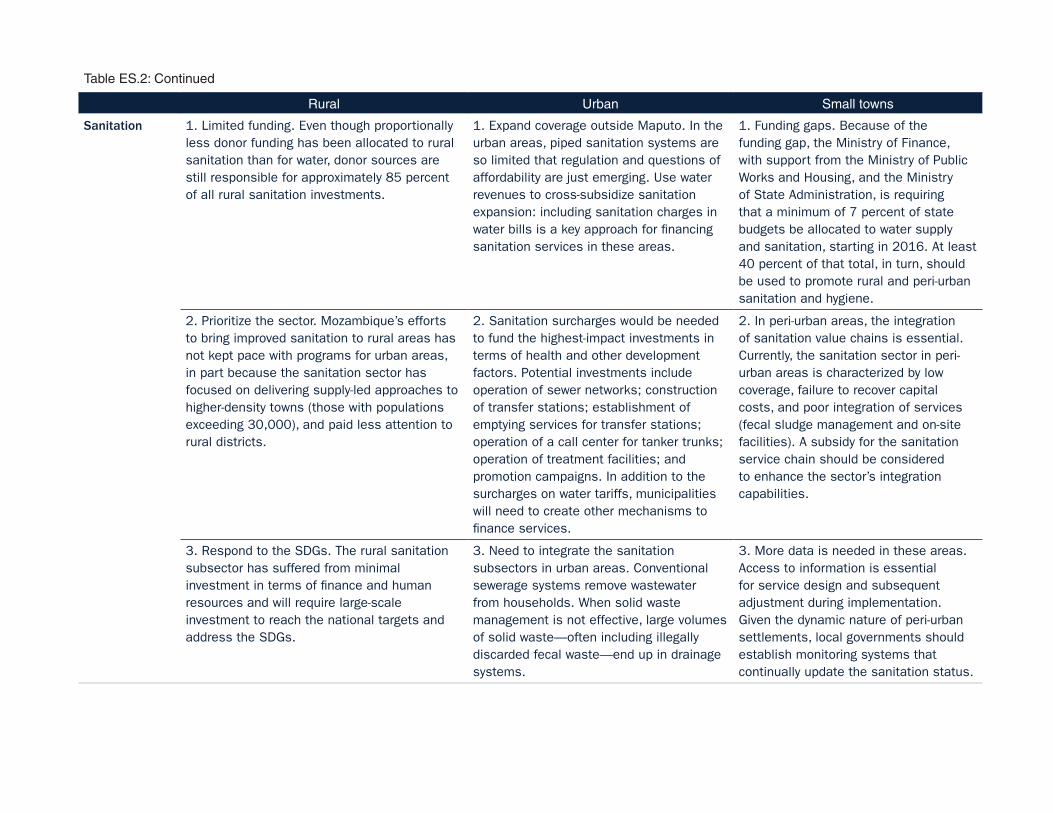
Table ES.2: Continued
Rural Urban Small towns
Sanitation 1. Limited funding. Even though proportionally less donor funding has been allocated to rural sanitation than for water, donor sources are still responsible for approximately 85 percent of all rural sanitation investments.
1. Expand coverage outside Maputo. In the urban areas, piped sanitation systems are so limited that regulation and questions of affordability are just emerging. Use water revenues to cross-subsidize sanitation expansion: including sanitation charges in water bills is a key approach for financing sanitation services in these areas.
1. Funding gaps. Because of the funding gap, the Ministry of Finance, with support from the Ministry of Public Works and Housing, and the Ministry of State Administration, is requiring that a minimum of 7 percent of state budgets be allocated to water supply and sanitation, starting in 2016. At least 40 percent of that total, in turn, should be used to promote rural and peri-urban sanitation and hygiene.
2. Prioritize the sector. Mozambique’s efforts to bring improved sanitation to rural areas has not kept pace with programs for urban areas, in part because the sanitation sector has focused on delivering supply-led approaches to higher-density towns (those with populations exceeding 30,000), and paid less attention to rural districts.
2. Sanitation surcharges would be needed to fund the highest-impact investments in terms of health and other development factors. Potential investments include operation of sewer networks; construction of transfer stations; establishment of emptying services for transfer stations; operation of a call center for tanker trunks; operation of treatment facilities; and promotion campaigns. In addition to the surcharges on water tariffs, municipalities will need to create other mechanisms to finance services.
2. In peri-urban areas, the integration of sanitation value chains is essential. Currently, the sanitation sector in peri-urban areas is characterized by low coverage, failure to recover capital costs, and poor integration of services (fecal sludge management and on-site facilities). A subsidy for the sanitation service chain should be considered to enhance the sector’s integration capabilities.
3. Respond to the SDGs. The rural sanitation subsector has suffered from minimal investment in terms of finance and human resources and will require large-scale investment to reach the national targets and address the SDGs.
3. Need to integrate the sanitation subsectors in urban areas. Conventional sewerage systems remove wastewater from households. When solid waste management is not effective, large volumes of solid waste—often including illegally discarded fecal waste—end up in drainage systems.
3. More data is needed in these areas. Access to information is essential for service design and subsequent adjustment during implementation. Given the dynamic nature of peri-urban settlements, local governments should establish monitoring systems that continually update the sanitation status.

14 Findings of the Mozambique Water Supply, Sanitation, and Hygiene Poverty Diagnostic
References
Direccao Nacional de Aguas (DNA). 2016. “Relatórios das Provincias: Água e Saneamento.” Ministry of Public Works and Housing, Mozambique. http://www.dnaguas.gov.mz/? __ target__=relatorios.
Ministério das Obras Publicas, Habitação e Recursos Hídricos - Direção Nacional de Aguas (MoPHRH-DNA). 2016. “Water and Sanitation Sector Objectives: 2015–2030.” Ministry of Public Works and Housing, Mozambique. http://www . ordemengenheiros.pt/fotos/dossier_artigo /18102012_suzanasaranga_193948376750 ab4861d227b.pdf.
WaterAid. 2015. “Financial Absorption in the Water, Sanitation and Hygiene Sector: Mozambique Case Study.” WaterAid America, New York.
Findings of the Mozambique Water Supply, Sanitation, and Hygiene Poverty Diagnostic 15
Chapter 1Country Background and Introduction
Political and Sociodemographic Transformations
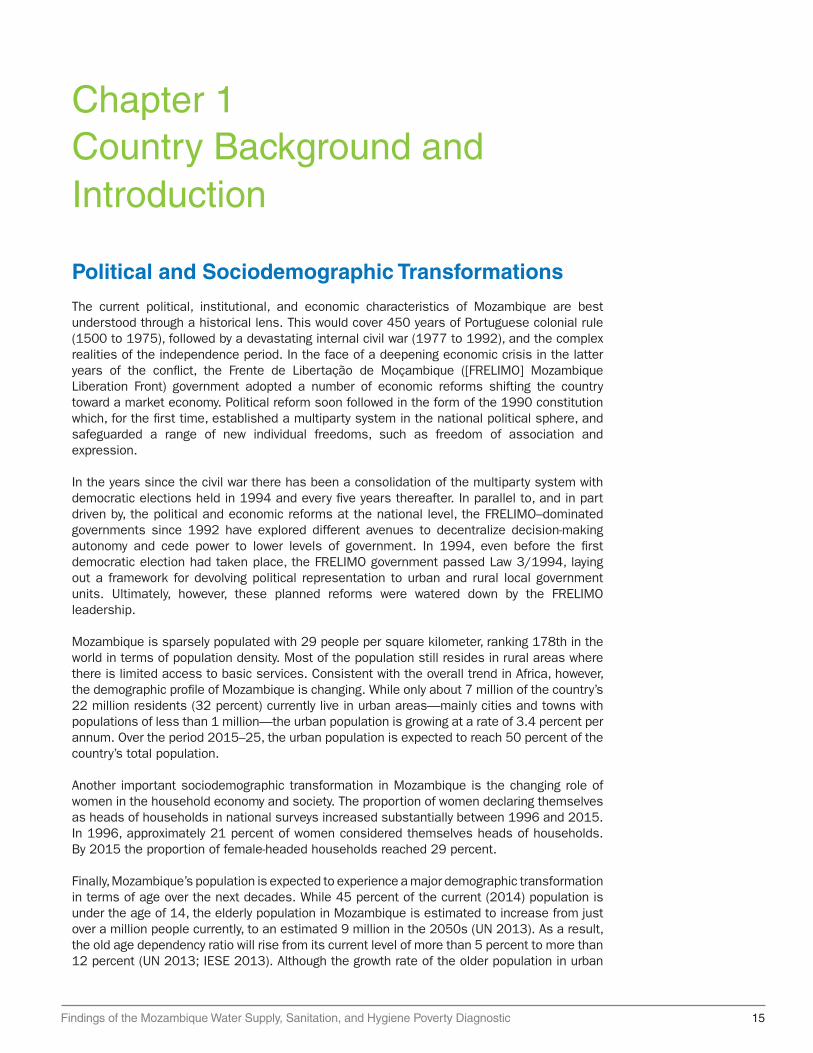
The current political, institutional, and economic characteristics of Mozambique are best understood through a historical lens. This would cover 450 years of Portuguese colonial rule (1500 to 1975), followed by a devastating internal civil war (1977 to 1992), and the complex realities of the independence period. In the face of a deepening economic crisis in the latter years of the conflict, the Frente de Libertação de Moçambique ([FRELIMO] Mozambique Liberation Front) government adopted a number of economic reforms shifting the country toward a market economy. Political reform soon followed in the form of the 1990 constitution which, for the first time, established a multiparty system in the national political sphere, and safeguarded a range of new individual freedoms, such as freedom of association and expression.
In the years since the civil war there has been a consolidation of the multiparty system with democratic elections held in 1994 and every five years thereafter. In parallel to, and in part driven by, the political and economic reforms at the national level, the FRELIMO–dominated governments since 1992 have explored different avenues to decentralize decision-making autonomy and cede power to lower levels of government. In 1994, even before the first democratic election had taken place, the FRELIMO government passed Law 3/1994, laying out a framework for devolving political representation to urban and rural local government units. Ultimately, however, these planned reforms were watered down by the FRELIMO leadership.
Mozambique is sparsely populated with 29 people per square kilometer, ranking 178th in the world in terms of population density. Most of the population still resides in rural areas where there is limited access to basic services. Consistent with the overall trend in Africa, however, the demographic profile of Mozambique is changing. While only about 7 million of the country’s 22 million residents (32 percent) currently live in urban areas—mainly cities and towns with populations of less than 1 million—the urban population is growing at a rate of 3.4 percent per annum. Over the period 2015–25, the urban population is expected to reach 50 percent of the country’s total population.
Another important sociodemographic transformation in Mozambique is the changing role of women in the household economy and society. The proportion of women declaring themselves as heads of households in national surveys increased substantially between 1996 and 2015. In 1996, approximately 21 percent of women considered themselves heads of households. By 2015 the proportion of female-headed households reached 29 percent.
Finally, Mozambique’s population is expected to experience a major demographic transformation in terms of age over the next decades. While 45 percent of the current (2014) population is under the age of 14, the elderly population in Mozambique is estimated to increase from just over a million people currently, to an estimated 9 million in the 2050s (UN 2013). As a result, the old age dependency ratio will rise from its current level of more than 5 percent to more than 12 percent (UN 2013; IESE 2013). Although the growth rate of the older population in urban

16 Findings of the Mozambique Water Supply, Sanitation, and Hygiene Poverty Diagnostic
areas is much higher than in rural areas, projections suggest that in 2020, about 75 percent of Mozambique’s older population will live in rural areas (IESE 2013).
Poverty, Economic Growth, and Human Development
Economic growth is not benefiting the poor. Mozambique’s economy has expanded at an accelerated pace in recent years, with real per capita GDP growing more than 5 percent between 1993 and 2004, and the country’s HDI steadily rising over the last 20 years. Yet growth has not been even in the country, and the government still faces the challenge of reducing poverty and inequality across regions and provinces (see map 1.1). In 2015, Mozambique’s population totaled an estimated 25 million, with 11.2 million living in poverty and 10 million falling in the bottom 40 percent (B40) of the wealth distribution in the country.1
The poor are mainly concentrated in rural areas, in the provinces of Nampula and Zambezia. Those two provinces represent 38 percent of the country’s total population, with 48 percent of their residents falling below the poverty line. In Zambezia in particular, the poverty gap has been widening over the last 20 years. Within provinces, the poor are increasingly found in the rural areas. In fact, no urban area of any province saw an increase in its share of the B40 between 1996 and 2015. Rural areas, in contrast, have seen their share of the poorest residents grow from 48 percent in 1996 to 55 percent in 2015. The provinces of Niassa, Cabo
Map 1.1: Poverty Headcount and Open-Defecation Rates, by Administrative Post
Source: World Bank 2016 (panel a); World Bank estimations census 2007.
a. Poverty headcount
Type
Provincial capital
National capital
District boundary
National boundary
Provincial boundary
Headcount rate (%)
2.52–25.6
25.7–46.9
47–57.8
57.9–63.5
63.6–66.5
66.6–68.9
69–71.1
71.2–73.7
73.8–78.4
78.5–89.20 75 150 Kilometers
b. Open defecation
Cabo Delgado
Gaza Inhambane
Manica
Maputo
Nampula
Niassa
Sofala
Tete
Zambezia
Percentage0.8–1
0.6–0.8
0.3–0.6
0.15–0.3
0–0.15
No data

Findings of the Mozambique Water Supply, Sanitation, and Hygiene Poverty Diagnostic 17
Delgado, and Nampula have seen even-greater increases in their poor populations, these being estimated at between 67 and 69 percent.
Mozambique has one of the highest chronic poverty rates in Africa. A large proportion of the poor in Mozambique do not benefit from growth, because they simply do not have access to the basic means needed to seize new economic opportunities. These people thus become trapped in a permanent state of poverty. Only a minority of the population has never been poor, and, by and large, these people are concentrated in urban centers, such as Maputo City (see figure 1.1). Mozambique’s urban-rural divide explains much of the inequity in the country, in terms of both the incidence and the persistence of poverty. Regional and provincial differences contribute further to the intractability of the problem.
Poverty is also linked with the education level of the head of the household and with a household’s dependency ratio. Mozambique has one of the highest dependency ratios in Africa and the average dependency ratio for Mozambican households has increased over time, from 1.05 in 1996 to 1.21 in 2015, with a noted increase in older dependents. Mozambique’s urban-rural poverty disparities are expected to increase because of growing disparities in dependency ratios. In urban areas, the average dependency ratio decreased from 1.08 in 1996 to 0.97 in 2015. In rural areas, the figure jumped from 1.04 to 1.32 over the same period. High dependency ratios also correlate with lower coverage rates for improved water supply and sanitation in those households. Households with dependency ratios of two or more show large poverty headcounts and slower poverty-reduction rates.
A comparison of Mozambique’s 140 districts shows that the 10 districts with the lowest access rates for improved water in rural areas also have the highest rates of poverty and the lowest rates of improved-sanitation access. The districts with both high poverty-headcount ratios and low access to services can be found not only in the poorest provinces of Zambezia and Nampula, but also in pockets across other provinces, like the districts of Chigubo (Gaza), Nampula (Nampula Province), and Funhalouro (Inhambane Province).
Figure 1.1: Bottom 40 Percent, by Province, 2015
Source: World Bank estimations using IOF 2014/15.Note: IOF = Inquérito sobre Orcamento Familiar (Family Budget Survey).
12%
32%
57%
4%
55%
33%
39%
50%
52%
49%
100%
88%
68%
43%
96%
45%
67%
61%
50%
48%
51%
0 1 2 3 4 5 6
Maputo City
Gaza
Inhambane
Niassa
Maputo Province
Cabo Delgado
Manica
Sofala
Tete
Zambezia
Nampula
Number of people (millions)
Bottom 40% Top 60%

18 Findings of the Mozambique Water Supply, Sanitation, and Hygiene Poverty Diagnostic
Water and Sanitation, Sickness, Child Nutrition, and Health Risks
Access to improved water and sanitation services underpins multiple aspects of human development. Benefits linked to improved service range from better health and nutrition (for example by reducing the incidence of diarrhea and enteropathy), to better educational outcomes (for example by boosting pupil attendance), to higher household incomes (for example by lowering the number of sick and missed work-days and by providing water as an input for economic activities).
Mozambique’s nutrition indicators help to illuminate the toll of poverty on the country’s children. Child malnutrition is a pathological state caused by low ingestion of macro- or micronutrients, arising from an inadequate diet or difficulty in absorbing nutrients because of disease. A main indicator of a child’s malnutrition is stunting, which reflects a failure to reach linear growth potential compared with a healthy population. Stunted children exhibit lower cognitive levels. The condition is a strong predictor of human capital development, and it presents a special worry in Mozambique because of its high prevalence. Wasting is less common in the country, but the problem has been on the rise. Wasting involves a recent and severe weight loss, which is often associated with acute starvation and advanced enteric disease. Child stunting levels in Mozambique totaled 42 percent in 2011, five percentage points higher than the Sub-Saharan Africa average of 37 percent. Mozambique’s child wasting rate was 6 percent for the same period, showing an upward trend since 2003, even as the region overall registered decreasing levels of wasting.
Lack of access to WASH significantly contributes to maternal health risks, time poverty, and undernutrition. Reducing the distance to water and sanitation facilities, and improving the reliability, quality, and affordability of those services benefit the poor by lowering the likelihood of disease and by freeing up time to engage in productive activities and education. The burden of inadequate WASH is disproportionately borne by the poorest women with high maternal health vulnerability. Provinces in northern and central Mozambique have overlapping high levels of both poor maternal health and exposure risk because of low WASH coverage.
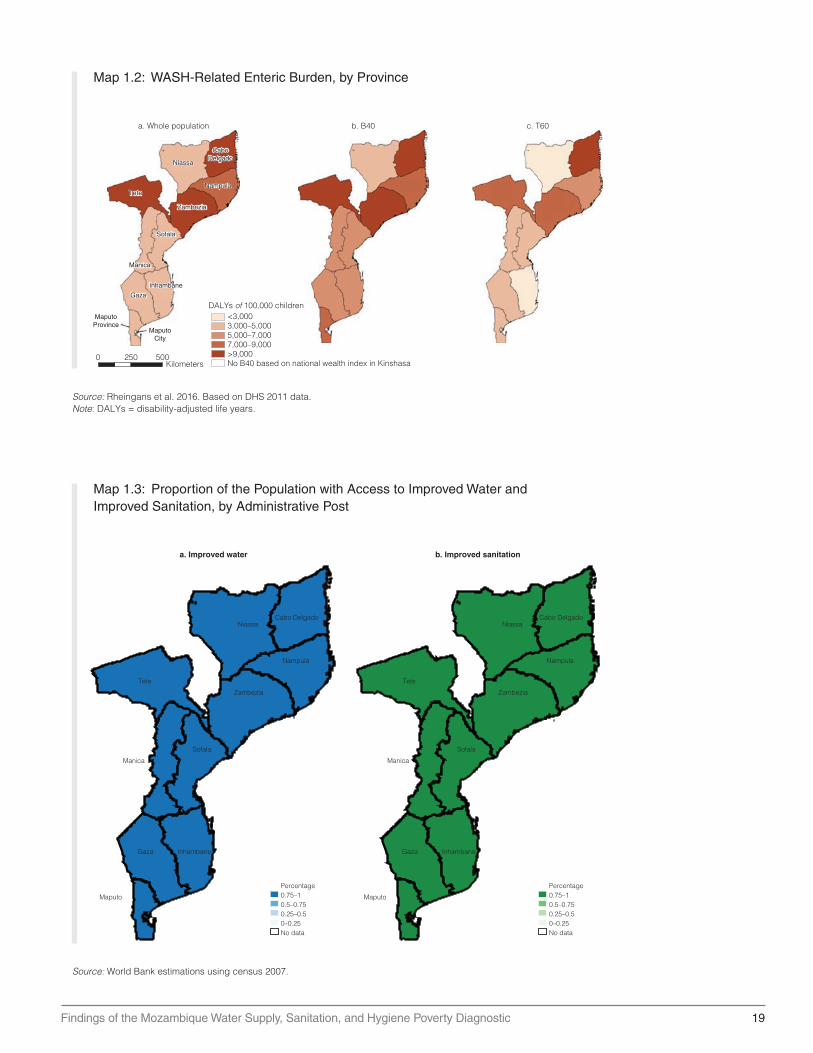
The interrelated burdens of poor health, poor water and sanitation services, and inadequate nutrition are thus key dimensions of poverty. About 20 percent of the substantial disease burden in Mozambique is linked to poor sanitation and unsafe water. Diarrheal illness and lower-respiratory infections (LRIs) are two of the main contributors to the burden of disease; they also rank as the second and third highest attributable risk factors of death, just behind HIV/AIDS. Moreover, children from Cabo Delgado, Zambezia, Nampula, and Tete have the highest inadequate WASH-related burden (more than 9,000 DALYs per 100,000 children) in the overall population (map 1.2, panel a). The B40 map (map 1.3, panel b) shows that the B40 children have a higher total enteric burden in general, with three regions having a high average enteric burden (more than 9,000 DALYs per 100,000 children).
Within provinces large disparities exist in child malnutrition indicators according to wealth. Comparisons of this indicator at the provincial level for the bottom 40 percent (B40) and top 60 percent (T60) provide evidence of a big difference in child malnutrition rates according to wealth. The largest gaps between the B40 and T60 groups are in Manica (21 percent versus 9 percent), Nampula (21 percent to 11 percent), and Cabo Delgado (22 percent to 12 percent). Although the southern provinces exhibit relatively low underweight rates, large gaps between the two wealth groups also exist there (map 1.2).
A WASH Poverty-Risk Model (PRM) was conducted using the latest demographic and health survey (DHS) of the country which was designed to describe these overlapping risk factors and understand the consequences of their unequal distribution to support WASH investment strategies that more effectively and efficiently target the areas of greatest need.
Findings of the Mozambique Water Supply, Sanitation, and Hygiene Poverty Diagnostic 19
Map 1.2: WASH-Related Enteric Burden, by Province
Source: Rheingans et al. 2016. Based on DHS 2011 data.Note: DALYs = disability-adjusted life years.
a. Whole population
0 250 500Kilometers
c. T60b. B40
<3,000DALYs of 100,000 children
3,000–5,0005,000–7,0007,000–9,000>9,000No B40 based on national wealth index in Kinshasa
Sofala
Tete
Niassa
Nampula
CaboDelgado
Zambezia
Manica
Gaza
Inhambane
MaputoProvince
MaputoCity
Map 1.3: Proportion of the Population with Access to Improved Water and Improved Sanitation, by Administrative Post
Source: World Bank estimations using census 2007.
Cabo Delgado
Gaza Inhambane
Manica
Maputo
Nampula
Niassa
Sofala
Tete
Zambezia
Percentage0.75–10.5–0.750.25–0.50–0.25No data
a. Improved water
Cabo Delgado
Gaza Inhambane
Manica
Maputo
Nampula
Niassa
Sofala
Tete
Zambezia
Percentage0.75–10.5–0.750.25–0.50–0.25No data
b. Improved sanitation

20 Findings of the Mozambique Water Supply, Sanitation, and Hygiene Poverty Diagnostic
This evidence can be used to strengthen a geographic targeting strategy based on ongoing regional plans. In Mozambique, there is an opportunity to advance in the geographic targeting of the country by scaling up the delivery of specific components of the provincial Multisectoral Action Plan for the Reduction of Chronic Malnutrition, through a package of essential nutrition and WASH interventions. The intervention packages could have a specific focus upon young children and pregnant and lactating women. WASH interventions are considered necessary accompanying measures to any improvement, and social behavior change can be a common key component for nutritional caregiving improvement and mainstreaming hygiene information.
Linkages between Water Supply and Sanitation Access, Poverty, and Inequity
The country’s inequities in wealth also extend to inequities in access to improved water and sanitation. While Mozambique has expanded its water and sanitation coverage over the last two decades, large disparities remain in terms of the availability and quality of services across provinces, between the B40 and T60, and between urban and rural residents (see map 1.3). These differences both reflect and exacerbate Mozambique’s broader, uneven development, and contribute to its chronic poverty and severe health issues, including stunting.
According to the WHO/UNICEF Joint Monitoring Programme for Water Supply and Sanitation (JMP 2014),2 improved drinking-water coverage increased from 35 percent to 51 percent nationally between 1990 and 2015. The generally low level of access to improved water,3
especially in rural areas, left 13.3 million people drinking water from unimproved sources in 2015 (WaterAid 2016; UNICEF 2014).
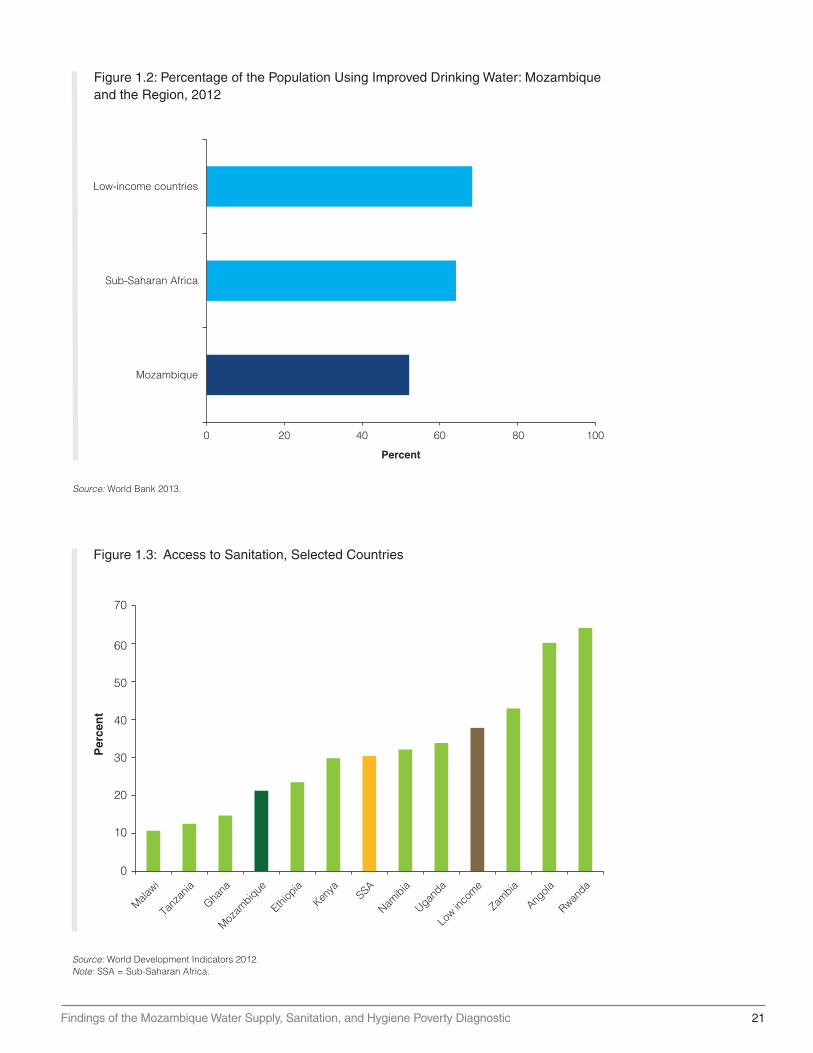
Nationally, the improved water supply coverage rate was lower than that for the broader Sub-Saharan Africa region or for other low-income countries, based on World Development Indicators (WDI) data for 2012 (figure 1.2). The proportion of Mozambique’s population with access to improved sanitation doubled from the abysmally low level of 10 percent nationally to just 21 percent (figure 1.3). These are among the lowest improved coverage rates reported by the WDI, which shows how poorly Mozambique performs against its Sub-Saharan African peers.
Mozambique also has a low Human Opportunity Index (HOI), which unmasks the inequities in access to services by taking account of the equality of service distribution across the entire population and across subgroups. The low values of the Index are not surprising given the low coverage levels in the country, but the dissimilarity index (a component of the HOI) also reveals that this low average covers large inequalities in access. Whereas the dissimilarity index has values of about 7 to 10 for access to improved water during 2003–15, the dissimilarity index values for access to improved sanitation are several magnitudes larger.
The ability of the poor to access improved water and sanitation services remains stagnant. The B40 has seen little change over the last five years in terms of its access to improved water sources, and the gap is growing between this group and the T60 in terms of access to piped water. In 1996, that gap was 27 percentage points, but by 2015, it had grown to 54 percentage points. The gaps in the rate of access to improved sanitation remained practically unchanged across all quintiles of the wealth distribution between 2002 and 2015. While access to improved sanitation remains low throughout the country, these low rates mask large inequalities in access borne mostly by the B40. These inequities are even larger in rural areas, with households headed by females or individuals without primary education being most affected.
A comparison of regional rates of access to piped water and surface water by the B40 and T60 shows contrasts. The availability of piped water (to the premises or neighborhood) is declining
Findings of the Mozambique Water Supply, Sanitation, and Hygiene Poverty Diagnostic 21
Figure 1.2: Percentage of the Population Using Improved Drinking Water: Mozambique and the Region, 2012
Source: World Bank 2013.
Low-income countries
Sub-Saharan Africa
Mozambique
0 20 40 60 80 100
Percent
Figure 1.3: Access to Sanitation, Selected Countries
Source: World Development Indicators 2012.Note: SSA = Sub-Saharan Africa.
70
60
50
40
Per
cen
t
30
20
10
Malawi
Tanz
ania
Ghana
Mozam
bique
Ethiop
ia
Kenya SSA
Namibia
Uganda
Low in
come
Zambia
Angola
Rwanda
0
22 Findings of the Mozambique Water Supply, Sanitation, and Hygiene Poverty Diagnostic
in four provinces (Niassa, Cabo Delgado, Zambezia, and Manica). Two of these provinces have the greatest percentages of poor populations (Zambezia, with 70 percent, and Cabo Delgado, with 62 percent).
Poor sanitation brings a heavy economic loss and only moderate improvements have occurred over the last decade. The Water and Sanitation Program (WSP) estimates that poor sanitation effectively costs the country’s economy US$50 million per year in rural areas and US$75 million per year in urban areas (WSP 2012). Sanitation data from the Joint Monitoring Programme (and World Bank’s calculations) consistently show that rural areas lag overall in terms of rates of access to improved sanitation.4 Indeed, the high proportion of rural households using unimproved sources of sanitation drives the national average down, because a higher proportion of the total population lives in the rural areas. Mozambique’s efforts to bring improved sanitation to rural areas have not kept pace with the programs for the urban areas. In part this is because the sanitation sector has focused on delivering supply-led approaches to higher-density towns (those with populations exceeding 30,000), and paid less attention to rural districts (UNICEF 2015).
Access to basic services also influences the availability and steadiness of basic consumption. Between 2003 and 2009 shifting from no access to improved water access led to a 31 percent increase in per capita consumption. For sanitation, a jump from no access to improved sanitation led to an increase of 140 percent in per capita consumption. Access to improved sanitation has a significantly higher conditional relation with consumption than does improved water access. When considering location, the increase in consumption related to greater access to improved sanitation is similar between urban and rural areas, and is two or three times higher than that related to improved water access.
WASH Service Delivery
SDG 6 calls on the global community to “ensure availability and sustainable management of water and sanitation for all.” In the transition from the Millennium Development Goals (MDGs) to the SDGs, the water and sanitation sector has recognized that “access” was a relatively one-dimensional indicator. Other aspects of service, such as quality, availability (including quantity and continuity), and affordability, are also important. These factors are interrelated and policy makers need to seek the right balance.
Unlike other countries in Africa, Mozambique has not fully updated and properly enforced its standards and principles governing the quality and reliability of water and sanitation services. The government of Mozambique has established standards for quantity, but it does not have standards to address quality or crowding (one consideration for availability). Also, it has not set standards for distance to access water or for reliability.
Mozambique has one of the lowest levels of per capita water consumption in the world. The low level of water availability is confirmed by data from the DHS (2011) showing only 8 percent of rural households in the first wealth quintile in Mozambique having access to improved water within the international standard for distance—a 30-minute walk to the water point (WHO/UNICEF 2012; OHCHR 2010). For one-third (31 percent) of rural households in the first quintile, it takes more than 30 minutes to reach an unimproved source of water.5
Quality of service is another key issue for the sector, especially in rural areas. Policy makers have acknowledged a problem with the high failure rates of rural water systems. Small, piped-water village systems and boreholes with hand pumps are the main mechanisms serving rural areas; however, 35 percent of these do not work at any one time, according to World Bank estimates. Access to piped water—the safest option for human consumption—remains very low for the bottom 40 percent compared with the top 60 percent. Coverage of piped water on premises for the top 60 percent of the wealth distribution increased from 11 percent of
Findings of the Mozambique Water Supply, Sanitation, and Hygiene Poverty Diagnostic 23
households in 1996 to 48 percent in 2015. However, the coverage rate for households in the bottom group remains at only 10 percent.
Water-quality monitoring remains weak in rural areas, but a 2008 midterm impact assessment of Mozambique’s water sector found that quality often deteriorates between the source and point of use. The assessment was conducted under the One Million Initiative, a cooperative venture between the Netherlands, Mozambique, and UNICEF’s WASH Programme. The probability that water would be clean at the point of use rose by 47 percent when Mozambican households switched to a microbiologically uncontaminated water source.
Governance and Rural Constraints
Ongoing governance reforms, including decentralization and a push to increase consumer participation, have sought to strike a balance between government and private-sector management of water and sanitation services. Sector financing is predominantly donor driven, though increasingly, support for government programs underscores a growing confidence in Mozambique’s capacity to achieve progress in the sector. However, the dependency on donor and government funding, which is subject to the vicissitude of spending cycles, can hinder local planning and efforts to meet increasing demand.
The decentralization process has been a cornerstone for preparing local sectors’ institutions for increasing access to WASH in rural areas. However, this process is far from being implemented fully and consistently in the country. Although certain laws in the country have been enacted to trigger the decentralization process, there are some loose ends in terms of making this process relevant for implementing and expanding water and sanitation coverage. For instance, there is still a challenge to enhance capacity at the lower levels of government (districts, municipalities, localities, barrios [neighborhoods], villages) to ensure that they competently undertake their roles of maintaining regular contacts with the communities; supervise the various operations; and use lessons learned to continuously improve the sector. This should go hand in hand with the creation of the necessary conditions to attract highly qualified personnel to the local levels. The district level should be given increased attention in this regard. With these conditions, it would be more effective to transfer the responsibility for planning and management of water and sanitation infrastructure to subnational government.
Constraints to Achieving Better Sector Results
One hindrance to sector reform arises from problems in sector financing. Mozambique’s water and sanitation sector is highly dependent on donor finance. The 2011 Country Status Overview for Mozambique found that approximately 85 percent of sector investments over the previous three years had come through official development assistance. Even though proportionally less donor funding goes to sanitation than water, donor sources fund about 85 percent of all sanitation investments.
While the budget for water and sanitation also increased, and stayed relatively high between 2010 and 2012, for the 2012/13 period public expenditures in the sector declined. After that, investments in the sector increased slightly because of higher donor investments. As a result, investments allocated to water and sanitation accounted for slightly less than 2 percent of GDP annually between 2010 and 2012, and then adjusted to reach only 1 percent of GDP. Funding for 2012 came from the national government, with €25.4 million (US$32.6 million), and external sources, with €76.3 million (US$98 million) (GLAAS 2014).
A cost analysis of the water and sanitation investment needs conducted for Mozambique in 2015 revealed that the urban water sector appears to be sufficiently funded in relation to its investment plans (AMCOW 2010). However, the rural water-supply sector has received limited support for improving management and implementation capacity, and suffers from annual

24 Findings of the Mozambique Water Supply, Sanitation, and Hygiene Poverty Diagnostic
shortfalls in funding. The rural sanitation sector also has not received systematic support for improving management and implementation capacity, and remains significantly underfunded. In addition, the water and sanitation sector underspent its budget by 13 percent (where actual expenditure data were available) over the 2011–13 period, performing worse than other sectors.
Notes
1. In the WASH poverty diagnostic, the terms bottom 40 (B40) and top 60 (T60) are used to highlight the differences between the first two quintiles of the wealth distribution (B40) and the rest of the quintiles (T60). Because poverty in Mozambique is more than 50 percent of the population, part of the population in the third quintile of wealth (that belongs to the T60 group) are considered poor as well. Therefore, the T60 group cannot be associated exclusively with “nonpoor” population.
2. The definitions were harmonized per type of survey to gain consistency across years for both water and sanitation sources and facilities.
3. The Millennium Development Goals (MDGs) established targets increasing access to “improved water supply and sanitation.” The new terminology for the Sustainable Development Goals (SDGs) recognizes equitable and sustained access to basic services, shifting from the JMP definitions of improved and unimproved facilities. Throughout the analysis, the report includes the best possible improved (i.e. piped water) and the worst unimproved facilities (surface water), in order to recognize the previous MDG framework and the new SDG terminology.
4. Sanitation generally refers to the provision of facilities and services for the safe disposal of human urine and feces. An improved sanitation facility is one that hygienically separates human excreta from human contact. Improved sanitation generally involves physically closer facilities, less waiting time, and safer disposal of excreta. Improved facilities include: ventilated improved pit (VIP) latrines, pit latrines with a slab, and pour-flush toilets with safe collection.
5. DHS (Inquisitor Demográfico e de Saúde). 2011/2012. MISA/Moçambique, INE/Moçambique and ICF International. http://dhsprogram.com/pubs/pdf/FR266/FR266 . pdf.
References
AMCOW (African Ministers’ Council on Water). 2010. “African Water Resources and Management Frameworks and Finances.” AMCOW, Nigeria. http: // www.amcow-online.org/images/docs /the_compendium .pdf.
Francisco, A., G. Sugahara, and P. Fisher. 2013. “Growing Old in Mozambique: Dynamics of Well-Being and Poverty.” IESE (Institute for Social and Economic Studies), Mozambique. 7862 / RLINLD/2013. Maputo. http://www.iese.ac.mz/lib/IESE_DynPov.pdf.
WHO/UNICEF JMP (World Health Organization/United Nations Children’s Fund Joint Monitoring Programme). 2014. “Progress on Sanitation and Drinking Water: 2014 Update and MDG Assessment.” JMP, WHO, and UNICEF, Geneva.
World Bank. 2016. “Republic of Mozambique: Systematic Country Diagnostic.” World Bank, Washington, DC. https://openknowledge.worldbank.org/handle/10986/24696 License: CC BY 3.0 IGO.
OHCHR (Office of the United Nations High Commissioner for Human Rights). 2010. “The Right to Water.” Fact Sheet No. 35, OHCHR, Geneva. http://www.ohchr.org/Documents / Publications /FactSheet35en.pdf.
Findings of the Mozambique Water Supply, Sanitation, and Hygiene Poverty Diagnostic 25
Rheingans, R., J. Anderson, K. Bagamian, S. Ryan, J. Watson, L. Laytner, and O. Cumming. 2016. “Poverty Risk Model Assessment: Mozambique (PRM).” Background Paper II. University of Florida (UF) and the London School of Hygiene and Tropical Medicine (LSHTM). Mimeo.
UN (United Nations). 2013. “World Population Prospects: The 2012 Revision, (13 June 2013).” Department of Economic and Social Affairs. Working Paper No. ESA/P/WP 228. United Nations, New York. https://africacheck.org/wp-content/uploads/2014/10/World -Population-Prospect-2012 -revision_upload-to-AC.pdf.
UNICEF. 2014. “Mozambique Situation Analysis: Costing Report of the Social Sector.” UNICEF, New York.
———. 2015. “Sanitation in Small Towns: Experience from Mozambique.” Field Note #35. UNICEF, New York. https://www.unicef.org/esaro/WASH-Field-Small-Towns-low-res.pdf.
WaterAid. 2016. “Water: At What Cost? The State of the World’s Water 2016.” WaterAid America, New York. http://www.wateraid.org/~/media/Publications/Water_at_what_cost .pdf?la=en.
WHO/UNICEF. 2012. “Progress on Safe Drinking Water and Sanitation.” WHO/UNICEF, New York. https://www .unicef.org/media/files/JMPreport2012.pdf.
World Bank. 2012. World Development Indicators 2012. World Development Indicators. World Bank, Washington, DC. https://openknowledge.worldbank.org/handle/10986/6014.
———. 2013. World Development Indicators 2013. World Development Indicators. World Bank, Washington, DC. doi:10.1596/978-0-8213-9824-1. http://databank . worldbank.org/data / download/WDI-2013 -ebook.pdf.
WSP (Water and Sanitation Program). 2012. “Economic Impacts of Poor Sanitation in Africa.” Fact Sheet. World Bank, Washington, DC. http://siteresources.worldbank.org / INTAFRICA / Resources/economic -impacts-of-poor-sanitation-in-africa-factsheet.pdf.

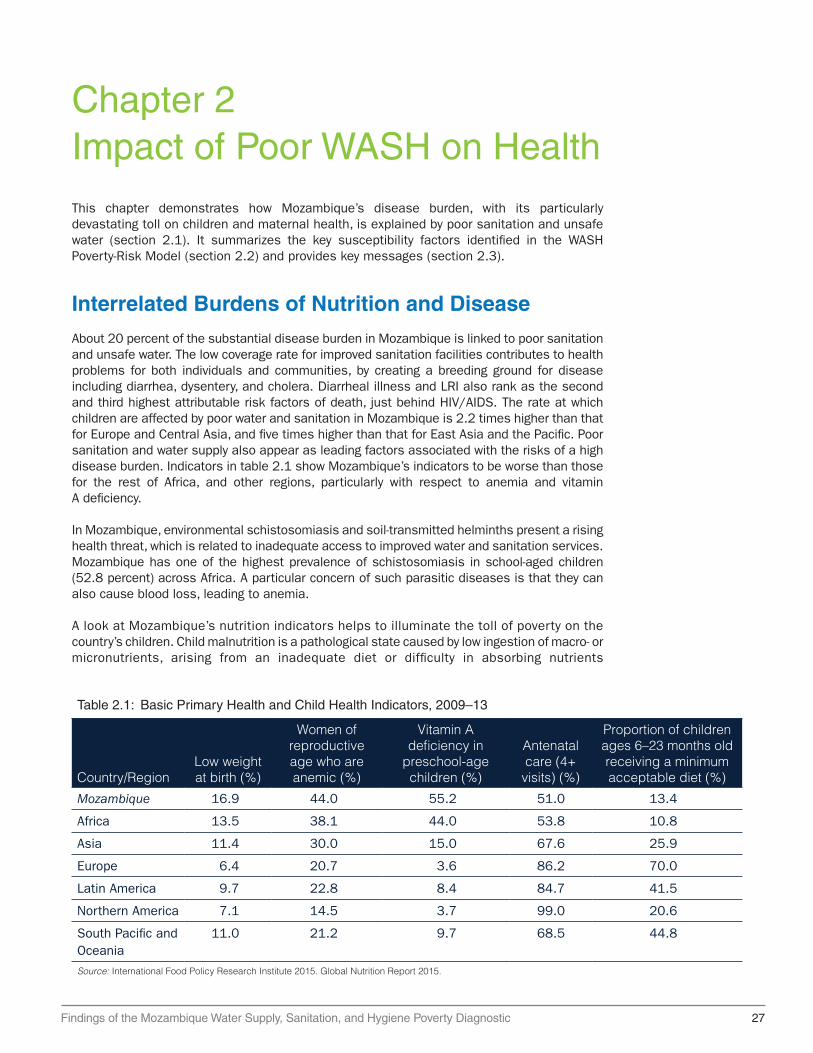
Findings of the Mozambique Water Supply, Sanitation, and Hygiene Poverty Diagnostic 27
Chapter 2Impact of Poor WASH on HealthThis chapter demonstrates how Mozambique’s disease burden, with its particularly devastating toll on children and maternal health, is explained by poor sanitation and unsafe water (section 2.1). It summarizes the key susceptibility factors identified in the WASH Poverty-Risk Model (section 2.2) and provides key messages (section 2.3).
Interrelated Burdens of Nutrition and Disease
About 20 percent of the substantial disease burden in Mozambique is linked to poor sanitation and unsafe water. The low coverage rate for improved sanitation facilities contributes to health problems for both individuals and communities, by creating a breeding ground for disease including diarrhea, dysentery, and cholera. Diarrheal illness and LRI also rank as the second and third highest attributable risk factors of death, just behind HIV/AIDS. The rate at which children are affected by poor water and sanitation in Mozambique is 2.2 times higher than that for Europe and Central Asia, and five times higher than that for East Asia and the Pacific. Poor sanitation and water supply also appear as leading factors associated with the risks of a high disease burden. Indicators in table 2.1 show Mozambique’s indicators to be worse than those for the rest of Africa, and other regions, particularly with respect to anemia and vitamin A deficiency.
In Mozambique, environmental schistosomiasis and soil-transmitted helminths present a rising health threat, which is related to inadequate access to improved water and sanitation services. Mozambique has one of the highest prevalence of schistosomiasis in school-aged children (52.8 percent) across Africa. A particular concern of such parasitic diseases is that they can also cause blood loss, leading to anemia.
A look at Mozambique’s nutrition indicators helps to illuminate the toll of poverty on the country’s children. Child malnutrition is a pathological state caused by low ingestion of macro- or micronutrients, arising from an inadequate diet or difficulty in absorbing nutrients
Table 2.1: Basic Primary Health and Child Health Indicators, 2009–13
Country/RegionLow weight at birth (%)
Women of reproductive age who are anemic (%)
Vitamin A deficiency in
preschool-age children (%)
Antenatal care (4+
visits) (%)
Proportion of children ages 6–23 months old receiving a minimum acceptable diet (%)
Mozambique 16.9 44.0 55.2 51.0 13.4
Africa 13.5 38.1 44.0 53.8 10.8
Asia 11.4 30.0 15.0 67.6 25.9
Europe 6.4 20.7 3.6 86.2 70.0
Latin America 9.7 22.8 8.4 84.7 41.5
Northern America 7.1 14.5 3.7 99.0 20.6
South Pacific and Oceania
11.0 21.2 9.7 68.5 44.8
Source: International Food Policy Research Institute 2015. Global Nutrition Report 2015.

28 Findings of the Mozambique Water Supply, Sanitation, and Hygiene Poverty Diagnostic
because of disease. Figure 2.1 presents the UNICEF conceptual framework that identifies the factors behind child malnutrition. The immediate causes are disease and inadequate diet. The latter, in turn, has three underlying causes: inadequate access to health care and to water and sanitation services; inadequate care of women and children; and insufficient food intake. Poverty and low education are the fundamental causes of child malnutrition, through their effect on these underlying causes.
The main indicators of malnutrition are stunting, wasting, and being underweight—defined as a failure to achieve the expected height or weight for a given age. Within provinces, large disparities exist in child malnutrition indicators across different wealth groups. The largest spreads in the incidence of underweight children between the bottom 40 percent and top 60 percent groups are in Manica (21 percent versus 9 percent), Nampula (21 percent versus 11 percent), and Cabo Delgado (22 percent versus 12 percent). The smallest gaps are in Gaza (no gap) and Niassa (19 percent versus 17 percent).
The proportion of stunted children in Mozambique was 42 percent in 2011, five percentage points higher than the Sub-Saharan African average of 37 percent. Mozambique’s child wasting (severe weight loss which is often associated with acute starvation and enteric disease) rate was 6 percent for the same period, showing an upward trend since 2003, even as the region overall registered decreasing levels of wasting. The northern part of Mozambique had the worst outcomes in terms of stunting compared with the southern and central regions, and rural areas had highest rates within the north. The prevalence of stunting among children reached almost 60 percent in these latter areas, and 50 percent for children living in urban areas. The prevalence of child stunting in urban areas in the south is almost half that in the northern and central regions.
Within provinces, large discrepancies exist in child malnutrition indicators according to wealth. Being underweight reflects both stunting and wasting. Comparisons of this indicator at the provincial level for the B40 and T60 provide evidence of a big difference in child malnutrition rates according to wealth. The largest gaps between the B40 and T60 are in Manica (21 percent versus 9 percent), Nampula (21 percent to 11 percent), and Cabo Delgado (22 percent to 12 percent) (see figure 2.2, panel b). Although the southern provinces exhibit relatively low
Figure 2.1: Child Malnutrition in the UNICEF Conceptual Framework
Source: Adapted from the UNICEF conceptual framework for child malnutrition.Note: UNICEF = United Nations Children’s Fund.
Immediate
Underlying
Basic
Mal
nutr
ition
cau
ses
Poverty
Diseases
Loweducation
Inadequate health service provisionaccess to
sanitation (and water) services
Inadequate care of women and
children Insufficient food intake
Inadequate diet
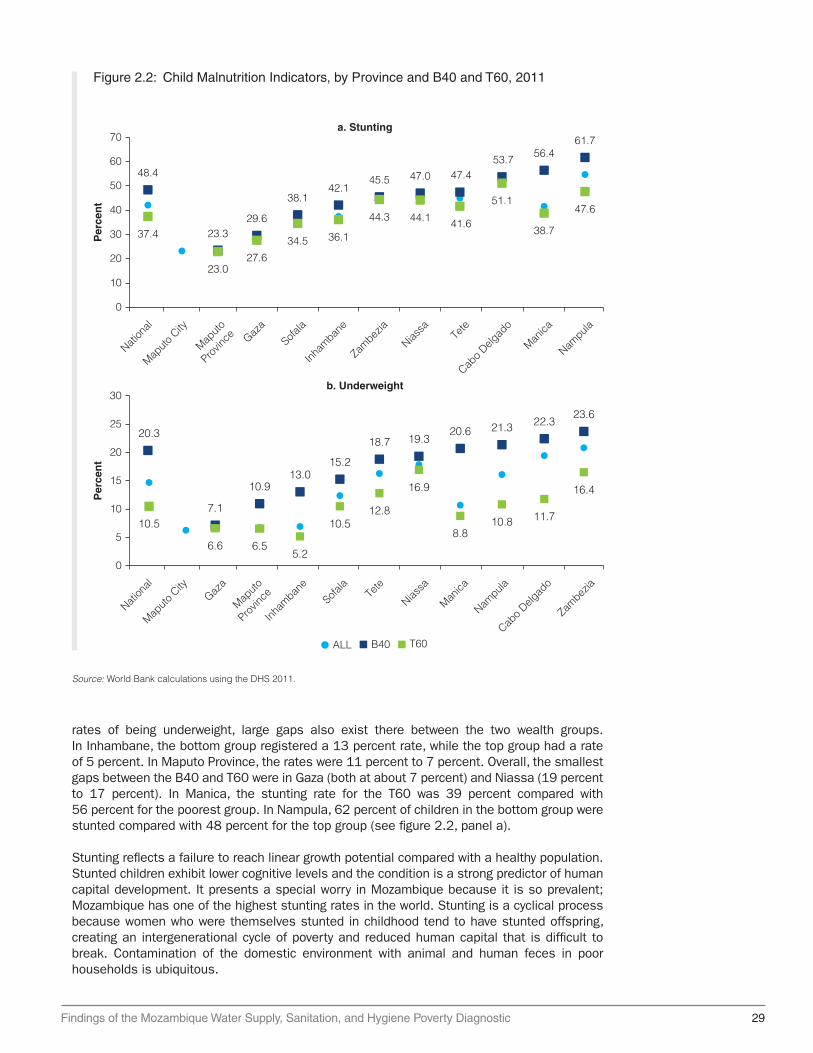
Findings of the Mozambique Water Supply, Sanitation, and Hygiene Poverty Diagnostic 29
rates of being underweight, large gaps also exist there between the two wealth groups. In Inhambane, the bottom group registered a 13 percent rate, while the top group had a rate of 5 percent. In Maputo Province, the rates were 11 percent to 7 percent. Overall, the smallest gaps between the B40 and T60 were in Gaza (both at about 7 percent) and Niassa (19 percent to 17 percent). In Manica, the stunting rate for the T60 was 39 percent compared with 56 percent for the poorest group. In Nampula, 62 percent of children in the bottom group were stunted compared with 48 percent for the top group (see figure 2.2, panel a).
Stunting reflects a failure to reach linear growth potential compared with a healthy population. Stunted children exhibit lower cognitive levels and the condition is a strong predictor of human capital development. It presents a special worry in Mozambique because it is so prevalent; Mozambique has one of the highest stunting rates in the world. Stunting is a cyclical process because women who were themselves stunted in childhood tend to have stunted offspring, creating an intergenerational cycle of poverty and reduced human capital that is difficult to break. Contamination of the domestic environment with animal and human feces in poor households is ubiquitous.
Source: World Bank calculations using the DHS 2011.
Figure 2.2: Child Malnutrition Indicators, by Province and B40 and T60, 2011
a. Stunting
48.4
37.4 23.3
23.0
29.6
27.6
38.1
34.5
42.1
36.1
45.5
44.3
47.0
44.1
47.4
41.6
53.7
51.1
56.4
38.7
61.7
47.6
0
10
20
30
40
50
60
70
Nation
al
Maputo
City
Maputo
Provin
ce Gaza
Sofala
Inham
bane
Zambez
ia
Niassa
Tete
Cabo D
elgad
o
Manica
Nampula
ALL B40 T60
Per
cen
t
b. Underweight
0
5
10
15
20
25
30
Nation
al
Maputo
City
Maputo
Provin
ceGaza
Sofala
Inham
bane
Zambez
ia
Niassa
Tete
Cabo D
elgad
o
Manica
Nampula
Per
cen
t
20.3
10.913.0
15.2
18.7 19.320.6 21.3 22.3
23.6
10.57.1
6.6 6.55.2
10.512.8
16.9
8.810.8 11.7
16.4
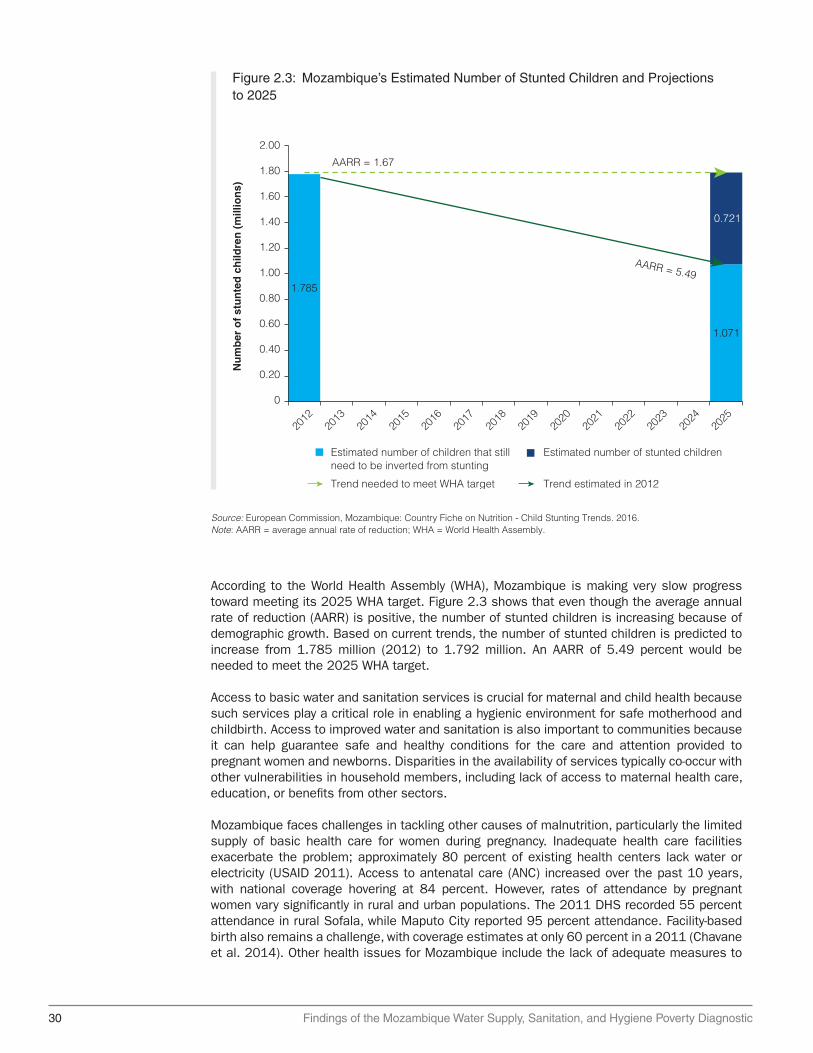
30 Findings of the Mozambique Water Supply, Sanitation, and Hygiene Poverty Diagnostic
According to the World Health Assembly (WHA), Mozambique is making very slow progress toward meeting its 2025 WHA target. Figure 2.3 shows that even though the average annual rate of reduction (AARR) is positive, the number of stunted children is increasing because of demographic growth. Based on current trends, the number of stunted children is predicted to increase from 1.785 million (2012) to 1.792 million. An AARR of 5.49 percent would be needed to meet the 2025 WHA target.
Access to basic water and sanitation services is crucial for maternal and child health because such services play a critical role in enabling a hygienic environment for safe motherhood and childbirth. Access to improved water and sanitation is also important to communities because it can help guarantee safe and healthy conditions for the care and attention provided to pregnant women and newborns. Disparities in the availability of services typically co-occur with other vulnerabilities in household members, including lack of access to maternal health care, education, or benefits from other sectors.
Mozambique faces challenges in tackling other causes of malnutrition, particularly the limited supply of basic health care for women during pregnancy. Inadequate health care facilities exacerbate the problem; approximately 80 percent of existing health centers lack water or electricity (USAID 2011). Access to antenatal care (ANC) increased over the past 10 years, with national coverage hovering at 84 percent. However, rates of attendance by pregnant women vary significantly in rural and urban populations. The 2011 DHS recorded 55 percent attendance in rural Sofala, while Maputo City reported 95 percent attendance. Facility-based birth also remains a challenge, with coverage estimates at only 60 percent in a 2011 (Chavane et al. 2014). Other health issues for Mozambique include the lack of adequate measures to
Figure 2.3: Mozambique’s Estimated Number of Stunted Children and Projections to 2025
Source: European Commission, Mozambique: Country Fiche on Nutrition - Child Stunting Trends. 2016.Note: AARR = average annual rate of reduction; WHA = World Health Assembly.
2.00
Nu
mb
er o
f st
un
ted
ch
ildre
n (
mill
ion
s)
AARR = 1.67
AARR = 5.49
1.80
1.60
1.40
1.20
1.00
0.80
0.60
0.40
0.20
0
2012
2013
2014
2015
2016
2017
2018
2019
2020
2021
2022
2023
2024
2025
1.785
0.721
1.071
Estimated number of children that stillneed to be inverted from stunting
Estimated number of stunted children
Trend needed to meet WHA target Trend estimated in 2012
Findings of the Mozambique Water Supply, Sanitation, and Hygiene Poverty Diagnostic 31
reduce anemia among women of reproductive age and the limited availability of vitamin A and iodine-deficiency interventions.
A regression analysis to elicit the statistical relationship between access to water and sanitation services and child malnutrition was undertaken. It considered household sociodemographic characteristics, maternal characteristics, child characteristics, and province and survey fixed effects. The findings show that regressions at the national level mask differential conditional relations between access to water and sanitation services and child malnutrition indicators depending on geographic location, wealth, and the child’s age. In general, inadequate access to sanitation worsens child malnutrition indicators in urban areas and in older children. The practice of unsafe disposal of child feces has consistently negative effects for all groups considered—except for younger children—and is the only factor affecting wasting. Adequate access to improved water sources has positive effects in both urban and rural areas and in younger children.
Among the most highlighted factors explaining the high risks to children’s health are:
i) The effect of inadequate access to sanitation is statistically significant in urban areas for weight and for weight and stunting in children ages 25–59 months. Open defecation is related to a reduction of 250 g in the weight of children in urban areas, equivalent to a 2.2 percent reduction in weight, and is also related to a reduction of about 210 g (1.6 percent) in children ages 25–59 months. Reductions in the use of open defecation—in favor of other, unimproved facilities, or improved facilities—are related to a 5-percentage point decrease in stunting rates in children ages 25–59 months from a model-predicted value of 49 percent.
ii) The practice of unsafe disposal of child feces has consistently negative effects on weight and height for all groups considered, particularly those in urban areas, except for children ages 0–24 months. At the national level, children in households that practice unsafe disposal are 200 g lighter and 0.6 centimeters shorter, compared with children in households that practice safe disposal of child feces. Unsafe disposal of child feces is related to a reduction of 250 g and 0.8 centimeters in urban areas and 150 g and a small, non-significant decrease in height in rural areas. The weight and height reduction for children ages 25–59 months totals about 180 g and 0.7 centimeters whereas for those ages 0–24 months the reductions are about 160 g and 0.08 centimeters, but these coefficients are not statistically different from zero.
iii) Unsafe disposal of child feces is also related to higher stunting in urban areas and higher wasting rates for the bottom 40 percent and for children ages 25–59 months. In urban areas, unsafe disposal of child feces is related to an increase of five percentage points in the stunting rate from a model-predicted value of 33 percent. For the bottom 40 percent, the practice of unsafe disposal of child feces is related to an increase of 2 percentage points in the wasting rate; this is a large effect, as the regression model predicts a wasting rate of 5 percent for the bottom 40 percent. For children ages 25–59 months, the increase of the wasting rate is 1 percentage point (the prediction is 2 percent).
iv) Adequate access to improved water sources has statistically significant effects on weight and height in urban areas and weight in children ages 0–24 months. Adequate access is also related to reductions in stunting in rural areas, for the bottom 40 percent, and for children ages 0–24 months. In urban areas, adequate access is related to an increase of 260 g (2.4 percent) and 0.7 centimeters (1 percent), whereas the effects in rural areas are small and not significant. Children ages 0–24 months with access to improved water sources are 151 g heavier (1.9 percent) relative to children without adequate access. Increases in access to improved water sources are related to a decrease of 3 percentage points in the stunting rates in rural areas from a
32 Findings of the Mozambique Water Supply, Sanitation, and Hygiene Poverty Diagnostic
model-predicted value of 48 percent, a decrease of 4 percentage points for the bottom 40 (from a 50 percent prediction), and a decrease of 4 percentage points for children ages 0–24 months (from a 36 percent prediction).
v) Between 2003 and 2011, a decline in the underweight rate at the provincial level was highly correlated with increases in access to both improved water and improved sanitation.
WASH Poverty-Risk Model
As discussed throughout this chapter, inadequate WASH can contribute to adverse health and other development consequences. However, not everyone is equally exposed to WASH-related risks. Within a population that lacks access to safe WASH, some face greater health risks because of other factors that render them more vulnerable or susceptible to adverse effects. For example, being undernourished increases both the likelihood and severity of diarrheal disease and those without access to timely health care are more likely to die because of infection. So, for children who are undernourished and lack access to quality health care, the risk of diarrheal disease and death presented by poor access to WASH is plausibly greater than that for a well-nourished child with timely access to quality health care (see box 2.1).
Inevitably, these two sets of factors—unsafe WASH conditions and other interacting factors, such as access to health care and undernutrition—which together determine the risk posed by unsafe WASH are not distributed equally within populations, but rather reflect wider structural
Box 2.1: PRM Findings: Informing the Country Partnership Framework of Mozambique
Mozambique’s WASH Poverty Diagnostic produced information to advance the sector’s knowledge to rethink the way in which interventions are targeted across the country. One of the key findings of the WASH Poverty Diagnostic relates to how health risks are spread spatially. Specifically, the report identified the interaction between the spatial distribution of risk and intervention impacts. First, the data point to the WASH-related risks of disease varying significantly across regions and economic groups in Mozambique. The reasons for this are threefold: (1) the variability in WASH-related exposures—with children in poorer households having higher exposures; (2) these same children are likely to be much more vulnerable because of their underlying poor nutrition and access to basic health services; and (3) both WASH and health vulnerabilities are the product of underlying economic and geographic inequalities. Some areas with children with the highest risk index values are concentrated in the north, with children from the Cabo Delgado province being particularly vulnerable to disease risk. According to the sanitation and water improvement maps, children from Cabo Delgado, Nampula, Tete, and Zambezia provinces would experience the greatest risk reduction in response to water or sanitation access improvements.
Moreover, the WASH Poverty Diagnostic estimated the disability-adjusted life years (DALYS) related to WASH diseases. DALYs are a metric of the disease burden that is
box continues next page
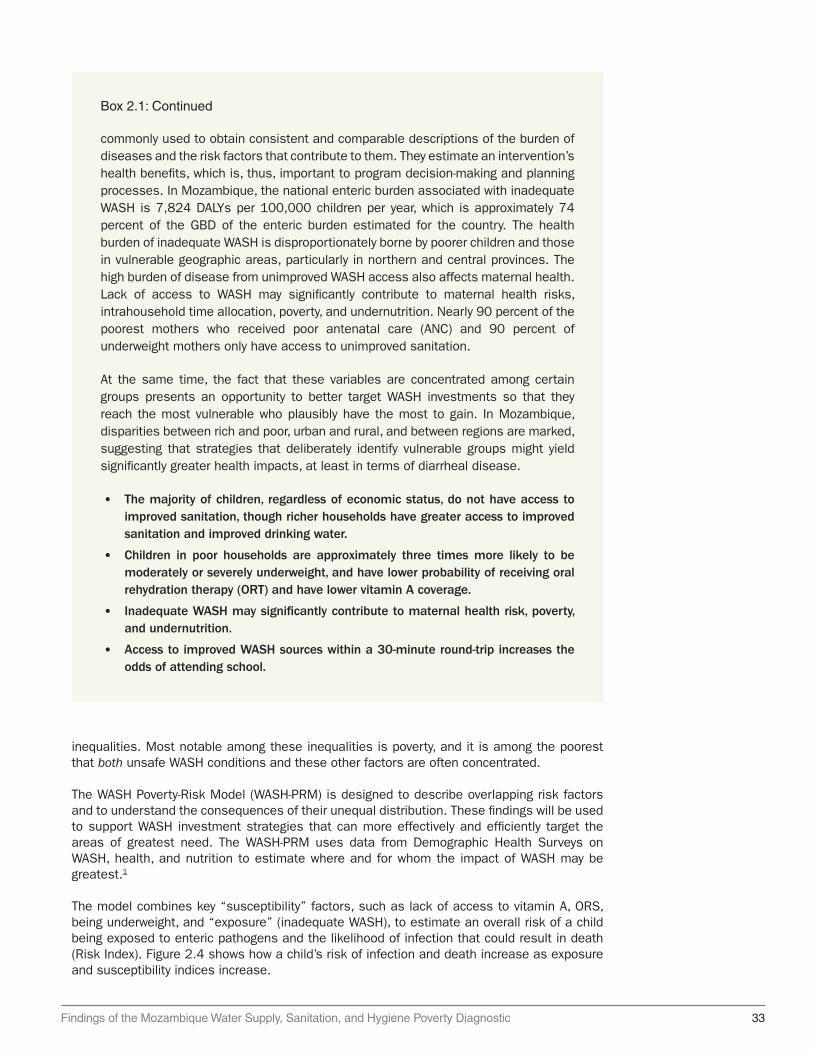
Findings of the Mozambique Water Supply, Sanitation, and Hygiene Poverty Diagnostic 33
inequalities. Most notable among these inequalities is poverty, and it is among the poorest that both unsafe WASH conditions and these other factors are often concentrated.
The WASH Poverty-Risk Model (WASH-PRM) is designed to describe overlapping risk factors and to understand the consequences of their unequal distribution. These findings will be used to support WASH investment strategies that can more effectively and efficiently target the areas of greatest need. The WASH-PRM uses data from Demographic Health Surveys on WASH, health, and nutrition to estimate where and for whom the impact of WASH may be greatest.1
The model combines key “susceptibility” factors, such as lack of access to vitamin A, ORS, being underweight, and “exposure” (inadequate WASH), to estimate an overall risk of a child being exposed to enteric pathogens and the likelihood of infection that could result in death (Risk Index). Figure 2.4 shows how a child’s risk of infection and death increase as exposure and susceptibility indices increase.
commonly used to obtain consistent and comparable descriptions of the burden of diseases and the risk factors that contribute to them. They estimate an intervention’s health benefits, which is, thus, important to program decision-making and planning processes. In Mozambique, the national enteric burden associated with inadequate WASH is 7,824 DALYs per 100,000 children per year, which is approximately 74 percent of the GBD of the enteric burden estimated for the country. The health burden of inadequate WASH is disproportionately borne by poorer children and those in vulnerable geographic areas, particularly in northern and central provinces. The high burden of disease from unimproved WASH access also affects maternal health. Lack of access to WASH may significantly contribute to maternal health risks, intrahousehold time allocation, poverty, and undernutrition. Nearly 90 percent of the poorest mothers who received poor antenatal care (ANC) and 90 percent of underweight mothers only have access to unimproved sanitation.
At the same time, the fact that these variables are concentrated among certain groups presents an opportunity to better target WASH investments so that they reach the most vulnerable who plausibly have the most to gain. In Mozambique, disparities between rich and poor, urban and rural, and between regions are marked, suggesting that strategies that deliberately identify vulnerable groups might yield significantly greater health impacts, at least in terms of diarrheal disease.
• The majority of children, regardless of economic status, do not have access to improved sanitation, though richer households have greater access to improved sanitation and improved drinking water.
• Children in poor households are approximately three times more likely to be moderately or severely underweight, and have lower probability of receiving oral rehydration therapy (ORT) and have lower vitamin A coverage.
• Inadequate WASH may significantly contribute to maternal health risk, poverty, and undernutrition.
• Access to improved WASH sources within a 30-minute round-trip increases the odds of attending school.
Box 2.1: Continued

34 Findings of the Mozambique Water Supply, Sanitation, and Hygiene Poverty Diagnostic
Susceptibility Factors
Disparities in susceptibility risk factors are most pronounced among moderately and severely underweight children, with the highest levels in all settings seen among children living in the poorest households. For example, while almost a quarter (22 percent) of the poorest children (bottom 20 percent) in the urban population are moderately to severely underweight, only 5 percent in the top 20 percent are moderately to severely underweight. The probability of receiving ORS and vitamin A is higher in urban settings than rural ones, with the poorest lagging behind the richer in all settings. In rural areas, disparities in being underweight are much lower among the poorest and the top 60 percent. Vitamin A coverage is close to 50 percent, on average, for the first three quintiles of wealth in rural areas, and reaches slightly more than 75 percent for the fifth quintile in rural areas. Across lower income groups in rural areas, deficiencies of micronutrients, such as vitamin A, iron, and iodine, are very common and have high prevalence in children ages under five and in pregnant women.
The provinces with the highest disease risk values are Cabo Delgado, Tete, and Zambezia; these are followed by Nampula. Map 2.1 shows the exposure, susceptibility, and risk maps for all socioeconomic classes. When assessing these indices separately for the B40 and T60 these same provinces have the highest risk, while Niassa, Inhambane, and Maputo have the lowest risk-index values in the T60 and B40. With respect to Maputo Province, higher risk in the B40 is not reflected in the overall map because of the low risk among the T60.
Deprivation is closely related to overall risks. Indicators of deprivation that play an important role in increasing child risks and vulnerabilities are: nutrition (stunting, wasting, and being
Figure 2.4: Conceptual Framework of Susceptibility, Exposure, and Overall Risk Indexes
Source: Rheingans et al. 2016.Note: ORS = oral rehydration solution.
Exposure index
Sus
cep
tibili
ty in
dex
Low weight for age
No ORS
No vitamin AHigh exposure
High susceptibility
Unimproved water
Unimproved sanitation
HighLow
Low
High
Size = risk index = exposure x susceptibility

Findings of the Mozambique Water Supply, Sanitation, and Hygiene Poverty Diagnostic 35
Map 2.1: Exposure, Susceptibility, and Risk Indexes
Source: DHS 2011. Mozambique.Note: B40 = bottom 40 percent; T60 = top 60 percent.
a. Exposure, B40 b. Exposure, T60 c. Susceptibility, B40 d. Susceptibility, T60 e. Risk, B40f. Risk, T60
< 2.702.70–2.802.80–2.902.90–3.003.00–3.10
0 125 250 500Kilometers
< 0.5
0
> 1.501.00–1.500.50–1.00
125 250 500Kilometers
< 1.001.00–2.002.00–3.003.00–4.004.00–5.00> 5.00
0 125 250 500Kilometers
underweight); water; sanitation; health care (immunization); and education (primary school enrollment). The links between exposure and susceptibility to risks are illustrated in the example of waterborne disease. Only one in four poor, rural children with infections from waterborne diseases receives rehydration treatment; one in three poor, rural children suffers from severe malnutrition. The large inequities in water and sanitation explain the exposure of risks for children. Among those living in the richest quintile of households, more than half enjoy access to improved water and sanitation services. In contrast, only 5 percent or less of the poorest households have access to such services. The bottom 20 percent and bottom 40 percent of the rural population have higher rates of exposure and susceptibility, and higher risk-index values, than the bottom 20 percent and bottom 40 percent of urban populations. The areas with the highest susceptibility are distributed in the northeastern, middle, and western parts of Mozambique. The provinces with the highest risk-index values are Cabo Delgado, Tete, and Zambezia.
The national enteric burden associated with inadequate WASH is 7,824 DALYs per 100,000 children per year, which is approximately 74 percent of the global burden of disease (GBD) of the enteric burden estimated for the country. The health burden of inadequate WASH is disproportionately borne by poorer children and those in vulnerable geographic areas, particularly in northern and central provinces. The distribution of the overall enteric and WASH-related burden in children is inequitable: twice as high for children living in the B40 compared with children in the T60. The highest burden associated with inadequate WASH among the poor is because of a conjuncture of vulnerabilities. They are less likely to have good WASH services and those that do not are also more likely to be undernourished and without access to care (box 2.2).
Box 2.2: Recommendations for WASH Data Improvements in National Surveys and Census
Of all available surveys In Mozambique, only the household budget surveys (HBS) and the DHS-type surveys provide comparable definitions across time to calculate access to improved water or sanitation services. The analysis to answers to Core Questions 1 to 3 relies on these surveys, but the information to even construct the basic indicators of access to improved water or sanitation services is limited.
box continues next page

36 Findings of the Mozambique Water Supply, Sanitation, and Hygiene Poverty Diagnostic
The main information limitation is that some questionnaires do not distinguish between improved or unimproved latrines or between protected or unprotected wells.
Given that the information to even construct the basic MDG and SDG indicators of access to improved water or sanitation is limited, household surveys were not used to provide a systematic analysis of all the different tiers that comprise the Access plus framework. Only the Inquérito sobre Orcamento Familiar (IOF) [Family budget Survey] 2014/15 and the DHS 2011 are used to provide estimations and only for the second tiers. The following are suggestions to improve survey questionnaires in Mozambique to better capture Access plus and inform the SDGs:
• Incorporate the types of questions that the Afrobarometer uses to assess quality of water service provision.
• Incorporate the question of continuity of water supply service available in the DHS Phase 7 (2013–18) questionnaires.
• The analysis of compliance with fecal and priority chemical standards can be complemented with quality perceptions of the drinking water used by the household (available in the IOF 2014/15) and with whether households treat their water before consumption (and how).
• A simple question available in older questionnaires could provide a rough estimate of expenditure on water: How much did you pay last month for water (Mozambican meticais [Mt])?
• Incorporate in the Household Budget Surveys whether the sanitation facilities are shared or not with other households.
The information in Census 2007 is limited, but simple changes would allow estimation of the second tiers of water and sanitation services. The following are suggestions to improve the census questionnaire in Mozambique to better capture Access plus and inform the SDGs:
• Update the response categories of the question “Source of water” to distinguish wells as protected or unprotected. The current question has an ambiguous category, “Water from well without pump”, that cannot be assigned as protected or not.
• Add a simple question for time to water source: “How long does it take to go there, get water, and come back?” The answer for time in minutes should be open-ended.
• Incorporate in the questionnaire whether the sanitation facilities are shared or not with other households.
• If possible, incorporate the question, “In the past two weeks, was the water from this source not available for at least one full day?” to assess service continuity.
Box 2.2: Continued

Findings of the Mozambique Water Supply, Sanitation, and Hygiene Poverty Diagnostic 37
Lessons and Important Messages
• The strong links between water and sanitation, anemia, and child growth highlight the pathways that may affect early child development. Although stunting and anemia are both clearly linked to malnutrition, dietary interventions alone have not normalized growth in children from low-income areas. Contamination of children’s play and feeding environments is a constant and cumulative health risk during the critical window of a child’s growth and development. When children lag persistently in development indicators and manifest irreversible physical and cognitive damage because of inadequate nutrition, recurrent enteric disease may play a role, along with poor diet and a lack of food security. Many common water and sanitation interventions are not specifically designed to tackle Mozambique’s burden of disease or to protect children in the first three years of life.
• In Mozambique, children in poor households are approximately three times more likely to be moderately or severely underweight than children from rich households. They are also more vulnerable to the risks posed by poor WASH because of low access to key health interventions (ORT). Rich children have more access to curative health services (ORT) than poor ones.
• Access to improved water is related to an increase of 260 g (2.3 percent) in children in urban areas, of 160 g (1.4 percent) for those in the top 60 percent category, and 150 g (1.9 percent) for children ages 0–24 months. Access to improved sanitation has a clear, negative relation with stunting rates, and to a lesser extent, with wasting rates. The effect of inadequate access to sanitation is statistically significant in urban areas and for children ages 25–59 months. Average access to unimproved sanitation is related to higher stunting rates, only when the average access exceeds 75 percent and it is not related to wasting rates.2
• Diseases associated with poor sanitation and unsafe water account for about 20 percent of the burden of disease in Mozambique. The rate at which children are affected by poor water and sanitation in Mozambique is 2.2 times higher than that for Europe and Central Asia, and five times higher than that for East Asia and the Pacific. The prevalence of schistosomiasis in school-age children in Mozambique (52.8 percent) is one of the highest across Africa.
• WASH-related risk of disease varies significantly across regions and economic groups in Mozambique. The reasons for this are threefold: (1) the variability in WASH-related exposures—with children in poorer households having higher exposures; (2) these same children are likely to be much more vulnerable because of underlying poor nutrition and access to basic health services; and (3) both WASH and health vulnerabilities are the products of underlying economic and geographic inequalities.
Notes
1. The WASH-PRM methodology and its full analysis for Mozambique are documented in background papers and can be made available upon request.
2. DHS (Inquérito Demográfico e de Saúde). 2011/2012. MISA/Moçambique, INE/Moçambique and ICF International. http://dhsprogram.com/pubs/pdf/FR266/FR266.pdf.
References
Chavane, L., M. Merialdi, A. P. Betrán, J. Requejo-Harris, E. Bergel, A. Aleman, M. Colomar, M. L. Cafferata, A. Carbonell, B. Crahay, T. Delvaux, D. Geelhoed, M. Gülmezoglu,
38 Findings of the Mozambique Water Supply, Sanitation, and Hygiene Poverty Diagnostic
C. R. Malapende, A. Melo, M. H. Nguyen, N. B. Osman, M. Widmer, M. Temmerman, and F. Althabe. 2014. “Implementation of Evidence-Based Antenatal Care in Mozambique: A Cluster Randomized Controlled Trial: Study Protocol.” BMC Health Services Research 14:228. https://doi.org/10.1186/1472-6963-14-228.
International Food Policy Research Institute. 2015. “Global Nutrition Report 2015: Actions and Accountability to Advance Nutrition and Sustainable Development.” Washington, DC. http://dx.doi.org/10.2499/9780896298835.
Rheingans, R., J. Anderson, K. Bagamian, S. Ryan, J. Watson, L. Laytner, and O. Cumming. 2016. “Poverty Risk Model Assessment: Mozambique (PRM).” Background Paper II. Mimeo. University of Florida (UF) and the London School of Hygiene and Tropical Medicine (LSHTM).
USAID (United States Agency for International Development). 2011. “Maternal and Child Health Integrated Program.” USAID, Washington, DC. http://pdf.usaid .gov/pdf_docs / Pdacs529 . pdf.

Findings of the Mozambique Water Supply, Sanitation, and Hygiene Poverty Diagnostic 39
Chapter 3Trends in Access to Improved Water Supply and SanitationThis chapter presents water access and coverage trends (section 3.1); shows estimates of the economic and human toll of poor sanitation (section 3.2); unfolds open defecation and hygiene statistics (section 3.3); and provides some lessons and key messages (section 3.4).
Water Access and Coverage Trends
The government has set ambitious targets for the water and sanitation sector. The National Strategy for Water and Urban Sanitation 2011–25 calls for 80 percent of the urban population to have access to improved water service by 2025. For the rural water sector, the strategy seeks to expand access to 69 percent of the rural population, or 13.5 million people, by 2025.
Figure 3.1 presents estimates of the increase in access to improved water between 2003 and 2015. Between 2003 and 2008, a large jump in the coverage rate occurred in urban access. More recent progress has been driven by an increase in improved water coverage in rural areas. Between 2011 and 2015, rural water coverage jumped from 38 percent to 45 percent, while coverage in urban areas inched up from 85 percent to 88 percent, slowed by rapid urbanization rates.
The access gap is increasing. Nationally, access to improved water sources for both the B40 and T60 increased from 2003 to 2015 (table 3.1), but the access gap increased as well. The access rate for the bottom group was 25 percent in 2003, increasing to 38 percent in
Figure 3.1: Trends in Water Access, by Type and Area, 2003–15
Source: World Bank calculations based on various household surveys, Mozambique.Note: DHS = Demographic and Health Survey; IAF = Inquérito aos Agregados Familiares (households survey); IOF = Mozambique Inquérito sobre Orçamento Familiar; MICS = Mozambique Multiple Indicator Cluster Survey.
Improved Unimproved
3748 53 58 58
77 85 88
28 34 38 45
6352 47 42 42
23 15 12
72 66 62 55
0
20
40
60
80
100
IAF 2
002–
03
MICS 20
08
DHS 2011
IOF 2
014–
15
IAF 2
002–
03
MICS 20
08
DHS 2011
IOF 2
014–
15
IAF 2
002–
03
MICS 20
08
DHS 2011
IOF 2
014–
15
National Urban Rural
Per
cen
t

40 Findings of the Mozambique Water Supply, Sanitation, and Hygiene Poverty Diagnostic
2015. The top group saw larger increases over the same period, with the access rate jumping from 45 percent to 72 percent. Between 2003 and 2008, access rates for the bottom group increased five percentage points to 30 percent, while those for the top group gained 14 points to 59 percent. These unequal rates of improvement have resulted in a growing access gap. The difference in access to improved water between the two groups rose to 34 percentage points in 2015, from 20 percentage points in 2003.
Estimates by national quintiles (figure 3.2) show that access to improved water sources by the bottom two quintiles remained almost stagnant from 2003 to 2015. Two sub-periods can be distinguished, the first between 2003 and 2011, when most of the progress occurred for the top, or wealthier, quintiles and the second from 2011 to 2015, when improvements largely benefited the middle class. The bottom three quintiles saw almost no progress between 2003 and 2011. In contrast, access for the fourth quintile increased from 42 percent in 2003 to 67 percent in 2011, and that for the fifth, or wealthiest, quintile rose from 63 percent to more than 90 percent, with most of the gains taking place between 2003 and 2008. In the period 2011 to 2015, the middle class, which consists of the population in the third quintile, experienced the largest increase, from 37 percent to 49 percent, while access for the bottom and top quintiles remained largely unchanged.
Table 3.2 presents the Joint Monitoring Programme figures for access to different water sources, ranging from reliance on unimproved sources to access to piped water onto premises. The latter, which is a subcategory under improved water sources, is the best option for a safe water supply. In addition to the large numbers of people still reliant on unimproved water sources, a wide disparity exists between urban and rural areas in terms of the percentage of the population with access to a piped-water supply.
Access to piped water is low throughout the country and largely benefits the better off in urban areas. Figure 3.3 presents estimates of the access to piped water by the B40 and T60 percentages for urban and rural areas. The former group has seen only a small improvement in their access rate for piped water compared with the latter group. The overall coverage for piped water on premises increased from 11 percent in 1996 to 48 percent in 2015 for the top group, while the level of access for the bottom group rose from a virtually nonexistent base to 10 percent over the same period.
Change in urban areas predominantly drove the diverging trends in terms of access to piped water. Access for the T60 increased steadily in the cities, with the coverage rate rising from 31 percent in 1996 to 79 percent in 2015, whereas access for the poorest urbanites has stagnated at about 25 percent since 2009. The access gap between the two groups was 27 percentage points in 1996 in the urban areas; by 2015, it had doubled to 54 points. Rural areas have very low rates of access to a piped-water supply, but the gap between the T60 and B40 are not as large as in urban areas. In 1996 access to piped water in rural areas was almost zero for both groups. By 2015 the T60 had an access rate of 18 percent and the poorest group had a rate of only 9 percent.
Table 3.1: Trends in Water Access, by B40 and T60, 2003–15Percent
Year National B40 T60 Gap
2003 37 25 45 20
2008 48 30 59 29
2011 53 33 66 33
2015 58 38 72 34Source: World Bank estimations based on DHS 2011/12,1 IAF 2002/03,2 IOF 2014/15,3 and MICS 20084.Note: B40 = bottom percent; DHS = Demographic and Health Survey; IAF = Inquérito aos Agregados Familiares (households survey); IOF = Mozambique Inquérito sobre Orçamento Familiar; MICS = Mozambique Multiple Indicator Cluster Survey; T60 = top 60 percent.

Findings of the Mozambique Water Supply, Sanitation, and Hygiene Poverty Diagnostic 41
Figure 3.2: Access to Improved Water, by Wealth Quintiles
Source: World Bank estimations based on IAF 2002/03, MICS 2008, DHS 2011, and IOF 2014/15.Note: DHS = Demographic and Health Survey; IAF = Inquérito aos Agregados Familiares (households survey); IOF = Mozambique Inquérito sobre Orçamento Familiar; MICS = Mozambique Multiple Indicator Cluster Survey.
0
20
40
60
80
100
Q1 Q2 Q3 Q4 Q5
2003 2008 2011 2015
Per
cen
t
Table 3.2: Joint Monitoring Programme Drinking-Water Coverage
Mozambique
Drinking-water coverage estimates
Urban (%) Rural (%) Total (%)
1990 2015a 1990 2015a 1990 2015a
Piped onto premises 20 25 1 1 6 9
Other improved source 52 56 22 36 29 42
Other unimproved source 25 15 45 48 40 38
Surface water 3 4 32 15 25 11Source: WHO/UNICEF 2012.a. Predictions.
Provincial Water-Supply Coverage Inequities
In 2015, the gap in access to improved water between the T60 and the B40 was 34 percentage points. This large difference is echoed by equally large disparities between the two groups within provinces, as well as among provinces. Figure 3.4 (panel a) presents estimates of provincial access to improved water by the B40 and T60. Provinces, ranked according to access for the bottom group, can be divided into two categories: one with access rates of about 40 percent for this group and the other with access rates of about 60 percent for the other group.
The provinces display tremendous variations in the types of service that people can access, from Maputo City, where few residents rely on surface water, to Zambezia, where surface-water use remains high and piped water is scarce (figure 3.4, panel b). The provinces where
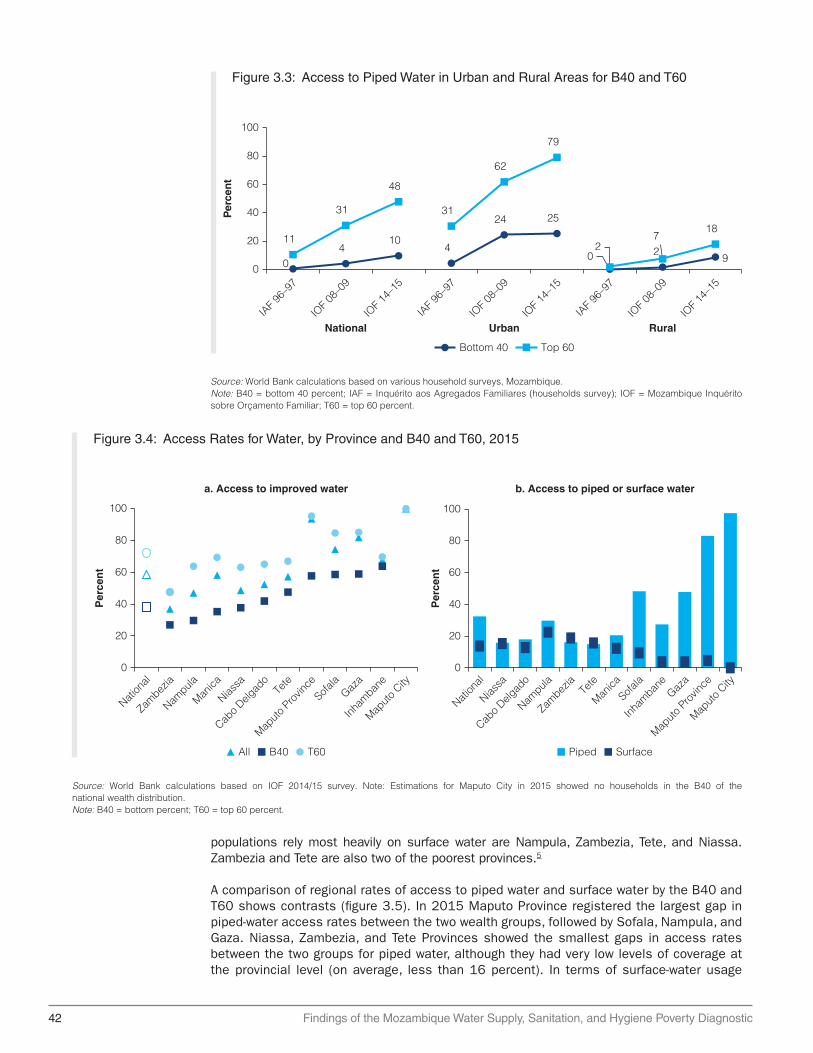
42 Findings of the Mozambique Water Supply, Sanitation, and Hygiene Poverty Diagnostic
Figure 3.3: Access to Piped Water in Urban and Rural Areas for B40 and T60
Source: World Bank calculations based on various household surveys, Mozambique.Note: B40 = bottom 40 percent; IAF = Inquérito aos Agregados Familiares (households survey); IOF = Mozambique Inquérito sobre Orçamento Familiar; T60 = top 60 percent.
Bottom 40 Top 60
04
104
24 25
0 29
11
31
48
31
62
79
27
18
0
20
40
60
80
100
IAF 9
6–97
IOF 0
8–09
IOF 1
4–15
IAF 9
6–97
IOF 0
8–09
IOF 1
4–15
IAF 9
6–97
IOF 0
8–09
IOF 1
4–15
National Urban Rural
Per
cen
t
Figure 3.4: Access Rates for Water, by Province and B40 and T60, 2015
Source: World Bank calculations based on IOF 2014/15 survey. Note: Estimations for Maputo City in 2015 showed no households in the B40 of the national wealth distribution.Note: B40 = bottom percent; T60 = top 60 percent.
a. Access to improved water
Per
cen
t
0
20
40
60
80
100
Nation
al
Zambez
ia
Nampula
Manica
Niassa
Cabo D
elgad
oTe
te
Maputo
Pro
vince
Sofala
Gaza
Inham
bane
Maputo
City
All B40 T60
Per
cen
t
b. Access to piped or surface water
0
20
40
60
80
100
Nation
al
Niassa
Cabo D
elgad
o
Nampula
Zambez
iaTe
te
Manica
Sofala
Inham
bane
Gaza
Maputo
Pro
vince
Maputo
City
Piped Surface
populations rely most heavily on surface water are Nampula, Zambezia, Tete, and Niassa. Zambezia and Tete are also two of the poorest provinces.5
A comparison of regional rates of access to piped water and surface water by the B40 and T60 shows contrasts (figure 3.5). In 2015 Maputo Province registered the largest gap in piped-water access rates between the two wealth groups, followed by Sofala, Nampula, and Gaza. Niassa, Zambezia, and Tete Provinces showed the smallest gaps in access rates between the two groups for piped water, although they had very low levels of coverage at the provincial level (on average, less than 16 percent). In terms of surface-water usage
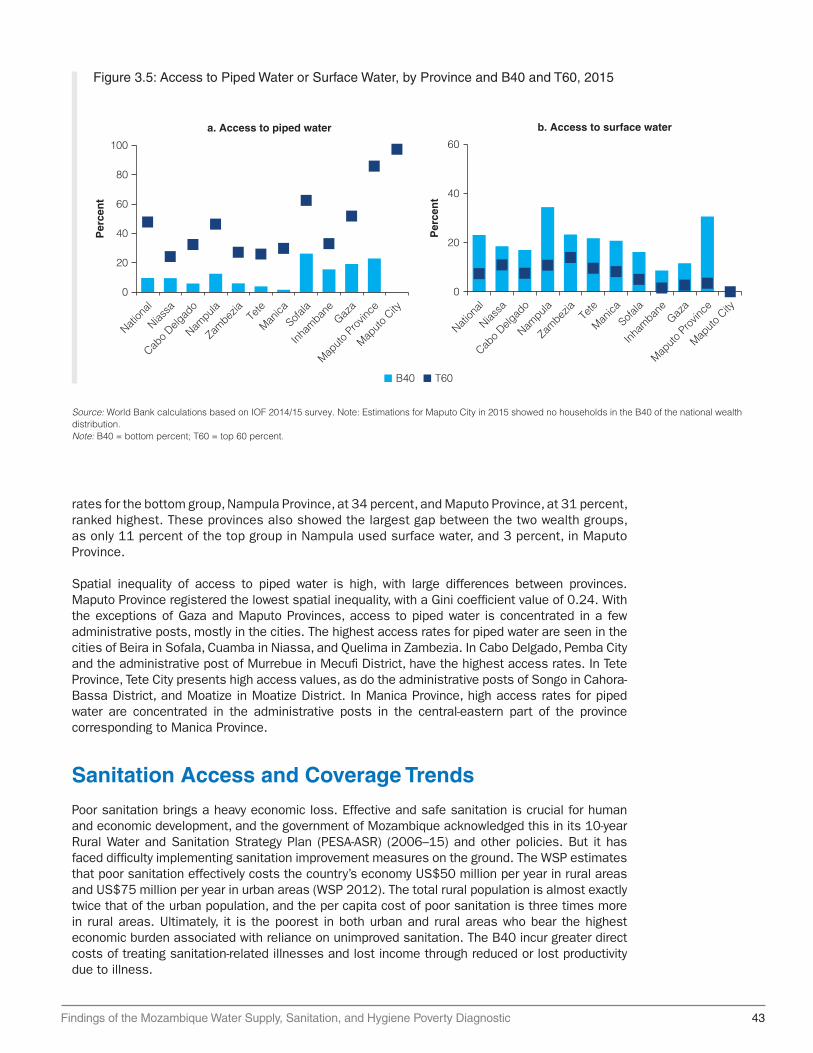
Findings of the Mozambique Water Supply, Sanitation, and Hygiene Poverty Diagnostic 43
Figure 3.5: Access to Piped Water or Surface Water, by Province and B40 and T60, 2015
Source: World Bank calculations based on IOF 2014/15 survey. Note: Estimations for Maputo City in 2015 showed no households in the B40 of the national wealth distribution.Note: B40 = bottom percent; T60 = top 60 percent.
a. Access to piped water
Per
cen
t
0
20
40
60
80
100
Nation
al
Niassa
Cabo D
elgad
o
Nampula
Zambez
iaTe
te
Manica
Sofala
Inham
bane
Gaza
Maputo
Pro
vince
Maputo
City
Per
cen
t
b. Access to surface water
0
20
40
60
Nation
al
Niassa
Cabo D
elgad
o
Nampula
Zambez
iaTe
te
Manica
Sofala
Inham
bane
Gaza
Maputo
Pro
vince
Maputo
City
B40 T60
rates for the bottom group, Nampula Province, at 34 percent, and Maputo Province, at 31 percent, ranked highest. These provinces also showed the largest gap between the two wealth groups, as only 11 percent of the top group in Nampula used surface water, and 3 percent, in Maputo Province.
Spatial inequality of access to piped water is high, with large differences between provinces. Maputo Province registered the lowest spatial inequality, with a Gini coefficient value of 0.24. With the exceptions of Gaza and Maputo Provinces, access to piped water is concentrated in a few administrative posts, mostly in the cities. The highest access rates for piped water are seen in the cities of Beira in Sofala, Cuamba in Niassa, and Quelima in Zambezia. In Cabo Delgado, Pemba City and the administrative post of Murrebue in Mecufi District, have the highest access rates. In Tete Province, Tete City presents high access values, as do the administrative posts of Songo in Cahora-Bassa District, and Moatize in Moatize District. In Manica Province, high access rates for piped water are concentrated in the administrative posts in the central-eastern part of the province corresponding to Manica Province.
Sanitation Access and Coverage Trends
Poor sanitation brings a heavy economic loss. Effective and safe sanitation is crucial for human and economic development, and the government of Mozambique acknowledged this in its 10-year Rural Water and Sanitation Strategy Plan (PESA-ASR) (2006–15) and other policies. But it has faced difficulty implementing sanitation improvement measures on the ground. The WSP estimates that poor sanitation effectively costs the country’s economy US$50 million per year in rural areas and US$75 million per year in urban areas (WSP 2012). The total rural population is almost exactly twice that of the urban population, and the per capita cost of poor sanitation is three times more in rural areas. Ultimately, it is the poorest in both urban and rural areas who bear the highest economic burden associated with reliance on unimproved sanitation. The B40 incur greater direct costs of treating sanitation-related illnesses and lost income through reduced or lost productivity due to illness.

44 Findings of the Mozambique Water Supply, Sanitation, and Hygiene Poverty Diagnostic
Sanitation data consistently show that rural areas lag overall in terms of rates of access to improved sanitation. Indeed, the high proportion of rural households using unimproved sources of sanitation drives the national average, because a higher proportion of the total population lives in rural areas. In rural areas, the coverage rates in Mozambique were lower than those for Sub-Saharan Africa (35 percent). Mozambique’s efforts to bring improved sanitation to rural areas has not kept pace with programs for urban areas, in part because the sanitation sector has focused on delivering supply-led approaches to higher-density towns (those with populations exceeding 30,000), and paid less attention to rural districts (UNICEF 2015).
Mozambique is at high risk of not meeting national targets. Improvement in sanitation is a top priority in the national agenda, despite the sector remaining insufficiently funded (see chapter 5). The first National Sanitation Conference, held in May 2014 under the leadership of the Mozambique government, agreed to try to eliminate open defecation by 2025, and to ensure universal access to water and sanitation by 2030, including for schools and health care facilities. For rural areas, the target is to cover nearly half (48 percent) of the rural population with improved sanitation services by 2025. For the urban sanitation sector, the objective is to reach 80 percent coverage, serving nearly 7 million people.
As figure 3.6 shows the national access rate for improved sanitation increased from 14 percent in 2003 to 28 percent in 2015. Urban areas saw improved sanitation coverage rates rise from 38 percent in 2003 to 59 percent in 2015. While urban areas are better served, the country is grappling with similar issues to those affecting other parts of Sub-Saharan Africa: service provision has not kept pace with rapid urbanization. This explains why the share of the urban population practicing open defecation has remained relatively steady between 1996 and 2015, especially for the poorest group, without showing any clear sign of reduction. Progress has been slower in the rural areas, with coverage rates increasing from 3 percent to 14 percent over the same period, but for the past several years (2011 to 2015) access to improved sanitation has not increased. Mozambique’s targets are unlikely to be met.
The country’s sanitation systems are in poor condition. Regardless of the containment method for collecting fecal waste (improved or unimproved), Mozambique’s sanitation service chain is underdeveloped when it comes to fecal sludge management—the emptying, transportation, treatment, and disposal of fecal waste (figure 3.7). On-site facilities are either
Figure 3.6: Sanitation-Access Trends, by Type and Area, 2003–15
Source: World Bank calculations based on various household surveys, Mozambique.Note: DHS = demographic and health survey; IAF = Inquérito aos Agregados Familiares (households survey); IOF = Mozambique Inquérito sobre Orçamento Familiar; MICS = Mozambique Multiple Indicator Cluster Survey.
14 1828 28
38 4557 59
3 6 14 14
36 3533 36
41 3529 29
3336
35 40
50 47 39 3521 20 14 11
64 58 51 46
0
20
40
60
80
100
IAF 2
002-
03
IOF 2
008-
09
DHS 2011
IOF 2
014-
15
IAF 2
002-
03
IOF 2
008-
09
DHS 2011
IOF 2
014-
15
IAF 2
002-
03
IOF 2
008-
09
DHS 2011
IOF 2
014-
15
National
Per
cen
t
Urban Rural
Improved Other unimproved Open defecation
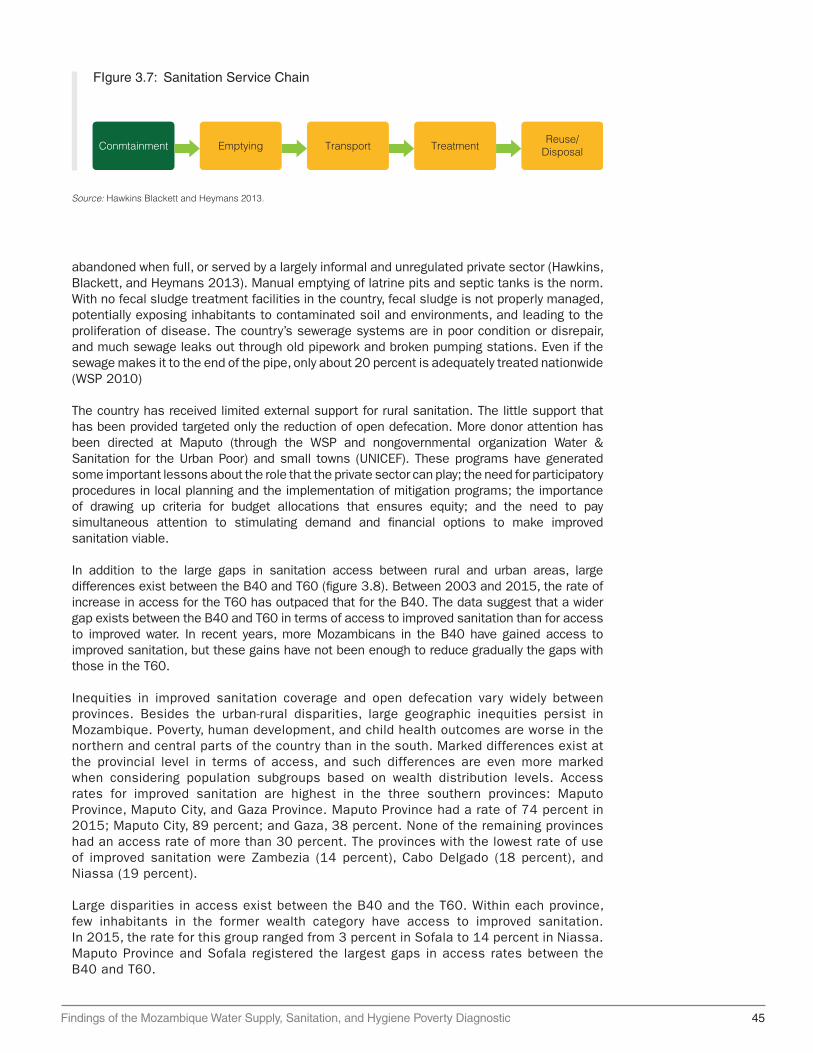
Findings of the Mozambique Water Supply, Sanitation, and Hygiene Poverty Diagnostic 45
FIgure 3.7: Sanitation Service Chain
Source: Hawkins Blackett and Heymans 2013.
Conmtainment Emptying Transport TreatmentReuse/
Disposal
abandoned when full, or served by a largely informal and unregulated private sector (Hawkins, Blackett, and Heymans 2013). Manual emptying of latrine pits and septic tanks is the norm. With no fecal sludge treatment facilities in the country, fecal sludge is not properly managed, potentially exposing inhabitants to contaminated soil and environments, and leading to the proliferation of disease. The country’s sewerage systems are in poor condition or disrepair, and much sewage leaks out through old pipework and broken pumping stations. Even if the sewage makes it to the end of the pipe, only about 20 percent is adequately treated nationwide (WSP 2010)
The country has received limited external support for rural sanitation. The little support that has been provided targeted only the reduction of open defecation. More donor attention has been directed at Maputo (through the WSP and nongovernmental organization Water & Sanitation for the Urban Poor) and small towns (UNICEF). These programs have generated some important lessons about the role that the private sector can play; the need for participatory procedures in local planning and the implementation of mitigation programs; the importance of drawing up criteria for budget allocations that ensures equity; and the need to pay simultaneous attention to stimulating demand and financial options to make improved sanitation viable.
In addition to the large gaps in sanitation access between rural and urban areas, large differences exist between the B40 and T60 (figure 3.8). Between 2003 and 2015, the rate of increase in access for the T60 has outpaced that for the B40. The data suggest that a wider gap exists between the B40 and T60 in terms of access to improved sanitation than for access to improved water. In recent years, more Mozambicans in the B40 have gained access to improved sanitation, but these gains have not been enough to reduce gradually the gaps with those in the T60.
Inequities in improved sanitation coverage and open defecation vary widely between provinces. Besides the urban-rural disparities, large geographic inequities persist in Mozambique. Poverty, human development, and child health outcomes are worse in the northern and central parts of the country than in the south. Marked differences exist at the provincial level in terms of access, and such differences are even more marked when considering population subgroups based on wealth distribution levels. Access rates for improved sanitation are highest in the three southern provinces: Maputo Province, Maputo City, and Gaza Province. Maputo Province had a rate of 74 percent in 2015; Maputo City, 89 percent; and Gaza, 38 percent. None of the remaining provinces had an access rate of more than 30 percent. The provinces with the lowest rate of use of improved sanitation were Zambezia (14 percent), Cabo Delgado (18 percent), and Niassa (19 percent).
Large disparities in access exist between the B40 and the T60. Within each province, few inhabitants in the former wealth category have access to improved sanitation. In 2015, the rate for this group ranged from 3 percent in Sofala to 14 percent in Niassa. Maputo Province and Sofala registered the largest gaps in access rates between the B40 and T60.
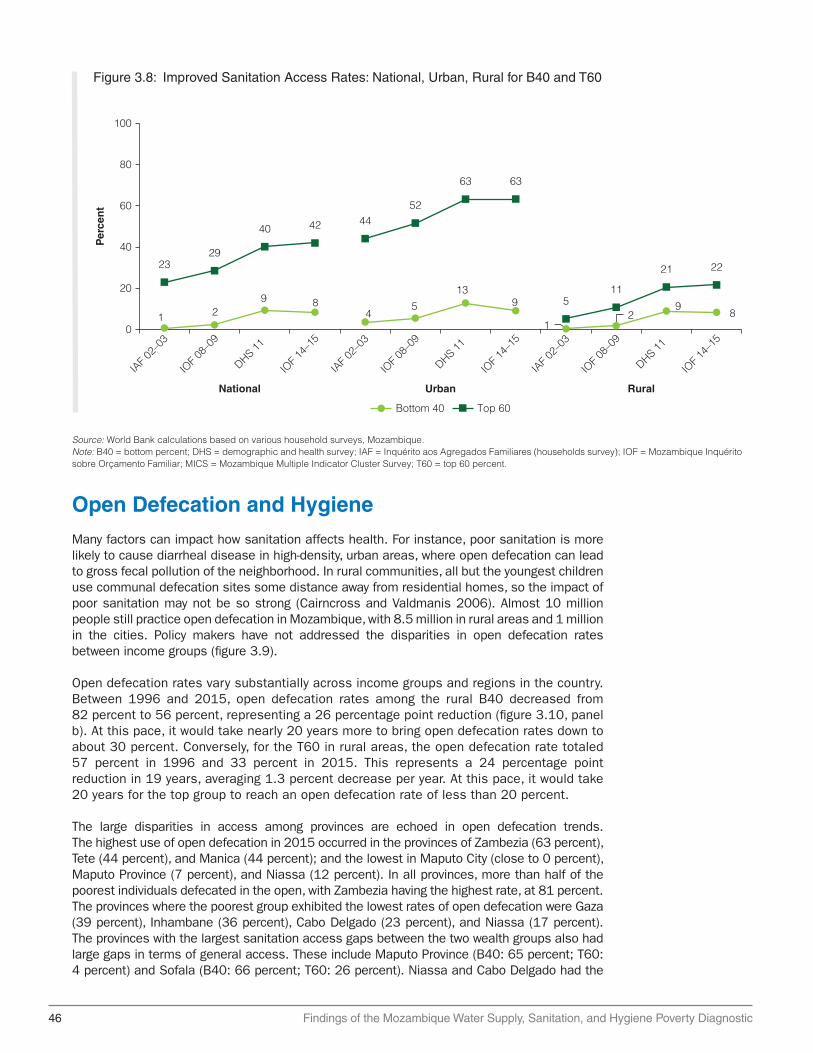
46 Findings of the Mozambique Water Supply, Sanitation, and Hygiene Poverty Diagnostic
Figure 3.8: Improved Sanitation Access Rates: National, Urban, Rural for B40 and T60
Source: World Bank calculations based on various household surveys, Mozambique.Note: B40 = bottom percent; DHS = demographic and health survey; IAF = Inquérito aos Agregados Familiares (households survey); IOF = Mozambique Inquérito sobre Orçamento Familiar; MICS = Mozambique Multiple Indicator Cluster Survey; T60 = top 60 percent.
1 29 8
45
139
12
98
2329
40 42 4452
63 63
511
21 22
National Urban Rural
Bottom 40 Top 60
0
20
40
60
80
100
Per
cen
t
IAF 0
2–03
IOF 0
8–09
DHS 11
IOF 1
4–15
IAF 0
2–03
IOF 0
8–09
DHS 11
IOF 1
4–15
IAF 0
2–03
IOF 0
8–09
DHS 11
IOF 1
4–15
Open Defecation and Hygiene
Many factors can impact how sanitation affects health. For instance, poor sanitation is more likely to cause diarrheal disease in high-density, urban areas, where open defecation can lead to gross fecal pollution of the neighborhood. In rural communities, all but the youngest children use communal defecation sites some distance away from residential homes, so the impact of poor sanitation may not be so strong (Cairncross and Valdmanis 2006). Almost 10 million people still practice open defecation in Mozambique, with 8.5 million in rural areas and 1 million in the cities. Policy makers have not addressed the disparities in open defecation rates between income groups (figure 3.9).
Open defecation rates vary substantially across income groups and regions in the country. Between 1996 and 2015, open defecation rates among the rural B40 decreased from 82 percent to 56 percent, representing a 26 percentage point reduction (figure 3.10, panel b). At this pace, it would take nearly 20 years more to bring open defecation rates down to about 30 percent. Conversely, for the T60 in rural areas, the open defecation rate totaled 57 percent in 1996 and 33 percent in 2015. This represents a 24 percentage point reduction in 19 years, averaging 1.3 percent decrease per year. At this pace, it would take 20 years for the top group to reach an open defecation rate of less than 20 percent.
The large disparities in access among provinces are echoed in open defecation trends. The highest use of open defecation in 2015 occurred in the provinces of Zambezia (63 percent), Tete (44 percent), and Manica (44 percent); and the lowest in Maputo City (close to 0 percent), Maputo Province (7 percent), and Niassa (12 percent). In all provinces, more than half of the poorest individuals defecated in the open, with Zambezia having the highest rate, at 81 percent. The provinces where the poorest group exhibited the lowest rates of open defecation were Gaza (39 percent), Inhambane (36 percent), Cabo Delgado (23 percent), and Niassa (17 percent). The provinces with the largest sanitation access gaps between the two wealth groups also had large gaps in terms of general access. These include Maputo Province (B40: 65 percent; T60: 4 percent) and Sofala (B40: 66 percent; T60: 26 percent). Niassa and Cabo Delgado had the

Findings of the Mozambique Water Supply, Sanitation, and Hygiene Poverty Diagnostic 47
Figure 3.9: Open Defecation Rates, Rural Areas, B40 and T60
Source: World Bank calculations based on various household surveys, Mozambique.Note: B40 = bottom percent; DHS = demographic and health survey; IAF = Inquérito aos Agregados Familiares (households survey); IOF = Mozambique Inquérito sobre Orçamento Familiar; T60 = top 60 percent.
0
20
40
60
80
100
IAF 1996–97 IAF 2002–03 IOF 2008–09 DHS 2011 IOF 2014–15
B40 T60
Per
cen
t
Household survey
Figure 3.10: Access to Improved Sanitation and Use of Open Defecation, by Province, 2015
Source: World Bank estimations using the IOF 2014/15 survey.Note: B40 = bottom percent; T60 = top 60 percent.
All B40 T60
a. Improved sanitation
0
20
40
60
80
100
Nation
al
Sofala
Manica
Inham
bane
Zambez
ia
Maputo
Pro
vince
Cabo D
elgad
o
Nampula
Gaza
Tete
Niassa
Maputo
City
Per
cen
t
b. Open defecation
0
20
40
60
80
100
Nation
al
Niassa
Cabo D
elgad
o
Inham
bane
Gaza
Tete
Nampula
Maputo
Pro
vince
Sofala
Manica
Zambez
ia
Maputo
City
Per
cen
t
lowest gaps; besides having low rates for open defecation by the poorest residents, the two provinces also had low rates for the T60 (6 percent in Niassa and 11 percent in Cabo Delgado).
Good hygiene practices are critical if inhabitants are to gain the full benefits of safe water and sanitation. These practices include handwashing, fecal containment (including for child feces), and safe handling of drinking water. Research suggests that among those three critical behaviors, handwashing with soap reduces the number of cases of diarrhea more than improved water quality and excreta disposal (Esrey et al. 1991; Cairncross et al. 2010).

48 Findings of the Mozambique Water Supply, Sanitation, and Hygiene Poverty Diagnostic
Handwashing practices in Mozambique are suboptimal. Based on the DHS (2011), handwashing practices vary considerably across different wealth quintiles of the population. On average, the population has a relatively low rate of proper handwashing, with only 21 percent of urbanites using soap. Even among those in the fifth quintile of wealth, only 32 percent wash their hands with soap. The lowest two quintiles average a 6 percent rate for handwashing with soap. For the bottom 80 percent of the population in urban areas, 10 percent or less have access to a place where they can wash their hands with soap (figure 3.11, panel a).6 Among the various ways to reduce incidence of diarrhea in Mozambique, hygiene education can play an essential role.
The discrepancy that exists across wealth quintiles in terms of access to proper handwashing facilities extends to rural and urban populations. The richest urban quintile, for example, has a higher rate of access compared with the other quintiles, albeit at a very low rate.
In Mozambique, poor, rural households that lack access to improved sanitation facilities also tend to dispose of child feces in unsafe ways. In 2011, 52 percent of households reported safe disposal of children’s feces, with increases in both urban and rural areas (WSP 2015). However, considerable variations exist across geographic and wealth groups. For instance, in rural areas, 85 percent of children in the first (poorest) quintile were not exposed to safe disposal practices. Even for the second quintile, nearly 60 percent of households engaged in unsafe disposal practices. In contrast, only 30 percent of households in the richest quintile used unsafe disposal methods. The use of different methods to dispose of child feces is not common among households in the first quintile, while 70 percent of those in the richest quintile use various, safe disposal practices.
Key Messages
• Investment to date has largely concentrated on urban water, which has benefited poorer urban households. However, the lack of attention to rural areas has left gross disparities between urban and rural; both the B40 and T60 in rural areas are neglected.
Figure 3.11: Proportion of Households with a Place for Handwashing with Soap, 2011
Source: World Bank estimations based on DHS 2011.
4
7
7
10
32
21
0 50 100
Lowestquintile
Quintile 2
Quintile 3
Quintile 4
Highestquintile
Total
a. Urban areas b. Rural areas
8
8
12
12
25
10
0 20 40 60 80 100
Lowestquintile
Quintile 2
Quintile 3
Quintile 4
Highestquintile
Total
Percent Percent

Findings of the Mozambique Water Supply, Sanitation, and Hygiene Poverty Diagnostic 49
• The T60 in urban areas have benefited more than anyone with respect to sanitation. Given population density and poor sanitation conditions among poorer populations, and correlation between stunting and open defecation in urban areas, this subsector warrants greater attention.
Notes
1. DHS (Demographic and Health Survey). 2011/2012. MISA/Moçambique, INE / Moçambique and ICF International. http://dhsprogram.com/pubs/pdf /FR266 / FR266.pdf.
2. IAF (Inquérito aos Agregados Familiares [households survey]). 2002/03. Mozambique Household Budget Survey 2002-03. National Institute of Statistics (INE) (Mozambique).
3. IOF (Mozambique Inquérito sobre Orçamento Familiar). 2014/15. Direcção de Censos e Inquéritos - Instituto Nacional de Estatística (INE). http://catalog.ihsn.org/index.php / catalog/2168/related_materials.
4. MICS (Mozambique Multiple Indicator Cluster Survey). 2008-09. UNICEF/National Statistics Institute (Mozambique), New York.
5. Nampula, with 5 million inhabitants, and Zambezia, with 4.8 million, are the most populous provinces. They also have the largest rural populations, with 3.8 million rural dwellers for Zambezia and 3.4 million for Nampula. Tete (2.2 million), Manica (1.5 million), and Cabo Delgado (1.4 million) have high numbers of rural residents as well. Tete (86 percent), Zambezia (79 percent), Niassa (77 percent), and Inhambane (77 percent) have the highest proportions of rural population among the provinces.
6. Usually such low percentages of handwashing are a result of a lack of information or limited resources to buy soap, or both.
References
Cairncross, S., and V. Valdmanis. 2006. “Water Supply, Sanitation, and Hygiene Promotion.” In Disease Control Priorities in Developing Countries [Internet], 2nd ed., edited by D. T. Jamison, J. G. Breman, A. R. Measham, G. Alleyne, M. Claeson, D. B. Evans, P. Jha, A. Mills, and P. Musgrove, chapter 41. Washington, DC: World Bank. http://www.ncbi.nlm.nih.gov/books /NBK11755/.
Esrey, S. A., J. B. Potash, L. Roberts, and C. Shiff. 1991. “Effects of Improved Water Supply and Sanitation on Ascariasis, Diarrhea, Dracunculiasis, Hookworm Infection, Schistosomiasis, and Trachoma.” Bulletin of the World Health Organization 69 (5): 609–21.
Hawkins, P., I. Blackett, and C. Heymans. 2013. “Poor-Inclusive Urban Sanitation: An Overview.” Water and Sanitation Program, World Bank, Washington, DC. https://www.wsp.org/sites / wsp.org/files/publications/WSP-Poor-Inclusive-Urban-Sanitation-Overview.pdf.
UNICEF (United Nations Children’s Fund). 2015. “Sanitation in Small Towns: Experience from Mozambique.” Field Note #35. UNICEF, New York. https://www.unicef.org/esaro/WASH -Field-Small-Towns-low-res.pdf.
WHO (World Health Organization)/UNICEF. 2012. “Progress on Safe Drinking Water and Sanitation.” WHO/UNICEF, New York. https://www .unicef.org/media/files/JMPreport2012 .pdf.
WSP (Water and Sanitation Program). 2010. “Sustainable Management of Small Water Supply Systems in Africa.” Practitioners’ Workshop Report, October 2010. World Bank, Washington, DC. http://www.wsp.org/sites/wsp.org/files/publications/Sustainable _ Management_of _ small_water_supply_systems_in_Africa_English.pdf.
50 Findings of the Mozambique Water Supply, Sanitation, and Hygiene Poverty Diagnostic
———. 2012. “Economic Impacts of Poor Sanitation in Africa.” World Bank, Washington, DC. http://siteresources.worldbank.org/INTAFRICA/Resources/economic -impacts-of-poor -sanitation-in-africa-factsheet.pdf.
———. 2015. “Child Feces Disposal in Mozambique.” World Bank-UNICEF-Water and Sanitation Program. http://documents.worldbank.org/curated/en/892471467992479942 / pdf /96434-BRI-CHILD-FECES-Box391444B-PUBLIC-WSP-Mozambique-CFD-Profile.pdf.
Findings of the Mozambique Water Supply, Sanitation, and Hygiene Poverty Diagnostic 51
Chapter 4Service Quality, Availability, and AffordabilitySDG 6 calls on the global community to “ensure availability and sustainable management of water and sanitation for all.” In the transition from the MDGs to the SDGs, the water and sanitation sector has recognized that “access” was a relatively one-dimensional indicator. When seeking to achieve Goal 6—and, particularly, equity of access—policy makers should also consider other aspects of service, such as quality, availability (including quantity and continuity), and affordability. Other important factors to consider include accountability and the prospects for service sustainability. These factors are, in fact, interrelated. For instance, a more desirable service may be more sustainable, but it could also be more expensive, stretching boundaries of affordability. Policy makers need to seek the right balance among this basket of characteristics.
As part of its responsibility for public hygiene, the Ministry of Health establishes drinking-water quality regulations and the National Directorate of Health (DNS) sets parameters for water quality for residential and industrial purposes. The Water-Supply Asset Holding and Investment Fund (FIPAG) and The Water and Sanitation Infrastructure Administration (AIAS) play a role in the development and management of Mozambique’s water and sanitation infrastructure, For the urban water systems, the Water Regulatory Council (CRA), the industry regulator, monitors indicators under its jurisdiction, including efficiency ratios and customer service indicators. As a result, information on urban water sector performance is more readily available than for rural areas where several fragmented, small-scale surveys have attempted to provide assessment of quality, availability, and cost. Data on the performance of sanitation systems are widely lacking, because of the limited number of urban systems currently in place.
Drinking-Water Quality RegulationsUrban Water Quality
The Regulator evaluates different parameters for drinking-water quality for each system, while adhering to minimum national standards. While compliance of samples from FIPAG systems has been in decline, as shown in figure 4.1, indicating potential health implications for consumers, the percentage of tested parameters has been growing since 2011, to more than 80 percent in 2014. Overall, the Fund’s systems met water-quality parameters about 85 percent of the time, with a few poor performing provinces, such as Cuamba, at 12 percent compliance.
Customer feedback for urban public water providers. An independent study conducted in 2014 assessed qualitative customer satisfaction with the services provided under the Fund’s (FIPAG) management, and included questions about water taste and smell. The study selected two locations where the large number of new connections added each year posed challenges to service provision and quality, Maputo and Beira (table 4.1). A total of 2,100 customers were interviewed (1,650 in Maputo City and the rest in Beira) and the sample was distributed to represent the main service areas. The survey respondents were divided according to the type of water connection they had.
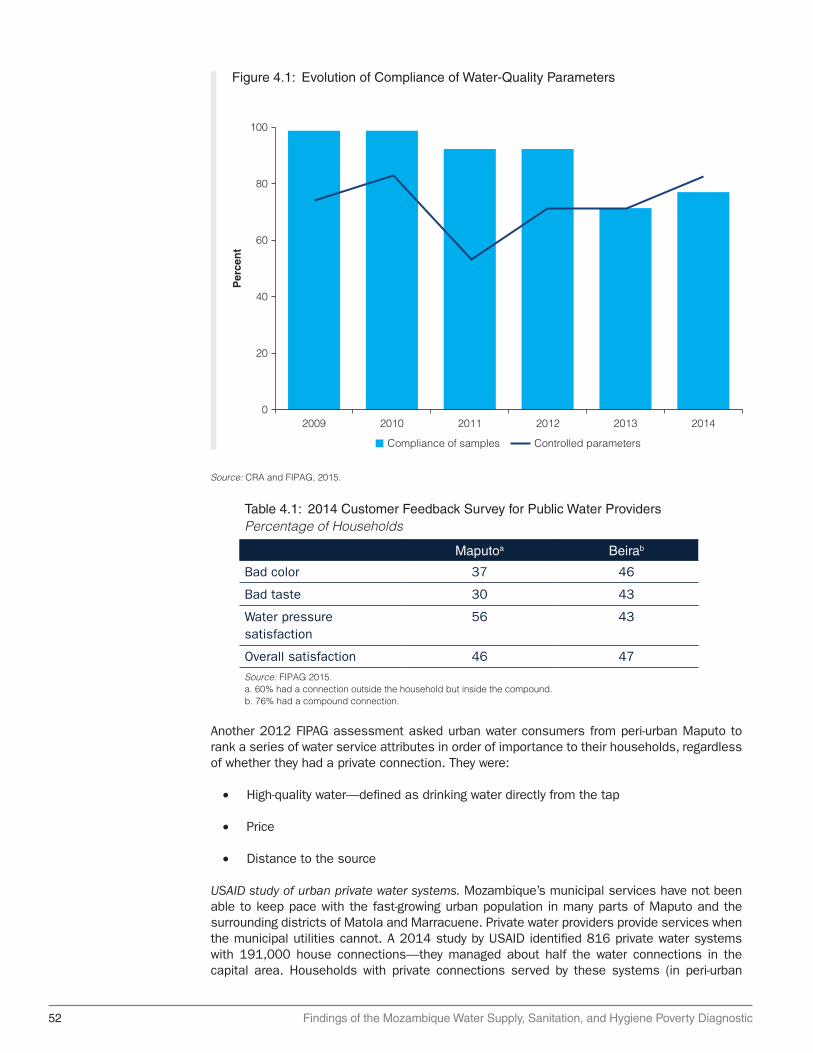
52 Findings of the Mozambique Water Supply, Sanitation, and Hygiene Poverty Diagnostic
Table 4.1: 2014 Customer Feedback Survey for Public Water ProvidersPercentage of Households
Maputoa Beirab
Bad color 37 46
Bad taste 30 43
Water pressure satisfaction
56 43
Overall satisfaction 46 47
Source: FIPAG 2015.a. 60% had a connection outside the household but inside the compound.b. 76% had a compound connection.
Figure 4.1: Evolution of Compliance of Water-Quality Parameters
Source: CRA and FIPAG, 2015.
100
80
60
40
20
2009
Per
cen
t
2010 2011 2012 2013 20140
Compliance of samples Controlled parameters
Another 2012 FIPAG assessment asked urban water consumers from peri-urban Maputo to rank a series of water service attributes in order of importance to their households, regardless of whether they had a private connection. They were:
• High-quality water—defined as drinking water directly from the tap
• Price
• Distance to the source
USAID study of urban private water systems. Mozambique’s municipal services have not been able to keep pace with the fast-growing urban population in many parts of Maputo and the surrounding districts of Matola and Marracuene. Private water providers provide services when the municipal utilities cannot. A 2014 study by USAID identified 816 private water systems with 191,000 house connections—they managed about half the water connections in the capital area. Households with private connections served by these systems (in peri-urban

Findings of the Mozambique Water Supply, Sanitation, and Hygiene Poverty Diagnostic 53
areas of Maputo Zuin, Nicholson, and Davis 2012) reported significantly higher hours of water service than those served by the public utility (19.8 hours versus 10.5 hours per day). Households served by private systems also had a higher opinion of the water quality, with 92 percent perceiving the water as safe to drink, versus 75 percent for those served by public utilities. The National Water Directorate of Mozambique is only just now starting to regulate these private systems.
Rural water quality. The One Million Initiative: In rural areas, water-quality indicators are not collected systematically and the quality of most of the rural water depends on the quality of the ground and surface water. Most of the population is concentrated in the coastal lowlands, including the capital city of Maputo in the extreme southeast. The quality of water for consumption is directly influenced by the water used for agriculture, given its economic and social importance.
The One Million Initiative1 was implemented in 18 districts in Manica, Sofala, and Tete Provinces from 2006 to 2013. The impact evaluation conducted water-quality testing in 2010 and provides interesting findings for rural areas, albeit of water-quality results achieved through the work of an implementer. The evaluation found that the probability of securing clean water at the point of use increased by 47 percent when Mozambique households switched to a microbiologically uncontaminated water source.
Water-quality contamination resulting from the proximity of animals, unsafe sanitation, and rubbish. Unfortunately, 19 percent of the samples collected directly from improved sources were found to be contaminated by coliform bacteria. A sanitary inspection revealed that many boreholes were contaminated because of the proximity of animals, latrines, or rubbish, highlighting the need for community training. A finding showed that around 33 percent of the water samples taken at the points of use (households) in villages where new water sources had been introduced by the One Million Initiative were still microbiologically contaminated. This finding confirmed that, regardless of any improvement in the source, water quality is significantly reduced at the point of use, reinforcing the need for hygiene interventions to ensure full health benefits (figure 4.2).
High-quality water contaminated by inadequate household hygiene. The Millennium Challenge Corporation (MCC), a five-year compact with Mozambique, included the construction or
Figure 4.2: Reduction in the Incidence of Diarrhea through WASH Interventions
Source: Fewtrell et al. 2005.
(a) Sanitation
Previous reviews Fewtrell et al. 2005
(b) Wateravailability
(c) Waterquality
(d) Hygienepromotion
(e) Handwashing
Red
uct
ion
in d
iarh
ea m
orb
idit
y (%
)
0
10
20
30
40
50
60
70
54 Findings of the Mozambique Water Supply, Sanitation, and Hygiene Poverty Diagnostic
reconstruction of 600 improved-water points in rural communities. It also organized the mobilization of water committees to maintain water-point infrastructure and to provide community-based training on how to improve sanitation and hygiene practices. The installation of hand pumps was associated with a 2 percent reduction in the number of children with reported gastrointestinal illness. However, these decreases were not statistically significant. The evaluators conducted water-quality testing and found that while the hand pumps were providing a high level of water quality at the point of collection, almost half of the samples of stored drinking water were contaminated at the household level. The implication is that inadequate hygiene and water-management practices negated the households’ potential health gains from the hand pumps, resulting in limited impacts on the observed illnesses (MCC 2014).
Availability
Mozambique has one of the lowest levels of per capita water consumption in the world. Under normal circumstances, 20 liters per capita per day is considered the amount needed to take care of consumption, basic hygiene needs, and basic food hygiene (Howard and Bartram 2003). Laundry and bathing might require higher amounts unless carried out at source. A minimum of 7.5 liters per capita per day is considered necessary. Mozambique has one of the lowest levels of per capita water consumption in the world and is far below global benchmarks (UNDP 2006).
In the urban context, the ability of customers to access quantities of improved water is limited by the ability of providers to deliver service for enough hours a day, and in locations and under conditions where consumers can take advantage of the service. The Water Services Regulator reports that in 2014, the water-supply systems of the Water-Supply Fund sold2 more than 86 million m3 of water. That is equivalent to a daily average consumption of about 65 liters per inhabitant per day. Inhambane had the highest per capita consumption, estimated at about 89 liters per inhabitant per day, while the Angoche system had the lowest per capita consumption value among the Fund’s systems, with an average of 25 liters per inhabitant per day.
Low consumption levels for rural consumers. The One Million Initiative evaluation confirmed the low consumption levels of rural consumers. When the program started in 2008, the mean domestic use totaled 12.6 liters per day. In 2010, mean domestic water use had dropped to 10.2 liters per capita per day. Only 14 percent of households in the sample consumed more than 20 liters per capita per day. The evaluators were not able to determine the cause of this drop, but speculated that while consumers had reduced the amount they carried home, they were using an additional amount at the water source. The evaluators found that the vast majority of households use the same water source for all domestic purposes. On the positive side, the fall in water consumption was significantly less for households that perceived an improvement in the quality of their drinking water. Daily consumption increased by 0.7 liters per person where there was an increase of one step on a five-point scale of perceived quality. This again reinforces the importance of paying additional attention to water quality when seeking full health benefits.
Only 8 percent of rural households have access to improved water within the 30-minute international standard. The MCC evaluation looked at a different aspect of availability—the distance to the water point—and found that consumption of water from an improved source was found to drop 1 liter per capita per day for every 100-meter increase in the distance from a household to its nearest hand pump. The distance at which the probability of using a hand pump drops below 0.5 is 1.2 kilometers. According to UNICEF (2011), an increase of 1 kilometer in the distance to the improved source reduces the probability of a household using it by 18.3 percentage points.
The distance to a water point represents a time commitment. Data from the DHS (2011) shows that in Mozambique, only 12 percent of rural households in the first wealth quintile

Findings of the Mozambique Water Supply, Sanitation, and Hygiene Poverty Diagnostic 55
have access to improved water within the international standard of 30 minutes’ walking to the water point (WHO 2003; OHCHR 2010). Conversely, almost 30 percent of rural households in the first quintile access unimproved sources of water located farther than 30 minutes’ walk (figure 4.3).
Rural households in Niassa have the best access to water from improved sources, with nearly 90 percent spending less than 30 minutes per day on this activity. Maputo Province follows, with nearly 85 percent of households being able to fetch water in an hour or less. Cabo Delgado residents have the worst access, with about one-third of the rural households spending more than one hour each day per trip collecting water. In certain parts of Gaza Province, households are spending two hours or more to collect water. In general, residents who live in peri-urban areas enjoy better access to improved drinking water.
In urban areas, almost 1 in 5 households in the bottom 20 percent of wealth accessed improved water sources by walking for 30 minutes or less to the point of collection (2011). Just as in rural areas, a third of urban households (32 percent) in the lowest quintile accessed water through unimproved sources located more than 30 minutes’ walk away. A large disparity divides the richest quintile and the other wealth quintiles in terms of distance to access improved drinking water. About two-thirds of households in the richest wealth quintile accessed water on their premises, whereas only 10 percent of urban households in the fourth quintile had access to water through other premises that required time to reach (figure 4.3).
The average cost of the lack of access to piped water is about US$300 per household per year. According to survey data,3 a person collecting water in 20-liter containers spends, on average, about 25–30 minutes per trip, and each household requires four trips per day. Washing clothes and baths require an additional 30 minutes. Based on the economic cost of time, with women and children generally in charge of this chore, the average cost of the lack of access to piped water is about US$300 per household per year. The fixed cost of an added water household connection for the water utility (Water-Supply Fund) is about US$240.
Women are “time poor” relative to men. Given the unequal division of labor within the household caused by the extra time women devote to fetching water, along with their lack of substitutes
Figure 4.3: Time to Reach Water Supply or Sanitation Facilities (Rural Areas), Mozambique
Source: World Bank estimations based on DHS 2011.Note: DHS = demographic and health survey; Q = quintile.
0
20
40
60
80
100
Q1 Q2 Q3 Q4 Q5 Rural National
1. Piped into premises 2. Improved (30 min or less)
5. Unimproved (more than 30 min)3. Improved (more than 30 min) 4. Unimproved (more or less)
Per
cen
t
16 19 20 24
6 111
12 10 1112
41
24
30
45 43 43 37 15
12
10
28 29 26 27
24
38
30
1525 19

56 Findings of the Mozambique Water Supply, Sanitation, and Hygiene Poverty Diagnostic
for unpaid labor, a recent study (Arora 2014) found that more women were “time poor” relative to men. While only 8 percent of men suffered from a lack of downtime, almost 50 percent of the women in the sample were time poor. These issues also emerged in certain peri-urban areas, where the time poverty of rural women was accentuated by the strenuous work of collecting water and firewood because of the lack of basic infrastructure and access to modern, time-saving household implements (Arora 2014).
Mozambique has not updated its standard for the distance to a water source—an aspect that it must address under the SDGs. Its standard for the number of users of a water point (allowable crowding) is high at 500, and is not differentiated by service type or technology. The issue with crowding is that, if a water point is only operational for a certain number of hours each day, users may be limited to collecting less water, and some users may be unable to access the water point at all. A high number of users results in queuing and long wait times at the water point, discouraging the use of improved-water points where they are accessible (UNICEF 2011).
The number of hours of water supply per day (continuity) reported by the Fund’s systems has been in decline, hitting a new low in 2014. In that year, the average number of hours of water supply in residential connections, based on a weighted average of the performance indicators of the Fund’s water supply systems, was about 19.4 hours. That was still above the minimum required 16 hours per day. The best performers, with a 24-hour service, were Xai-Xai, Chokwe, Inhambane, and Maxixe; the worst was Nacala, which only provided service 12 hours a day.
Affordability
Tariff revenues do not fully cover costs in urban areas. The Regulator (CRA) has been gradually increasing average tariff rates in urban areas (it has no role in rural areas), but tariff revenues have yet to cover the service providers’ operating costs. Here should be reference to table 4.2 Nationally, households spend an average of Mt 6,924 (US$147) per month on household expenses, which is equivalent to Mt 1,406 per person, according to the Household Budget Survey data for 2014/15.4 Urban families using 5 cubic meters of in-dwelling, piped water per month pay an average of US$0.86 per cubic meter, those using 10 cubic meters pay US$0.74 per cubic meter, and those using 15 cubic meters pay US$0.76 per cubic meter. Cost recovery is an issue at the national level, because revenues do not fully cover operational and maintenance costs in most urban areas. The average coverage ratio for the country is 0.85 (Farolfi and Gallego-Ayala 2014).
Cross-subsidization scheme aims to make the cost to customers affordable. While it does not yet fully cover costs through tariffs, mindful of social priorities, the CRA uses a cross-subsidization scheme designed to allow its systems to reach the greatest number of customers at affordable cost. The Water Tariff Policy lays out the basic tariff principles, but the Fund (FIPAG) has adjusted the tariff structure over time in response to changing consumption patterns. In a tariff adjustment in 2009, the Regulator reduced the target monthly consumption from 10 cubic meters to 5 cubic meters, in recognition that the low-income population represented more than 50 percent of consumers. Mozambique has set the maximum cost for a new connection to a regulated system at Mt 4,900 per connection for a Water and Sanitation Infrastructure Administration system and Mt 2,000 per connection for a Fund system. Customers may pay in installments over 18 months to make the cost more affordable. They must also pay a connection application fee, which can present a constraint to low-income households.
Output-based grant payments to regional utilities provided 30,000 subsidized connections in peri-urban areas. Mozambique has tested different measures to increase low-income households’ access to piped-water connections. One program issues output-based grant payments to the regional utilities to cover the cost of providing service to low-income households.

Findings of the Mozambique Water Supply, Sanitation, and Hygiene Poverty Diagnostic 57
Originally tested by the Global Partnership on Output-based Aid Project in Maputo, the scheme resulted in the establishment of about 30,000 subsidized connections to yard taps in peri-urban areas. The output-based grant payments successfully supported the operator to connect households through a subsidized tariff. However, for secondary cities Mozambique would then need an economic evaluation of how well the poorest households are targeted and the efficiency of subsidies in overcoming connection entry costs.
Scaling up the cross-subsidzation scheme. The scheme calls for utility companies to set up the connections, with verification by an independent party contracted by the Fund (FIPAG). The original scheme in Maputo used a one-phase verification process, but the new approach involves a two-step process for the Fund to make payments to the utilities. These steps are: (1) after the installation of functioning yard taps for eligible households, the Fund issues 70 percent of the total payment to the utility; and (2) after a demonstration of continued service for three months, the Fund pays the remaining 30 percent. The second step of verification is intended to ensure continuity of service delivery. Significantly, the program seeks to accelerate payments to the utility for the new connection, reducing the current installment period of 18 months.
The two-step connection process was found to deter some customers. A 2014 Completion Report Survey found that, of the households in the target areas of Maputo that had chosen not to connect, cost was not the main deterrent. Instead, the main obstacle to acquiring a connection was the relatively complex connection process involved, according to results of the survey, which was conducted by the Fund and the World Bank’s Global Partnership of Output-Based Aid. Fifty-four percent of the households indicated they did not understand the process to request a connection, or were discouraged by the process (see figure 4.4).
Table 4.2: Evolution of Household Tariffs
Region System
Average tariff (Mt/m3) Variation(%)
2009–142009 2014
Maputo 16.11 29.73 +84.5
Xai-Xai 14.06 21.57 +53.4
South Chókwèa 14.31 22.94 +60.3
Inhambane 14.68 23.90 +62.9
Maxixe 12.94 25.84 +99.7
Beira e Dondo 16.90 28.41 +68.1
Centre Manica 17.09ª 21.95 +28.5
Tete e Moatize 16.35a 21.67 +32.5
Quelimane 12.84 25.43 +98.1
Nampula 15.09 25.40 +68.3
Nacala 20.51a 22.55 +9.9
North Angoche 17.91a 19.30 +7.8
Pemba 15.33 26.26 +71.3
Lichinga 17.45a 22.77 +30.5
Cuamba 16.51a 20.94 +26.9
Source: CRA 2015.a. 2010 (first data available).
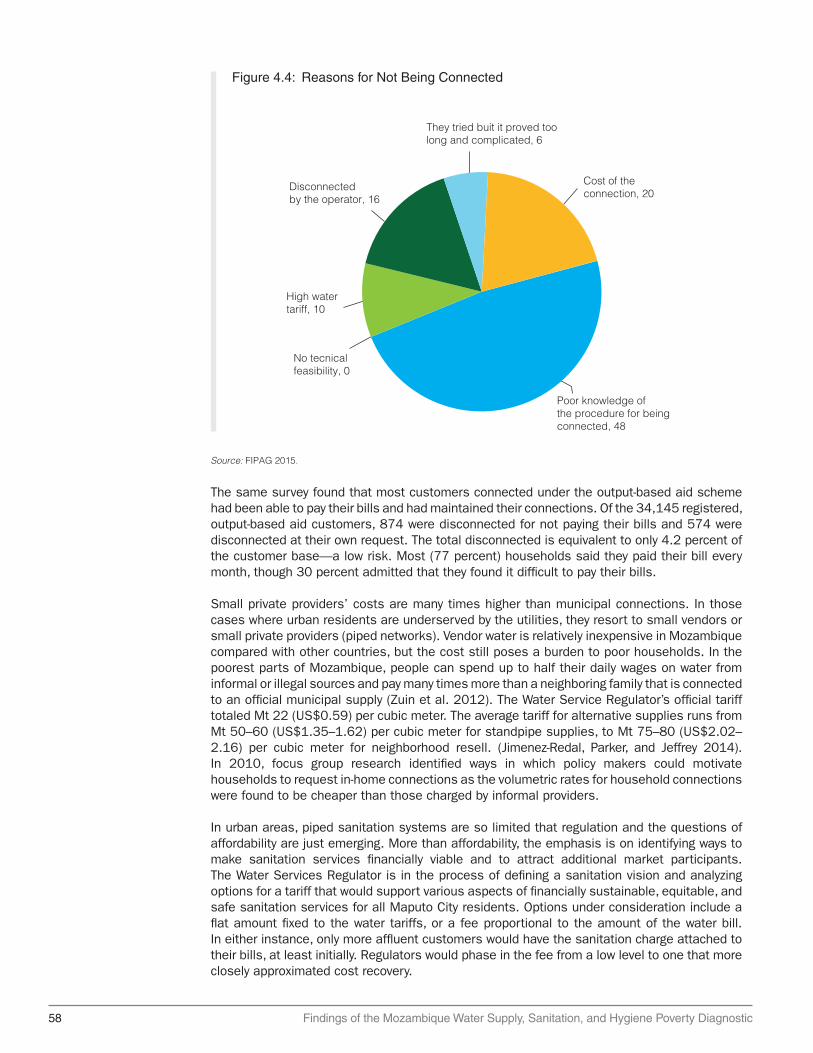
58 Findings of the Mozambique Water Supply, Sanitation, and Hygiene Poverty Diagnostic
The same survey found that most customers connected under the output-based aid scheme had been able to pay their bills and had maintained their connections. Of the 34,145 registered, output-based aid customers, 874 were disconnected for not paying their bills and 574 were disconnected at their own request. The total disconnected is equivalent to only 4.2 percent of the customer base—a low risk. Most (77 percent) households said they paid their bill every month, though 30 percent admitted that they found it difficult to pay their bills.
Small private providers’ costs are many times higher than municipal connections. In those cases where urban residents are underserved by the utilities, they resort to small vendors or small private providers (piped networks). Vendor water is relatively inexpensive in Mozambique compared with other countries, but the cost still poses a burden to poor households. In the poorest parts of Mozambique, people can spend up to half their daily wages on water from informal or illegal sources and pay many times more than a neighboring family that is connected to an official municipal supply (Zuin et al. 2012). The Water Service Regulator’s official tariff totaled Mt 22 (US$0.59) per cubic meter. The average tariff for alternative supplies runs from Mt 50–60 (US$1.35–1.62) per cubic meter for standpipe supplies, to Mt 75–80 (US$2.02–2.16) per cubic meter for neighborhood resell. (Jimenez-Redal, Parker, and Jeffrey 2014). In 2010, focus group research identified ways in which policy makers could motivate households to request in-home connections as the volumetric rates for household connections were found to be cheaper than those charged by informal providers.
In urban areas, piped sanitation systems are so limited that regulation and the questions of affordability are just emerging. More than affordability, the emphasis is on identifying ways to make sanitation services financially viable and to attract additional market participants. The Water Services Regulator is in the process of defining a sanitation vision and analyzing options for a tariff that would support various aspects of financially sustainable, equitable, and safe sanitation services for all Maputo City residents. Options under consideration include a flat amount fixed to the water tariffs, or a fee proportional to the amount of the water bill. In either instance, only more affluent customers would have the sanitation charge attached to their bills, at least initially. Regulators would phase in the fee from a low level to one that more closely approximated cost recovery.
Figure 4.4: Reasons for Not Being Connected
Source: FIPAG 2015.
Poor knowledge of the procedure for being connected, 48
High watertariff, 10
No tecnicalfeasibility, 0
Disconnectedby the operator, 16
They tried buit it proved too long and complicated, 6
Cost of theconnection, 20
Findings of the Mozambique Water Supply, Sanitation, and Hygiene Poverty Diagnostic 59
Under the proposals being developed for the Regulator with the support of the non-government group Water & Sanitation for the Urban Poor, the sanitation tariff would fund the highest-impact investments in terms of health and other development factors. Priorities would include construction of communal sanitation facilities in low-income areas and rehabilitation of sanitation facilities in schools, community centers and clinics. Other potential investments include operation of sewer networks; construction of transfer stations; establishment of emptying services for transfer stations; operation of a call center for tanker trunks; operation of treatment facilities; and promotion campaigns. The proposal does not include support for the emptying of on-site sanitation, under the assumption that the private sector can provide those services, and that other parts of the service chain require more attention to support the financial viability of the entire chain.
Voucher subsidies, a viable alternative. While the sanitation fee would help pay for the provision of these services, the program would extend additional support to low-income customers so that they could afford to pay for the services. The nonprofit group has proposed two potential ways to subsidize this group: a voucher subsidy to customers that would partially cover the cost of fecal sludge removal; or a subsidy directly given to providers in a portion of the service chain. Either of these approaches would improve affordability for customers.
Key Messages
• Quality of service is a key issue particularly in rural areas. Small, piped village systems and boreholes with hand pumps are the main mechanisms serving rural areas. However, 35 percent of these do not work at any one time, according to World Bank estimates. Access to piped water—the safest option for human consumption—remains very low for the B40 compared with the T60. Coverage of piped water on premises for the T60 increased from 11 percent of households in 1996 to 48 percent in 2015. However, the coverage rate for households in the bottom group remains at only 10 percent.
• Ensuring availability and reliability of service are another challenge. Water-quality monitoring remains weak in rural areas. A 2008 midterm impact assessment of Mozambique’s water sector found that quality often deteriorates between the source and point of use. The probability that water would be clean at the point of use rose by 47 percent when Mozambican households switched to microbiologically uncontaminated water sources. However, 19 percent of the samples taken directly from improved sources were still contaminated by coliform bacteria. A sanitary inspection revealed that many boreholes were contaminated because of their proximity to animals, latrines, or rubbish.
• Mozambique faces several monitoring and data availability challenges. The WHO/UNICEF Joint Monitoring Programme for Water Supply and Sanitation and the National Statistics Institute (INE) have different figures for water and sanitation access rates than Mozambique’s National Directorate of Water. The Joint Monitoring Programme and INE’s estimates are generally consistent, while the Directorate’s data are less aligned and neither consistently higher nor lower. Inconsistencies also complicate the application of key sector definitions, such as those for “rural” and “urban.”
Notes
1. Netherlands–supported government of Mozambique/UNICEF Water Supply, Sanitation and Hygiene Programme.
2. Note that the Water Services Regulator cites volume sold, so this does not include technical leakage.
3. Based on field data from FIPAG and Demographic and Health Survey (2011) in Mozambique. Also see WHO and UNICEF (2006).

60 Findings of the Mozambique Water Supply, Sanitation, and Hygiene Poverty Diagnostic
4. IAF (Inquérito aos Agregados Familiares [households survey]). 2002/03. Mozambique Household Budget Survey 2002–03. National Institute of Statistics (INE) (Mozambique).
References
Arora. D. 2014. “Gender Differences in Time Poverty in Rural Mozambique.” Working Paper No. 2014-05. University of Utah, Salt Lake City. http://economics . utah.edu/research / publications/2014_05.pdf.
CRA (Conselho de Regulacao de Agua). 2015. “Retrospective Report of the Water and Sanitation Sector 2009-2014.” CRA-ESAWAS, Maputo. http://www.cra.org.mz/pdf / RETROSPECTIVE %20REPORT%202009-2014%20-%20Eng%20version.pdf.
Farolfi, S., and J. Gallego-Ayala. 2014. “Domestic Water Access and Pricing in Urban Areas of Mozambique: Between Equity and Cost Recovery for the Provision of a Vital Resource.” International Journal of Water Resources Development 30 (4): 728–44.
Fewtrell, L., R. B. Kaufmann, D. Kay., W. Enanoria, L. Haller, and J. M. Colford Jr. 2005. “Water, Sanitation, and Hygiene Interventions to Reduce Diarrhoea in Less Developed Countries: A Systematic Review and Meta-analysis. Lancet Infect Dis 5: 42–52.
Howard, G., and J. Bartram. 2003. “Domestic Water Quantity, Service Level, and Health.” World Health Organization, Geneva.
Jimenez-Redal, R., A. Parker, and P. Jeffrey. 2014. “Factors Influencing the Uptake of Household Water Connections in Peri-Urban Maputo, Mozambique.” Utilities Policy 28: 22–27.
MCC (Millennium Challenge Corporation). 2014. “Final Status Report: Mozambique Compact.” https://assets.mcc.gov / content/uploads/2017/05/qsr-2014002152703-mozambique .pdf.
OHCHR (Office of the United Nations High Commissioner for Human Rights). 2010. “The Right to Water.” Fact Sheet No. 35, Office of the United Nations High Commissioner for Human Rights, Geneva. http://www.ohchr.org/Documents/Publications /FactSheet35en.pdf.
———. 2011. “Impact Evaluation of Drinking Water Supply and Sanitation Interventions in Rural Mozambique.” One Million Initiative. UNICEF-Government of Netherlands.
UNDP (United Nations Development Programme). 2006. “Beyond Scarcity: Power, Poverty and the Global Water Crisis.” United Nations Development Programme, New York.
WHO (World Health Organization). 2013. “Cholera Country Profile: Mozambique. Global Task Force on Cholera Control.” WHO, Geneva.
WHO/UNICEF (United Nations Children’s Fund). 2006. Meeting the MDG Drinking Water and Sanitation Target: The Urban and Rural Challenge of the Decade. Geneva: WHO/UNICEF; New York: http://www.who.int / water_sanitation_health/monitoring/jmpfinal.pdf.
Zuin, V., M. Nicholson, and J. Davis. 2012. “Water Access, Service Quality, and Consumer Satisfaction in Peri-Urban Maputo: A Beneficiary Assessment.” Report for the Water Regulatory Council of the Government of Mozambique, in partnership with the World Bank, and the Woods Institute for the Environment at Stanford University, Stanford, CA.
Zuin, V., L. Ortolano, M. Alvarinho, K. Russell, A. Thebo, O. Muximpua, and J. Davis. 2011. “Water Supply Services for Africa’s Urban Poor: The Role of Resale.” Journal of Water and Health 9 (4): 773–84.
Findings of the Mozambique Water Supply, Sanitation, and Hygiene Poverty Diagnostic 61
Chapter 5Institutional Impact on Service DeliveryImprovements to sanitation and water can yield massive returns on investment. Economic returns on water and sanitation projects are highly favorable with average rates of return exceeding 20 percent annually on over 60 projects evaluated by development banks in Africa. The three projects supported by the Asian Development Bank in Mozambique estimated an economic return of 14 percent in provincial towns, 18 percent in urban support projects, and 16 percent in rural projects. The corollary is that the failure to invest has massive costs. An economic study conducted for Mozambique has shown that impacts resulting from poor sanitation and hygiene cost the economy US$124 million per year or the equivalent of 1.2 percent of annual GDP (Sanitation and Water for All 2014, and WSP 2015). Nevertheless, urban areas account for 60 percent of the economic losses. To maximize the returns on investments in the sector, the strategic objectives of the sector (DNAAS 2016) highlights the need to reduce the technical losses from production and distribution networks, and revert to penalties in places where there are an increasing number of illegal connections. These actions can be complemented with the adoption of better management practices that facilitate information exchange between regions and provinces, accelerate the learning of best practices, and identify the challenges faced in terms of financial efficiency at the local level.
Mozambican perceptions of the management of their water services are below the Sub-Saharan Africa regional average. Nearly half (47 percent) of Mozambicans believe the government does a poor or very poor job of providing WASH services; this perception is particularly pertinent in rural areas. Regarding safe water consumption (water quantity), a large proportion (40 percent) of the very poor access less than 5 liters daily from an improved source.
The institutional context for public service delivery of water and sanitation matters to explain the underlying reasons for service delivery performance. This chapter addresses institutional factors to understand the gap between the existing situation and the potential of returns on investment, with a special focus on the rural water subsector. Based on current evidence, even existing resources are not being used to address the needs of the majority of the people who lack basic water and sanitation. Across subsectors, there has been a lack of pro-poor targeting of resources and a lack of effective operation, management, and maintenance of investments, especially in rural water.
The chapter comprises three subsections. Section 5.1 provides the institutional landscape for both urban and rural water and sanitation services, governed by policy as well as differences between the urban-rural arrangements of public administration. Section 5.2 provides an overview of the nature of funding for the main different subsectors of WASH in Mozambique. Section 5.3 focuses mainly on the binding constraints in the rural water sector. The poor are largely in the rural areas in large numbers and in relative terms. Rural areas significantly lack improved water. Rural areas have not benefited proportionally from the resource streams that the urban areas have enjoyed over the last several years.
Mozambique faces several monitoring practices and data availability challenges. The WHO/UNICEF Joint Monitoring Programme for Water Supply and Sanitation and the National Statistics Institute report different figures for water and sanitation access, and the sector information is
62 Findings of the Mozambique Water Supply, Sanitation, and Hygiene Poverty Diagnostic
not harmonized with Mozambique’s National Directorate of Water. It is necessary to have a harmonization strategy of WASH data to consolidate multiple sources of information, such as secondary sources, population census, national demographic databases, and JMP data (describing existing coverage and MDG targets). Mozambique can advance on this front by developing a nationwide WASH monitoring system that harmonizes and consolidate information by engaging local governments and regulators in integrating information to build accountability mechanisms for the entire water and sanitation sector.
Institutional Arrangements and Guiding Legislation for Service Delivery
The Ministry of Public Works and Housing (MoPH) is the lead agency for both water and sanitation. Under the Ministry, the National Directorate of Water (DNA) plays a central role in regulating the sector, with responsibility for policy making, planning, monitoring, and reporting related to rural water supply and sanitation. It also oversees aspects of water resource management and has limited responsibility for urban water and sanitation (box 5.1).
The MoPH and DNA function within the wider context of public administration in Mozambique. The institutional context is different in the rural areas covered by the 10 provinces (excluding Maputo City) and in urban areas covered by municipal authorities. Mozambique is a unitary state with two levels of territorial governance: the central government which comprises the Central and Local State Organs (OECLs) in rural and small town areas and the elected local government municipalities in selected urban areas.
The OECLs are deconcentrated entities of central government and cover four territorial levels as set out in the 2003 Law on Local State Organs (LoLE). From largest to smallest, these are provinces, districts, administrative posts, and localities (figure 5.1). OECLs are considered
Box 5.1: Planning Policies and Targets of the WASH Sector to 2025
The National Strategy 2025 targets for the proportion of the population with access to improved water services are:
• Urban water: 80 percent
• Rural water: 69 percent (13.5 million people)
Improvements in sanitation have also been made a top priority in the national agenda, despite the subsector remaining insufficiently funded. The first National Sanitation Conference, held in May 2014 under the leadership of the Mozambique government, agreed to try to ensure universal access to water and sanitation by 2030, including for schools and health care facilities.
National strategy 2025 sector targets for the proportion of the population with access to improved sanitation services are:
• Urban sanitation: 80 percent
• Rural sanitation: 48 percent (7 million people)
• Eliminate open defecation

Findings of the Mozambique Water Supply, Sanitation, and Hygiene Poverty Diagnostic 63
Figure 5.1: Mozambique Public Sector Structure
Source: Adapted from Boex and Simatupang 2015.
Elected Partially elected Administrative
Districts (140)
Administrative posts
Localities
Municipalities (53)
Central
Provinces (11)
“local extensions” of the central government. In urban areas, Law 2/97 (Lei Base das Autarquias Locais) sets the framework for the devolution of urban services to elected local government municipalities.
At the central government level, rural and small towns decentralization is coordinated through two main ministries. These are the Ministry of Economy and Finance, which coordinates the planning and budgeting process, including strategic planning, and the Ministry of State Administration and Public Service, which coordinates the organization of the state at all levels, including the drive toward political and administrative decentralization.
In rural areas, as part of the OECL structure, the district is designated as the principal territorial unit for the functioning of the local administration and is responsible for the provision of public services at local levels (that is, basic education, health, and water supply, among others). Provincial administrations are mandated with various functions related to the coordination, support, and monitoring of district activities and as such retain some functional responsibility for the delivery of local services. Under LoLE, subdistrict entities (administrative posts and localities) are not designated with any significant decision-making authority or responsibilities. They are, however, in place to provide closer links to communities themselves and to formal

64 Findings of the Mozambique Water Supply, Sanitation, and Hygiene Poverty Diagnostic
civil society groups known as Consultative Councils (CCs). CCs were established in 2009 to provide a more official link between the district administration and the rural population. These Councils are large with between 30 and 50 members, many of whom are appointed directly by the administrative authority in each level (locality, administrative post, and district).
In this territorially deconcentrated structure, provinces and districts operate as subcomponents of the political, financial, and budgetary structures and processes of the centralized state. As such they only retain partial fiscal resources or administrative discretion, even though the district retains functional responsibility for local level delivery of services (Boex and Simatupang 2015).
The water and sanitation sector is highly dependent on donor financing. The National Water Directorate chairs the Water and Sanitation Group (GAS), which was established in 2000 to coordinate donor support and work toward achieving the government’s water and sanitation targets. (WASHCost 2010). The Group meets regularly to share information and facilitate coordination with participants, including government departments, donors, United Nations agencies, nongovernmental organizations, and the private sector (box 5.2). Major donors include the bilateral agencies, World Bank, and UNICEF. The share of external financing is larger than that of internal financing, and the latter has not changed over the last five years. The external financing budget for 2015 for the Water-Supply Asset Holding and Investment Fund and the Water and Sanitation Infrastructure Administration rose marginally, compared with the budgets of previous years.
Box 5.2: Fiscal Decentralization Related to Rural Service Delivery
With respect to fiscal decentralization, provinces and districts have limited entitlements to an independent fiscal base and are reliant on annual transfers from the central government. Internally generated income constitutes just 2.5 percent of provincial revenue and 0.4 percent of district revenue (World Bank 2014a), and the vast majority of tax revenue is channeled to central levels. Local deconcentrated entities are, therefore, almost entirely reliant on the intergovernmental transfer of funds. For these entities, most of the finance comes through a nonsector-specific block grant from central government for financing provincial- and district-level expenditures. In principle, this transfer is allocated based on population size and poverty rates, and is designed to cover the recurrent operational costs of the provinces and districts (that is, salaries and some goods and services, and so on), and occasional investments in infrastructure of other services at the discretion of the Provincial Governor. Sector-specific funding is channeled through line ministries and should be aligned with the national plan for the line department (comprising provincial and district departmental plans) and captured in the central states’ financial management system (SISTAFE).
Each district also receives two additional intergovernmental grants from the central government: the “district investment fund” (FID) and the “district development fund” (FDD). The FID is a block grant for all infrastructure projects, not only water supply, and the district administration has discretion over the disbursement of these funds. The FDD (formally termed the “seven billion fund”) is a capital grant ostensibly for “job creation” activities at the local level and takes the form of many small-scale loans to individuals administered by districts. From its inception, serious questions
box continues next page
Findings of the Mozambique Water Supply, Sanitation, and Hygiene Poverty Diagnostic 65
In the urban context, there can be significant autonomy of municipalities and the mayor is directly elected. FRELIMO has dominated the municipal elections; for instance, winning the Maputo mayoral seat in 41 of the 43 municipalities with direct elections. The number of municipalities has increased since the first municipal elections in 2003. Recent election results have been tainted by low levels of citizen participation, with 46 percent of nationally registered voters participating. International observers however have termed the elections calm, free, fair, and transparent.
Municipalities, although autonomous, have very limited budgets. Across Mozambican cities, the collection of tax revenues is low, with small, federally transferred municipal budgets. Maputo’s budget in recent years has been around US$6.4 million, which translates to about US$5 per inhabitant. Municipal governments have exercised a very limited role in both water supply and sanitation despite their legal responsibilities. Given the current revenue-raising limitations, most municipalities remain dependent for funding upon central government programs and donor funding. In Manica, the municipal budget is Mt 18 million, of which Mt 12 million is provided by the central government. Given these limited budgets, although municipalities are more autonomous in decision making, they suffer from limited staff and human resource capacity much like the rural areas.
Urban Water in Fast-Growing Cities
Mozambique has made great, if uneven, progress in water-supply sector reform over the past two decades. Decree No. 72/98 of 1998 established the Delegated Management Framework (DMF) for water supply in the main cities. This policy sought to separate operations from asset management, to allow for private sector participation in service delivery; and to establish an independent regulator. Eighteen urban water supply systems operate under the umbrella of the Framework, in addition to three systems for small towns, although some of the systems are clustered for functioning purposes.
For the urban sector, the DMF change created two new institutions under the umbrella of the DMF—FIPAG, a public organization, and the Water Regulatory Council (Conselho de Regulacao do Abastecimento de Água) or CRA. FIPAG is responsible for promoting and ensuring the efficient and sustainable management of urban water supplies. It is currently responsible for 21 principal water-supply systems with a US$350 million (2009) portfolio covering major cities and towns including the capital, Maputo.
have been raised about the governance of this fund which, in many cases, appears to have been monopolized by local party elites (Forquilha 2009). For rural water services, districts can attempt to secure additional funds through their own budgeting process, as both district and provinces have been established as budgeting entities through the Program of Decentralized Planning and Finance.
In this structure, there is very little political autonomy or accountability within local state administrations. Members of the district secretariat are not elected, but appointed centrally. Provincial administrations have recently established elected assemblies, but these do not have decision-making authority and have limited authority over the functioning or financing of provincial or district administrations. Similarly, as district CCs have many members appointed by the district administrations their ability to provide effective oversight on behalf of the public is limited.
Box 5.2: Continued

66 Findings of the Mozambique Water Supply, Sanitation, and Hygiene Poverty Diagnostic
The CRA, the industry regulator, regulates the water services in those delegated urban water supply systems, including the establishment of water tariffs and their structures. The Water and Sanitation Infrastructure Administration (Administração de Infra-estruturas de Água e Saneamento [AIAS]) serves as the asset manager for urban sanitation and secondary-town water supplies. It is responsible for 131 secondary, urban water supply systems and 152 urban wastewater systems. At the provincial level, the 10 provincial Departments for Water and Sanitation (DAS) manage rural provision with oversight from the National Water Directorate (see table 5.1).
Urban Water in Small Towns
Small towns and rural growth centers have a vital role to play both in promoting economic development and in bringing public services to the population. This is particularly the case given the government of Mozambique’s continuing emphasis on decentralization and the development of rural growth poles. Functioning water-supply services are essential for the development of any settlement, especially those which support businesses and public services. As of 2015, small towns represent 15 percent of the total Mozambican population, about 3.8 million people, and this share is projected to increase to 18 percent (about 6.5 million people) by 2030.
To address this service deficit, the DMF, previously in place for only the largest water-supply systems, was recently extended to small town water-supply systems (see box 5.3). This follows on from other institutional reforms in the water sector, as presented schematically in figure 5.2. Prior to this change, there had not been a strategic approach for small towns and most systems were operated by local governments, which lacked technical expertise. Revenues, if collected at all, were not ring-fenced, and this has led to a severe degradation of the infrastructure, poor maintenance, low coverage (less than 10 percent), and failure to cover operational costs.
Rural Water
The overall government strategy for rural water supply is set out in the 2007 Rural Water Supply and Sanitation Strategic Plan (PESA-ASR) which was revised to comply with MDGs. The current plan dates from 2006 and is set to be replaced by a new plan being developed by the National Directorate of Water Supply and Sanitation (DNAAS). The 2006 plan has three
Table 5.1: Distribution of Responsibilities for Central Government Water Agencies
Institution Areas covered Number of systems2015 population
(millions)
FIPAG Major urban centers
21 systems:18 major cities + 3 small towns
5.5 to 6.5
AIAS Secondary systems
131 systems covering: 5 cities + 64 urban towns + 61 rural towns
3.8
DAS/DNA Rural growth centers
> 135 systems in > 400 settlements; number increasing with new rural settlements justifying piped-water systems
4.5a
Source: FIPAG 2015.Note: FIPAG = Water-Supply Asset Holding and Investment Fund; AIAS = Water and Sanitation Infrastructure Administration; DAS/DNA = Departments for Water and Sanitation/National Directorate of Water.a. The key performance indicators and country population projections for 2015 were used to update the estimates of the population served by FIPAG. This figure may differ from other figures since it has updated estimates of coverage and population growth in 18 major cities served by FIPAG.

Findings of the Mozambique Water Supply, Sanitation, and Hygiene Poverty Diagnostic 67
Box 5.3: Delegated Management Framework in Small Towns
Following the production of revised contracting documents in 2012, solid progress has been made, with a total of 39 systems now contracted to private operators (19 rural and 20 urban; see figure B5.3.1). Although this is still small scale, serving tens of thousands of customers, the growing number of systems contracted shows how momentum is building, especially among the AIAS systems. Eight were contracted during 2015 alone, and a further five are in an advanced stage of procurement. Initially it proved difficult to attract water supply operators. However, as the delegation of systems accelerates, more operators are gradually becoming interested in the water business (World Bank 2016a).
It is still too early to predict how this subsector will grow. A much longer period is needed to evaluate fully the impact of the new, more widely delegated management regime, especially as the operational reporting system is only now becoming established. However, some tentative conclusions can be drawn from the results achieved by the seven operators evaluated. They are supplying water to consumers consistently seven days a week, on average 12 hours a day. Per capita water consumption is above 50 liters a day. The number of individual connections in each scheme is increasing, although slowly. The operators are close to covering operational costs (96 percent).
Key lessons:
• The domestic private sector is emerging.
• The active involvement of local government is critical.
• Starting small and gradually growing in volume seems to be effective.
• Decentralization is fundamental.
Figure B5.3.1: Number of Systems Delegated and People Served Per System
Source: World Bank estimations based on FIPAG 2015, CRA 2015.Note: Right hand axis number of people served per system.
0
5
10
15
20
25
2012 2013 2014 20150
20
40
60
80
100
120
140
160
Nu
mb
er o
f p
eop
le s
erve
d
(th
ou
san
ds)
Nu
mb
er o
f sy
stem
s d
eleg
ated
# of delegated urban systemsurban population served
# of delegated rural systemsrural population served
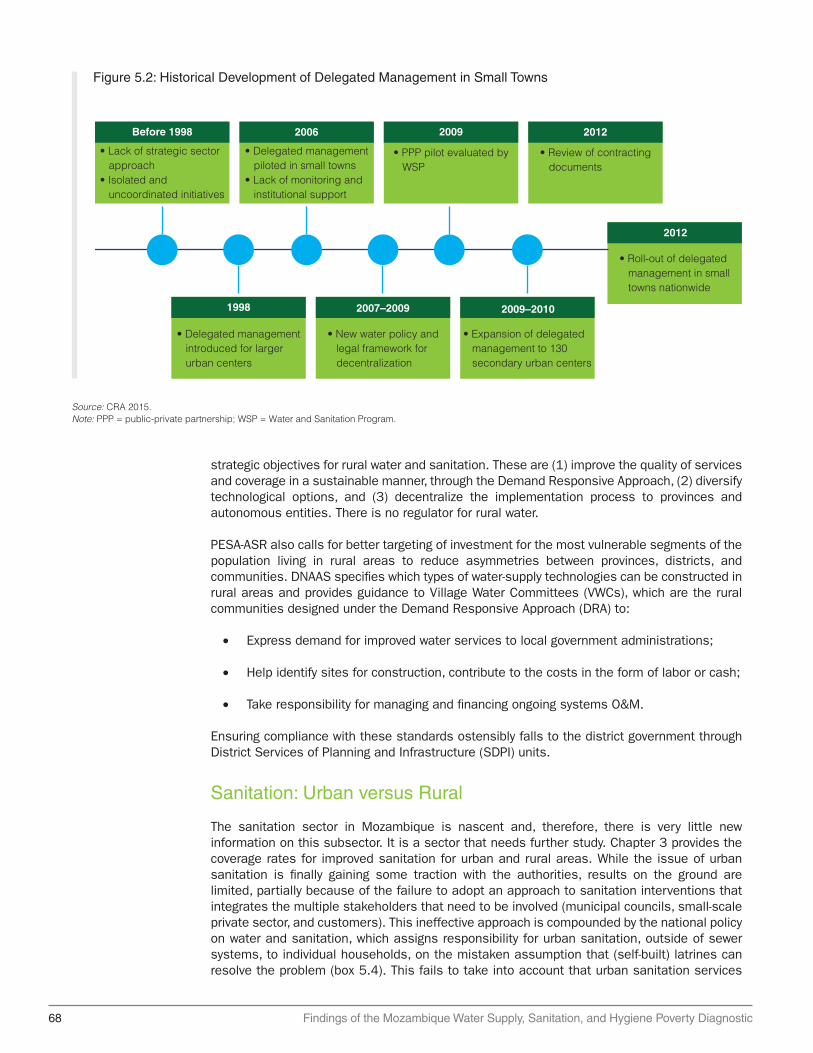
68 Findings of the Mozambique Water Supply, Sanitation, and Hygiene Poverty Diagnostic
strategic objectives for rural water and sanitation. These are (1) improve the quality of services and coverage in a sustainable manner, through the Demand Responsive Approach, (2) diversify technological options, and (3) decentralize the implementation process to provinces and autonomous entities. There is no regulator for rural water.
PESA-ASR also calls for better targeting of investment for the most vulnerable segments of the population living in rural areas to reduce asymmetries between provinces, districts, and communities. DNAAS specifies which types of water-supply technologies can be constructed in rural areas and provides guidance to Village Water Committees (VWCs), which are the rural communities designed under the Demand Responsive Approach (DRA) to:
• Express demand for improved water services to local government administrations;
• Help identify sites for construction, contribute to the costs in the form of labor or cash;
• Take responsibility for managing and financing ongoing systems O&M.
Ensuring compliance with these standards ostensibly falls to the district government through District Services of Planning and Infrastructure (SDPI) units.
Sanitation: Urban versus Rural
The sanitation sector in Mozambique is nascent and, therefore, there is very little new information on this subsector. It is a sector that needs further study. Chapter 3 provides the coverage rates for improved sanitation for urban and rural areas. While the issue of urban sanitation is finally gaining some traction with the authorities, results on the ground are limited, partially because of the failure to adopt an approach to sanitation interventions that integrates the multiple stakeholders that need to be involved (municipal councils, small-scale private sector, and customers). This ineffective approach is compounded by the national policy on water and sanitation, which assigns responsibility for urban sanitation, outside of sewer systems, to individual households, on the mistaken assumption that (self-built) latrines can resolve the problem (box 5.4). This fails to take into account that urban sanitation services
Figure 5.2: Historical Development of Delegated Management in Small Towns
Source: CRA 2015.Note: PPP = public-private partnership; WSP = Water and Sanitation Program.
2012
• Roll-out of delegated management in small towns nationwide
• Lack of strategic sector approach• Isolated and uncoordinated initiatives
• Delegated management piloted in small towns• Lack of monitoring and institutional support
2009
• PPP pilot evaluated by WSP
2012
• Review of contracting documents
2009–2010
• Expansion of delegated management to 130 secondary urban centers
2007–2009
• New water policy and legal framework for decentralization
1998
• Delegated management introduced for larger urban centers
Before 1998 2006

Findings of the Mozambique Water Supply, Sanitation, and Hygiene Poverty Diagnostic 69
Box 5.4: Why Invest in Sanitation and Drainage in Mozambique?
The case for drainage: rural sanitation
An estimated 35 percent of the population is now thought to be chronically food insecure. The economic impacts of drought seem to be most significant in Zambezi Province, where production losses could range between US$12 million and US$170 million for maize alone. Floods in Mozambique occur most frequently in the southern and central regions, along river basins in low-lying regions, and in areas with poor drainage systems. They are linked not only to heavy rainfall, but also to water drainage from rivers in upstream neighboring countries. Water from nine major river systems from vast areas of southeastern Africa finds its way to the Indian Ocean across Mozambique. The flood in 2000 killed about 800 people and displaced 540,000. Most recently, in January of 2012, tropical storm Funso, while never making landfall, directly affected 65,000 people whose homes were inundated and suffered severe damage.
The sanitation status in Maputo becomes progressively worse along the service chain
While urban areas are better served, the country is grappling with similar issues to those affecting other parts of Sub-Saharan Africa—service provision has not kept pace with rapid urbanization. Although almost 90 percent of Maputo residents have access to a hygienic excreta disposal facility as defined by the WHO/UNICEF Joint Monitoring Programme, this ignores the fact that most of them are not emptied and managed hygienically, with obvious and extremely negative implications for public health and the environment. Households have been investing in upgrading their systems to water flushed toilets, driven by major improvements in water supply coverage over the last five years.
Nine percent of households in Maputo are connected to a sewerage system, while 41 percent rely on pit latrines and 49 percent use septic tanks and pour-flush toilets. An analysis of fecal waste flows in Maputo shows that only 3 percent of the total fecal waste produced actually passes through the treatment plant, while more than 50 percent contaminates backyards, the drainage system, and Maputo Bay. However, little had been done previously to improve fecal sludge management services for poor residents in Maputo, and the results from the citywide survey show that fecal sludge transport and treatment are currently failing.
Source: World Bank 2012; WHO/UNICEF 2014.
do not end at containment, but comprise a whole chain from containment, to emptying, collection, treatment, and final disposal. Rural sanitation has been even slower to improve with coverage rates increasing from 3 percent to 14 percent in 2015 (peri-urban areas).
Funding of the Water Supply and Sanitation Sectors
The water and sanitation sector has fewer financial resources and expenditures than other sectors in Mozambique. The National Water Directorate, for instance, does not have an independent budget classification; its financial allocations and budgets are pooled under that

70 Findings of the Mozambique Water Supply, Sanitation, and Hygiene Poverty Diagnostic
of the MoPH. Sector financing is predominantly donor driven (see table 5.2), though increasingly, support for government programs underscores a growing confidence in Mozambique’s capacity to achieve progress in the sector.
At the central government level, robust planning and budgeting in the water and sanitation sector is the exception rather than the rule. Local governments are part of the planning process, but they generally lack the basic information needed to properly plan with central authorities the budget requirements at the district level.
The African Ministers’ Council on Water (AMCOW) in 2008 promised to establish specific public sector budget allocations for sanitation and hygiene programs. However, by 2015 fewer than half of the 35 participants had met the target, and in May 2015 as part of the Ngor Declaration, African leaders committed to budget allocations amounting to 0.5 percent of their countries’ respective GDP to sanitation and hygiene by 2020. (Rognerud and Fonseca 2016). Monitoring progress is difficult given the lack of transparency on WASH expenditure data (elaborated below), but Mozambique does not appear to be on track.
The sector’s reliance on external funding poses risks and uncertainties for budget planning, long-term financing, and spending efficiency by overcrowding the implementing capabilities of the institutions in charge of delivering water and sanitation services. Hence, innovative financing structures, such as grants, micro credits, and guarantees, remain scarce and difficult to implement. Private-sector funding and co-financing of capital and O&M expenditures are also limited for the sector. Given the lack of emphasis on cost recovery, potential donors from the private sector have little incentive to invest in Mozambique’s water and sanitation systems.
Budget Overview: Water and Sanitation
While the budget for water and sanitation also increased, and was kept relatively high between 2010 and 2012, for the 2012–13 period, public expenditures in the sector declined. After that, investments in the sector increased slightly because of higher donor investments. As a result, investments allocated to water and sanitation accounted for slightly less than 2 percent of GDP annually between 2010 and 2012, and then were adjusted to reach only 1 percent of GDP. Funding for 2012 came from the national government, with €25.4 million (US$32.6 million), and external sources, with €76.3 million (US$98 million) (GLAAS 2015).
The Public Expenditure Review (PER) (World Bank 2014b) and the Country Status Overview (CSO) (WSP 2011) concluded that the main constraints to reaching universal access to improved sources have less to do with funding amounts, than sector efficiency and the ability to target reliable streams of funding to address identified sector gaps at the local level. The CSO’s estimate of the investment required to meet the national 2015 targets revealed that
Table 5.2: Proportion of External Funding to Total Funding
2014 (%) 2015 (%)
DNA 51.8 67.1
FIPAG 72.0 69.1
AIAS 47.7 66.7
Total 57.8 67.7
Source: DNA 2015 and MoPHRH 2015.Note: AIAS = Water and Sanitation Infrastructure Administration; DNA = National Directorate of Water; FIPAG = Water-Supply Asset Holding and Investment Fund.
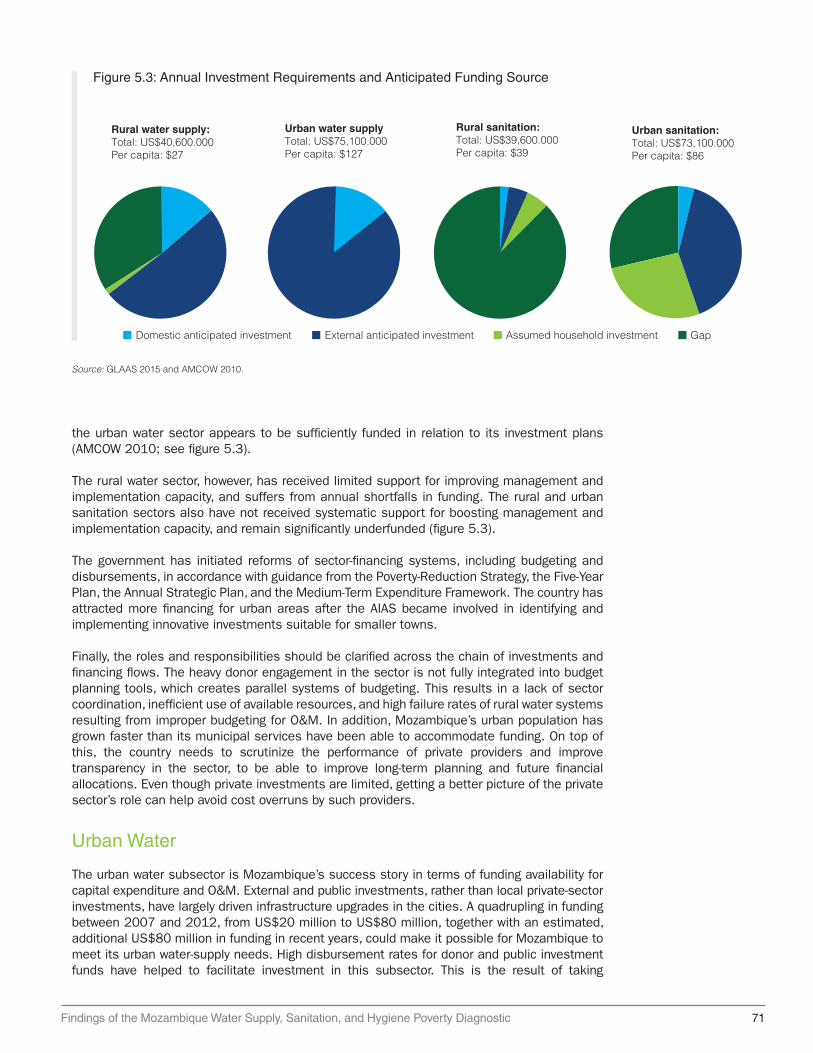
Findings of the Mozambique Water Supply, Sanitation, and Hygiene Poverty Diagnostic 71
the urban water sector appears to be sufficiently funded in relation to its investment plans (AMCOW 2010; see figure 5.3).
The rural water sector, however, has received limited support for improving management and implementation capacity, and suffers from annual shortfalls in funding. The rural and urban sanitation sectors also have not received systematic support for boosting management and implementation capacity, and remain significantly underfunded (figure 5.3).
The government has initiated reforms of sector-financing systems, including budgeting and disbursements, in accordance with guidance from the Poverty-Reduction Strategy, the Five-Year Plan, the Annual Strategic Plan, and the Medium-Term Expenditure Framework. The country has attracted more financing for urban areas after the AIAS became involved in identifying and implementing innovative investments suitable for smaller towns.
Finally, the roles and responsibilities should be clarified across the chain of investments and financing flows. The heavy donor engagement in the sector is not fully integrated into budget planning tools, which creates parallel systems of budgeting. This results in a lack of sector coordination, inefficient use of available resources, and high failure rates of rural water systems resulting from improper budgeting for O&M. In addition, Mozambique’s urban population has grown faster than its municipal services have been able to accommodate funding. On top of this, the country needs to scrutinize the performance of private providers and improve transparency in the sector, to be able to improve long-term planning and future financial allocations. Even though private investments are limited, getting a better picture of the private sector’s role can help avoid cost overruns by such providers.
Urban Water
The urban water subsector is Mozambique’s success story in terms of funding availability for capital expenditure and O&M. External and public investments, rather than local private-sector investments, have largely driven infrastructure upgrades in the cities. A quadrupling in funding between 2007 and 2012, from US$20 million to US$80 million, together with an estimated, additional US$80 million in funding in recent years, could make it possible for Mozambique to meet its urban water-supply needs. High disbursement rates for donor and public investment funds have helped to facilitate investment in this subsector. This is the result of taking
Figure 5.3: Annual Investment Requirements and Anticipated Funding Source
Source: GLAAS 2015 and AMCOW 2010.
Rural water supply:Total: US$40,600.000Per capita: $27
Domestic anticipated investment External anticipated investment GapAssumed household investment
Rural sanitation:Total: US$39,600.000Per capita: $39
Urban water supplyTotal: US$75,100.000Per capita: $127
Urban sanitation:Total: US$73,100.000Per capita: $86
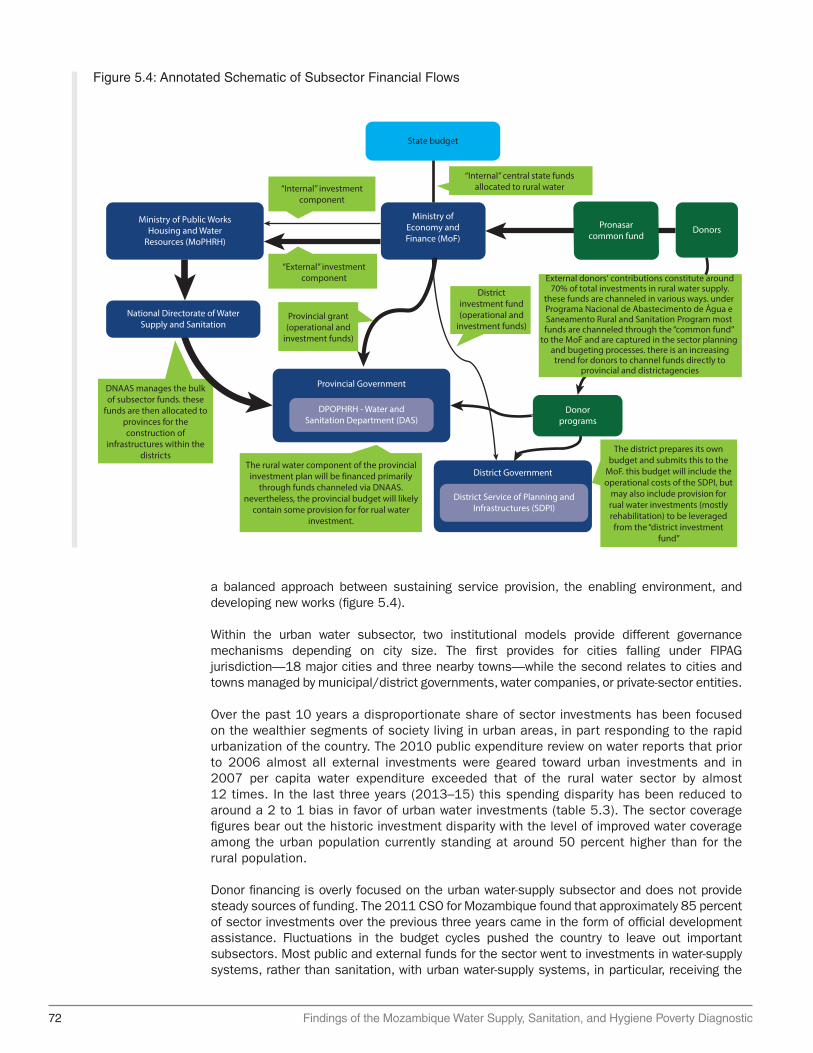
72 Findings of the Mozambique Water Supply, Sanitation, and Hygiene Poverty Diagnostic
a balanced approach between sustaining service provision, the enabling environment, and developing new works (figure 5.4).
Within the urban water subsector, two institutional models provide different governance mechanisms depending on city size. The first provides for cities falling under FIPAG jurisdiction—18 major cities and three nearby towns—while the second relates to cities and towns managed by municipal/district governments, water companies, or private-sector entities.
Over the past 10 years a disproportionate share of sector investments has been focused on the wealthier segments of society living in urban areas, in part responding to the rapid urbanization of the country. The 2010 public expenditure review on water reports that prior to 2006 almost all external investments were geared toward urban investments and in 2007 per capita water expenditure exceeded that of the rural water sector by almost 12 times. In the last three years (2013–15) this spending disparity has been reduced to around a 2 to 1 bias in favor of urban water investments (table 5.3). The sector coverage figures bear out the historic investment disparity with the level of improved water coverage among the urban population currently standing at around 50 percent higher than for the rural population.
Donor financing is overly focused on the urban water-supply subsector and does not provide steady sources of funding. The 2011 CSO for Mozambique found that approximately 85 percent of sector investments over the previous three years came in the form of official development assistance. Fluctuations in the budget cycles pushed the country to leave out important subsectors. Most public and external funds for the sector went to investments in water-supply systems, rather than sanitation, with urban water-supply systems, in particular, receiving the
Figure 5.4: Annotated Schematic of Subsector Financial Flows
“Internal” central state fundsallocated to rural water
“External” investmentcomponent
“Internal” investmentcomponent
State budget
Ministry ofEconomy andFinance (MoF)
Districtinvestment fund(operational and
investment funds)
DNAAS manages the bulkof subsector funds. these
funds are then allocated toprovinces for theconstruction of
infrastructures within thedistricts
Pronasarcommon fund
External donors‘ contributions constitute around70% of total investments in rural water supply.
these funds are channeled in various ways. under Programa Nacional de Abastecimento de Água e Saneamento Rural and Sanitation Program most funds are channeled through the “common fund”
to the MoF and are captured in the sector planning and bugeting processes. there is an increasing trend for donors to channel funds directly to
provincial and districtagencies
The district prepares its ownbudget and submits this to the
MoF. this budget will include theoperational costs of the SDPI, but
may also include provision forrual water investments (mostlyrehabilitation) to be leveragedfrom the “district investment
fund”
The rural water component of the provincialinvestment plan will be financed primarily
through funds channeled via DNAAS.nevertheless, the provincial budget will likely
contain some provision for for rual waterinvestment.
DonorsMinistry of Public Works
Housing and WaterResources (MoPHRH)
District Government
District Service of Planning andInfrastructures (SDPI)
Donorprograms
Provincial Government
Provincial grant(operational and
investment funds)
National Directorate of WaterSupply and Sanitation
DPOPHRH - Water andSanitation Department (DAS)
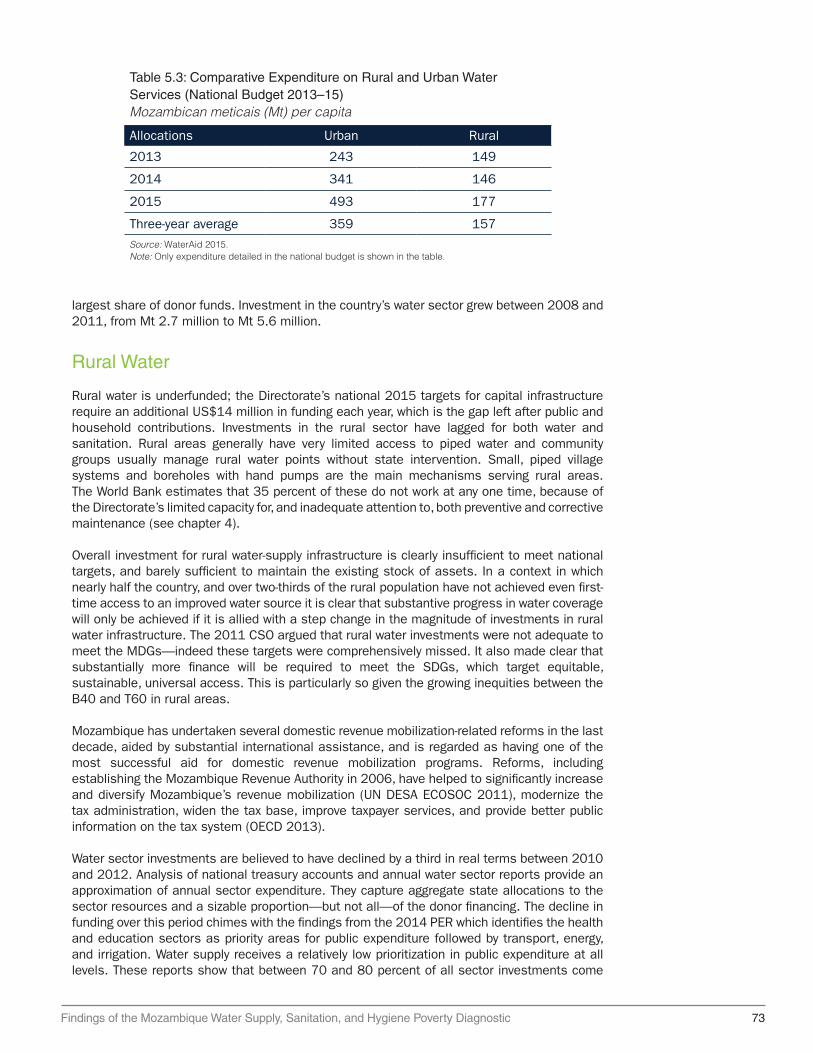
Findings of the Mozambique Water Supply, Sanitation, and Hygiene Poverty Diagnostic 73
largest share of donor funds. Investment in the country’s water sector grew between 2008 and 2011, from Mt 2.7 million to Mt 5.6 million.
Rural Water
Rural water is underfunded; the Directorate’s national 2015 targets for capital infrastructure require an additional US$14 million in funding each year, which is the gap left after public and household contributions. Investments in the rural sector have lagged for both water and sanitation. Rural areas generally have very limited access to piped water and community groups usually manage rural water points without state intervention. Small, piped village systems and boreholes with hand pumps are the main mechanisms serving rural areas. The World Bank estimates that 35 percent of these do not work at any one time, because of the Directorate’s limited capacity for, and inadequate attention to, both preventive and corrective maintenance (see chapter 4).
Overall investment for rural water-supply infrastructure is clearly insufficient to meet national targets, and barely sufficient to maintain the existing stock of assets. In a context in which nearly half the country, and over two-thirds of the rural population have not achieved even first-time access to an improved water source it is clear that substantive progress in water coverage will only be achieved if it is allied with a step change in the magnitude of investments in rural water infrastructure. The 2011 CSO argued that rural water investments were not adequate to meet the MDGs—indeed these targets were comprehensively missed. It also made clear that substantially more finance will be required to meet the SDGs, which target equitable, sustainable, universal access. This is particularly so given the growing inequities between the B40 and T60 in rural areas.
Mozambique has undertaken several domestic revenue mobilization-related reforms in the last decade, aided by substantial international assistance, and is regarded as having one of the most successful aid for domestic revenue mobilization programs. Reforms, including establishing the Mozambique Revenue Authority in 2006, have helped to significantly increase and diversify Mozambique’s revenue mobilization (UN DESA ECOSOC 2011), modernize the tax administration, widen the tax base, improve taxpayer services, and provide better public information on the tax system (OECD 2013).
Water sector investments are believed to have declined by a third in real terms between 2010 and 2012. Analysis of national treasury accounts and annual water sector reports provide an approximation of annual sector expenditure. They capture aggregate state allocations to the sector resources and a sizable proportion—but not all—of the donor financing. The decline in funding over this period chimes with the findings from the 2014 PER which identifies the health and education sectors as priority areas for public expenditure followed by transport, energy, and irrigation. Water supply receives a relatively low prioritization in public expenditure at all levels. These reports show that between 70 and 80 percent of all sector investments come
Table 5.3: Comparative Expenditure on Rural and Urban Water Services (National Budget 2013–15)Mozambican meticais (Mt) per capita
Allocations Urban Rural
2013 243 149
2014 341 146
2015 493 177
Three-year average 359 157
Source: WaterAid 2015. Note: Only expenditure detailed in the national budget is shown in the table.
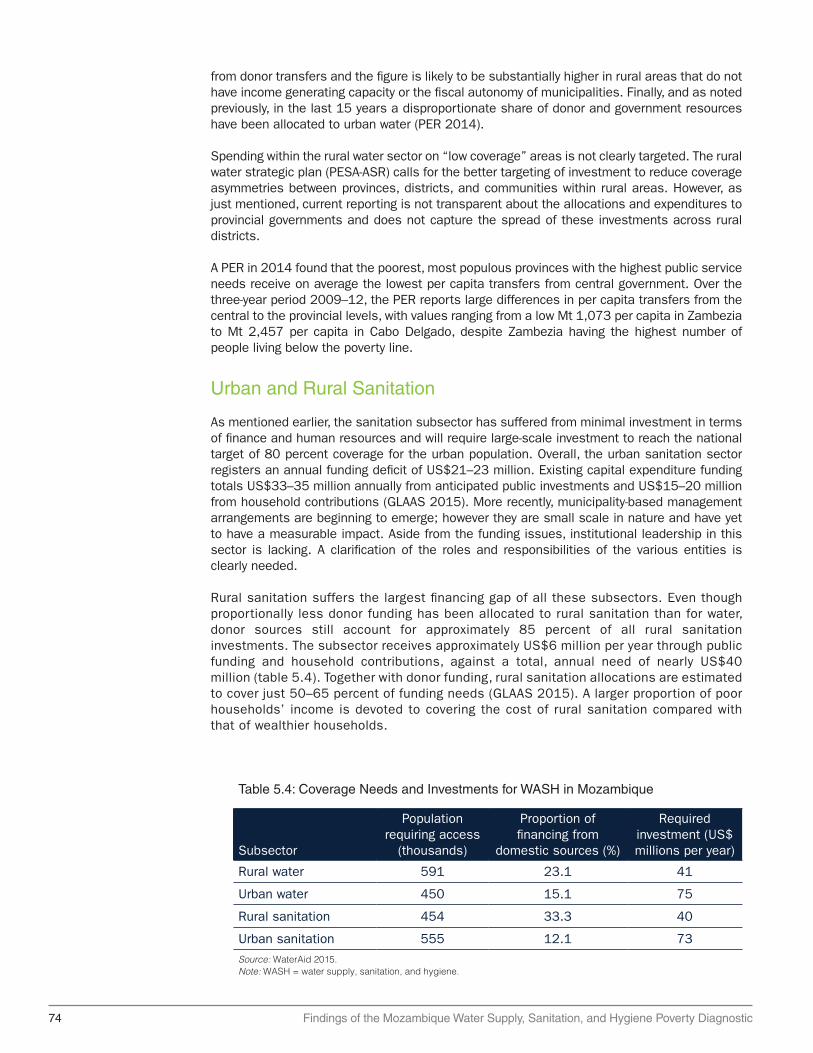
74 Findings of the Mozambique Water Supply, Sanitation, and Hygiene Poverty Diagnostic
from donor transfers and the figure is likely to be substantially higher in rural areas that do not have income generating capacity or the fiscal autonomy of municipalities. Finally, and as noted previously, in the last 15 years a disproportionate share of donor and government resources have been allocated to urban water (PER 2014).
Spending within the rural water sector on “low coverage” areas is not clearly targeted. The rural water strategic plan (PESA-ASR) calls for the better targeting of investment to reduce coverage asymmetries between provinces, districts, and communities within rural areas. However, as just mentioned, current reporting is not transparent about the allocations and expenditures to provincial governments and does not capture the spread of these investments across rural districts.
A PER in 2014 found that the poorest, most populous provinces with the highest public service needs receive on average the lowest per capita transfers from central government. Over the three-year period 2009–12, the PER reports large differences in per capita transfers from the central to the provincial levels, with values ranging from a low Mt 1,073 per capita in Zambezia to Mt 2,457 per capita in Cabo Delgado, despite Zambezia having the highest number of people living below the poverty line.
Urban and Rural Sanitation
As mentioned earlier, the sanitation subsector has suffered from minimal investment in terms of finance and human resources and will require large-scale investment to reach the national target of 80 percent coverage for the urban population. Overall, the urban sanitation sector registers an annual funding deficit of US$21–23 million. Existing capital expenditure funding totals US$33–35 million annually from anticipated public investments and US$15–20 million from household contributions (GLAAS 2015). More recently, municipality-based management arrangements are beginning to emerge; however they are small scale in nature and have yet to have a measurable impact. Aside from the funding issues, institutional leadership in this sector is lacking. A clarification of the roles and responsibilities of the various entities is clearly needed.
Rural sanitation suffers the largest financing gap of all these subsectors. Even though proportionally less donor funding has been allocated to rural sanitation than for water, donor sources still account for approximately 85 percent of all rural sanitation investments. The subsector receives approximately US$6 million per year through public funding and household contributions, against a total, annual need of nearly US$40 million (table 5.4). Together with donor funding, rural sanitation allocations are estimated to cover just 50–65 percent of funding needs (GLAAS 2015). A larger proportion of poor households’ income is devoted to covering the cost of rural sanitation compared with that of wealthier households.
Table 5.4: Coverage Needs and Investments for WASH in Mozambique
Subsector
Population requiring access
(thousands)
Proportion of financing from
domestic sources (%)
Required investment (US$ millions per year)
Rural water 591 23.1 41
Urban water 450 15.1 75
Rural sanitation 454 33.3 40
Urban sanitation 555 12.1 73
Source: WaterAid 2015. Note: WASH = water supply, sanitation, and hygiene.
Findings of the Mozambique Water Supply, Sanitation, and Hygiene Poverty Diagnostic 75
Constraints on Reaching the Poorest: Rural Water Services
Rural water services are focused on as the huge disparity in water coverage between rural and urban areas is mirrored by similar geographical disparities in poverty. Nationally, the majority of the poorest households live in rural areas. Around 90 percent of the two poorest quintiles (the B40) live in rural areas, and although national trends show a considerable reduction in poverty since 1997, most of this is concentrated in urban areas. Moreover, in Zambezia and Nampula where most of the poor live, access to improved water sources is lower than anywhere else in the country and is around half that of the wealthier provinces of Manica and Gaza.
Rural water investments appear more centralized than other sectors. A recent public financial management assessment of Mozambique reports that, in 2014, 63 percent of all expenditures were incurred centrally compared with 21 percent at the provincial level and 14 percent at the district level—the remaining 2 percent were incurred at municipal level (OECD 2014). In comparison, rural water investments are considerably more centralized—with investments by the district substantially lower than for other sectors in Mozambique. This suggests further scope for the rural water institutions and donors to follow the lead of other line ministries and increase direct allocations to districts. As the decision making is centralized, the rationale behind the eventual allocations is largely obscured from the lower level agencies (CIP 2009). This means that districts and provinces often have little understanding of the basis for the transfers they are eventually allocated (PER 2014).
In addition to the extremely low coverage in rural areas, a major concern is the sustainability and service levels provided by existing “improved” water points. Approximately 35 percent of hand pumps are broken at any point in time (World Bank 2016a). In addition, the rehabilitation of existing water points constitutes approximately 44 percent of all works completed between 2003 and 2008 and consumes an “excessive share” of subsector financing (AMCOW 2011). Approximately 55 percent of Mozambicans (both rural and urban) report being without water at least several times a week or always, which is roughly 1.7 times higher than the average for Sub-Saharan Africa.
Constraints on Needs-Based Budgetary Allocations and Effective Planning and Management
For rural water, provincial budgets are to contain recurrent and development budget lines for undertaking three mandated functions: (1) invest in new infrastructure to increase coverage, (2) promote equitable access to services within provinces, and (3) support district planning and the implementation of the DRA (MIPAR 2002). Provincial plans should be based on an assessment of district needs as part of a consultative process between the two levels and be aligned with the budget limits set by DNAAS and communicated to the OECLs through DNAAS.
District planning and budgeting sits with the SDPI, which, as of 2014 has been a formally established “budgeting unit.” As with the provinces, their plans and budgets should reflect the districts’ functional responsibilities outlined in the Manual de Implementação de Projectos de Água Rural (Rural Water Project Implementation Manual) (MIPAR) and project budget limits. These responsibilities include (1) engagement, monitoring, and support of VWCs in managing their water points, and (2) financing major system repairs and rehabilitation. The MIPAR policy guidelines state that both districts and provincial water departments should promote the private-sector provision of services and provide technical support when systems break down (MIPAR 2002). The SDPI has the additional responsibility to provide regular assistance to VWCs regarding management and operational issues.

76 Findings of the Mozambique Water Supply, Sanitation, and Hygiene Poverty Diagnostic
At the district level, and despite the 2014 designation of the SDPI as an independent budgeting unit, rural water allocations remain low. Although actual allocations to rural water from the district investment fund (FID) are not specified in current budget reporting, the broad picture provided by sector informants is that there has been little change in the overall flow of resources to the SDPI since 2014. This means that the SDPI staff have extremely limited resources to undertake their functional roles (support to VWCs, funds for rehabilitation, monitoring, evaluation, and similar functions). The centralization of budgeting and implementation functions within DNAAS and the provinces means that district agencies have little direct influence over investments within their territorial areas.
The planning and budgeting processes for rural water investments are further undermined at the district and subdistrict levels by poor quality data on water-point location and functionality. The situation is made worse by institutional weaknesses related to the transparency, accountability, and the vertical alignment of investment decision making at all levels. Despite some improvements in the coordination and disbursement of sector investments under PRONASAR, the capacity and resource constraints and institutional and accountability weaknesses inherent in planning, budgeting, and implementation processes limit the credibility and equity focus of subsector investments.
There is a high deviation between the original approved budgets, final budgets, and eventual allocations that reflect the ability of the Ministry of Finance to abruptly change budget allocations. The final budgets at national and provincial levels varied from the original budget quite considerably—often by more than 30 percent. In most cases the final budget for both internally and externally channeled funds was higher than the approved envelope. The budget deviations, whether increasing or decreasing, increase the unpredictability of resource allocation and likely impede the expected implementation of plans.
Finally, subsector monitoring data remain poor and inhibit efforts for needs-based planning and investment targeting. The de jure planning process is predicated on having a detailed understanding of water-point location and performance. However, district and subdistrict staff are not undertaking routine monitoring and are unclear on roles and responsibility for data collection as well as how the database is updated with the information collected. This means district, regional, and national stakeholders do not have a clear picture of the quantity, location, or functional status of the water points that exist.
Constraints on Oversight and Accountability of Budget Execution and Service Delivery
Without effective vertical or horizontal accountability the mismanagement of funds at local levels remains a risk. This risk is well illustrated by the handling of the now-defunct fund for district “Investment in Local Initiatives” (OIIL), otherwise known as the “7 million fund.” This fund, equating to approximately US$300,000 per district, was designed for local district development projects, but was not accompanied by oversight measures to ensure its proper use. As such, this fund has been subject to widespread mismanagement—including the diversion of funds for personal use by district officials and party affiliates (Reaud and Weimar 2010).
At the sector level, existing intergovernmental arrangements restrict oversight and accountability related to the implementation of plans. The Ministry of State Administration is the legal entity in charge of the Local State Organs (Provinces and Districts) and the Civil Service. Through the Provincial and District Secretariats it manages the human resources and performance of provinces and districts. MoPHRH, through DNAAS, has no legal means to hold the Provincial Directorate of Public Works, Housing and Hydric Resources, the Water Supply and Sanitation Department (DPOPHRH/DAS) or district SDPI to account for the effective implementation of plans and budgets, or to implement other performance-related sanctions. However, in practice, DNAAS could sanction a province by restricting central government allocations.

Findings of the Mozambique Water Supply, Sanitation, and Hygiene Poverty Diagnostic 77
The ownership of water points is not clearly defined in MIPAR or other policies. Neither MIPAR nor Water Policy clarifies the central question of how assets will be managed. The DRA approach and community management model states that infrastructures are handed over to the community for the management of services. The message to VWCs and communities is that the infrastructure belongs to the community—yet the VWCs have no legal status to formalize this ownership. De facto, water sources are public assets and, as such, there must be an entity responsible for their management. The central issue of asset management is long-standing, but has yet to be resolved at the subsector level despite the clear gap in water-point maintenance and rehabilitation.
Citizens have expressed limited interest and demand at present for improving rural water services. Although the planning process requires engaging CCs (as representatives of citizens), this form of citizen participation is largely ineffective, given (1) their ad hoc and political basis for final allocation of funds, and (2) that they are not really representative of citizens, but comprise nominated members. The current low levels of citizen mobilization and interest in investing time or money in improving the public supply of water in rural areas is a result also of the limited direct involvement of citizens by SDPIs.
Information asymmetries between civil society bodies and provincial and district administrators erodes meaningful public accountability. Even well-functioning CSOs would have little means of verifying how revenue is used. Very few agencies publish investment or expenditure plans and when they do it tends to be partial—this is seen as a failure of both local governments to provide this information and the capacity of local civil society organizations, including VWCs, to hold the government to account (GoTAS 2015). The lack of transparency regarding how resource revenues are allocated within districts undermines the credibility of district authorities (World Bank 2014a). Moreover, in rural Mozambique the participation in, and capacity of, local civil society organizations is limited.
VWCs straddle the roles of service producer, consumer, and community representative, but are not meaningfully empowered or resourced for any of these roles or functions. The resource and capacity challenges faced by the VWCs are well covered in the literature (UNICEF 2010; WaterAid 2003; WSP 2011), and are clearly fundamental to the sustainability of rural water services. In evaluating the challenges faced by VWCs we also unpack a broader set of interlinked policy constraints which also contribute to the poor service delivery outcomes observed.
VWCs have limited functions in practice. Interactions with VWCs and district agencies may happen on an ad hoc basis, but these are not formalized. Furthermore, there is no formal link between VWCs and CCs. The Councils have an established role in informing subsector planning processes and holding the districts accountable to these plans, whereas the VWCs do not. Therefore, any VWC demands, grievances, or other concerns regarding rural water supply do not carry any authority with districts or agencies beyond that of an ordinary citizen.
Key Messages
• The WASH subsectors need to be understood separately for their governance and institutional arrangements. The institutional arrangements and the nature of financial investments currently made (by donors and government) influence not only progress in the subsector, but also the types of incentives and accountability structures that exist in budgetary planning, allocations, and managing expenditures.
• While there is a shortfall of resources across WASH, some subsectors, like rural water, are especially a concern since they have a disproportionate effect on large numbers of the poorest. In understanding the binding constraints in rural water, we need to first address some key institutional issues: (1) the fragmentation of financing and investing in the subsector, and management structures for maintenance of rural water points; and (2) the oversight and accountability of budget execution and service delivery. Getting
78 Findings of the Mozambique Water Supply, Sanitation, and Hygiene Poverty Diagnostic
these institutional issues addressed will be important as this report calls for greater investments to address WASH services for the poorest in the country living in rural areas.
• There is limited detailed information on WASH investments. Additional details on the use of donor investments would allow more effective targeting toward the greatest need. Mozambique can take a stance to open its finances and financial allocation principles in strategic development sectors (education, health, WASH, and energy) and incorporate the national, subsector, and regional public spending data into the World Bank’s BOOST dataset. Only eight African countries have opened their public finance information into the BOOST initiative, and those under that initiative have conducted financial targeting analysis within and across priority development sectors.
• There are three important lessons to improve the address key institutional challenges of the rural water sector. A first step is to strengthen the incentive-based structure to achieve more results on the ground—such as conditional financing or results-based financing of the rural water sector. Second, the sector needs to improve its transparency and accountability to bring certainty to the budget planning processes and encourage the means to improve equity in the distribution of services. Third, the sector can promote new models that expand access in remote areas through cost recovery of interventions that meet minimum standards for service delivery.
• DNAAS is the central government institution, governed by MoPHRH, to which various functions related to the systems and water supply and sanitation services are assigned. Among the 11 roles assigned to DNAAS, listed in the normative rules, are that this institution:
• Ensures the implementation of policies, strategies, rules, regulations, and technical specifications for water supply and sanitation
• Promotes investments in the construction, planning maintenance, and expansion of infrastructure
• Designs drainage standards in urban and rural settlements
• Establishes and operates national information systems on water and sanitation
• Provides technical and methodological support in the water sector to local bodies of the State and local authorities.
References
AMCOW (African Ministers’ Council on Water). 2010. “African Water Resources and Management Frameworks and Finances.” AMCOW, Nigeria. http: // www.amcow-online.org/images/docs /the_compendium .pdf.
Boex, J., and R. Simatupang. 2015. “A Comparative Overview of Local Governance Systems in Selected Countries.” LPSI (Local Public Sector Initiative) working paper. LPS Associates, LLC, Alexandria, VA. http://www . localpublicsector.net/docs/LPSI_WP_LG_Systems _ Sep2015.pdf.
CIP. 2009. “Critical Aspects of Local Government in Mozambique: A Look at Six Districts and Three Municipalities.” Maputo: AMODE, CIP, GMD, LDH.
CRA (Conselho de Regulacao de Agua). 2015. “Retrospective Report of the Water and Sanitation Sector 2009-2014.” CRA-ESAWAS, Maputo. http://www.cra.org.mz/pdf/RETROSPECTIVE %20REPORT%202009-2014%20-%20Eng%20version.pdf.

Findings of the Mozambique Water Supply, Sanitation, and Hygiene Poverty Diagnostic 79
DNA (Direccao Nacional de Aguas). 2016. “Relatórios das Provincias: Água e Saneamento.” http://www.dnaguas.gov.mz/?__target__=relatorios.
DNAAS. 2016. “Plataforma Moçambicana da Água (PLAMA).” National Directorate of Water Supply and Sanitation, Maputo, Mozambique. http://www.plama . org.mz/sobreoplama . html.
FIPAG (Fundo de Investimento e Patrimonio do Abastecimento de Agua). 2015. “Key Performance Indicators.” FIPAG, Maputo, Mozambique.
Forquilha, S. 2009. “Governação Distrital no Contexto das Reformas de Descentralização Administrativa em Moçambique: Lógicas, Dinâmicas e Desafios.” In Brito, L., C. Castel-Branco., S. Chichava., A. e Francisco, (orgs.). Desafios para Moçambique.
GLAAS (Global Analysis and Assessment of Sanitation and Drinking-Water). 2015. “Investing in Water and Sanitation: Increasing Access and Reducing Inequities.” Special Report. WHO/UNICEF GLAAS Initiative, Geneva.
GoTAS. 2015. “Transparent Governance for Water, Sanitation and Health – GoTAS.” Swiss Cooperation, Maputo, Mozambique. https://www .eda.admin.ch/projects/SDC/en/2012 /7F08494/phase1.html.
MIPAR. 2002. “Manual de Implementação de Projetos de Abastecimento de Água Rural.” http: // extwprlegs1.fao.org/docs/pdf/moz50013.pdf.
Ministério das Obras Públicas, Habitação e Recursos Hídricos (MoPHRH). 2016. “Declarações dos Objectivos do Sector de Águas Pos 2015.” Direcção Nacional de Abastecimento de Água e Saneamento (DNAAS)-MoPHRH, Mozambique.
OECD. 2013. Tax and Development: Aid Modalities for Strengthening Tax Systems. Paris: OECD. Publishing. http://dx.doi.org/10.1787/9789264177581-en.
———. 2014. Independent Evaluation of Budget Support in Mozambique Final Report Volume I. OECD, Paris. https://www.oecd.org/derec/ec/Mz-BS-Eval-Final-Report-Vol-1.pdf.
Rognerud, I., and C. Fonseca. 2016. “Increasing Public Investment in Sanitation Services: Tracking Progress and Holding Governments to Account.” Finance Brief 09, Public Finance for WASH. IRC, The Netherlands. http://www.publicfinanceforwash.com/sites/default/files/uploads / Finance_Brief_9 _Govt%20investment%20in%20sanitation%202016%20state%20of%20play.pdf.
Reaud, L., and M. Weimar. 2010. “Comparative Assessment of Decentralization in Africa.” USAID (United States Agency for International Development), Washington, DC.
Rognerud I., C. Fonseca, A. van der Kerk, and P. Moriarty. IRC Trends Analysis, 2016-2025. Public Finances for WASH. Supporting water sanitation and hygiene services for life. IRC, The Netherlands. http://www.publicfinanceforwash.com/sites/default/files/uploads/IRC -trend%20analysis%202016-2025.pdf.
Sanitation and Water for All. 2014. “Briefings on the Economic Impact of Water and Sanitation: Mozambique. Sanitation and Water for All, New York. http://sanitationandwaterforall.org / priority-areas/political -prioritization/ 2014 -hlm/statements-and-evidence/.
UN DESA ECOSOC (United Nations Department of Economic and Social Affairs Economic and Social Council). 2011. “Foreign Aid as a Catalyst to Improving Domestic Revenue Mobilisation.”

80 Findings of the Mozambique Water Supply, Sanitation, and Hygiene Poverty Diagnostic
Analytical study for the Luxembourg High-level Symposium “Working Together to Improve the Development Impact of Aid.” October 2011. www.un.org/en/ecosoc / newfunct/pdf / domestic_revenue_mobilisation_june_11(july3).pdf.
OECD. 2013. “More than Water: Impact Evaluation of Drinking Water Supply and Sanitation Interventions in Rural Mozambique.” Paris: OECD. https://www.oecd.org/countries / mozambique/49295401.pdf.
WASHCost. 2010. Learning Alliance Mozambique, October 2010. Accessed 12 July 2011, available at http://www.washcost.info/page/565
WaterAid. 2003. “A Study into Rural Water Supply Sustainability in Niassa Province, Mozambique.” WaterAid UK, London.
———. 2011. “Evaluation of WaterAid’s Mozambique Country Programme.” WaterAid UK, London.
———. 2015. “Financial Absorption in the Water, Sanitation and Hygiene Sector: Mozambique Case Study.” WaterAid, New York.
WHO/UNICEF (World Health Organization/United Nations Children’s Fund). 2014. UNICEF Annual Country Report. Mozambique. WHO/UNICEF, Washington, DC. https://www.unicef .org/about/annualreport/files/Mozambique_Annual_Report _2014 .pdf.
World Bank. 2012. “Country Partnership Strategy for the Republic of Mozambique FY12-15. International Development Association.” World Bank, Washington DC. http://documents.worldbank .org/curated /en/102621468054281583/pdf/668130 CAS0P1240 Official0Use0Only090.pdf.
———. 2014a. “Intergovernmental Fiscal Management in Natural Resource–Rich Settings.” Report No. 91343-GLB. World Bank, Washington DC.
———. 2014b. “Mozambique Public Expenditure Review Addressing the Challenges of Today, Seizing the Opportunities of Tomorrow.” World Bank, Washington DC. http://documents.wor ldbank . org/curated/en/677921468275102771/pdf/911530 ESW0P 1300385389B00 PUBLIC00ACS.pdf.
———. 2016. “Implementation Completion Report of Water Services and Institutional Reform Project.” World Bank, Washington DC. http://documents.worldbank.org/curated / en/53850 1467990957414/pdf/ICR3755-P104566-BOx394886B-PUBLIC -disclosed-5-9-16.pdf.
———. 2017. “Reducing Inequalities in Water Supply, Sanitation, and Hygiene in the Era of the Sustainable Development Goals: Synthesis Report of the Water Supply, Sanitation, and Hygiene (WASH) Poverty Diagnostic Initiative.” World Bank, Washington, DC.
WSP (Water and Sanitation Program). 2011. “Water Supply and Sanitation in Mozambique: Turning Finance into Services for 2015 and Beyond.” AMCOW Country Status Overview. World Bank, Washington DC. https://wsp . org/sites/wsp.org/files/publications/CSO -Mozambique.pdf.
———. 2015. “End of Year Report.” World Bank, Washington, DC. http://www.wsp.org/sites / wsp.org/files / publications/WSP-End-Year-Report-FY15.pdf.

W17015
Findings of the Mozam
bique Water Supply, Sanitation, and Hygiene Poverty Diagnostic