Embed Size (px)
Citation preview

Firms’ governance, efficiency and tariffs in water service provision:empirical evidence from the Italian case
Very Preliminary Version
Andrea BordinUniversity of Venice
Mario PadulaUniversity of Venice
Paola ValbonesiUniversity of Padova
February 7, 2013
– Smart governance and regulation of water and sanitation services in Europe –
Chaire EPPP, FSR, ONEMA, Villa Finaly, Florence

MOTIVATION
In Italy, recently, perceived a relevant increase in residential water tariffs.
In the arisen national debate, large concern about the firm’s governance in waterservice provision: private firms have been often considered as the main determi-nant of tariffs’ increase.
Given the actual regulatory system, drivers for this increase can belong to:
� 1. Inefficiency in Production
� 2. New Investments (i.e. planned)
� 3. Distortion from Tariffs’ Structure
1

WHAT WE DO:
� Collect a new dataset on Italian water services on:i) technical data on local provisionii) budgetary data on about 80 operators over a total of 114 (2005-2011)iv) tariffs (2005-2012)iii) data on local regulators (several years)
� Empirically assess the effect of firms’ governance on efficiency and res-idential tariff, controlling for technical and structural characteristics of theservice.
2

EMPIRICAL LITERATURE ON EFFICIENCY in the PROVISIONof water services, public vs private firms
� - during the 1970s, debate in USA about optimal size of water utilities, existenceof possible economies of scale, effects of mergers and relative performance ofpublic vs private water and wastewater businesses.
� - in the 80s in UK and in the 90s in Continental Europe, debate on privatisation:private operators would lead to higher efficiency, improved quality and higherincentives to develop innovations.
� - after 2000, debate on hybrid governance mode: different forms of PPP differin the allocation of risks, revenues, rights, and obligations across public andprivate partners (i.e. PPP in France).
� - recently, debate on re-municipalisation: Paris (2010), Dar es Salam (Tanza-nia), Buenos Aires, Hamilton (Canada), some Malaysian municipalities; referen-dum in Italy. Main arguments against private management: not justified largereturn on investment, ”astronomical profits”, high tariffs.
3

MAIN EMPIRICAL RESULTS ON EFFICIENCY in the PROVISIONof water services, public vs private firms
� Surveys on empirical results by: Walter, M., Cullmann, A., Hirschhausen, C.v.,Wand, R., Zschille, M., (2009); Renzetti, S., Dupont, D., (2003).
� No discernable difference (Feigenbaum-Teeples,1983; Byrnes et al,1986;Teeples-Glyer,1987; Houtsma,2003; Garcia-Sanchez,2006; da Silva et al,2007).
� Private operators more efficient (Crain-Zardkoohi,1978; Morgan,1977; Raf-fiee et al,1992; Estache-Kouassi,2002).
� Public providers more efficient (Mann-Mikesell,1976; Bruggink,1982; Fox-Hofler,1985; Lambert et al,1993; Bhattacharyya et al,1995*; Shih et al,2006).
*at high levels of output, private firms are more efficient.- endogeneity of the organizational choice: Chong, et al,2006; Carpentier, etal,2006.
4

ITALIAN REGULATORY SETTING
� National Law 36/1996:- Definition of the Integrated water service, IWS (supplying of water - fetching,transporting and distributing - sewage and water treatment/purification)- Definition of the OTB - Optimal Territorial Basins- Definition of a new tariff system (full recovery cost on IWS)- Creation of a national Committee, with no regulatory independent power- Separation of the following functions:1. regulation/programming/monitoring of the IWS by OPT Authorities, which
maintains property of infrastructures;2. management of the IWS, held by a single and independent operator, con-
tracted out by the OPT Authority.
� Reform on May 2011, Decreto Sviluppo:- New Sectoral Authority with regulatory and independent power;- in two years, it has to set a new tariff system;- OTB, in their actual role, will disappear; new institutions: ”Basin Counsils”.
5

Tariff Regulation
Limit Tariff:
LTn = (C + A + R)n−1 ∗(1 + π + K)
m3
LTn = current tariffC = operation costsA = amortization costsR = capital remuneration componentπ = inflation rate expected for the current yearK = price cap, i.e. max rate of increase over planned inflationm3 = volume of water provided
Average Real Tariff:
ART = (C + A + R)/m3
6

Final Tariff
The Final Tariff, namely the one payed by consumers, is the smaller between theLT and the ART, so that:
if ART ≤ Limit Tariff −→ ART ≡ Final Tariff
if ART ≥ Limit Tariff −→ Limit Tariff ≡ Final Tariff
ART is the main reference in this regulatory design
7

TYPES OF MANAGEMENT ADMITTED BY THE LAW
� In House: Local Public Firm
� Joint Spa: Public Firm
� IPPP: Public Private Partnership
� Private: Private Firm
� Others: Old Concession
� Non contracted-out: No IWS
8

Figure 2: Optimal Territorial Basins
Copia per Valbonesi P.
60
Figura 9 - La geografia degli affidamenti in Italia
Fonte: Utilitatis
10

TYPE OF MANAGEMENT (Percentage)
In house Joint IPPP Private Others TOT
North 51,7 9,5 17,6 1,4 18,9 100Center 60,0 4,0 28,0 4,0 4,0 100South 26,7 6,7 13,3 33,5 20,0 100
POPULATION SERVED (Percentage)
In house Joint IPPP Private Others TOT
North 32.5 11.3 7.2 0.8 43.5 100Center 26.1 32.0 34.0 4.4 3.6 100South 22.3 1.2 17.9 8.6 47.5 100
11

Sheet1
Page 1
In House IPPP Joint S.p.a. Private Other58 22 9 7 1826 8 2 7 4
In House IPPP Joint S.p.a. Private Other0
10
20
30
40
50
60
70
CONVIRI REPORT 2009 Operators (114)
In House IPPP Joint S.p.a. Private Other0
5
10
15
20
25
30
DATA SAMPLE Operators (47)

Table 2: Population, Clients, Volume of water sold, Number of employees, Total employees expenditure for 47 operators in 2009, grouped by management
Population Clients Volume sold (m3) Conduct (Km) Employees Emp.Ex. (e)
In House (26)
Min. : 12.644,0 5.013,0 1.065.000,0 240,0 8,0 226.735,0Mean : 437.334,0 164.782,0 38.726.295,0 3.509,0 245,1 9.578.117,0sd : 577.436,6 165.420,9 55.374.948,0 2.445,3 306,5 13.499.120,0Max. : 2.194.759,0 780.000,0 250.000.000,0 10.267,0 1.417,0 53.824.351,0
Ippp (8)
Min. : 39.543,0 13.727,0 6.000.000,0 600,0 13,0 583.984,0Mean : 608.324,0 220.719,0 40.052.305,0 4.197,0 366,5 12.760.539,0sd : 512.557,9 171.035,1 31.453.409,0 2.298,3 279,5 10.536.019,0Max. : 1.448.715,0 460.000,0 85.605.678,0 7.000,0 780,0 30.353.235,0
Private (4)
Min. : 160.645,0 78.170,0 8.637.827,0 1.019,0 30,0 748.661,0Mean : 468.911,0 124.724,0 36.906.804,0 1.921,0 190,0 8.258.770,0sd : 303.399,0 48.623,6 32.691.143,0 799,9 187,0 9.313.944,0Max. : 880.000,0 186.205,0 72.706.000,0 2.544,0 428,0 20.975.969,0
Joint (2)
Min. : 656.081,0 - 45.032.665,0 1.300,0 676,0 33.932.350,0Mean : 2.106.140,0 - 245.966.332,0 6.026,0 1.186,5 58.642.655,0sd : 2.050.693,0 - 284.163.118,0 6.684,3 722,0 34.945.647,0Max. : 3.556.199,0 - 446.900.000,0 10.753,0 1.697,0 83.352.959,0
Others (7)
Min. : 62.500,0 13.592,0 3.113.000,0 333,0 24,0 1.114.975,0Mean : 1.127.552,0 348.648,0 90.713.392,0 5.498,0 459,0 18.374.568,0sd : 1.405.275,0 449.804,4 103.671.016,0 7.064,6 707,3 26.738.646,0Max. : 4.032.950,0 1.000.000,0 245.678.423,0 21.000,0 2.000,0 76.675.731,0
17

EFFICIENCY INDICATORS
INTERNAL PRODUCTION EFFICIENCY: the operator, given its productions func-tion, chooses among all the possible combinations of production factors that oneleading to the cost minimization.
� Production Cost/ Volume of water sold
� Production Cost/ Length of Conducts
� Production Cost/ Inhabitants
� Production Cost/ Employees
� Cost of Personnel/ Production Cost
18

Table 3: EFFICIENCY INDICATORS - Average Cost per Unit of Water Sold, for 47 operators in 2009 grouped by size
AVC PER A UNIT OF WATER SOLD (e/m3)
Small Medium Big (Top)
Min. : 0,3553 0,5832 0,4712 0,4715Mean : 1,2798 1,4870 1,4010 1,2820sd : 0,5483 0,6541 0,4715 0,4360Max. : 2,0574 3.5630 1,9500 1.6320
Table 4: EFFICIENCY INDICATORS - Average Cost per Employee, for 47 operators in 2009 grouped by size
AVC PER EMPLOYEE (e/Person)
Small Medium Big (Top)
Min. : 133.400,0 114.000,0 115.400,0 163.300,0Mean : 280.800,0 203.200,0 182.700,0 182.200,0sd : 183.856,6 65.641,3 41.827,7 23.836,1Max. : 668.700,0 368.600,0 264.000,0 209.000,0
19

Table 5: EFFICIENCY INDICATORS - Average Cost per Unit of Water Sold for 47 operators in 2009 grouped by management
AVC PER VOLUME OF WATER SOLD (e/m3)
In House Ippp Joint S.p.a. Private Others
Min. : 0,5832 0,4979 0,7935 1,554 0,355Mean : 1,4462 1,5040 1,2630 1,919 1,030sd : 0,5981 0,4713 0,6633 0,404 0,528Max. : 3,5629 1,9830 1,7320 2,354 1,652
Table 6: EFFICIENCY INDICATORS - Average Cost per Employee, for 47 operators in 2009 grouped by management
AVC PER EMPLOYEE (e/Person)
In House Ippp Joint S.p.a. Private Others
Min. : 114.000,0 145.000,0 115.400,0 264.000,0 116.700,0Mean : 192.400,0 190.500,0 162.200,0 435.400,0 217.700,0sd : 59.226,9 52.988,8 66.197,5 198.677,9 106.787,3Max. : 368.600,0 310.700,0 209.000,0 668.700,0 434.200,0
20

Sheet1
Page 1
In House IPPP Joint S.p.a. Private Other1.4462 1.504 1.263 1.919 1.03
In House IPPP Joint S.p.a. Private Other0
0.5
1
1.5
2
2.5
Data Sample 2009 AVC per Unit of Water Sold (Euro/mc3)
operators grouped by type of management (red bar means statistical significance)
Sheet1
Page 1
In House Ippp Private Joint S.p.a. Others192400 190500 435400 162200 217700
In House Ippp Private Joint S.p.a. Others0
50000100000150000200000250000300000350000400000450000500000
Data Sample 2009 AVC per Employee (Euro/person)
operators grouped by type of management (red bar means statisticall significance)
21

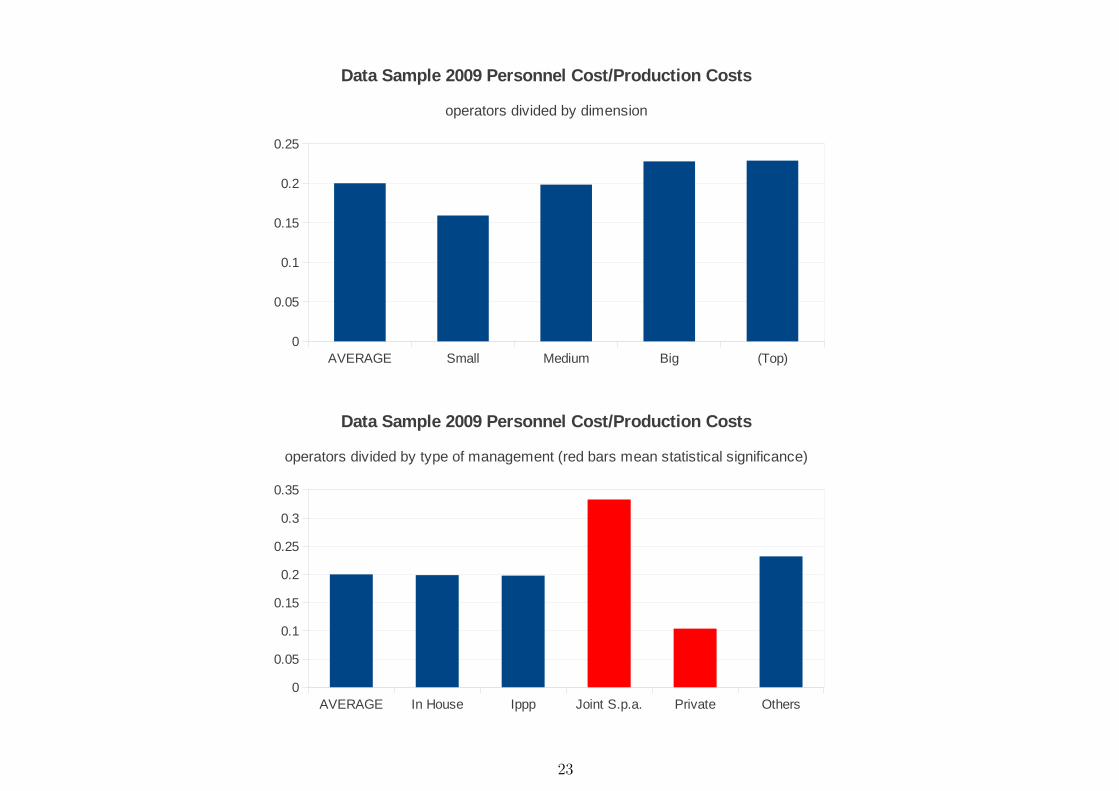
Table 7: EFFICIENCY INDICATORS - Ratio of Personnel Cost over Production Cost, for 47 operators in 2009 grouped by size
PERSONNEL COST OVER PRODUCTION COST by size (e/Person)
Operators Small Medium Big (Top)
Min. : 0,0047 0,0468 0,0047 0,1033 0,2199Mean : 0,2003 0,1593 0,1984 0,2277 0,2291sd : 0,0845 0,0816 0,0867 0,0735 0,0081Max. : 0,4351 0,2724 0,3966 0,4351 0,2350
Table 8: EFFICIENCY INDICATORS - Ratio of Personnel Cost over Production Cost, for 47 operators in 2009 grouped by management
PERSONNEL COST OVER PRODUCTION COST* by management (e/Person)
Operators In House Ippp Joint S.p.a. Private Others
Min. : 0,0047 0,0047 0,1033 0,2350 0,0468 0,1070Mean: 0,2003 0,1989 0,1978 0,3330 0,1040 0,2325sd : 0,0845 0,0758 0,0575 0,1414 0,0670 0,0890Max. : 0,4351 0,2955 0,2685 0,4351 0,1856 0,3967
22
Sheet1
Page 1
AVERAGE Small Medium Big (Top)0.20033 0.1593 0.19848 0.228 0.229
AVERAGE Small Medium Big (Top)0
0.05
0.1
0.15
0.2
0.25
Data Sample 2009 Personnel Cost/Production Costs
operators divided by dimension
Sheet1
Page 1
AVERAGE In House Ippp Joint S.p.a. Private Others0.20033 0.19894 0.198 0.333 0.104 0.232
AVERAGE In House Ippp Joint S.p.a. Private Others0
0.05
0.1
0.15
0.2
0.25
0.3
0.35
Data Sample 2009 Personnel Cost/Production Costs
operators divided by type of management (red bars mean statistical significance)
23

Sheet1
Page 1
House storico pulito (tolti 4)
2009 2008 2007 200643,333,746 39,935,411 46,821,325 43,439,705
1,649,339 1,601,247 1,545,265 1,322,272
67,792,982 63,488,814 55,796,625 50,507,205
119,878,886 120,836,012 109,905,482 104,412,715
24,303,782 22,537,555 22,416,837 21,376,679
59,823,123 63,914,935 62,111,845 56,839,343
68,130,530 61,585,529 60,084,102 59,266,807
43,127,980 38,701,413 37,081,195 35,280,013
19,690,767 20,238,950 18,145,115 16,931,971
40,151,062 39,442,155 37,909,971 37,327,947
8,074,089 8,223,034 8,114,289 7,607,009
4,445,593 5,353,437 5,006,777 4,709,940
18,495,066 18,057,402 10,752,827 990,849
13,262,012 11,951,619 11,485,333 11,316,690
7,316,802 7,008,657 6,419,431 60,000
18,424,857 17,999,442 16,908,883 16,310,397
5,184,859 5,148,173 5,298,423 6,050,473
47,593,200 44,979,574 47,621,576 44,519,895
28,728,494 28,273,085 26,782,437 24,065,453
38,537,228 39,504,486 29,666,472 29,288,500
227,135,362 200,492,372 215,968,316 188,021,394
MEDIA 43099036.14 40917776.29 39802025.05 36173583.67
37,549,743 36,474,362 42,064,517 37,209,895
1,645,949 1,537,692 1,484,124 1,263,957
60,724,709 56,993,401 51,666,960 48,310,096
89,167,984 95,665,936 96,404,774 96,290,498
20,366,482 19,492,394 18,847,598 17,850,517
50,067,879 52,603,802 52,572,458 49,227,269
54,711,987 52,710,184 52,376,736 51,935,295
30,358,754 27,711,805 28,101,168 27,667,748
16,494,071 16,518,859 15,578,544 14,160,319
36,710,978 36,211,177 35,504,742 31,275,172
6,264,266 6,468,192 5,441,945 5,087,402
4,378,338 5,269,394 4,678,042 4,384,514
12,976,824 12,300,497 8,521,891 954,208
9,064,043 8,786,409 8,468,231 8,008,378
47,552,117 36,438,396 15,342,236 33,110,916
6,990,033 6,617,109 5,414,403 0
24,525,002 24,525,002
17,253,960 16,923,686 15,725,403 15,190,319
4,806,171 4,874,726 4,956,916 4,757,378
40,189,686 38,837,266 39,096,634 35,694,274
25,660,751 25,110,198 23,100,963 21,411,933
A. TOT. VAL. DELLA PRODUZIONE
A. TOT. VAL. DELLA PRODUZIONE
A. TOT. VAL. DELLA PRODUZIONE
A. TOT. VAL. DELLA PRODUZIONE
A. TOT. VAL. DELLA PRODUZIONE
A. TOT. VAL. DELLA PRODUZIONE
A. TOT. VAL. DELLA PRODUZIONE
A. TOT. VAL. DELLA PRODUZIONE
A. TOT. VAL. DELLA PRODUZIONE
A. TOT. VAL. DELLA PRODUZIONE
A. TOT. VAL. DELLA PRODUZIONE
A. TOT. VAL. DELLA PRODUZIONE
A. TOT. VAL. DELLA PRODUZIONE
A. TOT. VAL. DELLA PRODUZIONE
A. TOT. VAL. DELLA PRODUZIONE
A. TOT. VAL. DELLA PRODUZIONE
A. TOT. VAL. DELLA PRODUZIONE
A. TOT. VAL. DELLA PRODUZIONE
A. TOT. VAL. DELLA PRODUZIONE
A. TOT. VAL. DELLA PRODUZIONE
A. TOT. VAL. DELLA PRODUZIONE
A.1. Ricavi vendite e prestazioni
A.1. Ricavi vendite e prestazioni
A.1. Ricavi vendite e prestazioni
A.1. Ricavi vendite e prestazioni
A.1. Ricavi vendite e prestazioni
A.1. Ricavi vendite e prestazioni
A.1. Ricavi vendite e prestazioni
A.1. Ricavi vendite e prestazioni
A.1. Ricavi vendite e prestazioni
A.1. Ricavi vendite e prestazioni
A.1. Ricavi vendite e prestazioni
A.1. Ricavi vendite e prestazioni
A.1. Ricavi vendite e prestazioni
A.1. Ricavi vendite e prestazioni
A.1. Ricavi vendite e prestazioni
A.1. Ricavi vendite e prestazioni
A.1. Ricavi vendite e prestazioni
A.1. Ricavi vendite e prestazioni
A.1. Ricavi vendite e prestazioni
A.1. Ricavi vendite e prestazioni
A.1. Ricavi vendite e prestazioni
2001 2002 2003 2004 2005 2006 2007 2008 2009 20100
0.2
0.4
0.6
0.8
1
1.2
1.4
Production Cost / Revenues (average)
source: AIDA
In HouseIppp PrivateJoint Sp.a.
Sheet1
Page 1
INVESTIMENTI181,330,155 118,410,302 89,762,694 49,775,435
524,304,084 515,052,128 537,489,177 525,615,130
38,325,302 21,904,344 4,299,524 21,509,723
45,349,750 37,860,578 25,098,521 36,102,950
Private 197327322.8 173306838 164162479 158250809.5
INVESTIMENTI283,414,445 279,723,533 282,126,775 271,793,394 262,187,907
6,167,590 6,003,767 6,305,436 5,548,335 3,595,467
174,010,536 144,961,417 115,436,767 103,922,166 103,265,535
817,208,982 814,812,857 785,503,735 757,891,631 675,998,278
21,631,588 22,203,127 22,220,420 21,190,542 19,331,456
169,314,837 151,574,940 123,864,783 101,753,180 78,858,363
165,397,276 146,467,148 125,686,444 117,073,486 90,802,275
171,000,826 162,258,818 156,125,068 151,634,364 147,984,212
84,308,705 83,985,002 77,637,978 70,129,858 56,575,568
19,925,495 19,111,854 19,083,580 18,582,440 18,622,751
3,156,248 3,926,284 3,545,972 3,159,579 2,351,272
27,243,137 20,772,266 13,198,960 1,371,268 15,646,408
49,181,565 48,628,549 36,520,928 35,844,526 35,369,111
18,861,635 18,613,097 16,375,472 2,783,685 14,158,472
33,902,777 30,423,121 29,748,420 26,709,579 23,249,696
21,082,942 20,947,259 21,837,797 22,201,407 19,877,167
337,794,481 327,558,399 316,248,704 308,268,273 114,370,789
70,111,108 66,147,940 58,143,765 46,683,214 33,579,812
101,553,842 106,915,072 89,348,249 76,857,393 71,309,115
68,306,636 51,658,455 39,362,948 53,109,346 53,109,347
774,151,896 761,927,338 596,317,654 458,146,369 345,087,637
In House 162748883.2 156600964 139744755 126412096.9 104063363.7
INVESTIMENTI220,719,440 202,812,693 187,258,942 165,686,355 140,669,563
409,931,833 280,910,484 210,903,842 146,829,782 43,404,135
15,132,049 17,263,911 15,158,195 9,174,612 14,182,192
127,891,371 115,132,899 102,675,132 71,764,294 59,913,014
486,251,528 487,491,508 497,683,612 487,317,057 489,685,926
25,694,099 22,573,797 18,486,439 16,793,481 14,586,401
102,817,115 99,299,784 103,860,649 87,094,747 63,091,261
25,694,099 22,573,797 18,486,439 16,793,481 14,586,401
4,814,282 5,015,734 4,534,020 5,316,787 4,123,970
Ippp 157660646.2 139230511.9 128783030 111863399.6 93804762.56
INVESTIMENTI5,915,209 5,573,924 3,735,522 3,581,509 3,401,771
195,013,191 187,268,033 197,730,013 194,731,004 181,445,000
Joint Sp.a. 100464200 96420978.5 100732767.5 99156256.5 92423385.5
TOTALE ATTIVO
TOTALE ATTIVO
TOTALE ATTIVO
TOTALE ATTIVO
TOTALE ATTIVO
TOTALE ATTIVO
TOTALE ATTIVO
TOTALE ATTIVO
TOTALE ATTIVO
TOTALE ATTIVO
TOTALE ATTIVO
TOTALE ATTIVO
TOTALE ATTIVO
TOTALE ATTIVO
TOTALE ATTIVO
TOTALE ATTIVO
TOTALE ATTIVO
TOTALE ATTIVO
TOTALE ATTIVO
TOTALE ATTIVO
TOTALE ATTIVO
TOTALE ATTIVO
TOTALE ATTIVO
TOTALE ATTIVO
TOTALE ATTIVO
TOTALE ATTIVO
TOTALE ATTIVO
TOTALE ATTIVO
TOTALE ATTIVO
TOTALE ATTIVO
TOTALE ATTIVO
TOTALE ATTIVO
TOTALE ATTIVO
TOTALE ATTIVO
TOTALE ATTIVO
TOTALE ATTIVO
2003 2004 2005 2006 2007 2008 2009 20100
50000000
100000000
150000000
200000000
250000000
Investments (average)
source: AIDA
In HousePrivateJoint Sp.a.Others
24

LINEAR MODEL SPECIFICATION
Efficiency Indicators (Y)
AC per Unit of Water SoldAC per Kilometer of ConductAC per InhabitantAC per Employee
AC = α + β1 + β2Dummy + ε
Beta Volume of water sold; Served Popolation, Raw Materials;Clients (number of contract), Services.
Beta dummies* Management: Djoint; Dippp; Dprivate; Dothers.Dimension: Dbig; Dsmall.Geographical area: Dcenter; Dsouth.
*Alfa (Reference group): In House, Medium, Northern operator
29

OLS MODEL RESULTS: AVC PER UNIT OF WATER SOLD (e/m3)
Coefficients First 4 coeff. in per capita terms Estimate sd
Intercept -0.969 (0.000)*** 0,195Raw materials 0,011 (0.001)** 0.004Services 0.013 (0.000)*** 0.002Volume sold (inverse) 96.708 (0.000)*** 12.093Conducts 0.773 (0.898) 5.974Employees 657.502 (0.000)*** 159.360Djoint 0.176 (0.284) 0.161Dippp 0.144 (0.122) 0.091Dprivate 0.520 (0.001)** 0.144Dothers -0,004 (0.965) 0.092Dsmall -0.199 (0.037)* 0.092Dbig -0.045 (0.524) 0.070
Adjusted R-squared: 0.902F-statistic: 36.1 (0.000)***The first four coefficients are expressed in per capita terms
34
33
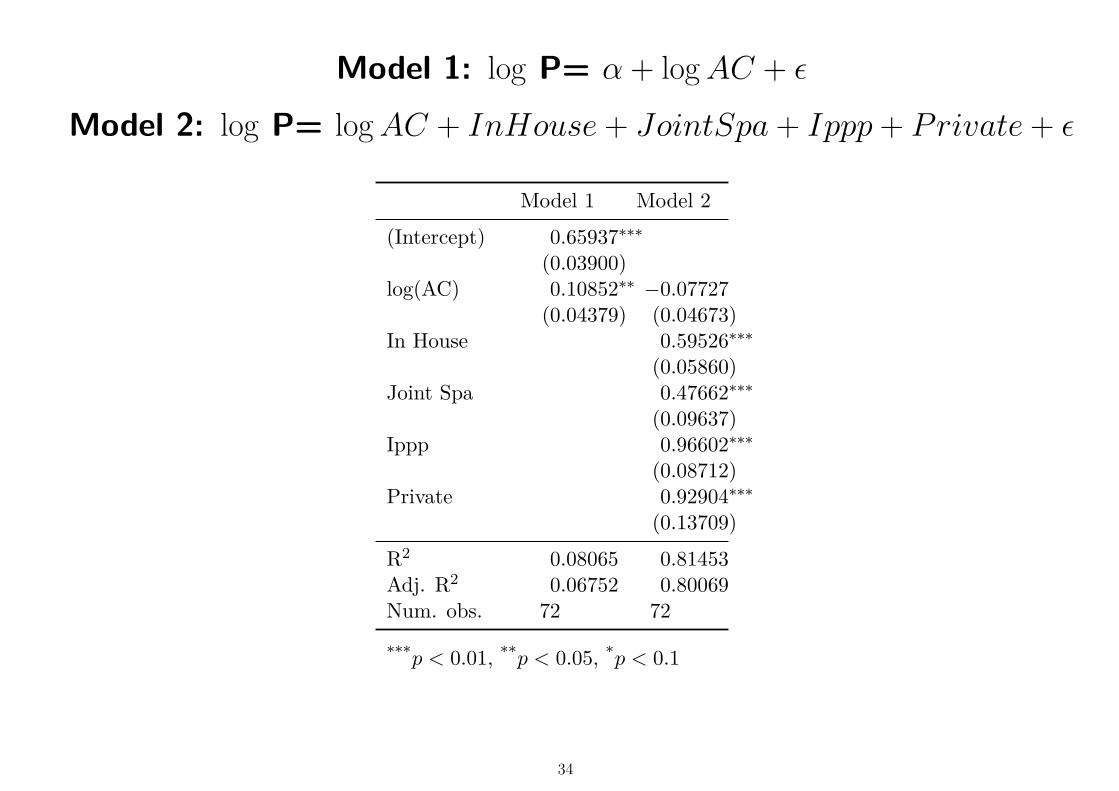
Model 1: log P= α + logAC + ε
Model 2: log P= logAC + InHouse + JointSpa + Ippp + Private + ε
Model 1 Model 2(Intercept) 0.65937∗∗∗
(0.03900)log(AC) 0.10852∗∗ −0.07727
(0.04379) (0.04673)In House 0.59526∗∗∗
(0.05860)Joint Spa 0.47662∗∗∗
(0.09637)Ippp 0.96602∗∗∗
(0.08712)Private 0.92904∗∗∗
(0.13709)R2 0.08065 0.81453Adj. R2 0.06752 0.80069Num. obs. 72 72
***p < 0.01, **p < 0.05, *p < 0.1
34

DISCUSSION
EFFICIENCY INDICATORS:- Average cost per employee decreasing with the dimension of the firm; very highfor Private Firms;- Average cost per unit of water sold lower for small and top firms, higher formedium and big firms.- Personnel cost over production costs are the lowest for Private Firms.== Average Costs: no large difference according to firms’ governance(excluding Private)TARIFF:
- Differences according to firms’ governance: Private Firms record the highest value== Where the differences in Tariff come from ?TO BE INVESTIGATED:
- Investment- Quality- Tariff Structure
1