Embed Size (px)
Citation preview
PHYSICAL REVIEW B 86, 224410 (2012)
First-principles determination of the rhombohedral magnetostrictionof Fe100−xAlx and Fe100−xGax alloys
Yanning Zhang,1 Hui Wang,1,2 and Ruqian Wu1
1Department of Physics and Astronomy, University of California, Irvine, California, 92697-4575, USA2Shenyang National Laboratory of Materials Science, Institute of Metal Research and International Centre of Materials Physics,
Chinese Academy of Sciences, Shenyang, 110016, China(Received 20 August 2012; revised manuscript received 27 November 2012; published 14 December 2012)
Through systematic density functional calculations using the full potential linearized augmented plane-wave(FLAPW) method, the rhombohedral magnetostriction (λ111) of Fe100−xAlx and Fe100−xGax alloys are studiedfor x up to 25. Theoretical calculations satisfactorily reproduce the main features of experimental λ111(x)curves, except for dilute alloys with x < 5. Detailed analyses on electronic and structural properties indicatethe importance of availability and symmetry of dangling bonds for the sign change of λ111 around x = 16. Inaddition, the impurity induced local distortion might be a possible reason for the disagreement between theoryand experiment for λ111 of the bulk bcc Fe.
DOI: 10.1103/PhysRevB.86.224410 PACS number(s): 75.80.+q, 71.15.Mb, 71.20.Be, 75.30.Gw
I. INTRODUCTION
Magnetostriction in a ferromagnetic material is the changeof shape or dimension in response to the reorientation of mag-netization along the applied external magnetic field.1 Highlymagnetostrictive rare-earth-free alloys such as Fe100−xGax
(Galfenol) and Fe100−xAlx (Alfenol) have recently attractedextensive attention due to their excellent features includinglarge strains at moderate fields, high permeability, and goodductility.2–7 Tremendous efforts have been dedicated in thelast decade to improve the performance of Fe100−xGax andFe100−xAlx alloys8,9 for applications in sensors, actuators,transducers, MEMS, and energy converting devices. Thetetragonal magnetostrictive coefficient (λ100) of Fe100−xGax
has an unique dependence on the composition of Ga, with twomaxima at x = 19 and x = 28 in the λ100(x) curve, both above300 ppm.9 On the contrary, the rhombohedral magnetostrictivecoefficient (λ111) shows no measurable change for x < 15, butsuddenly changes its sign near x ≈ 16 from negative to positive.The origin of the diverging behaviors of tetragonal andrhombohedral magnetostrictive responses has not been wellunderstood even after extensive interdisciplinary efforts.6,8,9
Recent density functional theory (DFT) studies satisfactorilyreproduced the experimental λ100(x) (x < 19) curves ofFe100−xGax .10,11 As was also revealed in experiments,12,13
the enhanced tetragonal magnetostriction of Fe100−xGax andrelated alloys should be attributed to electronic factors ratherthan to motions of precipitates.14 Nevertheless, calculationsfor λ111 of these alloys have never been done, and crossexaminations for λ100 and λ111 are necessary to establishreliable theoretical models and insights.
Magnetostriction originates from spin-orbit coupling(SOC), which is typically rather weak in 3d transition metals.15
DFT calculations of rhombohedral magnetostriction are stillnontrivial even for very simple systems. In previous theoreticalstudies, Fahnle et al. obtained positive λ111 for the bulkbcc Fe using three different approaches, opposite in sign
from experimental data: λ111 = −21 ppm.16 The deficiencyof the exchange-correlation potential was blamed for thedescription of Fe, but the actual reason for this “failure”remains mysterious. λ111 was found to be more sensitive thanλ100 to the change of lattice size, the presence of impurities,or the slight change of s-d charge transfer. Studies of λ111
for complex alloys may provide more stringent tests forthe reliability of DFT approaches for the determination ofSOC-induced magnetic properties.
In this paper we report results of DFT calculations forλ111 of Fe100−xAlx and Fe100−xGax alloys with x < 25. Thecalculated values of λ111 are overall in good agreement withexperiments, except for bcc Fe and dilute alloys with x < 5.The rhombohedral shear modulus (c44) is almost independentof x and hence the magnetoelastic constant (b2) determinesthe λ111(x) behavior. Extensive analysis reveals the key factorsfor the sign change of λ111 around x = 16 for Fe100−xGax
and Fe100−xAlx alloys. Possible reasons that lead to differentsigns of λ111 between theory and experiment for the bulk Feare also discussed.
II. COMPUTATIONAL DETAILS
For a cubic material, the field-induced fractional change inlength �l/l0 can be expressed in terms of λ100 and λ111 as1
�l
l0= 3
2λ100
(3∑
i=1
α2i β
2i − 1
3
)+ 3λ111(α1α2β1β2
+α2α3β2β3 + α3α1β3β1), (1)
where l0 is the length of an unmagnetized reference state, andαi and βi are directional cosines of the magnetization and thestrain measurement with respect to the ith crystalline axis.The magnetostriction coefficient λ111 thus can be obtained bymeasuring �l/l0 along the (111) direction (βi = 1/
√3) when
the magnetization direction is switched from the (111) axis tothe (112) axis:
λ111 = −2
3
(�l
l0
∣∣∣∣112
− �l
l0
∣∣∣∣111
)= −2
3
l0(α1 = α2 = 1√
6,α3 = − 2√
6
) − l0(α1 = α2 = α3 = 1√
3
)l0
(α1 = α2 = α3 = 1√
3
) . (2)
224410-11098-0121/2012/86(22)/224410(6) ©2012 American Physical Society
YANNING ZHANG, HUI WANG, AND RUQIAN WU PHYSICAL REVIEW B 86, 224410 (2012)
-0.02 -0.01 0.00 0.01 0.02
0
50
100
150
200
250
Eto
t(m
eV)
Fe93.75
Al6.25
111= - 7.76 ppm
EM
CA
(meV
)
-0.4
-0.2
0.0
0.2
0.4Fe93.75Al6.25
111 = -7.8 ppm[111][100]
-1-2 0 1 2
(%)
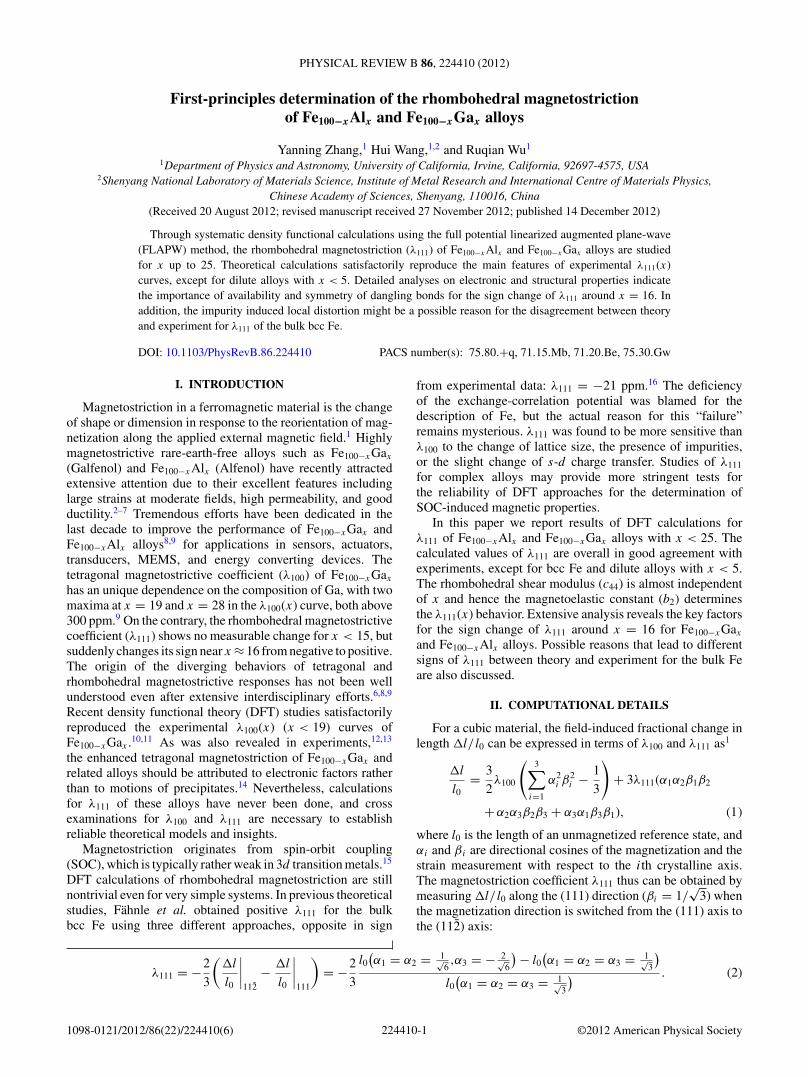
FIG. 1. (Color online) Calculated strain dependencies of Etot
(black open squares) and EMCA (blue/gray open circles) ofFe93.75Al6.25. The inset is the atomic model used in the presentcalculations. Blue (dark gray) and red (light gray) balls representthe Fe and Al atoms, respectively.
In the present DFT calculations we applied rhombohedralstrains [ε = (l − l0)/l0] along the (111) direction of the cubicunit cell in the constant-volume mode (i.e., ε112 = −ε111/2 =−ε/2) and calculated the strain dependencies of magnetocrys-talline anisotropy (EMCA = E111 − E112) and total energy(Etot). The rhombohedral magnetostrictive coefficient λ111 canbe directly calculated through the following equation:16
λ111 = 2dEMCA/dε
3d2Etot/dε2= − b2
3c44. (3)
Here b2 (= − 23V
dEMCAdε
in the present deformation mode, and
V is the volume of the unit cell) and c44 (= 13V
d2Etotdε2 ) are the
magnetoelastic and elastic stiffness constants, respectively.We employed the highly precise full potential linearized
augmented plane-wave (FLAPW) method that has no shapeapproximation for charge, potential, and wave functionexpansions.17 The spin-polarized generalized gradient
approximation (GGA) was used for the description of theexchange-correlation interaction among electrons.18 Thecore electrons were treated fully relativistically, while thespin-orbit coupling term was invoked second variationallyfor the valence states. Energy cutoffs of 225 and 16 Ry werechosen for the plane-wave expansions of charge potential andbasis in the interstitial region, respectively. In the muffin-tinregion (rFe = 1.20 A, rAl = 1.06 A, and rGa = 1.22 A), charge,potential, and basis functions were expanded in terms ofspherical harmonics with a maximum angular momentum oflmax = 8. Electronic self-consistence was assumed when theroot-mean-square differences between the input and outputcharge and spin densities are less than 1.0 × 10⁻⁴ e/(a.u.).3
The values of EMCA were calculated through the torqueapproach.15 Numerical convergence of all physical properties,particularly EMCA, against the number of k points in theBrillouin zone (BZ) was carefully monitored.
For the comparability we used identical 16-atom supercellsas for the determination of tetragonal magnetostriction ofFe100−xGax alloys at x = 6.25, 12.5, and 18.75 in our previouswork.10 In these configurations, different numbers of Al orGa atoms were placed in the bcc lattices without Al or Gafirst neighborhood, and the cubic symmetry of supercells wasreserved (cf. the insets of Fig. 2 in Ref. 10 for details).For cases of x = 1.85 and 8.33 we placed metalloid atomsin larger supercells with either 54 or 24 atoms. For alloyswith high Al/Ga concentrations, both B2 and D03 structureswere examined, and the more stable D03 structure was usedfor studies of physical properties of Fe75Al25. Nevertheless,D03 structure was found to be unstable for Fe75Ga25 andwe thereby limited our studies for Fe100−xGax with x < 19.Atomic positions were optimized according to the energyminimization procedure with a requirement that force on eachatom becomes smaller than 2.0 × 10⁻³ a.u.
III. RESULTS AND DISCUSSIONS
Using the approach mentioned above, we calculated λ111
for each concentration of Fe100−xAlx (x � 25) and Fe100−xGax
0 5 10 15 20 25
-20
0
20
40
60
cal. exp.
λ 111 (
ppm
)
x
Fe100-x
Alx(a) Fe100-xAlx
0 5 10 15 20
-20
0
20
40
60Fe
100-xGa
x
cal. exp.
λ 111 (
ppm
)
x
(b) Fe100-xGax
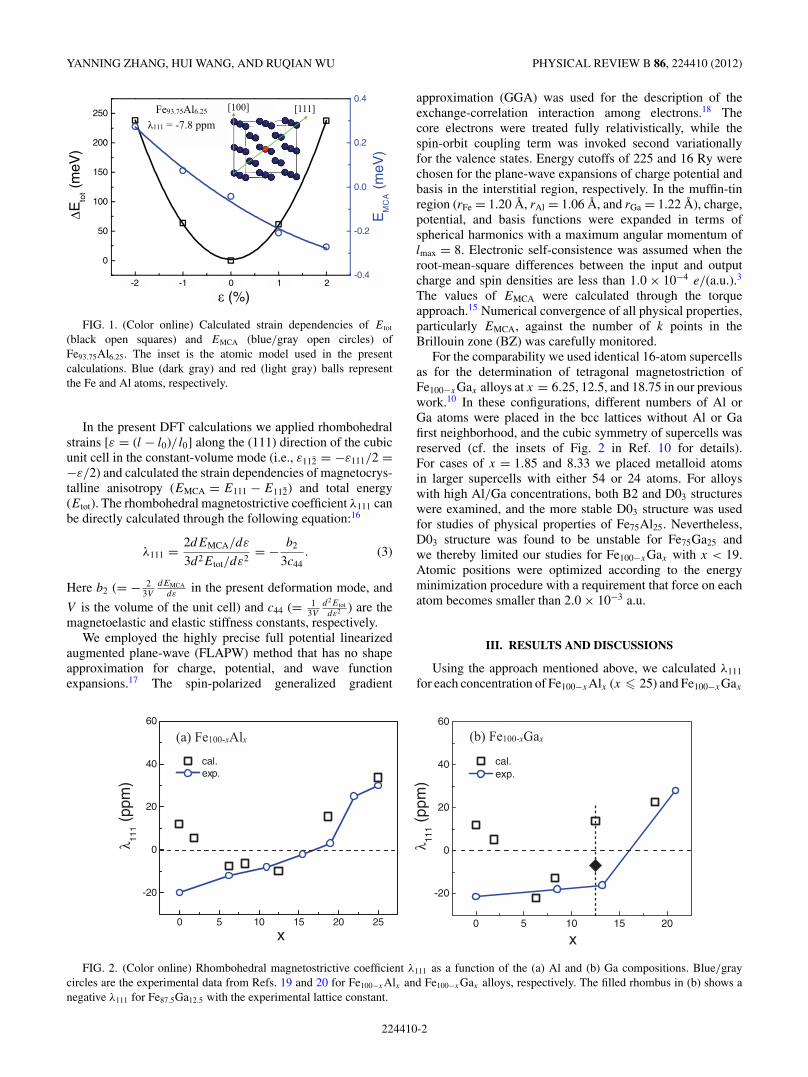
FIG. 2. (Color online) Rhombohedral magnetostrictive coefficient λ111 as a function of the (a) Al and (b) Ga compositions. Blue/graycircles are the experimental data from Refs. 19 and 20 for Fe100−xAlx and Fe100−xGax alloys, respectively. The filled rhombus in (b) shows anegative λ111 for Fe87.5Ga12.5 with the experimental lattice constant.
224410-2
FIRST-PRINCIPLES DETERMINATION OF THE . . . PHYSICAL REVIEW B 86, 224410 (2012)
alloys (x < 19). Taking Fe93.75Al6.25 as an example, the ε
dependencies of EMCA and Etot are shown in Fig. 1 in arange of − 2% < ε < 2%. Clearly both quantities are smoothfunctions of ε, indicating the high quality of our theoreticaldata. By fitting the Etot(ε) and EMCA(ε) curves, we obtained114 GPa for c44 and 2.66 MJ/m3 (or equivalently 2.66 MPa)for b2, respectively. According to Eq. (3), the calculated λ111
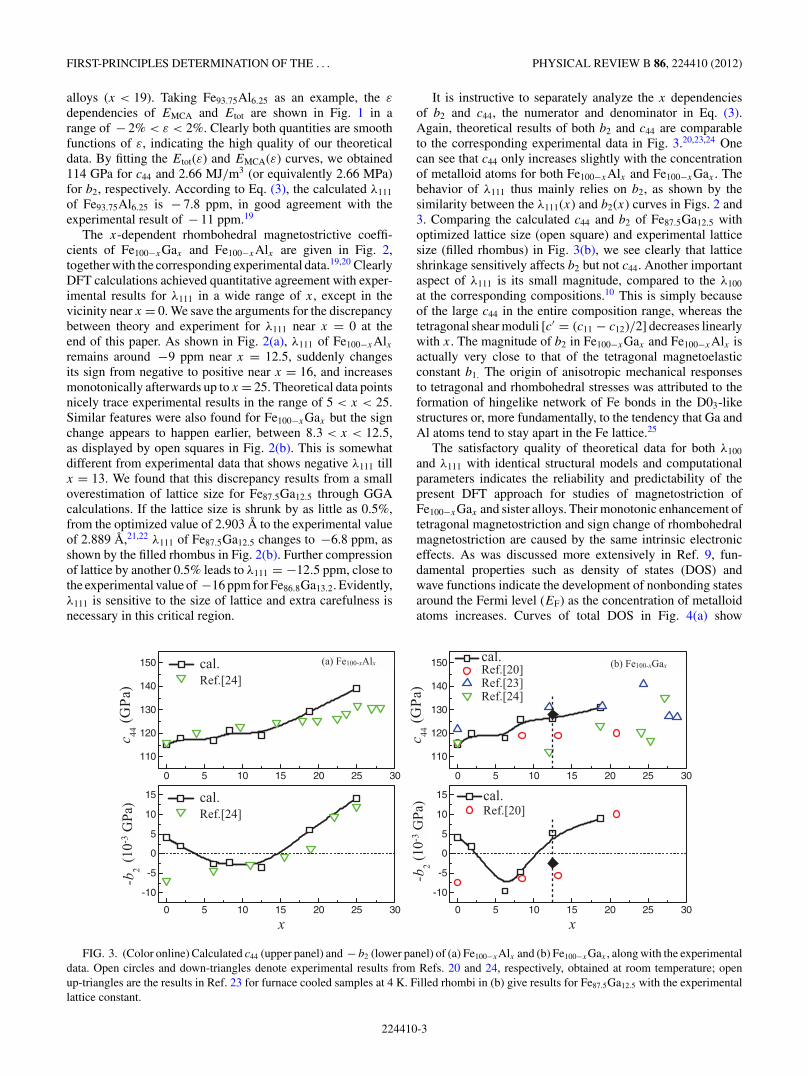
of Fe93.75Al6.25 is − 7.8 ppm, in good agreement with theexperimental result of − 11 ppm.19
The x-dependent rhombohedral magnetostrictive coeffi-cients of Fe100−xGax and Fe100−xAlx are given in Fig. 2,together with the corresponding experimental data.19,20 ClearlyDFT calculations achieved quantitative agreement with exper-imental results for λ111 in a wide range of x, except in thevicinity near x = 0. We save the arguments for the discrepancybetween theory and experiment for λ111 near x = 0 at theend of this paper. As shown in Fig. 2(a), λ111 of Fe100−xAlxremains around −9 ppm near x = 12.5, suddenly changesits sign from negative to positive near x = 16, and increasesmonotonically afterwards up to x = 25. Theoretical data pointsnicely trace experimental results in the range of 5 < x < 25.Similar features were also found for Fe100−xGax but the signchange appears to happen earlier, between 8.3 < x < 12.5,as displayed by open squares in Fig. 2(b). This is somewhatdifferent from experimental data that shows negative λ111 tillx = 13. We found that this discrepancy results from a smalloverestimation of lattice size for Fe87.5Ga12.5 through GGAcalculations. If the lattice size is shrunk by as little as 0.5%,from the optimized value of 2.903 A to the experimental valueof 2.889 A,21,22 λ111 of Fe87.5Ga12.5 changes to −6.8 ppm, asshown by the filled rhombus in Fig. 2(b). Further compressionof lattice by another 0.5% leads to λ111 = −12.5 ppm, close tothe experimental value of −16 ppm for Fe86.8Ga13.2. Evidently,λ111 is sensitive to the size of lattice and extra carefulness isnecessary in this critical region.
It is instructive to separately analyze the x dependenciesof b2 and c44, the numerator and denominator in Eq. (3).Again, theoretical results of both b2 and c44 are comparableto the corresponding experimental data in Fig. 3.20,23,24 Onecan see that c44 only increases slightly with the concentrationof metalloid atoms for both Fe100−xAlx and Fe100−xGax . Thebehavior of λ111 thus mainly relies on b2, as shown by thesimilarity between the λ111(x) and b2(x) curves in Figs. 2 and3. Comparing the calculated c44 and b2 of Fe87.5Ga12.5 withoptimized lattice size (open square) and experimental latticesize (filled rhombus) in Fig. 3(b), we see clearly that latticeshrinkage sensitively affects b2 but not c44. Another importantaspect of λ111 is its small magnitude, compared to the λ100
at the corresponding compositions.10 This is simply becauseof the large c44 in the entire composition range, whereas thetetragonal shear moduli [c′ = (c11 − c12)/2] decreases linearlywith x. The magnitude of b2 in Fe100−xGax and Fe100−xAlx isactually very close to that of the tetragonal magnetoelasticconstant b1. The origin of anisotropic mechanical responsesto tetragonal and rhombohedral stresses was attributed to theformation of hingelike network of Fe bonds in the D03-likestructures or, more fundamentally, to the tendency that Ga andAl atoms tend to stay apart in the Fe lattice.25
The satisfactory quality of theoretical data for both λ100
and λ111 with identical structural models and computationalparameters indicates the reliability and predictability of thepresent DFT approach for studies of magnetostriction ofFe100−xGax and sister alloys. Their monotonic enhancement oftetragonal magnetostriction and sign change of rhombohedralmagnetostriction are caused by the same intrinsic electroniceffects. As was discussed more extensively in Ref. 9, fun-damental properties such as density of states (DOS) andwave functions indicate the development of nonbonding statesaround the Fermi level (EF) as the concentration of metalloidatoms increases. Curves of total DOS in Fig. 4(a) show
0 5 10 15 20 25 30
110
120
130
140
150
c 44 (G
Pa)
0 5 10 15 20 25 30
-10
-5
0
5
10
15
-b2 (M
J/m
3 )
x
(a) Fe100-xAlx
0 5 10 15 20 25 30
110
120
130
140
150
c 44 (G
Pa)
0 5 10 15 20 25 30
-10
-5
0
5
10
15
-b2 (M
J/m
3 )
x
(b) Fe100-xGaxcal.Ref.[24]
cal.
Ref.[24]Ref.[23]Ref.[20]
cal.Ref.[24]
cal.Ref.[20]
(10-3
GPa
)
(10-3
GPa
)
FIG. 3. (Color online) Calculated c44 (upper panel) and − b2 (lower panel) of (a) Fe100−xAlx and (b) Fe100−xGax , along with the experimentaldata. Open circles and down-triangles denote experimental results from Refs. 20 and 24, respectively, obtained at room temperature; openup-triangles are the results in Ref. 23 for furnace cooled samples at 4 K. Filled rhombi in (b) give results for Fe87.5Ga12.5 with the experimentallattice constant.
224410-3
YANNING ZHANG, HUI WANG, AND RUQIAN WU PHYSICAL REVIEW B 86, 224410 (2012)
(a)
(d)
Fe81.25Al18.75 Fe87.5Al12.5
(c)
0.0 0.1 0.2 0.3-0.4
-0.2
0.0
0.2
0.4
ε = 0 ε = -2% ε = +2%
E MC
A (m
eV)
kz (a.u.)
Fe87.5Al12.5
(b)
0.00 0.05 0.10 0.15-0.4
-0.2
0.0
0.2
0.4
ε = 0 ε = -2% ε = +2%
E MC
A (m
eV)
kz (a.u.)
Fe81.25Al18.75
(d) (c)
-0
0
0
0
E MC
A(m
eV)
[1 -1 0]
[111]
-4 -2 0 2
-2
-1
0
1
2D
OS
(st
ates
/eV
. ato
m. s
pin)
Energy (eV)
Fe87.5
Al12.5
Fe81.25
Al18.75
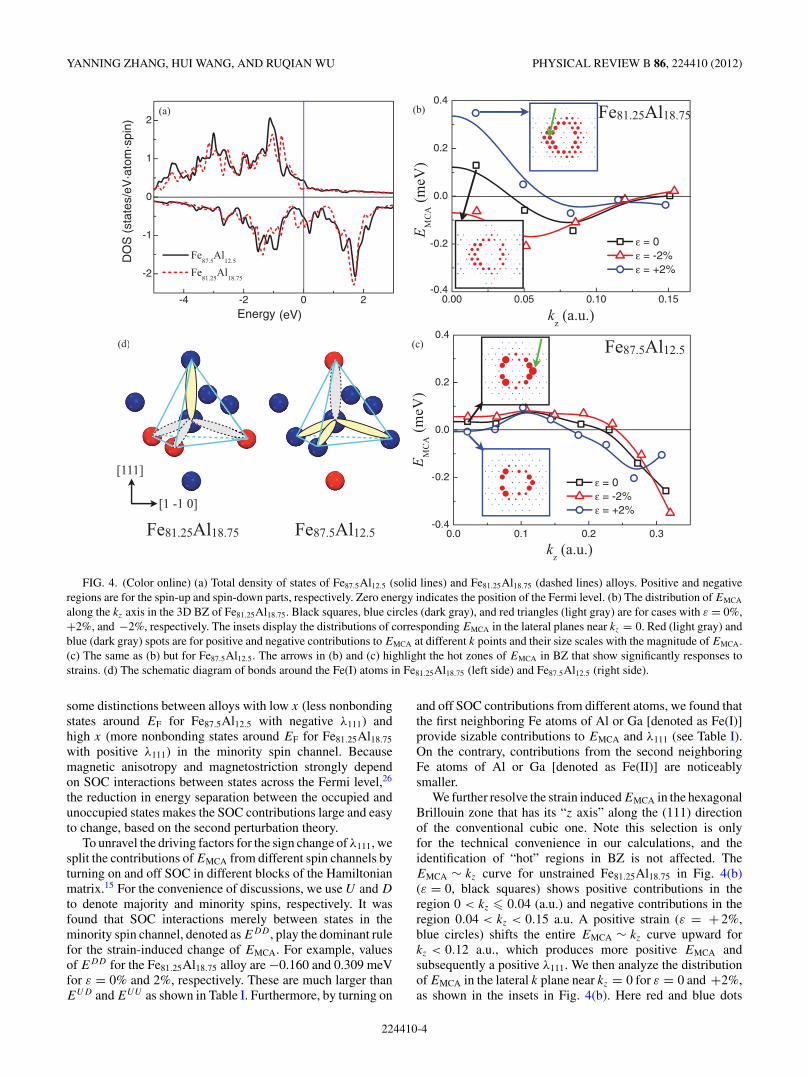
FIG. 4. (Color online) (a) Total density of states of Fe87.5Al12.5 (solid lines) and Fe81.25Al18.75 (dashed lines) alloys. Positive and negativeregions are for the spin-up and spin-down parts, respectively. Zero energy indicates the position of the Fermi level. (b) The distribution of EMCA
along the kz axis in the 3D BZ of Fe81.25Al18.75. Black squares, blue circles (dark gray), and red triangles (light gray) are for cases with ε = 0%,+2%, and −2%, respectively. The insets display the distributions of corresponding EMCA in the lateral planes near kz = 0. Red (light gray) andblue (dark gray) spots are for positive and negative contributions to EMCA at different k points and their size scales with the magnitude of EMCA.(c) The same as (b) but for Fe87.5Al12.5. The arrows in (b) and (c) highlight the hot zones of EMCA in BZ that show significantly responses tostrains. (d) The schematic diagram of bonds around the Fe(I) atoms in Fe81.25Al18.75 (left side) and Fe87.5Al12.5 (right side).
some distinctions between alloys with low x (less nonbondingstates around EF for Fe87.5Al12.5 with negative λ111) andhigh x (more nonbonding states around EF for Fe81.25Al18.75
with positive λ111) in the minority spin channel. Becausemagnetic anisotropy and magnetostriction strongly dependon SOC interactions between states across the Fermi level,26
the reduction in energy separation between the occupied andunoccupied states makes the SOC contributions large and easyto change, based on the second perturbation theory.
To unravel the driving factors for the sign change of λ111, wesplit the contributions of EMCA from different spin channels byturning on and off SOC in different blocks of the Hamiltonianmatrix.15 For the convenience of discussions, we use U and D
to denote majority and minority spins, respectively. It wasfound that SOC interactions merely between states in theminority spin channel, denoted as EDD , play the dominant rulefor the strain-induced change of EMCA. For example, valuesof EDD for the Fe81.25Al18.75 alloy are −0.160 and 0.309 meVfor ε = 0% and 2%, respectively. These are much larger thanEUD and EUU as shown in Table I. Furthermore, by turning on
and off SOC contributions from different atoms, we found thatthe first neighboring Fe atoms of Al or Ga [denoted as Fe(I)]provide sizable contributions to EMCA and λ111 (see Table I).On the contrary, contributions from the second neighboringFe atoms of Al or Ga [denoted as Fe(II)] are noticeablysmaller.
We further resolve the strain induced EMCA in the hexagonalBrillouin zone that has its “z axis” along the (111) directionof the conventional cubic one. Note this selection is onlyfor the technical convenience in our calculations, and theidentification of “hot” regions in BZ is not affected. TheEMCA ∼ kz curve for unstrained Fe81.25Al18.75 in Fig. 4(b)(ε = 0, black squares) shows positive contributions in theregion 0 < kz � 0.04 (a.u.) and negative contributions in theregion 0.04 < kz < 0.15 a.u. A positive strain (ε = + 2%,blue circles) shifts the entire EMCA ∼ kz curve upward forkz < 0.12 a.u., which produces more positive EMCA andsubsequently a positive λ111. We then analyze the distributionof EMCA in the lateral k plane near kz = 0 for ε = 0 and +2%,as shown in the insets in Fig. 4(b). Here red and blue dots
224410-4
FIRST-PRINCIPLES DETERMINATION OF THE . . . PHYSICAL REVIEW B 86, 224410 (2012)
TABLE I. Contributions to EMCA (meV) from spin-orbit couplings between different spin blocks and two types of Fe atoms in Fe81.25Al18.75
under 0% and +2% strains (ε) along the (111) direction. Here U and D denote majority spin and minority spin states involved in the SOCinteractions, respectively.
ε DD UD UU Fe(I) Fe(II) EMCA(tot)
0% −0.160 −0.049 0.033 0.151 −0.008 −0.1802% 0.309 0.183 0.101 0.303 0.109 0.552
represent positive and negative EMCA; and their size scales withthe magnitude of EMCA at each k point. The most pronouncedfeatures in both insets are the rings of red dots around thecenter of BZ, as highlighted by the arrow in Fig. 4(b). It isobvious that both the number and size of red dots increasewhen a +2% strain is applied along the (111) axis. Thisleads to more positive EMCA near kz = 0, as displayed bythe EMCA ∼ kz curve. On the contrary, the magnetostrictiveresponse of Fe87.5Al12.5 is less pronounced near kz = 0 due toless availability of dangling bonds, as displayed in Fig. 4(c).The shrinkage of the ring of red dots in the insets in Fig. 4(c)indicates that a +2% strain reduces positive contributionsto EMCA. In fact, this occurs almost in the entire range ofkz, except in regions around kz = 0.1 a.u. and kz > 0.3 a.u.Accordingly, this explains why Fe87.5Al12.5 has a negative λ111.
Now we may focus on band features around the hotzones in BZ to identify the key electronic states that areresponsible for the sign change of λ111. Analyses in bothreal and reciprocal spaces reveal the importance of danglingbonds around Fe(I), as depicted by the dashed ellipses in theschematic bond diagrams in Fig. 4(d). In Fe81.25Al18.75, Fe(I)atoms take the centers of tetrahedra formed by three Al atomsand one Fe atom. As a result, three bonds around this Fe(I)atom are broken and one bond along the (111) direction isstrengthened. The SOC interaction between these nonbondingstates contributes to positive EMCA since they have the samemagnetic quantum number around the z axis. In contrast, thedangling bond around the Fe(I) atom in Fe87.5Al12.5 is alongthe (111) direction so the magnetic quantum number is zeroaround the z axis. As a result, this state does not directlycontribute to EMCA.
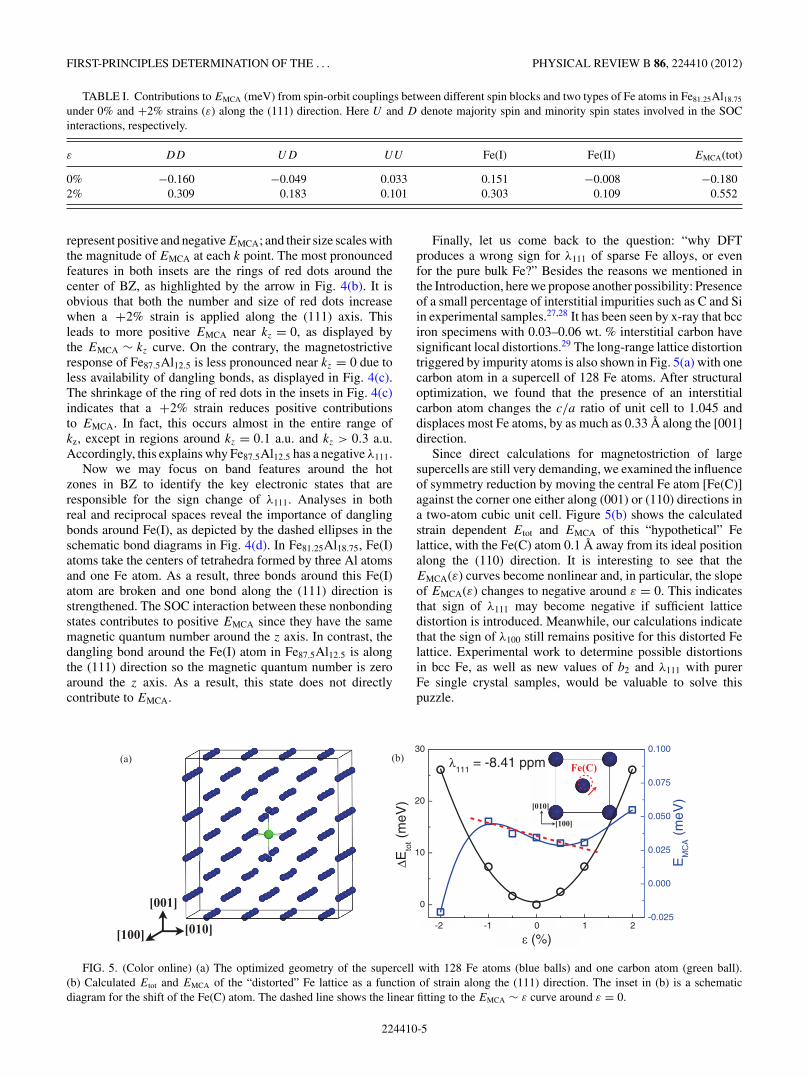
Finally, let us come back to the question: “why DFTproduces a wrong sign for λ111 of sparse Fe alloys, or evenfor the pure bulk Fe?” Besides the reasons we mentioned inthe Introduction, here we propose another possibility: Presenceof a small percentage of interstitial impurities such as C and Siin experimental samples.27,28 It has been seen by x-ray that bcciron specimens with 0.03–0.06 wt. % interstitial carbon havesignificant local distortions.29 The long-range lattice distortiontriggered by impurity atoms is also shown in Fig. 5(a) with onecarbon atom in a supercell of 128 Fe atoms. After structuraloptimization, we found that the presence of an interstitialcarbon atom changes the c/a ratio of unit cell to 1.045 anddisplaces most Fe atoms, by as much as 0.33 A along the [001]direction.
Since direct calculations for magnetostriction of largesupercells are still very demanding, we examined the influenceof symmetry reduction by moving the central Fe atom [Fe(C)]against the corner one either along (001) or (110) directions ina two-atom cubic unit cell. Figure 5(b) shows the calculatedstrain dependent Etot and EMCA of this “hypothetical” Felattice, with the Fe(C) atom 0.1 A away from its ideal positionalong the (110) direction. It is interesting to see that theEMCA(ε) curves become nonlinear and, in particular, the slopeof EMCA(ε) changes to negative around ε = 0. This indicatesthat sign of λ111 may become negative if sufficient latticedistortion is introduced. Meanwhile, our calculations indicatethat the sign of λ100 still remains positive for this distorted Felattice. Experimental work to determine possible distortionsin bcc Fe, as well as new values of b2 and λ111 with purerFe single crystal samples, would be valuable to solve thispuzzle.
(a)
[010]
[001]
[100]
Fe(C)
[100]
[010]
(b)
-0.02 -0.01 0.00 0.01 0.02
0
10
20
30
-0.025
0.000
0.025
0.050
0.075
0.100
ΔEto
t (m
eV)
EM
CA (
meV
)
ε
λ111
= -8.41 ppm
-2 -1 0 1 2
ε (%)
FIG. 5. (Color online) (a) The optimized geometry of the supercell with 128 Fe atoms (blue balls) and one carbon atom (green ball).(b) Calculated Etot and EMCA of the “distorted” Fe lattice as a function of strain along the (111) direction. The inset in (b) is a schematicdiagram for the shift of the Fe(C) atom. The dashed line shows the linear fitting to the EMCA ∼ ε curve around ε = 0.
224410-5
YANNING ZHANG, HUI WANG, AND RUQIAN WU PHYSICAL REVIEW B 86, 224410 (2012)
IV. CONCLUSIONS
In summary, we performed systematic DFT calculationsfor the rhombohedral magnetostrictive coefficient λ111 ofFe100−xGax and Fe100−xAlx alloys with x < 25. The calculatedλ111 are in consistent with experiments in a wide range ofx, except in the vicinity near x = 0. The diagonal shearmodulus c44 remains large in the entire range of x, so themagnitude of λ111 is small and the behavior of λ111(x) curvesmainly relies on b2 for both Fe100−xAlx and Fe100−xGax alloys.Analyses on the fundamental electronic properties show thatthe availability and local symmetry of nonbonding states nearthe Fermi level play an important role in determining the signof λ111. Moreover, the sign difference between experimentand theory for λ111 of the bulk Fe may not result from
deficiencies of approximate exchange-correlation functionals,but from a small atomic displacement due to the presence ofimpurities. Good agreements for both tetragonal and rhom-bohedral magnetostrictive behaviors in a broad compositionrange indicate the validity and predictability of the presenttheory and structural models for studies of magnetostriction oftransition metal alloys.
ACKNOWLEDGMENTS
The authors thank Dr. A.E. Clark, Dr. K.B. Hathaway,and Dr. M. Wun-Fogle for insightful discussions. Workwas supported by the ONR (Grant No: N00014-11-1-0144).Calculations were performed on the DoD supercomputers.
1A. E. Clark and K. B. Hathaway, Handbook of Giant Magnetostric-tive Materials, edited by G. Engdahl (Academic, San Diego, 2000),Chap. 1, pp. 1–48.
2A. E. Clark, J. B. Restorff, M. Wun-Fogle, T. A. Lograsso, andD. L. Schlagel, IEEE Trans. Magn. 36, 3238 (2000).
3A. E. Clark, M. Wun-Fogle, J. B. Restorff, T. A. Lograsso, andJ. R. Cullen, IEEE Trans. Magn. 37, 2678 (2001).
4J. R. Cullen, A. E. Clark, M. Wun-Fogle, J. B. Restorff, and T. A.Lograsso, J. Magn. Magn. Mater. 226-230, 948 (2001).
5R. Q. Wu, J. Appl. Phys. 91, 7358 (2002).6E. M. Summers, T. A. Lograsso, and M. Wun-Fogle, J. Mater. Sci.42, 9582 (2007).
7Q. Xing, Y. Du, R. J. McQueeney, and T. A. Lograsso, Acta. Mater.56, 4536 (2008).
8J. Atulasimha and A. B. Flatau, Smart Mater. Struct. 20, 043001(2011).
9G. Petculescu, R. Q. Wu, and R. McQueeney, Handbook ofMagnetic Materials, edited by K. H. J. Buschow (Elsevier, NewYork, 2012), Vol. 20, Chap. 3, pp. 123-223.
10Y. N. Zhang, J. X. Cao, and R. Q. Wu, Appl. Phys. Lett. 96, 062508(2010).
11Y. N. Zhang and R. Q. Wu, IEEE Trans. Magn. 47, 4044 (2011).12Q. Xing and T. A. Lograsso, Appl. Phys. Lett. 93, 182501 (2008).13Y. Du, M. Huang, T. A. Lograsso, and R. J. McQueeney, Phys. Rev.
B 85, 214437 (2012).14A. G. Khachaturyan and D. Viehland, Metall. Mater. Trans. A 38,
2317 (2007).15R. Q. Wu and A. J. Freeman, J. Magn. Magn. Mater. 200, 498
(1999).
16M. Fahnle, M. Komelj, R. Q. Wu, and G. Y. Guo, Phys. Rev. B 65,144436 (2002).
17E. Wimmer, H. Krakauer, M. Weinert, and A. J. Freeman, Phys.Rev. B 24, 864 (1981); M. Weinert, E. Wimmer, and A. J. Freeman,ibid. 26, 4571 (1982).
18J. P. Perdew, K. Burke, and M. Ernzerhof, Phys. Rev. Lett. 77, 3865(1996).
19R. C. Hall, J. Appl. Phys. 30, 816 (1959).20A. E. Clark, K. B. Hathaway, M. Wun-Fogle, J. B. Restorff, T. A.
Lograsso, V. M. Keppens, G. Petculescu, and R. A. Taylor, J. Appl.Phys. 93, 8621 (2003).
21N. Srisukhumbowornchai and S. Guruswamy, J. Appl. Phys. 90,5680 (2001).
22H. Okamoto, Bull. Alloy Phase Diagrams 11, 576(1990).
23G. Petculescu, K. B. Hathaway, T. A. Lograsso,M. Wun-Fogle, and A. E. Clark, J. Appl. Phys. 97, 10M315(2005).
24H. M. Schurter, M.S. thesis, University of Maryland, 2009.25Y. N. Zhang, R. Q. Wu, H. M. Schurter, and A. B. Flatau, J. Appl.
Phys. 108, 023513 (2010).26D. S. Wang, R. Q. Wu, and A. J. Freeman, Phys. Rev. B 47, 14932
(1993).27M. Onink, C. M. Brakman, F. D. Tichelaar, E. J. Mittemeijer,
S. van der Zwaag, J. H. Root, and N. B. Konyer, Scr. Metall. Mater.29, 1011 (1993).
28C. Wert, Acta Matellurgica 2, 361 (1954).29G. K. Williamson and R. E. Smallman, Acta Crystallogr. 6, 361
(1953).
224410-6