Embed Size (px)
Citation preview

First Quarter 2012 Report to Shareholders
BMO Financial Group Reports Very Strong Results, with First Quarter Net Income of $1.1 Billion, an
increase of 34% Year over Year
Financial Results Highlights1:
Net income of $1,109 million, up $284 million or 34% from a year ago
Adjusted net income2 of $972 million, up $155 million or 19% from a year ago
Reported EPS3 of $1.63, up 22% from a year ago
Adjusted EPS2,3 of $1.42, up 7.6% from a year ago
Reported ROE of 17.2%, compared with 17.8% a year ago
Adjusted ROE2 of 15.0%, compared with 17.6% a year ago
Provisions for credit losses of $141 million, down $182 million from a year ago; good performance across portfolios, including significant
recoveries
Common Equity Ratio remains strong at 9.65%, using a Basel II approach
Toronto, February 28, 2012 – For the first quarter ended January 31, 2012, BMO Financial Group reported net income of $1,109 million or $1.63 per share. On an adjusted basis, net income was $972 million or $1.42 per share.
"BMO produced record results for the quarter," said Bill Downe, President and Chief Executive Officer, BMO Financial Group. "Our focus on customers and investing wisely in the business are serving us well, and this is reflected in our results and the momentum of the bank. Each of our businesses is well-positioned and our balance sheet is strong – a source of confidence for our customers.
1 Effective this quarter, BMO’s consolidated financial statements and this accompanying Interim Management’s Discussion and Analysis (MD&A) are prepared in accordance with International Financial Reporting
Standards (IFRS), as described in Note 1 to the unaudited interim consolidated financial statements. Amounts in respect of comparative periods for 2011 have been restated to conform to the current
presentation. References to GAAP mean IFRS, unless indicated otherwise.
2 Results and measures in this document are presented on a GAAP basis. They are also presented on an adjusted basis that excludes the impact of certain items. Items excluded from first quarter 2012 results in the determination of adjusted results totalled $137 million after tax, comprised of a $114 million after-tax net benefit of credit-related items in respect of the acquired Marshall & Ilsley Corporation (M&I) performing loan portfolio; costs of $70 million ($43 million after tax) for the integration of the acquired business; a $34 million ($24 million after tax) charge for amortization of acquisition-related intangible assets on all acquisitions; the benefit of run-off structured credit activities of $136 million ($136 million after tax); and a restructuring charge of $68 million ($46 million after tax) to align BMO Capital Markets’ cost structure with the current and future business environment. All of the adjusting items are reflected in results of Corporate Services except for the amortization of acquisition-related intangible assets, which is charged across the operating groups. Management assesses performance on both a GAAP basis and adjusted basis and considers both bases to be useful in assessing underlying, ongoing business performance. Presenting results on both bases provides readers with an enhanced understanding of how management views results and may enhance readers’ analysis of performance. Adjusted results and measures are non-GAAP and are detailed in the Adjusted Net Income section, and (for all reported periods) in the Non-GAAP Measures section of the MD&A, where such non-GAAP measures and their closest GAAP counterparts are disclosed.
3 All Earnings per Share (EPS) measures in this document refer to diluted EPS unless specified otherwise. Earnings per share is calculated using net income after deductions for net income attributable to non-controlling interest in subsidiaries and preferred share dividends.

BMO Financial Group First Quarter Report 2012 1
“The integration of Marshall & Ilsley is on track. A lot has already been done as we stay focused on living up to our reputation for treating customers extremely well and ensuring our new customers can draw on the strengths and the abilities of the whole company. The combination of the two banks has created a competitive platform from which to grow our Personal and Commercial and Wealth businesses in the U.S. While the largest of the platform conversions will not take place until the end of the year, we are pleased with the synergies obtained to date, reflecting the work of a focused and capable integration team.
“All that we undertake is aimed at helping our customers make sense of complexity – and succeed. Prioritizing investments in what we believe our customers value most is consistent with our brand promise and works hand in hand with improved efficiency. We are certain that there is abundant opportunity to enhance customer experience and improve the bottom line. There can be no compromise when it comes to the importance of customers, and our success as a business depends entirely on their success. Our relentless pursuit of customer advocacy is enabled by disciplined management of our cost base. Improving the bank’s productivity is an area of broad focus and the entire organization is participating in this effort. As part of this focus, our results this quarter reflect a $46 million charge for restructuring in our Capital Markets business. Innovation and productivity are themes we are stressing with our customers and believe will be important contributors to North American competitiveness.
“We are confirming our confidence in business growth in Canada and the United States by committing to increase the credit we make available to small and medium-size enterprises so they, in turn, can innovate, expand and create jobs. For consumers, especially homebuyers, we are actively encouraging them to borrow smartly by considering a mortgage with a shorter amortization period. Our five-year low-rate mortgage, which carries a maximum amortization of twenty five years, was recognized as 2011 Mortgage of the Year by Canadian Mortgage Trends.
“Overall, we believe that the recovery that is underway in the United States will lead to gradually more favourable economic and market conditions throughout North America. Our businesses, customers and shareholders all stand to benefit from this.
“Enhancing risk management practices and ensuring strong capitalization continue to be priorities for BMO and within the financial services industry. We have been active in many areas related to this over the last few months, ensuring we are attentive to risk in all our portfolios. Actions undertaken this quarter included the introduction of the Basel 2.5 Market Risk Amendment capital changes, the filing of the BMO Recovery Plan in Canada and the filing of our Capital Plan Review submission for BMO Financial Corp. and BMO Harris Bank, N.A. with U.S. regulators. Our Basel III pro-forma Common Equity Ratio was 7.2%,” concluded Mr. Downe.
Concurrent with the release of results, BMO announced a second quarter dividend of $0.70 per common share, unchanged from the preceding quarter and equivalent to an annual dividend of $2.80 per common share.

2 BMO Financial Group First Quarter Report 2012
Operating Segment Overview
P&C Canada
Net income was $446 million, down $31 million or 6.7% from strong results a year ago. Results a year ago benefited from a securities gain. On a basis that adjusts reported results to reflect provisions on an actual loss basis and excludes the securities gain, net income decreased $5 million or 1.2%from a year ago. Results reflect the combination of higher volumes across most products and lower net interest margins. Net income was up $7 million from the fourth quarter. On a basis that adjusts reported results to reflect provisions on an actual loss basis, net income increased $23 million or 5.4%. Frequently reminding our customers that BMO is open for business, we continue to focus on making money make sense through innovative products and investments in our multichannel capabilities. We received the Mortgage of the Year award for 2011 from Canadian Mortgage Trends. The award recognizes the mortgage product that has provided the greatest innovation, flexibility and/or cost savings to homeowners. In addition, Keynote Competitive Research, the competitive research group of Keynote Systems, awarded our bmo.com public website Best Overall Customer Experience, placing first in Brand Impact and Customer Satisfaction in 2011. Our customers are increasingly using our mobile banking services including our ‘Tap and Go’ and email notices features. In personal banking, we continue to invest in our branch network and technology. We expanded our video conferencing service to over 50 locations across Canada, allowing our customers to connect personally with financial planners. We launched a new and innovative tool that provides us with leads across multiple channels based on the customer profile to help meet our customers’ needs. The new tool streamlines the process of discussing and fulfilling the financial needs of our customers. In commercial banking, we continued to rank #2 in Canadian business banking loan market share, and late in the quarter, we announced our plan to make available loans totalling up to $10 billion to Canadian businesses over the course of the next three years to help them boost productivity and expand into new markets. We continued to enhance our industry-leading online banking for business platform to make it easier for customers to manage their money. Customers can now choose to receive text or email alerts when specified transactions occur or certain balance levels are reached. We have also redesigned the electronic funds transfer system to make it easier for customers to manage their payments, and content available through this channel is now customizable based on customer preferences and needs. We continued to grow our cash management work force, increasing it by approximately 20% from the fourth quarter. In addition, we added small business bankers and now have almost 200 across the country. Our goal is to become the bank of choice for businesses across Canada by providing the knowledge, advice and guidance that our customers value.
P&C U.S. (all amounts in US$)
Net income of $135 million increased $81 million from the first quarter a year ago. Adjusted net income, which adjusts for the amortization of acquisition-related intangible assets, was $152 million, up $93 million from a year ago, with the acquired Marshall & Ilsley Corporation business contributing $89 million. Adjusted net income decreased $19 million from the fourth quarter due to lower net interest income, lower interchange
revenues, as expected, and a higher provision for credit losses under BMO’s expected loss provisioning methodology. Delivering on our commitments to customers and realizing the growth potential of the bank’s U.S. franchise is a clear priority. As a bank, we speak regionally and at the same time have the advantage of a respected, visible North American brand and infrastructure. We are deliberate in the way we manage our North-South capabilities; this enables us to invest once and touch many more customers with each investment. We recently announced the launch of our new suite of BMO Harris Bank credit cards. These new products exemplify the way we are leveraging the respective strengths of Harris and the acquired M&I operations to bring more to our customers. The products are competitive and offer a choice from an attractive suite of credit cards that provides solutions to meet the unique needs of our customers. Since the launch, we have issued nearly 7,000 credit cards, with thousands of additional applications in the pipeline. During the quarter, we continued to implement our integration plan by rebranding 237 legacy locations in Illinois and Northwest Indiana as BMO Harris Bank. The introduction of the new name and the addition of the blue colour into our offices and materials are important steps in our overall integration plan. BMO Harris Bank recently became a participating member in Welcome Home Heroes, a new program offered by the Illinois Housing Development Authority that provides Illinois military families a comprehensive financing package to help them achieve the dream of home ownership. During the quarter, BMO Harris Bank was awarded 15 Affordable Housing Program projects by the Federal Loan Bank of Chicago. These projects allow us to support our communities through the development of affordable housing, and can provide opportunities to cross-sell our products and services.
Private Client Group
Net income was $105 million, down $39 million or 28% from a year ago. We experienced an approximately $56 million net income decline due to year-over-year unfavourable movements in long-term interest rates that impacted our insurance business results. This decline resulted from the after-tax effect of unfavourable movements in long-term interest rates of approximately $47 million in the current quarter and the favourable effect of approximately $9 million a year ago. On a basis that excludes this interest rate impact, PCG net income increased $17 million or 12% from a year ago. Net income in PCG excluding insurance was $93 million, up 27% from a year ago. Higher revenues from our acquisitions and higher than usual asset management revenues from a strategic investment were partly offset by lower brokerage revenues as a result of challenging equity market conditions. Compared to the fourth quarter, net income was down $32 million or 24%. We experienced an approximately $28 million net income decline due to quarter-over-quarter unfavourable interest rate movements that impacted our insurance business results. This decline resulted from the after-tax effect of unfavourable movements in long-term interest rates of approximately $47 million in the current quarter and approximately $19 million in the prior quarter. On a basis that excludes this impact, net income was down $4 million or 3%. Net income in PCG excluding insurance was down 3.9% from the fourth quarter, due to higher expenses mainly from the impact of stock-based compensation costs for employees eligible to retire

BMO Financial Group First Quarter Report 2012 3
that are expensed each year in the first quarter, partly offset by higher than usual asset management revenues from a strategic investment. Assets under management and administration grew by $156 billion from a year ago to $435 billion. On a basis that excludes the impact of acquisitions and the stronger U.S. dollar, assets were relatively unchanged. Compared to the fourth quarter, assets under management and administration increased 2.3%. We continue to attract new client assets and are starting to see some improvement in equity market conditions. On February 20, 2012, BMO announced a definitive agreement to acquire a 19.99% interest in COFCO Trust Co., a subsidiary of COFCO Group, one of China’s largest state-owned enterprises with operations across a variety of sectors, including agriculture and financial services. COFCO Trust Co. had assets under management of approximately US$5.7 billion at December 31, 2011. The investment provides an important opportunity for us to expand our offering to high net worth and institutional clients in China through a local partner. This strategic partnership will open more doors, broaden our capabilities and help us grow our domestic wealth management business in China. The deal is subject to customary closing conditions including regulatory approvals. For the fifth consecutive year, the Retirement Plan Services team of BMO Institutional Trust Services (BMO ITS) earned the most awards overall in the annual PLANSPONSOR’s Defined Contribution Survey. BMO ITS was listed on six of the 12 Top 10 Provider “Best Of” lists, and had the highest percentage of clients “extremely likely to recommend.” The BMO Investment Centre was recognized for exceptional customer service with the Mutual Fund Service Award by DALBAR, Inc. for the sixth consecutive year. The BMO Investment Centre, which provides expert fund advice and assists clients in building mutual fund portfolios, ranked highest among mutual fund companies for its English and French language services in DALBAR’s Performance Evaluation of Mutual Fund Services, Annual Rankings and Trend Report.
BMO Capital Markets Net income for the current quarter was $198 million, a decrease of $62 million or 24% from the very strong results of a year ago. Net income increased $55 million or 39% from the fourth quarter. Revenue increased $79 million or 11% to $772 million, as market conditions have begun to show signs of improvement from the previous quarter. The current quarter saw some positive economic signs in the United States as well as a return to more normal levels of volatility and client flow in many parts of our business, especially in the latter part of the quarter. Our diversified portfolio has enabled us to take advantage of opportunities in our Trading Products business without changing our current risk profile. In our Investment and Corporate Banking business, more positive market sentiment is contributing to stronger pipelines, especially in Canada, although economic pressures in Europe continue to impede certain business activities. We are continuing to implement our strategy of building a North American capital markets business with a unified approach to client coverage, creating a better overall client experience for core clients. While we are focusing on expense management, including executing on a restructuring to align BMO Capital Markets’ cost structure with the current and future business
environment, we remain committed to our North American platform in support of our strategy. During the quarter, BMO Capital Markets earned a total of six 2011 Greenwich Quality Leader designations based on annual Greenwich Associates study results Quality Leaders ratings. These designations reflect that our clients have recognized BMO Capital Markets for distinguished service over the course of the year. BMO Capital Markets participated in 154 new issues in the quarter including 51 corporate debt deals, 42 government debt deals, 52 common equity transactions and nine issues of preferred shares, raising $55 billion.
Corporate Services
Corporate Services net income for the quarter was $223 million, an improvement of $333 million from a year ago, with M&I contributing $186 million. On an adjusted basis, net income was $62 million, an improvement of $188 million from a year ago, with M&I contributing $115 million. Adjusting items are detailed in the Adjusted Net Income section and in the Non-GAAP Measures section. Adjusted revenues were $58 million better, mainly due to higher gains on the sale of securities and hedging losses in the prior year including losses that related to securitization programs. Adjusted expenses were $6 million lower. Adjusted provisions for credit losses were better by $273 million in part due to improved credit conditions and a recovery of credit losses recorded in Corporate Services under BMO’s expected loss provisioning methodology in the current quarter compared with a provision a year ago. BMO employs a methodology for segmented reporting purposes whereby expected credit losses are charged to the client operating groups, and the difference between expected losses and actual losses is charged (or credited) to Corporate Services. The current period includes a $142 million ($88 million after-tax) recovery of provisions for credit losses on M&I purchased credit impaired loans. There was no provision or recovery on the purchased credit impaired loans in the prior quarter.
Acquisition of Marshall & Ilsley Corporation (M&I)
On July 5, 2011, BMO completed the acquisition of M&I. In this document, M&I is generally referred to as the ‘acquired business’ and other acquisitions are specifically identified. Activities of the acquired business are primarily reflected in the P&C U.S., Private Client Group and Corporate Services segments, with a small amount included in BMO Capital Markets. We continue to expect that annual cost savings from the integration of the acquired business and BMO will exceed US$300 million. We also expect there to be opportunities to add to revenues through expanded access to existing and new markets with increased brand awareness and a better ability to compete in the market. Integration costs are included in non-interest expense in Corporate Services and are expected to approximate a total of US$600 million by the time the integration is completed next year. We recorded $70 million of such expenses in the current quarter and a total of $201 million to date. In the current quarter, the acquired business contributed $269 million to reported net income and $215 million to adjusted net income, up from $199 million and $149 million, respectively, in the fourth quarter of 2011. Corporate Services reported net income includes the $114 million after-tax net benefit of credit-related items in respect of the acquired M&I performing loan portfolio. Corporate Services adjusted net income includes a $142 million recovery ($88 million after tax) of the credit mark on the M&I purchased credit impaired loan portfolio, primarily due to

4 BMO Financial Group First Quarter Report 2012
the repayment of loans at amounts in excess of the fair value determined at closing. At the end of the quarter, the remaining credit mark was $2,911 million for loans and $173 million for undrawn commitments and letters of credit, of which $1,269 million relates to performing term loans, $501 million relates to performing revolving loans, $38 million relates to other performing loans and $1,103 million relates to purchased credit impaired loans. Of the total credit mark for performing loans of $1,981 million, $1,118 million will be amortized over the remaining life of the portfolio. The portion that will not be amortized of $863 million will be recognized in either net interest income or provisions for credit losses as loans are repaid or changes in the credit quality of the portfolio occur. The credit mark on impaired loans will be recognized in the provision for credit losses as loans are repaid or changes in the credit quality of the portfolio occur. The accounting policy for purchased loans is discussed in the Purchased Loans section of Note 2 of the attached unaudited interim consolidated financial statements.
Adjusted Net Income
Management has designated certain amounts as adjusting items and has adjusted GAAP results so that we can discuss and present financial results without the effects of adjusting items to facilitate understanding of business performance and related trends. Management assesses performance on a GAAP basis and on an adjusted basis and considers both to be useful in the assessment of underlying business performance. Presenting results on both bases provides readers with a better understanding of how management assesses results. Adjusted results and measures are non-GAAP and, together with items excluded in determining adjusted results, are disclosed in more detail in the Non-GAAP Measures section, along with comments on the uses and limitations of such measures. The adjusting items that reduced net income in the first quarter of 2012 by $137 million or $0.21 per share were:
the $114 million after-tax net benefit of credit-related items in respect of the acquired M&I performing loan portfolio, including $234 million for the recognition in net interest income of a portion of the credit mark on the portfolio (including $66 million for the release of the credit mark related to early repayment of loans), net of a $50 million provision for credit losses (comprised of an increase in the collective allowance of $19 million and specific provisions of $31 million on the acquired M&I performing loan portfolio) and related income taxes of $70 million. These credit-related items in respect of the M&I performing loan portfolio can significantly impact both net interest income and the provision for credit losses in different periods over the life of the performing portfolio;
costs of $70 million ($43 million after tax) for integration of the acquired business including amounts related to system conversions, restructuring and other employee-related charges, consulting fees and marketing costs in connection with customer communications and rebranding activities;
the $136 million ($136 million after tax) benefit from run-off structured credit activities (our credit protection vehicle and structured investment vehicles). These vehicles are consolidated on our balance sheet under International Financial Reporting Standards (IFRS) and results primarily reflect valuation changes associated with these activities that have been included in trading revenue;
a restructuring charge of $68 million ($46 million after tax) to align BMO Capital Markets’ cost structure with the current and future business environment. This action is part of the broader effort underway in the bank to improve productivity; and
amortization of acquisition-related intangible assets of $34 million ($24 million after tax). Adjusted net income was $972 million for the first quarter of
2012, up $155 million or 19% from a year ago. Adjusted earnings per share were $1.42, up 7.6% from $1.32 a year ago. All of the above adjusting items were recorded in Corporate Services except the amortization of acquisition-related intangibles, which is charged across the operating groups.
International Financial Reporting Standards
Effective this quarter, BMO’s consolidated financial statements are prepared in accordance with IFRS, as described in Note 1 to the unaudited interim consolidated financial statements. The consolidated financial statements for comparative periods have been restated to conform to the current presentation. Our financial statements were previously prepared in accordance with Canadian generally accepted accounting principles (CGAAP) as defined at that time. The transition to IFRS is now complete. The most significant changes in accounting resulting from IFRS as well as the impacts of IFRS on our opening November 1, 2010, balance sheet, retained earnings and financial results for the year ended October 31, 2011, are outlined in Note 18 to the unaudited interim consolidated financial statements included with this release and pages 73 to 77 of BMO’s 2011 annual MD&A, which is available at www.bmo.com/investorrelations. The most significant impact of adopting IFRS on our results in the current quarter was the consolidation of our run-off structured credit activities, reflected in reported income in Corporate Services. BMO has elected to value the assets and liabilities of our structured credit vehicles at fair value as permitted under IFRS, with changes in fair value recorded in net income as they occur. Accounting gains and losses are reported as the fair value of the assets and liabilities change, reflecting market conditions. Market volatility and uncertainty, primarily related to difficulties in Europe, contributed to a valuation loss of $114 million being recognized in the fourth quarter of 2011. Improved market conditions in the first quarter contributed to a valuation gain of $148 million being recognized. The risk of volatility in net income is expected to reduce as the activities in these vehicles wind down. BMO believes the first-loss protection provided by the subordinated capital notes in the structured investment vehicles, and the protection provided by first-loss protection and hedges related to the credit protection vehicle continue to exceed future expected losses. As a result, any valuation gains or losses recognized in earnings should offset over time. Other changes in accounting due to the adoption of IFRS did not have a significant impact on results for the current quarter or as compared to their impact on results for the first and fourth quarters of 2011 as restated to reflect the adoption of IFRS.
Caution
The foregoing sections contain forward-looking statements. Please see the Caution Regarding Forward-Looking Statements. The foregoing sections contain adjusted results and measures, which are non-GAAP. Please see the Non-GAAP Measures section.

Financial Highlights (Unaudited) (Canadian $ in millions, except as noted) For the three months ended
January 31,
2012
October 31,
2011
July 31,
2011
April 30,
2011
January 31,
2011
Change from
January 31, 2011
Income Statement Highlights Total revenue $ 4,117 $ 3,822 $ 3,320 $ 3,333 $ 3,468 18.7 %Provision for credit losses 141 362 230 297 323 (56.4) Non-interest expense 2,554 2,432 2,221 2,030 2,058 24.1 Reported net income 1,109 768 708 813 825 34.4 Adjusted net income (b) 972 832 856 770 817 18.9
Net income attributable to non-controlling interest in subsidiaries 19 19 18 18 18 3.0
Net income attributable to Bank shareholders 1,090 749 690 795 807 35.1 Adjusted net income attributable to Bank shareholders (b) 953 813 838 752 799 19.3
Reported Net Income by Operating Segment Personal & Commercial Banking Canada $ 446 $ 439 $ 443 $ 414 $ 477 (6.7) %Personal & Commercial Banking U.S. 137 155 90 53 54 +100 Private Client Group 105 137 104 91 144 (27.6)BMO Capital Markets 198 143 270 229 260 (23.8) Corporate Services (a) 223 (106) (199) 26 (110) +100
Common Share Data ($) Diluted earnings per share $ 1.63 $ 1.11 $ 1.09 $ 1.32 $ 1.34 $ 0.29 Diluted adjusted earnings per share (b) 1.42 1.20 1.34 1.25 1.32 0.10 Dividends declared per share 0.70 0.70 0.70 0.70 0.70 - Book value per share 37.85 36.83 35.43 31.43 31.43 6.42 Closing share price 58.29 58.89 60.03 62.14 57.78 0.51 Total market value of common shares ($ billions) 37.3 37.6 38.3 35.4 32.8 4.5
As at
January 31,
2012
October 31,
2011
July 31,
2011
April 30,
2011
January 31,
2011 Change from
January 31, 2011
Balance Sheet Highlights Assets $ 538,260 $ 500,575 $ 502,036 $ 439,548 438,450 22.8 %Net loans and acceptances 242,621 238,885 235,327 204,921 204,764 18.5 Deposits 316,557 302,373 292,047 254,271 252,744 25.2 Common shareholders’ equity 24,238 23,492 22,549 17,874 17,815 36.0
For the three months
January 31,
2012
October 31,
2011
July 31,
2011
April 30,
2011
January 31,
2011
Financial Measures and Ratios (% except as noted) (c) Average annual five year total shareholder return 1.6 1.9 3.9 4.4 1.7 Diluted earnings per share growth 21.6 (10.5) (3.5) 4.8 19.6 Diluted adjusted earnings per share growth (b) 7.6 (4.8) 17.5 (2.3) 16.8 Return on equity 17.2 12.7 13.3 17.5 17.8 Adjusted return on equity (b) 15.0 13.9 16.4 16.6 17.6 Net economic profit ($ millions) (b) 434 150 151 315 325 Net economic profit (NEP) growth (b) 33.4 (21.1) 31.0 30.9 +100 Operating leverage (5.4) (1.8) (2.6) (1.4) 2.9 Adjusted operating leverage (b) (7.6) (2.6) 6.9 (2.9) 2.2 Revenue growth 18.7 18.1 13.9 9.0 14.4 Adjusted revenue growth (b) 8.5 13.4 16.0 6.1 13.7 Non-interest expense growth 24.1 19.9 16.5 10.4 11.5 Adjusted non-interest expense growth (b) 16.1 16.0 9.1 9.0 11.5 Non-interest expense-to-revenue ratio 62.0 63.7 66.9 60.9 59.3 Adjusted non-interest expense-to-revenue ratio (b) 63.5 63.8 61.2 61.5 59.4 Net interest margin on average earning assets 2.05 2.01 1.76 1.82 1.78 Adjusted net interest margin on average earning assets (b) 1.85 1.78 1.78 1.83 1.79 Provision for credit losses-to-average loans and acceptances (annualized) 0.23 0.60 0.43 0.58 0.63 Effective tax rate 22.02 25.31 18.04 19.18 24.11 Gross impaired loans and acceptances-to-equity and allowance for credit losses 8.74 8.98 7.94 10.18 11.46 Cash and securities-to-total assets ratio 32.2 29.5 32.0 32.9 33.1 Common equity ratio (based on Basel II) 9.65 9.59 9.11 10.67 10.15 Basel II tier 1 capital ratio 11.69 12.01 11.48 13.82 13.02 Basel II total capital ratio 14.58 14.85 14.21 17.03 15.17 Credit rating (d) DBRS AA AA AA AA AA Fitch AA- AA- AA- AA- AA- Moody’s Aa2 Aa2 Aa2 Aa2 Aa2 Standard & Poor’s A+ A+ A+ A+ A+ Twelve month total shareholder return 5.7 2.4 0.0 3.2 16.6 Dividend yield 4.80 4.75 4.66 4.51 4.85 Price-to-earnings ratio (times) 11.3 12.1 12.0 12.4 11.6 Market-to-book value (times) 1.54 1.49 1.58 1.82 1.69 Return on average assets 0.81 0.56 0.59 0.74 0.72 Equity-to-assets ratio 5.0 5.3 5.1 4.7 4.7
All ratios in this report are based on unrounded numbers. (a) Corporate Services includes Technology and Operations. (b) These are Non-GAAP measures. Refer to the Non-GAAP Measures section at the end of the
Financial Review for an explanation of the use and limitations of Non-GAAP measures and detail on the items that have been excluded from results in the determination of adjusted measures. Earnings and other measures adjusted to a basis other than generally accepted accounting
principles (GAAP) do not have standardized meanings under GAAP and are unlikely to be comparable to similar measures used by other companies.
(c) For the period ended, or as at, as appropriate. (d) For a discussion of the significance of these credit ratings, see the Liquidity and Funding Risk
section on pages 88 to 90 of BMO’s Annual Management’s Discussion and Analysis. Amounts for periods prior to fiscal 2011 have not been restated for IFRS. As a result, growth measures for 2011 may not be meaningful.

BMO Financial Group First Quarter Report 2012 5
Management’s Discussion and Analysis
Management’s Discussion and Analysis (MD&A) commentary is as of February 28, 2012. Unless otherwise indicated, all amounts are in Canadian dollars and
have been derived from financial statements prepared in accordance with International Financial Reporting Standards (IFRS). References to Canadian GAAP mean
IFRS, unless indicated otherwise. The MD&A should be read in conjunction with the unaudited interim consolidated financial statements for the period ended
January 31, 2012, included in this document, and the annual MD&A for the year ended October 31, 2011, included in BMO’s 2011 Annual Report. The material
that precedes this section comprises part of this MD&A.
Bank of Montreal uses a unified branding approach that links all of the organization’s member companies. Bank of Montreal, together with its subsidiaries, is known as BMO Financial Group. As such, in this document, the names BMO and BMO Financial Group mean Bank of Montreal, together with its subsidiaries.
Summary Data
(Unaudited) (Canadian $ in millions, except as noted) Q1-2012
Increase (Decrease)
vs. Q1-2011
Increase (Decrease)
vs. Q4-2011
Net interest income 2,318 601 35% 56 2%Non-interest revenue 1, 799 48 3% 239 15%
Revenue 4,117 649 19% 295 8%Specific provision for credit losses 122 (195) (62%) (177) (59%)Collective provision for credit losses 19 13 +100% (44) (70%)
Total provision for credit losses 141 (182) (56%) (221) (61%)Non-interest expense 2,554 496 24% 122 5%Provision for income taxes 313 51 20% 53 20%
Net income 1,109 284 34% 341 44%
Attributable to bank shareholders 1,090 283 35% 341 46% Attributable to non-controlling interest in subsidiaries 19 1 3% - -
Net income 1,109 284 34% 341 44%
Adjusted net income 972 155 19% 140 17%
Earnings per share – basic ($) 1.65 0.29 21% 0.53 47%Earnings per share – diluted ($) 1.63 0.29 22% 0.52 47%Adjusted earnings per share – diluted ($) 1.42 0.10 8% 0.22 18%Return on equity (ROE) 17.2% (0.6%) 4.5%Adjusted ROE 15.0% (2.6%) 1.1%Productivity ratio 62.0% 2.7% (1.7%)Adjusted productivity ratio 63.5% 4.1% (0.3%)Operating leverage (5.4%) nm nmAdjusted operating leverage (7.6%) nm nmNet interest margin on earning assets 2.05% 0.27% 0.04%Adjusted net interest margin on earning assets 1.85% 0.06% 0.07%Effective tax rate 22.0% (2.1%) (3.3%) Capital Ratios Basel II Tier 1 Capital Ratio 11.69% (1.33%) (0.32%) Common Equity Ratio – using a Basel II approach 9.65% (0.50%) 0.06% Net income by operating group: Personal and Commercial Banking 583 52 10% (11) (2%) P&C Canada 446 (31) (7%) 7 1% P&C U.S. 137 83 +100% (18) (11%)Private Client Group 105 (39) (28%) (32) (24%)BMO Capital Markets 198 (62) (24%) 55 39%Corporate Services, including T&O 223 333 +100% 329 +100%
BMO Financial Group net income 1,109 284 34% 341 44%
Adjusted net income by operating group: Personal and Commercial Banking 602 64 12% (11) (2%) P&C Canada 448 (31) (6%) 7 2% P&C U.S. 154 95 +100% (18) (10%)Private Client Group 110 (35) (24%) (33) (23%)BMO Capital Markets 198 (62) (24%) 55 39%Corporate Services, including T&O 62 188 +100% 129 +100%
BMO Financial Group adjusted net income 972 155 19% 140 17%
Adjusted results in this section are non-GAAP amounts or non-GAAP measures. Please see the Non-GAAP Measures section, which outlines the use of non-GAAP measures in this document. nm – not meaningful.

6 BMO Financial Group First Quarter Report 2012
Management’s Responsibility for Financial Information Bank of Montreal's Chief Executive Officer and Chief Financial Officer have signed certifications relating to the appropriateness of the financial disclosures in our interim MD&A and unaudited interim consolidated financial statements for the period ended January 31, 2012, and relating to the design of our disclosure controls and procedures and internal control over financial reporting. Bank of Montreal's management, under the supervision of the CEO and CFO, has evaluated the effectiveness, as at January 31, 2012, of Bank of Montreal's disclosure controls and procedures (as defined in the rules of the Securities and Exchange Commission and the Canadian Securities Administrators) and has concluded that such disclosure controls and procedures are effective. Bank of Montreal's internal control over financial reporting includes policies and procedures that: pertain to the maintenance of records that in reasonable detail accurately and fairly reflect the transactions and dispositions of the assets of BMO; provide reasonable assurance that transactions are recorded as necessary to permit preparation of the consolidated financial statements in accordance with Canadian generally accepted accounting principles and the requirements of the Securities and Exchange Commission in the United States, as applicable; ensure receipts and expenditures of BMO are being made only in accordance with authorizations of management and directors of Bank of Montreal; and provide reasonable assurance regarding prevention or timely detection of unauthorized acquisition, use or disposition of BMO assets that could have a material effect on the consolidated financial statements. Because of its inherent limitations, internal control over financial reporting can provide only reasonable assurance and may not prevent or detect misstatements. Further, projections of any evaluation of effectiveness to future periods are subject to the risk that controls may become inadequate because of changes in conditions, or that the degree of compliance with the policies or procedures may deteriorate. There were no changes in our internal control over financial reporting during the quarter ended January 31, 2012, that materially affected, or are reasonably likely to materially affect, our internal control over financial reporting. As in prior quarters, Bank of Montreal's audit committee reviewed this document, including the unaudited interim consolidated financial statements, and Bank of Montreal’s Board of Directors approved the document prior to its release. A comprehensive discussion of our businesses, strategies and objectives can be found in Management’s Discussion and Analysis in BMO's 2011 Annual Report, which can be accessed on our website at www.bmo.com/investorrelations. Readers are also encouraged to visit the site to view other quarterly financial information.
Caution Regarding Forward-Looking Statements Bank of Montreal’s public communications often include written or oral forward-looking statements. Statements of this type are included in this document, and may be included in other filings with Canadian securities
regulators or the U.S. Securities and Exchange Commission, or in other communications. All such statements are made pursuant to the “safe harbor” provisions of, and are intended to be forward-looking statements under,
the United States Private Securities Litigation Reform Act of 1995 and any applicable Canadian securities legislation. Forward-looking statements may involve, but are not limited to, comments with respect to our objectives
and priorities for 2012 and beyond, our strategies or future actions, our targets, expectations for our financial condition or share price, and the results of or outlook for our operations or for the Canadian and U.S. economies.
By their nature, forward-looking statements require us to make assumptions and are subject to inherent risks and uncertainties. There is significant risk that predictions, forecasts, conclusions or projections will not prove
to be accurate, that our assumptions may not be correct and that actual results may differ materially from such predictions, forecasts, conclusions or projections. We caution readers of this document not to place undue
reliance on our forward-looking statements as a number of factors could cause actual future results, conditions, actions or events to differ materially from the targets, expectations, estimates or intentions expressed in the
forward-looking statements.
The future outcomes that relate to forward-looking statements may be influenced by many factors, including but not limited to: general economic and market conditions in the countries in which we operate; weak,
volatile or illiquid capital and/or credit markets; interest rate and currency value fluctuations; changes in monetary, fiscal or economic policy; the degree of competition in the geographic and business areas in which we
operate; changes in laws or in supervisory expectations or requirements, including capital, interest rate and liquidity requirements and guidance; judicial or regulatory proceedings; the accuracy and completeness of the
information we obtain with respect to our customers and counterparties; our ability to execute our strategic plans and to complete and integrate acquisitions; critical accounting estimates and the effect of changes to
accounting standards, rules and interpretations on these estimates; operational and infrastructure risks; changes to our credit ratings; general political conditions; global capital markets activities; the possible effects on our
business of war or terrorist activities; disease or illness that affects local, national or international economies; natural disasters and disruptions to public infrastructure, such as transportation, communications, power or water
supply; technological changes; and our ability to anticipate and effectively manage risks associated with all of the foregoing factors.
With respect to the completed acquisition of Marshall & Ilsley Corporation (M&I), factors that may influence the future outcomes that relate to forward-looking statements include, but are not limited to: the possibility
that the anticipated benefits from the transaction, such as expanding our North American presence, providing synergies, being accretive to earnings and resulting in other impacts on earnings, are not realized in the time
frame anticipated, or at all, as a result of changes in general economic and market conditions, interest and exchange rates, monetary policy, laws and regulations (including changes to capital requirements) and their
enforcement, and the degree of competition in the geographic and business areas in which the combined business now operates; our ability to effectively integrate the businesses of M&I and BMO on a timely basis;
reputational risks and the reaction of M&I’s customers to the transaction; diversion of management time to issues related to integration and restructuring; and increased exposure to exchange rate fluctuations. A significant
amount of M&I’s business involved making loans or otherwise committing resources to specific borrowers, industries or geographic areas. Unforeseen events affecting such borrowers, industries or geographic areas could
have a material adverse effect on the performance of our integrated U.S. operations. Our anticipation that annual cost savings from the integration of M&I and BMO will exceed US$300 million is based on the assumption
that changes to business operations and support infrastructure and staffing will be consistent with our plans and that our expectations for business volumes are met.
We caution that the foregoing list is not exhaustive of all possible factors. Other factors could adversely affect our results. For more information, please see the discussion on pages 30 and 31 of BMO’s 2011 annual
MD&A, which outlines in detail certain key factors that may affect Bank of Montreal’s future results. When relying on forward-looking statements to make decisions with respect to Bank of Montreal, investors and others
should carefully consider these factors, as well as other uncertainties and potential events, and the inherent uncertainty of forward-looking statements. Bank of Montreal does not undertake to update any forward-looking
statements, whether written or oral, that may be made from time to time by the organization or on its behalf, except as required by law. The forward-looking information contained in this document is presented for the
purpose of assisting our shareholders in understanding our financial position as at and for the periods ended on the dates presented, as well as our strategic priorities and objectives, and may not be appropriate for other
purposes.
In calculating the pro-forma impact of Basel III on our regulatory capital, risk-weighted assets (including Counterparty Credit Risk and Market Risk) and regulatory capital ratios, we have assumed that our interpretation of
the proposed rules and proposals announced by the Basel Committee on Banking Supervision (BCBS) as of this date, and our models used to assess those requirements, are consistent with the final requirements that will be
promulgated by BCBS and the Office of the Superintendent of Financial Institutions Canada (OSFI). We have also assumed that the proposed changes affecting capital deductions, risk-weighted assets, the regulatory capital
treatment for non-common share capital instruments (i.e. grandfathered capital instruments) and the minimum regulatory capital ratios are adopted by OSFI as proposed by BCBS. We have also assumed that existing capital
instruments that are non-Basel III compliant but are Basel II compliant can be fully included in the January 31, 2012, pro-forma calculations. The full impact of the Basel III proposals has been quantified based on our
financial and risk positions at quarter end or as close to quarter end as was practical. In setting out the expectation that we will be able to refinance certain capital instruments in the future, as and when necessary to meet
regulatory capital requirements, we have assumed that factors beyond our control, including the state of the economic and capital markets environment, will not impair our ability to do so.
Assumptions about the level of asset sales, expected asset sale prices, net funding cost, credit quality, risk of default and losses on default of the underlying assets of certain structured investment vehicles were material
factors we considered when establishing our expectations regarding the structured investment vehicles discussed in this interim MD&A, including whether the first-loss protection provided by the subordinated capital notes
will exceed future losses. Key assumptions included that assets will continue to be sold with a view to reducing the size of the structured investment vehicles, under various asset price scenarios, and that the level of default
and losses will be consistent with the credit quality of the underlying assets and our current expectations regarding continuing difficult market conditions. In determining amounts of asset maturities by year, we have made
assumptions as to which issuers will or will not redeem subordinated debt prior to its maturity date, where permitted.
Assumptions about the level of default and losses on default were material factors we considered when establishing our expectations regarding the future performance of the transactions into which our credit protection
vehicle has entered. Among the key assumptions were that the level of default and losses on default will be consistent with historical experience. Material factors that were taken into account when establishing our
expectations regarding the future risk of credit losses in our credit protection vehicle and risk of loss to BMO included industry diversification in the portfolio, initial credit quality by portfolio, the first-loss protection
incorporated into the structure and the hedges that BMO has entered.
In determining the impact of reductions to interchange fees in the U.S. Legislative and Regulatory Developments section, we have assumed that business volumes remain consistent with our expectations and that
certain management actions are implemented that will modestly reduce the impact of the rules on our revenues.
Assumptions about the performance of the Canadian and U.S. economies, as well as overall market conditions and their combined effect on our business, are material factors we consider when determining our strategic
priorities, objectives and expectations for our business. In determining our expectations for economic growth, both broadly and in the financial services sector, we primarily consider historical economic data provided by the
Canadian and U.S. governments and their agencies. See the Economic Outlook and Review section of this interim MD&A.
Regulatory Filings Our continuous disclosure materials, including our interim filings, annual MD&A and audited consolidated financial statements, Annual Information Form and Notice of Annual Meeting of Shareholders and Proxy Circular are available on our website at www.bmo.com/investorrelations, on the Canadian Securities Administrators’ website at www.sedar.com and on the EDGAR section of the SEC’s website at www.sec.gov.

BMO Financial Group First Quarter Report 2012 7
Economic Outlook and Review
Canada’s economy is expected to grow 2.0% in 2012, slowing from an estimated real GDP growth rate of 2.3% in 2011. Despite low interest rates, consumers are expected to spend more cautiously as elevated debt levels restrain credit growth and housing market activity. While a projected modest pickup in U.S. demand should support exports and manufacturing, the still-high Canadian dollar will continue to temper growth. Governments are expected to slow their rate of spending to address budget deficits. However, business investment should continue to lead the expansion, supported by activity in the resource sector. Commodity-rich Saskatchewan and Alberta should lead the nation in growth, with both provinces attracting an increasing number of migrants from other countries and provinces. An outlook for modest growth and lower inflation, along with concerns about the European debt situation, will likely persuade the Bank of Canada to keep interest rates low well into next year. Supported by firm commodity prices, the Canadian dollar is expected to trade close to parity with the U.S. dollar in 2012. The U.S. economic expansion is expected to improve to a real GDP growth rate of 2.4% in 2012 from 1.7% in 2011, outpacing growth in the other G7 nations. Recent data show that the recovery has spread to most sectors except government, thereby lessening the risk of a recession. Improved job growth has supported consumer spending and helped stabilize the housing market, though home sales and starts remain low. Business investment should continue to lead the expansion as companies remain in good financial condition. Despite an expected recession in Europe, U.S. exports should also remain supportive, reflecting improved competitiveness. Consumer spending and housing activity are expected to strengthen moderately through the year as employment growth picks up. However, with the unemployment rate likely to remain high, the Federal Reserve is expected to keep short-term interest rates near zero for at least two more years. The U.S. Midwest economy is expected to grow moderately faster than the national average in 2012, supported by strong business investment and a pickup in manufacturing and automotive production, as well as continued robust demand for agricultural products. However, growth will continue to be restrained by cutbacks in the public sector. This Economic Outlook section contains forward-looking statements. Please see the Caution Regarding Forward-Looking Statements.
Foreign Exchange
The Canadian dollar equivalents of BMO’s U.S.-dollar-denominated net income, revenues, expenses, provisions for credit losses and income taxes were increased relative to the first and fourth quarters of 2011 by the strengthening of the U.S. dollar. The average Canadian/U.S. dollar exchange rate, expressed in terms of the Canadian dollar cost of a U.S. dollar, increased by 0.6% from a year ago and by 0.6% from the average of the fourth quarter of 2011. The following table indicates the relevant average Canadian/U.S. dollar exchange rates and the impact of changes in the rates. Effects of U.S. Dollar Exchange Rate Fluctuations on BMO’s Results Q1-2012
(Canadian $ in millions, except as noted) vs. Q1-2011 vs. Q4-2011
Canadian/U.S. dollar exchange rate (average)
Current period 1.0133 1.0133 Prior period 1.0074 1.0077
Effects on reported results
Increased net interest income 6 6Increased non-interest revenue 3 3
Increased revenues 9 9Increased expenses (6) (5)Decreased provision for credit loses 1 -Increased income taxes - - (1)
Increased net income 4 4
Effects on adjusted results Increased net interest income 5 5Increased non-interest revenues 3 3
Increased revenues 8 8Increased expenses (5) (5)Increased provision for credit loses - -Increased income taxes - -
Increased adjusted net income 3 3
Adjusted results in this section are non-GAAP amounts or non-GAAP measures. Please see the Non-GAAP Measures section.
At the start of each quarter, BMO assesses whether to enter into hedging transactions that are expected to partially offset the pre-tax effects of exchange rate fluctuations in the quarter on our expected U.S.-dollar-denominated net income for that quarter. As such, these activities partially mitigate the impact of exchange rate fluctuations, but only within that quarter. As a result, the sum of the hedging gains/losses for the four quarters in a year is not directly comparable to the impact of year-over-year exchange rate fluctuation on earnings for the year. Over the course of the current quarter, the U.S. dollar strengthened slightly, as the exchange rate increased from Cdn$0.9967 per U.S. dollar at October 31, 2011, to an average of Cdn$1.0133. However, hedging transactions resulted in a minimal after-tax gain of less than $1 million in the quarter. The gain or loss from hedging transactions in future periods will be determined by both future currency fluctuations and the amount of underlying future hedging transactions, since the transactions are entered into each quarter in relation to expected U.S.-dollar-denominated net income for the next three months. The effect of currency fluctuations on our investments in foreign operations is discussed in the Income Taxes section.

8 BMO Financial Group First Quarter Report 2012
Other Value Measures
BMO’s average annual total shareholder return for the five-year period ended January 31, 2012, was 1.6%. Net economic profit (NEP) was $434 million, compared with $150 million in the fourth quarter and $325 million in the first quarter of 2011. Adjusted NEP was $273 million, compared with $189 million in the fourth quarter and $309 million in the first quarter of 2011. Changes in NEP are reflective of higher earnings in the current quarter and increased capital relative to a year ago, due largely to the M&I acquisition. NEP of $434 million represents the net income that is attributable to common shareholders ($1,090 million), less preferred share dividends ($37 million), plus the after-tax amortization of intangible assets ($24 million), net of a charge for capital ($643 million), and is considered an effective measure of added economic value. NEP and adjusted NEP are non-GAAP measures. Please see the Non-GAAP Measures section for a discussion on the use and limitations of non-GAAP measures.
Net Income
Q1 2012 vs Q1 2011
Net income was $1,109 million for the first quarter of 2012, up $284 million or 34% from a year ago. Earnings per share were $1.63, up 22% from $1.34 a year ago. Management assesses performance on both a GAAP basis and adjusted basis and considers both bases to be useful in assessing underlying, ongoing business performance. Adjusted net income was $972 million for the first quarter of 2012, up $155 million or 19% from a year ago. Adjusted earnings per share were $1.42, up 7.6% from $1.32 a year ago. Adjusted results and measures are Non-GAAP. Adjusted results and items excluded in determining adjusted results are disclosed in more detail in the preceding Adjusted Net Income section and in the Non-GAAP Measures section, together with comments on the uses and limitations of such measures. On an adjusted basis, net income was up primarily due to a $215 million contribution from the acquired business and lower provisions for credit losses. Increased net income was moderated by lower insurance revenue in the first quarter in Private Client Group, resulting from unfavourable movements in long-term interest rates of approximately $47 million after tax in the current quarter compared with favourable movements of approximately $9 million in the prior year, and lower results from BMO Capital Markets compared to strong results a year ago. There was strong revenue growth due to the inclusion of the M&I and Lloyd George Management (LGM) acquisitions. Expense growth was modest excluding the impact of acquisitions. Provisions for credit losses were significantly lower due to the improved credit environment including an $88 million after-tax recovery of provisions for credit losses on M&I purchased credit impaired loans. The effective tax rate was also lower, as explained in the Income Taxes section.
Q1 2012 vs Q4 2011
Net income increased $341 million or 44% from the fourth quarter and earnings per share increased $0.52 or 47% to $1.63. Adjusted net income increased $140 million or 17% and adjusted earnings per share increased $0.22 or 18% to $1.42. Good revenue growth outpaced expense growth in the quarter and there were significantly lower provisions for credit losses. The effective tax rate was also lower.
Revenue
Total revenue increased $649 million or 19% from a year ago. Revenues in the current quarter included $716 million of revenue of the acquired business. Adjusted revenue excludes the portion of the credit mark on the acquired M&I performing loan portfolio recorded in Corporate Services as well as revenue from run-off structured credit activities, as explained in the Adjusted Net Income section. Adjusted revenue increased $295 million or 8.5%, due to $482 million of revenue from the inclusion of the acquired business, offset in part by lower revenue in BMO Capital Markets as a result of particularly strong revenue a year ago, and lower revenue in the insurance business in Private Client Group, due to the impact of unfavourable long-term interest rate movements in the current year versus favourable effects in the same period a year ago. The stronger U.S. dollar increased adjusted revenue growth by $8 million. Revenue increased $295 million or 7.7% from the fourth quarter of 2011. Adjusted revenue increased $73 million or 2.0%. There was strong growth in BMO Capital Markets, due to improving markets in the latter half of the quarter. The stronger U.S. dollar increased adjusted revenue growth by $8 million. BMO analyzes revenue at the consolidated level based on GAAP revenues reflected in the consolidated financial statements rather than on a taxable equivalent basis (teb), which is consistent with our Canadian peer group. Like many banks, we continue to analyze revenue on a teb basis at the operating group level. This basis includes an adjustment that increases GAAP revenues and the GAAP provision for income taxes by an amount that would raise revenues on certain tax-exempt items to a level equivalent to amounts that would incur tax at the statutory rate. The offset to the group teb adjustments is reflected in Corporate Services revenues and income tax provisions. The teb adjustments for the first quarter of 2012 totalled $52 million, down from $61 million in the first quarter of 2011 and in line with $51 million in the fourth quarter.
Changes in net interest income and non-interest revenue are reviewed in the sections that follow.
This section contains adjusted results and measures which are non-GAAP. Please see the Non-GAAP Measures section.
Net Interest Income
Net interest income increased $601 million or 35% from a year ago. Adjusted net interest income increased $366 million or 21% from a year ago. Adjusted net interest income excludes the portion of the credit mark on the acquired performing loan portfolio that is reflected in net interest income and booked in Corporate Services, as explained in the Adjusted Net Income section. Results from the acquired business added $321 million to adjusted net interest income relative to a year ago. The increase in adjusted net interest income was primarily in P&C U.S. and Private Client Group. BMO’s overall net interest margin increased by 27 basis points year over year to 2.05%. On an adjusted basis, net interest margin increased by 6 basis points to 1.85%. On this basis, there were increases in P&C U.S. and Private Client Group, with decreases in P&C Canada and BMO Capital Markets. Decreased margin in P&C Canada was primarily driven by lower deposit spreads in a low interest rate environment, competitive pricing pressure and lower refinancing fees on mortgages. In P&C U.S., the increase was mainly due to increased deposit balances and improved loan spreads as well as the impact of the acquired business, partially offset by deposit spread compression. In Private Client Group, the

BMO Financial Group First Quarter Report 2012 9
increase was mainly due to the earnings from our acquisitions, higher than usual asset management revenues from a strategic investment and higher private banking loan and deposit balances. The reduction in net interest margin in BMO Capital Markets was primarily attributable to growth in lower margin assets and an income distribution on an investment security in the prior year. Average earning assets increased $66 billion or 17% relative to a year ago, with minimal impact due to the stronger U.S. dollar. Higher asset levels were attributable to assets of the acquired business (which contributed $35 billion overall) in P&C U.S. and in Private Client Group along with personal loan growth in the Canadian private banking business, increased deposits with the Federal Reserve and reverse repos in BMO Capital Markets and loan growth in P&C Canada. There were also higher cash balances in Corporate Services representing, in part, increased deposits with the Federal Reserve. Relative to the fourth quarter, net interest income increased $56 million or 2.5%. Adjusted net interest income increased $96 million or 4.8%. There was good growth in Private Client Group and BMO Capital Markets with a more modest increase in P&C Canada, partially offset by a decrease in P&C U.S.
BMO’s overall net interest margin increased 4 basis points from the fourth quarter to 2.05%. Adjusted net interest margin increased 7 basis points to 1.85%. There were increases in all groups except P&C U.S., where the benefits of increased deposit balances were more than offset by deposit spread compression and lower loan spreads. P&C Canada’s overall net interest margin was essentially flat. In Private Client Group, margin increased due largely to the higher than usual revenues from the strategic investment referenced above. BMO Capital Markets net interest margin increased mainly due to increases in revenues from our interest-rate-sensitive businesses. Average earning assets increased $3.4 billion or 0.8% from the fourth quarter. The increase was attributable to growth in BMO Capital Markets due to higher reverse repos, as well as cash resources. Adjusted results in this section are non-GAAP amounts or non-GAAP measures. Please see the Non-GAAP Measures section.
Adjusted Net Interest Margin on Earning Assets (teb)*
(In basis points) Q1-2012
Increase(Decrease) vs.
Q1-2011
Increase (Decrease) vs.
Q4-2011
P&C Canada 290 (11) 2P&C U.S. 443 19 (9)
Personal and Commercial Client Group 331 11 (2)Private Client Group 380 81 89BMO Capital Markets 61 (22) 3Corporate Services, including (T&O)** nm nm nm
Total BMO adjusted net interest margin (1) 185 6 7
Total BMO reported net interest margin 205 27 4
Total Canadian Retail (reported and adjusted)*** 290 (13) 2
* Net interest margin is disclosed and computed with reference to average earning assets, rather than total assets. This basis provides a more relevant measure of margins, and changes in margins. Operating group margins are stated on a teb basis while total BMO margin is stated on a GAAP basis.
** Corporate Services adjusted net interest income is negative in all periods and its variability affects changes in net interest margin. *** Total Canadian retail margin represents the net interest margin of the combined Canadian business of P&C Canada and Private Client Group. (1) These are non-GAAP amounts or non-GAAP measures. Please see the Non-GAAP Measures section. nm - not meaningful
Non-Interest Revenue
Non-interest revenue is detailed in the attached summary unaudited interim consolidated financial statements. Non-interest revenue increased $48 million or 2.7% from a year ago. Adjusted non-interest revenue decreased $71 million or 4.1%. Adjusted non-interest revenue excludes $148 million of revenue from run-off structured credit activities in the current quarter and $30 million of comparable revenues a year ago, which are reported in trading revenues and recorded in the Corporate Services segment. Results included $160 million attributable to the acquired business, consisting primarily of deposit and payment service charges in P&C U.S., investment management fees in Private Client Group and other revenue. There was a strong increase in P&C U.S., due to the acquired business. There were decreases in BMO Capital Markets due to strong revenues a year ago, in P&C Canada due to a securities gain in the prior year, and in insurance revenues in Private Client Group. Underwriting and advisory fees decreased significantly as continued concerns over the European debt situation led to lower investment banking activity, primarily in the mergers and
acquisitions area. Insurance income also declined appreciably, as the effects of movements in long-term interest rates lowered revenues in the current quarter by approximately $65 million and raised revenues a year ago by approximately $12 million. Relative to the fourth quarter, non-interest revenue increased $239 million or 15%. Adjusted non-interest revenue decreased $23 million or 1.4%. Insurance revenue declined due to the approximately $65 million impact of unfavourable long-term interest rate movements in the current quarter, compared with the approximately $26 million impact in the fourth quarter. Trading revenues improved significantly from the low levels of the preceding quarter, primarily in interest and equity trading. Adjusted results in this section are non-GAAP amounts or non-GAAP measures. Please see the Non-GAAP Measures section.

10 BMO Financial Group First Quarter Report 2012
Non-Interest Expense
Non-interest expense is detailed in the attached unaudited interim consolidated financial statements. Non-interest expense increased $496 million or 24% from a year ago to $2,554 million. Adjusted non-interest expense increased $329 million or 16% from a year ago to $2,378 million. Adjusted non-interest expense in the current quarter excludes $70 million of integration costs relating to the acquired business, $34 million in respect of the amortization of acquisition-related intangible assets and a $68 million restructuring charge recorded in Corporate Services to align BMO Capital Markets’ cost structure with the current and future business environment. The acquired business increased adjusted non-interest expense by $307 million. Excluding the acquired business, adjusted non-interest expense increased $22 million or 1.1% year over year due to the LGM acquisition and modest growth across most categories. The stronger U.S. dollar increased adjusted expense growth by $5 million or 0.2%. Expenses in the quarter reflected ongoing costs that relate to initiatives undertaken in 2011 as well as a litigation expense in P&C U.S. Relative to the fourth quarter, non-interest expense increased $122 million or 5.0%. Adjusted non-interest expense increased $37 million or 1.6%. Employee compensation costs were significantly higher due to the inclusion of $71 million of performance-based compensation in respect of employees that are eligible to retire, which are expensed each year in the first quarter, and higher employee benefits costs, which are typically higher in the first quarter of the year. Our increased focus on productivity has resulted in a quarter over quarter adjusted operating leverage of 0.4% or 3.4% on a basis that excludes performance-based compensation in respect of employees that are eligible to retire. Adjusted results in this section are non-GAAP amounts or non-GAAP measures. Please see the Non-GAAP Measures section.
Risk Management
Uncertainty surrounding the European and U.S. economies continues to impact the global economic recovery. However, there are positive signs that a recovery is underway in the United States, with GDP growing moderately and the housing market starting to stabilize. There has also been some progress made by European leaders towards improving fiscal discipline, a very important step in restoring investor confidence. In Canada, low interest rates, an active housing market and high consumer debt levels imply potential risk. BMO’s Canadian residential mortgage portfolio represents 6.2% of the total Canadian residential mortgage market, which totalled approximately $1,107 billion at December 31, 2011. The portfolio is 70% insured, with an average loan-to-value ratio of 63% (adjusted for current housing values). The remaining 30% of the portfolio is uninsured, with an average loan-to-value ratio of 54%. BMO’s Home Equity Line of Credit portfolio is uninsured, but 94% of the exposures represent a priority claim and there are no exposures that had an average loan-to-value ratio greater than 80% at time of origination. We remain satisfied with our prudent and consistent lending standards throughout the credit cycle and will continue to monitor the portfolio closely. Provisions for credit losses for the current and prior periods are now reflected on an IFRS basis, which includes provisions resulting from the recognition of our securitized loans and certain special purpose entities. IFRS also requires that we recognize
interest income on impaired loans with a corresponding increase in provision for credit losses. Credit quality improved in the quarter and this is reflected in the provisions for the quarter. Provisions for credit losses totalled $141 million in the first quarter of 2012. Adjusted provisions for credit losses were $91 million, after adjusting for a $31 million specific provision and a $19 million increase in the collective allowance for the M&I purchased performing portfolio. Adjusted specific provisions for credit losses were $91 million, or an annualized 17 basis points of average net loans and acceptances, compared with $281 million or 53 basis points in the fourth quarter of 2011 and $317 million or 62 basis points in the first quarter of 2011. Included in adjusted specific provisions for credit losses is a recovery of $142 million related to the M&I purchased credit impaired loans this quarter. On a geographic basis, specific provisions in Canada and all other countries (excluding the United States) were $153 million in the first quarter of 2012, $180 million in the fourth quarter of 2011 and $170 million in the first quarter of 2011. Specific provisions in the United States were a $31 million recovery in the first quarter of 2012, and charges of $119 million in the fourth quarter of 2011 and $147 million in the first quarter of 2011. On an adjusted basis, specific provisions in the United States for the comparable periods were a $62 million recovery and provisions of $101 million and $147 million, respectively. BMO employs a methodology for segmented reporting purposes whereby credit losses are charged to the client operating groups quarterly, based on their share of expected credit losses. The difference between quarterly charges based on expected losses and required quarterly provisions based on actual losses is charged (or credited) to Corporate Services. The following paragraphs outline credit losses by client operating group based on actual credit losses, rather than their share of expected credit losses. Actual credit losses in the first quarter of 2012 were: $149 million in P&C Canada; $80 million in P&C U.S. ($56 million on an adjusted basis); $11 million recovery in BMO Capital Markets; $6 million charge in Private Client Group ($4 million on an adjusted basis); and $40 million in Corporate Services ($35 million on an adjusted basis), which included loans transferred from P&C U.S. to Corporate Services in the third quarter of 2011 and IFRS adjustments related to the interest on impaired loans. These actual credit losses exclude the $142 million recovery related to the M&I purchased credit impaired loans. Actual credit losses in the fourth quarter of 2011 were: $172 million in P&C Canada; $89 million in P&C U.S. ($69 million on an adjusted basis); $12 million in BMO Capital Markets; $2 million in Private Client Group; and $24 million in Corporate Services ($26 million on an adjusted basis), which included loans transferred from P&C U.S. to Corporate Services in the third quarter of 2011 and IFRS adjustments related to the interest on impaired loans. Actual credit losses in the first quarter of 2011, on both a reported and adjusted basis, were: $160 million in P&C Canada; $131 million in P&C U.S.; $3 million in BMO Capital Markets; $3 million in Private Client Group; and $20 million in Corporate Services due to the IFRS adjustments related to the interest on impaired loans. Impaired loan formations totalled $624 million in the current quarter, down from $732 million in the fourth quarter of 2011 and up from $474 million a year ago. U.S.-related formations

BMO Financial Group First Quarter Report 2012 11
represented over half of BMO’s total formations in the quarter, of which $259 million is related to purchased portfolios. Total gross impaired loans, excluding the purchased credit impaired loans, were $2,657 million at the end of the current quarter, down from $2,685 million in the fourth quarter of 2011 and from $2,739 million a year ago. At the end of the quarter, there were $429 million of gross impaired loans related to the acquired portfolios, of which $115 million is subject to a loss-sharing agreement that expires in 2015 for commercial loans and 2020 for retail loans. BMO’s liquidity and funding, market and insurance risk management practices and key measures are outlined on pages 88 to 91 of BMO’s 2011 annual MD&A. There were no significant changes to our level of liquidity and funding risk over the quarter. We remain satisfied that our liquidity and funding management framework provides us with a sound liquidity position. Trading and Underwriting Market Value Exposure (MVE) remained stable over the period. Exposure in the bank’s available-for-sale (AFS) portfolios increased mainly due to an increase in fixed income activity.
Stressed VaR, which is part of the Basel II Market Risk Amendment requirements that became effective in the first quarter of 2012, is reported in the table below. Stressed VaR model inputs are calibrated to historical data from a period of significant financial stress, whereas model inputs for VaR are calibrated to data from the prior 1-year period. The Stress VaR historical period is currently from August 2008 to August 2009. There were no significant changes in our structural market risk management practices during the quarter. Structural MVE is driven by rising interest rates and primarily reflects a lower market value for fixed-rate loans. Structural Earnings Volatility (EV) is driven by falling interest rates and primarily reflects the risk of prime-based loans repricing at lower rates. MVE and economic value sensitivities decreased modestly from the prior quarter primarily due to the adoption of IFRS. EV and earnings exposures under a falling interest rate scenario increased modestly from the prior quarter largely due to the increased impact of deposit floors, which limit the extent that interest expense can decline when interest rates fall. There were no significant changes in the risk management practices or risk levels of our insurance business during the quarter. This Risk Management section contains forward-looking statements. Please see the Caution Regarding Forward-Looking Statements.
Provisions for Credit Losses (Canadian $ in millions, except as noted) Q1-2012 Q4-2011 Q1-2011 New specific provisions 412 415 400Reversals of previously established allowances (67) (45) (24)
Recoveries of loans previously written-off (223) (71) (59)
Specific provision for credit losses 122 299 317Change in collective allowance 19 63 6
Provision for credit losses (PCL) 141 362 323
Adjusted specific provision for credit losses (1) 91 281 317 PCL as a % of average net loans and acceptances (annualized) (2) 0.23% 0.60% 0.63%PCL as a % of average net loans and acceptances excluding purchased portfolios (annualized) (3) 0.49% 0.52% 0.64%Specific PCL as a % of average net loans and acceptances (annualized) (2) 0.20% 0.50% 0.62%Adjusted specific PCL as a % of average net loans and acceptances (annualized) (1) 0.17% 0.53% 0.62%
(1) Adjusted specific provision for credit losses excludes provisions related to the acquired M&I performing portfolio. (2) Ratio is presented including purchased portfolios and prior periods have been restated. (3) Ratio is presented excluding purchased portfolios, to provide for better historical comparisons.
Changes in Gross Impaired Loans and Acceptances (GIL) (1) (Canadian $ in millions, except as noted) Q1-2012 Q4-2011 Q1-2011
GIL, beginning of period 2,685 2,290 2,894Additions to impaired loans & acceptances (2) 624 732 474Reductions in impaired loans & acceptances (2) (3) (379) (124) (396)Write-offs (4) (273) (213) (233)
GIL, end of period (1) 2,657 2,685 2,739
GIL as a % of gross loans & acceptances (5) 1.09% 1.12% 1.33%GIL as a % of gross loans & acceptances excluding purchased portfolios (5) 1.04% 1.18% 1.33%GIL as a % of equity and allowances for credit losses (5) 8.74% 8.98% 11.46%GIL as a % of equity and allowances for credit losses excluding purchased portfolios (5) 7.39% 8.36% 11.47%
(1) GIL excludes purchased credit impaired loans. (2) Prior periods have been restated to reflect current treatment of formations and reductions. (3) Includes impaired amounts returned to performing status, loan sales, repayments, the impact of foreign exchange fluctuations and effects for consumer write-offs which have not been recognized in
formations. (4) Excludes certain loans that are written off directly and not classified as new formations ($104 million in Q1-2012; $105 million in Q4-2011; and $103 million in Q1-2011). (5) Ratio is presented including purchased portfolios and prior periods have been restated. Ratio is also presented excluding purchased portfolios, to provide for better historical comparisons.
This section contains adjusted results and measures which are non-GAAP. Please see the Non-GAAP Measures section.

12 BMO Financial Group First Quarter Report 2012
Total Trading and Underwriting Market Value
Exposure (MVE) Summary ($ millions)*
For the quarter ended January 31, 2012 Oct. 31
(Pre-tax Canadian equivalent) Quarter-end Average High Low 2011
Commodity VaR (0.3) (0.4) (0.5) (0.2) (0.3)Equity VaR (4.9) (5.7) (8.6) (4.1) (5.4)Foreign Exchange VaR (3.3) (3.9) (6.8) (0.9) (0.9)Interest Rate VaR (Mark-to-Market) (6.7) (8.1) (9.9) (6.5) (6.3)Diversification 7.6 7.0 nm nm 4.2
Trading Market VaR (7.6) (11.1) (15.9) (7.6) (8.7)Trading & Underwriting Issuer Risk (4.7) (4.4) (5.5) (3.3) (3.6)
Total Trading & Underwriting MVE (12.3) (15.5) (19.5) (12.3) (12.3)
Interest Rate VaR (AFS) (17.6) (14.3) (17.6) (12.0) (11.3)
* One-day measure using a 99% confidence interval. Losses are in brackets and benefits are presented as positive numbers.
nm- not meaningful
Total Trading Market Stressed
Value at Risk (VaR) Summary ($ millions)*
For the quarter ended January 31, 2012 Oct. 31
(Pre-tax Canadian equivalent) Quarter-end Average High Low 2011
Commodity Stressed VaR (0.9) (0.5) (0.9) (0.3) (0.3)Equity Stressed VaR (7.2) (8.7) (12.2) (5.6) (6.4)Foreign Exchange Stressed VaR (5.0) (7.2) (12.0) (1.6) (1.2)Interest Rate Stressed VaR (Mark-to-Market) (14.7) (16.6) (18.6) (13.8) (13.2)Diversification 12.2 11.4 nm nm 6.7
Trading Market Stressed VaR (15.6) (21.6) (27.4) (15.0) (14.4)
* One-day measure using a 99% confidence interval. Losses are in brackets and benefits are presented as positive numbers.
nm- not meaningful
Structural Balance Sheet Market Value Exposure and Earnings Volatility ($ millions)*
(Canadian equivalent) Jan. 31 2012 Oct 31. 2011
Market value exposure (MVE) (pre-tax) (619.1) (685.9)12-month earnings volatility (EV) (after-tax) (96.2) (95.0)
* Losses are in brackets. Measured at a 99% confidence interval.
Structural Balance Sheet Earnings and Value Sensitivity to Changes in Interest Rates ($ millions)* **
(Canadian equivalent) Economic value sensitivity
(Pre-tax)Earnings sensitivity over the next 12 months (After-tax)
Jan. 31 2012 Oct. 31 2011 Jan. 31 2012 Oct. 31 2011
100 basis point increase (553.6) (614.3) 19.3 24.8100 basis point decrease 364.3 441.8 (104.5) (102.5)
200 basis point increase (1,220.4) (1,295.7) 52.6 69.3200 basis point decrease 667.0 829.4 (94.3) (63.3)
* Losses are in brackets and benefits are presented as positive numbers. ** For BMO’s Insurance businesses, a 100 basis point increase in interest rates at January 31, 2012 results in an increase in earnings after tax of $95 million and an increase in before tax economic value of $544
million ($88 million and $436 million, respectively, at October 31, 2011). A 100 basis point decrease in interest rates at January 31, 2012 results in a decrease in earnings after tax of $85 million and a decrease in before tax economic value of $653 million ($82 million and $494 million, respectively, at October 31, 2011). These impacts are not reflected in the table above.
Income Taxes
As explained in the Revenue section, management assesses BMO’s consolidated results and associated provisions for income taxes on a GAAP basis. We assess the performance of the operating groups and associated income taxes on a taxable equivalent basis and report accordingly. The provision for income taxes of $313 million increased $51 million from the first quarter of 2011 and $53 million from the fourth quarter of 2011. The effective tax rate for the quarter was 22.0%, compared with 24.1% a year ago and 25.3% in the fourth quarter. The lower effective tax rate in the current quarter relative to the first quarter of 2011 was primarily due to higher income from entities not subject to tax, a 1.7 percentage point reduction in the statutory Canadian income tax rate in 2012 and a provision for prior periods’ income taxes recorded in the U.S. business segment of BMO Capital Markets in the first quarter of 2011. These factors were partially offset by a higher proportion of income from higher tax-rate jurisdictions. The lower effective tax rate in the current quarter relative to the fourth quarter of 2011 was primarily due to a higher proportion of income from entities not subject to tax and the reduction in the statutory Canadian income tax rate in 2012, partially offset by a lower proportion of tax-exempt income. The adjusted effective tax rate was 23.7% in the current quarter, compared with 24.5% in the first quarter of 2011 and 20.7% in the fourth quarter of 2011. The adjusted tax rate is computed using adjusted net income rather than net income in the determination of income subject to tax.
As explained in the Provision for Income Taxes section of BMO’s 2011 annual MD&A, to manage the impact of foreign exchange rate changes on BMO’s investments in foreign operations, BMO may hedge foreign exchange risk by partially or fully funding its foreign investment in U.S. dollars. The gain or loss from such hedging and the unrealized gain or loss from translation of the investments in U.S. operations are charged or credited to shareholders’ equity. For income tax purposes, the gain or loss on the hedging activities results in an income tax charge or credit in the current period in shareholders’ equity, while the associated unrealized gain or loss on the investments in U.S. operations does not incur income taxes until the investments are liquidated. The income tax charge or benefit arising from such hedging gains or losses is a function of the fluctuation in the Canadian/U.S. exchange rate from period to period. This hedging of the investments in U.S. operations has given rise to an income tax recovery in shareholders’ equity of $17 million for the quarter. Refer to the Consolidated Statement of Comprehensive Income included in the unaudited interim consolidated financial statements for further details. Information on additional hedging of our foreign exchange exposure due to investments in foreign operations is, with respect to the mitigation of potential volatility in our capital ratios, described below in the Capital Management Q1 2012 Regulatory Capital Review section. Adjusted results in this section are non-GAAP amounts or non-GAAP measures. Please see the Non-GAAP Measures section.
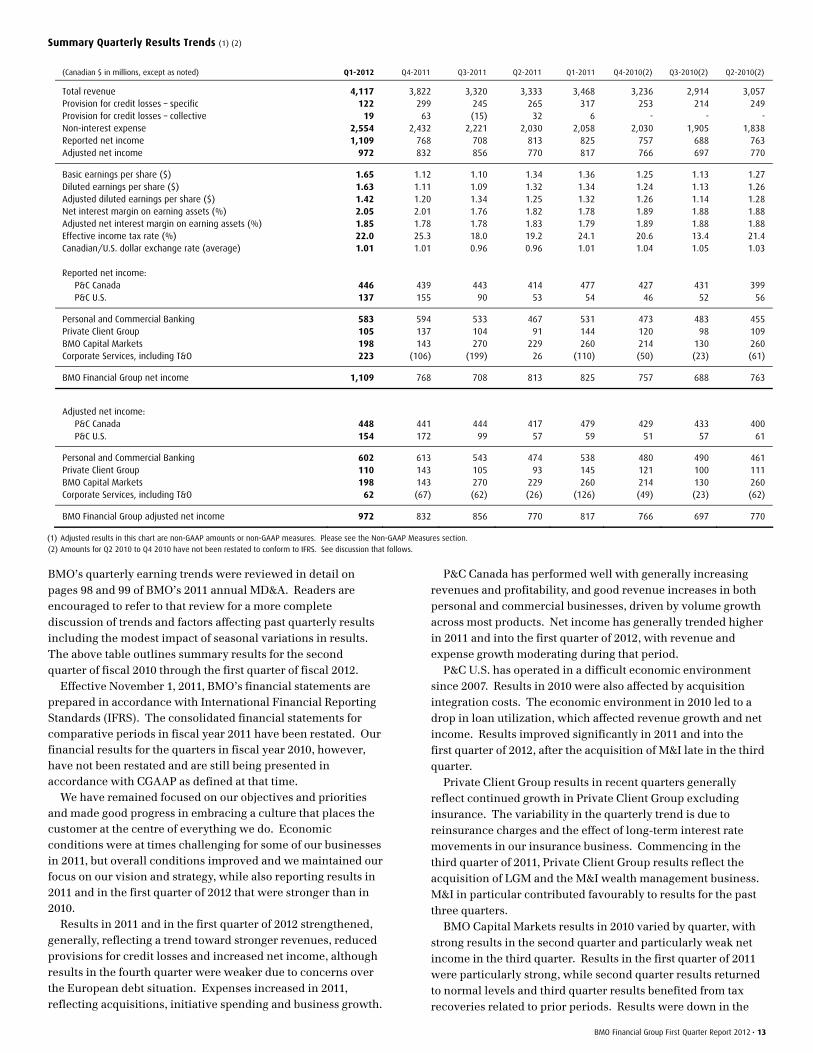
BMO Financial Group First Quarter Report 2012 13
Summary Quarterly Results Trends (1) (2)
(Canadian $ in millions, except as noted) Q1-2012 Q4-2011 Q3-2011 Q2-2011 Q1-2011 Q4-2010(2) Q3-2010(2) Q2-2010(2)
Total revenue 4,117 3,822 3,320 3,333 3,468 3,236 2,914 3,057 Provision for credit losses – specific 122 299 245 265 317 253 214 249 Provision for credit losses – collective 19 63 (15) 32 6 - - - Non-interest expense 2,554 2,432 2,221 2,030 2,058 2,030 1,905 1,838 Reported net income 1,109 768 708 813 825 757 688 763 Adjusted net income 972 832 856 770 817 766 697 770
Basic earnings per share ($) 1.65 1.12 1.10 1.34 1.36 1.25 1.13 1.27 Diluted earnings per share ($) 1.63 1.11 1.09 1.32 1.34 1.24 1.13 1.26 Adjusted diluted earnings per share ($) 1.42 1.20 1.34 1.25 1.32 1.26 1.14 1.28 Net interest margin on earning assets (%) 2.05 2.01 1.76 1.82 1.78 1.89 1.88 1.88 Adjusted net interest margin on earning assets (%) 1.85 1.78 1.78 1.83 1.79 1.89 1.88 1.88 Effective income tax rate (%) 22.0 25.3 18.0 19.2 24.1 20.6 13.4 21.4 Canadian/U.S. dollar exchange rate (average) 1.01 1.01 0.96 0.96 1.01 1.04 1.05 1.03 Reported net income: P&C Canada 446 439 443 414 477 427 431 399 P&C U.S. 137 155 90 53 54 46 52 56
Personal and Commercial Banking 583 594 533 467 531 473 483 455 Private Client Group 105 137 104 91 144 120 98 109 BMO Capital Markets 198 143 270 229 260 214 130 260 Corporate Services, including T&O 223 (106) (199) 26 (110) (50) (23) (61)
BMO Financial Group net income 1,109 768 708 813 825 757 688 763
Adjusted net income: P&C Canada 448 441 444 417 479 429 433 400 P&C U.S. 154 172 99 57 59 51 57 61
Personal and Commercial Banking 602 613 543 474 538 480 490 461 Private Client Group 110 143 105 93 145 121 100 111 BMO Capital Markets 198 143 270 229 260 214 130 260 Corporate Services, including T&O 62 (67) (62) (26) (126) (49) (23) (62)
BMO Financial Group adjusted net income 972 832 856 770 817 766 697 770
(1) Adjusted results in this chart are non-GAAP amounts or non-GAAP measures. Please see the Non-GAAP Measures section.
(2) Amounts for Q2 2010 to Q4 2010 have not been restated to conform to IFRS. See discussion that follows.
BMO’s quarterly earning trends were reviewed in detail on pages 98 and 99 of BMO’s 2011 annual MD&A. Readers are encouraged to refer to that review for a more complete discussion of trends and factors affecting past quarterly results including the modest impact of seasonal variations in results. The above table outlines summary results for the second quarter of fiscal 2010 through the first quarter of fiscal 2012. Effective November 1, 2011, BMO’s financial statements are prepared in accordance with International Financial Reporting Standards (IFRS). The consolidated financial statements for comparative periods in fiscal year 2011 have been restated. Our financial results for the quarters in fiscal year 2010, however, have not been restated and are still being presented in accordance with CGAAP as defined at that time. We have remained focused on our objectives and priorities and made good progress in embracing a culture that places the customer at the centre of everything we do. Economic conditions were at times challenging for some of our businesses in 2011, but overall conditions improved and we maintained our focus on our vision and strategy, while also reporting results in 2011 and in the first quarter of 2012 that were stronger than in 2010. Results in 2011 and in the first quarter of 2012 strengthened, generally, reflecting a trend toward stronger revenues, reduced provisions for credit losses and increased net income, although results in the fourth quarter were weaker due to concerns over the European debt situation. Expenses increased in 2011, reflecting acquisitions, initiative spending and business growth.
P&C Canada has performed well with generally increasing revenues and profitability, and good revenue increases in both personal and commercial businesses, driven by volume growth across most products. Net income has generally trended higher in 2011 and into the first quarter of 2012, with revenue and expense growth moderating during that period. P&C U.S. has operated in a difficult economic environment since 2007. Results in 2010 were also affected by acquisition integration costs. The economic environment in 2010 led to a drop in loan utilization, which affected revenue growth and net income. Results improved significantly in 2011 and into the first quarter of 2012, after the acquisition of M&I late in the third quarter. Private Client Group results in recent quarters generally reflect continued growth in Private Client Group excluding insurance. The variability in the quarterly trend is due to reinsurance charges and the effect of long-term interest rate movements in our insurance business. Commencing in the third quarter of 2011, Private Client Group results reflect the acquisition of LGM and the M&I wealth management business. M&I in particular contributed favourably to results for the past three quarters. BMO Capital Markets results in 2010 varied by quarter, with strong results in the second quarter and particularly weak net income in the third quarter. Results in the first quarter of 2011 were particularly strong, while second quarter results returned to normal levels and third quarter results benefited from tax recoveries related to prior periods. Results were down in the

14 BMO Financial Group First Quarter Report 2012
fourth quarter of 2011 and, to a lesser degree, in the first quarter of 2012 due to a difficult, but improving market environment. Corporate Services reported results are affected by adjusting items. Adjusted results have been generally more consistent, reflecting decreased provisions for credit losses and better revenues. The effective income tax rate can vary as it depends on the timing of resolution of certain tax matters, recoveries of prior periods’ income taxes and the relative proportion of earnings attributable to the different jurisdictions in which we operate. The U.S. dollar has generally weakened over the past two years. It weakened further in 2011 to levels close to parity, although the decrease in its value was less pronounced than in 2010. The U.S. dollar strengthened slightly in the first quarter of 2012. A stronger U.S. dollar increases the translated values of BMO’s U.S.-dollar-denominated revenues and expenses.
Balance Sheet
Total assets of $538.3 billion increased $37.7 billion from October 31, 2011. The increase primarily reflects increases in cash and cash equivalents and interest bearing deposits with banks of $21.5 billion, securities borrowed or purchased under resale agreements of $4.6 billion, securities of $4.3 billion, net loans and acceptances of $3.7 billion, and all other items totalling $3.6 billion. The $21.5 billion increase in cash and cash equivalents and interest bearing deposits with banks was primarily due to increased balances held with the Federal Reserve. The $4.3 billion increase in securities resulted primarily from an increase in available-for-sale securities. The $3.7 billion increase in net loans and acceptances was primarily due to an increase in loans to businesses and governments of $3.8 billion. There were also increases in residential mortgages and consumer instalment and other personal loans of $0.2 billion, respectively. This growth was offset by a reduction of $0.5 billion in credit card loans and customers’ liability under acceptances. The $3.6 billion increase in other items primarily related to increases in derivative assets, primarily in interest rate contracts. There was a comparable increase in derivative financial liabilities. Liabilities and equity increased $37.7 billion from October 31, 2011. The change primarily reflects increases in securities lent or sold under repurchase agreements of $19.9 billion, deposits of $14.2 billion, derivative financial liabilities of $4.2 billion and shareholders’ equity of $0.7 billion. There was a decrease in all other items totalling $1.3 billion. Securities lent or sold under repurchase agreements increased $19.9 billion mainly due to increased client-driven activities. Deposits by businesses and governments increased $14.6 billion primarily due to increased U.S. deposits and U.S. dollar wholesale funding. Deposits by individuals increased $0.3 billion while deposits by banks decreased $0.7 billion. The increase in shareholders’ equity of $0.7 billion in the fourth quarter reflects an increase in retained earnings. Contractual obligations by year of maturity are outlined in Table 20 on page 110 of BMO's 2011 Annual Report, in accordance with CGAAP. On this basis, there have been no material changes to contractual obligations that are outside the ordinary course of our business.
Capital Management
Q1 2012 Regulatory Capital Review
BMO remains well capitalized, with a Common Equity Ratio (based on Basel II) of 9.65%, and a Basel II Tier 1 Capital Ratio of 11.69% at January 31, 2012. Common Equity and Tier 1 capital were $20.1 and $24.4 billion, respectively. Risk-weighted assets (RWA) were $209 billion at January 31, 2012. The Common Equity Ratio was essentially unchanged and the Tier 1 Capital Ratio declined 32 basis points from the fourth quarter primarily due to lower capital, as explained below, but such ratios remain strong and well in excess of regulatory requirements.
Effective November 1, 2011, BMO adopted IFRS, which impacts our capital ratios on a prospective basis. The transition to IFRS reduced RWA and lowered retained earnings, which will ultimately reduce BMO’s Basel II Tier 1 Capital Ratio by approximately 60 basis points and increase the assets to capital multiple by 1.45x. Under OSFI transition guidance, BMO has elected to phase in the impact of lower Tier 1 capital over a five-quarter period. The impact of the IFRS transition in the first quarter of 2012 on our Basel II Tier 1 Capital Ratio was a 6 basis point reduction. The impact of lower RWA is not phased in and is fully recognized in the first quarter of 2012.
At January 31, 2012, BMO’s risk-weighted assets reflect changes to the Basel II Accord (“Basel 2.5” rules) for capitalizing certain trading book and structured-product risks. RWA of $209 billion, however, remains unchanged from October 31, 2011, as the requirements for additional Stressed VaR RWA under the Basel 2.5 rules were offset by lower RWA due to the transition to IFRS described above, improved risk assessments and lower Basel II market risk RWA.
Common equity (on a Basel II basis) at January 31, 2012, increased $0.1 billion from $20.0 billion at October 31, 2011. Retained earnings growth was offset by adjustments to retained earnings as part of the transition to IFRS, which, as noted above, is phased in over five quarters, and higher Basel II capital deductions due to the expiry of grandfathering rules related to capital deductions for insurance subsidiaries held prior to January 1, 2007. These adjustments had the effect of lowering the Common Equity Ratio (based on Basel II) by 8 basis points and 9 basis points, respectively. Excluding these adjustments, common equity increased by $0.6 billion due to retained earnings growth and the issuance of common shares through the Shareholder Dividend Reinvestment and Share Purchase Plan and the exercise of stock options, partly offset by higher deductions under Basel 2.5 rules. Basel II Tier 1 capital decreased $0.7 billion from October 31, 2011, primarily due to the redemption of $400 million BMO BOaTS – Series C in December and US$300 million Class B Preferred Shares Series 10 announced in January and completed in February. BMO’s Basel II Total Capital Ratio was 14.58% at January 31, 2012. The ratio decreased 27 basis points from 14.85% in the fourth quarter. Total capital decreased $0.5 billion to $30.4 billion, primarily due to the factors outlined above. The IFRS adjustments reflected in capital in the first quarter, described above, reduced the Tier 1 Capital Ratio and Total Capital Ratio by 6 and 2 basis points, respectively. Once fully phased in, the ultimate impact on the ratios will be 60 and 55 basis points, respectively. The end of the insurance subsidiary

BMO Financial Group First Quarter Report 2012 15
grandfathering rules reduced both the Common Equity Ratio and Tier 1 Capital Ratio by 9 basis points in the quarter. BMO’s Asset-to-Capital Multiple, a leverage ratio monitored by OSFI, was 15.37 at January 31, 2012. Under OSFI rules, a bank’s total assets should be no greater than 20 times its available capital, but OSFI may prescribe a lower multiple, or approve a multiple of up to 23, depending on a bank’s circumstances. BMO’s investments in U.S. operations are primarily denominated in U.S. dollars. As discussed above in the Income Taxes section, foreign exchange gains or losses on the translation of the investments in foreign operations to Canadian dollars are reported in shareholders’ equity (without attracting tax until realized). When coupled with the foreign exchange impact of U.S.-dollar-denominated RWA on Canadian-dollar-equivalent RWA, and with the impact of U.S.-dollar-denominated capital deductions on our Canadian dollar capital, this may result in volatility in the bank’s capital ratios. BMO may, as discussed above in the Income Taxes section, partially hedge this foreign exchange risk by funding its foreign investment in U.S. dollars and may, to reduce the impact of foreign exchange rate changes on the bank’s capital ratios, enter into forward currency contracts.
Pending Basel III Regulatory Capital Changes The Basel III capital rules, which will start to come into effect in January 2013, have now been largely outlined and BMO’s Basel III capital ratios are well-positioned for the adoption of the new requirements. We consider the Common Equity Ratio to be the primary capital ratio under Basel III. Based on our analysis and assumptions, BMO’s pro-forma January 31, 2012, Common Equity Ratio would be 7.2%, approximately 30 basis points higher than the fourth quarter. OSFI indicated in a public letter dated February 1, 2011, that it expects deposit-taking institutions to meet the Basel III capital requirements, including a 7% Common Equity Ratio target (4.5% minimum plus 2.5% capital conservation buffer), early in the Basel III transition period, which commences at the start of 2013. As such and as discussed below, BMO currently exceeds such expectations on a pro-forma basis. With retained earnings growth, BMO expects to maintain a Common Equity Ratio comfortably in excess of 7% when the rules come into effect in Canada in January 2013. The bank’s regulatory common equity, defined as common equity net of applicable regulatory capital adjustments, would decrease by approximately $2.7 billion from $18.9 billion under Basel II, based on full phase in of IFRS impacts, to $16.2 billion under Basel III, both as at January 31, 2012. Our RWA at January 31, 2012, would increase by approximately $16 billion from $209 billion under Basel II to $225 billion, primarily due to higher counterparty credit risk RWA of $14.1 billion, as well as the conversion of certain existing Basel II capital deductions to RWA. The Basel III pro-forma Tier 1 Capital Ratio at January 31, 2012, would be 9.1%, unchanged from the fourth quarter.
Under Basel III, Tier 1 capital at January 31, 2012, would decrease by approximately $2.9 billion from $23.3 billion under Basel II, based on full phase in of IFRS impacts, to $20.4 billion. BMO’s pro-forma Tier 1 Capital Ratio, Total Capital Ratio and Leverage Ratio exceed Basel III minimum requirements. The pro-forma calculations and statements in this section assume full implementation of announced Basel III regulatory capital requirements and proposals. In calculating the bank’s Basel III Tier 1 Capital Ratio, Basel III Total Capital Ratio and Leverage Ratio, we also assumed that the current non-common share Tier 1 and Tier 2 capital instruments were fully included in regulatory capital. These instruments do not meet Basel III capital requirements and will be subject to the grandfathering provisions and phased out over a nine-year period beginning January 1, 2013. We expect to be able to refinance non-common share capital instruments as and when necessary in order to meet applicable non-common share capital requirements. The Basel III pro-forma ratios do not reflect future management actions that may be taken to help mitigate the impact of the changes, the benefit of future growth in retained earnings, additional rule changes or factors beyond management’s control. Additional information on Basel III regulatory capital changes is available in the Enterprise-Wide Capital Management section on pages 61 to 65 of BMO’s 2011 annual MD&A.
Other Capital Developments
On January 19, 2012, BMO announced its intention to redeem all of its US$300 million Non-cumulative Perpetual Class B Preferred Shares Series 10, which were redeemed on February 25, 2012. During the quarter, 1,381,000 common shares were issued through the Shareholder Dividend Reinvestment and Share Purchase Plan and the exercise of stock options. On February 28, 2012, BMO announced that the Board of Directors declared a quarterly dividend payable to common shareholders of $0.70 per share, unchanged from a year ago and from the preceding quarter. The dividend is payable May 28, 2012, to shareholders of record on May 1, 2012. Common shareholders may elect to have their cash dividends reinvested in common shares of the bank in accordance with the bank's Shareholder Dividend Reinvestment and Share Purchase Plan (“Plan”). Under the Plan, the Board of Directors determines whether the common shares will be purchased in the secondary market or issued by the bank from treasury. At this time, the common shares purchased under the Plan will be issued from treasury with a two per cent discount from the average market price of the common shares, as defined in the Plan.

16 BMO Financial Group First Quarter Report 2012
Qualifying Regulatory Capital Basel II Regulatory Capital and Risk-Weighted Assets
(Canadian $ in millions) Q1-2012 Q4-2011
Gross common shareholders’ equity 24,709 24,455IFRS phase in not applicable to common equity 88 -Goodwill and excess intangible assets (3,656) (3,585)Securitization-related deductions (34) (168)Expected loss in excess of allowance – AIRB Approach (233) (205)Substantial investments/Investments in insurance subsidiaries (659) (481)Other deductions (75) -
Adjusted common shareholders’ equity 20,140 20,016Non-cumulative preferred shares 2,464 2,861Innovative Tier 1 Capital Instruments 1,857 2,156Non-controlling interest in subsidiaries 26 38IFRS phase in only applicable to Tier 1 capital (88) -
Adjusted Tier 1 Capital 24,399 25,071
Subordinated debt 5,813 5,896Trust subordinated notes 800 800Accumulated net after-tax unrealized gains on available-for-
sale equity securities 1 7Eligible portion of collective allowance for credit losses 359 309
Total Tier 2 Capital 6,973 7,012Securitization-related deductions (34) (31)Expected loss in excess of allowance – AIRB Approach (233) (205)Substantial Investments/Investment in insurance subsidiaries (659) (855)
Adjusted Tier 2 Capital 6,047 5,921
Total Capital 30,446 30,992
Risk-Weighted Assets
(Canadian $ in millions) Q1-2012 Q4-2011
Credit risk 175,073 179,092Market risk 8,719 4,971Operational risk 24,958 24,609
Total risk-weighted assets 208,750 208,672
Caution
The foregoing sections contain forward-looking statements. Please see the Caution Regarding Forward-Looking Statements. The foregoing sections contain adjusted results and measures, which are non-GAAP. Please see the Non-GAAP Measures section.
Outstanding Shares and Securities Convertible into Common Shares
As at February 22, 2012
Number of shares or
dollar amount
Common shares 640,404,902Class B Preferred Shares Series 5 $ 200,000,000 Series 13 $ 350,000,000 Series 14 $ 250,000,000
Series 15 $ 250,000,000Series 16 $ 300,000,000
Series 18 $ 150,000,000Series 21 $ 275,000,000Series 23 $ 400,000,000
Series 25 $ 290,000,000Convertible into common shares: Class B Preferred Shares (1) Series 10 US$ 300,000,000Stock options – vested 9,736,000 – non-vested 8,670,000
(1) Convertible preferred shares may be exchanged for common shares on specific dates on a pro-
rata basis based on 95% of the average trading price of common shares for the 20 days ending four days prior to the exchange date. The series 10 shares were redeemed on February 25, 2012.
Details on share capital are outlined in the 2011 Annual Report in Note 20 to the audited
consolidated financial statements on pages 154 to 155.
Eligible Dividends Designation
For the purposes of the Income Tax Act (Canada) and any similar provincial and territorial legislation, BMO designates all dividends paid or deemed to be paid on both its common and preferred shares as “eligible dividends”, unless indicated otherwise.
Credit Rating
The credit ratings assigned to BMO’s short-term and senior long-term debt securities by external rating agencies are important in the raising of both capital and funding to support our business operations. Maintaining strong credit ratings allows us to access the capital markets at competitive pricing levels. Should our credit ratings experience a material downgrade, our cost of funds would likely increase significantly and our access to funding and capital through capital markets could be reduced. A material downgrade of our ratings could have other consequences, including those set out in Note 10 on page 140 of our annual consolidated financial statements. BMO’s senior debt credit ratings were unchanged in the quarter and have a stable outlook. All four ratings are indicative of high-grade, high-quality issues. The ratings are as follows: DBRS (AA); Fitch (AA-); Moody’s (Aa2); and Standard & Poor’s (A+). These credit ratings are also disclosed in the Financial Highlights section located near the beginning of this document.
Transactions with Related Parties
In the ordinary course of business, we provide banking services to our directors and executives and their affiliated entities, joint ventures and equity-accounted investees on the same terms that we offer to our customers for those services. A select suite of customer loan and mortgage products is offered to our employees at rates normally made available to our preferred customers. We also offer employees a fee-based subsidy on annual credit card fees. Stock options and deferred share units granted to directors and preferred rate loan agreements for executives, relating to transfers we initiate, are both discussed in Note 27 to the audited consolidated financial statements on page 169 of BMO’s 2011 Annual Report.
Off-Balance-Sheet Arrangements
BMO enters into a number of off-balance-sheet arrangements in the normal course of operations. The most significant of these are Credit Instruments, Special Purpose Entities and Guarantees, which are described on pages 66 to 68 and 70 of BMO’s 2011 annual MD&A as well as in Notes 4 and 6 to the attached unaudited interim consolidated financial statements. Under IFRS, we now consolidate our structured credit vehicles, U.S. customer securitization vehicle, BMO Capital Trust II and BMO Subordinated Notes Trust. See the Select Financial Instruments section for comments on any significant changes to these arrangements during the quarter ended January 31, 2012.

BMO Financial Group First Quarter Report 2012 17
Accounting Policies and Critical Accounting Estimates
Effective this quarter, BMO’s consolidated financial statements are prepared in accordance with International Financial Reporting Standards (IFRS). References to GAAP mean IFRS, unless otherwise indicated. Significant accounting policies under IFRS are described in Note 1 to the attached unaudited interim consolidated financial statements, together with a discussion of certain accounting estimates that are considered particularly important as they require management to make significant judgments, some of which relate to matters that are inherently uncertain. Readers are encouraged to review that discussion. The consolidated financial statements for comparative periods have been restated to conform to the current presentation. Our consolidated financial statements were previously prepared in accordance with CGAAP as defined at that time. Changes in accounting as a result of conforming to IFRS are described more fully in Note 18 to the attached unaudited interim consolidated financial statements.
Future Changes in Accounting Policies
The International Accounting Standards Board (“IASB”) has issued amendments to the standard for financial instrument disclosures, which require additional disclosure on the transfer of financial assets, including the possible effects of any residual risks that the transferring entity retains. These amendments are effective for BMO for our annual disclosures as at October 31, 2012. In addition, effective November 1, 2013, we will also adopt new standards on Employee Benefits, Fair Value Measurement, Consolidated Financial Statements, Investment in Associates and Joint Ventures, and Offsetting. Additional information on the new standards and amendments to existing standards can be found in Note 1 of the attached unaudited interim consolidated financial statements.
Select Financial Instruments
Pages 65 to 69 of BMO’s 2011 annual MD&A provide enhanced disclosure relating to select financial instruments that, commencing in 2008 and based on subsequent assessments, markets had come to regard as carrying higher risk. Readers are encouraged to review that disclosure to assist in understanding the nature and extent of BMO’s exposures. We follow a practice of reporting on significant changes in the select financial instruments, if any, in our interim MD&A. Under IFRS, we now consolidate our structured investment vehicles, our Canadian credit protection vehicle and our U.S. customer securitization vehicle. There has been no change to the structure of our economic exposure. The amount drawn on the liquidity facilities BMO provides for the structured investment vehicles was lowered to US$2.3 billion and €nil million at the end of the quarter, down from US$2.6 billion and €230 million at the end of fiscal 2011. The decrease was attributable to asset sales and asset maturities. The book value of the subordinated capital notes at quarter end was US$420 million and €60 million for Links and Parkland, respectively, compared with US$440 million and €104 million, respectively, at October 31, 2011. Subsequent to year end, the remaining assets in Parkland have been sold and the proceeds used to retire the outstanding exposure to BMO and other creditors. Parkland intends to distribute the remaining proceeds to capital noteholders, and it is anticipated that the Directors of Parkland will then commence its winding up.
Select Geographic Exposures
BMO’s geographic exposure is subject to a country risk management framework that incorporates economic and political assessments, and management of exposure within limits based on product, entity and the country of ultimate risk. Our exposure to select countries of interest, as at January 31, 2012, is set out in the tables that follow. While we are closely monitoring exposures to Greece, Ireland, Italy, Portugal and Spain (GIIPS), the tables include a broader group of countries of interest in Europe with gross exposure greater than $500 million. The first table outlines portfolio total gross and net exposure for lending, securities, repo-style transactions and derivatives. These totals are broken down by counterparty type in the subsequent tables. Credit default swap exposure by counterparty is provided separately. The bank’s direct exposures in GIIPS are primarily to banks for trade finance and trading products. Exposures remain modest at net $155 million, plus $48 million of unfunded commitments. In addition, our Irish subsidiary is required to maintain reserves with the Irish central bank. These totalled $75 million at the end of the quarter. Our net direct exposure to the other Eurozone countries (the other 12 countries that share a common euro currency) totalled approximately $4.7 billion, of which 66% was to counterparties in countries with a Aaa/AAA rating by both Moody’s and S&P, with almost 100% rated Aaa/AAA by one or other of the rating agencies. Our net direct exposure to the rest of Europe totalled approximately $3.6 billion, of which 95% was to counterparties in countries with a Moody’s/S&P rating of Aaa/AAA. A significant majority of our sovereign exposure consists of tradeable cash products, while exposure to banks was comprised of trading instruments, short-term debt, derivative positions and letters of credit and guarantees. In addition to the exposures shown in the table, we have exposure to European supranational institutions totalling $0.85 billion, predominantly in the form of tradeable cash products, as well as $0.58 billion of European central bank exposure. The bank also has exposure to entities in a number of European countries through our credit protection vehicle, U.S. customer securitization vehicle and structured investment vehicles. These exposures are not included in the tables due to the credit protection incorporated in their structures. The bank has direct credit exposure to those structures, which in turn have exposures to loans or securities originated by entities in Europe. As noted on pages 65 to 69 of BMO’s 2011 annual MD&A, these structures all have first-loss protection and hedges are in place for our credit protection vehicle. The notional exposure held in our credit protection vehicle to issuers in Greece, Italy and Spain represented 0.5%, 1.3% and 1.1%, respectively, of its total notional exposure. Notional exposure to the other 12 countries that share the Euro currency was 14.1% of total notional exposure, of which 78.5% was rated investment grade by S&P (69.2% by Moody’s). The notional exposure to the remainder of Europe was 16.3% of the total notional exposure with 70.3% rated investment grade by S&P (63.7% by Moody’s). The bank is well protected as a result of both first-loss protection and hedges that are in place. The bank has exposure to GIIPS and other European countries through our U.S. customer securitization vehicle, which has reliance on 2.9% of loans or securities originated by entities in Europe. Exposure to Germany is the largest at 1.2%. Exposure to

18 BMO Financial Group First Quarter Report 2012
Spain is less than 0.1% and there is no exposure to Italy, Ireland, Greece or Portugal. The structured investment vehicles’ (SIVs) par value exposure to entities in European countries totals $1,060 million, of which there is $2 million exposure to GIIPS, $324 million to the other Eurozone countries and $734 million to the rest of Europe. The largest exposures include the United Kingdom at $668 million and Netherlands at $176 million. These values include exposure through CBO and CLO investments, which have credit exposures to borrowers or issuers operating in Europe. BMO’s indirect exposure to Europe in the form of Euro-denominated collateral to support trading activity was €689 million in securities issued by entities in European countries and €218 million of cash collateral at January 31, 2012. Of this amount, €25 million was held in GIIPS related securities and €341 million was in German securities. Indirect exposure by way of guarantees from entities in European countries totals $417 million, of which there is $nil exposure to GIIPS, $204 million to the other Eurozone countries and $213 million to the rest of Europe. Indirect exposure is managed through our credit risk management framework, with a robust assessment of the counterparty. Reliance may be placed on collateral or guarantees as part of specific product structures, such as repurchase agreements.
The bank’s credit default swap (CDS) exposures in Europe are also outlined in a table that follows. As part of our credit risk management framework, purchased CDS risk is controlled through a regularly reviewed list of approved counterparties. The maturity of CDS exposures are off-setting in nature, typically contain matched contractual terms and are attributable to legacy credit trading strategies that have been in run-off since 2008. Maturity mismatches in the run-off portfolio are not material, and where they exist, the purchased credit protection generally extends beyond the maturity date of the offsetting bond or CDS contract. There are two exceptions where the purchased protection expires prior to the reference obligation; these total €19 million and have maturity mismatches of less than 3 months. These have been netted in the tables. In addition, two European exposures totalling €50 million of sold protection are hedged on a proxy basis, and have not been netted in the tables. Of this exposure, €20 million is to Italian counterparties and the remainder is outside GIIPS. BMO’s direct credit exposures in North Africa and the Middle East totals $1.0 billion, of which $738 million is in Turkey, $105 million in Morocco and $73 million in United Arab Emirates. Of the exposure to Turkey, $249 million is insured through approved Export Credit Agencies. Exposure to the remaining countries is modest, and the bank has no direct exposure in Syria. The exposure is almost entirely with bank counterparties, in trade finance or trade related products.

BMO Financial Group First Quarter Report 2012 19
European Exposure7 by Country and Counterparty (Canadian $ in millions) As at January 31, 2012 Lending (1) Securities (2) Repo-Style Trans.(3) Derivatives (4) Total
Country Commitments Funded
Gross Net
Gross Net
Gross Net of
Coll. Gross Net
GIIPS Greece 3 3 55 - - - - - 58 3 Ireland (5) - - 28 - - - 65 3 93 3
Italy 1 1 211 26 34 - 13 5 259 32 Portugal 70 22 125 - - - - - 195 22 Spain 81 81 312 - - - 17 14 410 95
Total - GIIPS 155 107 731 26 34 - 95 22 1,015 155
Eurozone (excluding GIIPS) France 38 38 1,236 877 853 1 351 58 2,478 974
Germany 130 130 2,149 1,638 1,089 8 143 33 3,511 1,809 Netherlands 289 184 698 554 99 3 84 12 1,170 753 Other (6) 585 406 794 681 - - 99 41 1,478 1,128
Total – Eurozone (excluding GIIPS) 1,042 758 4,877 3,750 2,041 12 677 144 8,637 4,664
Rest of Europe Denmark 8 8 809 809 405 - 3 3 1,225 820
Norway 15 15 1,043 1,043 - - 24 24 1,082 1,082 Sweden - - 121 2 479 3 8 1 608 6 United Kingdom 466 238 1,842 1,149 1,717 9 623 117 4,648 1,513 Other (6) 179 169 676 - 110 3 29 12 994 184
Total - Rest of Europe 668 430 4,491 3,003 2,711 15 687 157 8,557 3,605
Total - All of Europe 1,865 1,295 10,099 6,779 4,786 27 1,459 323 18,209 8,424 Details of the summary amounts reflected in the columns above are provided in the tables that follow. (1) Lending includes loans and trade finance. (2) Securities include cash products, insurance investments and traded credit.
Gross traded credit includes only the long positions and excludes offsetting short positions.
(3) Repo-style transactions are all with bank counterparties. (4) Derivatives amounts are marked-to-market, incorporating transaction netting
and, for counterparties where a credit support annex is in effect, collateral offsets. Derivative replacement risk net of collateral for all of Europe is approximately $3.4 billion.
(5) Does not include Irish subsidiary reserves with Irish central bank of $75 million. (6) Includes countries with less than $500 million in net exposure. Other Eurozone
includes exposures to Austria, Belgium, Cyprus, Finland, Luxembourg, Slovakia and Slovenia. Other Europe includes exposures to Croatia, Czech Republic, Hungary, Iceland, Poland, Russian Federation and Switzerland.
(7) The bank also has exposure to entities in a number of European countries through our credit protection vehicle, U.S. customer securitization vehicle and structured investment vehicles. These exposures are not included in the tables due to the credit protection incorporated in their structures.
(8) Sovereign includes sovereign-backed bank cash products.
European Lending Exposure7 by Country and Counterparty (Canadian $ in millions) As at January 31, 2012
Lending (1)
Commitments Funded
Country Bank Corporate Sovereign Total Bank Corporate Sovereign Total
GIIPS
Greece 3 - - 3 3 - - 3 Ireland (5) - - - - - - - - Italy 1 - - 1 1 - - 1 Portugal 20 50 - 70 20 2 - 22
Spain 81 - - 81 81 - - 81
Total - GIIPS 105 50 - 155 105 2 - 107
Eurozone (excluding GIIPS) France 38 - - 38 38 - - 38 Germany 50 5 75 130 50 5 75 130 Netherlands 28 261 - 289 28 156 - 184
Other (6) 525 60 - 585 379 27 - 406
Total - Eurozone (excluding GIIPS) 641 326 75 1,042 495 188 75 758
Rest of Europe Denmark 8 - - 8 8 - - 8 Norway 15 - - 15 15 - - 15 Sweden - - - - - - - -
United Kingdom 128 338 - 466 128 110 - 238 Other (6) 163 16 - 179 163 6 - 169
Total - Rest of Europe 314 354 - 668 314 116 - 430
Total - All of Europe 1,060 730 75 1,865 914 306 75 1,295 Refer to footnotes in first table.

20 BMO Financial Group First Quarter Report 2012
European Securities Exposure7 by Country and Counterparty (Canadian $ in millions) As at January 31, 2012
Securities (2)
Gross Net
Country Bank Corporate Sovereign (8) Total Bank Corporate Sovereign (8) Total
GIIPS
Greece - - 55 55 - - - -
Ireland (5) - 3 25 28 - - - - Italy 62 37 112 211 - 26 - 26 Portugal - - 125 125 - - - - Spain 149 118 45 312 - - - -
Total - GIIPS 211 158 362 731 - 26 - 26
Eurozone (excluding GIIPS)
France 106 156 974 1,236 3 - 874 877 Germany 75 388 1,686 2,149 - 4 1,634 1,638 Netherlands 449 94 155 698 413 7 134 554 Other (6) 107 39 648 794 107 39 535 681
Total - Eurozone (excluding GIIPS) 737 677 3,463 4,877 523 50 3,177 3,750
Rest of Europe
Denmark 266 - 543 809 266 - 543 809 Norway 387 - 656 1,043 387 - 656 1,043 Sweden 1 119 1 121 1 - 1 2 United Kingdom 303 490 1,049 1,842 59 41 1,049 1,149 Other (6) 16 100 560 676 - - - -
Total - Rest of Europe 973 709 2,809 4,491 713 41 2,249 3,003
Total - All of Europe 1,921 1,544 6,634 10,099 1,236 117 5,426 6,779
Refer to footnotes in first table.
European Repo & Derivatives Exposure7 by Country and Counterparty (Canadian $ in millions) As at January 31, 2012
Repo-Style Trans. (3) Derivatives (4)
Gross Net of
Coll. Gross Net of Collateral
Country Total Total Bank Corporate Sovereign Total Bank Corporate Sovereign Total
GIIPS
Greece - - - - - - - - - - Ireland (5) - - 64 1 - 65 3 - - 3 Italy 34 - 12 1 - 13 4 1 - 5
Portugal - - - - - - - - - - Spain - - 17 - - 17 14 - - 14
Total - GIIPS 34 - 93 2 - 95 21 1 - 22
Eurozone (excluding GIIPS) France 853 1 351 - - 351 58 - - 58 Germany 1,089 8 143 - - 143 33 - - 33
Netherlands 99 3 84 - - 84 12 - - 12 Other (6) - - 94 1 4 99 36 1 4 41
Total - Eurozone (excluding GIIPS) 2,041 12
672 1 4 677
139 1 4 144
Rest of Europe Denmark 405 - 3 - - 3 3 - - 3 Norway - - 1 - 23 24 1 - 23 24 Sweden 479 3 8 - - 8 1 - - 1 United Kingdom 1,717 9 608 11 4 623 102 11 4 117
Other (6) 110 3 29 - - 29 12 - - 12
Total - Rest of Europe 2,711 15 649 11 27 687 119 11 27 157
Total - All of Europe 4,786 27 1,414 14 31 1,459 279 13 31 323
Refer to footnotes in first table.

BMO Financial Group First Quarter Report 2012 21
Credit Default Swaps by Country and Credit Quality (Canadian $ in millions) As at January 31, 2012
Fair Value Notional
Purchased Written Purchased Written
Country Inv.
Grade
Non-Inv.
Grade
Inv.
Grade
Non-Inv.
Grade Total Total
Exposure
Inv. Grade
Non-Inv.
Grade Total
Inv.
Grade
Non-Inv.
Grade Total Total
Exposure
GIIPS
Greece 36 - (36) - (36) - (55) - (55) 55 - 55 - Ireland (5) 6 - (6) - (6) - (29) - (29) 29 - 29 - Italy 18 - (18) - (18) - (286) - (286) 292 - 292 6 Portugal 49 - (49) - (49) - (125) - (125) 125 - 125 - Spain 12 - (12) (1) (13) (1) (280) (20) (300) 281 18 299 (1)
Total - GIIPS 121 - (121) (1) (122) (1) (775) (20) (795) 782 18 800 5
Eurozone (excluding GIIPS)
France 4 - (3) - (3) 1 (464) (13) (477) 449 - 449 (28) Germany 5 - (3) - (3) 2 (913) - (913) 861 26 887 (26) Netherlands 0 - 1 - 1 1 (204) (20) (224) 180 13 193 (31) Other (6) 6 - (7) - (7) (1) (255) - (255) 308 - 308 53
Total - Eurozone (excluding GIIPS) 15 -
(12) - (12) 3 (1,836) (33) (1,869)
1,798 39 1,837 (32)
Rest of Europe Denmark - - - - - - (32) - (32) 32 - 32 - Norway - - - - - - - - - - - - - Sweden (1) - 2 - 2 1 (150) (7) (157) 156 - 156 (1) United Kingdom 7 - (5) - (5) 2 (920) - (920) 860 46 906 (14) Other (6) 27 - (27) - (27) - (864) (25) (889) 868 8 876 (13)
Total - Rest of Europe 33 -
(30) - (30) 3 (1,966) (32) (1,998)
1,916 54 1,970 (28)
Total - All of Europe 169 -
(163) (1) (164) 5 (4,577) (85) (4,662)
4,496 111 4,607 (55) Refer to footnotes in first table.
Notes: - All purchased and written exposures are with bank counterparties, with the exception of $33 million of written notional exposure to German counterparties. - 24% of purchased and 25% of written exposure is subject to complete restructuring trigger events. - 76% of purchased and 75% of written exposure is subject to modified-modified restructuring trigger.

22 BMO Financial Group First Quarter Report 2012
U.S. Legislative and Regulatory Developments
On July 21, 2010, U.S. President Obama signed into law the Dodd-Frank Wall Street Reform and Consumer Protection Act (the Dodd-Frank Act). The Act is broad in scope and the reforms include heightened consumer protection, regulation of the over-the-counter derivatives markets, restrictions on proprietary trading and sponsorship of private investment funds by banks (referred to as the Volcker Rule), imposition of heightened prudential standards and broader application of leverage and risk-based capital requirements. The reforms also include greater supervision of systemically significant payment, clearing or settlement systems, restrictions on interchange fees, and the creation of a new financial stability oversight council of regulators with the objective of increasing stability by monitoring systemic risks posed by financial services companies and their activities. Many provisions of the Dodd-Frank Act continue to be subject to rulemaking and will take effect over several years, making it difficult to anticipate at this time the overall impact on BMO or the financial services industry as a whole. As rulemaking evolves, we are continually monitoring developments to ensure we are well-positioned to respond to and implement any required changes. We anticipate an increase in regulatory compliance costs, and will be focused on managing the complexity and breadth of the regulatory changes. The U.S. federal banking agencies and the Securities and Exchange Commission have jointly issued proposed rules to implement the Volcker Rule, which prohibits banking entities and their affiliates from certain proprietary trading and specified relationships with hedge funds and private equity funds. As currently proposed, the rule requires the implementation of a comprehensive compliance program and monitoring of certain quantitative risk metrics effective July 16, 2012. Banking entities must conform existing activities with the Volcker Rule by July 2014. In addition, under the Dodd-Frank Act, over-the-counter derivatives will be subject to a comprehensive regulatory regime.
Certain derivatives will be required to be centrally cleared or traded on an exchange. Registration, reporting, business conduct and capital and margin requirements are also being finalized. The Board of Governors of the Federal Reserve System (FRB) has issued for comment a proposed rulemaking (the Proposed Rule) that would implement the Dodd-Frank Act’s enhanced prudential standards and early remediation requirements. The Proposed Rule would establish new requirements relating to risk-based capital, leverage limits, liquidity standards, risk-management framework, concentration and credit exposure limits, resolution planning and credit exposure reporting. If implemented in its current form, the Proposed Rule would apply to BMO’s U.S. bank holding company subsidiary but not to BMO. The FRB has indicated that it intends to propose later this year a rule designed specifically for the top level of foreign-domiciled bank holding companies, such as BMO. BMO is currently assessing and preparing for the impact of these proposed rules on its operations. The restrictions on interchange fees under the Dodd-Frank Act became effective on October 1, 2011, and are expected to lower P&C U.S. pre-tax net income on an annual basis by approximately US$40 million, after the mitigating effects of related management actions. Pursuant to Federal Reserve Board requirements, our subsidiary BMO Financial Corp. (BFC) submitted a three year capital plan to the Federal Reserve Board of Chicago in January 2012. Under Federal Reserve rules, as a bank holding company with more than $50 billion in assets, BFC will be required to participate in an annual stress test exercise conducted by the Federal Reserve and to submit an annual capital plan to the Federal Reserve.

BMO Financial Group First Quarter Report 2012 23
Review of Operating Groups’ Performance
Operating Groups’ Summary Income Statements and Statistics for Q1-2012 Q1-2012
(Canadian $ in millions, except as noted) P&C PCG BMO CM
Corporate
including T&O Total BMO
Net interest income (teb) (1) 1,741 164 287 126 2,318Non-interest revenue 596 531 485 187 1,799
Total revenue (teb) (1) 2,337 695 772 313 4,117Provision for credit losses 224 4 24 (111) 141Non-interest expense 1,306 557 483 208 2,554
Income before income taxes 807 134 265 216 1,422Income taxes (recovery) (teb) (1) 224 29 67 (7) 313
Reported net income Q1-2012 583 105 198 223 1,109Reported net income Q4-2011 594 137 143 (106) 768Reported net income Q1-2011 531 144 260 (110) 825
Adjusted net income Q1-2012 602 110 198 62 972Adjusted net income Q4-2011 613 143 143 (67) 832Adjusted net income Q1-2011 538 145 260 (126) 817
Other statistics
Net economic profit (2) 242 53 75 64 434Return on equity 17.4% 19.6% 17.4% nm 17.2%Adjusted return on equity 18.0% 20.5% 17.4% nm 15.0%Operating leverage (7.6%) (12.4%) (18.3%) nm (5.4%)Adjusted operating leverage (6.0%) (11.3%) (18.3%) nm (7.6%)Productivity ratio (teb) 55.9% 80.2% 62.6% nm 62.0%Adjusted productivity ratio (teb) 54.7% 79.2% 62.6% nm 63.5%Net interest margin on earning assets (teb) 3.31% 3.80% 0.61% nm 2.05%Adjusted net interest margin (teb) 3.31% 3.80% 0.61% nm 1.85%Average common equity 12,858 2,088 4,313 5,105 24,364Average earning assets ($ billions) 209.0 17.2 186.4 36.2 448.8Full-time equivalent staff 24,531 6,534 2,287 13,708 47,060
(1) Operating group revenues, income taxes and net interest margin are stated on a taxable equivalent basis (teb). The group teb adjustments are offset in Corporate Services, and Total BMO revenue, income taxes and net interest margin are stated on a GAAP basis.
(2) Net economic profit is a non-GAAP measure. Please see the Non-GAAP Measures section.
Adjusted results in this chart are non-GAAP amounts or non-GAAP measures. Please see the Non-GAAP Measures section. nm – not meaningful
The following sections review the financial results of each of our operating segments and operating groups for the first quarter of 2012. Periodically, certain business lines and units within the business lines are transferred between client groups to more closely align BMO’s organizational structure with its strategic priorities. Results for prior periods are restated to conform to the current presentation.
Effective in the first quarter of 2012, Private Client Group and P&C Canada have entered into a revised agreement sharing the financial results related to retail Mutual Fund sales. Prior periods have been restated. Corporate Services is generally charged (or credited) with differences between the periodic provisions for credit losses charged to the client groups under our expected loss provisioning methodology and the periodic provisions required under GAAP.

24 BMO Financial Group First Quarter Report 2012
Personal and Commercial Banking (P&C)
(Canadian $ in millions, except as noted) Q1-2012
Increase (Decrease)
vs. Q1-2011
Increase (Decrease)
vs. Q4-2011
Net interest income (teb) 1,741 338 24% (8) (1%)Non-interest revenue 596 61 12% - -
Total revenue (teb) 2,337 399 21% (8) -Provision for credit losses 224 51 30% 8 4%Non-interest expense 1,306 288 28% 24 2%
Income before income taxes 807 60 8% (40) (5%)Income taxes (teb) 224 8 4% (29) (12%)
Reported net income 583 52 10% (11) (2%)
Adjusted net income 602 64 12% (11) (2%)
Return on equity 17.4% (10.3%) (1.8%)Adjusted return on equity 18.0% (10.1%) (1.9%)Operating leverage (7.6%) nm nmAdjusted operating leverage (6.0%) nm nmProductivity ratio (teb) 55.9% 3.3% 1.2%Adjusted productivity ratio (teb) 54.7% 2.5% 1.2%Net interest margin on earning assets (teb) 3.31% 0.11% (0.02%)Average earning assets ($ billions) 209.0 35.1 20% 0.6 -
Adjusted results in this chart are non-GAAP amounts or non-GAAP measures. Please see the Non-GAAP Measures section. nm – not meaningful
The Personal and Commercial Banking (P&C) operating group represents the sum of our two retail and business banking operating segments, Personal and Commercial Banking Canada (P&C Canada) and Personal and Commercial Banking U.S. (P&C U.S.). These operating segments are reviewed separately in the sections that follow.
Personal and Commercial Banking Canada (P&C Canada)
(Canadian $ in millions, except as noted) Q1-2012
Increase (Decrease)
vs. Q1-2011
Increase (Decrease)
vs. Q4-2011
Net interest income (teb) 1,109 (1) - 10 1%Non-interest revenue 447 (23) (5%) (12) (3%)
Total revenue (teb) 1,556 (24) (2%) (2) -Provision for credit losses 138 2 2% - -Non-interest expense 813 34 4% 5 1%
Income before income taxes 605 (60) (9%) (7) (1%)Provision for income taxes (teb) 159 (29) (15%) (14) (8%)
Reported net income 446 (31) (7%) 7 1%
Adjusted net income 448 (31) (6%) 7 1%
Personal revenue 963 (5) (1%) (7) (1%)Commercial revenue 593 (19) (3%) 5 1%Operating leverage (5.7%) nm nmProductivity ratio (teb) 52.2% 2.9% 0.4%Net interest margin on earning assets (teb) 2.90% (0.11%) 0.02%Average earning assets ($ billions) 152.3 5.8 4% 1.0 1%
Adjusted results in this chart are non-GAAP amounts or non-GAAP measures. Please see the Non-GAAP Measures section. nm – not meaningful

BMO Financial Group First Quarter Report 2011 25
Q1 2012 vs Q1 2011
P&C Canada net income of $446 million was down $31 million or 6.7% from a year ago. Results a year ago benefited from a securities gain of $17 million after tax. Reported results reflect provisions for credit losses in BMO’s operating groups on an expected loss basis. On a basis that adjusts reported results to reflect provisions on an actual loss basis and excludes the securities gain, P&C Canada’s net income was down $5 million or 1.2% from a year ago. Revenue decreased $24 million or 1.5% but was unchanged when adjusted for the securities gain. Revenue reflects the combination of volume growth across most products and lower net interest margins. Net interest margin declined 11 basis points, driven by lower deposit spreads in a low interest rate environment, competitive pricing pressure and lower refinancing fees on mortgages. In the personal banking segment, revenue was $5 million lower. Higher volumes across most products were more than offset by a less favourable mix and lower net interest margin. Total personal lending balances (including mortgages, Homeowner ReadiLine and other consumer lending products) increased 4.8% year over year, while total personal lending market share decreased. Personal cards loan balances increased 0.9% while market share also increased year over year. Our goal is to grow market share while remaining attentive to the credit quality of the portfolio. We continue to focus on improving the total personal lending business through investment and improved productivity in the sales force. Personal deposit balances increased 4.0% year over year due to increases in retail operating deposits. Market share for both retail operating and term deposits decreased year over year. In the commercial banking segment, revenue increased year over year by $5 million or 0.8% after adjusting for the securities gain in the prior year, due to volume growth across all products and favourable changes in product mix, partially offset by lower net interest margin.
Commercial loan balances increased 3.5% year over year. We continue to rank second in Canadian business banking market share of small and mid-sized business loans. Commercial cards balances declined 3.8% primarily due to expected attrition in Diners Club North American franchise card balances, while commercial deposit balances grew 7.4%. Non-interest expense increased $34 million or 4.2%, due to the current impact of 2011 initiative spending including higher front-line staffing levels. The group’s operating leverage was negative 5.7%. Average current loans and acceptances increased $6.2 billion or 4.2% from a year ago, while personal and commercial deposits grew $5.2 billion or 5.1%.
Q1 2012 vs Q4 2011
Net income increased $7 million or 1.4%. On a basis that adjusts reported results to reflect provisions on an actual loss basis, net income increased $23 million or 5.4%. Results in the quarter include the effects of a more favourable statutory Canadian income tax rate. Revenue decreased $2 million or 0.2% reflecting higher volumes across most products and lower retail cards revenues. Net interest margin was essentially flat. Non-interest expense was $5 million higher, due to $7 million of stock-based compensation for employees eligible to retire that is expensed in the first quarter of each year. Average current loans and acceptances increased $1.1 billion or 0.7% from last quarter, while personal and commercial deposits grew $2.0 billion or 1.9%.

26 BMO Financial Group First Quarter Report 2012
Personal and Commercial Banking U.S. (P&C U.S.)
(Canadian $ in millions, except as noted) Q1-2012
Increase (Decrease)
vs. Q1-2011
Increase (Decrease)
vs. Q4-2011
Net interest income (teb) 632 339 +100% (18) (3%)Non-interest revenue 149 84 +100% 12 9%
Total revenue (teb) 781 423 +100% (6) (1%)Provision for credit losses 86 49 +100% 8 10%Non-interest expense 493 254 +100% 19 4%
Income before income taxes 202 120 +100% (33) (14%)Provision for income taxes (teb) 65 37 +100% (15) (19%)
Reported net income 137 83 +100% (18) (11%)
Adjusted net income 154 95 +100% (18) (10%)
Operating leverage 11.6% nm nmAdjusted operating leverage 16.7% nm nmProductivity ratio (teb) 63.2% (3.5%) 2.9%Adjusted productivity ratio (teb) 60.1% (5.0%) 3.0%Net interest margin on earning assets (teb) 4.43% 0.19% (0.09%)Adjusted net interest margin on earning assets 4.43% 0.19% (0.09%)Average earning assets ($ billions) 56.7 29.3 +100% (0.3) (1%)
U.S. Select Financial Data (US$ in millions, except as noted) Net interest income (teb) 623 332 +100% (22) (3%)Non-interest revenue 148 83 +100% 12 9%
Total revenue (teb) 771 415 +100% (10) (1%)Non-interest expense 487 250 +100% 15 3%Reported net Income 135 81 +100% (18) (11%)Adjusted net income 152 93 +100% (19) (11%)Average earning assets (US$ billions) 56.0 28.8 +100% (0.6) (1)
Adjusted results in this chart are non-GAAP amounts or non-GAAP measures. Please see the Non-GAAP Measures section. nm – not meaningful
Q1 2012 vs Q1 2011 (in U.S. $)
Net income of $135 million increased $81 million from $54 million a year ago. Adjusted net income, which adjusts for the amortization of acquisition-related intangible assets, was $152 million, up $93 million from a year ago, of which $89 million was attributable to the acquired business. Revenue of $771 million increased $415 million from a year ago, of which $393 million was attributable to the acquired business. The remaining $22 million or 6.2% increase was due to increased deposit balances, higher securities gains, improved loan spreads as a result of a favourable change in mix of loan balances and higher lending fees, partially offset by deposit spread compression. Net interest margin increased by 19 basis points, due to increased deposit balances and improved loan spreads as well as the impact of the acquired business. These benefits were partially offset by deposit spread compression. Non-interest expense of $487 million increased $250 million. Adjusted non-interest expense of $463 million, which excludes $24 million of amortization of acquisition-related intangible assets, was $232 million higher, with $213 million due to the impact of the acquired business. Excluding M&I, adjusted expenses increased $19 million or 8.1% from a year ago, primarily due to a litigation expense and higher valuation adjustment on our serviced mortgage portfolio. Average current loans and acceptances more than doubled, increasing $26.9 billion year over year to $51.0 billion as a result of the acquired business. Excluding M&I, growth in commercial loans was largely offset by decreases in mortgages and home equity balances.
Average deposits also doubled, increasing $31.9 billion year over year to $58.4 billion. The deposits of the acquired business of M&I contributed $28.4 billion to growth in average balances. Excluding the acquired business, average deposits increased $3.5 billion, primarily due to growth in our commercial business.
Q1 2012 vs Q4 2011 (in U.S. $)
Net income decreased $18 million or 11% from the prior quarter. Adjusted net income decreased $19 million or 11%, due to lower net interest income, lower interchange revenue, as expected, and a higher provision for credit losses under BMO’s expected loss provisioning methodology. Revenue decreased $10 million or 1.2%, primarily due to lower interchange revenue. The benefit of higher securities gains and increased deposit balances was offset by deposit spread compression and lower loan spreads and balances. Net interest margin decreased by 9 basis points, as the benefit of increased deposit balances was more than offset by deposit spread compression and lower loans spreads. Non-interest expense increased $15 million or 3.2%. Adjusted non-interest expense increased $17 million or 3.9% primarily due to the litigation expense in the current quarter. Average current loans and acceptances decreased $0.8 billion from the prior quarter as commercial banking loan growth in key segments was more than offset by decreases in personal banking loans and declines in commercial real estate and run-off portfolios, as expected. Average deposits increased $1.0 billion from the prior quarter, primarily due to growth in our commercial business. Adjusted results in this section are non-GAAP amounts or non-GAAP measures. Please see the Non-GAAP Measures section.

BMO Financial Group First Quarter Report 2012 27
Private Client Group (PCG)
(Canadian $ in millions, except as noted) Q1-2012
Increase (Decrease)
vs. Q1-2011
Increase (Decrease)
vs. Q4-2011
Net interest income (teb) 164 57 53% 42 34%Non-interest revenue 531 (31) (6%) (53) (9%)
Total revenue (teb) 695 26 4% (11) (2%)Provision for credit losses 4 2 67% 1 29%Non-interest expense 557 78 16% 23 4%
Income before income taxes 134 (54) (29%) (35) (21%)Provision for income taxes (teb) 29 (15) (33%) (3) (8%)
Reported net income 105 (39) (28%) (32) (24%)
Adjusted net income 110 (35) (24%) (33) (23%)
Adjusted return on equity 20.5% (25.4%) (10.8%)Return on equity 19.6% (25.8%) (10.4%)Operating leverage (12.4%) nm nmProductivity ratio (teb) 80.2% 8.5% 4.5%Adjusted productivity ratio (teb) 79.2% 7.8% 4.4%Net interest margin on earning assets (teb) 3.80% 0.81% 0.89%Average earning assets 17,154 2,987 21% 529 3%
U.S. Select Financial Data (US$ in millions, except as noted) Total revenue (teb) 190 117 +100% 23 14%Non-interest expense 139 74 +100% 5 4%Reported net income 32 27 +100% 12 55%Adjusted net income 35 30 +100% 10 44%Average earning assets 2,970 820 38% (99) (3%)
Adjusted results in this chart are non-GAAP amounts or non-GAAP measures. Please see the Non-GAAP Measures section. nm – not meaningful
Q1 2012 vs Q1 2011
Net income was $105 million, down $39 million or 28% from a year ago. We experienced an approximately $56 million net income decline due to year-over-year unfavourable movements in long-term interest rates that impacted our insurance business results. This decline resulted from the after-tax effect of unfavourable movements in long-term interest rates of approximately $47 million in the current quarter and the favourable effect of approximately $9 million a year ago. On a basis that excludes this impact, PCG net income increased $17 million or 12% from a year ago. Net income in PCG excluding insurance was $93 million, up 27% from a year ago. Insurance net income was $12 million, down $59 million.
Revenue was $695 million, up $26 million or 3.9% from a year ago. Revenue in PCG excluding insurance was $662 million, up 20% from a year ago. Higher revenues from our acquisitions and higher than usual asset management revenues from a strategic investment were partly offset by lower brokerage revenues as a result of challenging equity market conditions. The insurance revenue decline resulted from the pre-tax effect of unfavourable movements in long-term interest rates of approximately $65 million in the current quarter and the favourable effect of approximately $12 million a year ago. Net interest income grew from the prior year due to earnings from our acquisitions, strategic investments and higher private banking loan and deposit balances. The stronger U.S. dollar increased both revenue and expense by $1 million.
Non-interest expense was $557 million, up $78 million or 16% primarily due to acquisitions. The productivity ratio of 80.2% increased 850 basis points from the prior year primarily due to the impact of unfavourable movements in long-term interest rates on revenues.
Assets under management and administration grew by $156 billion to $435 billion, but were relatively unchanged excluding the impact of acquisitions and the stronger U.S. dollar.
Q1 2012 vs Q4 2011
Net income decreased $32 million or 24% from the fourth quarter, but was only modestly lower excluding the after-tax effect of movements in long-term interest rates of approximately $47 million in the current quarter and approximately $19 million in the fourth quarter of 2011. PCG net income excluding insurance decreased $4 million or 3.9% and insurance net income decreased $28 million or 71%. Revenue decreased $11 million or 1.6%. PCG revenue excluding insurance was up 3.2% primarily due to the higher than usual asset management revenues from a strategic investment, as underlying business revenues were relatively unchanged. Insurance revenue declined primarily due to the impact of unfavourable market movements of approximately $65 million in the current quarter and approximately $26 million in the prior quarter. Net interest income grew primarily due to higher earnings from a strategic investment. The stronger U.S. dollar increased revenue by $1 million or 0.2%. Non-interest expense increased $23 million or 4.3%, primarily due to higher stock-based compensation including costs for employees eligible to retire that are expensed each year in the first quarter. The stronger U.S. dollar increased expenses by $1 million or 0.2%. The productivity ratio of 80.2% increased 450 basis points from the prior quarter. Assets under management and administration improved by $10 billion or 2.3% from the prior quarter, and by $8 billion or 2.0% when adjusted for the impact of the stronger U.S. dollar, due to new client assets and improved equity market conditions.

28 BMO Financial Group First Quarter Report 2012
BMO Capital Markets (BMO CM)
(Canadian $ in millions, except as noted) Q1-2012
Increase (Decrease)
vs. Q1-2011
Increase (Decrease)
vs. Q4-2011
Net interest income (teb) 287 (54) (16%) 30 12%Non-interest revenue 485 (133) (22%) 49 11%
Total revenue (teb) 772 (187) (20%) 79 11%Provision for credit losses 24 (6) (20%) (6) (19%)Non-interest expense 483 (6) (1%) (2) (1%)
Income before income taxes 265 (175) (40%) 87 49%Provision for income taxes (teb) 67 (113) (63%) 32 92%
Reported net income 198 (62) (24%) 55 39%
Adjusted net income 198 (62) (24%) 55 39%
Trading Products revenue 513 (82) (14%) 77 18%Investment and Corporate Banking 259 (105) (29%) 2 1%Return on equity 17.4% (8.4%) 3.5%Operating leverage (18.3%) nm nmProductivity ratio (teb) 62.6% 11.6% (7.4%)Adjusted productivity ratio (teb) 62.6% 11.6% (7.5%)Net interest margin on earning assets (teb) 0.61% (0.22%) 0.03%Average earning assets ($ billions) 186.4 23.2 14% 9.9 6%
U.S. Select Financial Data (US$ in millions, except as noted) Total revenue (teb) 244 (39) (14%) 11 6%Non-interest expense 200 5 2% (10) (4%)Reported net income 21 29 +100% 14 +100%Adjusted net income 21 29 +100% 14 +100%Average earning assets (US$ billions) 70.2 11.3 19% 1.2 2%
Adjusted results in this chart are non-GAAP amounts or non-GAAP measures. Please see the Non-GAAP Measures section. nm – not meaningful
Q1 2012 vs Q1 2011
Net income was $198 million, a decrease of $62 million or 24% from the previous year. Included in the prior year’s net income was a provision for prior periods’ income taxes in the U.S. segment. Revenue decreased $187 million or 20% from the levels of a year ago, to $772 million. In the first quarter of 2011, our strong revenue growth was driven by increases in trading revenue, strong mergers and acquisitions activity and higher underwriting fees. In the first quarter of 2012, while trading revenue was solid, it was not at the same level as a year ago. However, the significant decline in revenues relative to the previous year was in merger and acquisition and equity underwriting fees, as markets were not as robust given the continued impact of pressures from Europe, which overshadowed some of the rebound in the United States. Results from our lending business were consistent with a year ago. The stronger U.S. dollar increased revenue by $2 million relative to a year ago. There was a reduction in the provision for credit losses, which is charged to the groups on an expected loss basis. Return on equity was 17.4%, compared with 25.8% a year ago. Non-interest expense decreased $6 million or 1.2%, primarily due to lower variable compensation costs, which is in line with revenue performance, partially offset by increases in technology and support costs. The stronger U.S. dollar increased expenses by $1 million relative to a year ago.
Q1 2012 vs Q4 2011
Net income increased $55 million or 39% from the previous quarter. Revenue was $79 million or 11% higher, as market conditions have shown signs of improvement from the previous quarter. Revenue growth was driven by a significant improvement in trading revenues, primarily in interest and equity trading. There were also increases in revenues from our lending and interest-rate-sensitive businesses. The stronger U.S. dollar increased revenue by $2 million relative to the previous quarter. Non-interest expense decreased $2 million mainly due to a decrease in professional fees, partially offset by an increase in stock-based compensation costs for employees eligible to retire that are expensed in the first quarter of the year. The stronger U.S. dollar increased expenses by $1 million relative to the previous quarter.

BMO Financial Group First Quarter Report 2012 29
Corporate Services, Including Technology and Operations
(Canadian $ in millions, except as noted) Q1-2012
Increase (Decrease)
vs. Q1-2011
Increase (Decrease)
vs. Q4-2011
Net interest income before group teb offset 178 251 +100% (7) (3%)Group teb offset (52) 9 16% (1) (3%)
Net interest income (teb) 126 260 +100% (8) (6%)Non-interest revenue 187 151 +100% 243 +100%
Total revenue (teb) 313 411 +100% 235 +100%Provision for credit losses (111) (229) (+100%) (224) (+100%)Non-interest expense 208 136 +100% 77 59%
Profit before income taxes 216 504 +100% 382 +100%Provision for income taxes (recovery) (teb) (7) 171 96% 53 89%
Reported net income 223 333 +100% 329 +100%
Adjusted total revenue (teb) (61) 57 +48% 13 18%Adjusted provision for credit losses (161) (273) +100% (193) (+100%)Adjusted non-interest expense 66 (6) (8%) (7) (10%)Adjusted net income 62 188 +100% 129 +100%
U.S. Select Financial Data (US$ in millions, except as noted) Total revenue (teb) 189 246 +100% (29) (13%)Provision for credit losses (148) (233) (+100%) (252) (+100%)Non-interest expense 100 99 +100% 26 35%Income taxes provision (recovery) (teb) 64 147 +100% 64 +100%Reported net income 173 233 +100% 133 +100%Adjusted net income 122 184 +100% 148 +100%
Adjusted results in this chart are non-GAAP amounts or non-GAAP measures. Please see the Non-GAAP Measures section.
Corporate Services
Corporate Services consists of the corporate units that provide enterprise-wide expertise and governance support in a variety of areas, including strategic planning, risk management, finance, legal and compliance, communications and human resources. Operating results reflect the impact of certain asset-liability management activities, run-off structured credit activities, the elimination of teb adjustments and the impact of our expected loss provisioning methodology. BMO’s practice is to charge loss provisions to the client operating groups each year, using an expected loss provisioning methodology based on each group’s share of expected credit losses. Corporate Services is generally charged (or credited) with differences between the periodic provisions for credit losses charged to the client operating groups under our expected loss provisioning methodology and provisions required under GAAP.
Technology and Operations
Technology and Operations (T&O) manages, maintains and provides governance over information technology, operations services, real estate and sourcing for BMO Financial Group. T&O focuses on enterprise-wide priorities that improve service quality and efficiency to deliver an excellent customer experience.
Financial Performance Review
Technology and Operations operating results are included with Corporate Services for reporting purposes. However, the costs of T&O services are transferred to the three operating groups (P&C, PCG and BMO Capital Markets) and only minor amounts are retained in T&O results. As such, results in this section largely reflect the corporate activities outlined in the preceding description of the Corporate Services unit. Corporate Services net income for the quarter was $223 million, an improvement of $333 million from a year ago. Corporate Services’ results reflect a number of items and activities that are excluded from BMO’s adjusted results to help assess BMO’s
performance. These adjusting items are not reflective of core operating results. They are itemized in the following Non-GAAP Measures section. All adjusting items are recorded in Corporate Services except the amortization of acquisition-related intangible assets, which is included in the operating groups. The adjusting items include a restructuring charge of $46 million after tax to align BMO Capital Markets’ cost structure with the current and future business environment. This action to improve our efficiency is part of the broader effort underway in the bank to improve productivity. As a result, the charge was reflected in Corporate Services. Adjusted net income was $62 million, an improvement of $188 million from a year ago. Adjusted revenues were $58 million better, mainly due to higher gains on the sale of securities and hedging losses in the prior year including losses that related to securitization programs. Adjusted expenses were $6 million lower. Adjusted provisions for credit losses were better by $273 million in part due to improved credit conditions and a resulting recovery of credit losses recorded in Corporate Services under BMO’s expected loss provisioning methodology in the current quarter compared with a provision a year ago. The current period includes a $142 million ($88 million after-tax) recovery of provisions for credit losses on M&I purchased credit impaired loans. Corporate Services net income in the current quarter increased $329 million relative to the fourth quarter. Adjusted net income increased $129 million. Adjusted revenues were $14 million higher. Adjusted expenses were $7 million lower. Adjusted provisions for credit losses were $193 million lower due to the $142 million recovery discussed above as well as improved credit conditions. There was no provision or recovery on the purchased credit impaired loans in the fourth quarter. Adjusted results in this section are non-GAAP amounts or non-GAAP measures. Please see the Non-GAAP Measures section.

30 BMO Financial Group First Quarter Report 2012
GAAP and Related Non-GAAP Measures used in the MD&A (Canadian $ in millions, except as noted) Q1-2012 Q4-2011 Q1-2011
Reported Results Revenue 4,117 3,822 3,468Non-interest expense (2,554) (2,432) (2,058)
Pre-provision, pre-tax earnings 1,563 1,390 1,410Provision for credit losses (141) (362) (323)Provision for income taxes (313) (260) (262)
Net Income 1,109 768 825
Reported Measures (1) EPS ($) 1.63 1.11 1.34Net income growth (%) 34.4 1.4 22.1EPS growth (%) 21.6 (10.5) 19.6Revenue growth (%) 18.7 18.1 14.4Non-interest expense growth (%) 24.1 19.9 11.5Productivity ratio (%) 62.0 63.7 59.3Operating leverage (%) (5.4) (1.8) 2.9Return on equity (%) 17.2 12.7 17.8
Adjusting Items (Pre-tax) Credit-related items on the acquired M&I performing loan portfolio (2) 184 173 -Run-off structured credit activities (3) 136 (119) 20M&I integration costs (4) (70) (53) -M&I acquisition-related costs (4) - (4) -Amortization of acquisition-related intangible assets (4) (34) (34) (9)Decrease (increase) in the collective allowance for credit losses - 17 (6)Restructuring costs (4) (68) - -
Reduction in pre-tax income due to adjusting items in reported results 148 (20) 5
Adjusting Items (After-tax) Credit-related items on the acquired M&I performing loan portfolio 114 107 -Run-off structured credit activities 136 (119) 20M&I integration costs (43) (35) -M&I acquisition-related costs - (4) -Amortization of acquisition-related intangible assets (24) (25) (8)Decrease (increase) in the collective allowance for credit losses - 12 (4)Restructuring costs (46) - -
Adjusting items in net income 137 (64) 8EPS ($) 0.21 (0.09) 0.02
Adjusted Results (5) Revenue 3,743 3,670 3,448Non-interest expense (2,378) (2,341) (2,049)
Pre-provision, pre-tax earnings 1,365 1,329 1,399Provision for credit losses (91) (281) (317)Provision for income taxes (302) (216) (265)
Adjusted net Income 972 832 817
Adjusted Measures (1) (5) EPS ($) 1.42 1.20 1.32Net income growth (%) 18.9 8.8 20.3EPS growth (%) 7.6 (4.8) 16.8Revenue growth (%) 8.5 13.4 13.7Non-interest expense growth (%) 16.1 16.0 11.5Productivity ratio (%) 63.5 63.8 59.4Operating leverage (%) (7.6) (2.6) 2.2Return on equity (%) 15.0 13.9 17.6
(1) Adjusted results in this chart are non-GAAP amounts or non-GAAP measures. Please see the Non-GAAP Measures section.
(2) Comprised of $234 million of net interest income, $31 million of specific provisions for credit losses and $19 million of collective provisions in Q1, 2012; and $271 million of net interest income, $18 million of
specific provisions for credit losses and $80 million of collective provisions in Q4, 2011.
(3) Substantially all included in trading revenue, in non-interest revenue.
(4) Included in non-interest expense.
(5) Amounts for periods prior to fiscal 2011 have not been restated to conform to IFRS. As a result, growth measures for 2011 may not be meaningful.

BMO Financial Group First Quarter Report 2012 31
Non-GAAP Measures
Results and measures in the interim MD&A are presented on a GAAP basis. They are also presented on an adjusted basis that excludes the impact of certain items as set out in the preceding GAAP and Related Non-GAAP Measures used in the MD&A table. Management assesses performance on both a reported and adjusted basis and considers both bases to be useful in assessing underlying, ongoing business performance. Presenting results on both bases provides readers with an enhanced understanding of how management views results. It also permits readers to assess the impact of the specified items on results for the periods presented and to better assess results excluding those items if they consider the items to not be reflective of ongoing results. As such, the presentation may facilitate readers’ analysis of trends as well as comparisons with our competitors. Adjusted results and measures are non-GAAP and as such do not have standardized meaning under GAAP. They are unlikely to be comparable to similar measures presented by other companies and should not be viewed in isolation from or as a substitute for GAAP results. Details of adjustments are also set out in the Adjusted Net Income section. Certain of the adjusting items relate to expenses that arise as a result of acquisitions including the amortization of acquisition-related intangible assets, and are adjusted because the purchase decision may not consider the amortization of such assets to be a relevant expense. Certain other acquisition-related costs in respect of the acquired business have been designated as adjusting items due to the significance of the amounts and the fact that they can impact trend analysis as some of the costs are incurred with the intent to benefit future periods. Certain other items have also been designated as adjusting items due to their effects on trend analysis. They include changes in the collective allowance and credit-related amounts in respect of the acquired M&I portfolio, structured credit run-off activities and restructuring charges.
Net economic profit represents net income available to common shareholders after deduction of a charge for capital, and is considered an effective measure of added economic value. Income before provision for credit losses and income taxes (pre-provision, pre-tax earnings) is considered useful information as it provides a measure of performance that excludes the effects of credit losses and income taxes, which can at times mask performance because of their size and variability.
In the first quarter of 2012, adjusting items totalled a net benefit of $137 million after tax, comprised of a $114 million after-tax net benefit of credit-related items in respect of the acquired M&I performing loan portfolio (including $234 million in net interest income, net of a $50 million provision for credit losses and related income taxes of $70 million); costs of $70 million ($43 million after tax) for the integration of the acquired business; a $34 million ($24 million after tax) charge for amortization of acquisition-related intangible assets on all acquisitions; the benefit of run-off structured credit activities of $136 million ($136 million after tax) primarily included in trading revenue; and a restructuring charge of $68 million ($46 million after tax) related to restructuring parts of BMO Capital Markets to position it for the future. This action is part of the broader effort underway in the bank to improve productivity. Adjusting items were charged to Corporate Services with the exception of the amortization of acquisition-related intangible assets, which was charged to the operating groups as follows: P&C Canada $3 million ($2 million after tax); P&C U.S. $24 million ($17 million after tax); and Private Client Group $7 million ($5 million after tax). In the first quarter of 2011, adjusting items totalled a net benefit of $8 million, comprised of a $20 million ($20 million after tax) benefit due to run-off structured credit activities, primarily included in trading revenue, a $9 million ($8 million after tax) charge for the amortization of acquisition-related intangible assets and a collective provision for credit losses of $6 million ($4 million after tax). All of the above adjusting items were charged to Corporate Services except for the amortization of acquisition-related intangible assets, which was charged to the operating groups as follows: P&C Canada $2 million ($2 million after tax); P&C U.S. $5 million ($5 million after tax); and Private Client Group $2 million ($1 million after tax). In the fourth quarter of 2011, adjusting items totalled a net charge of $64 million after tax. Adjusting items consisted of a $107 million after-tax net benefit of credit-related items in respect of the M&I performing loan portfolio (including $271 million in net interest income and a $98 million provision for credit losses, net of related income taxes of $66 million); $53 million ($35 million after tax) for the integration costs of the acquired business; a $34 million ($25 million after tax) charge for amortization of acquisition-related intangible assets on all acquisitions; a $119 million charge ($119 million after tax) from the results of run-off structured credit activities, primarily included in trading revenue; a $17 million ($12 million after tax) collective provision for credit losses; and a $4 million ($4 million after tax) charge for M&I acquisition costs. Adjusting items were charged to Corporate Services with the exception of the amortization of acquisition-related intangible assets, which was charged to the operating groups as follows: P&C Canada $3 million ($2 million after tax); P&C U.S. $25 million ($17 million after tax); and Private Client Group $6 million ($6 million after tax).

32 BMO Financial Group First Quarter Report 2012
Interim Consolidated Financial Statements
Consolidated Statement of Income (Unaudited) (Canadian $ in millions, except as noted) For the three months ended
January 31,
2012
October 31,
2011
July 31,
2011
April 30,
2011
January 31,
2011
Interest, Dividend and Fee Income
Loans $ 2,868 $ 3,020 $ 2,462 $ 2,332 $ 2,389 Securities 591 484 574 542 576Deposits with banks 45 44 39 38 24
3,504 3,548 3,075 2,912 2,989
Interest Expense Deposits 628 674 674 651 694Subordinated debt 49 43 43 38 33Capital trust securities (Note 11) 16 18 18 18 22Other liabilities 493 551 537 513 523
1,186 1,286 1,272 1,220 1,272
Net Interest Income 2,318 2,262 1,803 1,692 1,717
Non-Interest Revenue Securities commissions and fees 285 292 297 317 309Deposit and payment service charges 240 246 205 188 195Trading revenues (losses) 345 (15) 100 220 244Lending fees 160 152 146 142 153Card fees 167 188 171 159 171Investment management and custodial fees 172 176 131 94 95Mutual fund revenues 159 157 164 158 154Underwriting and advisory fees 78 76 141 143 152Securities gains, other than trading 42 61 31 47 50Foreign exchange, other than trading 39 11 38 52 29Insurance income 46 74 47 40 122Other 66 142 46 81 77
1,799 1,560 1,517 1,641 1,751
Total Revenue 4,117 3,822 3,320 3,333 3,468
Provision for credit losses (Note 2) 141 362 230 297 323
Non-Interest Expense Employee compensation (Note 14) 1,446 1,311 1,212 1,110 1,194Premises and equipment 455 464 388 380 346Amortization of intangible assets 83 81 58 42 50Travel and business development 128 106 100 90 86Communications 72 75 63 61 60Business and capital taxes 12 14 12 14 11Professional fees 123 154 223 141 106Other 235 227 165 192 205
2,554 2,432 2,221 2,030 2,058
Income Before Provision for Income Taxes 1,422 1,028 869 1,006 1,087
Provision for income taxes 313 260 161 193 262
Net Income $ 1,109 $ 768 $ 708 $ 813 $ 825
Attributable to:
Bank shareholders 1,090 749 690 795 807 Non-controlling interest in subsidiaries 19 19 18 18 18
Net Income $ 1,109 $ 768 $ 708 $ 813 $ 825
Earnings Per Share (Canadian $) (Note 15) Basic $ 1.65 $ 1.12 $ 1.10 $ 1.34 $ 1.36Diluted 1.63 1.11 1.09 1.32 1.34
The accompanying notes are an integral part of these interim consolidated financial statements.

BMO Financial Group First Quarter Report 2012 33
Interim Consolidated Financial Statements
Consolidated Statement of Comprehensive Income (Unaudited) (Canadian $ in millions) For the three months ended
January 31,
2012
October 31,
2011 July 31,
2011
April 30,
2011
January 31,
2011
Net income $ 1,109 $ 768 $ 708 $ 813 $ 825 Other Comprehensive Income
Net change in unrealized gains (losses) on available-for-sale securities
Unrealized gains (losses) on available-for-sale securities arising during the period (net of income tax (provision) recovery of $10, $(20), $(33), $30 and $12) (30) 23 54 (33) (26) Reclassification to earnings of (gains) losses in the period (net of income tax provision (recovery) of $22, $37, $(1), $(4) and $19) (33) (67) (7) 7 (37)
(63) (44) 47 (26) (63)
Net change in unrealized gains (losses) on cash flow hedges
Gains (losses) on cash flow hedges arising during the period (net of income tax (provision) recovery of $(19), $(89), $(84), $(19) and $55) 46 230 208 40 (150) Reclassification to earnings of (gains) losses on cash flow hedges (net of income tax provision (recovery) of $nil, $11, $(1), $10 and $(11)) - (30) 2 (22) 29
46 200 210 18 (121)
Net gain (loss) on translation of net foreign operations
Unrealized gain (loss) on translation of net foreign operations 133 759 64 (679) (234)
Impact of hedging unrealized gain (loss) on translation of net foreign operations (net of income tax provision (recovery) of $17, $144, $10, $(116) and $(64)) (48) (317) (23) 299 164
85 442 41 (380) (70)
Other Comprehensive Income (Loss) 68 598 298 (388) (254)
Total Comprehensive Income $ 1,177 $ 1,366 $ 1,006 $ 425 $ 571
Attributable to:
Bank shareholders 1,158 1,347 988 407 553
Non-controlling interest in subsidiaries 19 19 18 18 18
Total Comprehensive Income $ 1,177 $ 1,366 $ 1,006 $ 425 $ 571
The accompanying notes are an integral part of these interim consolidated financial statements.

34 BMO Financial Group First Quarter Report 2012
Interim Consolidated Financial Statements
Consolidated Balance Sheet (Unaudited) (Canadian $ in millions) As at
January 31,
2012
October 31,
2011
July 31,
2011
April 30,
2011
January 31,
2011
November 1,
2010
Assets
Cash and Cash Equivalents $ 39,553 $ 19,676 $ 33,126 $ 24,500 $ 20,769 $ 17,460
Interest Bearing Deposits with Banks 7,603 5,980 7,049 5,309 5,493 5,157
Securities
Trading 71,018 69,925 72,671 72,548 74,405 72,704 Available-for-sale 54,545 51,426 47,141 41,594 43,460 45,924 Other 825 764 810 797 880 884
126,388 122,115 120,622 114,939 118,745 119,512
Securities Borrowed or Purchased Under Resale Agreements (Note 2) 42,608 37,970 38,301 33,040 35,887 28,102
Loans (Notes 2 and 5)
Residential mortgages 81,317 81,075 80,977 74,507 74,825 74,782 Consumer instalment and other personal 59,688 59,445 58,035 52,189 51,751 51,159 Credit cards 7,871 8,038 8,026 7,688 7,690 7,777
Businesses and governments 88,719 84,883 82,995 65,680 65,140 66,512
237,595 233,441 230,033 200,064 199,406 200,230
Customers’ liability under acceptances 6,782 7,227 7,000 6,620 7,194 7,001
Allowance for credit losses (Note 2) (1,756) (1,783) (1,706) (1,763) (1,836) (1,964)
242,621 238,885 235,327 204,921 204,764 205,267
Other Assets Derivative instruments 58,219 55,113 47,359 43,901 38,845 49,086 Premises and equipment 2,020 2,061 1,921 1,465 1,484 1,507 Goodwill (Note 8) 3,656 3,649 3,442 1,592 1,598 1,619 Intangible assets 1,558 1,562 1,511 848 822 812 Current tax assets 1,504 1,319 1,177 1,105 1,188 1,459 Deferred tax assets (Note 18) 3,090 3,355 3,369 1,167 1,101 1,078 Other 9,440 8,890 8,832 6,761 7,754 6,651
79,487 75,949 67,611 56,839 52,792 62,212
Total Assets $ 538,260 $ 500,575 $ 502,036 $ 439,548 $ 438,450 $ 437,710
Liabilities and Equity Deposits (Note 9)
Banks $ 20,150 $ 20,877 $ 22,950 $ 18,944 $ 19,882 $ 19,409 Businesses and governments 173,852 159,209 148,848 136,130 134,228 131,892 Individuals 122,555 122,287 120,249 99,197 98,634 99,043
316,557 302,373 292,047 254,271 252,744 250,344
Other Liabilities
Derivative instruments 55,157 50,934 43,596 40,978 37,153 47,632 Acceptances 6,782 7,227 7,000 6,620 7,194 7,001 Securities sold but not yet purchased 21,269 20,207 21,892 20,693 18,414 14,245 Securities lent or sold under repurchase agreements 51,952 32,078 48,426 38,954 46,788 40,987 Current tax liabilities 634 591 456 497 522 570 Deferred tax liabilities (Note 18) 225 314 329 297 303 332
Other 51,342 52,846 55,311 49,006 48,960 49,953
187,361 164,197 177,010 157,045 159,334 160,720
Subordinated Debt (Note 10) 5,362 5,348 5,284 5,208 3,713 3,776
Capital Trust Securities (Note 11) 450 821 821 809 808 1,187
Equity Share capital (Note 12) 14,260 14,193 14,114 9,951 9,572 9,498 Contributed surplus 119 113 111 101 100 91 Retained earnings 11,986 11,381 11,117 10,913 10,556 10,181 Accumulated other comprehensive income (loss) 734 666 68 (230) 158 412 Total shareholders’ equity 27,099 26,353 25,410 20,735 20,386 20,182Non-controlling interest in subsidiaries 1,431 1,483 1,464 1,480 1,465 1,501
Total Equity 28,530 27,836 26,874 22,215 21,851 21,683
Total Liabilities and Equity $ 538,260 $ 500,575 $ 502,036 $ 439,548 $ 438,450 $ 437,710
The accompanying notes are an integral part of these interim consolidated financial statements.

BMO Financial Group First Quarter Report 2012 35
Interim Consolidated Financial Statements
Consolidated Statement of Changes in Equity
(Unaudited) (Canadian $ in millions) For the three months ended
January 31,
2012
January 31,
2011
Preferred Shares Balance at beginning of period $ 2,861 $ 2,571
Balance at End of Period 2,861 2,571
Common Shares Balance at beginning of period 11,332 6,927 Issued under the Shareholder Dividend Reinvestment and Share Purchase Plan 46 50 Issued under the Stock Option Plan 21 24
Balance at End of Period 11,399 7,001
Contributed Surplus Balance at beginning of period 113 91 Stock option expense/exercised 6 9
Balance at End of Period 119 100
Retained Earnings Balance at beginning of period 11,381 10,181 Net income attributable to Bank shareholders 1,090 807 Dividends – Preferred shares (37) (34) – Common shares (448) (398)
Balance at End of Period 11,986 10,556
Accumulated Other Comprehensive Income on Available-for-Sale Securities Balance at beginning of period 322 408 Unrealized losses on available-for-sale securities arising during the period (net of income tax recovery of $10 and $12) (30) (26) Reclassification to earnings of gains in the period (net of income tax provision of $22 and $19) (33) (37)
Balance at End of Period 259 345
Accumulated Other Comprehensive Income (Loss) on Cash Flow Hedges Balance at beginning of period 311 4 Gains (losses) on cash flow hedges arising during the period (net of income tax (provision) recovery of $(19) and $55) 46 (150) Reclassification to earnings of losses on cash flow hedges (net of income tax provision (recovery) of $nil and $(11)) - 29
Balance at End of Period 357 (117)
Accumulated Other Comprehensive Income (Loss) on Translation of Net Foreign Operations Balance at beginning of period 33 -
Unrealized gain (loss) on translation of net foreign operations 133 (234)
Impact of hedging unrealized gain (loss) on translation of net foreign operations (net of income tax provision (recovery) of $17 and $(64)) (48) 164
Balance at End of Period 118 (70)
Total Accumulated Other Comprehensive Income 734 158
Total Shareholders’ Equity $ 27,099 $ 20,386
Non-controlling Interest in Subsidiaries
Balance at beginning of period 1,483 1,501 Net income attributable to non-controlling interest 19 18 Dividends to non-controlling interest (31) (31)Other (40) (23)
Balance at End of Period 1,431 1,465
Total Equity $ 28,530 $ 21,851
The accompanying notes are an integral part of these interim consolidated financial statements.

36 BMO Financial Group First Quarter Report 2012
Interim Consolidated Financial Statements
Consolidated Statement of Cash Flows
(Unaudited) (Canadian $ in millions) For the three months ended
January 31,
2012
January 31,
2011
Cash Flows from Operating Activities Net income $ 1,109 $ 825 Adjustments to determine net cash flows provided by (used in) operating activities Impairment write-down of securities, other than trading 1 1 Net (gain) on securities, other than trading (43) (51) Net (increase) in trading securities (1,106) (2,356) Provision for credit losses (Note 2) 141 323 Change in derivative instruments – (increase) decrease in derivative asset (3,183) 9,700 – increase (decrease) in derivative liability 4,251 (9,685) Amortization of premises and equipment 92 69 Amortization of intangible assets 83 50 Net (increase) decrease in deferred income taxes 193 (58) Net (increase) decrease in current income taxes (124) 156 Change in accrued interest – (increase) decrease in interest receivable (10) 159 – (decrease) in interest payable (112) (174) Changes in other items and accruals, net (1,428) (2,533) Net increase in deposits 11,744 2,866 Net (increase) in loans (3,951) (670) Net increase in securities sold but not yet purchased 1,077 4,284 Net increase in securities lent or sold under repurchase agreements 19,934 6,173 Net (increase) in securities borrowed or purchased under resale agreements (4,628) (8,072)
Net Cash Provided by Operating Activities 24,040 1,007
Cash Flows from Financing Activities Net increase in liabilities of subsidiaries 18 -
Proceeds from issuance of Covered Bonds (Note 9) 2,000 1,500
Redemption of Capital Trust Securities (Note 11) (400) (400)Proceeds from issuance of common shares 23 27
Cash dividends paid (441) (386)
Dividends paid to non-controlling interest (31) (31)
Net Cash Provided by Financing Activities 1,169 710
Cash Flows from Investing Activities Net (increase) in interest bearing deposits with banks (1,611) (376)Purchases of securities, other than trading (10,749) (4,337)Maturities of securities, other than trading 2,878 4,769 Proceeds from sales of securities, other than trading 4,568 1,897 Premises and equipment – net purchases (45) (33)Purchased and developed software – net purchases (73) (67)
Acquisitions (Note 7) - (20)
Net Cash Provided by (Used in) Investing Activities (5,032) 1,833
Effect of Exchange Rate Changes on Cash and Cash Equivalents (300) (241)
Net Increase in Cash and Cash Equivalents 19,877 3,309
Cash and Cash Equivalents at Beginning of Period 19,676 17,460
Cash and Cash Equivalents at End of Period $ 39,553 $ 20,769
Represented by: Cash and non-interest bearing deposits with Bank of Canada and other banks $ 37,731 $ 19,862
Cheques and other items in transit, net 1,822 907
$ 39,553 $ 20,769
Supplemental Disclosure of Cash Flow Information: Net cash provided by (used in) operating activities include: Amount of Interest paid in the period $ 1,300 $ 1,431 Amount of Income taxes paid (refunded) in the period $ 179 $ (23)Amount of interest and dividend income received in the period $ 3,466 $ 3,131
The accompanying notes are an integral part of these interim consolidated financial statements.

BMO Financial Group First Quarter Report 2012 37
Notes to Consolidated Financial Statements January 31, 2012 (Unaudited)
Note 1: Basis of Presentation Bank of Montreal (the “bank”), is a public company incorporated in Canada having its registered office in Montreal, Canada. The bank is a highly diversified financial services provider and provides a broad range of retail banking, wealth management and investment banking products and services. These interim consolidated financial statements have been prepared in accordance with IAS 34 Interim Financial Reporting. These are the bank’s first interim consolidated financial statements during the first year of reporting in accordance with International Financial Reporting Standards (“IFRS”), and accordingly IFRS 1 First-time Adoption of International Financial Reporting Standards has been applied. We also comply with interpretations of IFRS by our regulator the Office of the Superintendent of Financial Institutions of Canada (“OSFI”). Our consolidated financial statements were previously prepared in accordance with Canadian generally accepted accounting principles (“Canadian GAAP”), as previously defined and as described in the notes to our annual consolidated financial statements for the year ended October 31, 2011, on pages 119 to 180 of our 2011 Annual Report. Canadian GAAP, as previously defined, differs in some areas from IFRS. To comply with IFRS, we have amended certain accounting policies, classification, measurement and disclosures previously applied in the Canadian GAAP financial statements. As required under IFRS, we have:
provided comparative financial information including an opening balance sheet as at the transition date;
retroactively applied all IFRS, other than in respect of elections taken under IFRS 1; and
applied all mandatory exceptions as applicable for first-time adopters of IFRS.
Note 18 contains reconciliations and descriptions of the effects of the transition from Canadian GAAP to IFRS on the Consolidated Statement of Net Income, Consolidated Statement of Comprehensive Income, Consolidated Balance Sheet, and Consolidated Statement of Equity. These interim consolidated financial statements have been prepared in accordance with the accounting policies we expect to use in our October 31, 2012 annual consolidated financial statements. Those accounting policies are based on the IFRSs and IFRIC interpretations that we expect to be applicable at that time. Our interim consolidated financial statements have been prepared on a historic cost basis, except the revaluation of the following items: assets and liabilities held for trading; financial instruments designated at fair value through profit or loss; available-for-sale financial assets; investments in associates; financial assets and financial liabilities designated as hedged items in qualifying fair value hedge relationships; cash-settled share-based payment liabilities and defined benefit pension and other employee future benefit liabilities.
These interim consolidated financial statements were authorized for issue by the Board of Directors on February 28, 2012. (a) Basis of Consolidation The consolidated financial statements of the bank comprise the financial statements of the bank and its subsidiaries as at January 31, 2012. We conduct business through a variety of corporate structures, including subsidiaries, joint ventures, associates and special purpose entities (“SPEs”). Subsidiaries are those where we exercise control through our ownership of the majority of the voting shares. Joint ventures are those where we exercise joint control through an agreement with other shareholders. We also hold interests in special purpose entities (“SPEs”), which we consolidate where we control the SPE, as determined under IFRS. These are more fully described in Note 6. All of the assets, liabilities, revenues and expenses of our subsidiaries, consolidated SPEs and our proportionate share of the assets, liabilities, revenues and expenses of our joint venture are included in our consolidated financial statements. All significant intercompany transactions and balances are eliminated. We also hold investments in companies in which we exert significant influence over operating, investing and financing decisions (companies in which we own between 20% and 50% of the voting shares). These are initially recorded at cost and then subsequently adjusted for our proportionate share of any net income or loss, other comprehensive income or loss, and dividends. They are recorded as other securities in our Consolidated Balance Sheet and our proportionate share of the net income or loss of these companies is recorded in interest, dividend and fee income, securities, in our Consolidated Statement of Income. (b) Translation of Foreign Currencies We conduct business in a variety of foreign currencies and present our consolidated financial statements in Canadian dollars, which is our functional currency. Monetary assets and liabilities as well as non-monetary assets and liabilities measured at fair value that are denominated in foreign currencies are translated into Canadian dollars at the exchange rate in effect at the balance sheet date. Non-monetary assets and liabilities are translated into Canadian dollars at historical rates. Revenues and expenses denominated in foreign currencies are translated using the average exchange rate for the period. Unrealized gains and losses arising from translating net investments in foreign operations into Canadian dollars, net of related hedging activities and applicable income taxes, are included in our Consolidated Statement of Comprehensive Income within net gain (loss) on translation of net foreign operations. When we dispose of a foreign operation such that control, significant influence or joint control is lost, the cumulative amount of the translation gain/(loss), and applicable hedging activity and related income taxes are reclassified to

38 BMO Financial Group First Quarter Report 2012
profit or loss as part of the gain or loss on disposition. All other foreign currency translation gains and losses are included in foreign exchange, other than trading, in our Consolidated Statement of Income as they arise. Foreign currency translation gains and losses on foreign-currency denominated available-for-sale debt securities are included in foreign exchange, other than trading in our Consolidated Statement of Income. From time to time, we enter into foreign exchange hedge contracts to reduce our exposure to changes in the value of foreign currencies. Realized and unrealized gains and losses that arise when we mark-to-market foreign exchange contracts related to economic hedges are included in foreign exchange, other than trading, in our Consolidated Statement of Income. Changes in fair value on forward contracts that qualify as accounting hedges are recorded in other comprehensive income, with the spot/forward differential (the difference between the foreign currency rate at inception of the contract and the rate at the end of the contract) being recorded in interest income/expense over the term of the hedge. (c) Securities
Securities are divided into three types, each with a different purpose and accounting treatment. The types of securities we hold are as follows: Trading securities are securities that we purchase for resale over a short period of time. We report these securities at their fair value and record the fair value changes and transaction costs in our Consolidated Statement of Income in trading revenues. Securities Designated at Fair Value
Securities designated at fair value through profit or loss are financial instruments that are accounted for at fair value, with changes in fair value recorded in income provided they meet certain criteria. Securities designated at fair value through profit or loss must have reliably measurable fair values and satisfy one of the following criteria: (1) accounting for them at fair value eliminates or significantly reduces an inconsistency in measurement or recognition that would otherwise arise from measuring assets or liabilities or recognizing the gains and losses on them on different bases; (2) the securities are part of a group of financial assets, financial liabilities or both that is managed and its performance evaluated on a fair value basis, in accordance with a documented risk management or investment strategy, and is reported to key management personnel on a fair value basis; or (3) the securities are hybrid financial instruments with one or more embedded derivatives that would otherwise be required to be bifurcated and accounted for separately from the host contract. Financial instruments must be designated on initial recognition, and the designation is irrevocable. If these securities were not designated at fair value, they would be accounted for as available-for-sale securities with unrealized gains and losses recorded in other comprehensive income. Securities held by our insurance subsidiaries that support our insurance liabilities are designated at fair value through profit or loss. Since the actuarial calculation of insurance liabilities is based on the fair value of the investments supporting them, designating these securities at fair value through profit or loss
aligns the accounting result with the way the portfolio is managed. We designate certain securities held and liabilities issued by our structured investment vehicles and our credit protection vehicle and securities held by our merchant banking business at fair value through profit or loss, which aligns the accounting result with the way the portfolio is managed. Available-for-sale securities consist of debt and equity securities that may be sold in response to or in anticipation of changes in interest rates and resulting prepayment risk, changes in foreign currency risk, changes in funding sources or terms, or to meet liquidity needs.
Available-for-sale securities are initially measured at fair value plus transaction costs. They are subsequently re-measured at fair value with unrealized gains and losses recorded in unrealized gains (losses) on available-for-sale securities in our Consolidated Statement of Comprehensive Income until the security is sold. If an unrealized loss is considered to be an impairment, it is recorded in the Consolidated Statement of Income. Gains and losses on disposal and impairment losses are recorded in our Consolidated Statement of Income in securities gains (losses), other than trading. Interest income earned and dividends received on available-for-sale securities are recorded in our Consolidated Statement of Income in interest, dividend and fee income, securities.
Investments made by our insurance operations are classified as available-for-sale or other securities, except for investments that support the policy benefit liabilities on our insurance contracts, which are designated at fair value through profit or loss as discussed above. Interest and other fee income on available-for-sale securities is recognized when earned in our Consolidated Statement of Income in non-interest revenue, insurance income. Other securities are investments in companies where we exert significant influence over operating, investing and financing decisions (companies in which we own between 20 and 50% of the voting share) and certain securities held by our merchant banking business. We have not classified any of our securities as held-to-maturity. We account for all of our securities transactions using settlement date accounting on our Consolidated Balance Sheet. Changes in fair value between the trade date and settlement date are recorded in net income. For available-for-sale securities, changes in fair value between the trade date and settlement date are recorded in other comprehensive income. Impairment Review
For available-for-sale and other securities, impairment losses are recognized if there is objective evidence of impairment as a result of an event that reduces the estimated future cash flows of the security and the impact can be reliably estimated. For equity securities, a significant or prolonged decline in its fair value below its cost is objective evidence of impairment.

BMO Financial Group First Quarter Report 2012 39
If there is objective evidence of impairment, a write-down is recorded in our Consolidated Statement of Income in securities gains (losses), other than trading. For debt securities, a previous impairment loss is reversed through net income if an event occurs after the impairment was recognized that can be objectively attributed to an increase in fair value. For equity securities, previous impairment losses are not reversed through net income and any subsequent increases in fair value are recorded in other comprehensive income. Fair Value Measurement
For traded securities, quoted market value is considered to be fair value. Quoted market value is based on bid prices. For securities where market quotes are not available, we use estimation techniques to determine fair value. These estimation techniques include discounted cash flows, internal models that utilize observable market data or comparisons with other securities that are substantially the same. In limited circumstances, we use internal models where the inputs are not based on observable market data. See Note 17: Financial Instruments. (d) Offsetting financial assets and financial liabilities
Financial assets and financial liabilities are offset and the net amount reported in the Consolidated Balance Sheet when there is a legally enforceable right to offset the recognized amounts and there is an intention to settle on a net basis, or realize the asset and settle the liability simultaneously. (e) Derivative Instruments
Derivative instruments are financial contracts that derive their value from underlying changes in interest rates, foreign exchange rates or other financial or commodity prices or indices.
Derivative instruments are either regulated exchange-traded contracts or negotiated over-the-counter contracts. We use these instruments for trading purposes, as well as to manage our exposures, mainly to currency and interest rate fluctuations, as part of our asset/liability management program. Trading Derivatives
Trading derivatives are marked to fair value. Realized and unrealized gains and losses are recorded in trading revenues (losses) in our Consolidated Statement of Income. Unrealized gains on trading derivatives are recorded as derivative instrument assets and unrealized losses are recorded as derivative instrument liabilities in our Consolidated Balance Sheet. Accounting Hedges
In order for a derivative to qualify as an accounting hedge, the hedging relationship must be designated and formally documented at its inception, detailing the particular risk management objective and strategy for the hedge and the specific asset, liability or cash flow being hedged, as well as how its effectiveness is being assessed. Changes in the fair value of the derivative must be highly effective in offsetting either changes in the fair value of on-balance sheet items caused by the risk being hedged or changes in the amount of future cash flows.
Hedge effectiveness is evaluated at the inception of the hedging relationship and on an ongoing basis, retrospectively and prospectively, primarily using quantitative statistical measures of correlation. Any ineffectiveness in the hedging relationship is recognized in non-interest revenue, other in our Consolidated Statement of Income as it arises. Cash Flow Hedges
Cash flow hedges modify exposure to variability in cash flows for variable rate interest bearing instruments and assets and liabilities denominated in foreign currencies. Our cash flow hedges, which have a maximum remaining term to maturity of seven years, are hedges of floating rate loans and deposits as well as assets and liabilities denominated in foreign currencies.
We record interest that we pay or receive on these derivatives as an adjustment to net interest income in our Consolidated Statement of Income over the life of the hedge.
To the extent that changes in the fair value of the derivative offset changes in the fair value of the hedged item, they are recorded in other comprehensive income. The excess of the change in fair value of the derivative that does not offset changes in the fair value of the hedged item (the ineffectiveness of the hedge) is recorded directly in non-interest revenue, other in our Consolidated Statement of Income.
For cash flow hedges that are discontinued before the end of the original hedge term, the unrealized gain or loss recorded in other comprehensive income is amortized to net interest income, in our Consolidated Statement of Income as the hedged item affects earnings. If the hedged item is sold or settled, the entire unrealized gain or loss is recognized in net interest income, in our Consolidated Statement of Income. Fair Value Hedges
Fair value hedges modify exposure to changes in a fixed rate instrument’s fair value caused by changes in interest rates. These hedges convert fixed rate assets and liabilities to floating rate. Our fair value hedges include hedges of fixed rate securities, deposits and subordinated debt.
We record interest receivable or payable on these derivatives as an adjustment to net interest income in our Consolidated Statement of Income over the life of the hedge.
For fair value hedges, not only is the hedging derivative recorded at fair value but fixed rate assets and liabilities that are part of a hedging relationship are adjusted for the changes in value of the risk being hedged (“quasi fair value”). To the extent that the change in the fair value of the derivative does not offset changes in the quasi fair value of the hedged item (the ineffectiveness of the hedge), the net amount is recorded directly in non-interest revenue, other in our Consolidated Statement of Income. For fair value hedges that are discontinued, we cease adjusting the hedged item to quasi fair value. The quasi fair value adjustment of the hedged item is then amortized as an adjustment to the net interest income on the hedged item over its remaining term to maturity. If the hedged item is sold or settled, any remaining quasi fair value adjustment is included in the determination of the gain or loss on sale or settlement.

40 BMO Financial Group First Quarter Report 2012
Net Investment Hedges
Net investment hedges mitigate our exposure to foreign currency fluctuations in our net investment in foreign operations. Deposit liabilities denominated in foreign currencies are designated as hedges of this exposure. The foreign currency translation on the net investment in foreign operations and the corresponding hedging instrument is recorded in net gain (loss) on translation of net foreign operations. To the extent that the hedging instrument is not effective, amounts are included in the Consolidated Statement of Income in foreign exchange, other than trading. Embedded Derivatives
From time to time, we purchase or issue financial instruments containing embedded derivatives. The embedded derivative is separated from the host contract and carried at fair value if the economic characteristics of the derivative are not closely related to those of the host contract, the terms of the embedded derivative are the same as those of a stand-alone derivative, and the combined contract is not held for trading or designated at fair value. To the extent that we cannot reliably identify and measure the embedded derivative, the entire contract is carried at fair value, with changes in fair value reflected in income. Embedded derivatives in certain of our equity linked notes are accounted for separately from the host instrument. Fair Value
Fair value represents point-in-time estimates that may change in subsequent reporting periods due to market conditions or other factors. Fair value for exchange-traded derivatives is considered to be the price quoted on derivatives exchanges. Fair value for over-the-counter derivatives is determined from discount curves adjusted for credit, model and liquidity risks, as well as administration costs. Discount curves are created using generally accepted valuation techniques from underlying instruments such as cash, bonds, swaps and futures observable in the market. Option implied volatilities, an input into the valuation model, are either obtained directly from market sources or calculated from market prices. Multi-contributor sources are used wherever possible. See Note 17: Financial Instruments. (f) Intangible Assets Intangible assets related to our acquisitions are recorded at their fair value at the acquisition date. Software is recorded at cost. Intangible assets are amortized to income over the period during which we believe the assets will benefit us on either a straight-line or an accelerated basis, over a period not to exceed 15 years. We have no intangible assets with indefinite lives. The useful lives of intangible assets are reviewed annually for any change in circumstances. We test intangible assets for impairment when events or changes in circumstances indicate that their carrying value may not recoverable.
We write them down to their recoverable amount; the higher of the related discounted cash flows and the fair value less costs to sell, when this is less than the carrying value. (g) Other Liabilities
Acceptances
Acceptances represent a form of negotiable short-term debt that is issued by our customers and which we guarantee for a fee. We have an offsetting claim, equal to the amount of the acceptances, against our customers. The amount due under acceptances is recorded as a liability and our corresponding claim is recorded as a loan in our Consolidated Balance Sheet. Securities Sold but not yet Purchased
Securities sold but not yet purchased represent our obligation to deliver securities that we did not own at the time of sale. These obligations are recorded at their market value. Adjustments to the market value as at the balance sheet date and gains and losses on the settlement of these obligations are recorded in trading revenues (losses) in our Consolidated Statement of Income. Securities Lent or Sold Under Repurchase Agreements
Securities lent or sold under repurchase agreements represent short-term funding transactions in which we sell securities that we own and simultaneously commit to repurchase the same securities at a specified price on a specified date in the future. The obligation to repurchase these securities is recorded at the amount owing. The interest expense related to these liabilities is recorded on an accrual basis. Provisions
Provisions are recognised when we have an obligation as a result of past events; such as contractual commitments, legal claims or other obligations. We recognize as a provision the best estimate of the amount required to settle the obligation as of the balance sheet date, taking into account the risks and uncertainties surrounding the obligation. Contingent liabilities are possible obligations that arise from past events and whose existence will be confirmed only by the occurrence or non-occurrence of one or more future events not wholly within the control of the bank. Contingent liabilities are disclosed in our financial statements. (h) Stock-Based Compensation
Stock Option Plan
We maintain a Stock Option Plan for designated officers and employees. Options are granted at an exercise price equal to the closing price of our common shares on the day before the grant date. Options vest over a four-year period starting from their grant date. Each tranche (i.e. the 25% portion that vests each year) is treated as a separate award with a different vesting period. A portion of the options can only be exercised once certain performance targets are met. All options expire 10 years from their grant date. We determine the fair value of stock options on their grant date and record this amount as compensation expense over the period that the stock options vest, with a corresponding increase to contributed surplus. When these stock options are exercised, we issue shares and record the amount of proceeds, together

BMO Financial Group First Quarter Report 2012 41
with the amount recorded in contributed surplus, in share capital. Stock options granted to employees eligible to retire are expensed at the date of grant. Share Purchase Plan
We offer our employees the option of directing a portion of their gross salary toward the purchase of our common shares. We match 50% of employee contributions up to 6% of their individual gross salary. The shares held in the employee share purchase plan are purchased on the open market and are considered outstanding for purposes of computing earnings per share. The dividends earned on our common shares held by the plan are used to purchase additional common shares on the open market. We account for our contribution as employee compensation expense when it is contributed to the plan. Mid-Term Incentive Plans
We offer mid-term incentive plans for executives and certain senior employees. Depending on the plan, these pay either a single cash payment at the end of the three-year period of the plan, or three annual cash payments in each of the three years of the plan. The amount of the payment is adjusted to reflect reinvested dividends and changes in the market value of our common shares. We entered into agreements with third parties to assume most of our obligations related to these plans in exchange for cash payments. Amounts paid under these agreements were recorded in our Consolidated Balance Sheet in other assets and are recorded as employee compensation expense evenly over the period prior to payment to employees. For the remaining obligations related to plans for which we have not entered into agreements with third parties, the fair value of the amount of compensation expense is recognized as an expense and a liability over the period from the grant date to payment date to employees. This liability is remeasured to fair value each reporting period. Amounts related to employees who are eligible to retire are expensed at the time of grant. Deferred Incentive Plans
We offer deferred incentive plans for members of our Board of Directors, executives, and key employees in BMO Capital Markets and Private Client Group. Under these plans, fees, annual incentive payments and/or commissions can be deferred as stock units of our common shares. These stock units are fully vested on the grant date. The value of these stock units is adjusted to reflect reinvested dividends and changes in the market value of our common shares.
Deferred incentive payments are paid upon retirement or resignation. The deferred incentive payments can be made in cash or shares.
Employee compensation expense for these plans is recorded in the year the fees, incentive payments and/or commissions are earned. Changes in the amount of the incentive payments as a result of dividends and share price movements are recorded as employee compensation expense in the period of the change. (i) Income Taxes
We report our provision for income taxes in our Consolidated Statement of Income based upon transactions recorded in our consolidated financial statements regardless of when they are recognized for income tax purposes, with the exception of repatriation of retained earnings from our foreign subsidiaries, as noted below.
In addition, we record an income tax expense or benefit directly in shareholders’ equity when the taxes relate to amounts recorded in shareholders’ equity. For example, income tax expense (recovery) on hedging gains (losses) related to our net investment in foreign operations is recorded in our Consolidated Statement of Comprehensive Income as part of net gain (loss) on translation of net foreign operations.
Deferred income tax assets and liabilities are measured at the tax rates expected to apply when these differences reverse. Changes in deferred income tax assets and liabilities related to a change in tax rates are recorded in income in the period the tax rate is substantially enacted. See Note 18 for certain fiscal 2011 income tax disclosures prepared under IFRS. Income that we earn in foreign countries through our branches or subsidiaries is generally subject to tax in those countries. We are also subject to Canadian taxation on the income earned in our foreign branches. Canada allows a credit for foreign taxes paid on this income. Upon repatriation of earnings from certain foreign subsidiaries, we would be required to pay tax on certain of these earnings. As repatriation of such earnings is not planned in the foreseeable future, we have not recorded the related future income tax liability. (j) Use of Estimates The most significant assets and liabilities for which we must make estimates include: allowance for credit losses; securitization of loans; consolidation of special purpose entities; fair value of assets acquired and liabilities assumed as a result of acquisitions including loans and deposits; impairment of assets other than loans; pension and other employee future benefits; fair value of financial instruments; insurance-related liabilities; income taxes; and contingent liabilities. If actual results differ from the estimates, the impact would be recorded in future periods. We have established detailed policies and control procedures that are intended to ensure these judgments are well controlled, independently reviewed and consistently applied from period to period. We believe that our estimates of the value of BMO’s assets and liabilities are appropriate. We make judgments as it relates to the assessment of whether substantially all risks and rewards have been transferred in respect of transfers of financial assets and whether we control special purpose entities. These judgments are discussed in Note 5 and 6, respectively.
Note 17 discusses the judgment used in determining fair value.

42 BMO Financial Group First Quarter Report 2012
Allowance for Credit Losses The allowance for credit losses adjusts the value of loans to reflect their estimated realizable value. In assessing their estimated realizable value, we must rely on estimates and exercise judgment regarding matters for which the ultimate outcome is unknown. These include economic factors, developments affecting companies in particular industries and specific issues with respect to single borrowers. Changes in circumstances may cause future assessments of credit risk to be materially different from current assessments, which could require an increase or decrease in the allowance for credit losses. Purchased Loans Significant judgment and assumptions were applied to determine the fair value of the Marshall & Ilsley Corporation (“M&I”) loan portfolio. Loans are either purchased performing loans or purchased credit impaired loans (“PCI” loans), both of which are recorded at fair value at the time of acquisition. This involves estimating the expected cash flows to be received and determining the discount rate applied to the cash flows from the loan portfolio. The timing and amount of cash flows include significant management judgment regarding key assumptions, including the probability of default, severity of loss, timing of payment receipts and the valuation of collateral. All of these factors are inherently subjective and can result in significant changes in the cash flow estimates over the life of a loan. In determining the possible discount rates, we considered various factors including our cost to raise funds in the current market, the risk premium associated with the loans and the cost to service the portfolios.
Subsequent to the determination of the initial fair value, the purchased performing loans are subject to the credit review processes applied to bank originated loans.
PCI loans have experienced a deterioration of credit quality from origination to acquisition, and it is probable that the bank will be unable to collect all contractually required payments, including both principal and interest. Subsequent to the acquisition of a loan, we continue to estimate cash flows expected to be collected over the life of the loan. The measurement of expected cash flows involves assumptions and judgments consistent with those described above for determining the initial fair value. Changes in expected cash flows could result in the recognition of impairment or a recovery through provision for credit losses. Acquired Deposits
M&I deposit liabilities were recorded at fair value at acquisition. The determination of fair value involves estimating the expected cash flows to be paid and determining the discount rate applied to the cash flows. The timing and amount of cash flows include significant management judgment regarding the likelihood of early redemption by the bank and the timing of withdrawal by the client. Discount rates were based on the prevailing rates paid by the bank on similar deposits at the date of acquisition. Pension and Other Employee Future Benefits
The bank’s pension and other employee future benefits expense is calculated by our independent actuaries using assumptions
determined by management. If actual experience differs from the assumptions used, pension and other employee future benefits expense could increase or decrease in future years. The expected rate of return on plan assets is a management estimate that significantly affects the calculation of pension expense. Our expected rate of return on plan assets is determined using the plan’s target asset allocation and estimated rates of return for each asset class. Estimated rates of return are based on expected returns from fixed-income securities, which take into consideration bond yields. An equity risk premium is then applied to estimate equity returns. Expected returns from other asset classes are established to reflect the risks of these asset classes relative to fixed-income and equity assets. The impact of changes in expected rates of return on plan assets is not significant for our other employee future benefits expense since only small amounts of assets are held in these plans.
Pension and other employee future benefits expense and obligations are also sensitive to changes in discount rates. We determine discount rates at each year end for our Canadian and U.S. plans using high-quality corporate bonds with terms matching the plans’ specific cash flows.
Additional information regarding our accounting for pension and other employee future benefits, is included in Note 18. Impairment
We have investments in securities issued or guaranteed by Canadian or U.S. governments, corporate debt and equity securities, mortgage-backed securities and collateralized mortgage obligations, which are classified as available-for-sale securities. We review available-for-sale and other securities at each quarter-end reporting period to identify and evaluate investments that show indications of possible impairment. For available-for-sale and other securities, impairment losses are recognized if there is objective evidence of impairment as a result of an event that reduces the estimated future cash flows of the security and the impact can be reliably estimated. Objective evidence of impairment includes default or delinquency by a debtor, restructuring of an amount due to us on terms that we would not consider otherwise, indications that a debtor or issuer will enter bankruptcy, or the disappearance of an active market for a security. In addition, for equity securities, a significant or prolonged decline in its fair value below its cost is objective evidence of impairment. The decision to record a write-down, its amount and the period in which it is recorded could change if management’s assessment of those factors were different. We do not record impairment write-downs on debt securities when impairment is due to changes in market interest rates, if future contractual cash flows associated with the debt security are still expected to be recovered.
Additional information regarding our accounting for available-for-sale securities and other securities and the determination of fair value is included in the Securities section of this note. Income Taxes
The provision for income taxes is calculated based on the expected tax treatment of transactions recorded in our Consolidated Statements of Income or Changes in Shareholders’

BMO Financial Group First Quarter Report 2012 43
Equity. In determining the provision for income taxes, we interpret tax legislation in a variety of jurisdictions and make assumptions about the expected timing of the reversal of deferred tax assets and liabilities. If our interpretations differ from those of tax authorities or if the timing of reversals is not as expected, our provision for income taxes could increase or decrease in future periods. The amount of any such increase or decrease cannot be reasonably estimated.
Additional information regarding our accounting for income taxes is included in Note 18. Goodwill and Intangible Assets
For the purpose of impairment testing, goodwill is allocated to the bank’s cash generating units (“CGUs”) which represent the lowest level within the bank at which goodwill is monitored for internal management purposes. Impairment testing is performed at least annually, and whenever there is an indication that the CGU may be impaired, by comparing the recoverable amount of a CGU with the carrying value of its net assets, including attributable goodwill. The recoverable amount of an asset is the higher of its fair value less cost to sell, and its value in use. Value in use is the present value of the expected future cash flows from a CGU. If the recoverable amount is less than carrying value, an impairment loss is charged to income.
Fair value less costs to sell was used to perform the impairment test in 2011. In determining fair value less costs to sell, we employ internal valuation models, such as discounted cash flow models, consistent with those used when we acquire businesses. These models are dependent on assumptions related to revenue growth, discount rates, synergies achieved on acquisition and the availability of comparable acquisition data. Changes in each of these assumptions would affect the determination of fair value for each of the business units in a different manner. Management must exercise judgment and make assumptions in determining fair value less costs to sell, and differences in judgments and assumptions could affect the determination of fair value and any resulting impairment write-down.
Additional information regarding goodwill is included in Note 8. Insurance-Related Liabilities
Insurance claims and policy benefit liabilities represent current claims and estimates for future insurance policy benefits. Liabilities for life insurance contracts are determined using the Canadian Asset Liability Method, which incorporates best-estimate assumptions for mortality, morbidity, policy lapses, surrenders, future investment yields, policy dividends, administration costs and margins for adverse deviation. These assumptions are reviewed at least annually and updated to reflect actual experience and market conditions. The most significant impact on the valuation of a liability results from a change in the assumption for future investment yields. Future investment yields may be sensitive to variations in reinvestment interest rates and accordingly may affect the valuation of policy benefit liabilities. Provisions
The bank and its subsidiaries are involved in various legal actions in the ordinary course of business.
Provisions are recorded at the best estimate of the amount required to settle the obligation as of the balance sheet date, taking into account the risks and uncertainties surrounding the obligation. The bank’s management and internal and external experts are involved in estimating any amounts involved. The actual costs of resolving these claims may be substantially higher or lower than the amount of the provisions. Future Changes in IFRS Standards
Employee Benefits
The International Accounting Standards Board (“IASB”) has revised the standard on employee benefits. Actuarial gains and losses will be recognized immediately in equity and may no longer be deferred and amortized. Under the revised standard, service costs and net investment income (expense), which is calculated by applying the discount rate to the net benefit asset (liability), are recorded in income. As a result, a funding deficit will result in interest expense and a funding surplus will result in interest income, reflecting the financing effect of the amount owed to or from the plan. Under the prior standard, interest income could be earned on a plan with a funding deficit if the expected return on assets exceeded the interest cost on the benefit liability. This new standard is effective for our fiscal year beginning November 1, 2013. We cannot currently determine the impact of this revised standard on our consolidated financial statements as this will be dependent on the funded status of our plans and the net benefit asset (liability) position on adoption. Fair Value Measurement
The IASB has issued a new standard for fair value measurement that provides a common definition of fair value and establishes a framework for measuring fair value. This new standard is effective for our fiscal year beginning November 1, 2013. We do not expect this new standard will have a significant impact on how we determine fair value. Consolidated Financial Statements
The IASB has issued a new standard on consolidation that will replace the existing standard. This new standard provides a single consolidation model that identified control as the basis for consolidation for all types of entities. This new standard is effective for our fiscal year beginning November 1, 2013. We are currently assessing the impact of this revised standard on our future financial results. Investment in Associates and Joint Ventures
The IASB has amended the standard for investment in joint ventures to require that they be accounted for using the equity method. The new standard is effective for our fiscal year beginning on November 1, 2013. We do not expect this new standard will have a significant impact on future financial results. Offsetting Financial Assets and Financial Liabilities
The IASB has issued amendments to the standards for financial instruments classification and disclosure which clarify that an entity currently has a legally enforceable right to set-off if that right is not contingent on a future event; and enforceable both in the normal course of business and in the event of default,

44 BMO Financial Group First Quarter Report 2012
insolvency or bankruptcy of the entity and all counterparties. These amendments also contain new disclosure requirements for financial assets and financial liabilities that are offset in the statement of financial position or subject to master netting agreements or similar agreements. The disclosure amendments are effective for our fiscal year beginning on November 1, 2013 and the classification amendments are effective for our fiscal year beginning on November 1, 2014. We are currently assessing the impact of these amendments on our future financial results. Disclosure of Interests in Other Entities
The IASB has issued a new standard on the disclosure requirements for all forms of interest in other entities, including subsidiaries, joint arrangements, associates and unconsolidated structured entities. This new standard requires disclosure of the nature of, and risks associated with an entity’s interests in other entities and the effects of these interests on its financial position, financial performance and cash flows. This new standard is effective for our fiscal year beginning on November 1, 2014. We are currently assessing the impact of this new standard on our future financial disclosures.
Financial Instruments
The IASB released a new standard for the classification and measurement of financial assets and financial liabilities. This is the first phase of a three-phase project to replace the current standard for accounting for financial instruments. The new standard specifies that financial assets are measured at either amortized cost or fair value on the basis of the reporting entity’s business model for managing the financial assets and the contractual cash flow characteristics of the financial assets. The classification and measurement of financial liabilities remain generally unchanged; however, fair value changes attributable to changes in the credit risk for financial liabilities designated at fair value through profit or loss are to be recorded in other comprehensive income unless the treatment would create or enlarge an accounting mismatch in profit or loss. These amounts are not subsequently reclassified to income but may be transferred within equity. The remaining change in the fair value of the liability continues to be recorded in income. The other phases of this project, which are currently under development, address impairment and hedge accounting. The IASB has deferred the effective date of this new standard for two years from the originally proposed effective date, which will make it effective for us on November 1, 2015. We are currently assessing the impact of this new standard on our future financial results in conjunction with the completion of the other phases of the IASB’s financial instruments project.
Note 2: Loans and Allowance for Credit Losses Loans
Loans are recorded at amortized cost using the effective interest method except for purchased loans which are described in the Purchased Loans section below. The effective interest method allocates interest income over the expected term by applying the effective interest rate to the carrying amount of the loan. The effective interest rate is defined as the rate that exactly discounts estimated future cash receipts through the expected term of the loan to the net carrying amount of the loan. The treatment of interest income for impaired loans is described below.
We amortize deferred loan origination costs that are directly attributable and incremental to the origination of a loan using the effective interest method. We record the amortization as a reduction to interest, dividend and fee income, loans, over the term of the resulting loan. Under the effective interest method, the amount recognized in interest, dividend and fee income varies over the term of the loan based on the principal outstanding. Securities Borrowed or Purchased Under Resale Agreements
Securities borrowed or purchased under resale agreements represent the amounts we will receive as a result of our commitment to resell securities that we have purchased back to the original seller, on a specified date at a specified price. We account for these instruments as if they were loans. Lending Fees
The accounting treatment for lending fees varies depending on the transaction. Some loan origination, restructuring and renegotiation fees are recorded as interest income over the term of the loan, while other lending fees, to a certain threshold, are taken into income at the time of loan origination. Commitment
fees are recorded as interest income over the term of the loan, unless we believe the loan commitment will not be used. In the latter case, commitment fees are recorded as lending fees over the commitment period. Loan syndication fees are included in lending fees as the syndication is completed, unless the yield on any loans we retain is less than that of other comparable lenders involved in the financing. In the latter case, an appropriate portion of the syndication fee is recorded as interest income over the term of the loan. Customers’ Liability under Acceptances
Acceptances represent a form of negotiable short-term debt that is issued by our customers and which we guarantee for a fee. We have offsetting claims, equal to the amount of the acceptances, against our customers in the event of a call on these commitments. The amount due under acceptances is recorded in other liabilities and our corresponding claim is recorded as a loan in our Consolidated Balance Sheet.
Fees earned are recorded in lending fees in our Consolidated Statement of Income over the term of the acceptance. Impaired Loans We classify residential mortgages as impaired when payment is contractually 90 days past due, or one year past due if guaranteed by the Government of Canada. Credit card loans are classified as impaired and immediately written off when principal or interest payments are 180 days past due. Consumer instalment loans, other personal loans and some small business loans are classified as impaired when principal or interest payments are 90 days past due, and are normally written off when they are one year past due. For the purpose of measuring

BMO Financial Group First Quarter Report 2012 45
the amount to be written off, the determination of the recoverable amount includes an estimate of future recoveries. Corporate and commercial loans are classified as impaired when we are no longer reasonably assured that principal or interest will be collected in its entirety on a timely basis. Generally, corporate and commercial loans are considered impaired when payments are 90 days past due, or for fully secured loans, when payments are 180 days past due. Once a loan is identified as impaired, interest income continues to be recognized based on the original effective interest rate of the loan.
A loan will be reclassified back to performing status when we determine that there is reasonable assurance of full and timely repayment of interest and principal in accordance with the terms and conditions of the loan, and that none of the criteria for classification of the loan as impaired continue to apply. Allowance for Credit Losses
The allowance for credit losses recorded in our Consolidated Balance Sheet is maintained at a level that we consider adequate to absorb credit-related losses on our loans, customers’ liability under acceptances and other credit instruments. The portion related to other credit instruments is recorded in other liabilities in our Consolidated Balance Sheet. As at January 31, 2012, there was $220 million ($149 million as at January 31, 2011) allowance for credit losses related to other credit instruments included in other liabilities. The allowance comprises the following two components: Specific Allowance
These allowances are recorded for individually identified impaired loans to reduce their book value to the amount we expect to recover. We review our loans and acceptances on an ongoing basis to assess whether any loans should be classified as impaired and whether an allowance or write-off should be recorded (other than credit card loans, which are classified as impaired and written off when principal or interest payments are 180 days past due, as discussed under impaired loans). Our review of problem loans is conducted at least quarterly by our account managers, each of whom assesses the ultimate collectability and estimated recoveries for a specific loan based on all events and conditions that the manager believes are
relevant to the condition of the loan. This assessment is then reviewed and concurred with by an independent credit officer.
To determine the amount we expect to recover from an impaired loan, we use the value of the estimated future cash flows discounted at the financial asset’s original effective interest rate. The determination of estimated future cash flows of a collateralized loan reflects the expected realization of the underlying security net of expected costs and any amounts legally required to be paid to the borrower . Security can vary by type of loan and may include cash, securities, real property, accounts receivable, guarantees, inventory or other capital assets. Certain personal loans are individually identified as impaired however the provision is calculated on a pooled basis, taking into account historical loss experience. In the periods following the recognition of impairment, adjustments to the loan allowance reflecting the time value of money are recognized and presented as interest income. Collective Allowance
We maintain a collective allowance (previously referred to as general allowance) in order to cover any impairment in the existing portfolio that cannot yet be associated with individually identified as impaired loans. Our approach to establishing and maintaining the collective allowance is based on the guideline issued by OSFI. The collective allowance is reviewed on a quarterly basis. For purposes of calculating the collective allowance we group loans on the basis of similar credit risk characteristics. The collective allowance methodology incorporates both quantitative and qualitative factors to determine an appropriate level of the collective allowance. The quantitative component consists of a collective allowance model which utilizes statistical analysis of past performance to derive a long-run estimate of loss experience. The loss experience is then adjusted to reflect qualitative factors such as management’s experienced credit judgment with respect to current macroeconomic and business conditions, portfolio specific considerations, model factors and the level of non-performing balances (impaired loans) for which a specific allowance has not yet been assessed.

46 BMO Financial Group First Quarter Report 2012
A continuity of our allowance for credit losses is as follows:
(Canadian $ in millions)
Residential mortgages
Credit card, consumer instalment and other
personal loans
Business and
government loans
Customers’ liability
under acceptances Total
For the three months ended
January 31,
2012
January 31,
2011
January 31,
2012
January 31,
2011
January 31,
2012
January 31,
2011
January 31,
2012
January 31,
2011
January 31,
2012
January 31,
2011
Specific Allowance at beginning of period 74 52 59 47 426 481 - 10 559 590 Provision for credit losses 8 36 160 172 (46) 109 - - 122 317 Recoveries 33 3 38 30 152 26 - - 223 59 Write-offs (44) (23) (192) (194) (141) (119) - - (377) (336)
Foreign exchange and other 1 (3) (2) 1 (27) (20) - - (28) (22)
Specific Allowance at end of period 72 65 63 56 364 477 - 10 499 608
Collective Allowance at beginning of period 36 23 565 477 817 839 34 44 1,452 1,383
Provision for credit losses - 7 59 37 (29) (40) (11) 2 19 6
Foreign exchange and other - - - - 6 (12) - - 6 (12)
Collective Allowance at end of period 36 30 624 514 794 787 23 46 1,477 1,377
Total Allowance 108 95 687 570 1,158 1,264 23 56 1,976 1,985
Comprised of: Loans 106 95 687 570 940 1,115 23 56 1,756 1,836
Other credit instruments 2 - - - 218 149 - - 220 149
Interest income on impaired loans of $37 million was recognized for the quarter ended January 31, 2012 ($22 million for the quarter ended January 31, 2011).
Foreclosed Assets
Property or other assets that we have received from borrowers to satisfy their loan commitments are recorded at fair value and are classified as either held for use or held for sale according to management’s intention. Fair value is determined based on market prices where available. Otherwise, fair value is determined using other methods, such as analysis of discounted cash flows or market prices for similar assets. Insured Mortgages
Included in the residential mortgages balance are Canadian government and corporate insured mortgages of $24,529 million as at January 31, 2012 ($25,008 million as at October 31, 2011). Included in the consumer instalment and other personal loans balance are Canadian government-insured real estate personal loans of $nil as at January 31, 2012 ($nil as at October 31, 2011). Purchased Loans
We record all loans that we purchase at fair value on the day that we acquire the loans. The fair value of the acquired loan portfolio includes an estimate of the interest rate premium or discount on the loans calculated as the difference between the contractual rate of interest on the loans and prevailing interest rates (the “interest rate mark”). Also included in fair value is an estimate of expected credit losses (the “credit mark”) as of the acquisition date. The credit mark consists of two components: an estimate of the amount of losses that exist in the acquired loan portfolio on the acquisition date but that haven’t been specifically identified on that date (the “incurred credit mark”) and an amount that represents future expected losses (the “future credit mark”). As a result of recording the loans at fair value, no allowance for credit losses is recorded in our Consolidated Balance Sheet on the day we acquire the loans. Fair value is determined by estimating the principal and interest cash flows expected to be collected on the loans and discounting those cash flows at a market rate of interest. We estimate cash flows expected to be collected based on specific loan reviews for commercial loans. For retail loans, we use models that
incorporate management’s best estimate of current key assumptions such as default rates, loss severity, timing of prepayments and collateral. Acquired loans are classified into the following categories: those that on the acquisition date continued to make timely principal and interest payments (the “purchased performing loans”) and those which on the acquisition date the timely collection of interest and principal was no longer reasonably assured (the “purchased credit impaired loans” or “PCI” loans). Because purchased credit impaired loans are recorded at fair value at acquisition based on the amount expected to be collected, none of the purchased credit impaired loans are considered to be impaired at acquisition. Subsequent to the acquisition date, we account for each type of loan as follows: Purchased Performing Loans
For performing loans with fixed terms, the interest rate mark and future credit mark are fully amortized to net interest income over the expected life of the loan using the effective interest method. Specific provisions for credit losses will be recorded as they arise in a manner that is consistent with our accounting policy for originated loans. The incurred credit losses will be re-measured at each reporting period consistent with our methodology for the collective allowance, with any increases recorded in the provision for credit losses. Decreases in incurred credit losses will be recorded in the provision for credit losses until the accumulated collective allowance is exhausted. Any additional decrease will be recorded in net interest income. For loans with revolving terms, the interest rate mark as well as the incurred and future credit marks are amortized into net interest income on a straight-line basis over the contractual terms of the loans. As the incurred credit mark amortizes, we will record an allowance for credit losses at a level appropriate to absorb credit-related losses on these loans, consistent with our methodology for the collective allowance.

BMO Financial Group First Quarter Report 2012 47
As loans are repaid, the remaining unamortized credit mark related to those loans is recorded in net interest income during the period that the loan is repaid. Purchased Credit Impaired Loans
Subsequent to the acquisition date, we will regularly re-evaluate what we expect to collect on the purchased credit impaired loans. Increases in expected cash flows will result in a recovery in the provision for credit losses and either a reduction in any previously recorded allowance for credit losses or, if no allowance exists, an increase in the current carrying value of the purchased loans. Decreases in expected cash flows will result in a charge to the specific provision for credit losses and an increase to the allowance for credit losses. For purchased credit impaired loans, the interest rate mark is amortized into net interest income using the effective interest method over the effective life of the loan. As loans are repaid, the remaining unamortized credit mark related to those loans is recorded in the provision for credit losses during the period that the loan is repaid.
Unfunded Commitments and Letters of Credit Acquired
As part of our purchase of M&I, we recorded a liability of $192 million related to unfunded commitments and letters of credit. The total credit mark and interest rate mark associated with unfunded commitments and letters of credit are amortized into net interest income on a straight-line basis over the contractual term of the acquired liabilities. As the credit mark is amortized, an appropriate collective allowance is recorded, consistent with our methodology for the collective allowance. FDIC Covered Loans
Loans acquired as part of our acquisition of AMCORE Bank are subject to a loss share agreement with the Federal Deposit Insurance Corporation (“FDIC”). Under this agreement, the FDIC reimburses us for 80% of the net losses we incur on these loans. For the quarter ended January 31, 2012 we recorded new provisions for credit losses and recoveries of $(2.1) million and $(1.7) million, respectively, related to loans covered by the FDIC loss share agreement ($2 million and $6 million, respectively, for the quarter ended January 31, 2011). These amounts are net of the amounts expected to be reimbursed by the FDIC.
Note 3: Risk Management We have an enterprise-wide approach to the identification, measurement, monitoring and management of risks faced across the organization. The key financial instruments risks are classified as credit and counterparty, market, and liquidity and funding risk. Credit and Counterparty Risk
We are exposed to credit risk from the possibility that counterparties may default on their financial obligations to us. Credit risk arises predominantly with respect to loans, over-the-counter derivatives and other credit instruments. This is the most significant measurable risk that we face. Market Risk
Market risk is the potential for adverse changes in the value of our assets and liabilities resulting from changes in market variables such as interest rates, foreign exchange rates, equity and commodity prices and their implied volatilities, and credit
spreads, as well as the risk of credit migration. We incur market risk in our trading and underwriting activities and structural banking activities. Liquidity and Funding Risk
Liquidity and funding risk is the potential for loss if we are unable to meet financial commitments in a timely manner at reasonable prices as they fall due. It is our policy to ensure that sufficient liquid assets and funding capacity are available to meet financial commitments, including liabilities to depositors and suppliers, and lending, investment and pledging commitments, even in times of stress. Managing liquidity and funding risk is essential to maintaining both depositor confidence and stability in earnings. Key measures as at January 31, 2012 are outlined in the Risk Management section on page 10 to 12 of Management’s Discussion and Analysis of the First Quarter Report to Shareholders.
Note 4: Guarantees In the normal course of business we enter into a variety of guarantees. The most significant guarantees are as follows: Standby Letters of Credit and Guarantees
Standby letters of credit and guarantees represent our obligation to make payments to third parties on behalf of another party if that party is unable to make the required payments or meet other contractual requirements. The maximum amount payable under standby letters of credit and guarantees totalled $11,941 million as at January 31, 2012 ($11,880 million as at October 31, 2011). The majority have a term of one year or less. Collateral requirements for standby letters of credit and guarantees are consistent with our collateral requirements for loans. A large majority of these commitments expire without being drawn upon. As a result, the total contractual amounts may not be representative of the funding likely to be required for these commitments.
As at January 31, 2012, $45 million ($45 million as at October 31, 2011) was included in other liabilities related to guaranteed parties that were unable to meet their obligation to third parties (See Note 2). No other amount was included in our Consolidated Balance Sheet as at January 31, 2012 and October 31, 2011 related to these standby letters of credit and guarantees. Backstop and Other Liquidity Facilities
Backstop liquidity facilities are provided to asset-backed commercial paper (“ABCP”) programs administered by either us or third parties as an alternative source of financing in the event that such programs are unable to access ABCP markets or when predetermined performance measures of the financial assets owned by these programs are not met. The terms of the backstop liquidity facilities do not require us to advance money to these programs in the event of bankruptcy of the borrower.

48 BMO Financial Group First Quarter Report 2012
The facilities’ terms are generally no longer than one year, but can be several years. The maximum amount payable under these backstop and other liquidity facilities totalled $3,848 million as at January 31, 2012 ($3,708 million as at October 31, 2011). As at January 31, 2012, $66 million was outstanding from facilities drawn in accordance with the terms of the backstop liquidity facilities ($84 million as at October 31, 2011). Credit Enhancement Facilities
Where warranted, we provide partial credit enhancement facilities to transactions within ABCP programs administered by either us or third parties. Credit enhancement facilities are included in backstop liquidity facilities. Senior Funding Facilities
In addition to our investment in the notes subject to the Montreal Accord, we have provided a senior loan facility of $300 million. No amounts were drawn as at January 31, 2012 or October 31, 2011. Derivatives
Certain of our derivative instruments meet the accounting definition of a guarantee when they require the issuer to make payments to reimburse the holder for a loss incurred because a debtor fails to make payment when due under the terms of a debt instrument. In order to reduce our exposure to these derivatives, we enter into contracts that hedge the related risks. Written credit default swaps require us to compensate a counterparty following the occurrence of a credit event in relation to a specified reference obligation, such as a bond or a
loan. The maximum amount payable under credit default swaps is equal to their notional amount of $35,017 million as at January 31, 2012 ($36,135 million as at October 31, 2011). The terms of these contracts range from less than one year to 10 years. The fair value of the related derivative liabilities included in derivative instruments in our Consolidated Balance Sheet was $553 million as at January 31, 2012 ($880 million as at October 31, 2011). Indemnification Agreements
In the normal course of operations, we enter into various agreements that provide general indemnifications. These indemnifications typically occur in connection with sales of assets, securities offerings, service contracts, membership agreements, clearing arrangements, derivatives contracts and leasing transactions. As part of the acquisition of M&I, we acquired a securities lending business that lends securities owned by clients to borrowers who have been evaluated for credit risk using the same credit risk process that is applied to loans and other credit assets. In connection with these activities, we provide an indemnification to lenders against losses resulting from the failure of the borrower to return loaned securities when due. All borrowings are fully collateralized with cash or marketable securities. As securities are loaned, collateral is maintained at a minimum of 100% of the fair value of the securities and the collateral is revalued on a daily basis. The amount of securities loaned subject to indemnification was $4,733 million as at January 31, 2012 ($5,139 million as at October 31, 2011). No amount was included in our Consolidated Balance Sheet as at January 31, 2012 and October 31, 2011 related to these indemnifications.
Note 5: Securitization Periodically, we securitize loans to obtain alternate sources of funding. Securitization involves selling loans to trusts (“securitization vehicles”), which buy the loans and then issue either interest bearing or discounted investor certificates. We use bank securitization vehicles to securitize our Canadian mortgage loans and Canadian credit card loans. We are required to consolidate these vehicles. See Note 6 for further information. We also sell Canadian mortgage loans to third party Canadian securitization programs including the Canadian Mortgage Bond program and the National Housing Act Mortgage-Backed Securities program. Contracts with the third party securitization programs provide for the payment to us over time of the excess of the sum of interest and fees collected from customers, in connection with the loans that were sold, over the yield paid to investors in the securitization vehicle or third party securitization program, less credit losses and other costs. We assess whether the loans qualify for off-balance sheet treatment based on the transfer of the risks and rewards, as determined under the derecognition criteria contained in the IFRS financial instruments standard. We derecognise loans where the contractual rights to the cash flows from the loans expire, or where we have transferred the loans in a transaction in which substantially all the risks and rewards of the loans are transferred, or in which we neither
transfer or retain substantially all the risks and rewards of ownership and do not retain control of the loans. If substantially all the risks and rewards have been neither retained nor transferred and we have retained control of the loans, they would continue to be recognized to the extent of our continuing involvement. The loans sold to third party securitization programs do not qualify for off-balance sheet recognition as we have determined that the transfer of these loans has not resulted in the transfer of substantially all the risks and rewards. We continue to recognize the loans on our balance sheet and recognize the instruments issued as a liability representing a secured financing. The interest and fees collected, net of the yield paid to investors is recorded in net interest income using the effective interest method over the term of the securitization. Credit losses associated with the loans are recorded in the provision for credit losses. During the quarter ended January 31, 2012, we sold $1,385 million of loans to third party securitization programs ($709 million for the quarter ended January 31, 2011).

BMO Financial Group First Quarter Report 2012 49
The following table shows the carrying amounts related to securitization activities with third parties that are recorded on our balance sheet, together with the associated liabilities, for each category of asset on the balance sheet:
(Canadian $ in millions)
January 31,2012(1)
October 31,2011
November 1,2010
Carrying amount of
assets
Associated
liabilities
Carrying amount of
assets
Associated
liabilities
Carrying amount of
assets
Associated
liabilitiesAvailable-for-sale securities 816 874 1,077 Residential mortgages 12,108 11,758 13,384
12,924 12,632 14,461
Other Related Assets 7,162 8,004 8,754
Total 20,086 20,046 20,636 20,462 23,215 23,047 (1) The fair value of the securitized assets is $20,384 million and the fair value of the associated liabilities is $20,646 million, for a net position of $(262) million. Securitized assets are those which the bank has
transferred to third parties, including other related assets.
The other related assets represent payments received on account of loans pledged under securitization that have not been applied against the associated liabilities. The payments received are held on behalf of the investors in the securitization vehicles until principal payments are required to be made on
the associated liabilities. In order to compare all assets supporting the associated liabilities, this amount is added to the carrying value of the securitized assets in the above table. See note 6 for details of securitization activities with bank securitization vehicles.
Note 6: Special Purpose Entities We enter into certain transactions with customers in the ordinary course of business which involve the establishment of special purpose entities (“SPE”s) to facilitate or secure customer transactions. We are required to consolidate a SPE if we control the vehicle, as determined under the criteria contained in IFRS. The following circumstances are considered when assessing whether the bank, in substance, controls and consequently is required to consolidate a SPE:
the activities of the SPE are being conducted on behalf of the bank according to its specific business needs so that the bank obtains benefits from the SPE’s operation;
the bank has the decision-making powers to obtain the majority of the benefits of the activities of the SPE or, by setting up an ‘autopilot’ mechanism, the bank has delegated these decision-making powers;
the bank has rights to obtain the majority of the benefits of the SPE and therefore may be exposed to risks incidental to the activities of the SPE; or
the bank retains the majority of the residual or ownership risks related to the SPE or its assets in order to obtain benefits from its activities.
We consider all aspects of the relationship between the bank and the SPE to determine whether the bank ultimately has the power to govern the financial and operating policies of the SPE so as to obtain the benefits from the SPE’s activities. We perform a re-assessment of consolidation whenever there is a change in the substance of the relationship between the bank and an SPE.
Total assets in our unconsolidated SPEs and our exposure to losses are summarized in the following table:
(Canadian $ in millions) January 31, 2012 October 31, 2011 November 1, 2010
Exposure to loss
Total
assets Exposure to loss
Total
assets Exposure to loss
Total
assets
Undrawn
facilities(1)
Drawn
facilities
and loans
provided
Securities
held
Derivative
assets Total
Undrawn
facilities(1)
Drawn
facilities
and loans
provided
Securities
held
Derivative
assets Total Total
Unconsolidated SPEs Canadian customer securitization vehicles (2) 3,136 - 315 1 3,452 2,383 3,012 - 343 2 3,357 2,450 3,085 2,976 Structured finance vehicles (3)
na na 7,777 - 7,777 19,616 na na 7,331 - 7,331 19,117 4,772 6,979
Total 3,136 - 8,092 1 11,229 21,999 3,012 - 7,674 2 10,688 21,567 7,857 9,955
(1) These facilities are backstop liquidity facilities provided to our Canadian customer securitization vehicles. None of the backstop liquidity facilities provided to our Canadian customer securitization vehicles related to credit support as at January 31, 2012 and October 31, 2011.
(2) Securities held in our Canadian customer securitization vehicles are comprised of asset-backed commercial paper and are classified as trading securities and available-for-sale securities. Assets held by all these vehicles relate to assets in Canada.
(3) We enter into derivative contracts with third party investment funds to provide their investors with specified exposures. We hedge our risk to these derivative exposures by investing in the investment funds.
na - not applicable

50 BMO Financial Group First Quarter Report 2012
Total assets in our consolidated SPEs and our exposure to losses are summarized in the following table:
(Canadian $ in millions) January 31, 2012 October 31, 2011 November 1, 2010
Exposure to loss
Total
assets Exposure to loss
Total
assets Exposure to loss
Total
assets
Undrawn
facilities
Drawn
facilities
and loans
provided
Securities
held
Derivative
assets Total(1)
Undrawn
facilities
Drawn
facilities
and loans
provided
Securities
held
Derivative
assets Total(1) Total(1)
Consolidated SPEs Canadian customer securitization vehicles 16 - 123 - 139 123 20 - 89 - 109 89 396 196 U.S customer securitization vehicle 3,947 86 - 1 4,034 3,368 3,775 116 - 5 3,896 3,348 4,158 4,074
Bank securitization vehicles (2) 5,100 - 444 82 5,626 10,283 5,100 - 548 94 5,742 10,787 5,577 9,469 Credit protection vehicle – Apex 1,030 - 1,299 363 2,692 2,221 1,030 - 1,208 601 2,839 2,219 2,827 2,208 Structured investment vehicles 51 2,340 - 11 2,402 2,354 91 2,940 - 19 3,050 2,940 5,298 5,225
Capital and funding trusts 2,990 11,065 842 97 14,994 14,247 2,459 8,596 1,162 94 12,311 12,520 11,873 10,950
Total 13,134 13,491 2,708 554 29,887 32,596 12,475 11,652 3,007 813 27,947 31,903 30,129 32,122
1) We consolidate the SPEs in the table and as a result, all intercompany balances and transactions between the bank and the consolidated SPEs are eliminated upon consolidation.
(2) Included in other liabilities is $10,144 million of ABCP and term asset-backed securities funding our bank securitization vehicles.
Customer Securitization Vehicles
We sponsor Canadian and U.S. customer securitization vehicles (also referred to as bank-sponsored multi-seller conduits) that assist our customers with the securitization of their assets to provide them with alternate sources of funding. These vehicles provide clients with access to financing in the asset-backed commercial paper (“ABCP”) markets by allowing them to sell their assets into these vehicles, which then issue ABCP to investors to fund the purchases. In all cases, we do not service the transferred assets. If there are losses on the assets, the seller is the first to take the loss. We do not sell assets to these customer securitization vehicles. We earn fees for providing services related to the securitizations, including liquidity, distribution and financial arrangement fees for supporting the ongoing operations of the vehicles. For our Canadian customer securitization vehicles, we determined that we control and must consolidate three of these vehicles as we have the right to obtain the majority of the benefits though our ownership of ABCP. We are not required to consolidate five of our eight Canadian customer securitization vehicles. For our U.S. customer securitization vehicle, we determined that we control and must consolidate this vehicle, as we have key decision-making powers. Bank Securitization Vehicles We use bank securitization vehicles to securitize our Canadian mortgage loans and Canadian credit card loans in order to obtain alternate sources of funding. The structure of these vehicles limits the types of activities they can undertake and the types of assets they can hold, and they have limited decision making authority. These vehicles issue ABCP or term asset-backed securities to fund their activities. We control and must consolidate these vehicles, as we have key decision-making powers.
Credit Protection Vehicle
We sponsor a credit protection vehicle, Apex Trust (“Apex”) that provides credit protection to investors on investments in corporate debt portfolios through credit default swaps. In May 2008, upon the restructuring of Apex, we entered into credit default swaps with swap counterparties and offsetting swaps with Apex. As at January 31, 2012 and 2011, we have hedged our exposure to our holdings of notes as well as the first $515 million of exposure under the senior funding facility. Since 2008, a third party has held its exposure to Apex through a total return swap with us on $600 million of notes. We control and must consolidate this vehicle, through our ownership of medium term notes. Structured Investment Vehicles
Structured investment vehicles (“SIVs”) provide investment opportunities in customized, diversified debt portfolios in a variety of asset and rating classes. We hold interests in two SIVs, Links Finance Corporation (“Links”) and Parkland Finance Corporation (“Parkland”), and act as asset manager. We control and must consolidate these vehicles, as we have key decision-making powers. Structured Finance Vehicles
We facilitate development of investment products by third parties, including mutual funds, unit investment trusts and other investment funds that are sold to retail investors. We hedge our exposure related to these derivatives by investing in other funds through SPEs. We are not required to consolidate these vehicles under IFRS.

BMO Financial Group First Quarter Report 2012 51
Capital and Funding Trust
Capital and Funding Trusts (the “Trusts”) are created to issue notes or capital trust securities or to guarantee payments due to bondholders on bonds issued by the bank. These trusts
purchase notes from the bank or we may sell assets to the Trusts in exchange for promissory notes. We control and must consolidate these trusts, as the majority of the activities of these trusts are conducted on behalf of the bank.
Note 7: Acquisitions We account for acquisitions of businesses using the acquisition method. The cost of an acquisition is measured at the fair value of the consideration, including contingent consideration. Acquisition-related costs are recognized as an expense in the period in which they are incurred. The acquired identifiable assets, liabilities and contingent consideration are measured at their fair values at the date of acquisition. Goodwill is measured as the excess of the aggregate of the consideration transferred over the net of the amounts of identifiable assets acquired and liabilities assumed. The results of operations of acquired businesses are included in our consolidated financial statements beginning on the date of acquisition. Marshall & Ilsley Corporation (“M&I”)
On July 5, 2011, we completed the acquisition of Milwaukee based Marshall & Ilsley Corporation for consideration of approximately $4.1 billion (US $4.3 billion) paid in common shares, with fractional entitlements to our common shares paid in cash. Each common share of M&I was exchanged for 0.1257 of a common share, resulting in the issuance of approximately 67 million common shares. The value of our common shares was arrived at using the market price of the shares on the date of closing. In addition, immediately prior to the completion of the transaction, we purchased M&I’s Troubled Asset Relief Program preferred shares and warrants from the U.S. Treasury for $1.6 billion (US $1.7 billion). Acquisition costs of $86 million were expensed in non-interest expense, other expenses. The acquisition of M&I allows us to strengthen our competitive position in the U.S. Midwest markets. As part of this acquisition, we acquired a core deposit intangible asset that is being amortized on an accelerated basis over a period of 10 years, a customer relationship intangible asset which is being amortized on an accelerated basis over a period of 15 years, a credit card portfolio intangible asset which is being amortized on an accelerated basis over a period of 15 years, and a trade name intangible asset which is being amortized on an accelerated basis over a period of five years. Goodwill related to this acquisition is not deductible for tax purposes. M&I is part of our Personal and Commercial Banking U.S., Private Client Group, BMO Capital Markets and Corporate Services reporting
segments. Goodwill was allocated to these segments except for Corporate Services. Lloyd George Management (“LGM”)
On April 28, 2011, we completed the acquisition of all outstanding voting shares of Hong Kong-based Lloyd George Management, for cash consideration of $82 million subject to a post-closing adjustment based on working capital, plus contingent consideration based on meeting certain revenue thresholds over three years. We included contingent consideration of approximately $13 million in the purchase price, that is expected to be paid in future years related to this acquisition. During the year ended October 31, 2011, we increased the purchase price by $15 million to $110 million based on a revaluation of net assets acquired and finalization of working capital adjustments. During the year ended October 31, 2011, we decreased our estimate of the contingent consideration to $8 million, resulting in a gain of $5 million. Acquisition costs of $5 million were expensed in non-interest expense, other expenses. The acquisition of LGM allows us to expand our investment management capabilities in Asia and emerging markets to meet clients’ growing demand for global investment strategies. As part of this acquisition, we acquired a customer relationship intangible asset which is being amortized on a straight-line basis over a period of 15 years. Goodwill related to this acquisition is not deductible for tax purposes. LGM is part of our Private Client Group reporting segment. Future Acquisition
COFCO Trust Co.
On February 20, 2012, the bank announced a definitive agreement to acquire a 20% interest in COFCO Trust Co., a subsidiary of COFCO Group, one of China’s largest state-owned enterprises with operations across a variety of sectors, including agriculture and financial services. The investment provides an important opportunity for us to expand our offering to high networth and institutional clients in China. This acquisition is subject to regulatory approval. COFCO Trust Co. will be part of our PCG reporting segment.

52 BMO Financial Group First Quarter Report 2012
The estimated fair values of the assets acquired and the liabilities assumed at the date of acquisition are as follows:
(Canadian $ in millions)
LGM M&I
Cash resources (1) 11 2,838Securities 3 5,980 Loans - 29,128 Premises and equipment - 426 Goodwill 70 1,891 Intangible assets 31 649 Deferred tax assets - 2,138 Other assets 21 2,264
Total assets 136 45,314
Deposits - 33,799
Other liabilities 26 7,404
Total liabilities 26 41,203
Purchase price 110 4,111
The allocation of the purchase price for the LGM and M&I is subject to refinement as we complete the valuation of the assets acquired and liabilities assumed. (1) Cash resources, acquired through the M&I acquisition include cash and cash equivalents and interest bearing deposits.
Note 8: Goodwill When we complete an acquisition, we allocate the purchase price paid to the assets acquired, including identifiable intangible assets, and the liabilities assumed. Any excess of the consideration transferred over the fair value of those net assets is considered to be goodwill. Goodwill is not amortized. Fair value less costs to sell was used to perform the impairment test in 2011. The fair value less costs to sell for each cash generating unit (“CGU”) was determined by discounting cash flow projections. Cash flows were projected for the first ten years based on actual operating results, the expected future business performance and past experience. Beyond the first ten years, cash flows were assumed to grow at perpetual annual rates of up to 3%, a rate that is consistent with long-term nominal GDP growth. Discount rates applied in determining
the recoverable amounts range from 10.9% to 14.7%, and are based on our estimate of the cost of capital for each CGU. The cost of capital for each CGU was estimated using the Capital Asset Pricing Model, based on the historical betas of publicly traded peer companies that are comparable to the CGU. There were no write-downs of goodwill due to impairment during the quarter ended January 31, 2012 and the year ended October 31, 2011. The key assumptions described above may change as market and economic conditions change. However, the bank estimates that reasonably possible changes in these assumptions are not expected to cause recoverable amounts to decline below carrying amounts.
A continuity of our goodwill by CGU for the year ended October 31, 2011 and the quarter ended January 31, 2012 is as follows:
(Canadian $ in millions)
Personal andCommercial
Banking
Private Client Group
BMO Capital
Markets Total
P&C Canada P&C U.S. Total
Client Investing
Investment Products
Private Banking Insurance
Goodwill as at November 1, 2010 123 1,020 1,143 68 216 77 2 363 113 1,619 Acquisitions during the period - 1,478 1,478 - 157 257 - 414 76 1,968 Other (1) (1) 47 46 - 4 10 - 14 2 62 Goodwill as at October 31, 2011 122 2,545 2,667 68 377 344 2 791 191 3,649 Acquisitions during the period - - - - - - - - - - Other (1) - 7 7 - - - - - - 7 Goodwill as at January 31, 2012 122 (2) 2,552 (3) 2,674 68 (4) 377 (5) 344 (6) 2 791 191 (7) 3,656
(1) Other changes in goodwill included the effects of translating goodwill denominated in foreign
currencies into Canadian dollars and purchase accounting adjustments related to prior-year
purchases.
(2) Relates primarily to Moneris Solutions Corporate, bcpbank Canada and Diners Club.
(3) Relates primarily to New Lenox State Bank, First National Bank of Joliet, Household Bank
branches, Mercantile Bancorp, Inc., Villa Park Trust Savings Bank, First National Bank & Trust,
Ozaukee Bank, Merchants and Manufacturers Bancorporation, Inc., AMCORE and M&I.
(4) Relates to BMO Nesbitt Burns Corporation Limited.
(5) Relates to Guardian Group of Funds Ltd., Pyrford International plc, Integra GRS, LGM and M&I.
(6) Relates primarily to Harris myCFO, Inc. and Stoker Ostler Wealth Advisors, Inc and M&I.
(7) Relates to Gerard Klauer Mattison Co., Inc., BMO Nestbitt Burns Corporation Limited, Griffin,
Kubik, Stephens & Thompson, Inc., Paloma Securities LLC and M&I.

BMO Financial Group First Quarter Report 2012 53
Note 9: Deposits
Payable on demand
(Canadian $in millions) Interest bearing Non-interest bearing
Payable
after notice
Payable on
a fixed date Total
January 31,
2012
October 31,
2011
January 31,
2012
October 31,
2011
January 31,
2012
October 31,
2011
January 31,
2012
October 31,
2011
January 31,
2012
October 31,
2011
November 1,
2010
Deposits by:
Banks 715 747 569 541 2,736 2,423 16,130 17,166 20,150 20,877 19,409
Businesses and governments (1) 12,809 11,839 21,469 18,769 39,811 37,953 99,763 90,648 173,852 159,209 131,892 Individuals 5,387 7,170 9,695 9,438 62,518 59,313 44,955 46,366 122,555 122,287 99,043
Total (2) 18,911 19,756 31,733 28,748 105,065 99,689 160,848 154,180 316,557 302,373 250,344
Booked In
Canada 17,882 18,845 22,818 21,059 54,410 51,340 94,570 96,434 189,680 187,678 171,310
United States 753 496 8,798 7,562 49,894 47,767 51,736 43,881 111,181 99,706 64,077
Other Countries 276 415 117 127 761 582 14,542 13,865 15,696 14,989 14,957
Total 18,911 19,756 31,733 28,748 105,065 99,689 160,848 154,180 316,557 302,373 250,344
(1) Included in business and government deposits are Covered Bond issuances of €1 billion maturing in January 2013, US$2 billion maturing in October 2014, US$2 billion maturing in June 2015, US$1.5 billion maturing in January 2016 and US$2 billion maturing in January 2017 and which pay interest of 4.25%, 1.30%, 2.85%, 2.63% and 1.95%, respectively (October 31, 2011 – €1 billion maturing in January 2013, US$2 billion
maturing in October 2014, US$2 billion maturing in June 2015 and US$1.5 billion maturing in January 2016, 4.25%, 1.30%, 2.85% and 2.63%).
(2) As at January 31, 2012 and October 31, 2011, total deposits payable on a fixed date included $19,612 million and $18,190 million, respectively, of federal funds purchased, commercial paper issued and other deposit liabilities.
During the quarter ended January 31, 2012, we issued US$2.0 billion Covered Bonds-Series 5. This deposit pays interest of 1.95% and matures in January 30, 2017. During the quarter ended January 31, 2011, we issued US$1.5 billion Covered Bonds – Series 3. This deposit pays interest of 2.63% and matures on January 25, 2016. Deposits payable on demand are comprised primarily of our customers’ chequing accounts, some of which we pay interest on. Our customers need not notify us prior to withdrawing money from their chequing accounts. Deposits payable after notice are comprised primarily of our customers’ savings accounts, on which we pay interest. Deposits payable on a fixed date are comprised of:
Various investment instruments purchased by our customers to earn interest over a fixed period, such as term deposits and guaranteed investment certificates. The terms of these deposits can vary from one day to 10 years.
Federal funds purchased, which are overnight borrowings of other banks’ excess reserve funds at a United States Federal Reserve Bank. As at January 31, 2012, we had
borrowed $318 million of federal funds ($831 million as at October 31, 2011).
Commercial paper, which totalled $5,265 million as at January 31, 2012 ($3,804 million as at October 31, 2011).
Included in our deposits payable on a fixed date as at January 31, 2012 were $134,360 million of deposits, each greater than one hundred thousand dollars, of which $74,415 million were booked in Canada, $45,403 million were booked in the United States and $14,542 million were booked in other countries ($125,533 million, $76,972 million, $34,695 million and $13,866 million, respectively, as at October 31, 2011). Of the $74,415 million of deposits booked in Canada, $28,071 million mature in less than three months, $3,272 million mature in three to six months, $9,872 million mature in six to 12 months and $33,200 million mature after 12 months ($76,972 million, $34,842 million, $1,846 million, $6,154 million and $34,130 million, respectively, as at October 31, 2011). We have liquid assets of $173,544 million to support these and other deposit liabilities ($147,771 million as at October 31, 2011). A portion of these liquid assets have been pledged.
Note 10: Subordinated Debt During the quarter ended January 31, 2012 and January 31, 2011, we did not issue or redeem any subordinated debt.
Note 11: Capital Trust Securities During the quarter ended January 31, 2012, we redeemed all of our BMO Capital Trust securities – Series C (“BMO BOaTs – Series C”) at a redemption amount equal to $1,000 for an aggregate redemption of $400 million, plus unpaid distributions.
During the quarter ended January 31, 2011, we redeemed all of our BMO Capital Trust Securities – Series B (“BMO BOaTs – Series B”) at a redemption amount equal to $1,000, for an aggregate redemption of $400 million, plus unpaid distributions.

54 BMO Financial Group First Quarter Report 2012
Note 12: Share CapitalDuring the quarter ended January 31, 2012 and 2011 we did not issue or redeem any preferred shares. During the quarter ended July 31, 2011, we issued 66,519,673 common shares to M&I shareholders as consideration for the acquisition of M&I. During the quarter ended April 30, 2011, we issued 11,600,000 3.9% Non-Cumulative 5-year Rate Reset Class B Preferred Shares, Series 25, at a price of $25.00 per share, representing an aggregate issue price of $290 million.
On January 19, 2012, we announced our intention to redeem all of our Non-cumulative Perpetual Class B Preferred Shares Series 10 on February 25, 2012, at a redemption price of US$25.00 per share plus all declared and unpaid dividends up to but excluding the date fixed for redemption. We did not repurchase any shares under our previous normal course issuer bid, which expired on December 15, 2011.
Share Capital Outstanding (1)
(Canadian $ in millions, except as noted) January 31, 2012 October 31, 2011 November 1, 2010
Number of
shares
Amount
Number of
shares
Amount
Number of
shares
Amount
Convertible into…
Preferred Shares – Classified as Equity
Class B – Series 5 8,000,000 200 8,000,000 200 8,000,000 200 -
Class B – Series 10 (2) 12,000,000 396 12,000,000 396 12,000,000 396 common shares (3)
Class B – Series 13 14,000,000 350 14,000,000 350 14,000,000 350 -
Class B – Series 14 10,000,000 250 10,000,000 250 10,000,000 250 -
Class B – Series 15 10,000,000 250 10,000,000 250 10,000,000 250 -
Class B – Series 16 12,000,000 300 12,000,000 300 12,000,000 300 preferred shares – class B – series 17 (4)
Class B – Series 18 6,000,000 150 6,000,000 150 6,000,000 150 preferred shares – class B – series 19 (4) Class B – Series 21 11,000,000 275 11,000,000 275 11,000,000 275 preferred shares – class B – series 22 (4) Class B – Series 23 16,000,000 400 16,000,000 400 16,000,000 400 preferred shares – class B – series 24 (4) Class B – Series 25 11,600,000 290 11,600,000 290 - - preferred shares – class B – series 26 (4)
2,861 2,861 2,571
Common Shares 640,380,373 11,399 638,999,563 11,332 566,468,440 6,927
Share Capital 14,260 14,193 9,498
(1) For additional information refer to Notes 20 and 22 to our consolidated financial statements for the year ended October 31, 2011 on pages 154 to 158 of our 2011 Annual Report.
(2) Face value is US$300 million. (3) The number of shares issuable on conversion is not determinable until the date of conversion.
(4) If converted, the holders have the option to convert back to the original preferred shares on subsequent redemption dates.
(5) The stock options issued under the stock option plan are convertible into 18,452,968 common shares as at January 31, 2012 (16,989,499 common shares as at October 31, 2011).
Note 13: Capital Management Our objective is to maintain a strong capital position in a cost-effective structure that: considers our target regulatory capital ratios and internal assessment of required economic capital; is consistent with our targeted credit ratings; underpins our operating groups’ business strategies; and builds depositor confidence and long-term shareholder value.
We have met OSFI’s stated minimum capital ratios requirement as at January 31, 2012. Our capital position as at January 31, 2012 is detailed in the Capital Management section on page 14 to 15 of Management’s Discussion and Analysis of the First Quarter Report to Shareholders.
Note 14: Employee CompensationStock Options
During the quarter ended January 31, 2012, we granted a total of 2,526,345 stock options (1,798,913 stock options during the quarter ended January 31, 2011). The weighted-average fair value of options granted during the quarter ended January 31, 2012 was $5.54 per option ($7.26 per option for the quarter ended January 31, 2011). The fair value of options granted was estimated using a binomial option pricing model. Expected dividend yield is
based on market expectations of future dividends on our common shares. Expected volatility is determined based on the market consensus implied volatility for traded options on our common shares. The risk-free rate is based on the yields of Canadian strip bonds with maturities similar to the expected period until exercise of the options. To determine the fair value of the stock option tranches (i.e. the 25% portion that vests each year) on the grant date, the following ranges of values were used for each option pricing assumption:
For stock options granted during the three months ended
January 31,
2012
January 31,
2011
Expected dividend yield 6.8%-7.2% 6.0%-6.4%Expected share price volatility 21.3%-22.3% 22.1%-22.8%
Risk-free rate of return 1.5%-1.8% 2.7%-3.0%
Expected period until exercise (in years) 5.5-7.0 5.5-7.0
Changes to the input assumptions can result in different fair value estimates.

BMO Financial Group First Quarter Report 2012 55
Pension and Other Employee Future Benefit Expenses
Pension and other employee future benefit expenses are determined as follows:
(Canadian $ in millions)
Pension benefit plans Other employee future benefit plans
For the three months ended
January 31,
2012
January 31,
2011
January 31,
2012
January 31,
2011
Benefits earned by employees 46 38 4 6 Interest cost on accrued benefit liability 67 63 13 13 Plan amendment costs recognized in expense - - (1) (1)
Expected return on plan assets (79) (82) (1) (1)
Benefits expense 34 19 15 17 Canada and Quebec pension plan expense 16 15 - - Defined contribution expense 2 2 - -
Total pension and other employee future benefit expenses 52 36 15 17
Note 15: Earnings Per Share The following tables present the bank’s basic and diluted earnings per share:
Basic earnings per share
(Canadian $ in millions, except as noted) For the three months ended
January 31,
2012
January 31,
2011
Net income attributable to Bank shareholders 1,090 807
Dividends on preferred share (37) (34)
Net income available to common shareholders 1,053 773
Average number of common shares outstanding (in thousands) 640,033 567,451
Basic earnings per share (Canadian $) 1.65 1.36
Diluted earnings per share
(Canadian $ in millions, except as noted) For the three months ended
January 31,
2012
January 31,
2011
Net income available to common shareholders adjusted for dilution effect 1,061 785
Average number of common shares outstanding (in thousands) 640,033 567,451
Convertible shares 10,225 17,069
Stock options potentially exercisable (1) 6,254 9,085
Common shares potentially repurchased (4,972) (6,619)
Average diluted number of common shares outstanding (in thousands) 651,540 586,986
Diluted earnings per share (Canadian $) 1.63 1.34
(1) In computing diluted earnings per share we excluded average stock options outstanding of 2,070,340 with a weighed-average exercise price of $118.58 for the three months ended January 31, 2012 (764,013 with a weighted-average exercise price of $63.59 for the three months ended January 31, 2011) as the average share price for the period did not exceed the exercise price.
Basic Earnings per Share
Our basic earnings per share is calculated by dividing our net income, after deducting total preferred shares dividends by the daily average number of fully paid common shares outstanding throughout the year. Diluted Earnings per Share
Diluted earnings per share represents what our earnings per share would have been if instruments convertible into common shares that had the impact of reducing our earnings per share had been converted either at the beginning of the year for instruments that were outstanding all year or from the date of issue for instruments issued during the year. Convertible Shares
In determining diluted earnings per share, we increase net income available to common shareholders by dividends paid on convertible preferred shares and interest on capital trust securities as these distributions would not have been paid if the instruments had been converted at the beginning of the year.
Similarly, we increase the average number of common shares outstanding by the number of shares that would have been issued had the conversion taken place at the beginning of the year. Employee Stock Options
In determining diluted earnings per share, we increase the average number of common shares outstanding by the number of shares that would have been issued if all stock options with a strike price below the average share price for the period had been exercised. When performance targets have not been met, affected options are excluded from the calculation. We also decrease the average number of common shares outstanding by the number of our common shares that we could have repurchased if we had used the proceeds from the exercise of stock options to repurchase them on the open market at the average share price for the period. We do not adjust for stock options with a strike price above the average share price for the period because including them would increase our earnings per share, not dilute it.

56 BMO Financial Group First Quarter Report 2012
Note 16: Operating and Geographic Segmentation Operating Groups We conduct our business through three operating groups, each of which has a distinct mandate. We determine our operating groups based on our management structure and therefore these groups, and results attributed to them, may not be comparable with those of other financial services companies. We evaluate the performance of our groups using measures such as net income, revenue growth, return on equity, net economic profit and non-interest expense-to-revenue (productivity) ratio, as well as cash operating leverage. Personal and Commercial Banking
Personal and Commercial Banking (“P&C”) is comprised of two operating segments: Personal and Commercial Banking Canada and Personal and Commercial Banking U.S. Personal and Commercial Banking Canada
Personal and Commercial Banking Canada (“P&C Canada”) offers a broad range of products and services to personal and business customers, including solutions for everyday banking, financing, investing, credit cards and creditor insurance, as well as a broad suite of commercial and financial advisory services, through an integrated network of branches, telephone banking, online and mobile banking and automated banking machines as well as expertise from mortgage specialists, financial planners and small business bankers. Effective in the first quarter of 2012, Private Client Group and P&C Canada have entered into a revised agreement sharing the financial results related to retail Mutual Fund sales. Prior periods have been restated. Personal and Commercial Banking U.S.
Personal and Commercial Banking U.S. (“P&C U.S.”) offers a broad range of products and services to personal and business clients in select U.S. Midwest markets, Arizona and Florida through branches and direct banking channels such as telephone banking, online banking and a network of automated banking machines. Private Client Group
Private Client Group (“PCG”), our group of wealth management businesses, serves a full range of client segments, from mainstream to ultra-high net worth, as well as select institutional markets, with a broad offering of wealth management products and solutions including insurance products. PCG operates in both Canada and the United States, as well as in Asia and Europe. Effective in the first quarter of 2012, PCG and P&C Canada have entered into a revised agreement sharing the financial results related to retail Mutual Fund sales. Prior periods have been restated. BMO Capital Markets
BMO Capital Markets (“BMO CM”) combines all of our businesses serving corporate, institutional and government clients. In Canada and the United States, these clients span a broad range of industry sectors. BMO CM also serves clients in the United Kingdom, Europe, Asia and Australia. BMO CM offers clients financial solutions, including equity and debt underwriting, corporate lending and project financing, mergers and acquisitions, advisory services, merchant banking,
securitization, treasury and market risk management, debt and equity research and institutional sales and trading. Corporate Services
Corporate Services includes the corporate units that provide enterprise-wide expertise and governance support in areas such as Technology and Operations (“T&O”), strategic planning, legal and compliance, finance, internal audit, risk management, corporate communications, economics, corporate marketing and human resources. Operating results include revenues and expenses associated with certain securitization and asset-liability management activities, the elimination of taxable equivalent adjustments, the impact of our expected loss provisioning methodology, the results from certain impaired loan portfolios, the impact of certain fair value adjustments, and integration and restructuring costs relating to the M&I acquisition. T&O manages, maintains and provides governance over our information technology, operations services, real estate and sourcing. T&O focuses on enterprise-wide priorities that improve quality and efficiency to deliver an excellent customer experience. Operating results for T&O are included with Corporate Services for reporting purposes. However, costs of T&O services are transferred to the three operating groups and only minor amounts are retained. As such, results for Corporate Services largely reflect the activities outlined above. Corporate Services also includes residual revenues and expenses representing the differences between actual amounts earned or incurred and the amounts allocated to operating groups. Operating results for the structured credit vehicles are included within Corporate Services for reporting purposes from November 1, 2010 onwards. Previously they were recorded in BMO Capital Markets. Basis of Presentation
The results of these operating segments are based on our internal financial reporting systems. The accounting policies used in these segments are generally consistent with those followed in the preparation of our consolidated financial statements as disclosed in Note 1 and throughout the consolidated financial statements. Notable accounting measurement differences are the taxable equivalent basis adjustment and the provisions for credit losses, as described below.
Taxable Equivalent Basis
We analyze net interest income on a taxable equivalent basis (“teb”) at the operating group level. This basis includes an adjustment which increases IFRS revenues and the IFRS provision for income taxes by an amount that would raise revenues on certain tax-exempt securities to a level that incurs tax at the statutory rate. The operating groups’ teb adjustments are eliminated in Corporate Services.

BMO Financial Group First Quarter Report 2012 57
Provisions for Credit Losses
Provisions for credit losses are generally allocated to each group based on expected losses for that group. Differences between expected loss provisions and provisions required under IFRS are included in Corporate Services. Acquisition of Marshall & Ilsley Corporation
Commencing on July 5, 2011, our P&C U.S., PCG, BMO CM and Corporate Services segments include a portion of M&I’s acquired business. Within Corporate Services we have included the fair value adjustments for credit losses on the M&I loan portfolio and the valuation of loans and deposits at current market rates. Upon acquisition, Corporate Services also included approximately $1.5 billion of certain M&I impaired real estate – secured assets, comprised primarily of commercial real estate loans. Corporate Services results will include any changes in our estimate of credit losses as well as adjustments to net interest income. The operating groups’ results will reflect the provision for credit losses on an expected loss basis and net interest income based on the contractual rates for loans and deposits. Impaired Real Estate Secured Loans
During the quarter ended July 31, 2011, approximately $1 billion of impaired real estate secured loans comprised primarily of commercial real estate loans were transferred to Corporate Services from P&C U.S. to allow our businesses to focus on ongoing customer relationships and leverage our risk management expertise in our special assets management unit.
Inter-Group Allocations
Various estimates and allocation methodologies are used in the preparation of the operating groups’ financial information. We allocate expenses directly related to earning revenue to the groups that earned the related revenue. Expenses not directly related to earning revenue, such as overhead expenses, are allocated to operating groups using allocation formulas applied on a consistent basis. Operating group net interest income reflects internal funding charges and credits on the groups’ assets, liabilities and capital, at market rates, taking into account relevant terms and currency considerations. The offset of the net impact of these charges and credits is reflected in Corporate Services. Geographic Information
We operate primarily in Canada and the United States but we also have operations in the United Kingdom, Europe, the Caribbean and Asia, which are grouped in Other countries. We allocated our results by geographic region based on the location of the unit responsible for managing the related assets, liabilities, revenues and expenses, except for the consolidated provision for credit losses, which is allocated based upon the country of ultimate risk.

58 BMO Financial Group First Quarter Report 2012
Our results and average assets, grouped by operating segment and geographic region are as follows:
(Canadian $ in millions)
For the three months ended January 31, 2012 (2)
P&C
Canada
P&C
U.S. PCG BMO CM
Corporate
Services (1) Total
Net interest income 1,109 632 164 287 126 2,318Non-interest revenue 447 149 531 485 187 1,799 Total Revenue 1,556 781 695 772 313 4,117Provision for credit losses 138 86 4 24 (111) 141 Amortization 39 48 16 10 62 175 Non-interest expense 774 445 541 473 146 2,379 Income before taxes 605 202 134 265 216 1,422Income taxes 159 65 29 67 (7) 313
Net Income 446 137 105 198 223 1,109
Average Assets 157,584 62,454 19,433 248,725 49,938 538,134
Goodwill (As At) 122 2,552 791 191 - 3,656
For the three months ended January 31, 2011 (2)
P&C
Canada
P&C
U.S. PCG BMO CM
Corporate
Services (1) Total
Net interest income 1,110 293 107 341 (134) 1,717Non-interest revenue 470 65 562 618 36 1,751 Total Revenue 1,580 358 669 959 (98) 3,468Provision for credit losses 136 37 2 30 118 323 Amortization 34 19 9 7 50 119 Non-interest expense 745 220 470 482 22 1,939
Income before taxes 665 82 188 440 (288) 1,087 Income taxes 188 28 44 180 (178) 262
Net Income 477 54 144 260 (110) 825
Average Assets 151,295 30,246 16,082 206,907 39,865 444,395
Goodwill (As At) 122 1,002 362 112 - 1,598
For the three months ended January 31, 2012 (2) Canada United States
Other
Countries (1) Total
Net interest income 1,340 964 14 2,318
Non-interest revenue 1,194 471 134 1,799
Total Revenue 2,534 1,435 148 4,117 Provision for credit losses 183 (42) - 141 Amortization 99 75 1 175 Non-interest expense 1,444 886 49 2,379
Income before taxes 808 516 98 1,422 Income taxes 159 154 - 313
Net Income 649 362 98 1,109
Average Assets 321,440 197,198 19,496 538,134
Goodwill (As At) 467 3,168 21 3,656
For the three months ended January 31, 2011 (2) Canada United States
Other
Countries (1) Total
Net interest income 1,355 370 (8) 1,717
Non-interest revenue 1,313 329 109 1,751
Total Revenue 2,668 699 101 3,468 Provision for credit losses 169 144 10 323 Amortization 88 30 1 119 Non-interest expense 1,389 497 53 1,939
Income before taxes 1,022 28 37 1,087 Income taxes 227 30 5 262
Net Income 795 (2) 32 825
Average Assets 296,485 124,967 22,943 444,395
Goodwill (As At) 447 1,130 21 1,598
(1) Corporate Services includes Technology and Operations. (2) Operating groups report on a taxable equivalent basis – see Basis of Presentation section.

BMO Financial Group First Quarter Report 2012 59
Note 17: Financial Instruments Fair Value of Financial Instruments
We record trading assets and liabilities, derivatives, available-for-sale securities and securities sold but not yet purchased at fair value and other non-trading assets and liabilities at amortized cost less allowances or write-downs for impairment. Where there is no quoted market value, fair value is determined using a variety of valuation techniques and assumptions. These fair values are based upon the estimated amounts for individual assets and liabilities and do not include an estimate of the fair value of any of the legal entities or underlying operations that comprise our business. Fair value amounts disclosed represent point-in-time estimates that may change in subsequent reporting periods due to market conditions or other factors. Fair value represents our estimate of the amounts for which we could exchange the financial instruments with willing third parties who were interested in acquiring the instruments. In most cases, however, the financial instruments are not typically exchangeable or exchanged and therefore it is difficult to determine their fair value. In those cases, we have estimated fair value taking into account only changes in interest rates and credit risk that have occurred since we acquired them or entered into the underlying contracts. These calculations represent management’s best estimates based on a range of methodologies and assumptions; since they involve uncertainties, the fair values may not be realized in an actual sale or immediate settlement of the instruments. Interest rate changes are the main cause of changes in the fair value of our financial instruments. Financial Instruments Whose Book Value Approximates Fair Value Fair value is assumed to equal book value for acceptance-related liabilities and securities lent or sold under repurchase agreements, due to the short-term nature of these assets and liabilities. Fair value is also assumed to equal book value for our cash resources, certain other assets and certain other liabilities.
Loans In determining the fair value of our loans, we incorporate the following assumption:
For fixed rate and floating rate performing loans and customers’ liability under acceptances, we discount the remaining contractual cash flows, adjusted for estimated prepayment, at market interest rates currently offered for loans with similar terms.
The value of our loan balances determined using the above assumption is further adjusted by a credit mark that represents an estimate of the expected credit losses in our loan portfolio. Securities The methods used to determine the fair value of securities are provided in Note 1. Derivative Instruments The methods used to determine the fair value of derivative instruments are provided in Note 1. Deposits In determining the fair value of our deposits, we incorporate the following assumptions:
For fixed rate, fixed maturity deposits, we discount the remaining contractual cash flows for these deposits, adjusted for expected redemptions, at market interest rates currently offered for deposits with similar terms and risks.
For fixed rate deposits with no defined maturities, we consider fair value to equal book value based on book value being equivalent to the amount payable on the reporting date.
For floating rate deposits, changes in interest rates have minimal impact on fair value since deposits reprice to market frequently. On that basis, fair value is assumed to equal book value.
Subordinated Debt and Capital Trust Securities
The fair value of our subordinated debt and capital trust securities is determined by referring to current market prices for similar instruments.
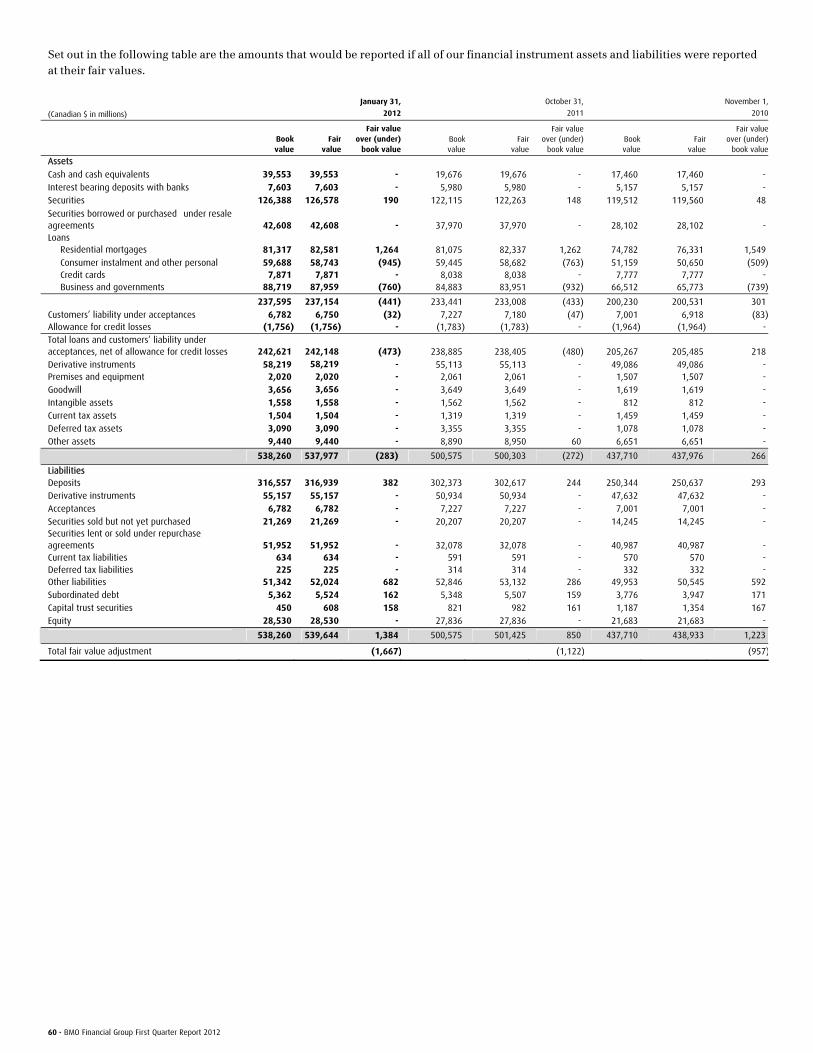
60 BMO Financial Group First Quarter Report 2012
Set out in the following table are the amounts that would be reported if all of our financial instrument assets and liabilities were reported at their fair values.
(Canadian $ in millions)
January 31,
2012
October 31,
2011
November 1,
2010
Book value
Fair value
Fair valueover (under)
book valueBookvalue
Fairvalue
Fair value over (under)
book value Book value
Fairvalue
Fair value over (under)
book value
Assets
Cash and cash equivalents 39,553 39,553 - 19,676 19,676 - 17,460 17,460 -
Interest bearing deposits with banks 7,603 7,603 - 5,980 5,980 - 5,157 5,157 -
Securities 126,388 126,578 190 122,115 122,263 148 119,512 119,560 48
Securities borrowed or purchased under resale agreements 42,608 42,608 - 37,970 37,970 - 28,102 28,102 - Loans Residential mortgages
81,317 82,581 1,264 81,075 82,337 1,262 74,782 76,331 1,549
Consumer instalment and other personal 59,688 58,743 (945) 59,445 58,682 (763) 51,159 50,650 (509) Credit cards 7,871 7,871 - 8,038 8,038 - 7,777 7,777 - Business and governments 88,719 87,959 (760) 84,883 83,951 (932) 66,512 65,773 (739) 237,595 237,154 (441) 233,441 233,008 (433) 200,230 200,531 301
Customers’ liability under acceptances 6,782 6,750 (32) 7,227 7,180 (47) 7,001 6,918 (83)Allowance for credit losses (1,756) (1,756) - (1,783) (1,783) - (1,964) (1,964) -
Total loans and customers’ liability under acceptances, net of allowance for credit losses 242,621 242,148 (473) 238,885 238,405 (480) 205,267 205,485 218
Derivative instruments 58,219 58,219 - 55,113 55,113 - 49,086 49,086 - Premises and equipment 2,020 2,020 - 2,061 2,061 - 1,507 1,507 -
Goodwill 3,656 3,656 - 3,649 3,649 - 1,619 1,619 -
Intangible assets 1,558 1,558 - 1,562 1,562 - 812 812 -
Current tax assets 1,504 1,504 - 1,319 1,319 - 1,459 1,459 -
Deferred tax assets 3,090 3,090 - 3,355 3,355 - 1,078 1,078 -
Other assets 9,440 9,440 - 8,890 8,950 60 6,651 6,651 -
538,260 537,977 (283) 500,575 500,303 (272) 437,710 437,976 266
Liabilities Deposits 316,557 316,939 382 302,373 302,617 244 250,344 250,637 293
Derivative instruments 55,157 55,157 - 50,934 50,934 - 47,632 47,632 -
Acceptances 6,782 6,782 - 7,227 7,227 - 7,001 7,001 -
Securities sold but not yet purchased 21,269 21,269 - 20,207 20,207 - 14,245 14,245 - Securities lent or sold under repurchase agreements 51,952 51,952 - 32,078 32,078 - 40,987 40,987 - Current tax liabilities 634 634 - 591 591 - 570 570 - Deferred tax liabilities 225 225 - 314 314 - 332 332 - Other liabilities 51,342 52,024 682 52,846 53,132 286 49,953 50,545 592
Subordinated debt 5,362 5,524 162 5,348 5,507 159 3,776 3,947 171
Capital trust securities 450 608 158 821 982 161 1,187 1,354 167
Equity 28,530 28,530 - 27,836 27,836 - 21,683 21,683 -
538,260 539,644 1,384 500,575 501,425 850 437,710 438,933 1,223
Total fair value adjustment (1,667) (1,122) (957)

BMO Financial Group First Quarter Report 2012 61
Financial Instruments Designated at Fair Value A portion of our structured note liabilities has been designated at fair value through profit or loss and are accounted for at fair value, which aligns the accounting result with the way the portfolio is managed. The change in fair value of these structured notes was an increase in non-interest revenue, trading revenues of $33 million for the quarter ended January 31, 2012 (increase of $47 million for the quarter ended January 31, 2011). This includes an increase of $6 million for the quarter ended January 31, 2012 attributable to changes in our credit spread (an increase of $4 million for the quarter ended January 31, 2011). We recognized offsetting amounts on derivatives and other financial instrument contracts that are held to hedge changes in the fair value of these structured notes. The change in fair value related to changes in our credit spread that has been recognized since they were designated at fair value through profit or loss to January 31, 2012 was an unrealized gain of $27 million. Starting in 2009, we hedged the exposure to changes in our credit spreads. The fair value and amount due at contractual maturity of these structured notes as at January 31, 2012 were $4,322 million and $4,448 million, respectively ($4,301 million and $4,572 million, respectively, as at October 31, 2011). These structured notes are recorded in Other Liabilities in our Consolidated Balance Sheet. We designate certain insurance investments at fair value through profit or loss since the actuarial calculation of insurance liabilities is based on the fair value of the investments supporting them. This designation aligns the accounting result with the way the portfolio is managed. The fair value of these investments as at January 31, 2012 of $5,193 million ($4,965 million as at October 31, 2011) is recorded in Trading Securities in our Consolidated Balance Sheet. The impact of recording these investments at fair value through profit or loss was an increase in non-interest revenue, insurance income of $169 million for the quarter ended January 31, 2012 (decrease of $62 million for the quarter ended January 31, 2011). Changes in the insurance liability balances are also recorded in non-interest revenue, insurance income. We designate the obligation related to certain annuity contracts at fair value through profit or loss, which eliminates a measurement inconsistency that would otherwise arise from measuring the annuity liabilities and offsetting changes in the fair value of the investments supporting them on a different basis. The fair value of these annuity liabilities as at January 31, 2012 of $252 million ($214 million as at October 31, 2011) is recorded in Other Liabilities in our Consolidated Balance Sheet. The change in fair value of these annuity liabilities resulted in a decrease of $12 million in non-interest revenue, insurance income, for the quarter ended January 31, 2012 (increase of $8 million, for the quarter ended January 31, 2011). Changes in the fair value of investments backing these annuity liabilities are also recorded in non-interest revenue, insurance income. We designate investments held by our credit protection vehicle and our structured investment vehicles (our “structured credit vehicles”) at fair value through profit or loss, which aligns the accounting result with the way the portfolio is managed. The fair value of these investments as at January 31, 2012 of $4,619 million ($5,266 million as at October 31, 2011) is recorded in Trading Securities in our Consolidated Balance Sheet. The
impact of recording these at fair value through profit or loss was a decrease in non-interest revenue, trading revenues of $5 million for the quarter ended January 31, 2012 (decrease of $77 million for the quarter ended January 31, 2011). We recognized offsetting amounts on derivative contracts that are held to hedge changes in the fair value of these investments. Note liabilities issued by our credit protection vehicle and our structured investment vehicles have been designated at fair value through profit or loss and are accounted for at fair value. This eliminates a measurement inconsistency that would otherwise arise from measuring the note liabilities and offsetting changes in the fair value of investments and derivatives on a different basis. The fair value of these note liabilities as at January 31, 2012 of $826 million ($784 million as at October 31, 2011) is recorded in Other Liabilities in our Consolidated Balance Sheet. The change in fair value of these note liabilities resulted in a decrease of $45 million in non-interest revenue, trading revenues for the quarter ended January 31, 2012 (decrease of $23 million, for the quarter ended January 31, 2011). We designate certain investments held in our merchant banking business at fair value through profit or loss, which aligns the accounting result with the way the portfolio is managed. The fair value of these investments as at January 31, 2012 of $590 million ($577 million as at October 31, 2011) is recorded in Securities in our Consolidated Balance Sheet. The impact of recording these investments at fair value through profit or loss was a decrease in non-interest revenue, trading revenues of $25 million for the quarter ended January 31, 2012 (increase of $12 million for the quarter ended January 31, 2011).
Fair Value Hierarchy
We use a fair value hierarchy to categorize the inputs we use in valuation techniques to measure fair value. The extent of our use of quoted market prices (Level 1), internal models using observable market information as inputs (Level 2) and internal models without observable market information as inputs (Level 3) in the valuation of securities, fair value liabilities, derivative assets and derivative liabilities was as follows:

62 BMO Financial Group First Quarter Report 2012
(Canadian $ in millions) January 31, 2012 October 31, 2011 November 1, 2010
Valued
using
quoted
market
prices
Valued using
models
(with
observable
inputs)
Valued using
models
(without
observable
inputs)
Valued
using
quoted
market
prices
Valued using
models
(with
observable
inputs)
Valued using
models
(without
observable
inputs)
Valued
using
quoted
market
prices
Valued
using
models (with
observable
inputs)
Valued using
models
(without
observable
inputs)
Trading Securities Issued or guaranteed by: Canadian federal government 12,577 965 - 14,012 21 - 12,372 64 - Canadian provincial and municipal governments 3,277 2,024 - 5,896 129 - 3,909 6 - U.S. federal government 6,498 3 - 5,875 - - 8,061 - - U.S. states, municipalities and agencies 365 248 - 389 212 - 848 206 - Other governments 663 - - 1,149 - - 1,365 - - Mortgage-backed securities and collateralized mortgage obligations 515 893 427 562 1,194 494 859 2,396 780 Corporate debt 8,803 3,787 1,323 8,065 4,003 1,485 7,433 4,930 1,605 Corporate equity 25,732 2,918 - 23,706 2,733 - 27,239 631 -
58,430 10,838 1,750 59,654 8,292 1,979 62,086 8,233 2,385
Available-for-Sale Securities
Issued or guaranteed by: Canadian federal government 21,140 - - 19,896 - - 18,248 - - Canadian provincial and municipal governments 2,028 296 - 1,189 296 - 1,442 253 - U.S. federal government 5,339 - - 4,670 - - 5,658 - - U.S. states, municipalities and agencies 546 3,478 21 553 3,052 25 - 4,237 20 Other governments 6,840 826 - 7,704 825 - 9,454 587 - Mortgage-backed securities and collateralized mortgage obligations 5,057 1,722 - 5,088 913 - 683 1,101 - Corporate debt 4,393 1,446 72 5,634 97 62 2,959 134 347 Corporate equity 212 146 983 197 214 1,011 137 229 435 45,555 7,914 1,076 44,931 5,397 1,098 38,581 6,541 802
Other Securities 98 - 492 84 - 493 128 - 537
98 - 492 84 - 493 128 - 537
Fair Value Liabilities
Securities sold but not yet purchased 21,269 - - 20,207 - - 14,245 - - Structured notes and other note liabilities - 5,148 - - 5,085 - - 4,747 -
21,269 5,148 - 20,207 5,085 - 14,245 4,747 -
Derivative Assets Interest rate contracts 11 42,315 7 14 37,817 167 24 33,189 217 Foreign exchange contracts 19 9,300 - 31 10,422 - 45 10,089 - Commodity contracts 2,058 226 - 1,473 138 - 2,207 382 - Equity contracts 3,329 398 7 3,869 461 6 1,028 617 8 Credit default swaps - 477 72 - 648 67 - 1,120 160
5,417 52,716 86 5,387 49,486 240 3,304 45,397 385
Derivative Liabilities
Interest rate contracts 12 40,326 43 22 35,849 38 38 32,255 48 Foreign exchange contracts 15 9,062 - 23 9,884 - 20 9,517 - Commodity contracts 2,116 351 - 1,520 320 - 2,087 501 - Equity contracts 126 2,484 69 141 2,192 65 53 2,109 71 Credit default swaps - 551 2 - 878 2 - 930 3 2,269 52,774 114 1,706 49,123 105 2,198 45,312 122

BMO Financial Group First Quarter Report 2012 63
Valuation Techniques and Significant Inputs
We determine the fair value of publicly traded fixed maturity and equity securities using quoted market prices in active markets (Level 1) when these are available. When quoted prices in active markets are not available, we determine the fair value of financial instruments using models such as discounted cash flows with observable market data for inputs such as yield and prepayment rates or broker quotes and other third party vendor quotes (Level 2). Fair value may also be determined using models where the significant market inputs are unobservable due to inactive or minimal market activity (Level 3). We maximize the use of market inputs to the extent possible. Our Level 2 trading securities are primarily valued using discounted cash flow models with observable spreads or based on broker quotes. The fair value of Level 2 available-for-sale securities is determined using discounted cash flow models with observable spreads or third party vendor quotes. Level 2 structured note liabilities are valued using models with observable market information. Level 2 derivative assets and liabilities are valued using industry standard models and observable market information. Sensitivity analysis at January 31, 2012 for the most significant Level 3 instruments, that is securities for which greater than 10% of the balance is classified as Level 3, is provided below where applicable. Within Level 3 trading securities are mortgage backed securities and collateralized mortgage obligations of $427 million. The fair value of these securities is determined using benchmarking to similar instruments and by obtaining independent prices provided by third-party vendors, broker quotes and relevant market indices, as applicable. Where external price data is not available, we assess the collateral performance in assessing the fair value of the securities. The impact of assuming a 10 basis point increase or decrease in market spread would result in a change in fair value of $(2) million and $2 million respectively. Within Level 3 trading securities is corporate debt of $1,190 million that relates to securities that are hedged with total return swaps and credit default swaps that are also considered a Level 3 instrument. The sensitivity analysis for the structured product is performed on an aggregate basis and is described as part of the discussion on derivatives below. Within Level 3 available for sale securities is corporate equity of $678 million that relates to U.S. Federal Reserve Banks and U.S. Federal Home Loan Banks that we hold to meet regulatory requirements in the U.S. and $305 million that relates to private equity investments. The valuation of these investments requires management judgement due to the absence of quoted market prices, the potential lack of liquidity and the long-term nature of such assets. Each quarter, the valuation of these investments is reviewed using relevant company-specific and industry data including historical and projected net income, credit and liquidity conditions and recent transactions, if any. Since the valuation of these investments does not use models, a sensitivity analysis on the category is not performed.
Within derivative assets and derivative liabilities as at January 31, 2012 was $79 million and $45 million, respectively, related to the mark-to-market of credit default swaps and total return swaps on structured products. We have determined the valuation of these derivatives and the related securities based on external price data obtained from brokers and dealers for similar structured products. Where external price information is not available, we use market-standard models, such as Intex, to model the specific collateral composition and cash flow structure of the deal. Key inputs to the model are market spread data for each credit rating, collateral type and other relevant contractual features. The impact of assuming a 10 basis point increase or decrease in the market spread would result in a change in fair value of $(3) million and $3 million, respectively. Significant Transfers
Transfers are made between the various fair value hierarchy levels due to changes in the availability of quoted market prices or observable market inputs due to changing market conditions. The following is a discussion of the significant transfers between Level 1, Level 2 and Level 3 balances for the quarter ended January 31, 2012. During the quarter ended January 31, 2012, no significant transfers were made into or out of Level 3. During the year ended October 31, 2011, available-for-sale securities purchased as part of the M&I acquisition that are classified as Level 3 totalled $326 million of which $124 million were sold during the year ended October 31, 2011. In addition, to meet regulatory requirements after the acquisition of M&I we purchased $430 million of additional stock in Federal Reserve Banks and Federal Home Loan Banks. During the year ended October 31, 2011, $139 million of trading corporate debt securities were transferred from Level 3 to Level 2 as values for these securities are now obtained through a third party vendor and are based on market prices. During the year ended October 31, 2011, $207 million and $20 million of mortgage-backed securities and collateralized mortgage obligations were transferred from Level 3 to Level 2 within trading securities and available-for-sale securities, respectively, as values for these securities are now obtained through a third party vendor and are based on a larger volume of market prices. During the year ended October 31, 2011, derivative assets of $84 million and derivative liabilities of $13 million were transferred from Level 3 to Level 2 as market information became available for certain over-the-counter equity contracts. Changes in Level 3 Fair Value Measurements
The table on the following page presents a reconciliation of all changes in Level 3 financial instruments during the quarter ended January 31, 2012, including realized and unrealized gains (losses) included in earnings and other comprehensive income.

64 BMO Financial Group First Quarter Report 2012
(Canadian $ in millions) Change in Fair Value
For the three months ended January 31, 2012
Balance, October 31,
2011 Included in
earnings
Included in other
comprehensive income Purchases Sales Maturities (1)
Transfers out of Level 3
Fair Value as at
January 31, 2012
Unrealized Gains
(losses) (2)
Trading Securities Mortgage-backed securities and collateralized mortgage obligations 494 (9) - - (58) - - 427 (9)Corporate debt 1,485 11 - - (173) - - 1,323 11
Total trading securities 1,979 2 - - (231) - - 1,750 2
Available-for-Sale Securities Issued or guaranteed by: U.S. states, municipalities and
agencies 25 - (3) - - (1) - 21 (3)
Corporate debt 62 - 2 24 (2) (14) - 72 3
Corporate equity 1,011 (4) 5 22 (45) (6) - 983 5
Total available-for-sale securities 1,098 (4) 4 46 (47) (21) - 1,076 5
Other Securities 493 (17) - 17 (1) - - 492 16 Total other securities 493 (17) - 17 (1) - - 492 16
Derivative Assets Interest rate contracts 167 (2) - - - (158) - 7 - Equity contracts 6 - - 1 - - - 7 - Credit default swaps 67 - - 5 - - - 72 -
Total derivative assets 240 (2) - 6 - (158) - 86 -
Derivative Liabilities
Interest rate contracts 38 - - 5 - - - 43 -
Equity contracts 65 8 - 1 - (5) - 69 9
Credit default swaps 2 - - - - - - 2 -
Total derivative liabilities 105 8 - 6 - (5) - 114 9
(1) Includes cash settlement of derivative assets and derivative liabilities. (2) Unrealized gains or losses on trading securities, derivative assets and derivative liabilities still held on January 31, 2012 are included in earnings in the period. For available-for-sale securities, the unrealized gains or losses on securities still held on January 31, 2012 are included in Accumulated Other Comprehensive Income.
Other Items Measured at Fair Value
Certain assets such as foreclosed assets are measured at fair value at initial recognition but are not required to be measured at fair value on an ongoing basis.
As at January 31, 2012, we held $175 million of foreclosed assets measured at fair value at inception, all of which were classified as Level 2. For the quarter ended January 31, 2012, we recorded write-downs of $38 million on these assets.
Note 18: Transition to International Financial Reporting Standards The differences between our Canadian GAAP accounting policies and IFRS requirements, combined with our decisions on the optional exemptions from retroactive application of IFRS, resulted in measurement and recognition differences on transition to IFRS. The net impact of these differences was recorded in opening retained earnings as of November 1, 2010, affecting shareholders’ equity, with the exception of the accumulated other comprehensive loss on the translation of foreign operations (described below under cumulative translation differences), as this was already recorded in shareholders’ equity. These impacts also extend to our capital ratios, with the exception of the change related to accumulated other comprehensive loss on translation of foreign operations, which had no impact on our capital ratios. The impact on Basel II ratios will be phased-in over five quarters. The following information reflects our first-time adoption transition elections under IFRS 1, the standard for first-time adoption and the significant accounting changes resulting from our adoption of IFRS. The general principle under IFRS 1 is retroactive application, such that our opening balance sheet as at November 1, 2010 was restated as though we had always applied IFRS with the net impact shown as an adjustment to opening retained earnings. However, IFRS 1 contains mandatory exceptions and permits certain optional exemptions from full retroactive application. In preparing our opening
balance sheet in accordance with IFRS 1, we have applied certain of the optional exemptions and the mandatory exceptions from full retroactive application of IFRS as described below. Exemptions from Full Retroactive Application Elected by the Bank
We have elected to apply the following optional exemptions from full retroactive application:
Pension and other employee future benefits – We have elected to recognize all cumulative actuarial gains and losses, as at November 1, 2010, in opening retained earnings for all of our employee benefit plans.
Business combinations – We have elected not to apply IFRS 3, the current standard for accounting for business combinations, retroactively in accounting for business combinations that took place prior to November 1, 2010.
Share-based payment transactions – We have elected not to go back and apply IFRS 2, the standard for accounting for share-based payments, in accounting for equity instruments granted on or before November 7, 2002, and equity instruments granted after November 7, 2002, that have vested by the transition date. We have also elected not to go back and apply IFRS 2 in accounting for liabilities arising

BMO Financial Group First Quarter Report 2012 65
from cash-settled share-based payment transactions that were settled prior to the transition date.
Cumulative translation differences - We have elected to reset the accumulated other comprehensive loss on translation of foreign operations to $nil at the transition date, with the adjustment recorded in opening retained earnings.
Designation of previously recognized financial instruments - We have elected to designate $3,477 million of Canada Mortgage Bonds as available-for-sale securities on the transition date. Available-for-sale securities are measured at fair value with unrealized gains and losses recorded in accumulated other comprehensive income (loss). These bonds were previously designated as held for trading and were measured at fair value with changes in fair value recorded in trading revenues. These bonds provided an economic hedge associated with the sale of the mortgages through a third party securitization program under Canadian GAAP. Under IFRS, this economic hedge is no longer required as these mortgages will remain on our balance sheet.
Insurance Contracts - IFRS 1 provides the option to apply the transitional provisions in IFRS 4, Insurance Contracts, which allow us to follow our existing accounting policies related to our insurance–related activities.
Mandatory Exemptions to Retroactive Application
We have applied the following mandatory exceptions to full retroactive application:
Hedge accounting – Only hedging relationships that satisfied the hedge accounting criteria of IFRS as of the transition date are recorded as hedges in our results under IFRS.
Estimates – Hindsight was not used to create or revise estimates, and accordingly, the estimates previously made by us under Canadian GAAP are consistent with their application under IFRS.
Derecognition of financial assets and financial liabilities – We applied retroactively to transfers that occurred on or after January 1, 2004.
Reconciliation of Consolidated Balance Sheet as Reported Under Canadian GAAP to IFRS
The following is a reconciliation of our Consolidated Balance Sheet recorded in accordance with Canadian GAAP to our Consolidated Balance Sheet recorded in accordance with IFRS as at the transition date of November 1, 2010.
(Canadian $ in millions)
Canadian
GAAP
balances Consolidation(a)
Asset
Securitization(b)
Pension and
other future
Employee
benefits(c)
Non-Controlling
interest(d)
Translation of
Net Foreign
operations(e) Reinsurance(f)
Other
(g)- (s)
Total IFRS
Adjustments IFRS balances
Assets
Cash and cash equivalents 17,368 27 65 - - - - - 92 17,460
Interest bearing deposits with banks 3,186 1,971 - - - - - - 1,971 5,157
Securities 123,399 4,670 (8,387) - - - - (170) (3,887) 119,512
Securities borrowed/purchased under resale agreements 28,102 - - - - - - - - 28,102
Loans 178,521 (1,975) 30,595 - - - - 90 28,710 207,231
Allowance for credit losses (1,878) 56 (138) - - - - (4) (86) (1,964)
Other assets 62,942 (561) (38) (1,048) - - 873 44 (730) 62,212
Total assets 411,640 4,188 22,097 (1,048) - - 873 (40) 26,070 437,710
Liabilities
Deposits 249,251 2,079 (986) - - - - - 1,093 250,344
Other liabilities 135,933 1,801 23,286 171 (1,338) - 873 (6) 24,787 160,720
Subordinated debt 3,776 - - - - - - - - 3,776
Capital trust securities 800 445 - - - - - (58) 387 1,187
Shareholder’s Equity
Share capital 9,498 - - - - - - - - 9,498
Contributed surplus 92 - - - - - - (1) (1) 91
Retained earnings 12,848 (137) 22 (1,219) - (1,135) - (198) (2,667) 10,181
Accumulated other comprehensive income (loss) (558) - (225) - - 1,135 - 60 970 412
Total shareholders’ equity 21,880 (137) (203) (1,219) - - - (139) (1,698) 20,182
Non-controlling interest in subsidiaries - - - - 1,338 - - 163 1,501 1,501
Total equity 21,880 (137) (203) (1,219) 1,338 - - 24 (197) 21,683
Total liabilities and equity 411,640 4,188 22,097 (1,048) - - 873 (40) 26,070 437,710

66 BMO Financial Group First Quarter Report 2012
Reconciliation of Equity as Reported under Canadian GAAP to IFRS
The following is a reconciliation of our equity recorded in accordance with Canadian GAAP to our equity in accordance with IFRS
(Canadian $ in millions)
November 1,
2010
January 31,
2011
April 30,
2011
July 31,
2011
October 31,
2011
As reported under Canadian GAAP 21,880 21,993 22,355 27,009 28,123
Reclassification of non-controlling interest in subsidiaries to equity under IFRS 1,338 1,320 1,320 1,319 1,348
Share Capital - - - 142 142
Contributed Surplus (1) (2) (1) (1) -
Retained Earnings
Consolidation (a) (137) (133) (49) (102) (214)
Asset securitization (b) 22 16 (74) (64) (88)
Pension and other employee future benefits (c) (1,219) (1,201) (1,181) (1,178) (1,158)
Translation of net foreign operations (e) (1,135) (1,135) (1,135) (1,135) (1,135)
Business combinations (o) - - - (58) (62)
Other (198) (183) (204) (209) (237)
Accumulated Other Comprehensive Income (Loss)
Consolidation (a) - 2 (1) - 2
Asset securitization (b) (225) (137) (126) (147) (205)
Translation of net foreign operations (e) 1,135 1,135 1,135 1,135 1,135
Other 60 31 16 18 50
Non-controlling interest in subsidiaries (d) 163 145 160 145 135
As reported under IFRS 21,683 21,851 22,215 26,874 27,836
Reconciliation of Net Income as Reported under Canadian GAAP to IFRS
The following is a reconciliation of our net income reported in accordance with Canadian GAAP to our net income in accordance with IFRS.
(Canadian $ in millions)
January 31,
2011
April 30,
2011
July 31,
2011
October 31,
2011
Year ended
October 31,2011
Net income as reported under Canadian GAAP 776 800 793 897 3,266
Add back: non-controlling interest 18 18 18 19 73
Differences increasing (decreasing) reported net income:
Consolidation (a) (1) 4 84 (53) (112) (77)
Asset securitization (b) (1) (6) (90) 10 (24) (110)
Pension and other employee future benefits (c) 18 20 3 20 61
Business combinations (o) - - (58) (4) (62)
Other 15 (19) (5) (28) (37)
Net Income reported under IFRS 825 813 708 768 3,114
Attributable to:
Bank shareholders 807 795 690 749 3,041
Non-controlling interest in subsidiaries 18 18 18 19 73
(1) Includes decrease (increase) in collective allowance of $(4) million, $(53) million, $11 million, $12 million and $(34) million for the three months ended January 31, 2011, April 30, 2011, July 31, 2011, October
31, 2011 and the year ended October 31, 2011, respectively.
Reconciliation of Comprehensive Income as Reported under Canadian GAAP to IFRS
The following is a reconciliation of our comprehensive income reported in accordance with Canadian GAAP to our comprehensive income in accordance with IFRS:
(Canadian $ in millions)
January 31,
2011
April 30,
2011
July 31,
2011
October 31,
2011
Year ended
October 31,2011
Comprehensive income as reported under Canadian GAAP 461 419 1,109 1,519 3,508
Add back: non-controlling interest 18 18 18 19 73
Differences increasing (decreasing) reported comprehensive income
Consolidation (a) 6 81 (52) (110) (75)
Asset securitization (b) 82 (79) (11) (82) (90)
Pension and other employee future benefits (c) 18 20 3 20 61
Business combinations (o) - - (58) (4) (62)
Other (14) (34) (3) 4 (47)
Comprehensive income as reported under IFRS 571 425 1,006 1,366 3,368
Attributable to:
Bank shareholders 553 407 988 1,347 3,295
Non-controlling interest in subsidiaries 18 18 18 19 73

BMO Financial Group First Quarter Report 2012 67
Changes to the Consolidated Statement of Cash Flows
Under Canadian GAAP, we classified the net changes in loans and securities borrowed or purchased under resale agreements as Cash Flows from Investing Activities and the net changes in deposits and securities lent or sold under repurchase agreements as Cash Flows from Financing Activities on the Consolidated Statement of Cash Flows. Under IFRS, we classify the net changes in loans, deposits, securities lent or sold under repurchase agreements and securities borrowed or purchased under resale agreements as Cash Flows from Operating Activities in accordance with IAS 7 Cash Flow Statements, which requires this classification for the main revenue-producing activities of the bank. Under Canadian GAAP, we classified the net changes in securities sold but not yet purchased as Cash Flows from Financing Activities. Under IFRS, we classify the net changes in securities sold but not yet purchased as Cash Flows from Operating Activities, in accordance with IAS 7 Cash Flow Statements, which requires this classification for instruments used for trading purposes. Under Canadian GAAP, we classified the proceeds from securitization of loans as Cash Flows from Investing Activities. Under IFRS, as the loans sold through securitization programs do not qualify for derecognition, they are classified as Cash Flows from Operating Activities. Explanation of differences:
(a) Consolidation
The IFRS consolidation requirements primarily impact entities defined as variable interest entities (“VIEs”) under Canadian GAAP or special purpose entities (“SPEs”) under IFRS, with which we have entered into arrangements in the normal course. Under Canadian GAAP, the conclusion as to whether an entity should be consolidated is determined by using three different models: voting rights, VIEs and qualifying special purpose entities (“QSPEs”). Under the voting rights model, ownership of the majority of the voting shares leads to consolidation, unless control does not rest with the majority owners. Under the VIE model, VIEs are consolidated if the investments we hold in these entities or the relationships we have with them result in our being exposed to the majority of their expected losses, being able to benefit from the majority of their expected returns, or both. Under the QSPE model, an entity that qualifies as a QSPE is not consolidated. Under IFRS, an entity is consolidated if it is controlled by the reporting company, as determined under the criteria contained in the IFRS consolidated and separate financial statements standard (IAS 27) and, where appropriate, SIC-12 (an interpretation of IAS 27). As with Canadian GAAP, ownership of the majority of the voting shares leads to consolidation, unless control does not rest with the majority owners. For an SPE, our analysis considers whether the activities of the SPE are conducted on our behalf, our exposure to the SPE’s risks and benefits, our decision-making powers over the SPE, and whether these considerations demonstrate that we, in substance, control the SPE and therefore must consolidate it. There is no concept of a QSPE under IFRS. We consolidated certain SPEs under IFRS that were not consolidated under Canadian GAAP, including our credit
protection vehicle, our structured investment vehicles (“SIVs”), our U.S. customer securitization vehicle, BMO Capital Trust II and BMO Subordinated Notes Trust. For five of our eight Canadian customer securitization vehicles and certain structured finance vehicles, the requirements to consolidate were not met under IFRS, a result that is consistent with the accounting treatment for the vehicles under Canadian GAAP. Information on all our SPEs, including total assets and our exposure to loss is included in Note 6. (b) Asset securitization
Securitization primarily involves the sale of loans originated by us to trusts (“securitization vehicles”). Under Canadian GAAP, we account for transfers of loans to our securitization programs and to third party securitization programs as sales when control over the loans is given up and consideration other than notes issued by the securitization vehicle has been received. Under IFRS, financial assets are derecognized only when substantially all risks and rewards have been transferred as determined under the derecognition criteria contained in IAS 39. Control is only considered when substantially all risks and rewards have been neither transferred nor retained. Under IFRS, credit card loans and mortgages sold through these securitization programs do not qualify for derecognition as we have determined that the transfer of these loans and mortgages has not resulted in the transfer of substantially all the risks and rewards. This has resulted in the associated assets and liabilities being recognized on our Consolidated Balance Sheet and gains previously recognized in income under Canadian GAAP being reversed at the transition date. Under IFRS, the credit card loans and mortgages sold through our securitization vehicles and through the Canada Mortgage Bond program and to the National Housing Act Mortgage-Backed Securities program will remain on our Consolidated Balance Sheet. Under Canadian GAAP, the credit card loans and mortgages sold through these programs were removed from our Consolidated Balance Sheet. Under Canadian GAAP, mortgages converted into mortgage-backed securities that have not yet been sold to one of the securitization programs are recorded at fair value as available-for-sale securities, with all mark-to-market adjustments recorded in accumulated other comprehensive income (loss). Under IFRS, these mortgages are classified as loans and recorded at amortized cost; the associated mark-to-market adjustments recorded in accumulated other comprehensive income (loss) under Canadian GAAP are reversed through retained earnings at the transition date. Additional information on our asset securitizations is included in Note 5. (c) Pension and other employee future benefits
Actuarial gains and losses consist of market-related gains and losses on pension fund assets and the impact of changes in discount rates and other assumptions or of plan experience being different from management’s expectations for pension and other employee future benefit obligations. Under Canadian GAAP, these amounts are deferred and only amounts in excess of 10% of the greater of our plan asset or benefit liability balances are recorded in pension and other employee future

68 BMO Financial Group First Quarter Report 2012
benefit expense over the expected remaining service period of active employees. Under IFRS, we elected to recognize all previously unrecognized actuarial gains and losses as at November 1, 2010, in opening retained earnings for all of our employee benefit plans. Under IFRS, we will continue to defer actuarial gains and losses, consistent with the methodology under Canadian GAAP. Plan amendments are changes in our benefit liabilities as a result of changes to provisions of the plans. Under Canadian GAAP, these amounts are recognized in expense over the remaining service period of active employees for pension plans and over the expected average remaining period to full benefit eligibility for other employee future benefit plans. Under IFRS, plan amendments are recognized immediately to the extent that benefits are vested and are otherwise recognized over the average period until benefits are vested on a straight-line basis. Under Canadian GAAP, our actuaries valued our benefit liabilities using the projected unit benefit method. Under IFRS, our actuaries value our benefit liabilities using the projected unit credit method. The difference in methodology did not have a significant impact on our financial results. Under Canadian GAAP, when plan assets exceed the benefit liability of a defined benefit plan giving rise to a plan surplus, a valuation allowance is recognized for any excess of the surplus over the present value of the expected future economic benefit arising from the asset. Similarly to Canadian GAAP, IFRS limits the recognition of the surplus to the expected future economic benefit arising from the asset. However, the methodology for calculating the expected future economic benefit differs from that under Canadian GAAP. The difference in methodology did not have an impact on our financial results. (d) Non-controlling interest
Under Canadian GAAP, non-controlling interest in subsidiaries (“NCI”) are reported as other liabilities. Under IFRS, NCI are reported as equity. Under Canadian GAAP, the portion of income attributable to NCI is deducted prior to the presentation of net income in the Consolidated Statement of Income. Under IFRS, there is no comparable deduction, and instead, net income reflects income attributable to both shareholders and NCI. This difference had no impact on our capital ratios or return on equity. (e) Translation of net foreign operations
We have elected to reset the accumulated other comprehensive loss on translation of net foreign operations to $nil at the transition date, with the adjustment recorded in opening retained earnings. This difference had no impact on our capital ratios or return on equity. (f) Reinsurance
Under Canadian GAAP, reinsurance recoverables related to our life insurance business were offset against the related insurance liabilities. Under IFRS, reinsurance recoverables and insurance liabilities are presented on a gross basis on our Consolidated Balance Sheet.
(g) Loan impairment
Under IFRS, we will continue to write off loans on a basis consistent with the accounting under Canadian GAAP except that for the purpose of measuring the amount to be written off, the determination of the recoverable amount includes an estimate of future recoveries. This difference did not have a material impact on our opening retained earnings. Under Canadian GAAP, we did not accrue interest income on loans classified as impaired. Under IFRS, once a loan is identified as impaired, the accretion of the net present value of the written down amount of the loan due to the passage of time is recognized as interest income using the original effective interest rate of the loan. (h) Sale-leaseback transactions
Under Canadian GAAP, gains or losses from sale-leaseback transactions are deferred and amortized over the lease term, regardless of the type of lease that is entered into. Under IFRS, if the new lease is an operating lease and the sale took place at fair value, the resulting gains or losses from the sale-leaseback transaction are recognized immediately in income. This difference did not have a material impact on opening retained earnings on transition. (i) Stock-based compensation
Under Canadian GAAP, for grants of stock options with graded vesting, such as an award that vests 25% per year over four years, an entity can elect to treat the grant as one single award or to treat each tranche (i.e. the 25% portion that vests each year) as a separate award with a different vesting period. The bank elected to treat these stock option grants as one single award under Canadian GAAP, and the fair value of the award was recognized in expense on a straight-line basis over the vesting period. Under IFRS, each tranche must be treated as a separate award and the fair value of each tranche must be recognized in expense over its respective vesting period. This difference did not have a material impact on our opening retained earnings. (j) Loan origination costs
Under Canadian GAAP, loan origination costs are deferred and amortized over the term of the resulting loan. Under IFRS, only loan origination costs that are directly attributable and incremental to the origination of a loan can be deferred and amortized over the term of the resulting loan. This difference resulted in a $41 million decrease in opening retained earnings on transition. (k) Transaction costs
Under Canadian GAAP, it was the bank’s practice to expense transaction costs on deposit liabilities. Under IFRS, direct and incremental transaction costs on deposit liabilities are deferred and recorded as a reduction of their initial value of the deposit and amortized over the term of the deposit liability. This difference did not have a material impact on our opening retained earnings.

BMO Financial Group First Quarter Report 2012 69
(l) Available-for-sale securities
Under Canadian GAAP, available-for-sale securities are recorded at amortized cost if their sale is restricted. Under IFRS, available-for-sale securities are recorded at fair value even if their sale is restricted. This difference did not have a material impact on our opening retained earnings. (m) Premises and equipment
Canadian GAAP does not require that significant components of premises and equipment be amortized separately. Under IFRS, significant components of premises and equipment are amortized separately. This difference resulted in a $38 million decrease in opening retained earnings on transition. (n) Customer loyalty programs
Under Canadian GAAP, we recorded revenues and expenses related to our reward programs on a net basis. Under IFRS, we are required to record revenues and expenses related to certain of our reward programs on a gross basis. This difference did not have a material impact on our opening retained earnings. (o) Business Combinations
We elected not to apply IFRS 3 retroactively to business combinations that took place prior to the transition date. Consequently, business combinations concluded prior to November 1, 2010, have not been restated and the carrying amount of goodwill under IFRS as of November 1, 2010, is equal to the carrying amount as at that date under Canadian GAAP. For the acquisitions of M&I and LGM that occurred in fiscal 2011, our comparative year, we have made the following adjustments: Measurement of purchase price
Under Canadian GAAP, the purchase price is based on an average of the market price of the shares over a reasonable period before and after the date the terms of the acquisition are agreed to and announced. Under IFRS, the purchase price is based on the market price of the shares at the closing date of the transaction. As a result, the recorded values of goodwill and common shares were increased by $142 million as at October 31, 2011, to reflect the re-measurement of our common shares issued as consideration for the M&I acquisition. Acquisition costs
Under Canadian GAAP, acquisition costs are capitalized and classified as goodwill. IFRS requires that acquisition costs be expensed. As a result, goodwill was reduced by $91 million as of October 31, 2011, $86 million related to the acquisition of M&I and $5 million related to the acquisition of LGM. Contingent Consideration
Under Canadian GAAP, contingent consideration is recorded when the amount can be reasonably estimated and the outcome of the contingency can be determined beyond a reasonable doubt. Any subsequent change in the amount of contingent consideration is generally recorded as an adjustment to goodwill. Under IFRS, contingent consideration is recognised initially at fair value as part of the purchase price. Subsequent changes in the fair value of contingent consideration classified as an asset or liability are recognised in profit or loss. As a
result, goodwill was increased by $13 million for contingent consideration and reduced by $5 million for acquisition costs noted above for a total increase in goodwill of $8 million for the LGM acquisition as at October 31, 2011. (p) Merchant banking investments
Under Canadian GAAP, our merchant banking investments are accounted for at fair value, with changes in fair value recorded in income as they occur. Under IFRS, we elected as of the transition date to designate certain of these investments at fair value through profit or loss. Subsequent changes in fair value are recorded in income as they occur. Merchant banking investments that we have not designated at fair value through profit or loss are accounted for as either available-for-sale securities, investments accounted for using the equity method of accounting, or loans, depending on the characteristics of each investment. This difference resulted in a $33 million decrease in opening retained earnings on transition. (q) Compound financial instruments
Under Canadian GAAP, Capital Trust Securities Series B and C issued through BMO Capital Trust were classified as liabilities. Under IFRS, these Capital Trust Securities are classified as compound instruments comprising both a liability and equity component. The equity component is due to certain payment features in these instruments that do not create an unavoidable obligation to pay cash. This difference did not have a material impact on our opening retained earnings. (r) Translation of preferred shares issued by a foreign operation
Under Canadian GAAP, preferred shares held by non-controlling interests in a self-sustaining foreign operation are translated at the current rate of exchange. IFRS requires that equity instruments of foreign operations be translated at the historical rate. This difference did not have a material impact on opening retained earnings on transition. (s) Income taxes
Under Canadian GAAP, the tax charge or credit on items recorded in other comprehensive income or equity is also recorded in other comprehensive income or equity, respectively, if recognized in the same period. Subsequent changes in tax rates and laws and the assessment of the recoverability of deferred tax for items previously recorded in other comprehensive income or in equity are recorded in profit or loss. Under IFRS, income tax relating to items recorded in other comprehensive income or equity is recorded in other comprehensive income or equity, respectively, whether the income tax is recorded in the same or different period. Additional Annual Disclosures under IFRS
As these interim consolidated financial statements are our first financial statements prepared under IFRS, the following IFRS annual disclosures, have been included in these financial statements for the comparative annual period. They were provided in our 2011 annual financial statements but prepared on a Canadian GAAP basis. Certain information and footnote disclosures were omitted or condensed where such information

70 BMO Financial Group First Quarter Report 2012
is not considered material to the understanding of our interim financial information. Employee Compensation – Pension and Other Employee Future
Benefits
We have a number of arrangements in Canada, the United States and the United Kingdom that provide pension and other employee future benefits to our retired and current employees. Pension arrangements include defined benefit statutory pension plans, as well as supplemental arrangements that provide pension benefits in excess of statutory limits. Generally, under these plans we provide retirement benefits based on an employee’s years of service and average annual earnings over a period of time prior to retirement. We are responsible for ensuring that the statutory pension plans have sufficient assets to pay the pension benefits upon retirement of employees. Some groups of employees are eligible to make voluntary contributions in order to receive enhanced benefits.
Our pension and other employee future benefit expenses, recorded in employee compensation expense, mainly comprises the current service cost plus the unwinding of the discount rate on plan liabilities less the expected return on plan assets. We also provide defined contribution pension plans to employees in some of our subsidiaries. Under these plans, we are responsible for contributing a predetermined amount to a participant’s retirement savings, based on a percentage of that employee’s salary. The costs of these plans, recorded in employee compensation expense, are equal to the bank’s contributions to the plans. We also provide other employee future benefits, including health and dental care benefits and life insurance, for current and retired employees. Short-term employee benefits, such as salaries, paid absences, bonuses and other benefits are accounted for on an accrual basis over the period in which the employees provide the related services.
Changes in the estimated financial positions of our pension benefit plans and other employee future benefit plans in fiscal 2011 were as follows:
(Canadian $ in millions, except as noted) Pension benefit plans Other employee future benefit plans
2011 2011
Benefit Liability
Benefit liability at beginning of year 4,839 975
Opening adjustment for acquisitions 17 -
Benefits earned by employees 163 21
Interest cost on benefit liability 253 53
Benefits paid to pensioners and employees (243) (30)
Voluntary employee contributions 9 -
(Gain) loss on the benefit liability arising from changes in assumptions 73 (66)
Plan settlement 1 -
Plan amendments 25 -
Other, primarily foreign exchange (13) (1)
Benefit liability at end of year 5,124 952
Wholly or partially funded benefit liability 5,066 102
Unfunded benefit liability 58 850
Total benefit liability 5,124 952
Weighted-average assumptions used to determine the benefit liability
Discount rate at end of year 5.1% 5.6%
Rate of compensation increase 3.3% 3.2%
Assumed overall health care cost trend rate na 5.5% (1)
Fair value of plan assets
Fair value of plan assets at beginning of year 5,185 67
Actual return on plan assets 236 6
Employer contributions 171 30
Voluntary employee contributions 9 -
Benefits paid to pensioners and employees (239) (30)
Settlement payments (3) -
Other, primarily foreign exchange (21) (1)
Fair value of plan assets at end of year 5,338 72
Plan funded status 214 (880)
Unrecognized actuarial (gain) loss 160 (68)
Unrecognized benefit of plan amendments - (7)
Net benefit asset (liability) at end of year 374 (955)
Recorded in:
Other assets 411 -
Other liabilities (37) (955)
Net benefit asset (liability) at end of year 374 (955)
(1)Trending to 4.5% in 2030 and remaining at that level thereafter.
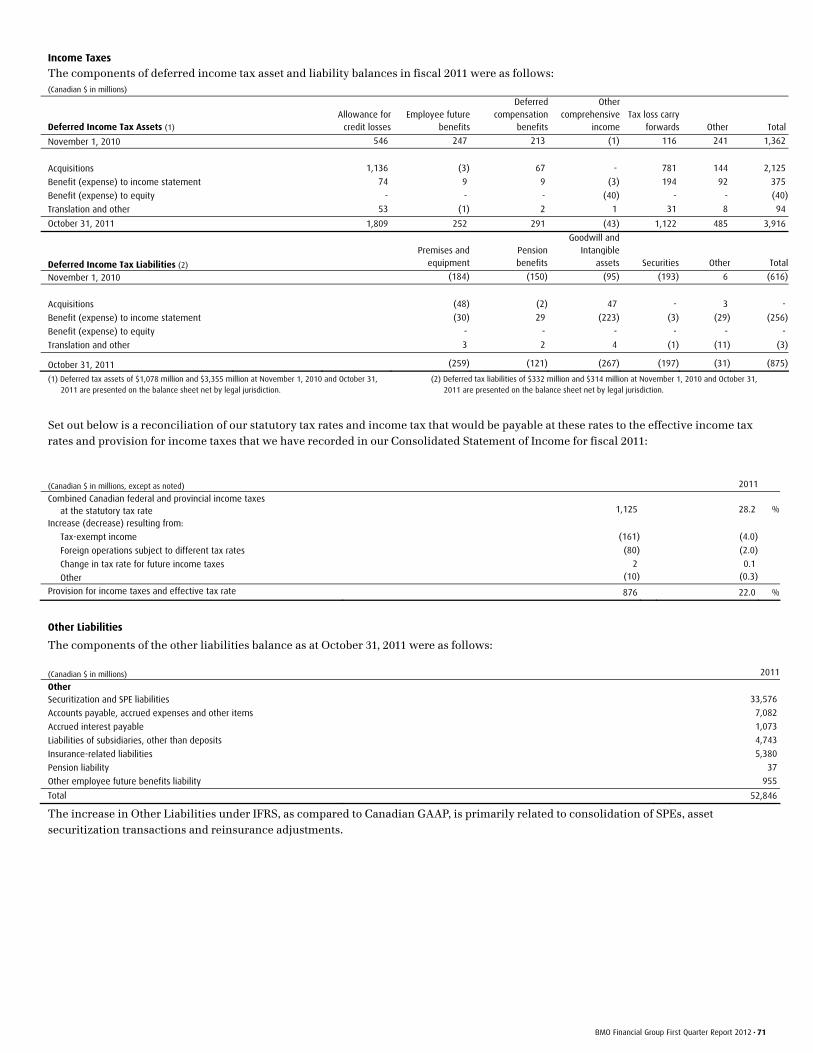
BMO Financial Group First Quarter Report 2012 71
Income Taxes
The components of deferred income tax asset and liability balances in fiscal 2011 were as follows: (Canadian $ in millions)
Deferred Income Tax Assets (1) Allowance for
credit lossesEmployee future
benefits
Deferred compensation
benefits
Other comprehensive
income Tax loss carry
forwards Other Total
November 1, 2010 546 247 213 (1) 116 241 1,362
Acquisitions 1,136 (3) 67 - 781 144 2,125
Benefit (expense) to income statement 74 9 9 (3) 194 92 375
Benefit (expense) to equity - - - (40) - - (40)
Translation and other 53 (1) 2 1 31 8 94
October 31, 2011 1,809 252 291 (43) 1,122 485 3,916
Deferred Income Tax Liabilities (2)
Premises and
equipmentPension benefits
Goodwill and Intangible
assets Securities Other Total
November 1, 2010 (184) (150) (95) (193) 6 (616)
Acquisitions (48) (2) 47 - 3 -
Benefit (expense) to income statement (30) 29 (223) (3) (29) (256)
Benefit (expense) to equity - - - - - -
Translation and other 3 2 4 (1) (11) (3)
October 31, 2011
(259) (121) (267) (197) (31) (875)
(1) Deferred tax assets of $1,078 million and $3,355 million at November 1, 2010 and October 31,
2011 are presented on the balance sheet net by legal jurisdiction.
(2) Deferred tax liabilities of $332 million and $314 million at November 1, 2010 and October 31,
2011 are presented on the balance sheet net by legal jurisdiction.
Set out below is a reconciliation of our statutory tax rates and income tax that would be payable at these rates to the effective income tax rates and provision for income taxes that we have recorded in our Consolidated Statement of Income for fiscal 2011:
(Canadian $ in millions, except as noted)
2011
Combined Canadian federal and provincial income taxes at the statutory tax rate 1,125 28.2 %
Increase (decrease) resulting from:
Tax-exempt income (161) (4.0)
Foreign operations subject to different tax rates (80) (2.0)
Change in tax rate for future income taxes 2 0.1
Other (10) (0.3)
Provision for income taxes and effective tax rate 876 22.0 %
Other Liabilities
The components of the other liabilities balance as at October 31, 2011 were as follows:
(Canadian $ in millions)
2011
Other
Securitization and SPE liabilities 33,576
Accounts payable, accrued expenses and other items 7,082
Accrued interest payable 1,073
Liabilities of subsidiaries, other than deposits 4,743
Insurance-related liabilities 5,380
Pension liability 37
Other employee future benefits liability 955
Total 52,846
The increase in Other Liabilities under IFRS, as compared to Canadian GAAP, is primarily related to consolidation of SPEs, asset securitization transactions and reinsurance adjustments.

INVESTOR AND MEDIA PRESENTATION
Investor Presentation Materials
Interested parties are invited to visit our website at www.bmo.com/investorrelations to review our 2011 annual report, this quarterly news release, presentation materials and a supplementary financial information package online.
Quarterly Conference Call and Webcast Presentations
Interested parties are also invited to listen to our quarterly conference call on Tuesday, February 28, 2012, at 2:00 p.m. (EST). At that time, senior BMO executives will comment on results for the quarter and respond to questions from the investor community. The call may be accessed by telephone at 416-695-9753 (from within Toronto) or 1-888-789-0089 (toll-free outside Toronto). A replay of the conference call can be accessed until Tuesday, May 22, 2012, by calling 905-694-9451 (from within Toronto) or 1-800-408-3053 (toll-free outside Toronto) and entering passcode 6850310. A live webcast of the call can be accessed on our website at www.bmo.com/investorrelations. A replay can be accessed on the site until Tuesday, May 22, 2012.
Media Relations Contacts
Ralph Marranca, Toronto, [email protected], 416-867-3996 Ronald Monet, Montreal, [email protected], 514-877-1873
Investor Relations Contacts
Viki Lazaris, Senior Vice-President, [email protected], 416-867-6656 Michael Chase, Director, [email protected], 416-867-5452 Andrew Chin, Senior Manager, [email protected], 416-867-7019
Chief Financial Officer
Tom Flynn, Executive Vice-President and CFO, [email protected], 416-867-4689
Corporate Secretary
Barbara Muir, Senior Vice-President, Deputy General Counsel, Corporate Affairs and Corporate Secretary [email protected], 416-867-6423
Shareholder Dividend Reinvestment and Share Purchase Plan
Average market price November 2011 $56.22 December 2011 $55.28 January 2012 $59.70
For dividend information, change in shareholder address
or to advise of duplicate mailings, please contact
Computershare Trust Company of Canada 100 University Avenue, 9th Floor Toronto, Ontario M5J 2Y1 Telephone: 1-800-340-5021 (Canada and the United States) Telephone: (514) 982-7800 (international) Fax: 1-888-453-0330 (Canada and the United States) Fax: (416) 263-9394 (international) E-mail: [email protected]
For other shareholder information, please contact
Bank of Montreal Shareholder Services Corporate Secretary’s Department One First Canadian Place, 21st Floor Toronto, Ontario M5X 1A1 Telephone: (416) 867-6785 Fax: (416) 867-6793 E-mail: [email protected]
For further information on this report, please contact
Bank of Montreal Investor Relations Department P.O. Box 1, One First Canadian Place, 18th Floor Toronto, Ontario M5X 1A1
To review financial results online, please visit our website at
www.bmo.com
® Registered trademark of Bank of Montreal Annual Meeting 2012
The next Annual Meeting of Shareholders will be held on
Tuesday, March 20, 2012, in Halifax, Nova Scotia.