Embed Size (px)
Citation preview

1
First Results of Coherent Uplink from a Phased Array of Widely Separated Antennas:
Steps Toward Real-Time Atmospheric Phase Fluctuation Correction
for a High Resolution Radar System
Dr. Barry Geldzahler
NASA Headquarters, Washington DC
Rick Birr, Robert Brown, Kevin Grant, Richard Hoblitzell,
Michael Miller, Gary Woods NASA Kennedy Space Center, Cape Canaveral, Florida
Arby Archuleta, Michael Ciminera, Timothy Cornish, Dr. Larry D’Addario,
Dr. Faramaz Davarian, Dr. Jonathan Kocz, Dennis Lee, David Morabito, Melissa Soriano,
Philip Tsao, Dr. Vic Vilnrotter
Jet Propulsion Laboratory, Pasadena CA
Hali Jakeman-Flores, Melanie N. Ott, Dr. W. Joe Thomes
NASA Goddard Space Flight Center, Greenbelt MD
Jason Soloff
NASA Johnson Space Flight Center, Houston TX
Dr. Grant Denn
Metropolitan State University of Denver, Denver CO
ABSTRACT
NASA is pursuing a demonstration of coherent uplink arraying at 7.145-7.190 GHz (X-band) and 30-31 GHz (Ka-
band) using three 12m diameter COTS antennas separated by 60m at the Kennedy Space Center in Florida. In
addition, we have used up to three 34m antennas separated by ~250m at the Goldstone Deep Space Communication
Complex in California and at X-band 7.1 GHz incorporating real-time correction for tropospheric phase
fluctuations. Such a demonstration would then enable NASA to design and establish a high power, high resolution,
24/7 availability radar system for (a) tracking and characterizing observations of Near Earth Objects (NEOs), (b)
tracking, characterizing and determining the statistics of small-scale (≤10cm) orbital debris, (c) incorporating the
capability into its space communication and navigation tracking stations for emergency spacecraft commanding in
the Ka band era which NASA is entering, and (d) fielding capabilities of interest to other US government agencies.
We present herein the results of our phased array uplink combining at near 7.17 and 8.3 GHz using widely separated
antennas demonstrations at both locales, the results of a study to upgrade from a communication to a radar system,
and our vision for going forward.
1. INTRODUCTION
NASA has embarked on a path to implement a high power, higher resolution radar system to better track and
characterize NEO’s and orbital debris. We are advancing an X/Ka band system (KaBOOM: Ka Band Objects
Observation and Monitoring) to supplement the S-band radar at Arecibo, Puerto Rico and the X-band radar at
NASA’s Goldstone tracking complex in California. The three facilities would complement each other in that
different wavelengths have different resolutions and penetration depths. An X/Ka band radar system also has
applications for cost effective space domain awareness. This work describes our path toward demonstrating Ka
band coherent uplink arraying with real-time atmospheric compensation using three 12m diameter antennas at the
Kennedy Space Center (KSC). Coherent uplink arraying has been successfully demonstrated by two NASA groups:

2
at X band and at Ku band, without atmospheric compensation, and by sending commands to and receiving telemetry
from GEO and deep space satellites. Deep space in NASA terms means a distance greater than 2 million kilometers.
KaBOOM is a Ka band coherent uplink arraying proof of concept demonstration being undertaken to allow
decisions to be made for implementing a National Radar Facility [large scale array(s)]:
High power, high resolution radar system
Space Situational Awareness
24/7 availability for NEO and orbital debris tracking and characterization
Map out radar stealth zones on Mars- help define “no drive” zones for future rovers to avoid the Spirit problem
Beam sailing propulsion capability
2. THE ADVANTAGES OF SITE DIVERSE, MULTI-FREQUENCY RADAR
OBSERVATIONS OF NEAR EARTH OBJECTS
NASA has several major uses for uplink arraying: (1) planetary defense- tracking and characterization (size, shape,
spin, porosity, surface features, non-gravitational forces, presence of moons, etc.) of NEOs, (2) improved
detection/tracking of small (≤1-10cm) orbital debris particles, (3) rapidly available high power emergency uplink
capability for spacecraft emergencies, and (4) radio science experiments (tomography of planetary atmospheres,
general relativity tests, mass determinations, occultations, surface scattering, etc.).
The NASA Authorization Act of 2008 directs NASA to catalog 90% of NEOs > 140m in size. The Goldstone radar
on the 70m antenna is typically available only 2-3% of the time due to spacecraft tracking obligations. It is further
limited by the high power density of the beam since the transmitter is 450 kW which requires consultation and
compliance with some 31 federal, state, local, and military authorities for permission to trigger the radar. It can take
up to a month to obtain the necessary permission. In times of spacecraft emergencies, the time can be cut back to a
few days, but it would be better if the radar system was available on demand as needed.
Tracking of orbital debris particles less than 10 cm in size is difficult. Where high resolution is possible, the antenna
beam is too small for accurate long term tracking; short term detection of individual particles is possible and the
statistics of small particles are obtained, however. In those facilities where particle tracking is possible, the
resolution is lacking.
Having a site and frequency diverse radar system is an advantage over today’s Goldstone Solar System Radar. If
NASA has both Goldstone and the KaBOOM site radars available, we can obtain longer tracks leading to improved
NEO orbit determination. In addition, longer tracks will also allow for more precise data to determine the tumbling
parameters which in turn lead to better models of the moments of inertia of the NEO. Since the KaBOOM site will
operate at Ka band, we shall obtain higher range resolution than at Goldstone [5-10 cm vs. 400 cm] and, hence,
produce sharper images of the NEO surface structures. By adding in Arecibo radar data at S-band (2 GHz), we
could have a three frequency radar system, and since each frequency has a different penetration depth, NASA will
obtain a greater knowledge of the NEO porosity parameters. All of these aspects are important for designing a
multistatic radar system- essentially a very long baseline interferometry (VLBI) system- and carrying out crewed
missions to NEOs whether they are asteroids or comets, etc.

3
Fig 1. Relative sizes of asteroid Itokawa and the International Space Station. Note the boulders on the asteroid. For
robotic and crewed missions to asteroids, NASA will need to know the surface structure - such as the boulders in the
box - so as to ensure the safety of the landing spacecraft and its inhabitants.
An interesting capability that uplink arraying offers an opportunity to get high EIRP (effective isotropic radiated
power) from relatively lower power transmitters because the uplink power, for identical transmitters and antennas, is
proportional to N2, where N is the number of antennas in the array. The power is proportional to the number of
transmitters (N) times the number of antennas (N); hence, N2. Fig. 2 demonstrates this effect for data taken of the
planet Venus with two of the 34m antennas at Goldstone. Fig. 2a shows the radar image for a single 34m antenna.
Fig. 2b shows the radar image, with a 6 dB gain (factor of 4) when the power from two 34m dishes are coherently
combined.
Fig 2. Doppler-delay images of Venus, taken on 2010 DOY-297, Goldstone Solar System Radar processing: a)
single 34m antenna illumination; b) 2-34m antenna phased-array illumination, showing greatly improved image
quality.
Fig. 2 also demonstrates why an array is more reliable than a single dish system. For these observations, we
were supposed to use three 34m antennas at Goldstone. However, the day of the observing run, one of the 34m
antennas had an anomaly. Even without that one dish, we saw an increase of 4 in the power which allowed us
to still be successful albeit with reduced signal/noise (Vilnrotter et al. 2011). If we had used only a single dish
radar system and had that antenna not been available, we would have been totally unsuccessful.
3. ADVANTAGES OF A MULTIPURPOSE FACILITY EMPLOYING UPLINK ARRAYING
TECHNIQUES
An array is a more reliable resource than a single dish. If the 70m is down for any reason, so too is the radar
facility. The same is true for the high power klystron tubes used for the radar. At the time of this writing, there
are no spare tubes to ensure that a 450 kW radar capability at Goldstone. In addition, the 70m antenna that
houses the NASA solar system radar was down for seven months under going depot level maintenance. During
that time NASA had NO ground radar capability whatsoever. However, with an array, if any given antenna is
range
Doppler
range
Doppler
a
(b) (a)
4
taken out for maintenance or is in an anomalous condition, little performance is lost. For example, losing a
single antenna out of 25 would be a loss of only 2% of the array downlink capability and only 1% of the uplink
capability. Hence, reliability of the array is more resistant and robust to operational “down time” or element
failures.
Virtually 24/7 availability. Whereas radar observations on the DSN 70m antenna comprise < 3% of the
available antenna time, on a NEO-focused array, some 25-30 times more antenna time could be available and
thus 25-30 times the number of sources can be observed in a given year. This will dramatically help NASA
reach the goal of tracking and characterizing 90% of NEOs ≥140m by 2020.
Spectrum management is not an issue with the array. Since the high power, coherently combined beam forms
~200 km above the earth, the FAA EIRP limit will not be violated since the transmission from each individual
antenna is below the limit thereby obviating the need for a time-consuming coordination among a large number
of Agencies.
The range resolution of a radar system is determined by the spectral bandwidth available. At X-band, the
International Telecommunications Union has allocation 150 MHz. The Goldstone Solar System Radar uses on
40 MHz of that allocation leading to a range resolution of 375 cm. At Ka band, however, the primary allocation
is 2.6 GHz, and with the secondary allocation, a total of 4 GHz bandwidth is available leading to a range
resolution of 3.75 cm: two orders of magnitude improvement! In addition, we are exploring means of obtaining
1 cm range resolutions- without going to the highly weather dependent W-band (90 GHz).
The angular resolution of the proposed array in a bistatic or multistatic mode with elements in the western US
and in Australia operating at Ka band (33-37 GHz) and used in a radio astrometric mode (measuring to 1/100 of
the beam) has an angular resolution of 0.015 milliarcsec; the equivalent of 5 cm at GEO.
Scalability. If still higher resolution or greater sensitivity is desired, additional antenna elements can be added.
At roughly $1.5M per antenna element, increased capability can be added quickly and at a low cost.
Extensibility to Ka band. This would be unique to NASA and, in a single-dish equivalent, provide 16 times the
angular resolution of the 70m radar system as well as significantly improved range and range-rate measurement.
Radio science experiments are usually conducted by transmitting signals from the spacecraft past/through
the target of interest to the ground. However, spacecraft transmitters, ~20W, limit the signal to noise ratio
and hence the science results. Using a high power uplink from the ground to the target to the spacecraft and
then downlinking the data via telemetry (as in the case of New Horizons) can increase the S/N by ≥ 1000.
Science using traditional “downlink” measurement techniques will also be improved due to the higher
sensitivity of the array.
5. ATMOSPHERIC FLUCTUATION PHASE ERROR CORRECTION:
a. METHODOLOGY
5.a.1. Principal Error Contributors
There are three major contributors to phase instabilities in a phased array of widely separated antennas. The error
sources are independent of each other and can be addressed individually.
1. Accommodation of circuitry, transmission line, and antenna shape variation
2. Differential beam steer phase due to dish to target line-of-sight geometrical variation (“predicts” in DSN parlance)
3. Mitigation of propagation phase variation due to tropospheric effects
5.a.2. Mitigation of Principal Error Contributors 1. Continual Open-Loop Carrier Phase Control using Tx signal itself
Complex Envelope realization mitigates need for high precision time delay
2. Continual Adaptive Combining of antennas
Initial estimate of Antenna Reference Points (ARP) can be refined using interferometric techniques
3. Transmit using phase estimates from a received signal
Expected to compensate for phase fluctuations due to the atmosphere

5
5.b. RF ADAPTIVE OPTICS (COOPERATIVE TARGETS)
In Fig. 3, we show the method employed on 34m antennas to detect, measure, and compensate for circuit phase
errors in the ground system employed by NASA at the Jet Propulsion Lab.
Fig. 3. Continuous open-loop phase control at NASA Goldstone Signal Processing Center (SPC) 10 using the
transmitted signal itself. This approach mitigates phase errors due to: Transmission Lines, Circuitry, and
Antenna Deformation
Since not all elements are directed in the same direction of the sky, the path lengths to each antenna in the array
differ from one another. Hence, we expect that the tropospheric contributions to phase shifts also differ for each
array element. The tropospheric contribution to phase errors can be significant and are certainly unpredictable as
evidenced by water vapor radiometer measurements. However, there is no apparent linkage between meteorological
data and the observed phase fluctuations. Thus, ground-level measurements are not accurate indicators of what is
occurring higher in the atmosphere. Developing an all-encompassing, universal model to predict the phase stability
of a particular site would be extremely difficult. Furthermore, if the longest baseline of the array is even a few
kilometers in extent, different weather conditions above individual array elements would make precise modeling of
atmospheric phase fluctuations of the array as a whole an extraordinary challenge. Evidence for this is shown in Fig
4 for the Australia Telescope Compact Array in Narrabri, NSW. Whereas the gains of the inner five closely spaced
(50-300 m) antennas relative to an array reference point are similar and track each other as a function of elevation,
the gain for the more distant antenna 3 km distant falls off much more rapidly and dramatically.

6
Fig. 4. Measured gain as a function of elevation for the Australia Telescope Compact Array antennas at 31.9 GHz.
Note that antenna 6 is 3 km distant from antennas 1-5.
A simpler solution is to develop a real-time atmospheric compensation methodology at radio frequencies just as the
optical astronomers have done by using a sodium laser to get an artificial “star” in the telescope field of view
simultaneously with the object of interest. The method developed for the open loop uplink arraying demo, the RF
analog of the well-known adaptive optics methodology, has been used to mitigate in real-time the varying
atmospheric fluctuations. The scheme handles the general case where each dish-to-target path may be looking
through different columns of atmosphere due to the wide spacing of the elements.
Real time propagation variations were mitigated by using a signal from a source of known angular position- within
the primary antenna beam- received through the varying atmosphere; assumed to be flat on average. Since the open
loop receive circuit is operational, variations in the received steering vector from the flat atmosphere measured the
magnitude of the tropospheric phase contribution in the direction of the received signal. Since the antenna beam
width is small, the tropospheric variation toward the Tx target was essentially the same as to the receive target. Since
the effect due to atmospheric variation, mainly due to water vapor and turbulence, is one of frequency independent
time delay, the total differential delay obtained from the measured received variation was applied to calculations of
the steering vector for the transmit direction. Any known astrometric source may be used for this purpose, such as
another satellite, quasar or supernova remnant. For Ka band, the planets are excellent calibration and reference
sources.
5.c. MEASURED RESULTS OF REAL TIME OPEN LOOP DEMONSTRATIONS
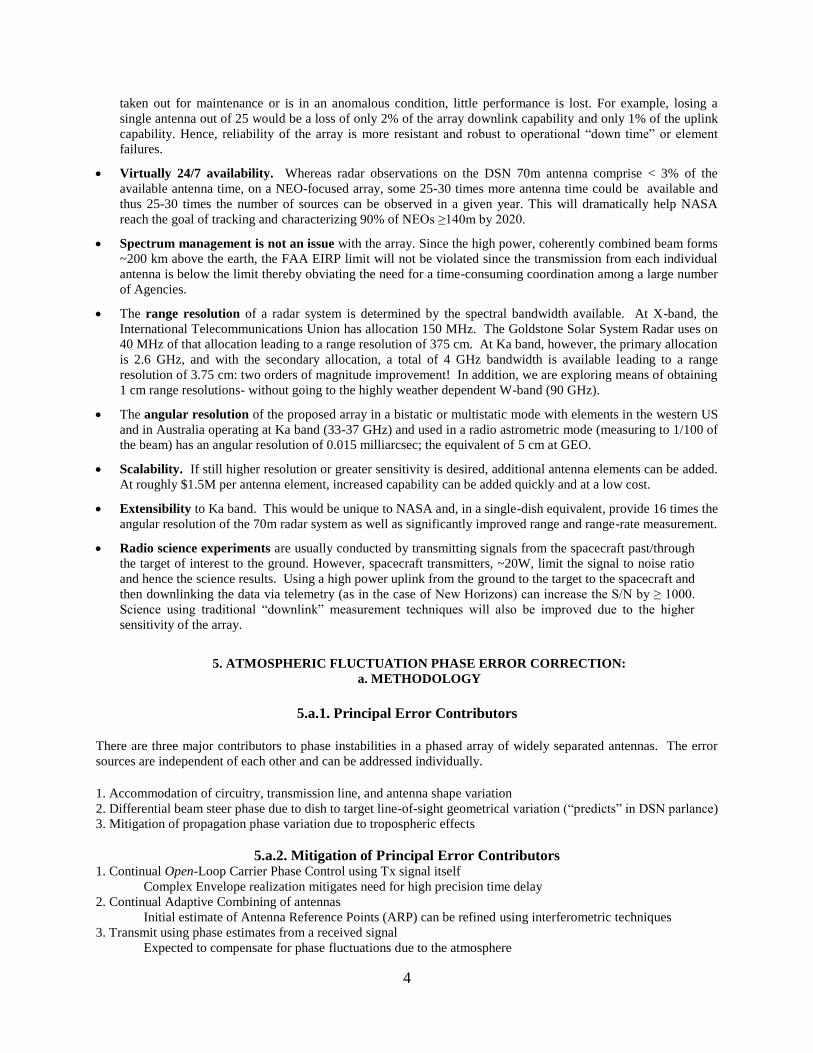
Since the proof resides in measured data, first we show the results of the expected EIRP gain from a coherently
phased uplink array. In Figure 5, we show the successful demonstration of the N2 effect both for a spacecraft in
cruise trajectory (EPOXI; see also V. Vilnrotter et al. 2010). In Figure 6, we show a similar result for a spacecraft
orbiting another planet (Mars Odyssey). The latter demonstration represents the first successful coherent uplink
arraying to another planet and offers a technique for getting increased power to a spacecraft in case of emergency
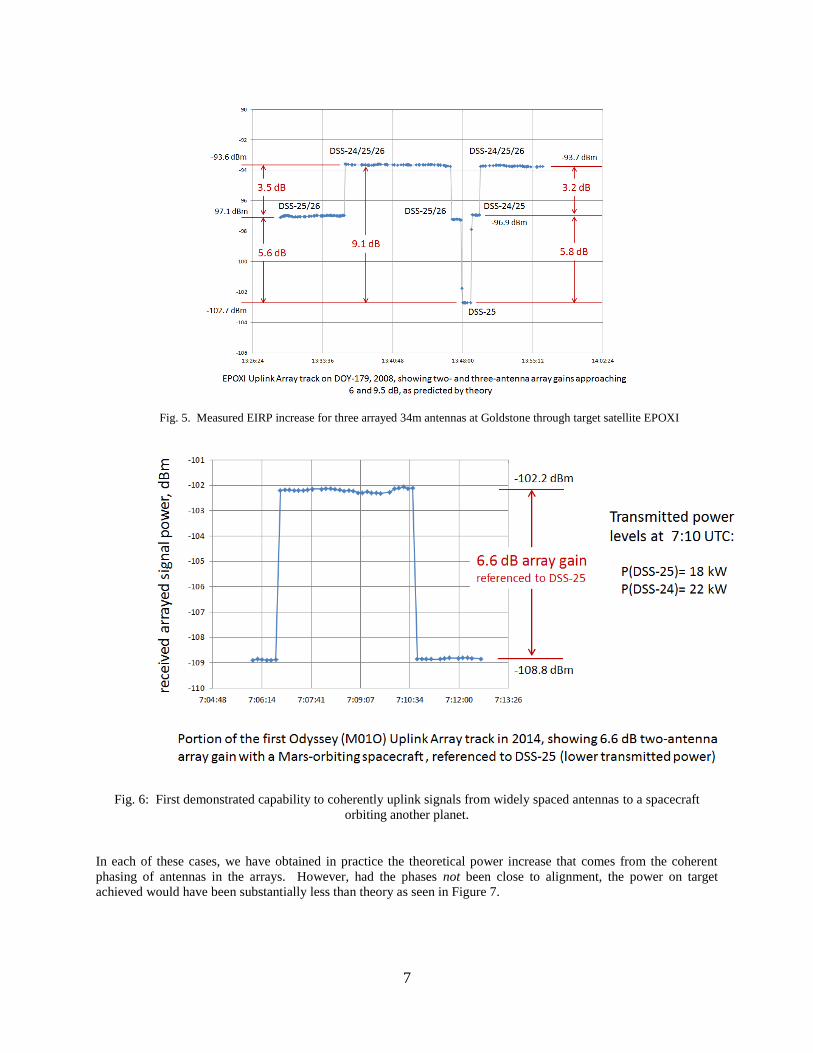
operations. Next, in Figure 7, we show why correcting for atmospheric phase fluctuations in real-time is crucial for
maximizing the power on target. Finally, in Figure 8, we show the successful results of real-time compensation
of atmospheric phase fluctuations during the uplink arraying to the Mars Reconnaissance Orbiter.
We have declared VG-Day (Victory at Goldstone Day) with respect to uplink arraying techniques and have turned
over the processes and algorithms to NASA’s Deep Space Network operations personnel for implementation as an
operational capability.
7
Fig. 5. Measured EIRP increase for three arrayed 34m antennas at Goldstone through target satellite EPOXI
Fig. 6: First demonstrated capability to coherently uplink signals from widely spaced antennas to a spacecraft
orbiting another planet.
In each of these cases, we have obtained in practice the theoretical power increase that comes from the coherent
phasing of antennas in the arrays. However, had the phases not been close to alignment, the power on target
achieved would have been substantially less than theory as seen in Figure 7.
8
Fig.7. Array gain vs. Phasing Error for a two antenna system
Fig. 8: First demonstrated capability of coherently combined uplink signals to the Mars Reconnaissance Orbiter
from two 34m antennas separated by ~ 250m and correcting for atmospheric phase fluctuations in real time at
NASA’s Goldstone tracking complex
In Figure 8, the peak-to-peak maximum variation of the relative phases between the two antennas is 92 degrees. The
fact that the 6 dB gain was observed in the coherently phased signal indicates that the atmosphere was relatively
stable over the observing period. The standard deviation of the phase fluctuation over the observing interval was
17.2 degrees, and thus, from Figure 7, we were able to attain the near theoretical 6 dB power increase. So, while, in
desert location such as Goldstone and in a calm atmosphere, real-time phase fluctuation corrections were not
necessary during these 8 GHz demonstrations, we have developed the algorithm, technique, and capability such that
47.62 deg
-44.41 deg
92.03 deg
47.62 deg
-44.41 deg
47.62 deg

9
when a system at 32-37 GHz is deployed- perhaps in a less friendly environment- the capability will be available to
maximize the power on a target such as an asteroid or orbital debris.
Going beyond X-band for NASA involves Ka band tracking capabilities. Recall, the range resolution achievable at
Ka band is some 2 orders of magnitude finer than possible today using NASA’s Goldstone Solar System Radar
system. The capabilities for uplink arraying at Ka band do not exist at and of NASA’s tracking complexes, so we
have stood up a capability demonstration and maturation system using 12m antennas at KSC. Although the previous
demonstration of coherent uplink arraying at Ku band under taken in southern California was successful and gives
us encouragement that such techniques will be successful at Ka band, we have no data to bear out that hypothesis.
Furthermore, we have not yet shown how to make uplink arraying at Ka band reliable in an operational sense
because we have not previously had the resources to undertake that aspect.
5.d. NON-COOPERATIVE TARGETS
The algorithms and techniques for tracking and putting power on a non-cooperative target (i.e.- those with no
beacon or telemetry stream) are currently being developed. The goal is to demonstrate this capability by the end of
calendar year 2015.
6. NEXT STEP: KaBOOM: Ka BAND OBJECTS: OBSERVATION AND
MONITORING
Fig. 9: Overhead shot of the KaBOOM site at the Kennedy Space Center. It is comprised of three 12m diameter
antennas. The operations center is seen just to the right of center. Spacing between the antennas is 60m.
Fig 10. Current array configuration of three 12m reflector antennas at the Kennedy Space Center
The three-antenna element interferometer system at KSC has re-validated previously obtained X-band data but now
using COTS equipment rather than the vastly more costly DSN antennas, and establish the overall system baseline
performance incorporating lessons learned from an initial implementation.
18
47.62 deg
-44.41 deg
92.03 deg

10
Fig 11 X-band demonstration of the N2 power increase at the KaBOOM site at the Kennedy Space Center
Thereafter, we intend to demonstrate coherent uplink arraying with real-time atmospheric fluctuation correction at
Ka band; 30-31 GHz. All of these demonstrations involve the interferometer system in a space communications
mode.
7. KaBOOM to KARNAC
Following the successful demonstration of real-time atmospheric phase fluctuation correction at Ka band, we shall
convert the space communication system at KSC to a Ka band (34-36 GHz) radar system to demonstrate a high
power, high resolution radar system (KARNAC: Ka band Array Radar for NEO Accurate Characterization). Our
initial goal is 10 cm range resolution. If we can obtain Ka band transmitters with a bandwidth of 33-37 GHz, we
may be able to attain a 5 cm range resolution. In addition, we are beginning to envision a technique to drive the
range resolution to 1 cm! These are theoretical resolutions, and systematic errors etc. may increase these resolutions
slightly.
Once KARNAC has successfully demonstrated its target performance and passing of NASA and our partners’
funding decision gates, we envision the construction of a larger, multi-element array to increase capability. The
Table below shows the potential advantages. It is evident that even with a modest number of antennas (15), there is
the possibility of a 100% increase in maximum imaging distance over the current 70m capability and the ability to
track objects over a volume more than 8.6 times larger than is current possible. Even a modest system of antennas
can provide a substantially greater uplink power than is current available at Ka band. However, this assumes
coherent uplink arraying at Ka-band can be successfully accomplished. After the successful demonstration of the
initial capability, we shall explore its limitations; i.e. - where does Ka band uplink arraying break down or become
ineffective. These data will provide critical data for designing an operational Ka band uplink arraying system. To
date, none of the coherent uplink arraying demonstrations using widely separated antennas has failed! This is
because time and funding constraints has not allowed any of the teams to test to failure. We plan to rectify this
deficiency with KaBOOM. The beauty of an array system is that antennas and transmitters can be deployed as
requirements and desirements evolve and as funding becomes available. The totally funding need not be allocated at
once.
The advantages of operations at Ka band are enormous:
For radar applications, an increased spectral bandwidth allocation of 4 GHz (vs. 40 MHz at X-band- Goldstone
radar) thereby leading to a dramatic increase in spatial and range resolutions (5 cm vs. 400 cm) as well as more
power on target (Table I). This is enabled by the newly developed 30 kW Ka band klystrons having a bandwidth
of 4 GHz [33-37 GHz].

11
For NEO, Space Situational Awareness, and orbital debris cases, the increased power afforded by uplink
arraying radars can help to better characterize objects and can track and characterize objects farther out than
current radars (Table I).
For geolocation applications, measurement of atmospheric fluctuations coupled with other sensor data has the
potential to increase the accuracy and precision of ground-based target location.
For space communication purposes, the wider spectrum allocation (10x wider than at X-band) will allow for
more data to be sent at a given time and complements NASA’s on-going optical communications efforts.
For radio science, the 100-1000x increase in possible uplink power will allow for more precise determination of
planetary properties.
Table I. Comparison of Current and Proposed Systems
# Antennas Power (TW) Maximum
Distance (AU)
70m; X-band; 460 kW 1 11 0.1
12m; Ka-band; 100
kW; 50% efficiency
1 0.9 0.01
15 215 0.15
25 600 0.26
50 2410 0.37
100 8650 0.53
The target satellite chosen for the Phase 1 Ka band demonstration, WGS 3, has an elevation as seen from KSC of
only 10 degrees- meaning an air mass 5.6X greater than that toward the zenith. This constraint of increased
attenuation and scintillation coupled with the non-ideal Ka band weather provides a highly challenging environment.
Since this is a demonstration for NASA as well as for other partners who may deploy larger systems using these
techniques in non-Ka band-pristine locations, we have deliberately chosen a difficult challenge.
8. APPLICABILITY TO NASA HUMAN SPACEFLIGHT AND SCIENCE ENDEAVORS
Part of the “flexible path” NASA is embarking on calls for exploration- robotic and crewed- to asteroids. Before a
crew is sent to an asteroid, it is most likely, based on past exploration NASA practices that a robotic precursor will
be sent to investigate. However, which asteroid will be chosen? If the “wrong” asteroid is chosen, we shall have
lost or wasted a decade of time and funding. Hence it is incumbent upon us to select the best target.
It is well known that radar is an ideal technique to characterize (size, shape, spin, porosity) near earth objects and
precisely determine their orbits (up to 5 orders of magnitude more precise than optical determinations). Radar
measurements can prevent potential mission targets from being “lost.” Many NEO’s are lost shortly after discovery
using optical techniques. However, radar observations can anchor the orbit of an object for decades or in some cases
centuries. Furthermore, higher powers and thus farther distances can be achieved with an arrayed system thereby (a)
expanding the search volume for NEO’s (a factor of ~150 for an array of 100 antennas), and (b) through
characterization, narrow the potential target list thereby reducing the risk of sending a robotic precursor mission to
the “wrong” asteroid.
Large arrays with high power transmitters on each antenna could lead to an NEO Early Warning System. In Fig. 11,
we show the current capability, and what is possible with a large array: extending the area of tracking from 0.1 AU
(1 Astronomical Unit is the average Earth-Sun distance, ~ 150M km).
Current State
of the Art

12
Fig 12: Possibility for a NEO Early Warning System
9. APPLICABILITY TO ORBITAL DEBRIS AND SPACE DOMAIN AWARENESS (SDA)
The National Space Policy states the following regarding Orbital Debris remediation (ODR): “For the purpose of
minimizing debris and preserving the space environment for the responsible, peaceful, and safe use of all users, the
United States Shall:
“Pursue research and development of technologies and techniques, through the Administrator of the National
Aeronautics and Space Administration (NASA) and the Secretary of Defense, to mitigate and remove on-orbit
debris, reduce hazards, and increase understanding of the current and future debris environment.”
NASA’s recognition of the importance of ODR technology coupled with limited resources provides the basis for
guidance on ODR investments and activities. In summary:
NASA related funded and unfunded work should extend only to technology development, not operational
systems. NASA has no plans to establish an operational role in ODR.
NASA will focus efforts in ODR technology development on Technology Readiness Level (TRL) 1-4
concepts.
Current investments and activities should demonstrate nonduplicative cross-cutting relevance to the
technology roadmap areas prioritized in the Agency’s Strategic Space Technology Investment Plan.
As time goes on, orbital debris has become and will continue to become an ever increasing source of risk to rocket
launches, to the International Space Station, and to government and commercial space assets. Tracking of orbital
debris on cm (or even mm) size scales and larger has become concomitantly more imperative. (Limiting Future
Collision Risk to Spacecraft: An Assessment of NASA’s meteoroid and Orbital Debris Programs,” National
Research Council report: The National Academies Press at http://www.nap.edu/catalog.php?record_id=13244).
Here again, Goldstone has made a contribution- the statistics of the numbers of small particles. The Goldstone 70m
antenna can detect individual small particles, but the beam size is far too small to track these particles. The proposed
array, with broad primary beam antennas, has the advantage. This type of system can complement and supplement
0.5 AU capability for
tracking and characterizing
NEO’s
Current capability for tracking and
characterizing NEO’s 0.1 AU

13
the activities of the Space Fence. However, although NASA’s Goldstone antenna can detect individual small (< 1
cm) particles, they are not tracked because the particles move through the very narrow antenna beam (2.2 arcmin)
too quickly. Furthermore, that antenna is so busy tracking NASA spacecraft, that little time, perhaps only 100
hours/year, are available for such observations.
Fig. 13. Goldstone Orbital Debris Radar Apparent Diameters detected in FY2009. Each cross represents an
individual particle. The blank part of the diagram near the bottom and toward the right is an
artifact of a sensitivity selection effect.
For SDA, the recent GAO report: “SPACE ACQUISITIONS: Development and Oversight Challenges in Delivering
Improved Space Situational Awareness Capabilities” (GAO-11-545 May 2011:
http://www.gao.gov/new.items/d11545.pdf) summed up the current status: “The United States’ growing
dependence on space systems for its security and well-being—such as for missile warning; intelligence,
surveillance, and reconnaissance; communications; scientific research; weather and climate monitoring; and
positioning, navigation, and timing—makes these systems vulnerable to a range of intentional and unintentional
threats. These threats range from adversary attacks such as anti-satellite weapons, signal jamming, and cyber attacks,
to environmental threats such as harsh temperatures, radiation, and collisions with debris and other man-made or
natural objects, which have been increasing rapidly over the past several years.”
Detailed simulations of the capabilities of a phased array radar system indicates that current gaps in the following
areas of SDA knowledge can be addressed
Detect/Track/Identify: Uncued detection, Unexpected maneuvers
- Discriminate between closely spaced objects
Characterization: Orbital Debris, Satellite break-ups, collisions
Threat Warning and Assessment: Conjunction assessment, Re-entry prediction

14
A Ka band system using coherent uplink arraying techniques and bistatic and multistatic radars can meet and
probably exceed the goals or, at the very least, compliment a 90 GHz system. Specifically, at Ka-band range
resolution of 5 cm and a spatial resolution (using a US-Australia baseline) of ~ 5 cm can be achieved.
The first demonstration of using coherent uplink arraying in a radar mode has been undertaken at the Jet
Propulsion Lab (Vilnrotter and Tsao) using two 34m beam wave guide antennas at X-band. Precise calibration
of Array Radar antenna phase required, and the phase calibration can be accomplished via the “Moon-Bounce”
method. In addition, closed-loop phase control is required to maintain phase calibration since temperature
variations and equipment instabilities degrade coherence. The proposed array radar approach provides
simultaneous projection of OD velocity vectors onto three independent baselines, thus enabling trajectory
determination from a single Array Radar observation!
In brief, three 34m BWG antennas with 20 kW transmitters at 7.18 GHz are available. The array spans ~ 500
meters with antenna null-to-null beamwidths ~ 170 mdegs and spacings: DSS-24 – DSS-25 baseline ~ 23 mdegs
and DSS-24 – DSS-26 baseline ~ 15 mdegs. For a single antenna: EIRP of 34m antenna, 20 kW transmitter; two
antenna array: peak EIRP of 34m antenna, 80 kW transmitter; three antenna array: peak EIRP of 34m antenna,
180 kW transmitter. CAVEAT: Simultaneous multi-frequency/multi-baseline operation remains to be shown.
This would enable processing of simultaneous echoes from different baselines.
The results of our initial phased array radar tests with the Goldstone 34m antennas were presented in Figure 12
of Geldzahler et al. (2014).
10. APPLICABILITY TO MAPPING OUT “NO DRIVE” ZONES ON MARS
A radar stealth region 2000 x ~ 300 km was discovered on Mars (Muhleman et al. 1993). It was dubbed a stealth
region because there were virtually no radar reflections from the area. The best postulate for the stealth property
is that the soil has a density of 0.5 gm/cc thus inhibiting reflections. It is believed that the Mars rover Spirit got
stuck in such a “sandy” constituency- away from the stealth region (McCuistion, private communication 2012).
If we could map the entire planet and the locations of such regions- e.g., “no drive” zones, we might save or
increase the useful lifetimes of multibillion dollar assets.
Once we have established that Ka band uplink arraying is possible, the next step is to establish a large array with
high power Ka band transmitters. Using arrays with radio astronomy resolution techniques on a US-Australia
baseline at Ka band would provide a ground resolution of 50 km which is useless for attaining our goal. Using radio
astrometry techniques where we can measure to 1/100 of a beam or better, we might expect to get resolutions of 0.5
km. Interesting, but the fundamental limitation is the diameter of the Earth. With ~100 kW transmitters on a
feasible number of antennas, we can use the radar array in a SAR mode and let baseline be determined by the
motion of the planets. Preliminary calculations show that at Mars’ closest approach to Earth, about 5.46 * 107 km, a
ground resolution of 10 m can be obtained in one hour of observation! (analysis by Bert Tise, Sandia National
Laboratory; see Geldzahler et al 2014).

15
Fig 14: Estimate synthesized beam azimuth resolution
The problem of 1/r4 losses from radar observations still exists, though. If, however, NASA puts an orbiter around
Mars with Ka band receive capability, a high power signal from Earth could reflect off the planet and be captured on
the spacecraft thereby changing a 1/r4 diminution to merely a 1/r2 effect while not requiring a high power Ka band
transmitter on the orbiter.
As a proof of concept, NASA is proceeding with a two-year exploratory project called MOONSHINE. Using
NASA’s Space Communication and Navigation Test Bed aboard the International Space Station which is comprised
of three software designed radios, we shall demonstrate bistatic Synthetic Aperture Radar imaging. We shall use a
DSN asset (most likely a 34m antenna) as an S-band transmitter sending a signal to the moon (our target). The
reflected signal will be captured on the moving ISS. The long-term objective is high-resolution radar imaging of
orbital debris and targets by placing a small satellite near the geosynchronous orbit.
Fig. 15. Pictorial Representation of NASA’s MOONSHINE Project
We are actively exploring accomplishing the Mars no drive zone mapping by designing a Ka-band radar slice in the
newly developed Universal Space Transponder to capture Ka band radar data which is at a different frequency than
the Ka communication frequencies.
11. APPLICATION TO BEAM SAILING
0 100 200 300 400 500 600 700 800
0
10
20
30
40
50
60
Azimuth beamsize at Mars
earth day
Azi
muth
bea
msiz
e in
m f
or
on
e h
our
of
ob
serv
ati
on
Diana2 – Moonshine
Earth
Moon
JPL Radio onSCaN Testbed
DSN
(S-Band)

16
Here, a microwave beam will strike a solar sail delivering electromagnetic pressure. This is a natural extension of
solar sailing in that the microwave beam assists the sun (Benford and Benford 2003). A qualitative study of how
much mass could be delivered to Mars at closest approach was undertaken in 2004, and provided intriguing results
(Benford and Benford 2004). NASA is exploring a proof of concept demonstration as a prelude to a large scale,
high power uplink array as one of the tools in the human space exploration tool kit.
We have tentatively identified several cubesat missions that will employ solar sails as targets of opportunity to test
the beam sailing ideas. In particular, the demonstration will be carried out in a manner similar to on-off photometric
astronomical measurements. The cubesat with sail deployed will cruise under solar radiation pressure. At an
appropriate time, the coherent microwave beam from several antennas will be aimed at the cubesat, the acceleration
measured, and then beam will be turned off. Repeating this sequence should provide the evidence we seek. Note
that we are not at this time looking for an ablative inner portion of the sail as Benford and Benford (2003) describe.
Additionally, there are two dependencies to undertake a successful demonstration: (1) we must first demonstrate
“uplink very long baseline interferometry” (see Fig. 15) since initially we shall employ existing assets at NASA’s
Goldstone tracking stations. The N2 effect of the 70m antenna plus three or four 34m antennas should provide the
power required, and (2) we shall need an inertial measurement unit with sufficient sensitivity and resolving power to
measure the anticipated small push from the combined microwave beams.
We are exploring means of using the radar upgrade to KaBOOM, aka KARNAC, for a beam powered sailing
demonstration with cubesats.
12. RECOVERY OF NON-COMMUNICATING SATELLITES
NASA’s STEREO BEHIND was lost on October 1, 2014. All contingency operations so far have been
unsuccessful. We don’t know the orientation of the spacecraft; we don’t know the spin state/rate of the spacecraft;
and we don’t know whether or not the battery is fully discharged. Our plan is to phase up the three 34m antennas at
NASA’s Goldstone tracking station in the Mohave dessert to try and jam a set of emergency commands in through a
backlobe or a side lobe. Two of the three 34m BWGs at Goldstone have 20 kW transmitters while the third has a
new 80 kW transmitter. When coherently phased, the combined power is 16 times that of a single 34m antenna and
four times that of the 70m antenna which also has a 20 kW transmitter. We plan the attempt later in 2015 and/or
early 2016.
13. GOING FORWARD PLANS
As of this writing, only KaBOOM is funded. The near term steps for the effort at Kennedy Space Center are
demonstrations of:
1. X-band- communication mode:
a. Real-time atmospheric phase fluctuation compensation (cooperative target)
b. Self-calibrating, stand-alone system
c. Real-time atmospheric phase fluctuation compensation (non-cooperative target)
d. BPSK and QPSK phased transmission
e. Low power radar: Kennedy Space Center to Goldstone
f. Determination of where the coherent phasing breaks down
2. Ka-band- communication mode:
a. Demonstration of the N2 effect
b. Real-time atmospheric phase fluctuation compensation (cooperative target)
c. Self-calibrating, stand-alone system
d. Real-time atmospheric phase fluctuation compensation (non-cooperative target)
e. BPSK and QPSK phased transmission
f. Low power radar: Kennedy Space Center KaBOOM site to KSC receive antenna some 3 miles away
from KaBOOM
g. Determination of where the coherent phasing breaks down
3. Transmogrify KaBOOM space communication system to the KARNAC high power radar system

17
We are making detailed cost estimates for replacing the communication mode system in KaBOOM with a purely Ka
band radar system. The transformation from KaBOOM to KARNAC - Plan A- has been jump started by our
obtaining three surplus Ka band TWTs (34-36 GHz spectral response, each 30 kW peak power).
KARNAC has the potential to transmit half the power (225 kW) as the Goldstone radar system (450 kW) albeit with
a range resolution of 10 cm as opposed to the 400 cm at Goldstone.
Fig. 16. Maturation and Capability Demonstration Roadmap

18
Fig. 17. Evolutionary Approach to a Radar Array
14. CONCLUSIONS
We have the funding in place for a demonstration of uplink arraying at Ka band with real-time compensation for
atmospheric fluctuations. We shall start at X-band in a space communications mode (Summer 2015), next repeating
the demonstration but at Ka band (30-31 GHz), and finally demonstrate Ka band radar capabilities (Summer 2016).
Our colleagues at MIT/LL are completing a study to estimate the hardware required and cost to transform our space
communication system to a high power radar Ka band system. In addition, our colleagues at the Applied Physics
Laboratory, who previously completed a study for us on the capabilities of a large monostatic Ka band radar system,
are completing of a multistatic radar system capabilities. When a myriad of folks said “You’ll NEVER be able to
send commands to a space craft via a coherently phased uplink array,” the teams just went ahead and successfully
overcame all the challenges. The teams have never been phased by having to follow the phases through all the
phases of the demonstration, thereby accomplishing what NASA does so well: Doing the “impossible” every day.
14. ACKNOWLEDGEMENTS
It is a pleasure to thank Pete Aragona, Jason Crusan, Lindley Johnson, Richard McGinnis, Bill Marinelli, and Chris
Moore for their guidance and encouragement regarding the demos, MIT/LL personnel both at the lab in Lexington
MA and at Kwajalein, Marshall Islands for their guidance on the Ka band upgrade to KARNAC and their patience
with the lead author- a simple radio astronomer, and Les Johnson at NASA’s Marshall Space Flight Center for beam
sailing discussions. The authors also are appreciative of NASA management at Headquarters at the Division,
Directorate, and Agency levels for allowing these demonstrations to be undertaken and for the use of the facilities.
REFERENCES

19
Benford, G. and Benford, J. The Planetary Report, January/February, 2003.
Benford, G. and Benford, J. private communication, 2004.
Geldzahler, B., “Coherent Uplink Arraying Techniques for Next Generation Space Communications and Planetary
Radar Systems,” SPIE Defense, Security + Sensing, 2011.
Geldzahler, B., “Coherent Uplink Arraying: A Self-Calibrating, Nearly Stand-Alone System,” Military Sensing
Symposium/Broad Area Maritime Surveillance, 2011.
Geldzahler, B. et al. 2014, “Field Demonstration of Coherent Uplink from a Phased Array of Widely Separated
Antennas: Steps Toward A Verifiable Real-Time Atmospheric Phase Fluctuation Correction for a High Resolution
Radar System” AMOS Conference.
McCuistion, private communication 2012.
Muhleman et al. Science , 253, 1508, 1993.
Vilnrotter, V., Lee, D., Cornish, T., Tsao, P., PaaI, L. and Jamnejad, V. IEEE A&E SYSTEMS MAGAZINE, MAY
2010
Vilnrotter, V., Tsao, P., Lee, D., Cornish, T., Jao, J., Slade, M., Proceedings of the IEEE Aerospace Conference, Big
Sky, Montana, March 2011