Embed Size (px)
Citation preview
FISCAL ENVIRONMENT
1

State Tax Capacity & EffortIndexed to U.S. Average
Source: State Higher Education Executive Officers (SHEEO)
AL
AK
AZ
AR
CACO
CT
DE
GA HI
IL
IN IAKS
KYLA
ME
MD
MA
MS
MT
NE
NV
NJ
NY
NC
ND
OH
OK
PA
RI
SC
SD
UT
VT
VA
WA
FL
ID
MI
MN
MO
NH
NM
TNTX
WV
WI
WY
0.6
0.7
0.8
0.9
1.0
1.1
1.2
1.3
1.4
1.5
1.6
1.7
0.6 0.8 1.0 1.2 1.4
Sta
te T
ax C
apacity
(Tota
l Taxable
Reso
urce
s Per C
apita
)
State Tax Effort (Effective Tax Rate)
US
OR
slide 2

Projected State and Local Budget Surplus (Gap) as a Percent of Revenues, 2016
slide 3Source: NCHEMS; Don Boyd (Rockefeller Institute of Government), 2009
-2-2
.1-2
.1-2
.2-2
.3-2
.5-2
.5-2
.9-3
.2-3
.4-3
.6-3
.8-3
.9-4
.4-4
.6-4
.7-4
.8-4
.9 -5-5
.3-5
.5-5
.6-5
.6-6 -6
-6.1
-6.3
-6.5
-6.7
-6.9
-7.2
-7.3
-7.3
-7.4
-7.5
-7.6
-8 -8-8
.1-8
.4-8
.4-8
.6-8
.6-8
.7-9
-9.2
-9.4
-9.6
-10.
6-1
0.8
-11
-12
-10
-8
-6
-4
-2
0
Verm
ont
Mar
ylan
dM
aine
New
Jers
eyCo
nnec
ticut
Rhod
e Is
land
New
Ham
pshi
reW
isco
nsin
Mas
sach
usett
sM
ichi
gan
Calif
orni
aN
orth
Dak
ota
Ohi
oD
elaw
are
Kans
asO
rego
nVi
rgin
iaN
ew Y
ork
Min
neso
taPe
nnsy
lvan
iaW
est V
irgi
nia
Neb
rask
aIll
inoi
sU
nite
d St
ates
Mon
tana
Indi
ana
Haw
aii
Loui
sian
aM
isso
uri
Okl
ahom
aA
lask
aKe
ntuc
kyW
yom
ing
Iow
aN
ew M
exic
oSo
uth
Dak
ota
Was
hing
ton
Flor
ida
Sout
h Ca
rolin
aA
rkan
sas
Geo
rgia
Colo
rado
Tenn
esse
eN
orth
Car
olin
aId
aho
Uta
hA
rizo
naN
evad
aA
laba
ma
Mis
siss
ippi
Texa
s

After stimulus wanes, gaps could approximate 4% of spending, or $70 billion, even under the “Low-Gap”
Scenario
Source: Don Boyd (Rockefeller Institute of Government), 2009slide 4

After stimulus wanes, gaps could approach 7% of spending or $120 billion under the “High-Gap”
scenario
Source: Don Boyd (Rockefeller Institute of Government), 2009slide 5

FINANCE: ALIGNMENT WITH STRATEGIC PLANNING6

May 10, 2001
7
The Management Cycle in a Public University System
System
Planning
Institution
System
Assessment
Institution
System
Resource Allocation
Institution

The Flow of Funds - State
8
Federal Government
Tax Policy
Appropriations/GrantsStudent Aid
Tuition
Scholarships &Waivers
Available State and Local
Govt. Funds
Higher Education
Students Institutions
Economy
• K-12• Corrections• Health Care• Other Govt.
Stimulus
Funds

FINANCE POLICY
9

The Two Purposes of State Funding Policy
• Build Core Capacity—General Purpose Funding
• Promote Capacity Utilization Around State Priorities—Special Purpose Funding

Criteria for Effective Higher Education Finance Policy
• Create and Maintain Necessary Institutional Capacity
• Reinforce Utilization of Capacity to Achieve State Goals
• Contributions Required Are Affordable—To Both State and Students
• Viewed as Being Fair
• Transparent

Finance Policy—The Options
Institution Focused
Student Focused
Core Capacity
Capacity Utilization/Public Agenda
Tuition and Aid PolicyFocused on
Attainment ofSpecified Outcomes
Base-Plus
Formulas
Investment Funds
Performance
Funding
Tuition and Aid Policy
Focused on
Revenue Generation

Basic Questions at State Level
• How Much to Allocate
• To Which Recipients—Students or Institutions
• Using Which Mechanisms

A Key Distinction
• Investment Funds
– Capacity Building
– A Priori
• Incentive Funds
– Capacity Utilization
– Post Facto

Remember—All Funding Mechanisms
Provide Incentives for Behavior
Central Question:
Are the Behaviors Elicited
the Ones You Want?

Components of a Higher Education Funding Model (the Institutional Piece)
• Base Institutional Funding
– The Largest Portion, by far
– The Current Mississippi Funding Formula Fits in this Category
• Special Purpose Funds—Resources Set Aside Explicitly to Provide Incentives for Certain Outcomes

One Set of Trade-Offs
Unit Total Total RevenuesQuantity Characteristics Utilization Cost Cost $ Rev. $ Sources
AssetsPersonnelFacilitiesEquipmentCollectionsStudentsFinancesProgram
ConsumablesServicesSuppliesUtilities
Contingency
New Initiatives
=
TuitionAppropriationsGovt. GrantsPrivate GiftsEndowmentSales & ServicesOtherReserves

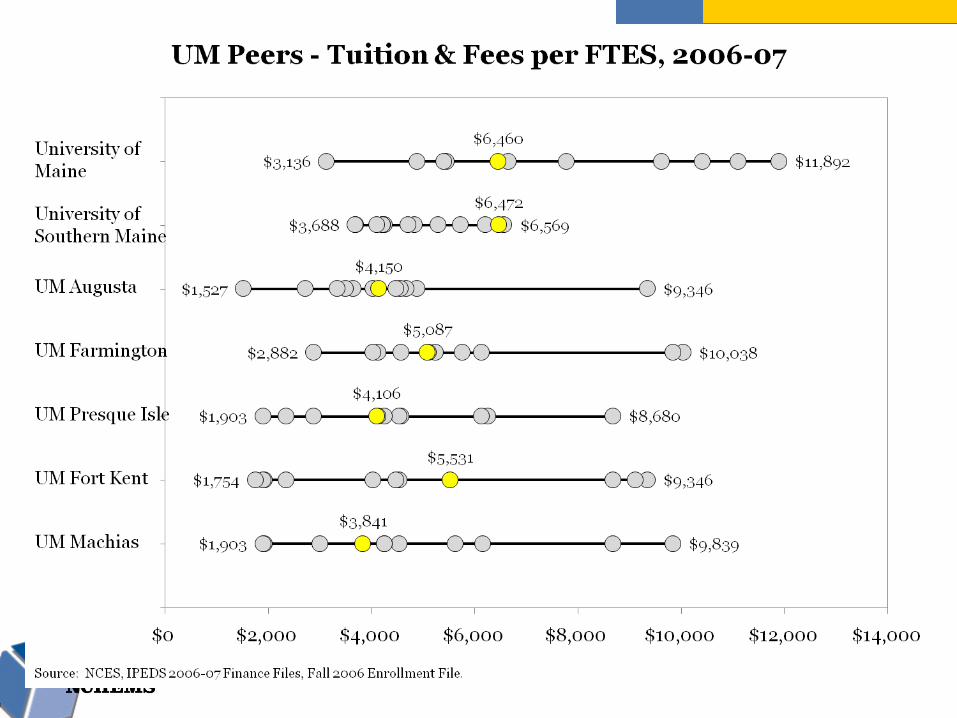
Illustrations of Peer Comparisons from University of Maine System
18