Embed Size (px)
Citation preview
1200 Firs t Street, NE | Washington, DC 20002 | T 202.442.5885 | F 202.442.5026 | dcps .dc .gov
FISCAL YEAR 2016 (FY16)
District of Columbia Public Schools School Budget Overview
Dis tr ic t of Columbia Public Schools | A pr il 2015 Page 2 of 23
FISCAL YEAR 2016 DCPS SCHOOL BUDGET OVERVIEW
Table of Contents Chancellor’s Introduction ............................................................................................................................................................. 3
Introduction From The Chancellor............................................................................................................................................3 How Has DCPS Prioritized Budgeting Since Fiscal Year 2014 (FY14)?.....................................................................4
Investing In Schools ........................................................................................................................................................................ 4 Elementary Schools......................................................................................................................................................................... 4 Middle Grades................................................................................................................................................................................... 5 High Schools...................................................................................................................................................................................... 6
At-risk Funding in FY16 .................................................................................................................................................................6 What Is At-risk?................................................................................................................................................................................ 7 How Is At-risk Funding Allocated In FY16?.............................................................................................................................. 8
Enrollment ............................................................................................................................................................................................. 9 How Is Enrollment Trending? .....................................................................................................................................................9
Enrollment By Ward ....................................................................................................................................................................... 9 Historic Enrollment Growth .......................................................................................................................................................10 Enrollment By School Configuration ........................................................................................................................................11 School-level Enrollment Growth ...............................................................................................................................................12
FY16 DCPS Budget Components ............................................................................................................................................. 13 Agency Budget Components ..................................................................................................................................................... 13
How Is DCPS Funded? ..................................................................................................................................................................13 School Budget Components ....................................................................................................................................................... 13
How Are Schools Funded?...........................................................................................................................................................13 Our Goals For FY16 .......................................................................................................................................................................14
FY16 School Budget Data............................................................................................................................................................ 15 Ward .................................................................................................................................................................................................... 15
Enrollment & Funding By Ward ................................................................................................................................................15 Content Area & Related Arts Teachers By Ward...................................................................................................................15 Special Education & ELL Teachers By Ward ..........................................................................................................................15 At-risk Funding By Ward.............................................................................................................................................................16 Related Arts Supply & Technology Investments By Ward .................................................................................................17
School Type....................................................................................................................................................................................... 18 Enrollment & Funding By School Type....................................................................................................................................18 Content Area & Related Arts Teachers By Ward...................................................................................................................18
Budgeted Positions........................................................................................................................................................................ 19 All Teachers.....................................................................................................................................................................................19 Neighborhood High School Teachers .......................................................................................................................................20 Special Education ..........................................................................................................................................................................21 Social-Emotional Supports ..........................................................................................................................................................21 School-wide Instructional Support ...........................................................................................................................................22 Early Childhood Education (ECE) .............................................................................................................................................22 Administrative & Custodial .........................................................................................................................................................22
School Budget Resources............................................................................................................................................................ 23 DCPS Interactive Data Center ................................................................................................................................................... 23
www.DCPSDataCenter.com ........................................................................................................................................................23 DCPS Website – Budget & Finance ......................................................................................................................................... 23
www.DCPS.dc.gov .........................................................................................................................................................................23 DCPS School Budget Development Guide............................................................................................................................ 23
www.DCPSSchoolBudgetGuide.com ........................................................................................................................................23
Dis tr ic t of Columbia Public Schools | A pr il 2015 Page 3 of 23
FISCAL YEAR 2016 DCPS SCHOOL BUDGET OVERVIEW
Chancellor’s Introduction
Introduction From The Chancellor Dear District of Columbia Public Schools Community:
I am excited to share detail about our submitted budget for the upcoming Fiscal Year 2016 with you. I remain grateful to
the students, parents and community members who took the time to provide suggestions and feedback. Many of our final
proposals, including expanded elective offerings in every high school and our 500-for-500 literacy mentorship program,
were a direct result of your feedback.
Budget development kicked off in November 2014 with public meetings where we shared our three priorities for the
coming year: making a new, significant investment in neighborhood high schools; ensuring equity in curriculum and
instruction for every school; and establishing the Empowering Males of Color initiative. Over the following months, we
gathered community input, met directly with principals to identify their needs and challenges, tapped into expertise
throughout DCPS schools and central offices, and spoke with parents and students about how these priorities should take
shape. We heard wide consensus that these were the right priorities, and were presented with great ideas about how to
implement them.
We are thankful that Mayor Bowser kept education a budget priority and maintained per student funding at equal levels
even during a tight fiscal climate. With over 1,500 new students expected and four new schools opening next year, DC
Public Schools is strongly positioned to continue its momentum forward. The budget that DCPS submitted protects recent
investments in elementary and middle schools, while still allowing us to create new ambitious new plans for high schools
and educational equity. The results will be exciting to watch. Thank you for your continued support.
Sincerely,
Kaya Henderson
Chancellor
Dis tr ic t of Columbia Public Schools | A pr il 2015 Page 4 of 23
FISCAL YEAR 2016 DCPS SCHOOL BUDGET OVERVIEW
How Has DCPS Prioritized Budgeting Since Fiscal Year 2014 (FY14)? Investing In Schools
Over the past three fiscal years, DCPS raised its direct school funding from $525M to over $585M - an increase
of $60M. Much of this new funding is available as a result of more families choosing to enroll in DCPS
(enrollment has increased by more than 3,000 students since School Year 2012-2013.) Even with an enrollment
gain of nearly 6% over the past three years, the school
district will still spend more per student in FY16 as
compared to FY14. As part of the five-year A Capital
Commitment strategic plan, DCPS has reworked the
budget allocation formula for the three primary school types (elementary, middle, and high) over the past three
fiscal years—ultimately steering more money and resources to each, and sustaining that initial investment over
time. Since FY14, every school in DCPS has experienced at least one budget increase.
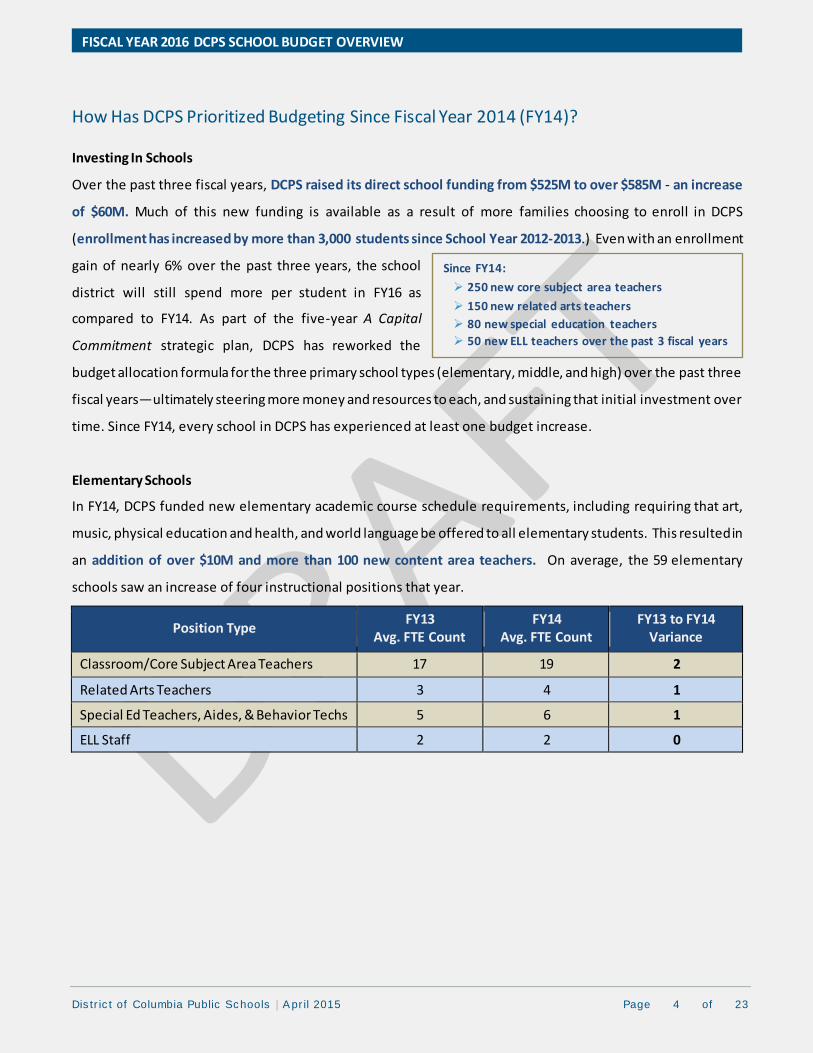
Elementary Schools
In FY14, DCPS funded new elementary academic course schedule requirements, including requiring that art,
music, physical education and health, and world language be offered to all elementary students. This resulted in
an addition of over $10M and more than 100 new content area teachers. On average, the 59 elementary
schools saw an increase of four instructional positions that year.
Position Type FY13
Avg. FTE Count
FY14 Avg. FTE Count
FY13 to FY14 Variance
Classroom/Core Subject Area Teachers 17 19 2
Related Arts Teachers 3 4 1
Special Ed Teachers, Aides, & Behavior Techs 5 6 1
ELL Staff 2 2 0
Since FY14:
250 new core subject area teachers
150 new related arts teachers
80 new special education teachers
50 new ELL teachers over the past 3 fiscal years
Dis tr ic t of Columbia Public Schools | A pr il 2015 Page 5 of 23
FISCAL YEAR 2016 DCPS SCHOOL BUDGET OVERVIEW
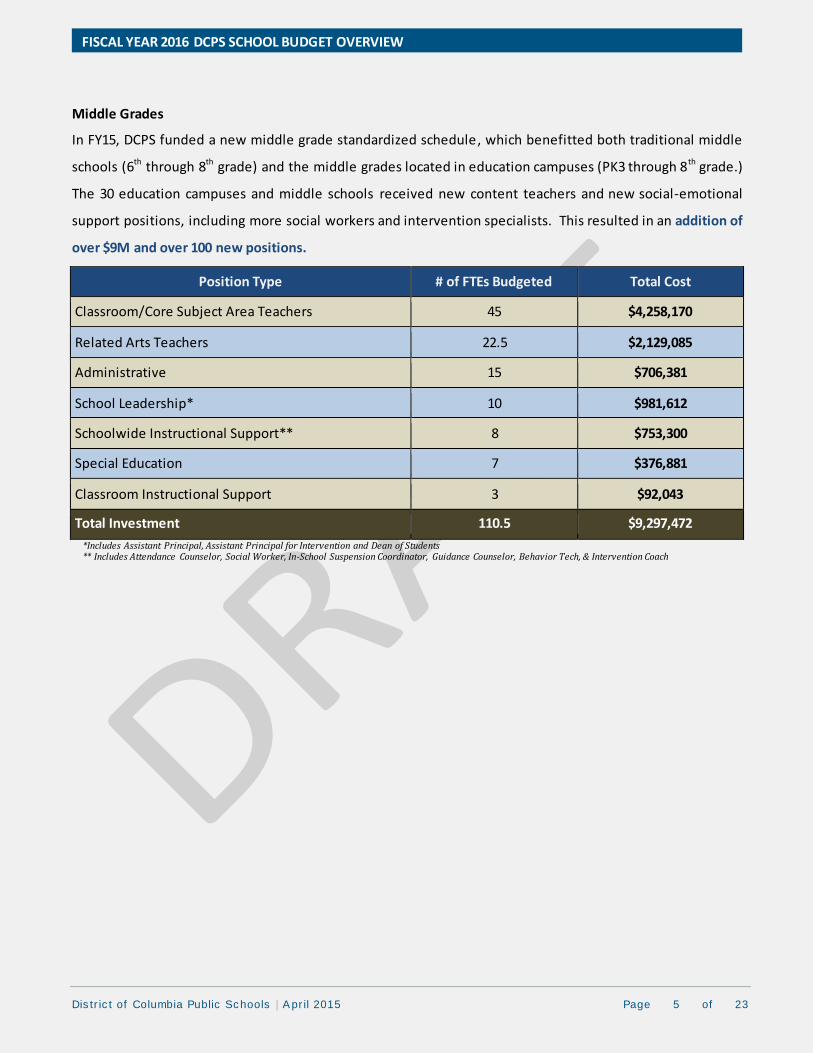
Middle Grades
In FY15, DCPS funded a new middle grade standardized schedule, which benefitted both traditional middle
schools (6th through 8th grade) and the middle grades located in education campuses (PK3 through 8th grade.)
The 30 education campuses and middle schools received new content teachers and new social-emotional
support positions, including more social workers and intervention specialists. This resulted in an addition of
over $9M and over 100 new positions.
Position Type # of FTEs Budgeted Total Cost
Classroom/Core Subject Area Teachers 45 $4,258,170
Related Arts Teachers 22.5 $2,129,085
Administrative 15 $706,381
School Leadership* 10 $981,612
Schoolwide Instructional Support** 8 $753,300
Special Education 7 $376,881
Classroom Instructional Support 3 $92,043
Total Investment 110.5 $9,297,472
*Includes Assistant Principal, Assistant Principal for Intervention and Dean of Students ** Includes Attendance Counselor, Social Worker, In-School Suspension Coordinator, Guidance Counselor, Behavior Tech, & Intervention Coach
Dis tr ic t of Columbia Public Schools | A pr il 2015 Page 6 of 23
FISCAL YEAR 2016 DCPS SCHOOL BUDGET OVERVIEW
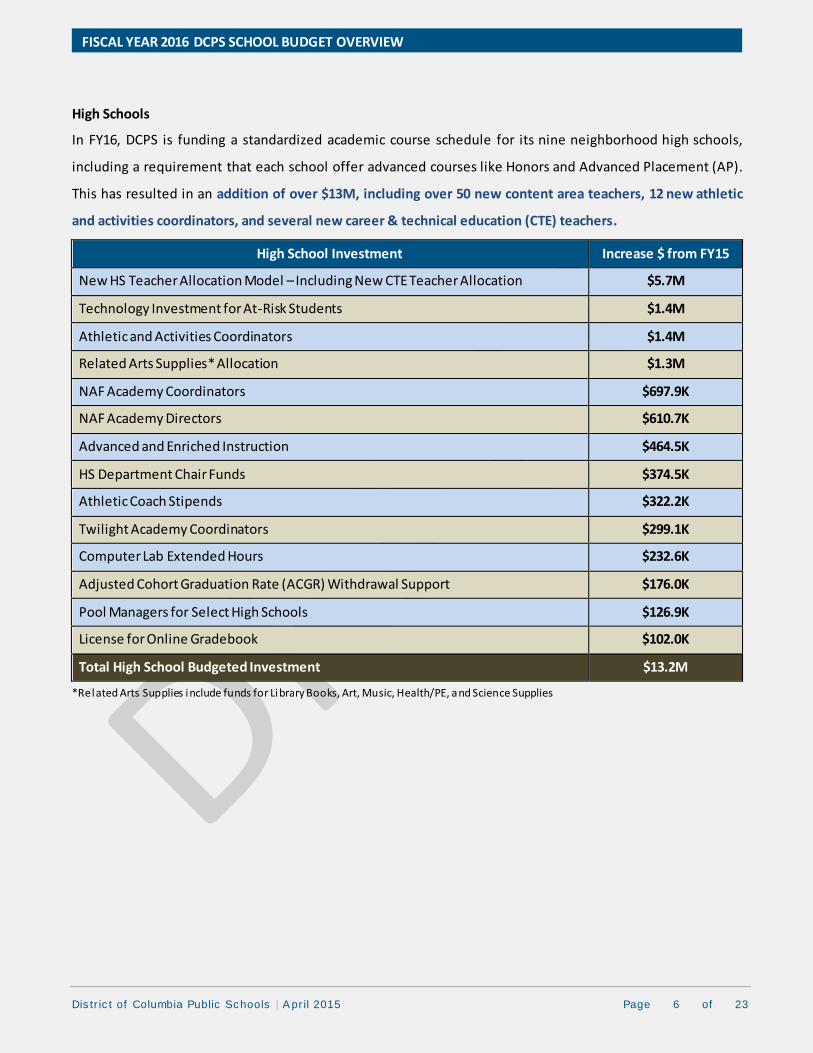
High Schools
In FY16, DCPS is funding a standardized academic course schedule for its nine neighborhood high schools,
including a requirement that each school offer advanced courses like Honors and Advanced Placement (AP).
This has resulted in an addition of over $13M, including over 50 new content area teachers, 12 new athletic
and activities coordinators, and several new career & technical education (CTE) teachers.
High School Investment Increase $ from FY15
New HS Teacher Allocation Model – Including New CTE Teacher Allocation $5.7M
Technology Investment for At-Risk Students $1.4M
Athletic and Activities Coordinators $1.4M
Related Arts Supplies* Allocation $1.3M
NAF Academy Coordinators $697.9K
NAF Academy Directors $610.7K
Advanced and Enriched Instruction $464.5K
HS Department Chair Funds $374.5K
Athletic Coach Stipends $322.2K
Twilight Academy Coordinators $299.1K
Computer Lab Extended Hours $232.6K
Adjusted Cohort Graduation Rate (ACGR) Withdrawal Support $176.0K
Pool Managers for Select High Schools $126.9K
License for Online Gradebook $102.0K
Total High School Budgeted Investment $13.2M
*Related Arts Supplies include funds for Library Books, Art, Music, Health/PE, and Science Supplies
Dis tr ic t of Columbia Public Schools | A pr il 2015 Page 7 of 23
FISCAL YEAR 2016 DCPS SCHOOL BUDGET OVERVIEW
At-risk Funding in FY16 What Is At-risk?
In 2014, the Uniform Per Student Funding Formula (UPSFF), which is the formula to
allocate local funding to all DC public schools, was updated.
These changes followed a multi-year review conducted by the DC Deputy Mayor for
Education (DME) called the “DC Education Adequacy Study”, which recommended
changes to the formula to more closely match allocated resources to actual need.
As a result, several of the grade-level allocations were
increased. An entirely new category was created to
direct additional funds to students considered "at-
risk" of academic failure.
The new category defined at-risk in a specific way.
It includes students who are homeless, in the foster
care system, receive the Temporary Assistance for Needy
Families (TANF) program or the Supplemental Nutrition Assistance Program (SNAP),
and over-age high school students.
The Office of the State Superintendent of Education (OSSE) calculates the number of
at-risk students at each public school by comparing current students against the public
assistance rosters, as well as collecting data on homeless, foster, and over-age
students. DCPS then uses those percentages to allocate additional staff and resources
to address the needs of at-risk students.
Di rected allocation for
more art, music, library,
science and health/PE
supplies
PWP Grants specifically
to target at-risk student
needs
Di rected allocation for
classroom technology
Seed money for new
extended day programs
and extended year
More social workers
and school psychologists
Funding for new
athletic uniforms and
equipment at middle
schools
New extended year
program at Raymond EC
in Ward 4
More special education
teachers
More content area
teachers for high school
Where is At-risk Funding in FY16?
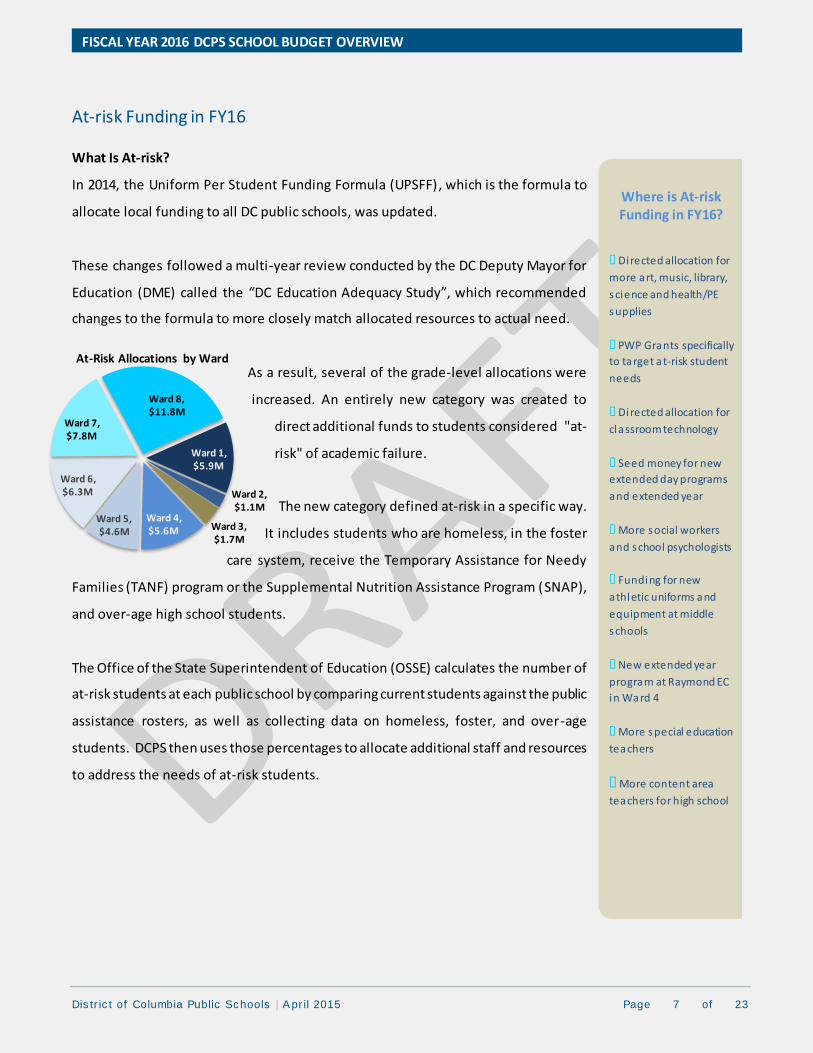
Ward 1, $5.9M
Ward 2, $1.1M
Ward 3, $1.7M
Ward 4, $5.6M
Ward 5, $4.6M
Ward 6, $6.3M
Ward 7, $7.8M
Ward 8, $11.8M
At-Risk Allocations by Ward
Dis tr ic t of Columbia Public Schools | A pr il 2015 Page 8 of 23
FISCAL YEAR 2016 DCPS SCHOOL BUDGET OVERVIEW
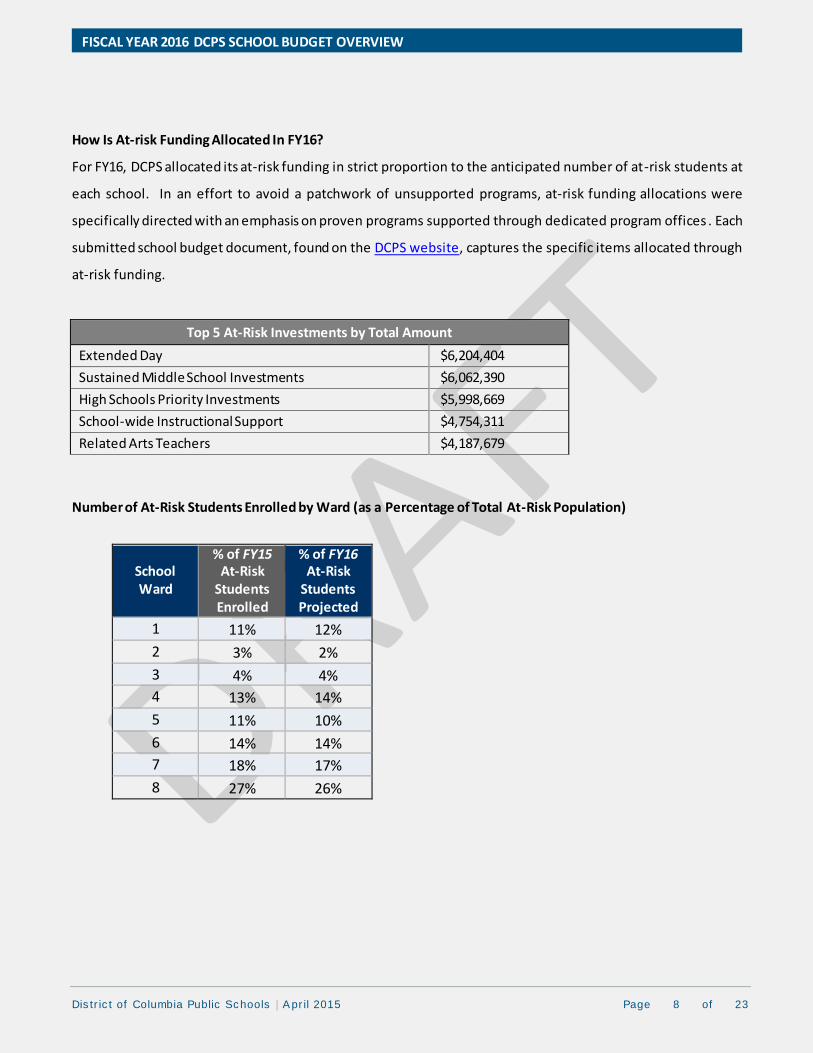
How Is At-risk Funding Allocated In FY16?
For FY16, DCPS allocated its at-risk funding in strict proportion to the anticipated number of at-risk students at
each school. In an effort to avoid a patchwork of unsupported programs, at-risk funding allocations were
specifically directed with an emphasis on proven programs supported through dedicated program offices . Each
submitted school budget document, found on the DCPS website, captures the specific items allocated through
at-risk funding.
Top 5 At-Risk Investments by Total Amount
Extended Day $6,204,404
Sustained Middle School Investments $6,062,390
High Schools Priority Investments $5,998,669
School-wide Instructional Support $4,754,311
Related Arts Teachers $4,187,679
Number of At-Risk Students Enrolled by Ward (as a Percentage of Total At-Risk Population)
School Ward
% of FY15 At-Risk
Students Enrolled
% of FY16 At-Risk
Students Projected
1 11% 12%
2 3% 2%
3 4% 4%
4 13% 14%
5 11% 10%
6 14% 14%
7 18% 17%
8 27% 26%
Dis tr ic t of Columbia Public Schools | A pr il 2015 Page 9 of 23
FISCAL YEAR 2016 DCPS SCHOOL BUDGET OVERVIEW
Enrollment
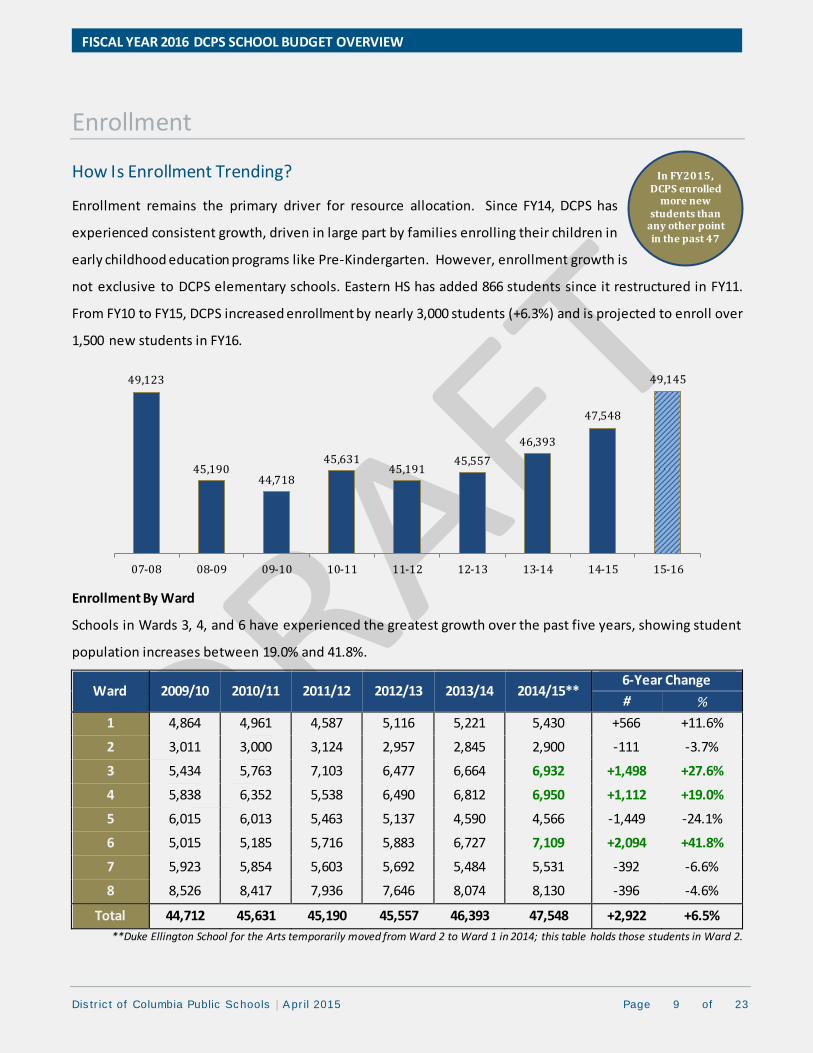
How Is Enrollment Trending?
Enrollment remains the primary driver for resource allocation. Since FY14, DCPS has
experienced consistent growth, driven in large part by families enrolling their children in
early childhood education programs like Pre-Kindergarten. However, enrollment growth is
not exclusive to DCPS elementary schools. Eastern HS has added 866 students since it restructured in FY11.
From FY10 to FY15, DCPS increased enrollment by nearly 3,000 students (+6.3%) and is projected to enroll over
1,500 new students in FY16.
Enrollment By Ward
Schools in Wards 3, 4, and 6 have experienced the greatest growth over the past five years, showing student
population increases between 19.0% and 41.8%.
Ward 2009/10 2010/11 2011/12 2012/13 2013/14 2014/15** 6-Year Change
# %
1 4,864 4,961 4,587 5,116 5,221 5,430 +566 +11.6%
2 3,011 3,000 3,124 2,957 2,845 2,900 -111 -3.7%
3 5,434 5,763 7,103 6,477 6,664 6,932 +1,498 +27.6%
4 5,838 6,352 5,538 6,490 6,812 6,950 +1,112 +19.0%
5 6,015 6,013 5,463 5,137 4,590 4,566 -1,449 -24.1%
6 5,015 5,185 5,716 5,883 6,727 7,109 +2,094 +41.8%
7 5,923 5,854 5,603 5,692 5,484 5,531 -392 -6.6%
8 8,526 8,417 7,936 7,646 8,074 8,130 -396 -4.6%
Total 44,712 45,631 45,190 45,557 46,393 47,548 +2,922 +6.5%
**Duke Ellington School for the Arts temporarily moved from Ward 2 to Ward 1 in 2014; this table holds those students in Ward 2.
49,123
45,190 44,718
45,631 45,191
45,557
46,393
47,548
49,145
07-08 08-09 09-10 10-11 11-12 12-13 13-14 14-15 15-16
In FY2015, DCPS enrolled
more new students than
any other point in the past 47
years.
Dis tr ic t of Columbia Public Schools | A pr il 2015 Page 10 of 23
FISCAL YEAR 2016 DCPS SCHOOL BUDGET OVERVIEW
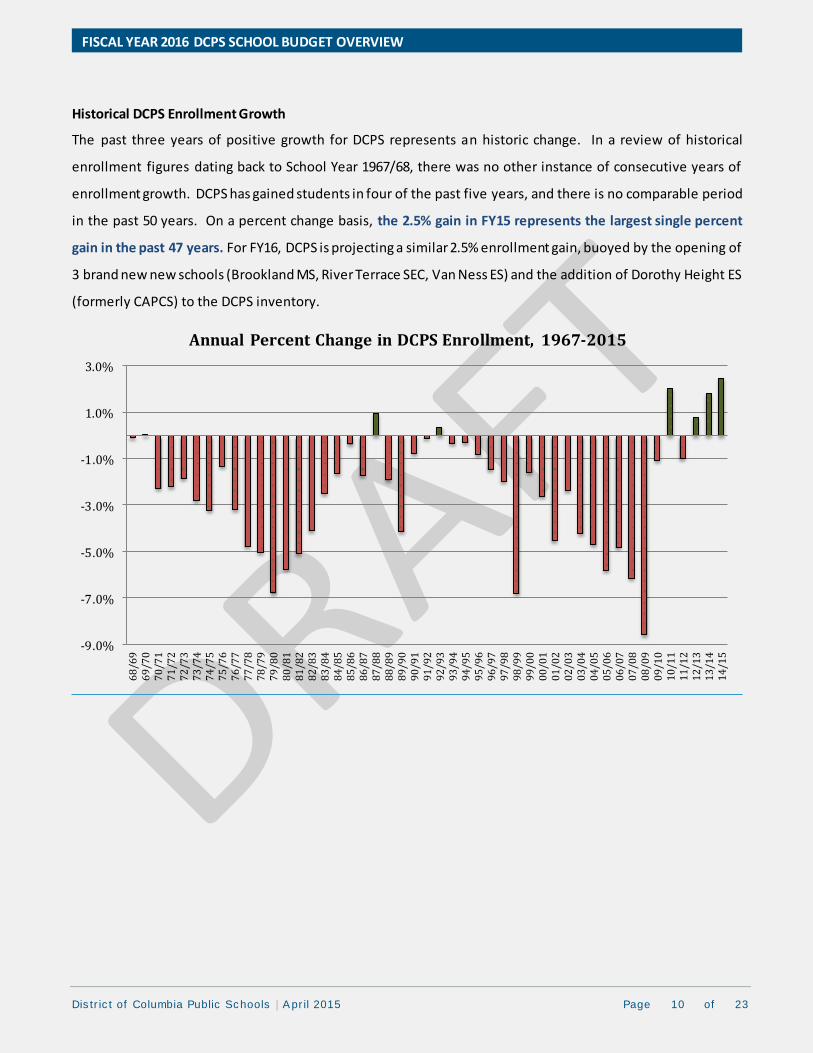
Historical DCPS Enrollment Growth
The past three years of positive growth for DCPS represents an historic change. In a review of historical
enrollment figures dating back to School Year 1967/68, there was no other instance of consecutive years of
enrollment growth. DCPS has gained students in four of the past five years, and there is no comparable period
in the past 50 years. On a percent change basis, the 2.5% gain in FY15 represents the largest single percent
gain in the past 47 years. For FY16, DCPS is projecting a similar 2.5% enrollment gain, buoyed by the opening of
3 brand new new schools (Brookland MS, River Terrace SEC, Van Ness ES) and the addition of Dorothy Height ES
(formerly CAPCS) to the DCPS inventory.
-9.0%
-7.0%
-5.0%
-3.0%
-1.0%
1.0%
3.0%
68
/69
69
/70
70
/71
71
/72
72
/73
73
/74
74
/75
75
/76
76
/77
77
/78
78
/79
79
/80
80
/81
81
/82
82
/83
83
/84
84
/85
85
/86
86
/87
87
/88
88
/89
89
/90
90
/91
91
/92
92
/93
93
/94
94
/95
95
/96
96
/97
97
/98
98
/99
99
/00
00
/01
01
/02
02
/03
03
/04
04
/05
05
/06
06
/07
07
/08
08
/09
09
/10
10
/11
11
/12
12
/13
13
/14
14
/15
Annual Percent Change in DCPS Enrollment, 1967-2015
Dis tr ic t of Columbia Public Schools | A pr il 2015 Page 11 of 23
FISCAL YEAR 2016 DCPS SCHOOL BUDGET OVERVIEW
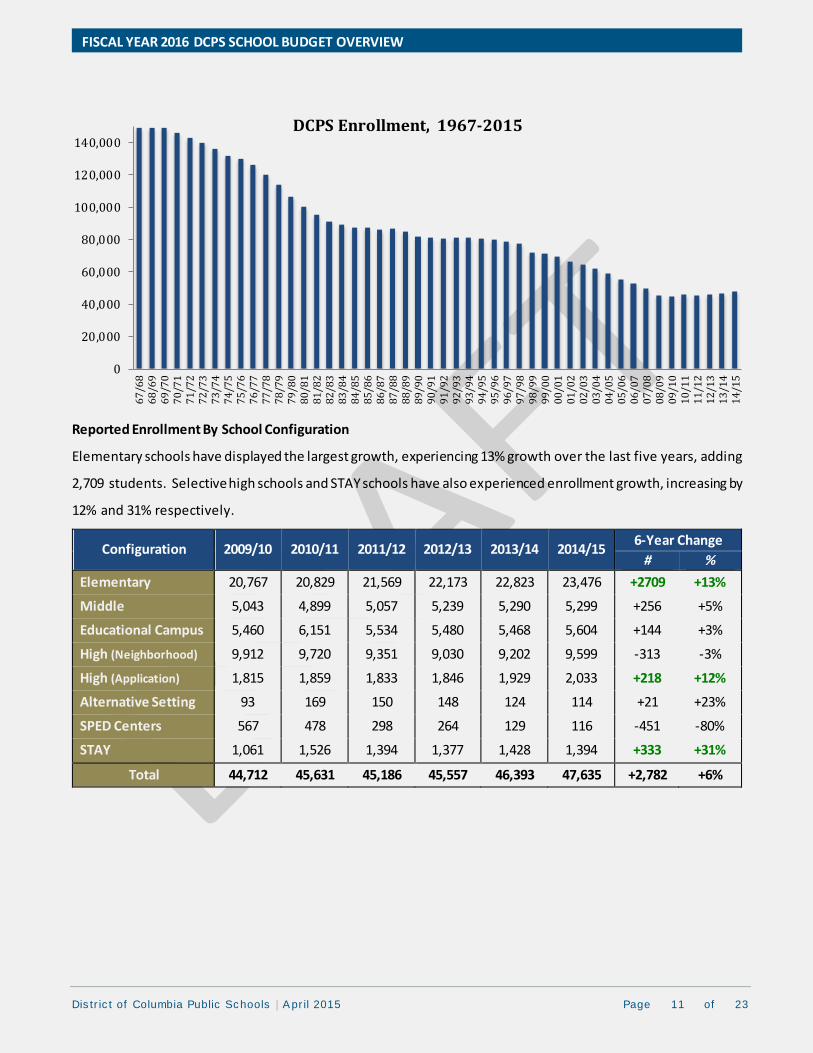
Reported Enrollment By School Configuration
Elementary schools have displayed the largest growth, experiencing 13% growth over the last five years, adding
2,709 students. Selective high schools and STAY schools have also experienced enrollment growth, increasing by
12% and 31% respectively.
Configuration 2009/10 2010/11 2011/12 2012/13 2013/14 2014/15 6-Year Change
# %
Elementary 20,767 20,829 21,569 22,173 22,823 23,476 +2709 +13%
Middle 5,043 4,899 5,057 5,239 5,290 5,299 +256 +5%
Educational Campus 5,460 6,151 5,534 5,480 5,468 5,604 +144 +3%
High (Neighborhood) 9,912 9,720 9,351 9,030 9,202 9,599 -313 -3%
High (Application) 1,815 1,859 1,833 1,846 1,929 2,033 +218 +12%
Alternative Setting 93 169 150 148 124 114 +21 +23%
SPED Centers 567 478 298 264 129 116 -451 -80%
STAY 1,061 1,526 1,394 1,377 1,428 1,394 +333 +31%
Total 44,712 45,631 45,186 45,557 46,393 47,635 +2,782 +6%
0
20,000
40,000
60,000
80,000
100,000
120,000
140,0006
7/6
86
8/6
96
9/7
07
0/7
17
1/7
27
2/7
37
3/7
47
4/7
57
5/7
67
6/7
77
7/7
87
8/7
97
9/8
08
0/8
18
1/8
28
2/8
38
3/8
48
4/8
58
5/8
68
6/8
78
7/8
88
8/8
98
9/9
09
0/9
19
1/9
29
2/9
39
3/9
49
4/9
59
5/9
69
6/9
79
7/9
89
8/9
99
9/0
00
0/0
10
1/0
20
2/0
30
3/0
40
4/0
50
5/0
60
6/0
70
7/0
80
8/0
90
9/1
01
0/1
11
1/1
21
2/1
31
3/1
41
4/1
5
DCPS Enrollment, 1967-2015
Dis tr ic t of Columbia Public Schools | A pr il 2015 Page 12 of 23
FISCAL YEAR 2016 DCPS SCHOOL BUDGET OVERVIEW
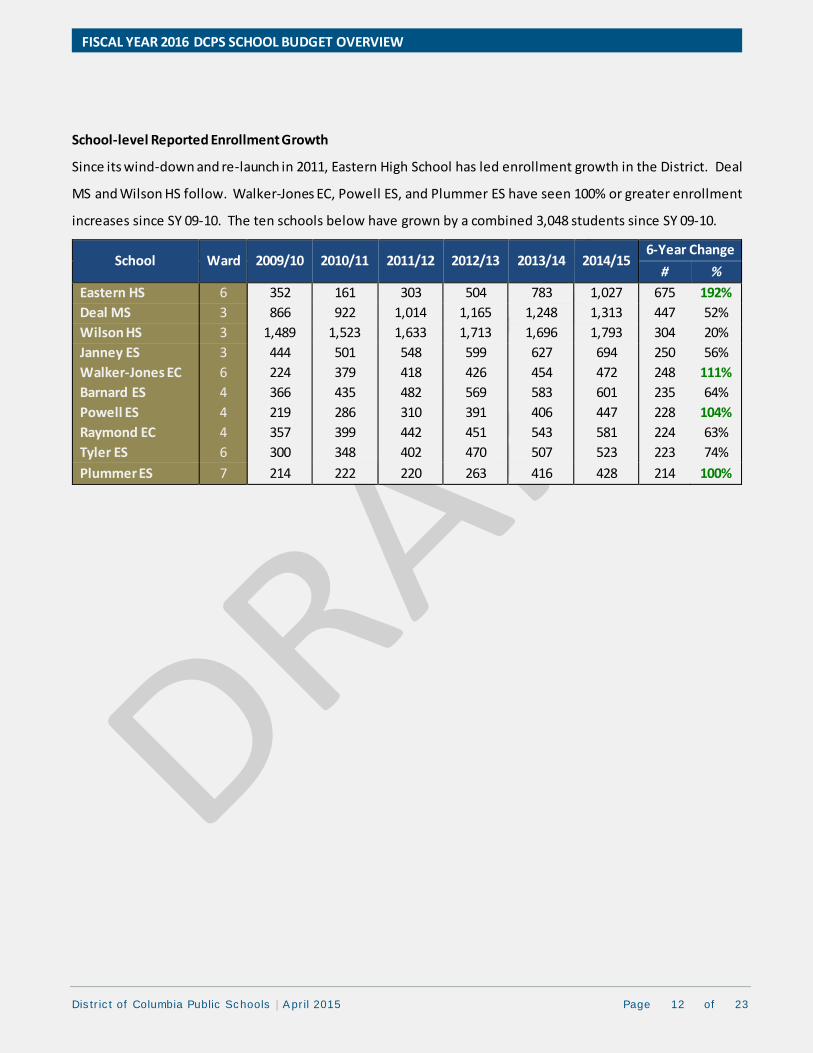
School-level Reported Enrollment Growth
Since its wind-down and re-launch in 2011, Eastern High School has led enrollment growth in the District. Deal
MS and Wilson HS follow. Walker-Jones EC, Powell ES, and Plummer ES have seen 100% or greater enrollment
increases since SY 09-10. The ten schools below have grown by a combined 3,048 students since SY 09-10.
School Ward 2009/10 2010/11 2011/12 2012/13 2013/14 2014/15 6-Year Change
# %
Eastern HS 6 352 161 303 504 783 1,027 675 192%
Deal MS 3 866 922 1,014 1,165 1,248 1,313 447 52%
Wilson HS 3 1,489 1,523 1,633 1,713 1,696 1,793 304 20%
Janney ES 3 444 501 548 599 627 694 250 56%
Walker-Jones EC 6 224 379 418 426 454 472 248 111%
Barnard ES 4 366 435 482 569 583 601 235 64%
Powell ES 4 219 286 310 391 406 447 228 104%
Raymond EC 4 357 399 442 451 543 581 224 63%
Tyler ES 6 300 348 402 470 507 523 223 74%
Plummer ES 7 214 222 220 263 416 428 214 100%
Dis tr ic t of Columbia Public Schools | A pr il 2015 Page 13 of 23
FISCAL YEAR 2016 DCPS SCHOOL BUDGET OVERVIEW
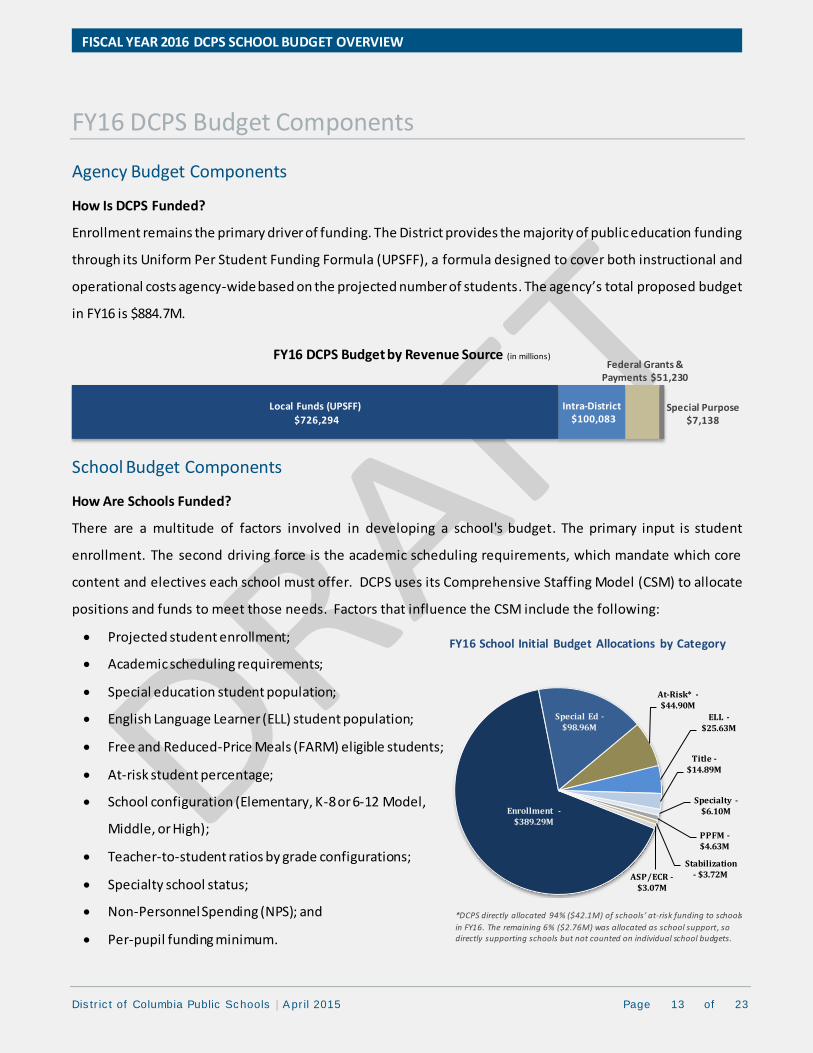
Local Funds (UPSFF)
$726,294
Intra-District $100,083
Federal Grants & Payments $51,230
Special Purpose $7,138
FY16 DCPS Budget by Revenue Source (in millions)
FY16 DCPS Budget Components
Agency Budget Components
How Is DCPS Funded?
Enrollment remains the primary driver of funding. The District provides the majority of public education funding
through its Uniform Per Student Funding Formula (UPSFF), a formula designed to cover both instructional and
operational costs agency-wide based on the projected number of students. The agency’s total proposed budget
in FY16 is $884.7M.
School Budget Components
How Are Schools Funded?
There are a multitude of factors involved in developing a school's budget. The primary input is student
enrollment. The second driving force is the academic scheduling requirements, which mandate which core
content and electives each school must offer. DCPS uses its Comprehensive Staffing Model (CSM) to allocate
positions and funds to meet those needs. Factors that influence the CSM include the following:
Projected student enrollment;
Academic scheduling requirements;
Special education student population;
English Language Learner (ELL) student population;
Free and Reduced-Price Meals (FARM) eligible students;
At-risk student percentage;
School configuration (Elementary, K-8 or 6-12 Model,
Middle, or High);
Teacher-to-student ratios by grade configurations;
Specialty school status;
Non-Personnel Spending (NPS); and
Per-pupil funding minimum.
Enrollment - $389.29M
Special Ed - $98.96M
At-Risk* - $44.90M
ELL - $25.63M
Title - $14.89M
Specialty - $6.10M
PPFM - $4.63M
Stabilization - $3.72M ASP/ECR -
$3.07M
*DCPS directly allocated 94% ($42.1M) of schools’ at-risk funding to schools
in FY16. The remaining 6% ($2.76M) was allocated as school support, so directly supporting schools but not counted on individual school budgets.
FY16 School Initial Budget Allocations by Category
Dis tr ic t of Columbia Public Schools | A pr il 2015 Page 14 of 23
FISCAL YEAR 2016 DCPS SCHOOL BUDGET OVERVIEW
To learn more about the Comprehensive Staffing Models (CSM) used to allocate resources to schools each year,
visit the DCPS School Budget Development Guide (www.DCPSschoolbudgetguide.com).
Our Goals For FY16
DCPS planned three goals for its FY16 budget development:
Continue the opportunities started during the previous two fiscal years for students, parents, and
community members to provide meaningful input during the budget development process;
Sustain investments in elementary and middle schools while simultaneously creating a new investment
specific to neighborhood high schools;
Comply with the Fair Student Funding Act by proportionally allocating at-risk funds based on the number
of anticipated at-risk students.
DCPS successfully sustained its earlier investments in elementary and middle schools and also created an
ambitious new program for neighborhood high schools. In compliance with the law, it allocated 90% of its at-
risk funding in proportion to the number of expected at-risk students. It was not without some challenges. It
was necessary for DCPS to implement some cuts in order to sustain earlier investments, create a new
investment, and comply with the law. The DCPS central office was cut by about $15 million, and will
subsequently experience a modest reduction-in-force for FY16. It was also necessary to make some small
reductions in the school allocation formula, such as to the per pupil funding minimum (PPFM).
The following sections take a closer look at FY16 DCPS school budgets, including Ward and School Type data,
staffing data, and school-based programming data. For more information about school budgets, please visit the
DCPS Interactive Data Center (www.DCPSdatacenter.com), a great place to see FY16 school budget data for each
school and ward, as well as historical budget data, in easy to use interactive dashboards. This site will continue
to be updated throughout the budget development process and during the upcoming school year—so please
bookmark it!
Dis tr ic t of Columbia Public Schools | A pr il 2015 Page 15 of 23
FISCAL YEAR 2016 DCPS SCHOOL BUDGET OVERVIEW
FY16 School Budget Data
Ward
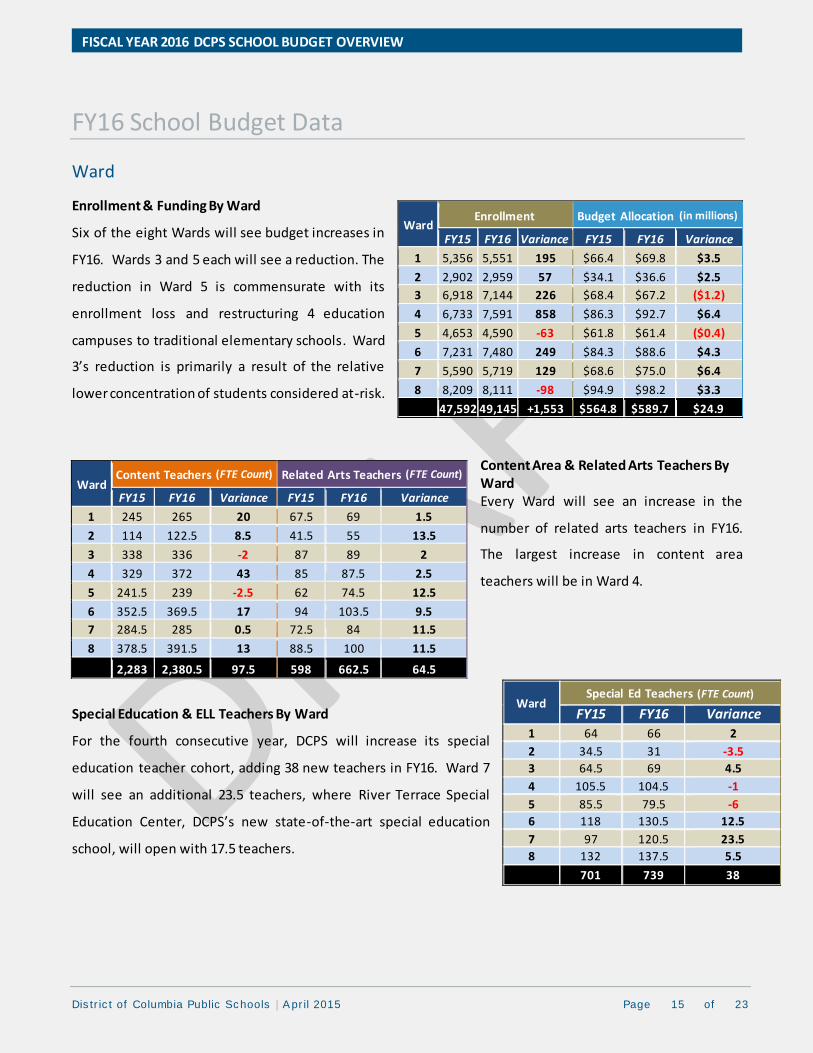
Enrollment & Funding By Ward
Six of the eight Wards will see budget increases in
FY16. Wards 3 and 5 each will see a reduction. The
reduction in Ward 5 is commensurate with its
enrollment loss and restructuring 4 education
campuses to traditional elementary schools. Ward
3’s reduction is primarily a result of the relative
lower concentration of students considered at-risk.
Content Area & Related Arts Teachers By Ward Every Ward will see an increase in the
number of related arts teachers in FY16.
The largest increase in content area
teachers will be in Ward 4.
Special Education & ELL Teachers By Ward
For the fourth consecutive year, DCPS will increase its special
education teacher cohort, adding 38 new teachers in FY16. Ward 7
will see an additional 23.5 teachers, where River Terrace Special
Education Center, DCPS’s new state-of-the-art special education
school, will open with 17.5 teachers.
.Ward. Enrollment .Budget Allocation (in millions).
FY15 FY16 Variance. FY15 FY16 Variance
1 5,356 5,551 195 $66.4 $69.8 $3.5
2 2,902 2,959 57 $34.1 $36.6 $2.5
3 6,918 7,144 226 $68.4 $67.2 ($1.2)
4 6,733 7,591 858 $86.3 $92.7 $6.4
5 4,653 4,590 -63 $61.8 $61.4 ($0.4)
6 7,231 7,480 249 $84.3 $88.6 $4.3
7 5,590 5,719 129 $68.6 $75.0 $6.4
8 8,209 8,111 -98 $94.9 $98.2 $3.3
47,592 49,145 +1,553 $564.8 $589.7 $24.9
.Ward. .Content Teachers (FTE Count). .Related Arts Teachers (FTE Count).
FY15 FY16 Variance FY15 FY16 Variance
1 245 265 20 67.5 69 1.5
2 114 122.5 8.5 41.5 55 13.5
3 338 336 -2 87 89 2
4 329 372 43 85 87.5 2.5
5 241.5 239 -2.5 62 74.5 12.5
6 352.5 369.5 17 94 103.5 9.5
7 284.5 285 0.5 72.5 84 11.5
8 378.5 391.5 13 88.5 100 11.5
2,283 2,380.5 97.5 598 662.5 64.5
.Ward. Special Ed Teachers (FTE Count)
FY15 FY16 Variance
1 64 66 2
2 34.5 31 -3.5
3 64.5 69 4.5
4 105.5 104.5 -1
5 85.5 79.5 -6
6 118 130.5 12.5
7 97 120.5 23.5
8 132 137.5 5.5
701 739 38
Dis tr ic t of Columbia Public Schools | A pr il 2015 Page 16 of 23
FISCAL YEAR 2016 DCPS SCHOOL BUDGET OVERVIEW
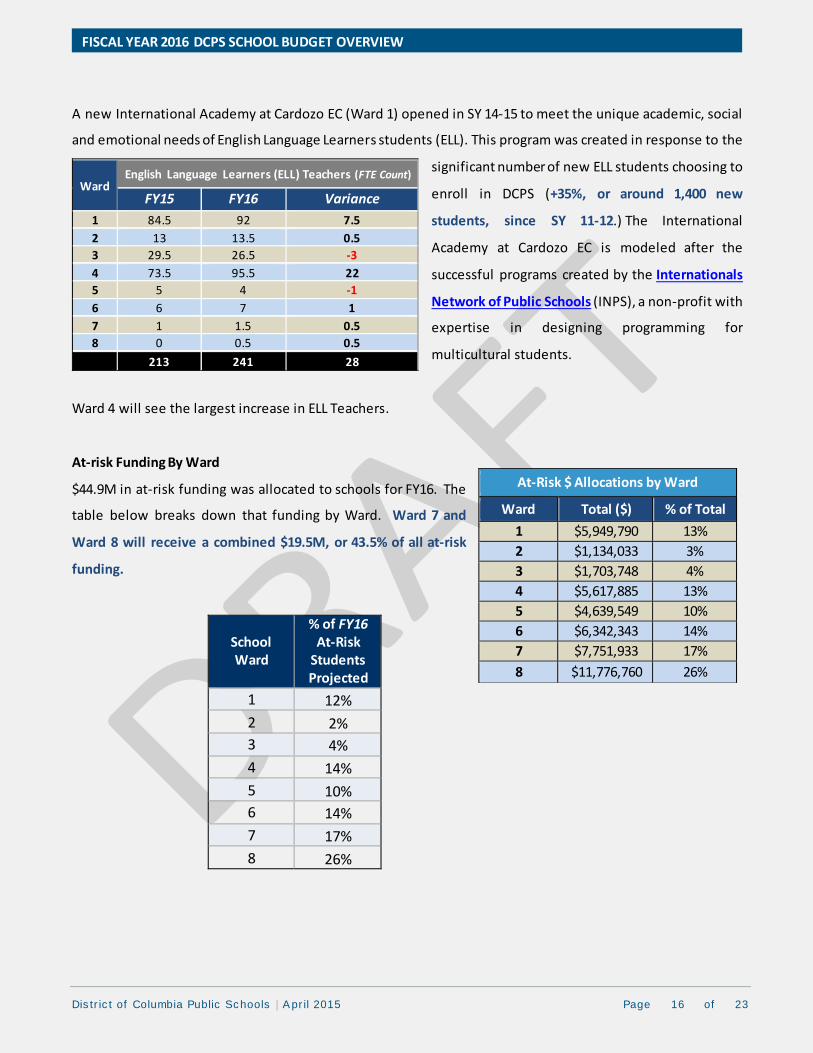
A new International Academy at Cardozo EC (Ward 1) opened in SY 14-15 to meet the unique academic, social
and emotional needs of English Language Learners students (ELL). This program was created in response to the
significant number of new ELL students choosing to
enroll in DCPS (+35%, or around 1,400 new
students, since SY 11-12.) The International
Academy at Cardozo EC is modeled after the
successful programs created by the Internationals
Network of Public Schools (INPS), a non-profit with
expertise in designing programming for
multicultural students.
Ward 4 will see the largest increase in ELL Teachers.
At-risk Funding By Ward
$44.9M in at-risk funding was allocated to schools for FY16. The
table below breaks down that funding by Ward. Ward 7 and
Ward 8 will receive a combined $19.5M, or 43.5% of all at-risk
funding.
School Ward
% of FY16 At-Risk
Students Projected
1 12%
2 2%
3 4%
4 14%
5 10%
6 14%
7 17%
8 26%
Ward English Language Learners (ELL) Teachers (FTE Count)
FY15 FY16 Variance
1 84.5 92 7.5
2 13 13.5 0.5
3 29.5 26.5 -3
4 73.5 95.5 22
5 5 4 -1
6 6 7 1
7 1 1.5 0.5
8 0 0.5 0.5
213 241 28
At-Risk $ Allocations by Ward
Ward Total ($) % of Total
1 $5,949,790 13%
2 $1,134,033 3%
3 $1,703,748 4%
4 $5,617,885 13%
5 $4,639,549 10%
6 $6,342,343 14%
7 $7,751,933 17%
8 $11,776,760 26%
Dis tr ic t of Columbia Public Schools | A pr il 2015 Page 17 of 23
FISCAL YEAR 2016 DCPS SCHOOL BUDGET OVERVIEW
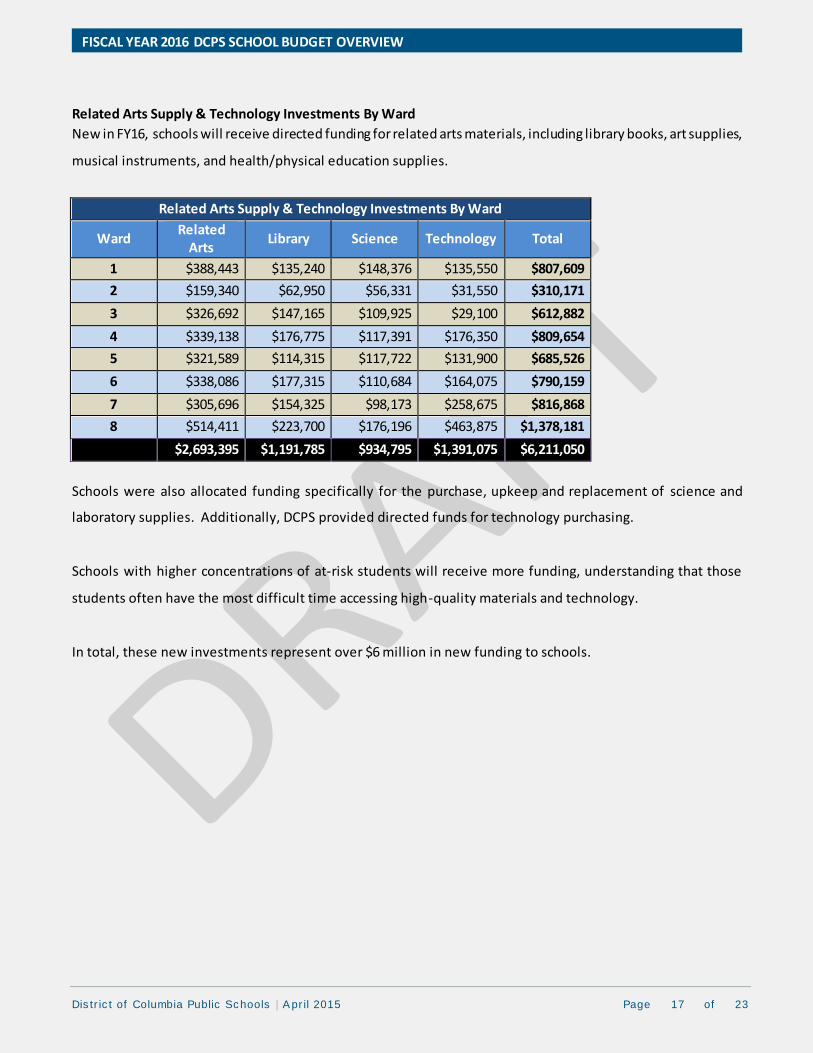
Related Arts Supply & Technology Investments By Ward
New in FY16, schools will receive directed funding for related arts materials, including library books, art supplies,
musical instruments, and health/physical education supplies.
Related Arts Supply & Technology Investments By Ward
Ward Related
Arts Library Science Technology Total
1 $388,443 $135,240 $148,376 $135,550 $807,609
2 $159,340 $62,950 $56,331 $31,550 $310,171
3 $326,692 $147,165 $109,925 $29,100 $612,882
4 $339,138 $176,775 $117,391 $176,350 $809,654
5 $321,589 $114,315 $117,722 $131,900 $685,526
6 $338,086 $177,315 $110,684 $164,075 $790,159
7 $305,696 $154,325 $98,173 $258,675 $816,868
8 $514,411 $223,700 $176,196 $463,875 $1,378,181
$2,693,395 $1,191,785 $934,795 $1,391,075 $6,211,050
Schools were also allocated funding specifically for the purchase, upkeep and replacement of science and
laboratory supplies. Additionally, DCPS provided directed funds for technology purchasing.
Schools with higher concentrations of at-risk students will receive more funding, understanding that those
students often have the most difficult time accessing high-quality materials and technology.
In total, these new investments represent over $6 million in new funding to schools.
Dis tr ic t of Columbia Public Schools | A pr il 2015 Page 18 of 23
FISCAL YEAR 2016 DCPS SCHOOL BUDGET OVERVIEW
School Type
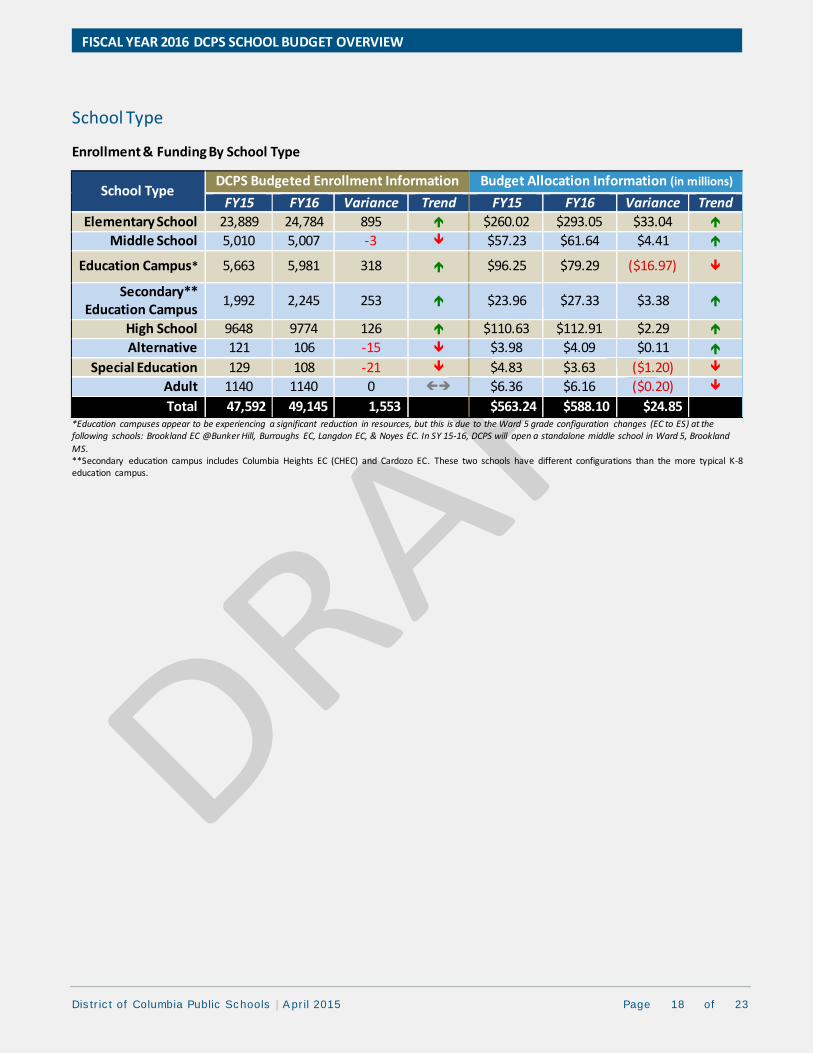
Enrollment & Funding By School Type
School Type DCPS Budgeted Enrollment Information Budget Allocation Information (in millions)
FY15 FY16 Variance Trend FY15 FY16 Variance Trend
Elementary School 23,889 24,784 895 $260.02 $293.05 $33.04
Middle School 5,010 5,007 -3 $57.23 $61.64 $4.41
Education Campus* 5,663 5,981 318 $96.25 $79.29 ($16.97)
Secondary** Education Campus
1,992 2,245 253 $23.96 $27.33 $3.38
High School 9648 9774 126 $110.63 $112.91 $2.29
Alternative 121 106 -15 $3.98 $4.09 $0.11
Special Education 129 108 -21 $4.83 $3.63 ($1.20)
Adult 1140 1140 0 $6.36 $6.16 ($0.20)
Total 47,592 49,145 1,553 $563.24 $588.10 $24.85 *Education campuses appear to be experiencing a significant reduction in resources, but this is due to the Ward 5 grade configuration changes (EC to ES) at the following schools: Brookland EC @Bunker Hill, Burroughs EC, Langdon EC, & Noyes EC. In SY 15-16, DCPS will open a standalone middle school in Ward 5, Brookland
MS. **Secondary education campus includes Columbia Heights EC (CHEC) and Cardozo EC. These two schools have different configurations than the more typical K-8 education campus.
Dis tr ic t of Columbia Public Schools | A pr il 2015 Page 19 of 23
FISCAL YEAR 2016 DCPS SCHOOL BUDGET OVERVIEW
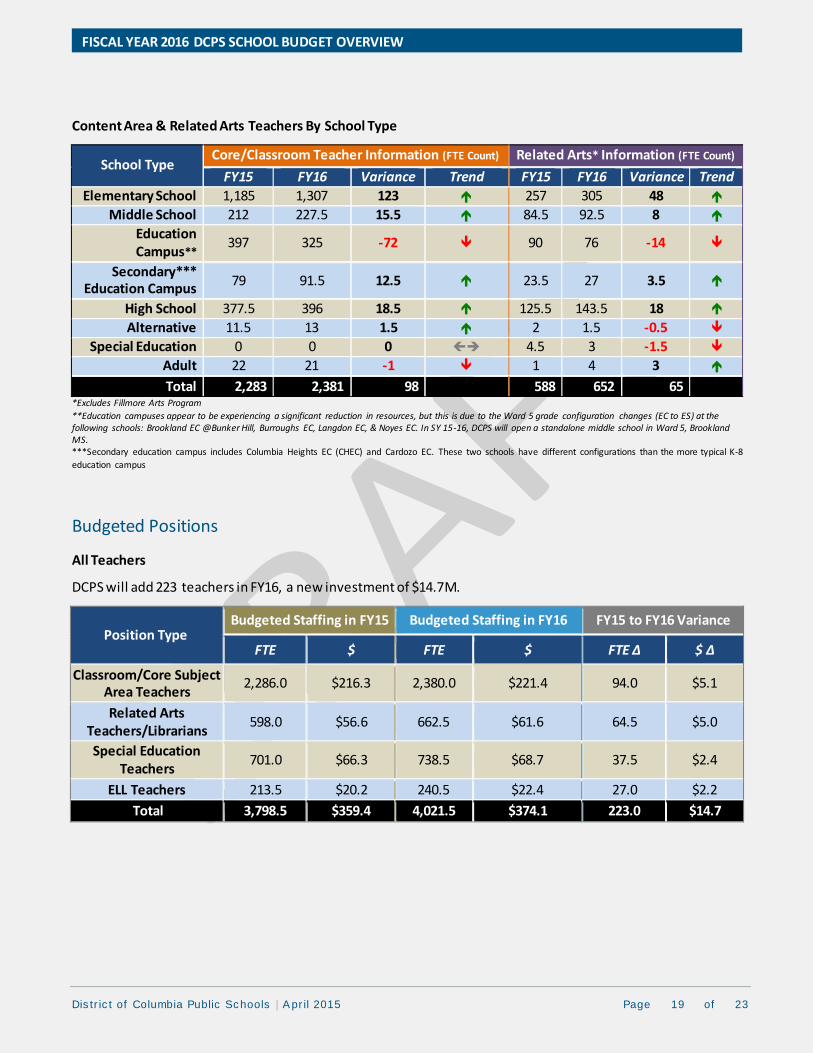
Content Area & Related Arts Teachers By School Type
School Type Core/Classroom Teacher Information (FTE Count) Related Arts* Information (FTE Count)
FY15 FY16 Variance Trend FY15 FY16 Variance Trend
Elementary School 1,185 1,307 123 257 305 48
Middle School 212 227.5 15.5 84.5 92.5 8
Education Campus**
397 325 -72 90 76 -14
Secondary*** Education Campus
79 91.5 12.5 23.5 27 3.5
High School 377.5 396 18.5 125.5 143.5 18
Alternative 11.5 13 1.5 2 1.5 -0.5
Special Education 0 0 0 4.5 3 -1.5
Adult 22 21 -1 1 4 3
Total 2,283 2,381 98 588 652 65 *Excludes Fillmore Arts Program
**Education campuses appear to be experiencing a significant reduction in resources, but this is due to the Ward 5 grade configuration changes (EC to ES) at the following schools: Brookland EC @Bunker Hill, Burroughs EC, Langdon EC, & Noyes EC. In SY 15-16, DCPS will open a standalone middle school in Ward 5, Brookland MS. ***Secondary education campus includes Columbia Heights EC (CHEC) and Cardozo EC. These two schools have different configurations than the more typical K-8
education campus
Budgeted Positions
All Teachers
DCPS will add 223 teachers in FY16, a new investment of $14.7M.
Position Type Budgeted Staffing in FY15 Budgeted Staffing in FY16 FY15 to FY16 Variance
FTE $ FTE $ FTE ∆ $ ∆
Classroom/Core Subject Area Teachers
2,286.0 $216.3 2,380.0 $221.4 94.0 $5.1
Related Arts Teachers/Librarians
598.0 $56.6 662.5 $61.6 64.5 $5.0
Special Education Teachers
701.0 $66.3 738.5 $68.7 37.5 $2.4
ELL Teachers 213.5 $20.2 240.5 $22.4 27.0 $2.2
Total 3,798.5 $359.4 4,021.5 $374.1 223.0 $14.7
Dis tr ic t of Columbia Public Schools | A pr il 2015 Page 20 of 23
FISCAL YEAR 2016 DCPS SCHOOL BUDGET OVERVIEW
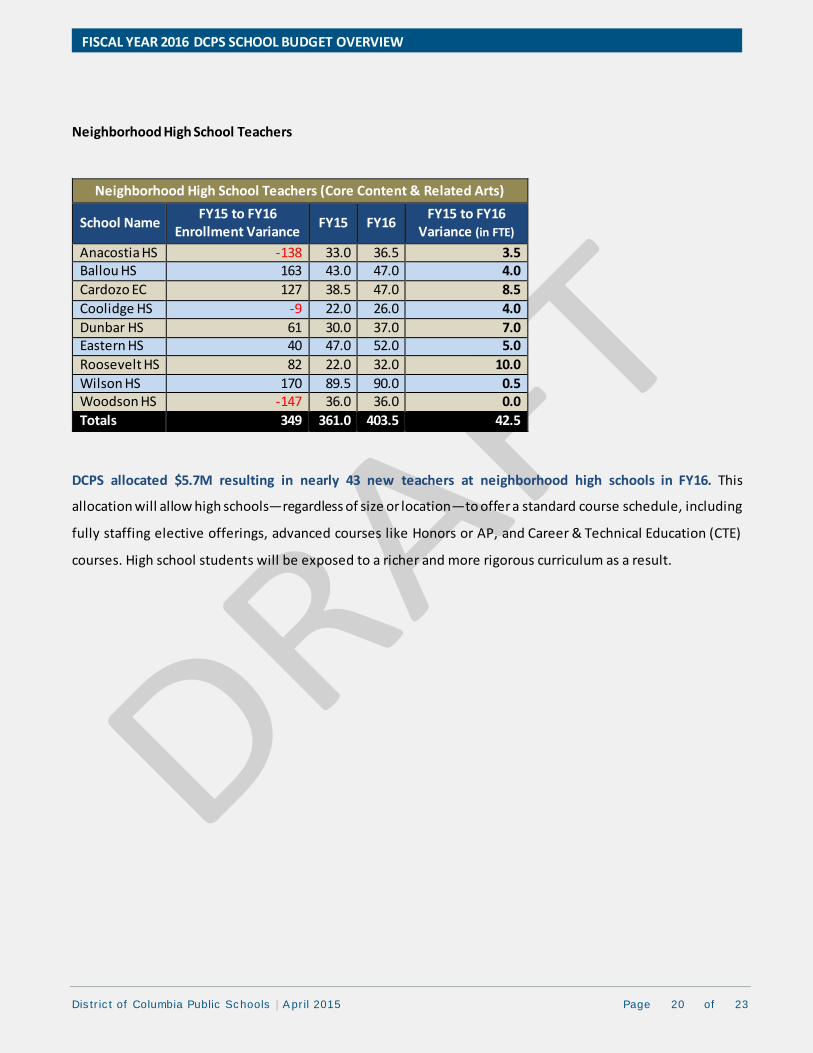
Neighborhood High School Teachers
DCPS allocated $5.7M resulting in nearly 43 new teachers at neighborhood high schools in FY16. This
allocation will allow high schools—regardless of size or location—to offer a standard course schedule, including
fully staffing elective offerings, advanced courses like Honors or AP, and Career & Technical Education (CTE)
courses. High school students will be exposed to a richer and more rigorous curriculum as a result.
Neighborhood High School Teachers (Core Content & Related Arts)
School Name FY15 to FY16
Enrollment Variance FY15 FY16
FY15 to FY16 Variance (in FTE)
Anacostia HS -138 33.0 36.5 3.5 Ballou HS 163 43.0 47.0 4.0
Cardozo EC 127 38.5 47.0 8.5
Coolidge HS -9 22.0 26.0 4.0
Dunbar HS 61 30.0 37.0 7.0 Eastern HS 40 47.0 52.0 5.0
Roosevelt HS 82 22.0 32.0 10.0
Wilson HS 170 89.5 90.0 0.5 Woodson HS -147 36.0 36.0 0.0
Totals 349 361.0 403.5 42.5
Dis tr ic t of Columbia Public Schools | A pr il 2015 Page 21 of 23
FISCAL YEAR 2016 DCPS SCHOOL BUDGET OVERVIEW
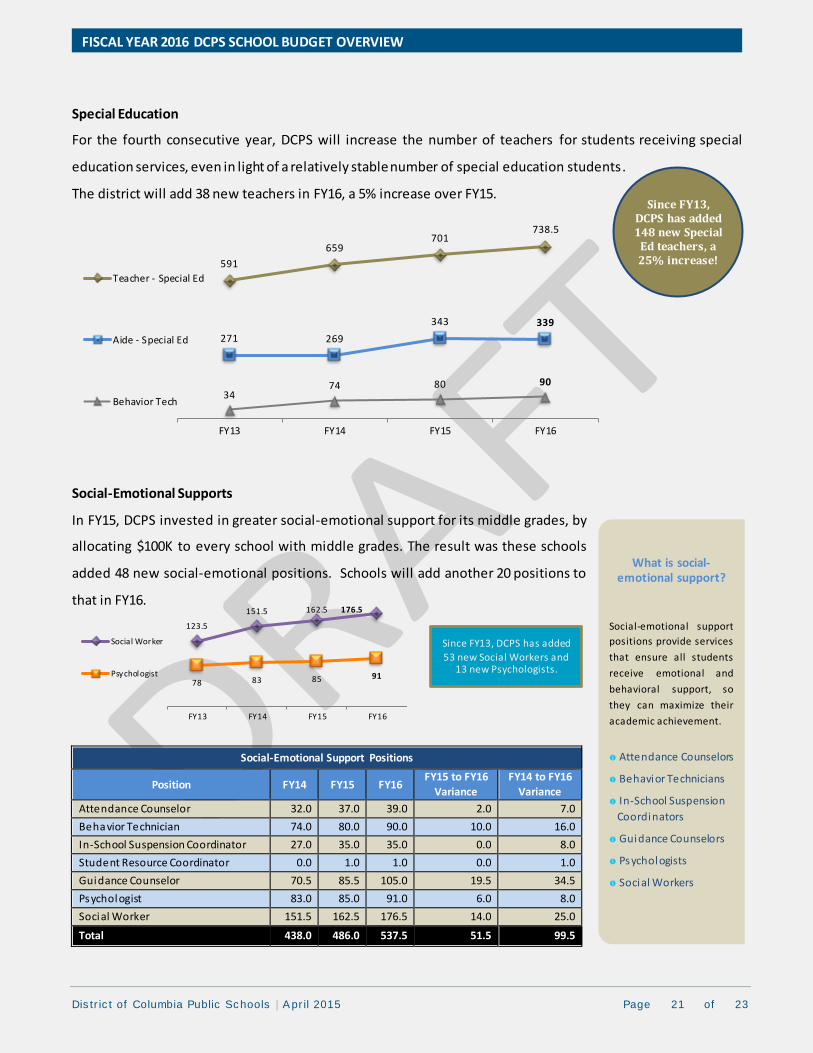
Special Education
For the fourth consecutive year, DCPS will increase the number of teachers for students receiving special
education services, even in light of a relatively stable number of special education students.
The district will add 38 new teachers in FY16, a 5% increase over FY15.
Social-Emotional Supports
In FY15, DCPS invested in greater social-emotional support for its middle grades, by
allocating $100K to every school with middle grades. The result was these schools
added 48 new social-emotional positions. Schools will add another 20 positions to
that in FY16.
591
659 701
738.5
271 269
343 339
34 74 80 90
FY13 FY14 FY15 FY16
Teacher - Special Ed
Aide - Special Ed
Behavior Tech
Social-Emotional Support Positions
Position FY14 FY15 FY16 FY15 to FY16
Variance
FY14 to FY16
Variance
Attendance Counselor 32.0 37.0 39.0 2.0 7.0
Behavior Technician 74.0 80.0 90.0 10.0 16.0
In-School Suspension Coordinator 27.0 35.0 35.0 0.0 8.0
Student Resource Coordinator 0.0 1.0 1.0 0.0 1.0
Guidance Counselor 70.5 85.5 105.0 19.5 34.5
Psychologist 83.0 85.0 91.0 6.0 8.0
Social Worker 151.5 162.5 176.5 14.0 25.0
Total 438.0 486.0 537.5 51.5 99.5
Since FY13, DCPS has added 148 new Special
Ed teachers, a 25% increase!
Social-emotional support
positions provide services
that ensure all students
receive emotional and
behavioral support, so
they can maximize their
academic achievement.
Attendance Counselors
Behavior Technicians
In-School Suspension
Coordinators
Guidance Counselors
Psychologists
Social Workers
Student Resource
Coordinators
What is social-emotional support?
123.5
151.5 162.5 176.5
78 83 85 91
FY13 FY14 FY15 FY16
Social Worker
Psychologist
Since FY13, DCPS has added
53 new Social Workers and 13 new Psychologists.
Dis tr ic t of Columbia Public Schools | A pr il 2015 Page 22 of 23
FISCAL YEAR 2016 DCPS SCHOOL BUDGET OVERVIEW
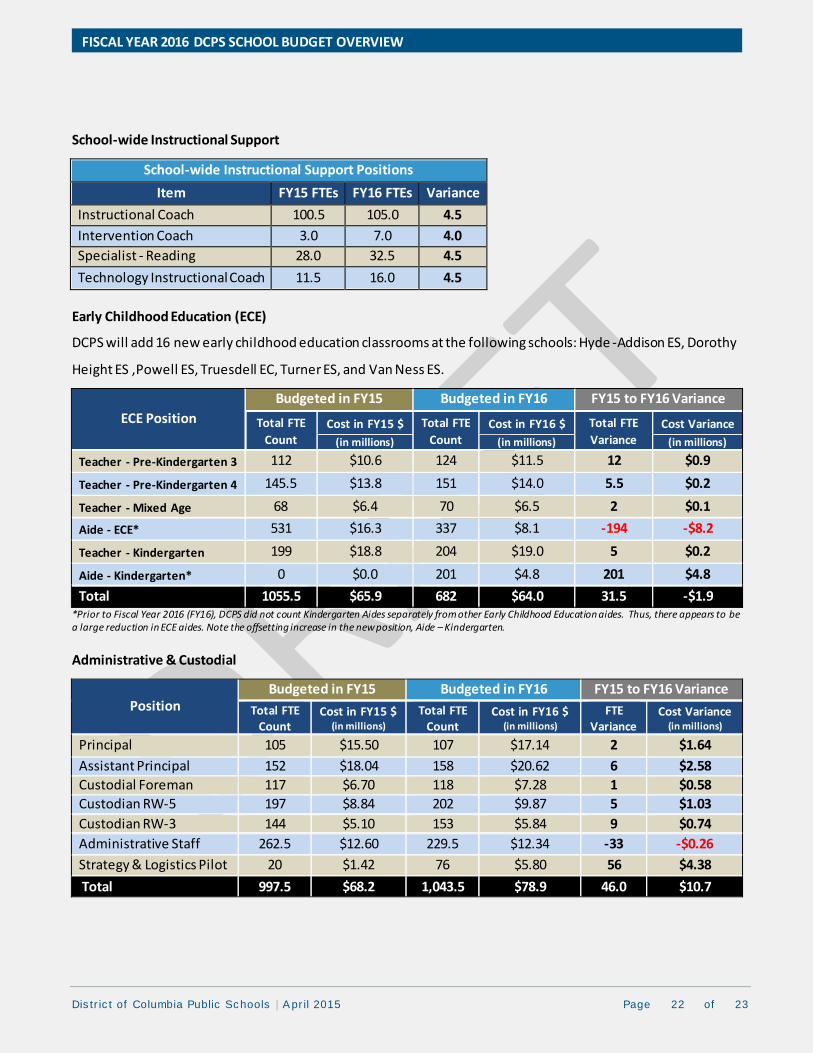
School-wide Instructional Support
School-wide Instructional Support Positions
Item FY15 FTEs FY16 FTEs Variance
Instructional Coach 100.5 105.0 4.5
Intervention Coach 3.0 7.0 4.0
Specialist - Reading 28.0 32.5 4.5
Technology Instructional Coach 11.5 16.0 4.5
Early Childhood Education (ECE)
DCPS will add 16 new early childhood education classrooms at the following schools: Hyde -Addison ES, Dorothy
Height ES ,Powell ES, Truesdell EC, Turner ES, and Van Ness ES.
ECE Position
Budgeted in FY15 Budgeted in FY16 FY15 to FY16 Variance
Total FTE
Count Cost in FY15 $ Total FTE
Count Cost in FY16 $ Total FTE
Variance Cost Variance
(in millions) (in millions) (in millions)
Teacher - Pre-Kindergarten 3 112 $10.6 124 $11.5 12 $0.9
Teacher - Pre-Kindergarten 4 145.5 $13.8 151 $14.0 5.5 $0.2
Teacher - Mixed Age 68 $6.4 70 $6.5 2 $0.1
Aide - ECE* 531 $16.3 337 $8.1 -194 -$8.2
Teacher - Kindergarten 199 $18.8 204 $19.0 5 $0.2
Aide - Kindergarten* 0 $0.0 201 $4.8 201 $4.8
Total 1055.5 $65.9 682 $64.0 31.5 -$1.9 *Prior to Fiscal Year 2016 (FY16), DCPS did not count Kindergarten Aides separately from other Early Childhood Education aides. Thus, there appears to be a large reduction in ECE aides. Note the offsetting increase in the new position, Aide – Kindergarten.
Administrative & Custodial
Position Budgeted in FY15 Budgeted in FY16 FY15 to FY16 Variance
Total FTE Count
Cost in FY15 $ (in millions)
Total FTE Count
Cost in FY16 $ (in millions)
FTE Variance
Cost Variance (in millions)
Principal 105 $15.50 107 $17.14 2 $1.64
Assistant Principal 152 $18.04 158 $20.62 6 $2.58
Custodial Foreman 117 $6.70 118 $7.28 1 $0.58
Custodian RW-5 197 $8.84 202 $9.87 5 $1.03
Custodian RW-3 144 $5.10 153 $5.84 9 $0.74
Administrative Staff 262.5 $12.60 229.5 $12.34 -33 -$0.26
Strategy & Logistics Pilot 20 $1.42 76 $5.80 56 $4.38
Total 997.5 $68.2 1,043.5 $78.9 46.0 $10.7
Dis tr ic t of Columbia Public Schools | A pr il 2015 Page 23 of 23
FISCAL YEAR 2016 DCPS SCHOOL BUDGET OVERVIEW
School Budget Resources
DCPS Interactive Data Center www.DCPSDataCenter.com
To foster greater understanding of how student enrollment and school funding interact, DCPS created a series of
interactive dashboards. These dashboards provide a range of tools, from a broad overview of FY16 budget
allocations to an analysis of how a school budgets as compared to all other schools like it.
DCPS School Budget Development Guide www.DCPSSchoolBudgetGuide.com
This year the Budget Guide was designed as an interactive, searchable version published as a website. The
website is the definitive version for all FY16 budget guidance. A traditional PDF version of the budget guide is
also available at this website.