Embed Size (px)
Citation preview
18
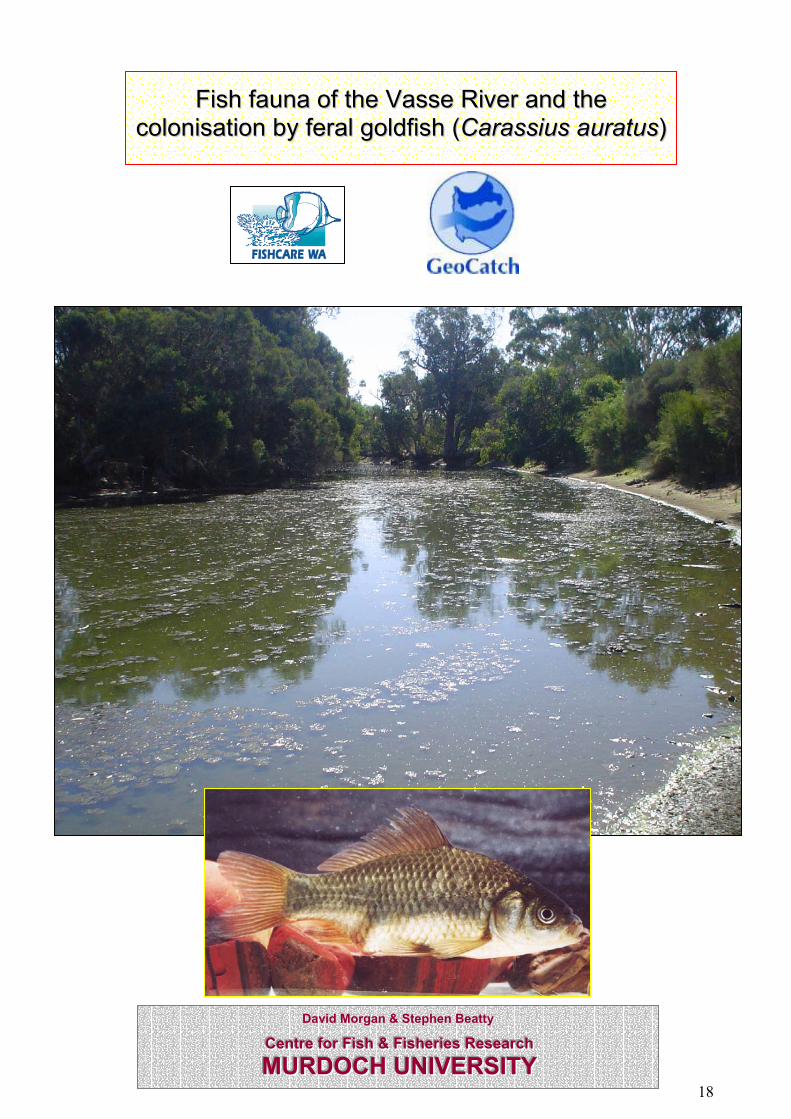
David Morgan & Stephen Beatty
CCCeeennntttrrreee fffooorrr FFFiiissshhh &&& FFFiiissshhheeerrriiieeesss RRReeessseeeaaarrrccchhh MMMUUURRRDDDOOOCCCHHH UUUNNNIIIVVVEEERRRSSSIIITTTYYY
FFiisshh ffaauunnaa ooff tthhee VVaassssee RRiivveerr aanndd tthhee ccoolloonniissaattiioonn bbyy ffeerraall ggoollddffiisshh ((CCaarraassssiiuuss aauurraattuuss))
2
Contents
PROJECT SUMMARY ................................................................................................................................... 3
INTRODUCTION................................................................................................................................................ 4
Threats to the native freshwater fishes of the south-west.................................................................................. 4
The Vasse River ............................................................................................................................................................. 5
MATERIALS AND METHODS ............................................................................................................... 7
Sampling sites and environmental variables ........................................................................................................ 7
Sampling of fish fauna ................................................................................................................................................. 7
Fish surveys ........................................................................................................................................................................ 7
Goldfish .............................................................................................................................................................................. 8
RESULTS AND DISCUSSION .................................................................................................................. 9
Environmental variables and sampling sites ........................................................................................................ 9
Fish fauna of the Vasse River.................................................................................................................................. 14
Goldfish.......................................................................................................................................................................... 25
Distribution in Western Australia ..................................................................................................................................... 25
Goldfish or carp? Identification........................................................................................................................................ 26
Distribution of goldfish in the Vasse River ...................................................................................................................... 26
Population structure and growth of goldfish in the Vasse River ...................................................................................... 27
Diets and ecological impact of goldfish in the Vasse River ............................................................................................. 30
SUMMARY AND RECOMMENDATIONS .................................................................................. 32
ACKNOWLEDGEMENTS......................................................................................................................... 33
REFERENCES..................................................................................................................................................... 34
3
Project summary During December 2003 and March 2004 a total of 7895 fish from nine species were captured during a survey
of the Vasse River, including two sites in the Vasse River Diversion Drain. Of the fish captured, four were
native freshwater fishes that are endemic to the south-west, three were native estuarine species and two were
introduced fishes. Two estuarine species dominated the native catches with the western hardyhead
(Leptatherina wallacei) being captured at the most downstream sites and the Swan River goby
(Pseudogobius olorum) being captured throughout the river aside from the upper-most headwater site. The
endemic western pygmy perch (Edelia vittata) was also widely distributed in the river, however, it was
captured in relatively low numbers aside from immediately downstream of the Diversion Drain at a site with
more complex in-stream and riparian habitat. The western minnow (Galaxias occidentalis) and nightfish
(Bostockia porosa) were only captured in relatively low numbers at two sites each in the lower Vasse River.
This study also captured the rare mud minnow (Galaxiella munda) at the headwater site, which is the first
record of this species in the Vasse River.
The Vasse River is generally heavily modified and two introduced feral species, the mosquitofish
(Gambusia holbrooki) and goldfish (Carassius auratus) have become established and accounted for over
60% of all fish captures. These species were particularly dominant in more degraded reaches of the river,
such as the Diversion Drain and the lower Vasse River. The goldfish were captured in the lower Vasse
River, between the Diversion Drain and immediately below the Old Butter Factory slot-boards. This stretch
of the river has essentially become a heavily silted, stagnant pool due to the restriction of flow from the
Diversion Drain and the presence of slot-boards, which together prevent adequate flushing of the system and
that is likely to have facilitated the establishment of the feral species, as well as exacerbating algal blooms.
It is suggested that the introduction of goldfish into the Vasse River is relatively recent and the
dominance of juveniles born in October last year will result in a rapid increase in the population in the next
few years. Growth rates of goldfish in the Vasse River far exceed those reported elsewhere with individuals
attaining lengths of over 180 mm TL at the end of their first year, the age at which they also mature.
Goldfish are known to be vectors for disease introduction, may prey on native fish and their eggs and larvae,
reduce aquatic plant biomass and re-suspend nutrients further fuelling algal blooms. Furthermore, recent
studies have demonstrated that significant growth of cyanobacteria is stimulated by the passage through
goldfish intestines. Goldfish, which attained lengths of over 40 cm in the Vasse River, therefore have the
potential to contribute to algal blooms.
It is recommended that flushing of the river could occur by removal of the slot-boards at the Old
Butter Factory and diverting flows from the Diversion Drain back into the river, thus attempting to return
environmental flows to a more natural regime. Riparian vegetation should also continue to occur in this
stretch of the River with estuarine species able to tolerate the higher salinities expected to occur as the River
returns to a more natural, estuarine system.
A goldfish eradication program should be implemented in the lower Vasse River. This program
would also provide an excellent opportunity to gain further information on their biology and ecological
impact in the system, particularly with regard to their role in algal blooms. An education program should
also be implemented outlining the problems caused by releasing aquarium fish into wild aquatic systems.
4
Introduction Threats to the native freshwater fishes of the south-west The freshwater fish fauna of the south-west of Western Australia, although not rich in number, is
highly unique with eight of the ten species being found nowhere else (Morgan et al. 1998). The
uniqueness of the aquatic fauna is also reflected in the freshwater crayfish of the region with all 11
species being endemic (Austin and Knott 1996; Horwitz and Adams 2000).
Perhaps due to their small size, the native freshwater fishes are relatively poorly appreciated
with none of the species, aside from the freshwater cobbler (Tandanus bostocki), providing angling
opportunities. A number of introduced freshwater fish species have become established in this
State and many have deleterious impacts on native species. Relatively large, predatory introduced
species have been translocated into aquatic systems in this region for the purpose of angling, i.e.
rainbow trout (Oncorhynchus mykiss), brown trout (Salmo trutta) and redfin perch (Perca
fluviatilis). These species are known to predate heavily on native freshwater fish and crayfish,
particularly redfin perch (e.g. Morgan et al. 2002, in press). Another notable feral species,
introduced for the purpose of mosquito control, is the mosquitofish (Gambusia holbrooki). This
species originates from North America and, due to its widespread liberation, is now one of the most
widely distributed freshwater fishes in the world. It is also an aggressive species that fin-nips native
species (Gill et al. 1999) and attains very high densities via a highly effective live-bearing
reproductive strategy which involves reaching maturity early in life and having an extended
spawning period.
A number of aquarium species have also been released and have become established in wild
aquatic systems in this region. Perhaps most notably, the goldfish (Carassius auratus) is found in a
number of systems, particularly lakes and slow moving waterways, such as irrigation drains that
traverse the Swan Coastal Plain (see Figure 16). This relatively large species is a known detrital
feeder and may alter the benthic habitat of aquatic systems through its feeding behaviour. The
impact of these introduced species on native aquatic species in this region is increasingly being
recognised, but is poorly understood.
In addition to introduced fishes, there exist other considerable threats to this highly endemic
fish fauna associated with habitat degradation (such as salinisation, eutrophication, and destruction
of riparian vegetation) and barriers to fish migration (in particular dams, gauging weirs and
drainage canals). For example, the alteration of rivers as they traverse the Swan Coastal Plain from
the Darling Scarp for irrigation and flood control has involved: straightening of natural stream
meanders; the formation of diversion drains; steepening of banks; placement of barriers in the form
of slot-boards; and removal of native riparian vegetation and in-stream structures. These actions
result in homogeneity of aquatic habitat that differ widely from the natural stream form and create a
highly disturbed aquatic system that favours introduced aquatic species, often to the detriment of
5
native species. Recent work has established that native fish species, such as the western pygmy
perch (Edelia vittata), western minnow (Galaxias occidentalis) and the nightfish (Bostockia
porosa), in these systems persist only in the limited areas of favourable habitat (such as deep pools
with structure) whilst the numerically dominant introduced mosquitofish and goldfish have no such
preference, being found in less diverse, ‘typical’ drain habitats (Morgan and Beatty 2003).
Introduced teleost species may have serious impacts on aquatic ecosystems including;
habitat alteration; introduction of disease; competition for resources with native fish species;
predation and agonistic impacts on native fish species. For example, predation on native fish and
freshwater crayfish (by rainbow trout, brown trout and redfin perch) and fin-nipping native fish
species (by mosquitofish) have been previously described (Gill et al. 1999, Morgan et al. 2002,
Morgan and Beatty 2003). However, there has been a relative paucity of research into the impacts
of these species on the overall aquatic ecosystems in this region. Virtually nothing is known on the
impacts of goldfish in Australia.
The Vasse River The Vasse River is approximately 45 km long encompassing a catchment of approximately 270
km2, however approximately 60% of the catchment is cleared and heavily modified, with much of
the flows diverted to drainage canals for flood mitigation (Pen 1997). Much of the Vasse-
Wonnerup estuarine lagoon, which is roughly 1.5km wide and runs for 25km behind narrow coastal
dunes covering an area of 1000ha is cleared and the hydrology has been largely modified by
drainage and tidal barriers and is threatened by eutrophication with the system no longer
functioning as an estuary (Jaensch and Lane 1993, Pen 1997). Regardless, the system still provides
important habitat for waterbirds and is listed as a Ramsar Wetland of International Importance
(Jaensch and Lane 1993, Pen 1997). In appreciation of the importance of natural stream
morphology and riparian vegetation in creating healthy stream ecosystems, the Lower Vasse River
Cleanup Program, coordinated by the Geographe Catchment Council, has incorporated reshaping
and revegetation of the bed and banks of the Lower Vasse River while also conducting Phoslock™
trials to reduce dissolved phosphorus and thereby attempt to reduced blue-green algal
(cyanobacteria) blooms in the river (Goss and Greenop 2003). During this work, the reported
sightings and capture of feral fish such as goldfish and mosquitofish in the Vasse River has
increased considerably in recent years.
As part of a wider Vasse River rehabilitation program, there was thus a need for a
comprehensive fish survey of the lower Vasse River to ascertain the distribution and abundances of
endemic and introduced fishes. The lower Vasse River between the slot-boards at the Old Butter
Factory and the Vasse River Diversion Drain, has effectively become a stagnant reservoir and the
6
sampling regime was designed to determine what impact this has had on the fish fauna compared
with upstream of this reach of the river and to a lesser extent the Vasse River Diversion Drain.
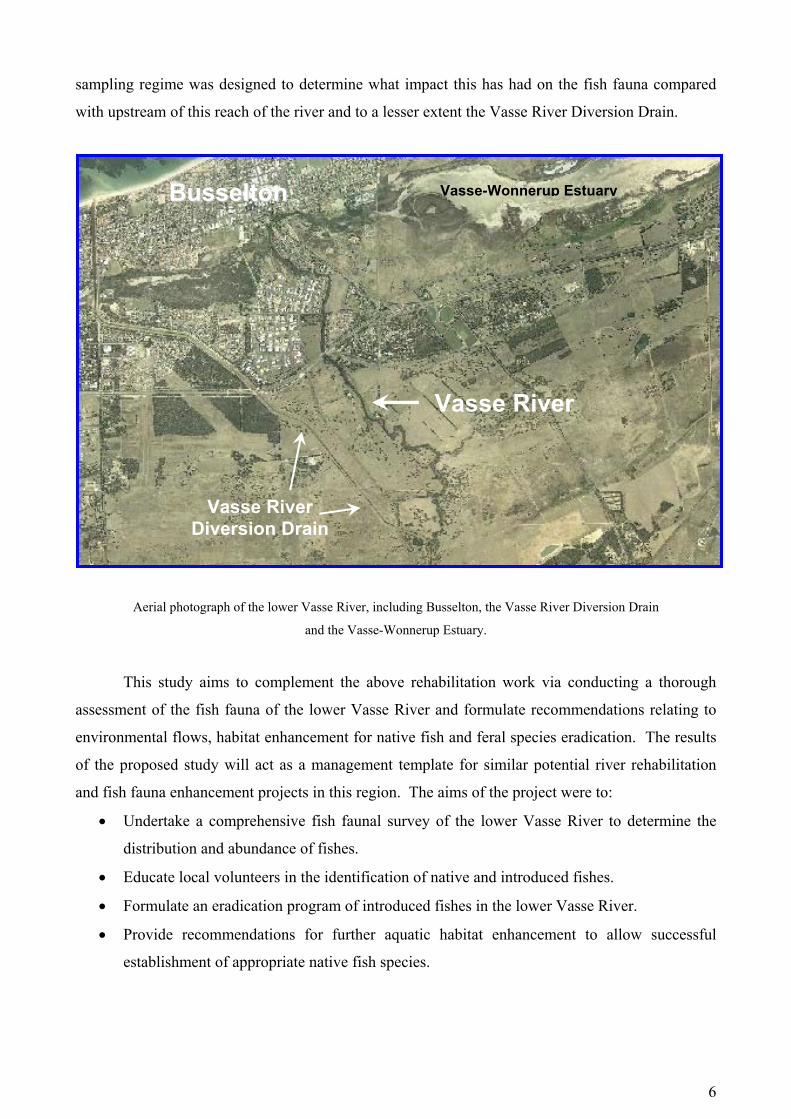
Aerial photograph of the lower Vasse River, including Busselton, the Vasse River Diversion Drain
and the Vasse-Wonnerup Estuary.
This study aims to complement the above rehabilitation work via conducting a thorough
assessment of the fish fauna of the lower Vasse River and formulate recommendations relating to
environmental flows, habitat enhancement for native fish and feral species eradication. The results
of the proposed study will act as a management template for similar potential river rehabilitation
and fish fauna enhancement projects in this region. The aims of the project were to:
• Undertake a comprehensive fish faunal survey of the lower Vasse River to determine the
distribution and abundance of fishes.
• Educate local volunteers in the identification of native and introduced fishes.
• Formulate an eradication program of introduced fishes in the lower Vasse River.
• Provide recommendations for further aquatic habitat enhancement to allow successful
establishment of appropriate native fish species.
Vasse River Diversion Drain
Vasse River
BBuusssseellttoonn Vasse-Wonnerup Estuary
7
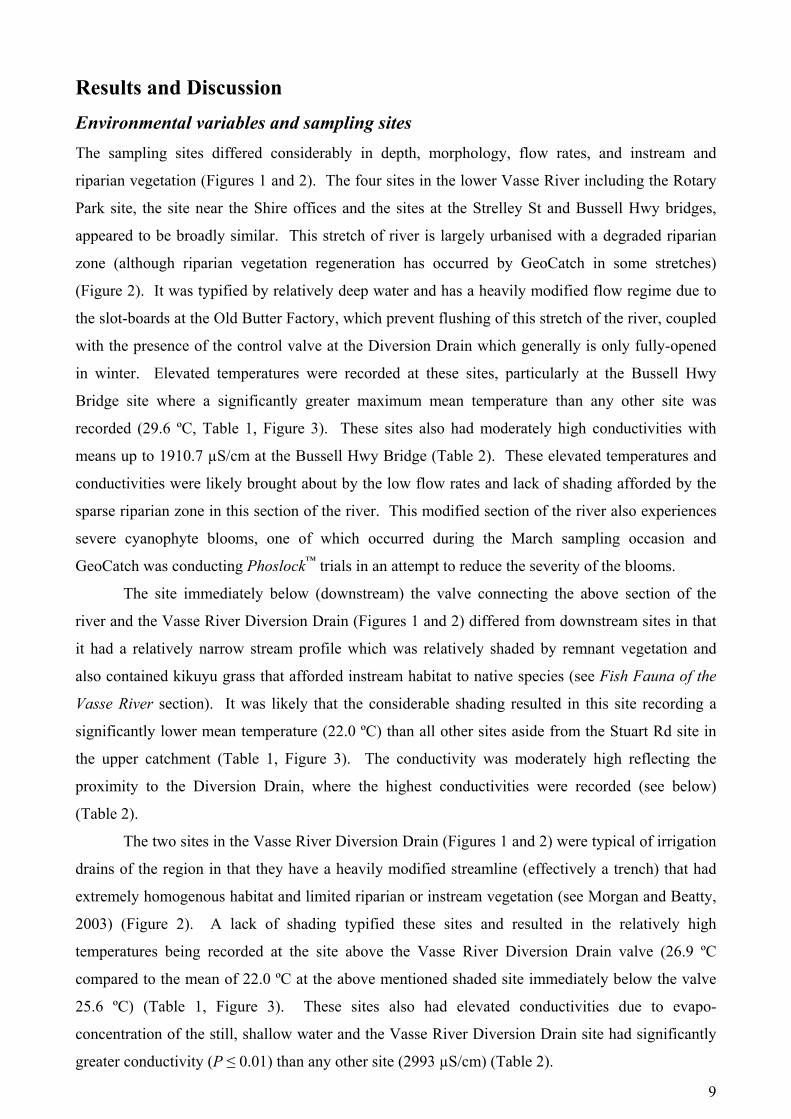
Materials and methods Sampling sites and environmental variables An initial sampling occasion occurred in December 2003 in the lower Vasse River. Four sites were
selected as far downstream as immediately below the slot-boards at the Old Butter Factory and
upstream to the Busselton Shire Offices (Figure 1). Due to the relatively high water levels at that
time (as the slot-boards remained inserted at the Old Butter Factory), which reduces the
effectiveness of the sampling methodologies, this was treated as an exploratory survey to determine
the species present in this section of the river and to determine appropriate methodologies for the
subsequent more intensive sampling occasion, in March, 2004.
The major sampling occasion in March involved two major methods: the first involved
intensively sampling a total of seven sites distributed from below the Old Butter Factory slot-boards
(sampled as part of the initial survey) to as far upstream as the waterpoint near Chapman Hill Rd, in
the extreme upper catchment of the Vasse River (Figure 1). This sampling also included sites in the
Vasse River Diversion Drain, and was designed to compare fish fauna in the lower Vasse River
with that in the Diversion Drain and the more natural, less modified upper reaches. The second
sampling method was designed to survey the distribution of goldfish and attempt to remove as
many as possible from the lower Vasse River.
The water temperature and conductivity of each site was measured at the bottom of the
water column at three locations. The latitude and longitude of each site was recorded with the use
of a hand held GPS and maps of sampling sites created using the MapInfo™ program.
Sampling of fish fauna Fish surveys
Sampling of fish as part of the broad survey of the river involved the use of 5 and 10 m seine nets
(mesh widths 3 mm, fished to a depth of 1.5 m) and the use of a back-pack electrofisher (Smith Root
model 12-A) which momentarily stuns the fish. Each fish was identified to species and abundances
determined. The mean density (± 1 S.E.) of each species at each site was determined using the
formula:
D = N / A
where D is the density of each fish species at each site, N is the number of fish captured at each site
and A is the area sampled at each site.
8
Goldfish
As the lower Vasse River is a large body of water relative to upstream reaches due to slot board
insertion and the Vasse River Diversion Drain, an alternate method was used to capture as many
goldfish as possible. This involved the use of a 240 volt, generator powered electrofisher deployed
from a boat from ~500 m upstream of the Bussell Hwy Bridge to immediately downstream of the
Old Butter Factory slot boards (Figure 2). The latitude and longitude of each goldfish capture was
recorded using a GPS and a map of the distribution of goldfish captures was produced using the
MapInfo™ program (see Figure 18).
Each goldfish captured was placed immediately in an ice slurry and, upon return to the
laboratory, measured to the nearest 1 mm total length (TL) and weighed to the nearest 1 mg. A
length-weight relationship was produced via testing a number of models and the one that provided
the greatest R2 value adopted as the best fit of the data. The guts of a sub-sample of 20 goldfish
from a wide size range were removed and the contents classified into a number of prey categories.
The frequency of occurrence and points method (Ball 1961, Hynes 1950) was used to determine the
frequency of occurrence of each prey category in the guts of goldfish and the relative contribution
(by volume) of each prey category to their diet.
The number of translucent zones of the otoliths (ear bones) is commonly used to determine
the age of fish as they are generally laid down annually as a consequence of seasonal variations in
water temperature, day-length etc, in much the same way that trees develop growth rings. As there
appeared to be distinct cohorts of goldfish present in our samples (see Figure 19), the otoliths of
each goldfish in the sub-sample were removed and viewed though a dissecting microscope using
reflected light. The number of translucent zones was counted and it was assumed that these
corresponded to year classes (while not specifically validated, this technique has been validated for
the majority of native freshwater fishes in south-western Australia and also for an introduced fish
(e.g. Morgan et al. 1995, 2000, 2002)). A length-frequency distribution was produced separately
for those goldfish captured in December and those electrofished during March, and was split for
each year class, based on age from otoliths (see Figure 19).
The length of each individual was plotted against its age and a preliminary growth curve
was fitted using a von Bertalanffy curve with October 1 as an estimated birth date. This estimate
was made from the small size of individuals captured in December and from the capture of larval
(newly-hatched) goldfish in other parts of south-western Australia, specifically, North Lake, during
early spring. The von Bertalanffy growth curve is Lt = L∞[1-E-K(t-t0
)], where Lt is the length at age t
(years), L∞ is the asymptotic length of the population, K is the growth coefficient and t0 is the
hypothetical age at which the fish would have zero length.
9
Results and Discussion Environmental variables and sampling sites The sampling sites differed considerably in depth, morphology, flow rates, and instream and
riparian vegetation (Figures 1 and 2). The four sites in the lower Vasse River including the Rotary
Park site, the site near the Shire offices and the sites at the Strelley St and Bussell Hwy bridges,
appeared to be broadly similar. This stretch of river is largely urbanised with a degraded riparian
zone (although riparian vegetation regeneration has occurred by GeoCatch in some stretches)
(Figure 2). It was typified by relatively deep water and has a heavily modified flow regime due to
the slot-boards at the Old Butter Factory, which prevent flushing of this stretch of the river, coupled
with the presence of the control valve at the Diversion Drain which generally is only fully-opened
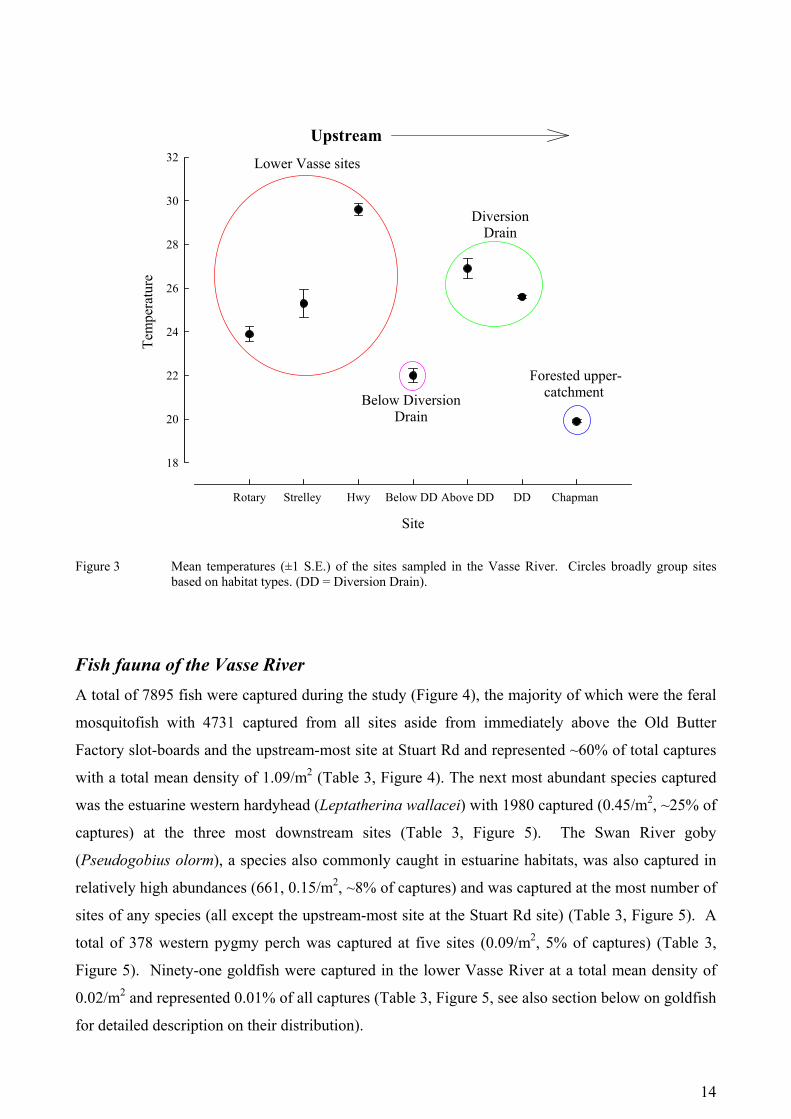
in winter. Elevated temperatures were recorded at these sites, particularly at the Bussell Hwy
Bridge site where a significantly greater maximum mean temperature than any other site was
recorded (29.6 ºC, Table 1, Figure 3). These sites also had moderately high conductivities with
means up to 1910.7 µS/cm at the Bussell Hwy Bridge (Table 2). These elevated temperatures and
conductivities were likely brought about by the low flow rates and lack of shading afforded by the
sparse riparian zone in this section of the river. This modified section of the river also experiences
severe cyanophyte blooms, one of which occurred during the March sampling occasion and
GeoCatch was conducting Phoslock™ trials in an attempt to reduce the severity of the blooms.
The site immediately below (downstream) the valve connecting the above section of the
river and the Vasse River Diversion Drain (Figures 1 and 2) differed from downstream sites in that
it had a relatively narrow stream profile which was relatively shaded by remnant vegetation and
also contained kikuyu grass that afforded instream habitat to native species (see Fish Fauna of the
Vasse River section). It was likely that the considerable shading resulted in this site recording a
significantly lower mean temperature (22.0 ºC) than all other sites aside from the Stuart Rd site in
the upper catchment (Table 1, Figure 3). The conductivity was moderately high reflecting the
proximity to the Diversion Drain, where the highest conductivities were recorded (see below)
(Table 2).
The two sites in the Vasse River Diversion Drain (Figures 1 and 2) were typical of irrigation
drains of the region in that they have a heavily modified streamline (effectively a trench) that had
extremely homogenous habitat and limited riparian or instream vegetation (see Morgan and Beatty,
2003) (Figure 2). A lack of shading typified these sites and resulted in the relatively high
temperatures being recorded at the site above the Vasse River Diversion Drain valve (26.9 ºC
compared to the mean of 22.0 ºC at the above mentioned shaded site immediately below the valve
25.6 ºC) (Table 1, Figure 3). These sites also had elevated conductivities due to evapo-
concentration of the still, shallow water and the Vasse River Diversion Drain site had significantly
greater conductivity (P ≤ 0.01) than any other site (2993 µS/cm) (Table 2).
10
Much of the upper Vasse River was dry during the March sampling occasion (Figure 2),
however, the Stuart Rd site (Figure 1), which is a fire-fighting waterpoint, would connect during
winter. The upper reaches of the Vasse River is a stream that passes through State Forrest and
agricultural land and, for the most part, the stream has a degree of natural remnant riparian
vegetation affording heavy shading and heterogenous instream habitat (Figure 2). The Stuart Rd site
therefore had considerable riparian vegetation and the lowest recorded mean temperatures of any
site sampled (19.9 ºC) (Table 1, Figure 3). This site was also significantly fresher than all others
sampled with a mean conductivity of 357.3 µS/cm (Table 2).
Figure 1 Sites sampled for fish in the Vasse River and in the Vasse River Diversion Drain.
Vasse River
WesternAustralia
Busselton
0 5 km
Vasse River Diversion Drain
11
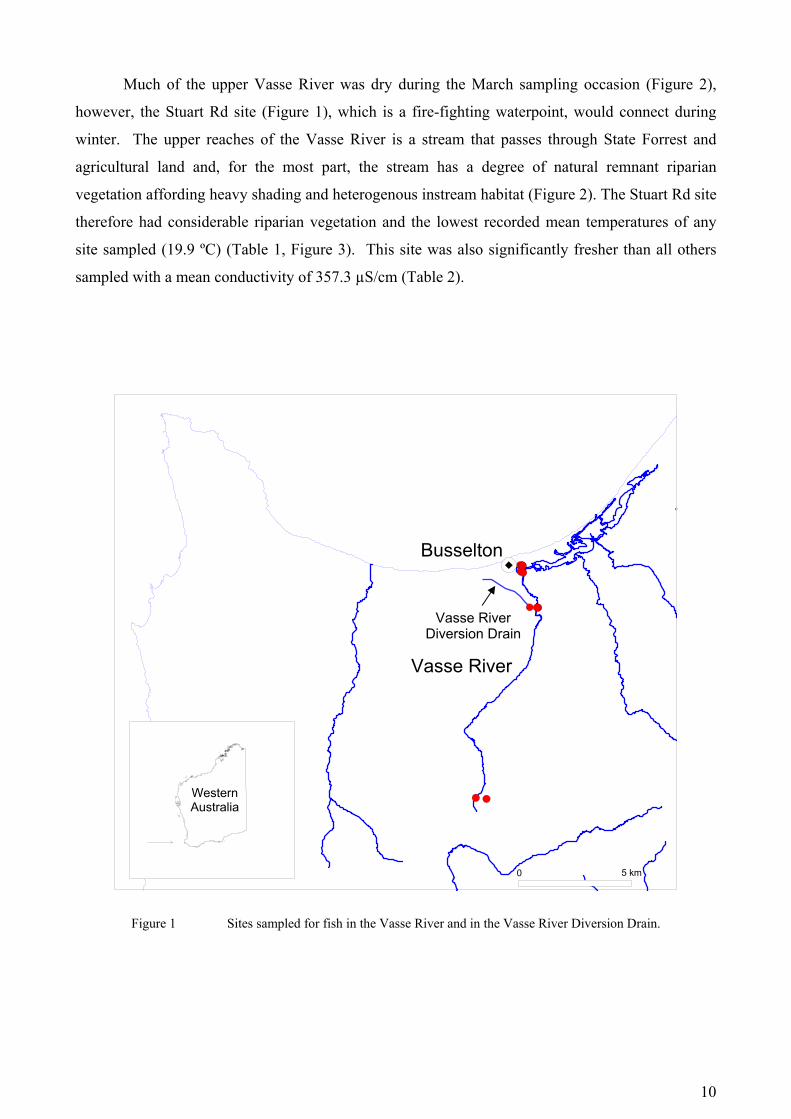
Figure 2 A-D. Seine netting and electrofishing at slot boards at Old Butter Factory; E. Strelley St Bridge; F-G.
Electrofishing upstream of Bussell Hwy Bridge; H. Junction of Vasse River and Diversion Drain; I. Diversion Drain; J. Upper Vasse River waterpoint where mud minnows were captured. N.B. Lack of riparian vegetation in the lower Vasse River and Diversion Drain sites.
A
B
C
D
E
F
H
G
J
I
12
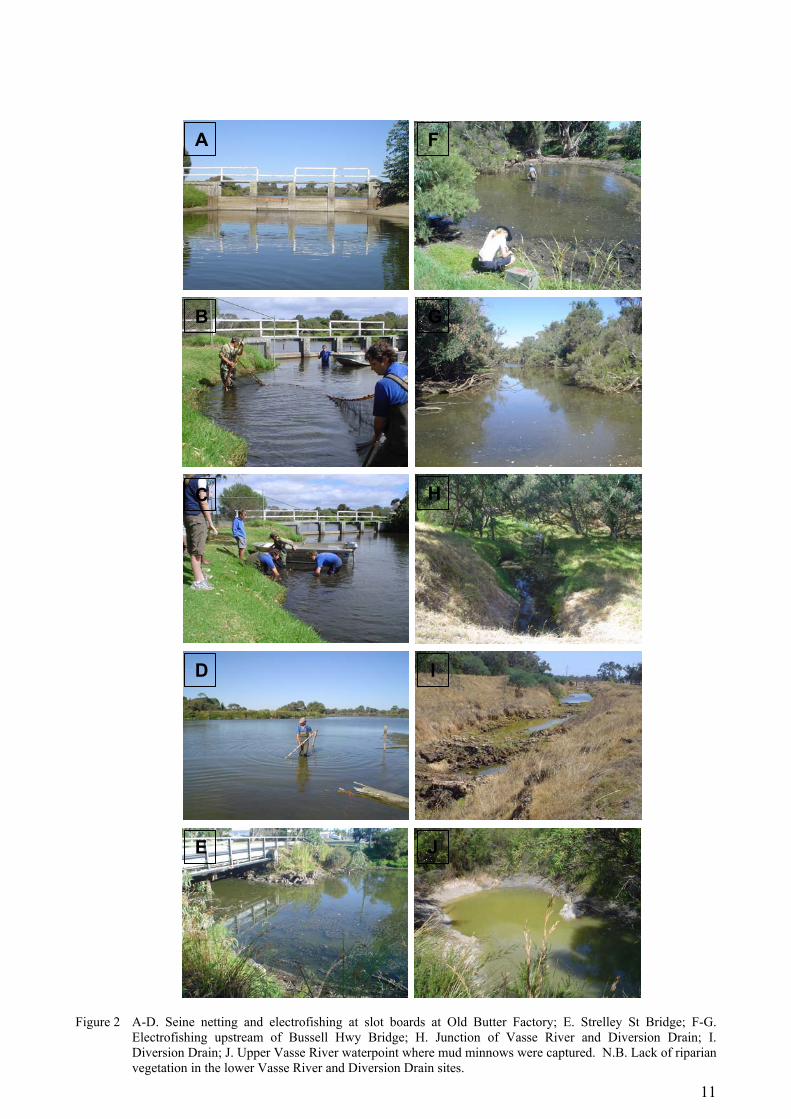
Table 1 Mean temperatures at each sampling site in the Vasse River in March 2003 (++ Rotary Park recorded in December). Significant differences between sites (ANOVAs) are shown: ns = not significantly different, * = P≤ 0.05, ** = P≤ 0.01.
Increasing distance upstream
Sites Rotary Park ++
Strelley St Bridge
Bussell Hwy Bridge
Below Vasse Diversion Drain valve
Above Vasse Diversion Drain valve
Vasse Diversion Drain
Stuart Rd
Temperatures (±1 S.E)
23.9 (±0.35)
25.3 (±0.62)
29.6 (±0.29)
22.0 (±0.33)
26.9 (±0.45)
25.6 (±0.08)
19.9 (±0.07)
Rotary Park ++ 23.9 (±0.35) -
Strelley St Bridge
25.3 (±0.62) ns -
Bussell Hwy Bridge
29.6 (±0.29)
** ** -
Below Diversion Drain valve
22.0 (±0.33)
* ** ** -
Vasse Diversion Drain above valve
26.9 (±0.45)
** ns ** ** -
Vasse Diversion Drain
25.6 (±0.08)
ns ns ** ** ns -
Increasing distance
upstream ↓
Stuart Rd 19.9 (±0.07)
** ** ** * ** ** -
13
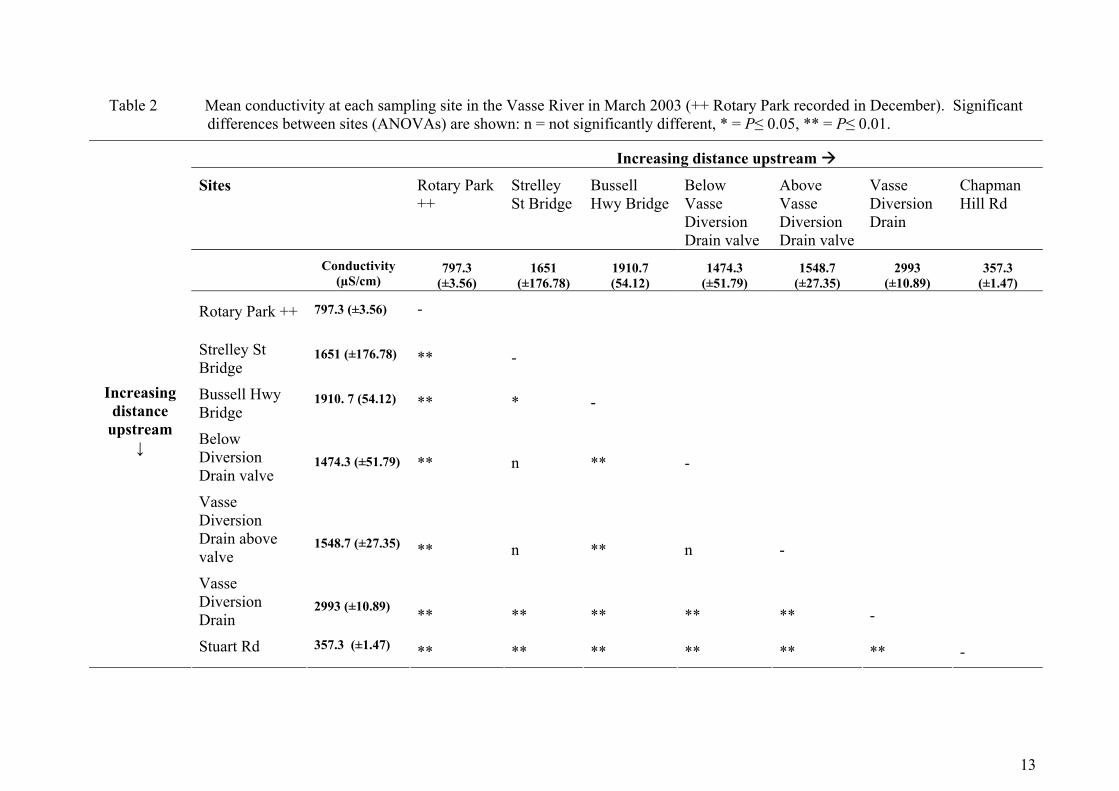
Table 2 Mean conductivity at each sampling site in the Vasse River in March 2003 (++ Rotary Park recorded in December). Significant differences between sites (ANOVAs) are shown: n = not significantly different, * = P≤ 0.05, ** = P≤ 0.01.
Increasing distance upstream
Sites Rotary Park ++
Strelley St Bridge
Bussell Hwy Bridge
Below Vasse Diversion Drain valve
Above Vasse Diversion Drain valve
Vasse Diversion Drain
Chapman Hill Rd
Conductivity (µS/cm)
797.3 (±3.56)
1651 (±176.78)
1910.7 (54.12)
1474.3 (±51.79)
1548.7 (±27.35)
2993 (±10.89)
357.3 (±1.47)
Rotary Park ++ 797.3 (±3.56) -
Strelley St Bridge
1651 (±176.78) ** -
Bussell Hwy Bridge
1910. 7 (54.12) ** * -
Below Diversion Drain valve
1474.3 (±51.79) ** n ** -
Vasse Diversion Drain above valve
1548.7 (±27.35) ** n ** n -
Vasse Diversion Drain
2993 (±10.89) ** ** ** ** ** -
Increasing distance
upstream ↓
Stuart Rd 357.3 (±1.47) ** ** ** ** ** ** -
14
Site
Rotary Strelley Hwy Below DD Above DD DD Chapman
Tem
pera
ture
18
20
22
24
26
28
30
32 Lower Vasse sites
DiversionDrain
Forested upper-catchment Below Diversion
Drain
Upstream
Figure 3 Mean temperatures (±1 S.E.) of the sites sampled in the Vasse River. Circles broadly group sites
based on habitat types. (DD = Diversion Drain).
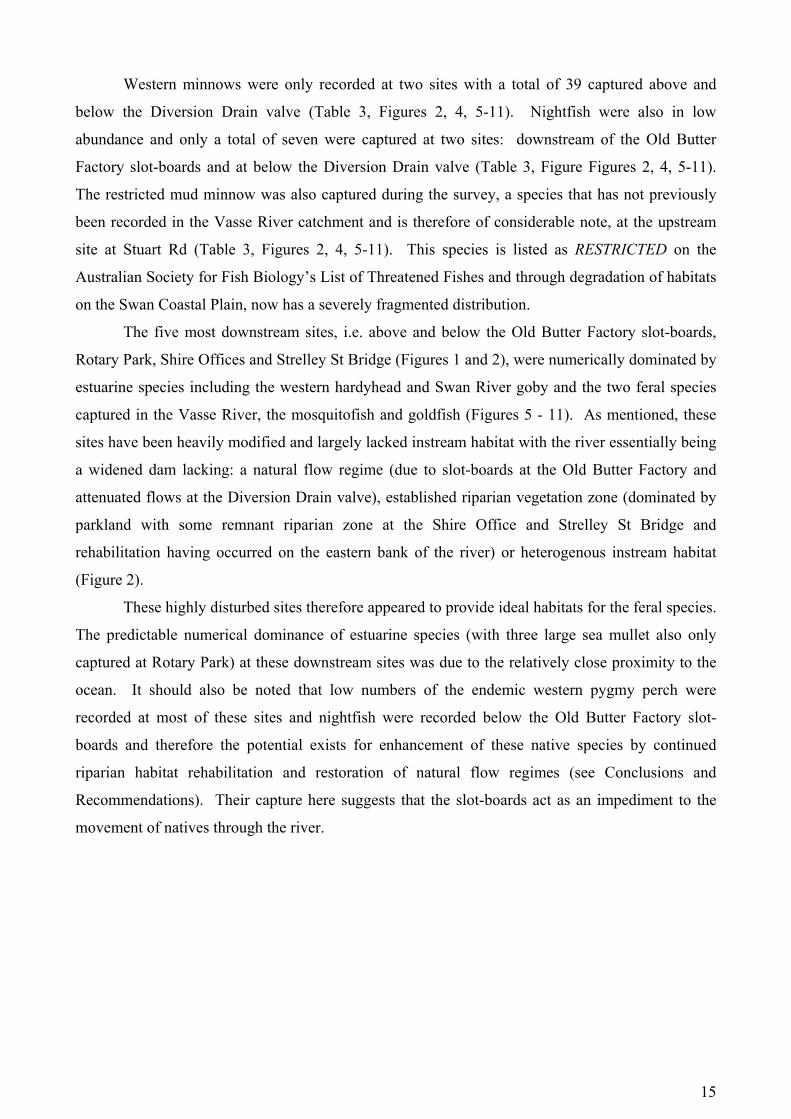
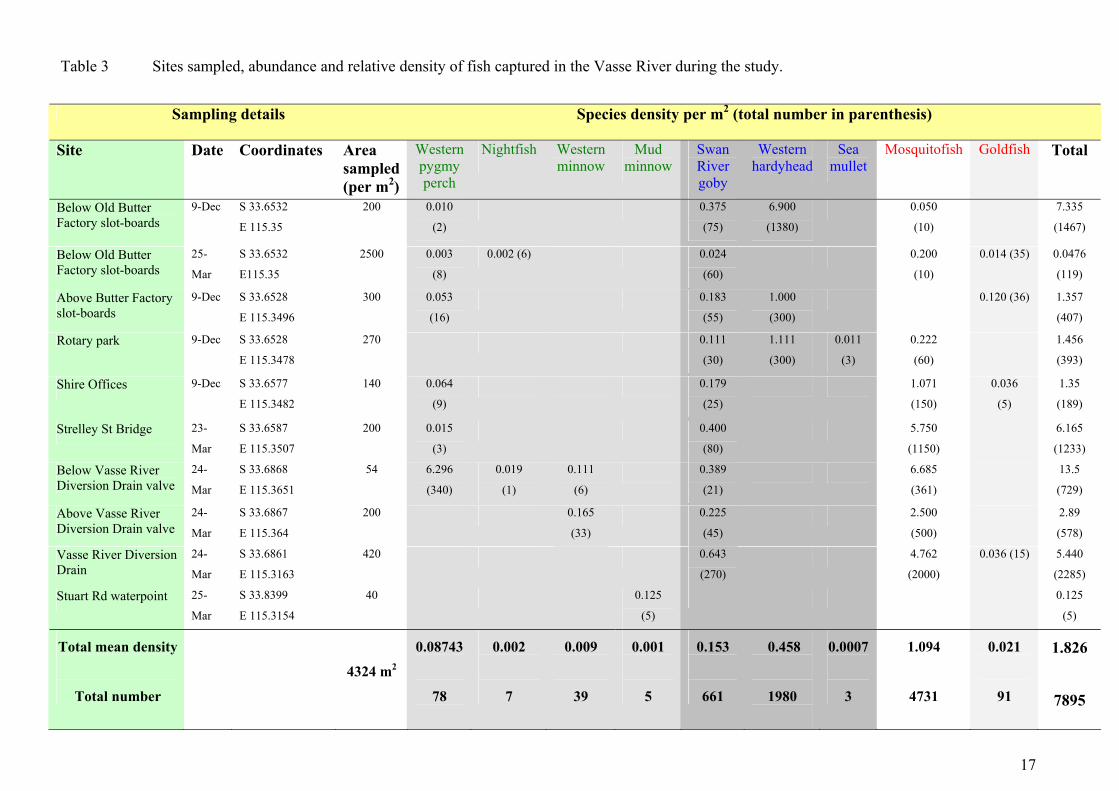
Fish fauna of the Vasse River A total of 7895 fish were captured during the study (Figure 4), the majority of which were the feral
mosquitofish with 4731 captured from all sites aside from immediately above the Old Butter
Factory slot-boards and the upstream-most site at Stuart Rd and represented ~60% of total captures
with a total mean density of 1.09/m2 (Table 3, Figure 4). The next most abundant species captured
was the estuarine western hardyhead (Leptatherina wallacei) with 1980 captured (0.45/m2, ~25% of
captures) at the three most downstream sites (Table 3, Figure 5). The Swan River goby
(Pseudogobius olorm), a species also commonly caught in estuarine habitats, was also captured in
relatively high abundances (661, 0.15/m2, ~8% of captures) and was captured at the most number of
sites of any species (all except the upstream-most site at the Stuart Rd site) (Table 3, Figure 5). A
total of 378 western pygmy perch was captured at five sites (0.09/m2, 5% of captures) (Table 3,
Figure 5). Ninety-one goldfish were captured in the lower Vasse River at a total mean density of
0.02/m2 and represented 0.01% of all captures (Table 3, Figure 5, see also section below on goldfish
for detailed description on their distribution).
15
Western minnows were only recorded at two sites with a total of 39 captured above and
below the Diversion Drain valve (Table 3, Figures 2, 4, 5-11). Nightfish were also in low
abundance and only a total of seven were captured at two sites: downstream of the Old Butter
Factory slot-boards and at below the Diversion Drain valve (Table 3, Figure Figures 2, 4, 5-11).
The restricted mud minnow was also captured during the survey, a species that has not previously
been recorded in the Vasse River catchment and is therefore of considerable note, at the upstream
site at Stuart Rd (Table 3, Figures 2, 4, 5-11). This species is listed as RESTRICTED on the
Australian Society for Fish Biology’s List of Threatened Fishes and through degradation of habitats
on the Swan Coastal Plain, now has a severely fragmented distribution.
The five most downstream sites, i.e. above and below the Old Butter Factory slot-boards,
Rotary Park, Shire Offices and Strelley St Bridge (Figures 1 and 2), were numerically dominated by
estuarine species including the western hardyhead and Swan River goby and the two feral species
captured in the Vasse River, the mosquitofish and goldfish (Figures 5 - 11). As mentioned, these
sites have been heavily modified and largely lacked instream habitat with the river essentially being
a widened dam lacking: a natural flow regime (due to slot-boards at the Old Butter Factory and
attenuated flows at the Diversion Drain valve), established riparian vegetation zone (dominated by
parkland with some remnant riparian zone at the Shire Office and Strelley St Bridge and
rehabilitation having occurred on the eastern bank of the river) or heterogenous instream habitat
(Figure 2).
These highly disturbed sites therefore appeared to provide ideal habitats for the feral species.
The predictable numerical dominance of estuarine species (with three large sea mullet also only
captured at Rotary Park) at these downstream sites was due to the relatively close proximity to the
ocean. It should also be noted that low numbers of the endemic western pygmy perch were
recorded at most of these sites and nightfish were recorded below the Old Butter Factory slot-
boards and therefore the potential exists for enhancement of these native species by continued
riparian habitat rehabilitation and restoration of natural flow regimes (see Conclusions and
Recommendations). Their capture here suggests that the slot-boards act as an impediment to the
movement of natives through the river.
16
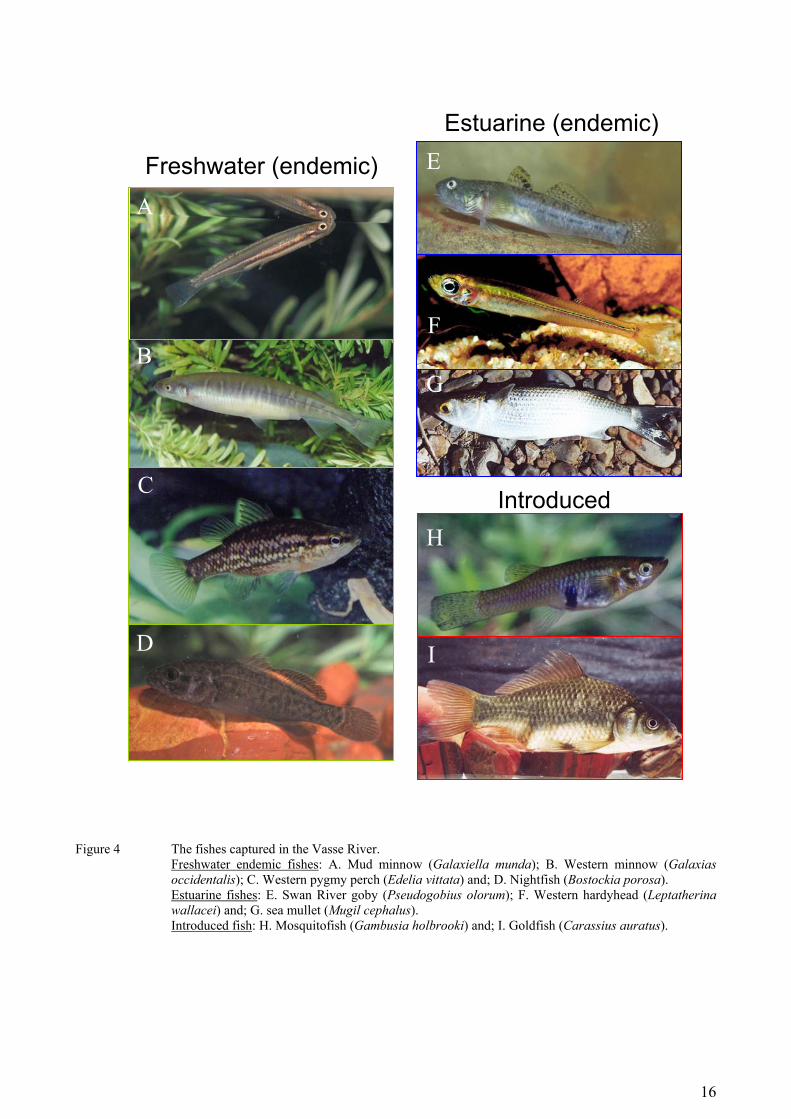
Figure 4 The fishes captured in the Vasse River.
Freshwater endemic fishes: A. Mud minnow (Galaxiella munda); B. Western minnow (Galaxias occidentalis); C. Western pygmy perch (Edelia vittata) and; D. Nightfish (Bostockia porosa). Estuarine fishes: E. Swan River goby (Pseudogobius olorum); F. Western hardyhead (Leptatherina wallacei) and; G. sea mullet (Mugil cephalus). Introduced fish: H. Mosquitofish (Gambusia holbrooki) and; I. Goldfish (Carassius auratus).
Freshwater (endemic)
Estuarine (endemic)
Introduced
A
B
C
D
E
G
H
F
G
I
17
Table 3 Sites sampled, abundance and relative density of fish captured in the Vasse River during the study.
Sampling details Species density per m2 (total number in parenthesis)
Site Date Coordinates Area sampled (per m2)
Western pygmy perch
Nightfish Western minnow
Mud minnow
Swan River goby
Western hardyhead
Sea mullet
Mosquitofish Goldfish Total
Below Old Butter Factory slot-boards
9-Dec S 33.6532
E 115.35
200 0.010
(2)
0.375
(75)
6.900
(1380)
0.050
(10)
7.335
(1467)
Below Old Butter Factory slot-boards
25-
Mar
S 33.6532
E115.35
2500 0.003
(8)
0.002 (6) 0.024
(60)
0.200
(10)
0.014 (35) 0.0476
(119)
Above Butter Factory slot-boards
9-Dec S 33.6528
E 115.3496
300 0.053
(16)
0.183
(55)
1.000
(300)
0.120 (36) 1.357
(407)
Rotary park 9-Dec S 33.6528
E 115.3478
270 0.111
(30)
1.111
(300)
0.011
(3)
0.222
(60)
1.456
(393)
Shire Offices 9-Dec S 33.6577
E 115.3482
140 0.064
(9)
0.179
(25)
1.071
(150)
0.036
(5)
1.35
(189)
Strelley St Bridge 23-
Mar
S 33.6587
E 115.3507
200 0.015
(3)
0.400
(80)
5.750
(1150)
6.165
(1233)
Below Vasse River Diversion Drain valve
24-
Mar
S 33.6868
E 115.3651
54 6.296
(340)
0.019
(1)
0.111
(6)
0.389
(21)
6.685
(361)
13.5
(729)
Above Vasse River Diversion Drain valve
24-
Mar
S 33.6867
E 115.364
200 0.165
(33)
0.225
(45)
2.500
(500)
2.89
(578)
Vasse River Diversion Drain
24-
Mar
S 33.6861
E 115.3163
420 0.643
(270)
4.762
(2000)
0.036 (15) 5.440
(2285)
Stuart Rd waterpoint 25-
Mar
S 33.8399
E 115.3154
40 0.125
(5)
0.125
(5)
Total mean density
Total number
4324 m2
0.08743
78
0.002
7
0.009
39
0.001
5
0.153
661
0.458
1980
0.0007
3
1.094
4731
0.021
91
1.826
7895
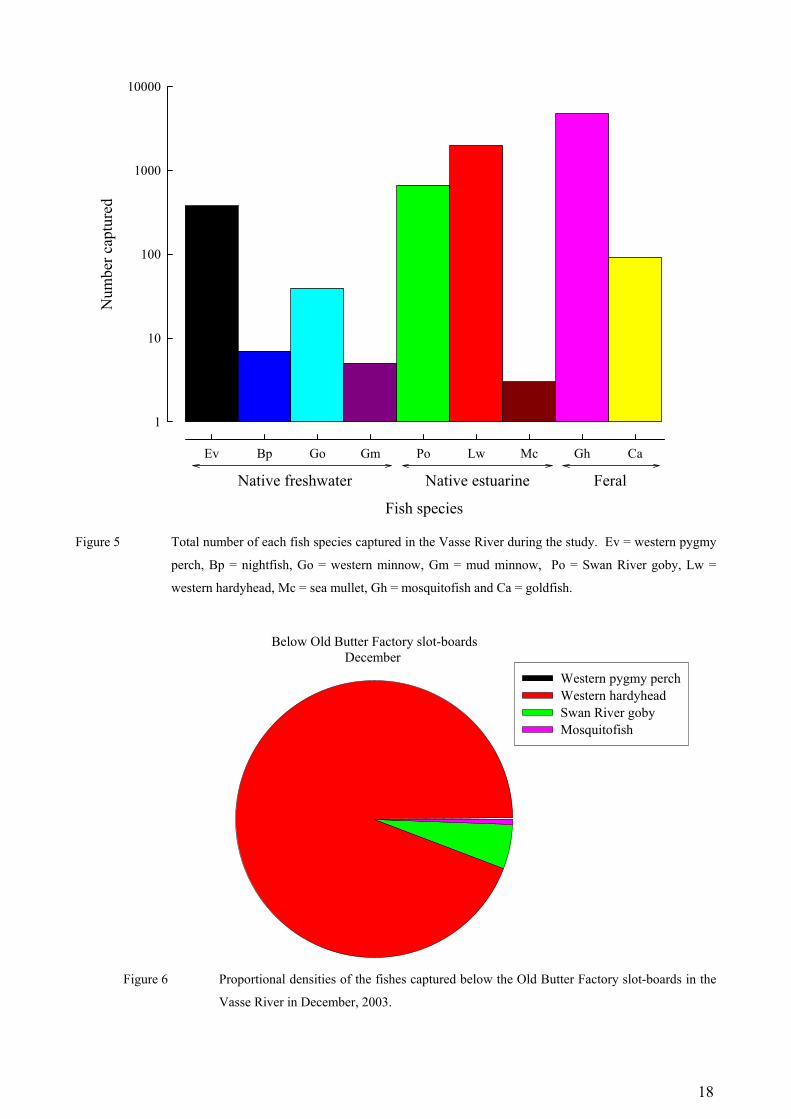
18
Fish species
Ev Bp Go Gm Po Lw Mc Gh Ca
Num
ber c
aptu
red
1
10
100
1000
10000
Native freshwater Native estuarine Feral
Figure 5 Total number of each fish species captured in the Vasse River during the study. Ev = western pygmy
perch, Bp = nightfish, Go = western minnow, Gm = mud minnow, Po = Swan River goby, Lw =
western hardyhead, Mc = sea mullet, Gh = mosquitofish and Ca = goldfish.
Below Old Butter Factory slot-boardsDecember
Western pygmy perchWestern hardyheadSwan River gobyMosquitofish
Figure 6 Proportional densities of the fishes captured below the Old Butter Factory slot-boards in the
Vasse River in December, 2003.
19
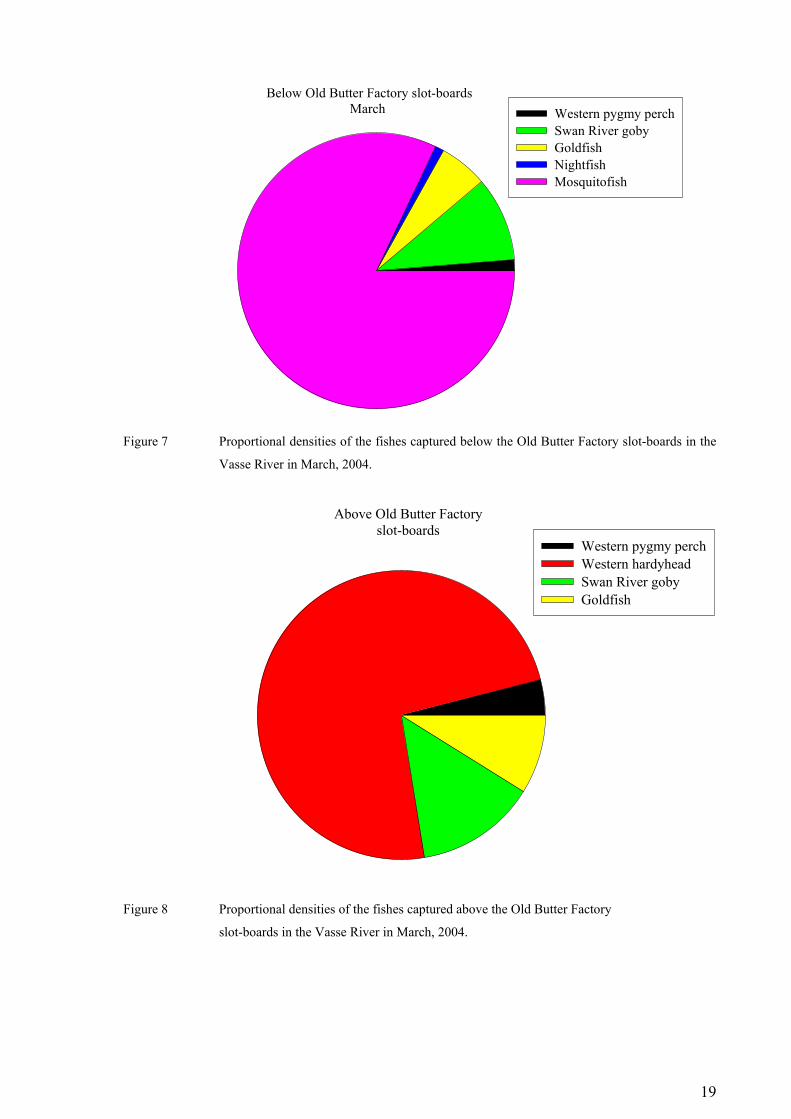
Below Old Butter Factory slot-boardsMarch Western pygmy perch
Swan River gobyGoldfishNightfishMosquitofish
Figure 7 Proportional densities of the fishes captured below the Old Butter Factory slot-boards in the
Vasse River in March, 2004.
Above Old Butter Factory slot-boards
Western pygmy perchWestern hardyheadSwan River gobyGoldfish
Figure 8 Proportional densities of the fishes captured above the Old Butter Factory
slot-boards in the Vasse River in March, 2004.
20
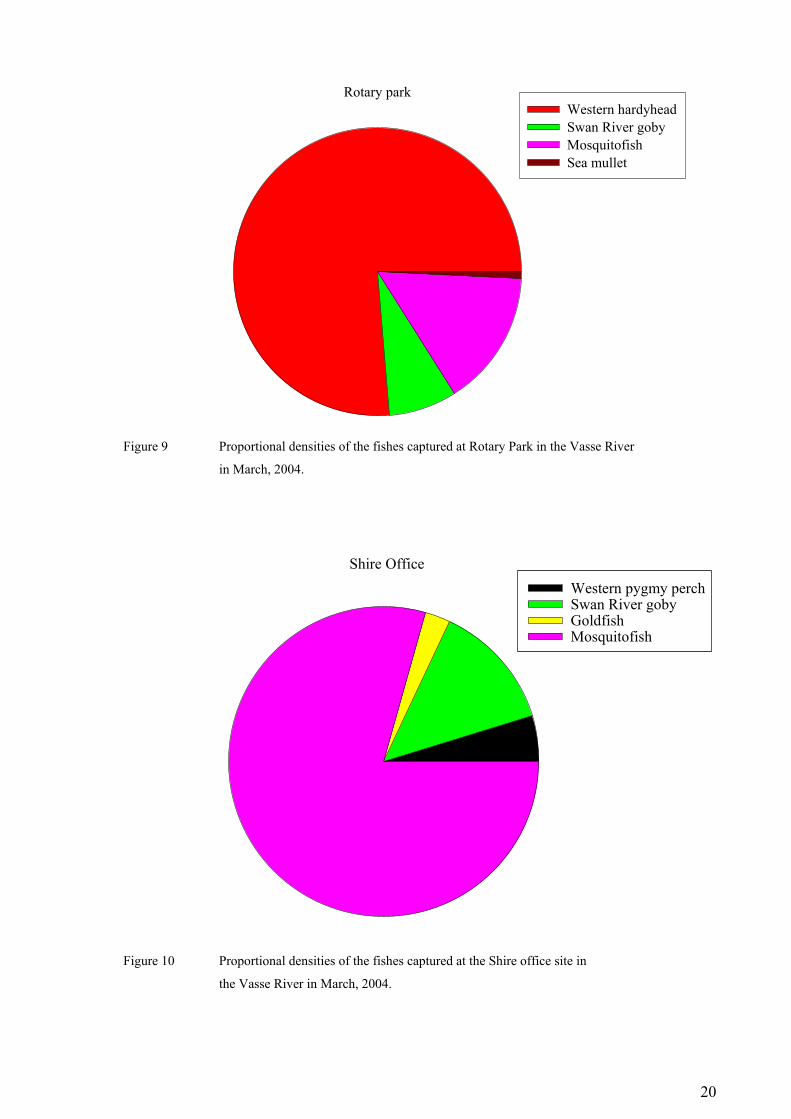
Rotary parkWestern hardyheadSwan River gobyMosquitofishSea mullet
Figure 9 Proportional densities of the fishes captured at Rotary Park in the Vasse River
in March, 2004.
Shire OfficeWestern pygmy perchSwan River gobyGoldfishMosquitofish
Figure 10 Proportional densities of the fishes captured at the Shire office site in
the Vasse River in March, 2004.
21
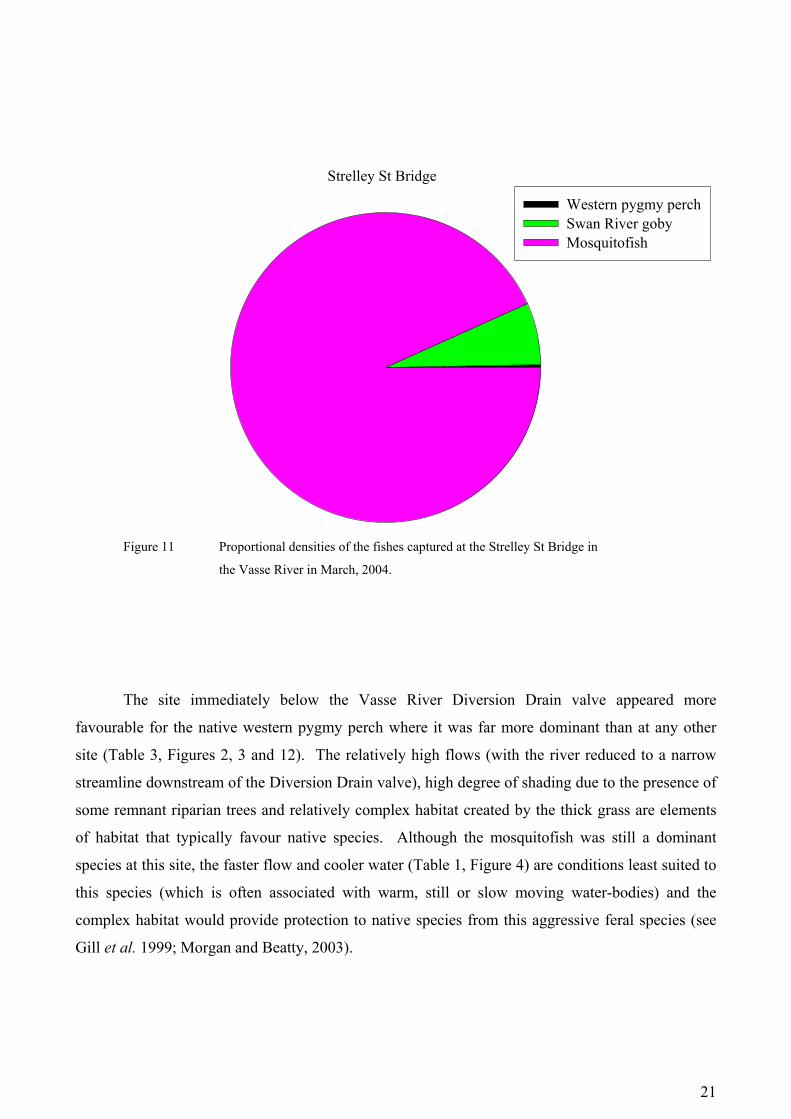
Strelley St Bridge
Western pygmy perchSwan River gobyMosquitofish
Figure 11 Proportional densities of the fishes captured at the Strelley St Bridge in
the Vasse River in March, 2004.
The site immediately below the Vasse River Diversion Drain valve appeared more
favourable for the native western pygmy perch where it was far more dominant than at any other
site (Table 3, Figures 2, 3 and 12). The relatively high flows (with the river reduced to a narrow
streamline downstream of the Diversion Drain valve), high degree of shading due to the presence of
some remnant riparian trees and relatively complex habitat created by the thick grass are elements
of habitat that typically favour native species. Although the mosquitofish was still a dominant
species at this site, the faster flow and cooler water (Table 1, Figure 4) are conditions least suited to
this species (which is often associated with warm, still or slow moving water-bodies) and the
complex habitat would provide protection to native species from this aggressive feral species (see
Gill et al. 1999; Morgan and Beatty, 2003).
22
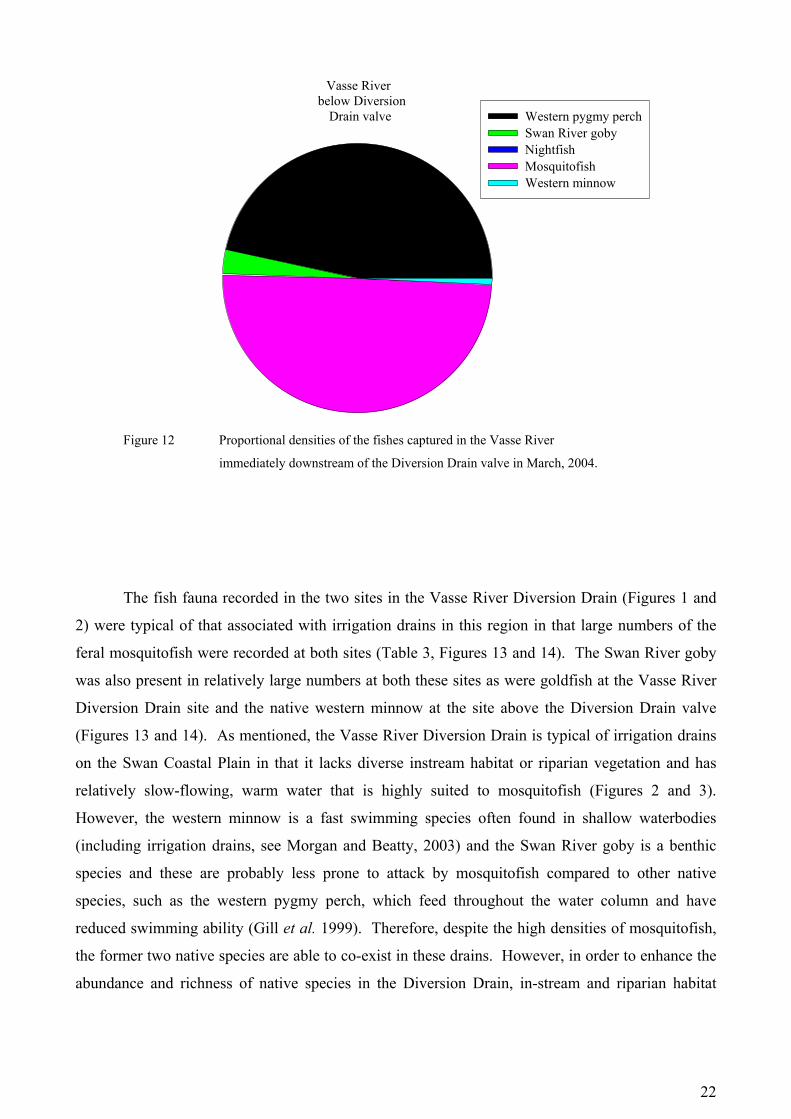
Vasse River below Diversion
Drain valve Western pygmy perchSwan River gobyNightfishMosquitofishWestern minnow
Figure 12 Proportional densities of the fishes captured in the Vasse River
immediately downstream of the Diversion Drain valve in March, 2004.
The fish fauna recorded in the two sites in the Vasse River Diversion Drain (Figures 1 and
2) were typical of that associated with irrigation drains in this region in that large numbers of the
feral mosquitofish were recorded at both sites (Table 3, Figures 13 and 14). The Swan River goby
was also present in relatively large numbers at both these sites as were goldfish at the Vasse River
Diversion Drain site and the native western minnow at the site above the Diversion Drain valve
(Figures 13 and 14). As mentioned, the Vasse River Diversion Drain is typical of irrigation drains
on the Swan Coastal Plain in that it lacks diverse instream habitat or riparian vegetation and has
relatively slow-flowing, warm water that is highly suited to mosquitofish (Figures 2 and 3).
However, the western minnow is a fast swimming species often found in shallow waterbodies
(including irrigation drains, see Morgan and Beatty, 2003) and the Swan River goby is a benthic
species and these are probably less prone to attack by mosquitofish compared to other native
species, such as the western pygmy perch, which feed throughout the water column and have
reduced swimming ability (Gill et al. 1999). Therefore, despite the high densities of mosquitofish,
the former two native species are able to co-exist in these drains. However, in order to enhance the
abundance and richness of native species in the Diversion Drain, in-stream and riparian habitat
23
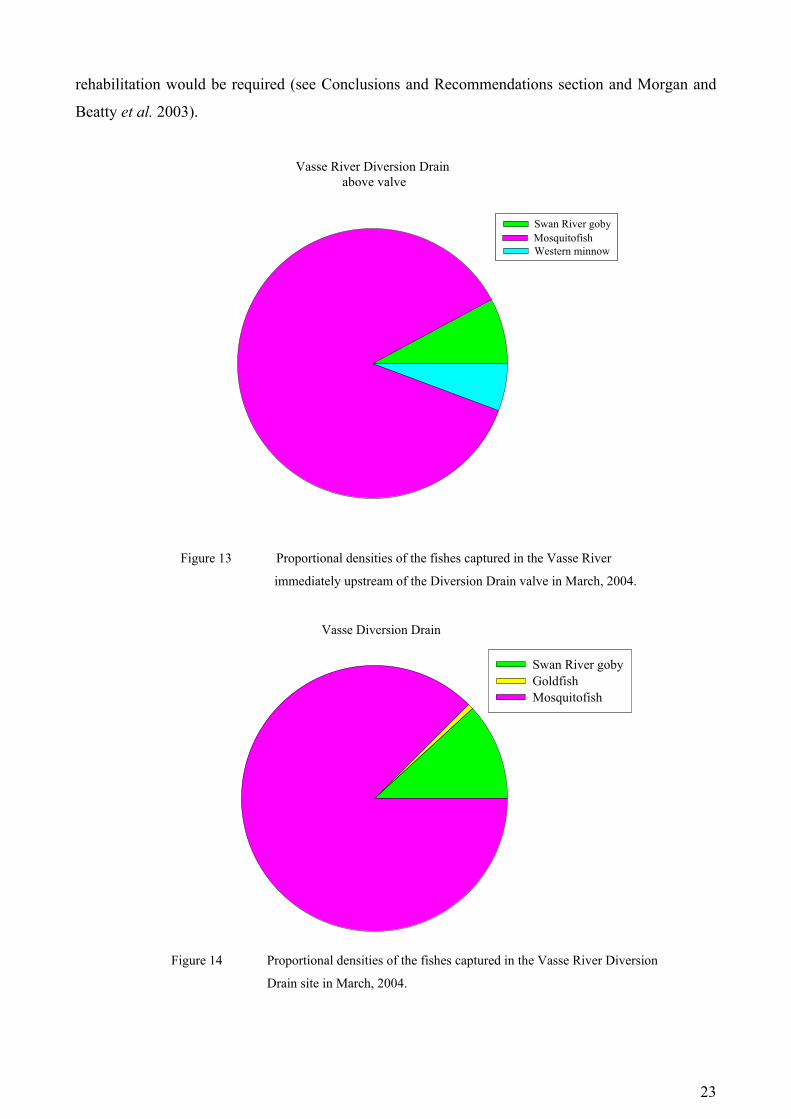
rehabilitation would be required (see Conclusions and Recommendations section and Morgan and
Beatty et al. 2003).
Vasse River Diversion Drain above valve
Swan River gobyMosquitofishWestern minnow
Figure 13 Proportional densities of the fishes captured in the Vasse River
immediately upstream of the Diversion Drain valve in March, 2004.
Vasse Diversion Drain
Swan River gobyGoldfishMosquitofish
Figure 14 Proportional densities of the fishes captured in the Vasse River Diversion
Drain site in March, 2004.
24
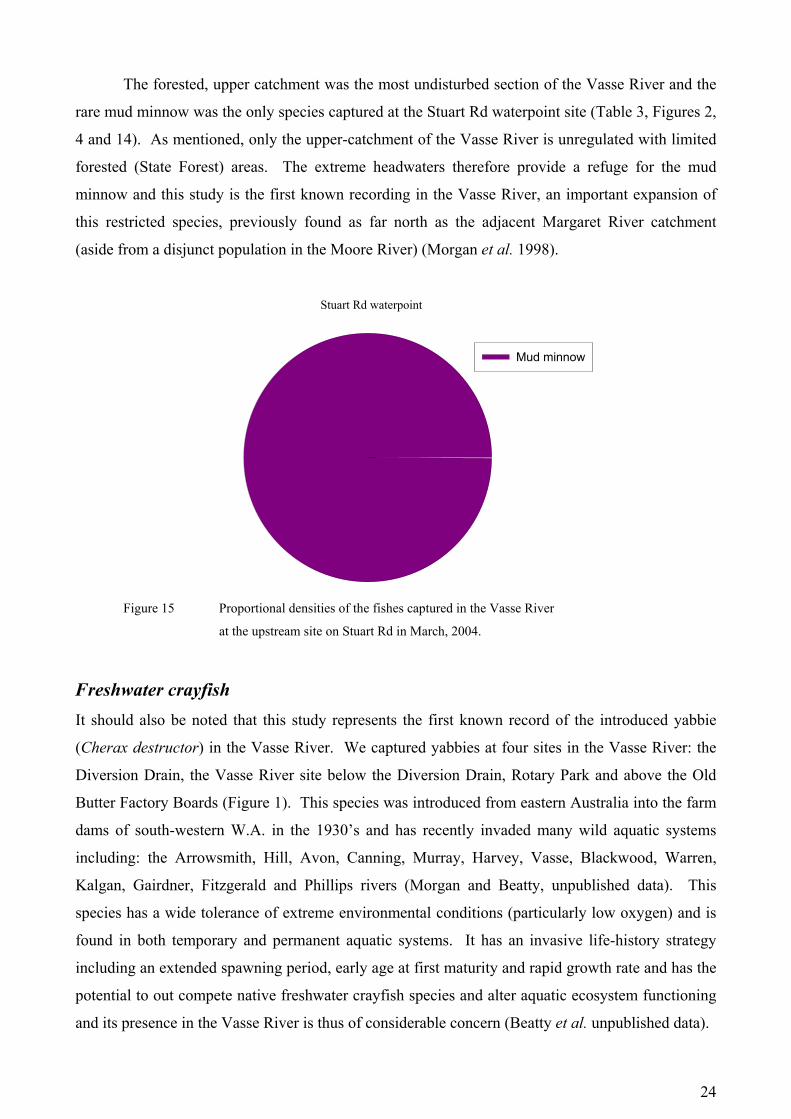
The forested, upper catchment was the most undisturbed section of the Vasse River and the
rare mud minnow was the only species captured at the Stuart Rd waterpoint site (Table 3, Figures 2,
4 and 14). As mentioned, only the upper-catchment of the Vasse River is unregulated with limited
forested (State Forest) areas. The extreme headwaters therefore provide a refuge for the mud
minnow and this study is the first known recording in the Vasse River, an important expansion of
this restricted species, previously found as far north as the adjacent Margaret River catchment
(aside from a disjunct population in the Moore River) (Morgan et al. 1998).
Stuart Rd waterpoint
Mud minnow
Figure 15 Proportional densities of the fishes captured in the Vasse River
at the upstream site on Stuart Rd in March, 2004.
Freshwater crayfish It should also be noted that this study represents the first known record of the introduced yabbie
(Cherax destructor) in the Vasse River. We captured yabbies at four sites in the Vasse River: the
Diversion Drain, the Vasse River site below the Diversion Drain, Rotary Park and above the Old
Butter Factory Boards (Figure 1). This species was introduced from eastern Australia into the farm
dams of south-western W.A. in the 1930’s and has recently invaded many wild aquatic systems
including: the Arrowsmith, Hill, Avon, Canning, Murray, Harvey, Vasse, Blackwood, Warren,
Kalgan, Gairdner, Fitzgerald and Phillips rivers (Morgan and Beatty, unpublished data). This
species has a wide tolerance of extreme environmental conditions (particularly low oxygen) and is
found in both temporary and permanent aquatic systems. It has an invasive life-history strategy
including an extended spawning period, early age at first maturity and rapid growth rate and has the
potential to out compete native freshwater crayfish species and alter aquatic ecosystem functioning
and its presence in the Vasse River is thus of considerable concern (Beatty et al. unpublished data).
25
The other freshwater crayfish captured was the endemic gilgie (Cherax quinquecarinatus),
which also inhabits a wide variety of temporary and permanent aquatic systems in this region
(Austin and Knott 1996), and was captured co-existing with yabbies in the Diversion Drain sites
(Figure 1). Both these species are able to tolerate the relatively extreme conditions in irrigation
drains and are able to burrow to escape drought and provide shelter (see also Morgan and Beatty
2003).
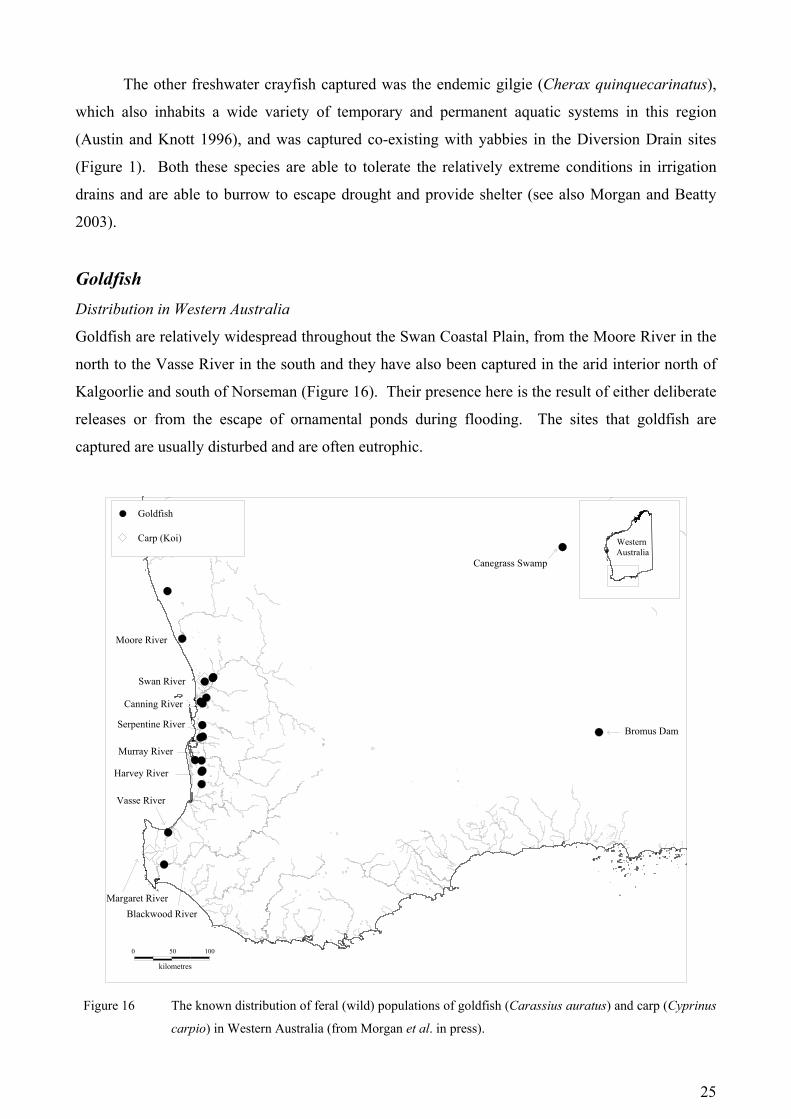
Goldfish Distribution in Western Australia
Goldfish are relatively widespread throughout the Swan Coastal Plain, from the Moore River in the
north to the Vasse River in the south and they have also been captured in the arid interior north of
Kalgoorlie and south of Norseman (Figure 16). Their presence here is the result of either deliberate
releases or from the escape of ornamental ponds during flooding. The sites that goldfish are
captured are usually disturbed and are often eutrophic.
kilometres
Canning River
Blackwood River
Harvey River
Murray River
0 50 100
Western Australia
Moore River
Swan River
Serpentine River
Margaret River
Vasse River
Bromus Dam
Canegrass Swamp
Goldfish
Carp (Koi)
Figure 16 The known distribution of feral (wild) populations of goldfish (Carassius auratus) and carp (Cyprinus
carpio) in Western Australia (from Morgan et al. in press).
26
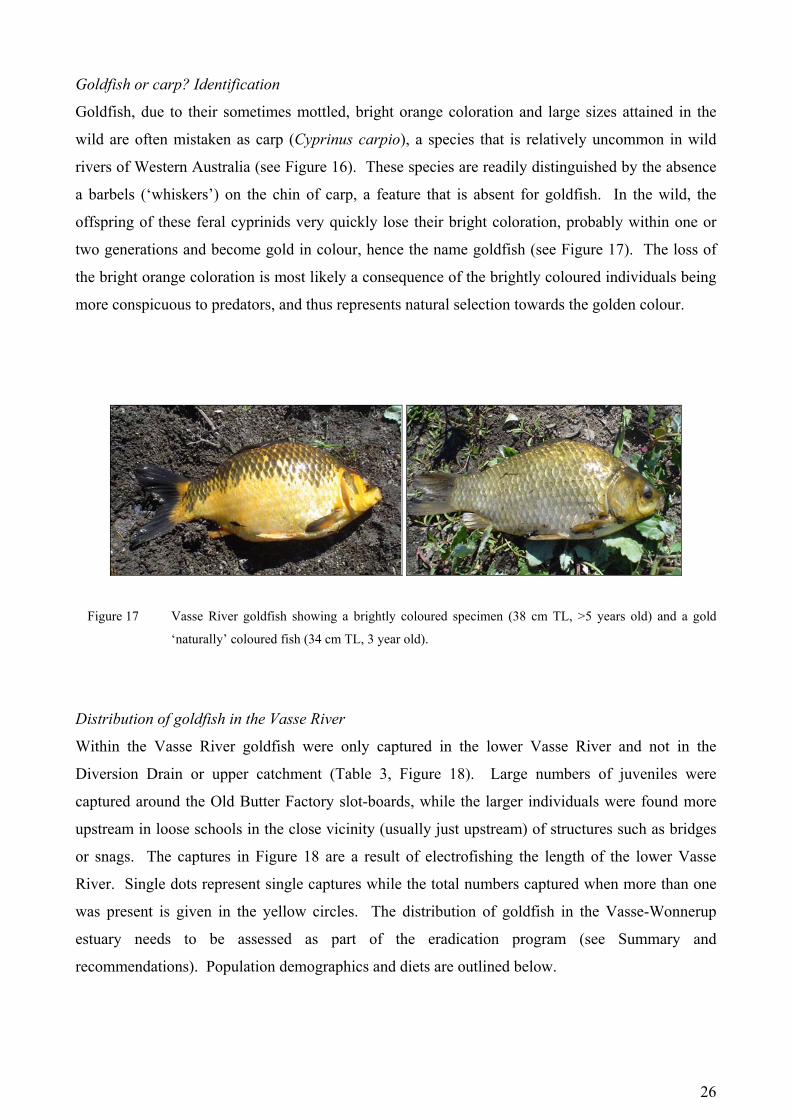
Goldfish or carp? Identification
Goldfish, due to their sometimes mottled, bright orange coloration and large sizes attained in the
wild are often mistaken as carp (Cyprinus carpio), a species that is relatively uncommon in wild
rivers of Western Australia (see Figure 16). These species are readily distinguished by the absence
a barbels (‘whiskers’) on the chin of carp, a feature that is absent for goldfish. In the wild, the
offspring of these feral cyprinids very quickly lose their bright coloration, probably within one or
two generations and become gold in colour, hence the name goldfish (see Figure 17). The loss of
the bright orange coloration is most likely a consequence of the brightly coloured individuals being
more conspicuous to predators, and thus represents natural selection towards the golden colour.
Figure 17 Vasse River goldfish showing a brightly coloured specimen (38 cm TL, >5 years old) and a gold
‘naturally’ coloured fish (34 cm TL, 3 year old).
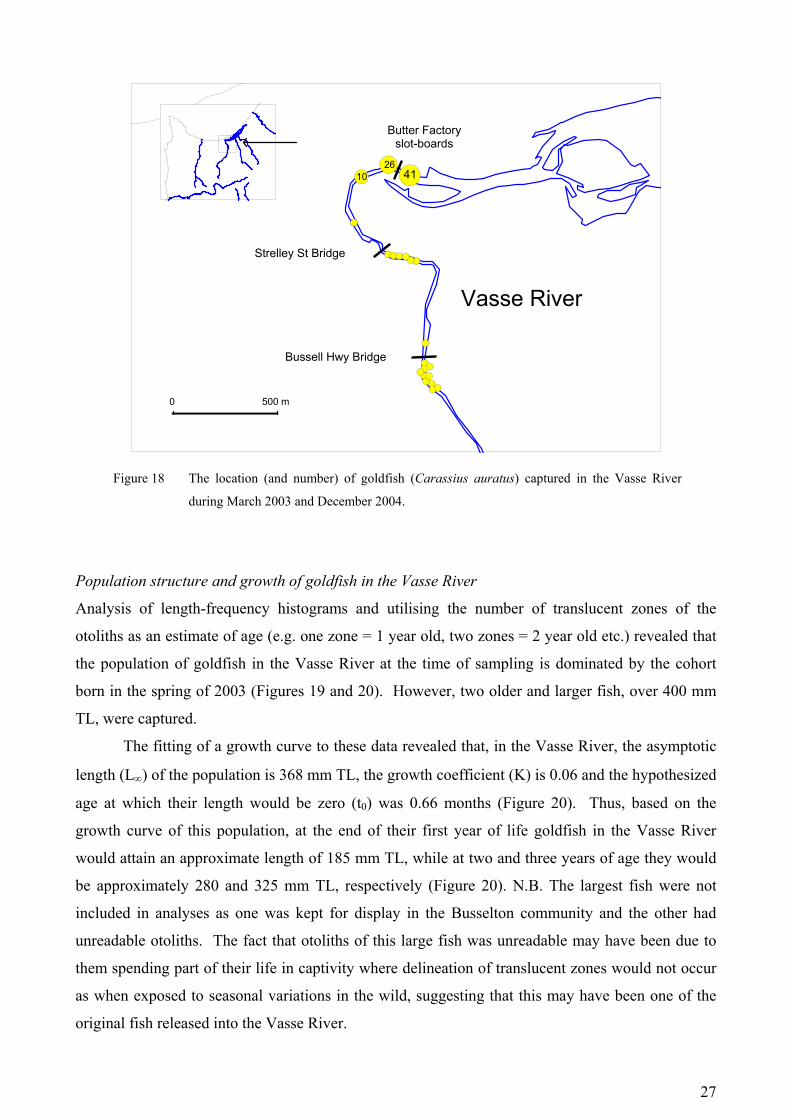
Distribution of goldfish in the Vasse River
Within the Vasse River goldfish were only captured in the lower Vasse River and not in the
Diversion Drain or upper catchment (Table 3, Figure 18). Large numbers of juveniles were
captured around the Old Butter Factory slot-boards, while the larger individuals were found more
upstream in loose schools in the close vicinity (usually just upstream) of structures such as bridges
or snags. The captures in Figure 18 are a result of electrofishing the length of the lower Vasse
River. Single dots represent single captures while the total numbers captured when more than one
was present is given in the yellow circles. The distribution of goldfish in the Vasse-Wonnerup
estuary needs to be assessed as part of the eradication program (see Summary and
recommendations). Population demographics and diets are outlined below.
27
411026
352626
Butter Factoryslot-boards
Strelley St Bridge
Vasse River
Bussell Hwy Bridge
0 500 m
41
Figure 18 The location (and number) of goldfish (Carassius auratus) captured in the Vasse River
during March 2003 and December 2004.
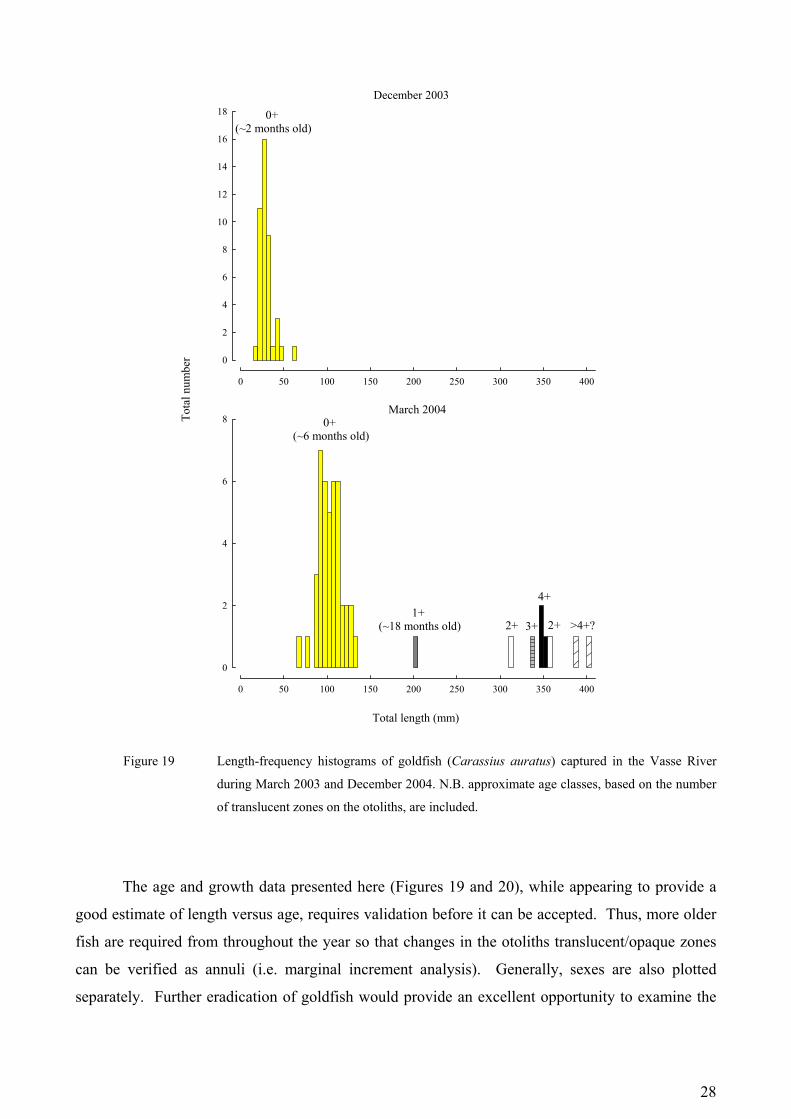
Population structure and growth of goldfish in the Vasse River
Analysis of length-frequency histograms and utilising the number of translucent zones of the
otoliths as an estimate of age (e.g. one zone = 1 year old, two zones = 2 year old etc.) revealed that
the population of goldfish in the Vasse River at the time of sampling is dominated by the cohort
born in the spring of 2003 (Figures 19 and 20). However, two older and larger fish, over 400 mm
TL, were captured.
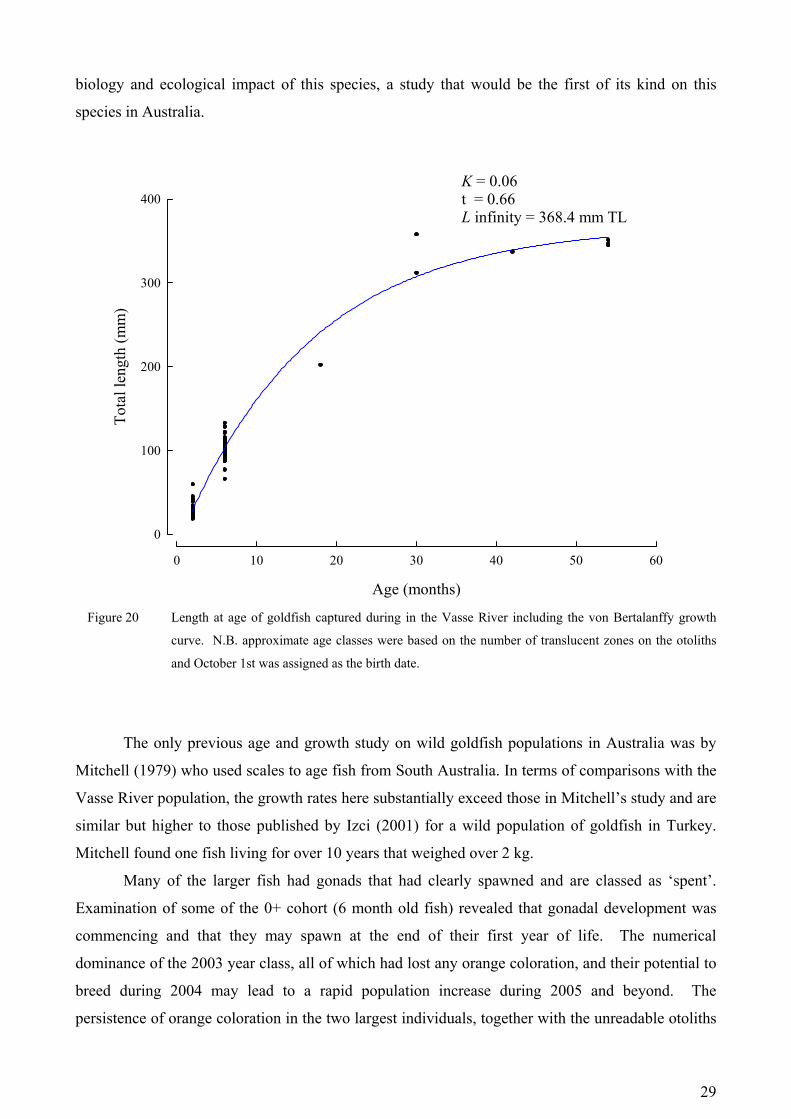
The fitting of a growth curve to these data revealed that, in the Vasse River, the asymptotic
length (L∞) of the population is 368 mm TL, the growth coefficient (K) is 0.06 and the hypothesized
age at which their length would be zero (t0) was 0.66 months (Figure 20). Thus, based on the
growth curve of this population, at the end of their first year of life goldfish in the Vasse River
would attain an approximate length of 185 mm TL, while at two and three years of age they would
be approximately 280 and 325 mm TL, respectively (Figure 20). N.B. The largest fish were not
included in analyses as one was kept for display in the Busselton community and the other had
unreadable otoliths. The fact that otoliths of this large fish was unreadable may have been due to
them spending part of their life in captivity where delineation of translucent zones would not occur
as when exposed to seasonal variations in the wild, suggesting that this may have been one of the
original fish released into the Vasse River.
28
0 50 100 150 200 250 300 350 400
0
2
4
6
8
10
12
14
16
18
Total length (mm)
0 50 100 150 200 250 300 350 400
Tota
l num
ber
0
2
4
6
8
December 2003
March 20040+
(~6 months old)
1+ (~18 months old) 2+ 3+ >4+?
4+
2+
0+ (~2 months old)
Figure 19 Length-frequency histograms of goldfish (Carassius auratus) captured in the Vasse River
during March 2003 and December 2004. N.B. approximate age classes, based on the number
of translucent zones on the otoliths, are included.
The age and growth data presented here (Figures 19 and 20), while appearing to provide a
good estimate of length versus age, requires validation before it can be accepted. Thus, more older
fish are required from throughout the year so that changes in the otoliths translucent/opaque zones
can be verified as annuli (i.e. marginal increment analysis). Generally, sexes are also plotted
separately. Further eradication of goldfish would provide an excellent opportunity to examine the
29
biology and ecological impact of this species, a study that would be the first of its kind on this
species in Australia.
Age (months)
0 10 20 30 40 50 60
Tota
l len
gth
(mm
)
0
100
200
300
400K = 0.06t = 0.66L infinity = 368.4 mm TL
Figure 20 Length at age of goldfish captured during in the Vasse River including the von Bertalanffy growth
curve. N.B. approximate age classes were based on the number of translucent zones on the otoliths
and October 1st was assigned as the birth date.
The only previous age and growth study on wild goldfish populations in Australia was by
Mitchell (1979) who used scales to age fish from South Australia. In terms of comparisons with the
Vasse River population, the growth rates here substantially exceed those in Mitchell’s study and are
similar but higher to those published by Izci (2001) for a wild population of goldfish in Turkey.
Mitchell found one fish living for over 10 years that weighed over 2 kg.
Many of the larger fish had gonads that had clearly spawned and are classed as ‘spent’.
Examination of some of the 0+ cohort (6 month old fish) revealed that gonadal development was
commencing and that they may spawn at the end of their first year of life. The numerical
dominance of the 2003 year class, all of which had lost any orange coloration, and their potential to
breed during 2004 may lead to a rapid population increase during 2005 and beyond. The
persistence of orange coloration in the two largest individuals, together with the unreadable otoliths
30
perhaps as a result of living in captivity, suggests that they may have been either the original stock
introduced into the Vasse River or they are first or possibly second generation – their age however
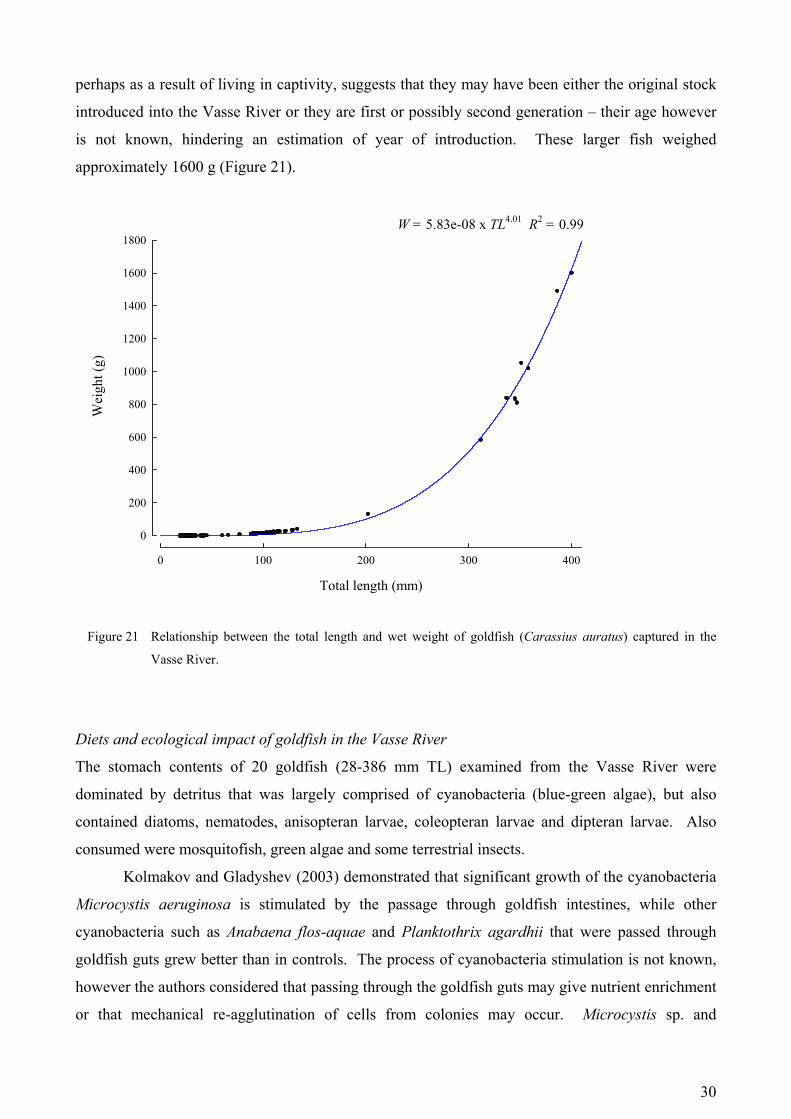
is not known, hindering an estimation of year of introduction. These larger fish weighed
approximately 1600 g (Figure 21).
Total length (mm)
0 100 200 300 400
Wei
ght (
g)
0
200
400
600
800
1000
1200
1400
1600
1800W = 5.83e-08 x TL4.01 R2 = 0.99
Figure 21 Relationship between the total length and wet weight of goldfish (Carassius auratus) captured in the
Vasse River.
Diets and ecological impact of goldfish in the Vasse River
The stomach contents of 20 goldfish (28-386 mm TL) examined from the Vasse River were
dominated by detritus that was largely comprised of cyanobacteria (blue-green algae), but also
contained diatoms, nematodes, anisopteran larvae, coleopteran larvae and dipteran larvae. Also
consumed were mosquitofish, green algae and some terrestrial insects.
Kolmakov and Gladyshev (2003) demonstrated that significant growth of the cyanobacteria
Microcystis aeruginosa is stimulated by the passage through goldfish intestines, while other
cyanobacteria such as Anabaena flos-aquae and Planktothrix agardhii that were passed through
goldfish guts grew better than in controls. The process of cyanobacteria stimulation is not known,
however the authors considered that passing through the goldfish guts may give nutrient enrichment
or that mechanical re-agglutination of cells from colonies may occur. Microcystis sp. and
31
Anabaena sp. are known to cause algal blooms in the Vasse River (S. Grigo, Department of
Environment, Southwest Region Phytoplankton Ecology Unit, Vasse River sampling results 2003-
2004).
The above findings of the diets of the goldfish in the Vasse River, together with the fact that
they can stimulate significant growth in blue-green algae, and that the goldfish population in the
Vasse River may be in its infancy and set to boom over the next few years, is cause for concern in a
system that is currently exposed to severe algal blooms during spring, summer and autumn (see
Paice 2001). Thus, a substantial increase in goldfish biomass could become a major factor
attributing to algal blooms in the Vasse River. Furthermore, the vigorous bottom sucking feeding
methods of goldfish resuspends nutrients making them available to algae. Within the Vasse River
algal blooms have lead to a number of fish kills since 1997 (Paice 2001), a period that may coincide
with the initial introduction of goldfish. An increase in algae also provides this feral species with an
abundance of a food source that they can utilise from a very young age.
Feral goldfish also have the potential to prey on the eggs, larvae and adults of native fishes
and have been known to cause declines in native fish populations in the U.S. (e.g. Deacon et al.
1964). Goldfish also compete with native fishes for food and space and by growing to a much
larger size than all but one of the south-west’s native freshwater fishes, they would escape predation
from a young age (probably by a few months old they would attain lengths larger than can be
consumed by native fishes). Goldfish, as a benthic generalist/herbivore has also been shown to
cause increased turbidity and deplete aquatic vegetation (Richardson et al. 1995). A reduction in
aquatic vegetation reduces habitat and potential spawning sites for native fishes. It is recommended
that a detailed dietary study of goldfish in the Vasse River be implemented and that it is based on
both seasonal and ontogenetic changes in diet.
Very little is known of the parasites infecting freshwater fishes in Western Australia,
however it is acknowledged that non-native parasites may use introduced fishes as vectors to infect
native fishes (e.g. Morgan 2003). Goldfish are known carriers of a number of serious diseases and
have been implicated with the introduction of several fish pathogens in South Africa (Mouton et al.
2001) and at least one monogenean trematode in Australia (Fletcher and Whittington 1998).
The implications for the activation of cyanobacteria blooms after passing through fish
digestive tracts are huge when considering not only the widespread distribution of goldfish in
Western Australia, but that there are large numbers of other feral fishes that consume
phytoplankton. Specifically, apart from populations of goldfish, feral populations of tilapia
(Oreochromis mossambicus), one-spot livebearers (Phalloceros caudimaculatus), swordtails
(Xiphophorus helleri) and carp have become established here (Morgan et al. in press), and as all are
detritivores they may all have the ability to stimulate cyanobacteria growth. Furthermore, native
32
species such as sea mullet and Swan River gobies are known to consume detritus and may also
contribute to algal blooms. The control of such blooms may be aided with eradication programs of
feral detritivorous fishes.
Summary and Recommendations • The Vasse River catchment has been heavily cleared and its flow regime modified by drain
construction and instream barriers. Much of the riparian zone is also relatively degraded.
• The lower reach between the Diversion Drain and the Old Butter Factory has essentially become
an elongated reservoir due to the insertion of slot-boards and presence of a valve at the
Diversion Drain and is the site of cyanobacteria blooms.
• The Vasse River houses seven native species of fishes, however, is dominated by the feral
mosquitofish and also contains a feral population of goldfish found downstream of the
Diversion Drain.
• Goldfish are known carriers of disease and impact on ecosystem structure and functioning,
including enhancing algal blooms via their feeding behaviour.
• The goldfish population is likely to have been established relatively recently (~5 years) and, due
to the numerical dominance of a cohort of juveniles, it is expected that the population will
increase rapidly in coming years, should no management actions (i.e. eradication program) be
undertaken.
• It is recommended that the lower Vasse River be returned to a more natural flow regime via the
removal of the slot-boards at the Old Butter Factory and opening of the valve at the Diversion
Drain for longer periods. The riparian re-vegetation program should be expanded.
• An ongoing goldfish eradication program, run initially over three years, should be implemented
and should form the basis of a study examining their biology and ecological impact. Studies
should include examining the extent to which the growth of the dominant cyanobacteria species
in the Vasse River is stimulated after passing through goldfish digestive tracts.
• The eradication program should involve an annual intensive capture effort prior to the onset of
the spawning period (i.e. September).
• Eradication efforts should focus on areas of high goldfish densities as outlined in this study i.e.
upstream and downstream of the Old Butter Factory, upstream of the Strelley St and Bussell
Hwy bridges.
• The eradication program should involve the use of gill net (large mesh width to prevent the
capture of native freshwater species), seine nets and electrofishing.
33
• All goldfish captured should be retained for the above-mentioned biological and ecological
studies.
• The success of the eradication program should be evaluated after three years by comparison of
relative abundances of goldfish in the lower Vasse River at that time with the relative
abundances documented in this study.
• An education program should be instigated detailing: the native and feral fishes found in the
Vasse River; the problems associated with the release of aquarium fishes into wild aquatic
systems; the goldfish eradication program. This should involve a poster being displayed at
Rotary Park and brochures being produced which should be distributed by GeoCatch and the
Department of Fisheries, Busselton.
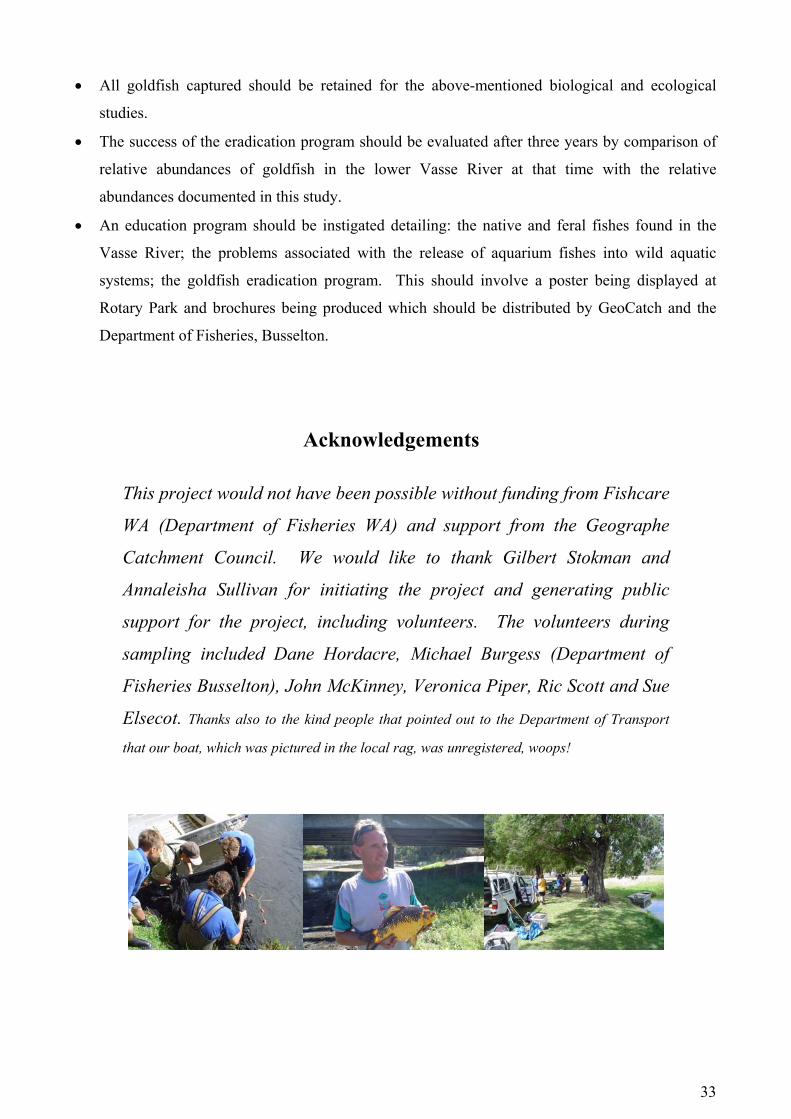
Acknowledgements
This project would not have been possible without funding from Fishcare
WA (Department of Fisheries WA) and support from the Geographe
Catchment Council. We would like to thank Gilbert Stokman and
Annaleisha Sullivan for initiating the project and generating public
support for the project, including volunteers. The volunteers during
sampling included Dane Hordacre, Michael Burgess (Department of
Fisheries Busselton), John McKinney, Veronica Piper, Ric Scott and Sue
Elsecot. Thanks also to the kind people that pointed out to the Department of Transport
that our boat, which was pictured in the local rag, was unregistered, woops!
34
References
Austin, C.M. and Knott. B. (1996). Systematics of the freshwater crayfish genus Cherax Erichson (Decapoda: Parastacidae) in south-western Australia: electrophoretic, morphological and habitat variation. Australian Journal of Zoology 44: 223-258.
Ball, J. N. (1961). On the brown trout of Llyn Tegid. Proceedings of the Zoological Society of London 137,
599-622. Deacon, J.E., Hubbs, C. and Zahuranec, B.J. (1964). Some effects of introduced fishes on the native fish
fauna of southern Nevada. Copeia 1964(2): 384-388. Fletcher, A.S. and Whittington, I.D. (1998). A parasite-host checklist for Monogenea from freshwater fishes
in Australia, with comments on biodiversity. Systematic Parasitology 41: 159-168. Gill, H.S., Hambleton, S.J. and Morgan, D.L. (1999). Is Gambusia holbrooki a major threat to the native
freshwater fishes of south-western Australia? In Seret, B. & Sire, J.-Y., (eds). Proceedings 5th Indo-Pacific Fish Conference (Noumea, 3-8 November1997). pp. 79-87. Paris: Societe Francaise d’Ichtyologie & Institut de Recherche pour le Development.
Goss, Z. and Greenop, B. (2003). Lower Vasse River Phoslock™ trials. South West Inflo, Water and Rivers
Commission, March 2003. Horwitz, P. and Adams. M. (2000). The systematics, biogeography and conservation status of species in the
freshwater crayfish genus Engaewa Riek (Decapoda: Parastacidae) from south-western Australia. Invertebrate Taxonomy 14: 655-680.
Hynes, H. B. N. (1950). The food of sticklebacks with a review of the methods used in studies of the food
of fishes. Journal of Animal Ecology 19: 36-58. Jaensch, R. and Lane, J. (1993). Western Australia. In Usback, S. and James, R., (eds). A Directory of
Important Wetlands in Australia. Canberra: Australian Nature Conservation Agency. Izci, L. (2001). Some population parameters of Carassius auratus (L., 1758) in Lake Egirdir. Turkish
Journal of Veterinary and Animal Sciences 28:23-27. Kolmakov, V.I. and Gladyshev, M.I. (2003). Growth and potential photosynthesis of cyanobacteria are
stimulated by viable gut passage in crucian carp. Aquatic Ecology 37:237-242. Mitchell, B.D. (1979). Aspects of growth and feeding in golden carp, Carassius auratus, from South
Australia. Transactions of the Royal Society of South Australia. 103(6): 137-144. Morgan, D.L. (2003). Distribution and biology of Galaxias truttaceus (Galaxiidae) in south-western
Australia, including first evidence of parasitism of fishes in Western Australia by Ligula intestinalis. Environmental Biology of Fishes 66: 155-167.
Morgan, D. & Beatty, S. (2003). Fish and decapod fauna of Bancell Brook (Harvey River) and the impacts
of irrigation slot boards on migrations. Report to the Southern Peel Partnership Landcare Group. Morgan, D.L., Hambleton, S.J., Gill, H.S. and Beatty, S.J. (2002). Distribution, biology and likely impacts
of the introduced redfin perch (Perca fluviatilis) (Percidae) in Western Australia. Marine & Freshwater Research 53: 1211-1221.
Morgan, D.L., Gill, H.S., Maddern, M.G. & Beatty, S.J. (in press). Distribution and impacts of introduced
freshwater fishes in Western Australia. New Zealand Journal of Marine and Freshwater Research.
35
Morgan, D.L., Gill, H.S. and Potter, I.C. (1995). Life cycle, growth and diet of Balston's pygmy perch in its
natural habitat of acidic pools. Journal of Fish Biology 47: 808-825. Morgan, D.L., Gill, H.S. and Potter, I.C. (1998). Distribution, identification and biology of freshwater fishes
in south-western Australia. Records of the Western Australian Museum Supplement No. 56: 97 pp. Morgan, D.L., Gill, H.S. and Potter, I.C. (2000). Age composition, growth and reproductive biology of the
salamanderfish Lepidogalaxias salamandroides: a re-examination. Environmental Biology of Fishes 57: 191-204.
Mouton, A., Basson, L. and Impson, D. (2001). Health status of ornamental freshwater fishes imported to
South Africa: a pilot study. Aquarium Sciences and Conservation 3: 327-333. Paice, R. (2001). Water quality in the Vasse-Wonnerup estuarine system and lower Vasse River 1996-2000.
South West info, Water and Rivers Commission, July 2001. Pen, L. (1997). A systematic overview of environmental values of the wetlands, rivers and estuaries of the
Busselton-Walpole Region. Water and Rivers Commission, Water Resource Allocation and Planning Report Series No WRAP 7.
Richardson, M.J., Whoriskey, F.G. and Roy, L.H. (1995). Turbidity generation and biologica impacts of an
exotic fish Carassius auratus, introduced into shallow seasonally anoxic ponds. Journal of Fish Biology 47: 576-585.


![[5937 - 19334]Auditoria de Prestacao de Contas Publicas](https://img.pdfslide.net/doc/110x75/55cf9b98550346d033a6aaf0/5937-19334auditoria-de-prestacao-de-contas-publicas.jpg)