Embed Size (px)
Citation preview

Fisheries Centre
The University of British Columbia
Working Paper Series
Working Paper #2015 - 88
The marine fishery catch of Georgia (including Abkhazia), 1950-2010
Aylin Ulman and Esther Divovich
Year: 2015
Email: [email protected]
This working paper is made available by the Fisheries Centre, University of British Columbia, Vancouver, BC, V6T 1Z4, Canada.

THE MARINE FISHERY CATCH OF GEORGIA (INCLUDING ABKHAZIA), 1950-2010
Aylin Ulman and Esther Divovich
Sea Around Us, Fisheries Centre, University of British Columbia, 2202 Main Mall, Vancouver, BC, V6T 1Z4, Canada
[email protected]; [email protected]
ABSTRACT
Total marine fishery removals in Georgia (including the region of Abkhazia) were estimated for the time period 1950-2010 using a reconstruction approach and were composed of industrial landings, their discards, and small-scale catch in the artisanal, recreational and subsistence sectors. We added the unreported components of these estimates to the ‘official’ data, which have been reported on Georgia’s behalf by the United Nations’ Food and Agriculture Organization (FAO) from 1988 to 2010. We allocated a component of former USSR catch to Georgia for 1950-1987 (which was determined through national sources). The reconstructed total domestic catch for the 1950-2010 time period (inclusive of the reported data) is approximately 3.02 million t, or 41% more than the 2.15 million t of reported data. The main unreported taxon by tonnage was European anchovy (Engraulis encrasicolus) due to its sheer high proportion of catch. Unreported catches consisted of 32% industrial discards, 23% industrial landings, 20% subsistence landings, 15% artisanal landings, and 10% recreational landings. Total catches increased from 9,500 t in 1950, to a peak of 133,000 t in 1980 before rapidly declining with the collapse of the Soviet Union, as well as a local fisheries crisis stemming from a local ctenophore population explosion, to about 12,000 t in 1991, and since then increased to reach 92,000 t in 2010. In the 2000s, reconstructed catch for Georgia was nearly five times the total reported marine landings. Furthermore, catch of the foreign fleets operating inside Georgia’s EEZ was estimated for Turkey, Ukraine, and Russia, who caught 443,000 t, 198,000, and 106,000 t for the years 1991-2010, respectively, most of which was unreported and taken from Abkhazia after its dispute with Georgia in 1992.
INTRODUCTION
Georgia is situated along the eastern Black Sea, and is surrounded by Russia to the north and Turkey to the south (Figure 1). The Black Sea is an almost entirely enclosed body of water which connects to the Aegean Sea and then the Mediterranean Sea via the narrow Bosphorus Strait in Turkey. More saline, denser water from the Mediterranean Sea is transported to the Black Sea via a bottom current in the Bosphorus Strait, while lighter, less saline water flows out of the Black Sea through a surface current in the Bosphorus Strait. This marked density difference has left the entire Black Sea at depths greater than 100-150 m anoxic and practically devoid of life, which also contributes to the relatively narrow fishable area on ice coastal continental shelf.
Georgia declared its independence from the U.S.S.R. on April 9, 1991 and claims a 12 nm territorial sea and a 200 nm Exclusive Economic Zone (EEZ), which is roughly 23,000 km2 (www.seaaroundus.org); Figure 1. The most important ports are in Poti, Sukhimi and Batumi, respectively (Figure 1). In 2008, Georgia sold 51% of its port in Poti to the United Arab Emirates to develop a free economic zone and new terminal.1 Batumi, also sold its two harbours to private owners and serves only recreational yachts, leaving the fishing fleet without landing facilities or a commercial harbour, although exceptions are made in the off-season (Khavtasi et al. 2010). The population trajectory of Georgia had two distinct and diverse
1 http://www.worldportsource.com/ports/GEO_Port_of_Poti_2227.php
1

phases, from 1950 to 1990, the population grew from 3.5 million to 5.4 million people, after which its population rapidly declined to 4.3 million people by 2010 (Rukhadze 2010).
Abkhazia, also outlined in Figure 1, lies in the north-western part of Georgia and is a disputed territory plagued with violence, organized crime and smuggling networks since the 1990s (Kukhianidze et al. 2004). Abkhazia has been closed to international trade since 1993, but since Abkhazia declared itself a Republic, the ‘Abkhazian Autonomous Republic’, they still trade with Turkey by sea and Russia by land, but international consensus is that it is an integral part of Georgia, and thus are treated here as one entity (http://government.gov.ge). The population of Abkhazia was approximately 526,000 in 1989, 216,000 in 2003, and 240,000 in 2010,2 with an additional 600,000 Abkhaz people living in Turkey.3 The majority of Abkhazians have recently been granted Russian citizenship, escalating the polarity between Abkhazia and Georgia (Punsman 2009). The structure of Abkhazia’s foreign trade seems unfavourable for them as exports are mainly citrus fruits, hazelnuts and fish, and imports are mainly manufactured goods, gasoline and tobacco products.4
This project aims to first determine Georgia’s reported (with respect to FAO reported data for the former-USSR and Georgia) marine catches taken exclusively from Georgian waters from 1950-2010 and use those as the ‘reported’ baseline, and then estimate all unreported landings and discards from the Georgian EEZ from 1950-2010 using the best available data. The unreported components include: industrial landings, artisanal landings, recreational and subsistence landings, and discards. In addition, the amount of foreign catch taken from Georgian waters was estimated.
Fishing history
The ancient Greek historian, Herodotus (484-425 B.C.) noted that fishing was the main activity of Georgian tribes living adjacent to the Black Sea (van Anrooy et al. 2006). In the late 19th century, documents stated that sturgeon (Acipenseridae) and mullets (Mugilidae) were the most abundant species. Based on expert data from 1901-1913, annual Georgian marine catches were about 5,700 t·year-1 (van Anrooy et al. 2006), which did not include local consumption.
The Georgian fishing sector took shape in 1930, when the company Saktevski was established. By 1945, commercial fishing switched to purse seining to target European anchovy. Passive fishing gear-types common at this time included drag seines, seines, fixed and fyke nets, baited hooks, and gillnets for turbot (Scopthalmus maximus). That same decade, fish processing plants were constructed, and in 1960, the Ocean Fishing Department was founded (van Anrooy et al. 2006). At this time it was mainly just the inshore area was fished and engine power was about 25-30 HP.
When Georgia was under Soviet rule, fishing often took place by semi-military organizations which helped protect the nation’s security and also controlled illegal fishing. Places with high fish abundances were allocated as marine reserves. The Soviet portion of the Black Sea was openly shared by the Soviet states.
From 1980-1990, the Georgian industrial fishing fleet had 48 vessels, ten of which were trawlers with up to 3,000 hp, capable of distant water fishing (FAO 2005); each distant-water vessel caught and processed about 4,000 t·fish·year-1. The marine fisheries employed about 3,400 people in the 1980s, which rapidly decreased to less than 1,800 by the early 1990s. After gaining independence, economic and social hardship were felt in Georgia; the industrial fishing fleet practically disappeared and fisheries catches
2 http://taklama.com/2011/12/29/a-first-look-at-abkhazias-census-results/ 3 http://abkhazworld.com/news/diaspora/95-turkish-abkhazians-enjoying-independence-of-their-far-away-country-.html 4 http://abkhazworld.com/aw/analysis/760-socio-economic-system-of-abkhazia-and-problems-of-its-development#sthash.6LXLtV0H.dpuf
2
dramatically declined (Khavtasi et al. 2010). The country was no longer able to reap the rewards of their marine resources as the local economy, and consequently infrastructure, largely dissipated.
By 2005, Georgia’s industrial fishing fleet consisted of 36 medium-sized seiners which used a combination of purse-seine and bottom trawls to target anchovy (Khavtasi et al. 2010); 80% of the fleet operated out of Poti (Figure 1) and used pelagic trawls, whereas the remainder operated out of Batumi and used bottom trawls, illegal in the eastern Black Sea (Khavtasi et al. 2010). Purse seines are much more practical for targeting anchovy, but require more capital.
After 1982, with the adoption of the United Nation’s Convention on the Law of the Sea (UNCLOS), which notably established resource control within each maritime country’s Exclusive Economic Zone (EEZ, if declared), the former USSR relocated a large part of their distant water fleet into their EEZ in the Black Sea, thus at one point, Georgia had 220 seiners targeting anchovy in the Black Sea (van Anrooy et al. 2006), whereas before they were free to roam internationally. Georgia lost free and ready access to about two-thirds of its EEZ to the ongoing Abkhaz dispute, with the Abkhaz coastline being almost twice that of the rest of Georgia.
In 2004, the catch rate for the local 35 purses-seiners was between 10-12 t∙vessel-1∙day-1, with an average of 55-60 fishing days∙season-1 (van Anrooy et al. 2006), resulting in an annual catch potential of 20,000-26,000 t∙year-1. Thus, the Georgian vessels have the capacity to catch almost half the annual quota, but the bidding system clearly prefers foreign income.
Commercial species
In the 1950s, the main commercially targeted species (van Anrooy et al. 2006) were anchovy, Atlantic horse mackerel (Trachurus trachurus), turbot, grey mullets (Mugil spp.), Pontic shad (Alosa immaculata), Black Sea shads (Alosa maeotica and A. tanaica), five sturgeon species, Black Sea salmon (Salmo labrax) and picked dogfish (Squalus acanthias). In 1950, anchovy comprised 83% (5,200 t) of Georgia’s marine coastal catch, which increased to 99% by 1980 (110,000 t). Throughout the 1960s, the use of passive gears decreased while active gears and gillnets increased (van Anrooy et al. 2006).
Demersal fish are less common in Georgia’s catches due to the narrow continental shelf and also the anoxic nature of the Black Sea basin, which inhibits fish survival below the 150 m thermocline. At first, increase in effort, and the geographical and taxonomic expansion of the fisheries, masked the declining trend in local catches (Eremeev and Zuyev 2007; Pauly 2009), and thus the disappearance of the large predators went almost unnoticed in the Black Sea from 1950-1980. Subsequently, no management system was enacted to reverse the losses, a typical case of ‘Fishing Down Marine Food Webs’ (Pauly et al. 1998), which triggered a trophic cascade (Daskalov 2002). After the near-complete removal of large predators, their former prey, the small pelagics, e.g., anchovy, European sprat (Sprattus sprattus), Mediterranean horse mackerel (Trachurus mediterraneus) and whiting (Merlangius merlangus), increased their biomass of total Black Sea landings from 70% in the 1960s-1970s to 93% in 1988 (Eremeev and Zuyev 2007).
The number of commercially targeted species has decreased over the years from 17 species in the 1930s, 14 species in the 1960s, 6 species in the 1980s, e.g. anchovy, sprat, whiting, picked dogfish, red mullet (Mullus barbatus barbatus) and Mediterranean horse mackerel (Komakhidze et al. 2007)], and to four by the 1990s (Mazmanidi and Komakhidze 1996). While other species still have commercial value, they are sold as retained by-catch, since their contributions to the catch do not warrant a targeted fishery. Prior to independence, most fisheries catches were exported to the USSR, leaving most Georgians devoid of fish culture, folklore and fish protein (apart from some seaside towns).3 Anchovy catches alone were in the 200,000 to 300,ooo t·year-1 range, landed from both the Sea of Azov and Black Sea (Komakhidze et al.
3

2007). Sea snails (Rapana spp.) and Mediterranean mussel (Mytilus galloprovincialis) were also commercially caught.
Thus, the Georgian commercial fishery can be classified as having three distinct stages:
1) From the 1930s to the early 1960s, annual catches were small yet stable and ranged from approximately 3,000 to 8,000 t·year-1 (except during WWII when they decreased to under 2,000 t·year-1);
2) From the mid-1960s to 1990, the commercial fisheries appeared to improve remarkably due to a massive increase in anchovy and sprat populations (likely due to the overfishing of their larger predators), and reported catches peaked in 1985 at almost 94,000 t·year-1;
3) A fisheries collapse circa 1990, due to an alien ctenophore invasion which consumed most fish larvae of the small pelagics (Komakhidze et al. 2007), along with the transfer from a state-led to a market economy which also negatively impacted the livelihood of the fleet.
Most locally consumed fish is imported from Turkey, since Georgians prefer larger-size fish such as mackerel, hake (Merluccius merluccius), salmon and sturgeon, currently unavailable in local markets5. The Georgian fishery is not accredited to export fish to the European Union, leaving only non-EU countries able to import their products, such as Turkey. In light of the scarcity of fresh fish, the national seafood consumption rate diminished from 19 kg·person-1 ·year-1 pre-independence to under 4 kg·person-1 ·year-1 by 2010 (Khavtasi et al. 2010).
METHODS
Here, we present a reconstruction of Georgia’s fisheries catches for the years 1950-2010, using the methodology described in Zeller et al. (2007).
Baseline data
The Food and Agriculture Organization of the United Nations (FAO) asks its member countries to submit their national fisheries catch statistics since 1950, which is made publicly accessible in the Fishstat database. The FAO began reporting for Georgia in 1988, whereas prior to 1988 (1950-1987), Georgia’s marine fisheries catches for the Black Sea region were combined with the catches of the other Black Sea Soviet States (Ukraine and Russia). An earlier attempt was made to disaggregate the former USSR catches to individual Soviet States from 1950 until Georgia began reporting independently in 1988 based on each taxa’s first five-year reported average (Zeller and Rizzo 2007), which was improved upon here after locating local national data from the early period. Post-independence, Georgia’s reporting habits and quality greatly deteriorated (Raykov 2010). For example, in 2001 and 2002, Georgia reported for about 20 species, but in 2003, Georgia only reported for one species, anchovy. From 2004-2006, no catches were reported, and in 2007, only three species were reported, and none since then. The Black Sea Commission refused to accept Georgia’s 2007 anchovy catch data due to incompleteness and lack of credibility (Mathews 2007); the FAO also noted that anchovy landings may have been mis-reported. Data were collected both from licensed landing vessels and/or from market research, but only for the handful of species indicated on the license.
Abkhaz fisheries catches prior to the civil war, beginning in 1992, were assumed to have been included in the catches reported on behalf of Georgia to the FAO. It appears that post-conflict, Abkhaz marine catches have been omitted from the data sent on behalf of Georgia to the FAO. Furthermore, since most small-
5 http://www.finchannel.com/Main_News/Geo/107053_Investment_Opportunities_in_Georgia%E2%80%99s_Fishing_Industry/
4
scale fishers are unlicensed, their catches have largely been omitted from the statistics (van Anrooy et al. 2006). Catches were generally only reported for species which had a specific quota and license requirement.
Improvements were to be made in data collection and analysis by the Department of Fisheries (van Anrooy et al. 2006), but this has not occurred. Prior to 2005, the Department of Fisheries (DoF) was severely understaffed with only 8 staff, each with an annual budget of US $6,000. In 2005, the number of staff was increased to about 20, along with their salaries. Despite the increased funding, the department was still lacking basic technical resources. The Biodiversity Protection Service (BPS) of the Ministry of Environment Protection and Natural Resources of Georgia (MEPNR) is supposed to protect, develop and optimize the natural resources. However, the BPS operates without technical staff (Mathews 2007), resulting in inconclusive data.
Georgia’s reported marine fisheries catches from the Black Sea were accounted for using a combination of catch data and species allocations found in van Anrooy et al. (2006). Table 1 from van Anrooy et al. (2006) was used to determine the 1950 and 1980 species allocations and total catches, and Table 3 in van Anrooy et al. (2006) was used to determine 1960 and 1965 total marine catches for Georgia. Each reported taxon was assigned a percentage contribution to the total catch which was interpolated from 1951-1979, and again from 1981 to the FAO 1988 reported data. Some species were only reported for the early period (1950 to the early 1960s), as they were overfished and not present from later data, such as Atlantic horse mackerel, sturgeon, turbot and garfish (Belone belone), hence local expert knowledge of the temporal taxonomic disappearances were used to estimate their disappearance from the data. Sprat was initially reported in the 1988 FAO data, but we interpolated its percentage of annual growth from the first three years of reporting backwards, which resulted in it initially likely being caught in 1980. From 1988 onwards, the FAO data were used as the baseline of reported marine catches for Georgia.
Commercial fishing
Industrial sector
For the purposes of this report, industrial (i.e., large-scale commercial) catches are those taken by active fishing gear (trawl, purse seines, etc.), whereas artisanal catches (i.e., small-scale commercial) are those taken by passive types of fishing gear (i.e., rod, set nets, traps, longlines, etc.) as also described by the European Parliament (Martín 2012).
For the reported catch data, in Table 3 in van Anrooy et al. (2006), the composition of reported catches caught by either active or passive gear-type were used to separate industrial catches from artisanal catches, and the categorizations were available for every fifth year between 1950 and 1970. The years which were not specified during 1950-1970, were interpolated from previous years. It should be noted that from 1950 to 1960, catches caught by active gear-types increased at an astonishing rate of 6% per annum from 34% in 1950 to 92% in 1960. From 1970 onwards, the same annual percentage rate of increase in industrial fishing as the 1965-1970 period was used, which by 1979 equated to 100% of reported catches being industrial. It is assumed that in the last few decades, only industrial catches were reported, as mixed local species typical of artisanal catches seem largely unaccounted for.
Unreported industrial fishing operations were reconstructed within the EEZ of Georgia for both the domestic fleet (including Abkhazia) and foreign fleets. While Georgia was under Soviet jurisdiction (1950-1990), industrial catch statistics were assumed to have been relatively well reported. Hence, the following section deals mostly with unreported catch in the last two decades of the time period in question, 1990-2010. The methodology is presented separately for the anchovy fishery, which is by far the most prominent fishery in these waters, followed by fisheries targeting high valued species.
5

Anchovy
Catch for the anchovy fishery was calculated separately for the Abkhazia fisheries from the rest of Georgia, yet both regions had catch by domestic and foreign fleets.
Abkhazia
Since the turmoil for Abkhazia began in the early 1990s, the maritime area has been plagued with escalated levels of illegal activities, resulting from a lack of rules, regulations and control of their resources. The following describe some of the issues related to fisheries catches in the Abkhaz state:
• Thomas Moth-Poulson from the FAO stated that the level of IUU fishing in Abkhazian waters is possibly of an unrecognized magnitude which may seriously affect sustainable measures being applied elsewhere, creating unfairness in shared resource use (GFCM 2013);
• Much of the catches taken in Abkhazia stem from illegal and/or informal deals, neither of which can be reported;
• Abkhazia leases (some) of their continental shelf to Turkey for fishing, which equates to 15% of Abkhazia’s export revenue, and locals say the Turks have largely thinned the fish population in the shallow coastal waters (Delyagin 2009);
• Two Turkish companies (Konevy Ltd. and Kiyak Kardes Liyar) had ‘official’ contracts with the Ministry of Economy of Abkhazia and export their catches to Turkey (Kukhianidze et al. 2004);
• In recent years, Turkish-Abkhaz relations increased both politically and economically, and many Turkish fishing vessels are typically seen anchored in Sukhumi harbour;6
• About 30 Turkish fishing vessels operate in Abkhazia where no fisheries control exists;7 • Two-thirds of Abkhazia’s exports to Turkey are shipments of fish, fish meal and fish oil;8 • In addition to Turkish fishers, there are also Russian and Ukrainian fishers operating in Abkhazia,
targeting anchovy but also turbot, whiting, red mullet and prohibited sturgeon (Zengin et al. 2012).
In Abkhazia, in 2011, anchovy was fished by two Turkish, one Ukrainian and a few local companies for local processing and then export, but was not made available to locals. Instead, Abkhazians find frozen mullet and salted herring at their fish markets.9 The Abkhaz anchovy quota was recently increased from 17,000 t·year-1 in 2010 to 27,000 t·year-1 in 2011, all which was used.
It was estimated that the combined Russian, Ukrainian and Turkish catch from Abkhaz waters in early 2011 was about 50,000 t of small-sized anchovy (Oztürk et al. 2011). Since foreign fishing began in Abkhazia in 1996, anchovy catches were estimated at a conservative 13,000 t·year-1 in 1996, which was linearly increased to our 2011 published estimated catch amount of 50,000 t·year-1, which was applied to 2010. Of these annual totals, 60% was assumed to be caught by Turkish fishers and 20% each by Ukrainian and Russian fishers. Domestic unreported Abkhaz catches were thought to begin in 1992 at 2,000 t·year-1, which was linearly increased to 4,000 t in 2006, the year prior to the opening of the domestic plant processing anchovy (Gaerke and MothPoulson 2011); thereafter, catches were linearly interpolated to the 2010 domestic catch amount of 17,000 t. Both domestic anchovy catch and foreign fishing in Abkhaz waters were assumed to be unreported, as in (Oztürk et al. 2011) it was stated that Georgian and Turkish catches were definitely unreported, while data on other countries does not exist.
6 http://www.abkhazworld.com/Pdf/Reflections_on_Abkhazia.pdf 7 http://hamsi.ims.metu.edu.tr/sunumlar/4-IUU-GFCM[ACG].pdf 8 http://apsnypress.info/en/news/417.html 9 http://www.bakutoday.net/abkhaz-president-instructed-to-provide-the-population-of-black-sea-fish-which-nearly-wiped-out.html
6
Georgia (excluding Abkhazia)
Domestic catch
While FAO catch for Georgia was used as the reported landings baseline, one significant omission from reported catch data is that processed anchovy (into fish meal, oil and flour) are not reported as fish catches (Oztürk et al. 2011), but the processed fish meal and oil are reported as exports from Georgia, and likely reported as fishmeal/oil imports to Turkey, but not as fresh fish. Most Georgian caught anchovy (85-90%) is processed in fish meal factories (Gaerke and MothPoulson 2011), and three new fish processing plants opened in 2005 in Georgia (Kapadokia Ltd., Laguna Ltd. and Tedoradze Ltd.) with the capacity to process 250, 300 and 50 t·shift-1, respectively, under joint Georgian-Turkish ventures. Technically, these ventures are supposed to have 2/3 of their catches processed in Georgia while 1/3 is allowed to be exported unprocessed (Khavtasi et al. 2010); however freezing the catch technically classifies as processing so the frozen fish can easily be exported. Since processing capabilities in Georgia are limited, most exports are either chilled or frozen and then sent to Turkey.
According to the Abkhazian website for their chamber of commerce, Abkhazia claims to export over 8 t of fish meal and fish oil per year10 which was understood to be highly inaccurate. Abkhaz anchovy processing plants began in 2007 with Ooo Hamsa under Turkey’s largest fish oil and fish meal manufacturer, the Kobyalar Group. A trusted source stated that in early 2011, Abkhaz factories processed 17,000 t of fish and exported another 25,000 t to Turkey, some of which was reported (Oztürk et al. 2011). The first half of 2012 of the Abkhaz foreign trade showed a much more trusted amount of US $11 million in exports to Turkey in fish, fish meal and fish oil products.11 We assumed these amounts were already considered in our previous estimates of local and foreign Abkhaz catch in order to avoid double counting.
As of 2009, two freezing plants, one fishmeal plant and one smoking plant were operational in Poti, the major landing port in Georgia (Khavtasi et al. 2010). To account for the catches processed into fishmeal and fishoil, FAO’s Fishstat software was used to determine Georgian fishmeal and fishoil exports, which were available from 2004-2009, and Eurofish data (http://georgia.eurofish.dk/Countries/Georgia.pdf) was used to determine 2010 Georgian marine fish exports, which were considerable. In 2010, Georgia exported 2,870 t of fishmeal and 1,125 t of fish oil. The annual totals were applied the appropriate conversion ratio of 6.5:1 for fishmeal and 13:1 for fish oil (Gaerke and MothPoulson 2011) to convert to whole fish weight. Since export data for 2006 was missing, the values were interpolated (see Table 2) and the time series from 2004-2010 was used to estimate unreported domestic anchovy catch. Since exports were small yet still present in the 2000s (Gaerke and MothPoulson 2011), we interpolated from 0 t of unreported catch in 1999 to the 2004 amount of unreported catch (2,593 t).
Foreign catch
In Georgia, as in the Mediterranean, Turkey is the main fisher of European anchovy and captured about 36% of the world’s catch in 2008 (Gaerke and MothPoulson 2011). Turkish fishers have a history of fishing illegally in waters other than their own without permission, or for defying other rules such as minimum size or minimum depth limits (see also Ulman et al. 2013). Being aware of this, Georgian authorities have imposed the following regulations on Turkish anchovy fishers: protected ‘no-take’ areas, spatial restrictions >300 m from the coast, a minimum landing size of 7 cm (anchovy), total allowable catch, and to process most of the landings in Georgia. From 2009-2010, there were 32 Turkish fishers arrested for disobeying these laws,12 suggesting low compliance, including with reporting of catches.
10 http://www.tppra.org/en/livestock-sector-and-fisheries 11 http://www.abkhazworld.com/news/misc/900-russia-and-turkey-remain-abkhazias-main-trade-partners.html 12 http://hamsi.ims.metu.edu.tr/sunumlar/4-IUU-GFCM[ACG].pdf
7

Turkish fishers began targeting anchovy in Georgian waters in 1996, after purchasing permission from the Georgian government (Oztürk et al. 2011). The Turkish Ministry of Agriculture and Rural Affairs (MARA) published the number of Turkish vessels from 2002-2009 licensed to fish in Georgia; the number of vessels averaged 46 per year and the number of transport vessels averaged 14 per year, or roughly one transport vessel working per three purse seiners. Obviously, these numbers only include the ‘legal’ vessels. In 2009, Turkey had 5,973 licensed vessels operating in the Black Sea, 12% of which were of industrial class (12-50+ m long), signifying a massive presence and extraction potential (TÜİK 2010).
Although it cannot be shown with certainty that the Turkish fleet has exceeded the Georgian allowable catch for anchovy, the following sources support the notion:
1) A Turkish-hired seiner catches between 300-500 and sometimes 1,000 t·day-1 of anchovy (Khavtasi et al. 2010), thus, one Turkish seiner can catch somewhere between 30,000- 100,000 t·year-1 assuming an actual fishing season of 30-100 days;
2) In private interviews with the first author in July 2013, two Turkish seine fishers explained that one Turkish vessel fishing in Georgia/Abkhazian waters catches between 10,000- 20,000 t·season-1;
3) A captain of a Turkish carrier vessel working for one of two Turkish purse seiners which fished in Abkhazian waters, explained to a contact that in a 3 month period, he made 23 shipments of anchovy to the middle of the Turkish Black Sea coast13 (not the official landings port in the town of Hopa bordering Georgia where foreign anchovy are to be landed and hence reported), the smallest of which was 60 t but the average load being 100 t (Ulman et al. 2013);
4) Along with the transshipment of turbot from domestic Georgian vessels to Turkish vessels, mussel, rapa whelk and turbot as well as anchovy and sprat are illegally fished (Oztürk et al. 2011);
5) In 2007, Georgia signed a Free Trade Agreement with Turkey which came into effect in 2008. In 2009, Georgian exports to Turkey accounted for 20% of total Georgian exports; and
6) It is understood that anchovy sent for processing into fish meal and fish oil are not reported by either Turkey or Georgia, also the fresh and the processed anchovy products taken in Abkhazia waters are not thought to be recorded in either Georgian or Turkish catch data, and were estimated to total 50,000 t· year-1 in 2011 (Oztürk et al. 2011).
The Turkish fleet generally fishes for anchovy from January to March of each year (Zengin et al. 2012). Catches caught in Georgia but landed in the Turkish town of Hopa were registered from 2003-2009 (Table 1)(Oztürk et al. 2011). These catches were tagged as Turkish catches from Georgian waters in the present data since in the Turkish catch statistics, there were no catches originating from foreign waters. For 2010, we assumed the same values were caught as in 2009, as it is known the quota was reached.
In 2006, there was a Total Allowable Catch (TAC) of 60,000 t set for the industrial anchovy fishery (Komakhidze et al. 2007), 10% of which is reserved for small-scale Georgian companies, and the remainder to the highest bidder. For the purposes of this reconstruction, these ‘small-scale’ catches are actually industrial because the vessels employed are trawlers, albeit many are outdated and cannot compete with the new Turkish chartered vessels (Gaerke and MothPoulson 2011). Winning bidders own their portion of the quota for 10 years and the annual TAC varies each year based on scientific advice
13 Hopa is the ‘official’ import port from Abkhazia, which suggests that catches being landed outside of Hopa may have gone unreported.
8
(Mathews 2007), i.e., increased to 70,000 t for the 2010/2011 season, and to 80,000 t for the 2011/2012 season. There are now six main Georgian companies as license holders who charter about 20 Turkish vessels to catch the majority of the quota (Gaerke and MothPoulson 2011). In 2011, of these 6 Georgian companies, three owned fish meal factories, another was under construction and one was in the planning stages. Two-thirds of this catch is to be processed in Georgia, either by freezing the catch or by processing into fish meal/oil. Once allotted a quota, each vessel pays 15 GEL (i.e., $8.70 USD) per allotted tonnage as a regulation fee and an additional 25 GEL per tonne as a natural resource fee (Mathews 2007), independent of their actual catch amount.
The fish processing industry of the Ukraine was more prominent in the past since the Soviet Union was the main consumer of processed fish products, and according to van Anrooy et al. (2006) both Ukraine and Turkey began fishing in the 1990s in Georgia. Furthermore, van Anrooy et al. (2006) provided data on the total catch of anchovy in Georgian waters by national and foreign fleets from 1970-2003 for select years. We compared this data to FAO reported Georgian catch, assuming the difference between total catch and Georgian FAO catch to be foreign. We only considered catch from the years 1992 onward, as prior to this Georgia was part of the USSR and most likely Soviet catches predominated in their waters.
Any foreign catch from 1992-1995 was assigned to Ukraine, as Turkey only established an agreement to fish in Georgian waters in 1996. Thus in 1995, 0% of foreign catch was caught by Turkey and 100% by Ukraine. Starting in 2003, Turkish catch of anchovy in Georgia was available (Table 1), as was total catch data in van Anrooy et al. (2006), thus allowing a straightforward subtraction to yield Ukrainian catch. As a result, in 2003, 66% of foreign catch was caught by Turkey, and the remaining 34% by Ukraine. We interpolated the relative proportions of both Turkey and Ukraine to total foreign catch from 1995 to 2003, and therefore derived the estimated removals of each country’s catch for the years in between.
From 2003 onward, data on Turkish catch was available but estimates of total catch or Ukrainian catch is limited. Given the knowledge that there has been a seasonal quota of 60,000 t of anchovy since 2006 (although there is limited data on whether it was met) we assumed total catch in 2009 and 2010 was 60,000. It is more reasonable to assume that the quota was fully met in 2009 than in previous years because Georgian domestic catch of anchovy was reported at 24,500 t while Turkish catch was about 22,200 t (Oztürk et al. 2011), which are markedly higher than in previous years. This leaves the remainder of catch, assumedly, to be caught by Ukraine. To estimate Ukrainian catch from 2004-2008, we used the 2003 and 2009 anchor points to derive a ratio of Ukrainian catch in Georgia to all other catch (Georgian and Turkish) and interpolated this ratio between the two years. This was then applied to the total estimated landings of Georgian and Turkish catch. Since FAO catch data for 2010 was the same as in 2009, and we assumed that Turkish catch was comparable and the quota was comparable, catch for Ukrainian catch was also the same in 2010 as in 2009.
Other species
High-valued species caught in Georgian waters go unreported because there is no mandate requiring landed species which do not have specific catch quotas to be reported. From Komakhidze et al. (2007), several unreported species were monitored from 1990-2001, and their catches ranged from 288-355 t·year-1, but the trend showed that catches slightly increased throughout the period due to improved monitoring. From 2002-2010, the same values for the select unreported species as in the last year (2001) of their unreported estimations were applied as unreported catches. The data from the Komakhidze et al. (2007) graph were not 100% clear, so the values were estimated to our best ability, with a taxonomic group created for miscellaneous marine fish to equate to the same published totals from Komakhidze et al. (2007).
9

To include unreported catches for high-valued species in the Abkhaz region, these values were multiplied by 1.75 to attain estimates for the entire coast (based on the relative size of Abkhazia’s coast). Once each taxon’s values were estimated from 1990-2010, 50% of these catches were applied to the industrial sector, and the remainder, which were artisanal, were not used here, since artisanal catches were estimated using other methods, thus avoiding double-counting. Of the industrial unreported high-valued commercial catches, beginning in 1996, 90% of the catches were assumed to have been caught by Turkish fishers in Georgia, the remaining 10%, thought to have been caught by domestic fishers.
Artisanal sector
In Georgia, the artisanal fishery (locally referred to as the ‘traditional fishery’ or small-scale commercial) is defined as the commercial collection of fish and other living marine resources by traditional passive gear types. This sector is only permitted to operate within 300 m of the shoreline (Mathews 2007) and a licensing system for the coastal fisheries was not introduced until 2007.
Under Soviet rule, small-scale fishing with passive gear, such as trammel nets, gillnets, longlines, rod and line, etc., was conducted by semi-military organizations (van Anrooy et al. 2006), which consequently contributed to the security of the country. The small-scale sector played a significant role in the economy up until 1990, when it rapidly shrunk by almost half, the total number of people employed in (both large- and small-scale) marine fisheries was 3,400 in 1980, which decreased to 1,800 by 1990 (van Anrooy et al. 2006). This sector is technically supposed to be licensed, but in general, is not.
Seemingly, since 1988, when Georgia began reporting to the FAO independently, only a handful of commercial species (both pelagic and benthic, likely caught by bottom-, mid-water trawlers or seiners) were reported on. Since quotas are only placed on the industrial sector, is was assumed that the artisanal sector had not reported any catches during this period (1988-2010). If the artisanal sector had reported, there would then be some data on mixed coastal fish species. The FAO species list for marine fishes and invertebrates of Georgia only lists 19 taxa, only 8 of which had catch amounts in the first year of reporting in 1988. In the 1950-1987 data, using the same percentage of increase of the large-scale sector in comparison with the small-scale sector which had occurred from 1960-1970 (van Anrooy et al. 2006), it was assumed that catches of the small-scale sector were absent from the reported data as of 1979.
While one source stated that in the late 1980s that the small-scale fleet had an estimated 325 small-scale fishing boats, on closer inspection, this amount in some sources represented small-capacity bottom trawlers, which we considered to be part of the large-scale or industrial sector as that involves an active type of fishing, i.e., was towed from a boat such as a trawler or a seiner (Martín 2012). Thus, a type of fishing gear was considered to be used by the artisanal sector (i.e., small-scale) if only passive fishing methods were used, e.g., small nets, traps etc. (van Anrooy et al. 2006), hence the amount of small-scale vessels was not used as an anchor point. Another area in the same document suggested that there may have been about 1,000 small-scale small fishing units (vessels?) operating in the country, as there were about 300 in the Achara province alone.
In addition to the above, it was stated that the coastal fishery had approximately 1,500 full-time, and 300 part-time fishers in 2004 (excluding about 300 industrial fishers), and likely also hundreds of illegal fishers (van Anrooy et al. 2006). Thus, we assumed there to be 1,800 full-time fishers in 2004, which thus included the illegal as full-time fishers but excluded the part-time to remain conservative. We also used the above loose estimate of 1,000 small-scale vessels as an anchor point to determine the number of fishers per vessel (1,800 fishers divided by 1,000 vessels equated to 1.8 fishers per vessel). In 1980, we know there were roughly 88% more fishers in the total marine fisheries (i.e., 3,100 compared to 1,500 in 1990) and both the 1980 and 1990 amounts each had the industrial fishers subtracted to complete our time-series of artisanal fishers. The number of small-scale fishers was kept constant from 1950-1980. A
10

catch rate of 2 t·vessel-1·year-1 was applied from 1950-1985 per vessel, after which it was linearly decreased to 1 t·vessel-1·year-1 by 1990 and held constant to 2010 to acknowledge the tropic cascade in the Black Sea which resulted in smaller, lower quality fish, which mostly negatively affected the industrial sector more than the artisanal. Thus the number of boats was then multiplied by the annual catch rate to determine annual small-scale catches per vessel. Since it was assumed that the artisanal sector was accounted for in the early period, but unreported from about 1980, the annual calculated artisanal catch amounts had the reported artisanal amounts subtracted from them to determine the unreported artisanal portion from 1950-1979.
Since the number of small-scale fishers dramatically decreased from 1980-1990, around the time the turmoil began between Georgia and Abkhazia, this decrease in the number of fishers was understood to somewhat represent the separation of state by excluding the fishers from much of its coastline, hence, it was assumed that total small-scale catches did not actually decline much with the inclusion of Abkhazian catches. Although Abkhazia has claimed its independence from Georgia, this has not been recognized by most of the world, except for Russia and a few other countries. Despite the ongoing dispute, it is assumed here to be a part of the Georgian territory, a de facto sate, and its fisheries catches were here estimated for the first time for inclusion purposes, as we aim to include all unreported catches of the country. To include the catches of the Abkhaz region, the above estimated artisanal catches for Georgia from 1995 to 2010 were multiplied by 1.75 to determine amounts for the entire country, whereas from 1992 (the start of the Abkhaz war) to 1995, Abkhazia’s small-scale catches were linearly increased from 0 to 175%.
The species allocated to these catches varied annually reflecting the natural changes in the Black Sea ecosystem and were derived using a combination of expert advice from the Ukrainian fisheries (Vladyslav Shlyakhov, pers. comm.), Turkish Black Sea fisheries statistics, and the recreational catch composition. The taxonomic allocation for 1954 (what we deemed the first year of small-scale unreporting) and 2010 are provided in Table 3, and the amounts were interpolated in between.
Industrial discards
Discards are defined as the portion of the catch that is “thrown away, or dumped at sea” (Kelleher 2005), and may include both commercial and non-commercial species. Reasons for discarding include damaged or spoiled catches, target-species smaller than the legal landing size, or having little or no market or commercial value (Rousou 2009).
Since very little publicly available data exist on the earlier composition of the fishing fleet (prior to 1980), besides a fleet of Black Sea seiners beginning in 1945,14 the Georgian fleet was assumed to have similar development to the Ukrainian fishing fleet, both ex-Soviet Union States. Thus from 1950-2010, 60% of landings of the industrial fleet (except sea snail which is calculated separately) were assumed to have been fished by purse seine, 20% by bottom trawl, and 20% by mid-water trawl. From 1980-1990, 20% of the fleet was known to be bottom trawlers (FAO 2005), and bottom trawling was noted to be a leading cause of fish biodiversity and biomass decline. In the 2000s, in Abkhazia, vessels fishing for the joint Turkish-Abkhaz company Amalgur were known to use bottom trawls, and also 20% of the ‘seiners’, which operated out of Poti, actually fished via bottom trawl (Khavtasi et al. 2010). One published Black Sea bottom trawl discard rate was 42% (Ceylan et al. 2014), but to be conservative, this rate was reduced to 30%. Of this 30% bottom trawl discard rate, 10% was allocated as damaged, juvenile, or otherwise unmarketable sprat, 5% as damaged or juvenile anchovy, the remaining 15% were allocated as non-target (i.e., non-commercial fish, Table 5) and invertebrates. Other commonly occurring benthic species had commercial value and thus would be retained by-catch, and not ‘discarded’.
14 http://georgia.eurofish.dk/Countries/Georgia.pdf
11

It has been suggested that the Black Sea anchovy purse seine fleet has a zero discard rate (Kelleher 2005), but it is understood that in the winter months of December and January, sprat is often caught as by-catch in the anchovy fishery (Shlyakhov, unpubl. data), and sprat can make-up 10-60% of total anchovy catch when anchovy is the target (C. Keskin, pers. comm.). Since some fish processing plants only accept anchovy, much of the incidentally-caught sprat is discarded. In the Black Sea, sprat and anchovy biomasses increased together in the 1970s, and since anchovy was of higher value, many fishers switched their target species to anchovy. A sprat fishery only became commercially viable post-1990, after the Black Sea fisheries crisis, and was largely discarded prior to that. The sprat composition in anchovy fisheries can range from 10-60% (known to be higher in the western Black Sea), since they temporally occur together for about a third of the anchovy season. Thus, from 1950-2010, for the purse seine catches, a 10% sprat discard rate was initially allocated, but since the two species are only closely associated for 1/3 of the anchovy season, the 10% was divided by three to temporally represent their co-occurrence which resulted in a 3.3% annual discard rate (applied to sprat) for the anchovy fisheries. Sprat are occasionally landed for processing, but are still often discarded if the associated fishmeal factory is selective. An additional 1% discard rate was calculated to represent non-marketable fish species, thus, a total discard rate of 4.3% was applied to purse seine catches.
The published discard rate for mid-water trawlers is 5.1% (Kelleher 2005). To be conservative, mid-water trawlers were also assumed to have the same 4.3% discard rate as the seiners, as they share similar fishing behaviour. The discard rates for purse seine, bottom trawl and mid-water seine were applied to the reported and unreported industrial catches. Foreign discards were allocated to the specific country fishing them.
Sea snails in Georgia are fished by the ‘cage trawl’ method (Mathews 2007), a mixture between a dredge and a bottom trawler. We applied a sea snail discard rate of 11.5% (Kelleher 2005), which was assumed to consist of equal amounts of miscellaneous marine fish and miscellaneous marine crustaceans.
Recreational fishing
We realized that recreational, subsistence and some aspects of small-scale commercial fisheries form a continuum, and may be hard to separate, however, here recreational and subsistence fisheries are defined and estimated separately.
We are defining the recreational fishery here as fishing primarily for pleasure, and generally neither for commercial sale, nor for the primary purpose of feeding one’s self or one’s family. The recreational fishery in Georgia is locally referred to as either the ‘amateur’ or ‘sports’ fishery and is defined as fishing with any kind of fishing rod, spinning net, throw net, racket net, draught net or the hunting and collection of marine life without the use of scuba gear (Mathews 2007).
Recreational fishing is widespread in Georgia, and the fishers are well-equipped (Khavtasi et al. 2010). Khavtasi et al. (2010) suggested that the number of recreational fishers is high, and their annual catch may be around several hundred tonnes.
To assemble a time-series of Georgian population statistics, the time-series of Tsiklauri and Sulaberidze (2013) was used, which addressed many inconsistencies in the national data, which also included the Abkhaz population.
Given that Georgia has the highest percentage (38.6%)15 of people living coastally among Black Sea countries, it was assumed that the number of recreational fishers was fixed at a low rate of 0.25% of the
15 http://www.wetlands.org/Portals/0/publications/BSO%20publications/vision_fin.pdf
12

total population from 1950-1975 (due to a strong military presence which would have deterred many leisure fishers), after which it was linearly increased to 1% of the population by 1990, and a catch rate of 49 kg·fisher-1·year-1 (verified by local experts for use for the Ukrainian catch reconstruction) was used from 1992-2010, this catch rate was linearly increased by 50% to 73.5 kg·fisher-1·year-1 for the 1950-1975 period (to represent larger and more abundant fish in the earlier Black Sea ecosystem), and then the two catch rates were interpolated between 1976 and 1991. The values from 1989-1992 were reduced by 50% to account for the ‘Black Sea fishery crisis’ which negatively affected mainly small pelagic catches.
The taxa allocated to the recreational and subsistence sectors were varied to reflect the natural changes in the Black Sea ecosystem, and were derived using a combination of expert (Ukrainian) advice, Turkish fisheries statistics and recreational catch knowledge. In Table 4, each taxon’s contribution to the total sum was presented as a percentage for both 1950 and 2010, and were largely interpolated in between following expert advice.
Subsistence fishing
Subsistence fishing is generally defined as fishing for the primary purpose of feeding one’s self or family, and thus generally not for commercial sale. Due to Georgia’s recent increase in economic hardship and the associated decrease in social welfare, it is understood here that the subsistence sector primarily fishes to provide fresh protein for one’s self or one’s family, but also may sell some catches if they were substantial or if the landed species were of high-value.
While a subsistence fishery certainly exists in Georgia, no studies have ever been conducted on this sector. An analysis of all peer-reviewed and grey literature uncovered the following on this sector:
• There are too many fishers sharing reduced revenues. When asked why they continued to fish, the fishers said it was because they needed to eat, even if profits were zero signifying that subsistence fishing is as important as fishing for profit (Mathews 2007); and
• Post-independence, Georgians have been trying to survive under poor socio-economic conditions which have led to increased unemployment and also increased impoverishment. Subsequently, fish poaching (as in the taking of protected fish) has recently increased (Komakhidze et al. 2007), which for many, is a main means for survival. Both poaching and illegal fishing happen year-round, but are more significant during certain spawning periods, when the fish are more vulnerable, as with sturgeons.
From the above, we assumed that 1.0% of the total population fished for subsistence purposes from 1950 to 1989, which was linearly increased to 1.5% of the population by 1991, when the state-authoritative control was significantly reduced. This rate was held constant from 1991-2010. We suspect this may have been an underestimate for recent times.
We assumed a catch-rate which was one-third less than the recreational fishery which equated to 32.6 kg·fisher-1·year-1, which was held constant from 1992-2010. The catch rate was doubled from 1950-1985 to 65 kg·fisher-1·year-1 due to the former presence of larger predatory fish, and then the rate was linearly decreased from 1986 to the 1992 value. The catches from 1989-1992 were additionally reduced by 50% to account for the fishery crisis which affected the entire Black Sea, mostly brought on by overfishing, a trophic cascade and then a ctenophore invasion which consumed much of the eggs of the small pelagics.
13

RESULTS
Georgia as a whole
Our reconstruction of Georgia’s total catch from 1950 to 2010 established an independent reported baseline for Georgia, as none was previously available. The total reconstructed catch used this newly derived reported baseline, along with our best estimates of unreported industrial, artisanal, recreational, and subsistence landings, as well as major discards (Figure 2a, Appendix Table A1), and the separate estimation of foreign fishing in Georgia (Figure 3).
The total reconstructed catch for the Georgia averaged just under 10,000 t·year-1 in the early 1950s, after which it gradually increased to 45,600 t in 1970, increased rapidly to peak in 1980 with 133,000 t and sustained these levels until 1988. After this point, the fisheries rapidly crashed to 12,200 t by 1991 due to the Black Sea fisheries crisis, the collapse of the Soviet Union, and the associated cessation of funding to the industrial fisheries, only beginning to recover in the 2000s as catch reached 92,000 t in 2010 (Figure 2a, Appendix Table A1). For the entire time period, total reconstructed catch was 41% higher than the derived baseline of reported catches from 1950-2010.
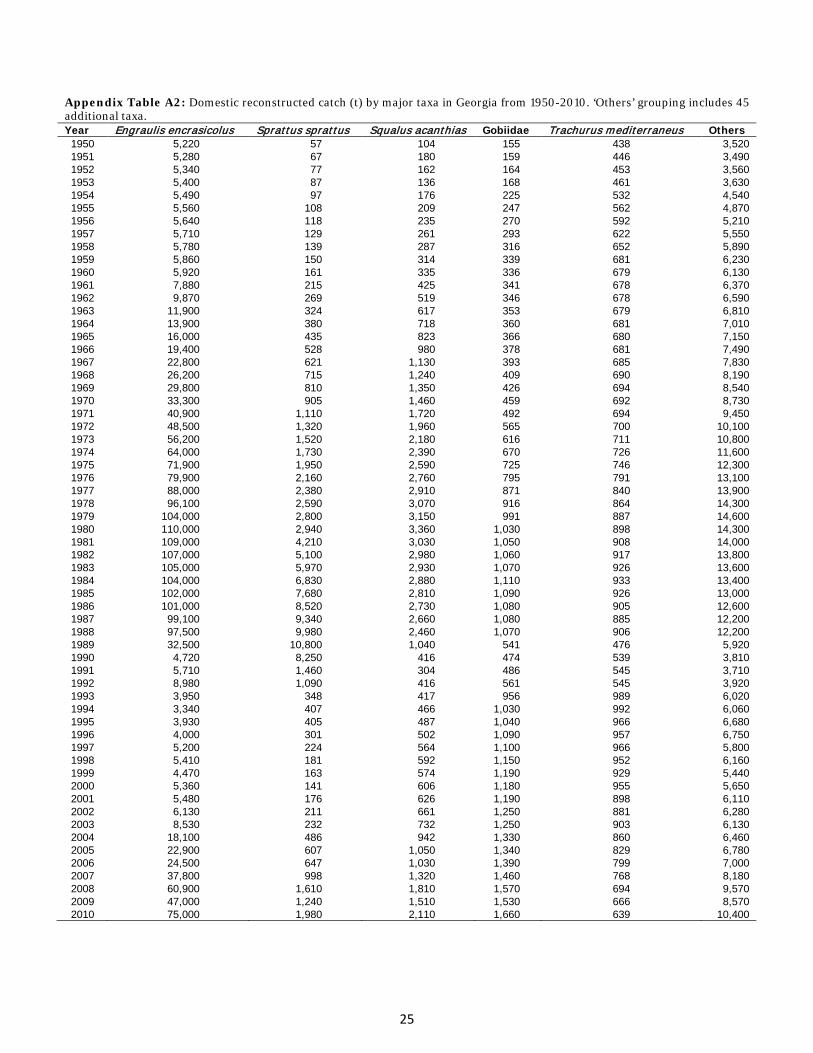
From the total reconstructed catches (inclusive of the reported data) for the 1950-2010 period (Figure 2b, Appendix Table A2), the major taxonomic contributors to the catches were European anchovy (74%) and European sprat (4%), and the minor contributors were picked dogfish (3%), gobies (Gobiidae) (2%), and Mediterranean horse mackerel (2%) with 45 additional taxa contributing to the remaining 17% of the catches (Figure 2; Appendix Table A2).
Industrial landings
Reported industrial landings for Georgia averaged 2,700 t∙year-1 in the early 1950s, peaked in 1980 with 111,000 t, declined substantially after 1988, with catch averaging only 2,000 t∙year-1 from 1993-2002, thereafter increasing to reach 25,500 t∙year-1 in the late 2000s. Unreported catches in the industrial fisheries only began in 1991 after the collapse of the Soviet Union, and increased dramatically from 93 t of catch in 1991 to over 50,000 t in 2010, due to undocumented catch in Abkhazia and in domestic fishmeal/oil operations (Figure 2a, Appendix Table A1).
The major species landed by the industrial sector from 1950-2010 were European anchovy (94.8%), European sprat (2.4%), and smaller amounts of picked dogfish, horse mackerel, grey mullets, bonito, and an additional 25 taxa each contributing less than 1% each to catch.
Artisanal landings
Reported artisanal landings were 4,170 t in 1950, and then were assumed to gradually decrease to a reported contribution of 20 t in 1979. Unreported artisanal landings were assumed to have begun in 1954 at 1,050 t, gradually increased to peak in 1978 at 3,440 t, after which they decreased to average just over 800 t·year-1 during 1989-1991, and then increased to 2,750 t∙year-1 in the late 2000s (Figure 2a, Appendix Table A1).
The major taxa landed by the artisanal sector from 1950-2010 were European anchovy (26.5%), mullets (Mugilidae) (8.6%), whiting (7.7%), gobies (7.5%), bluefish (Pomatomus saltatrix) (6.4%), picked dogfish (5.8%), sturgeons (5.2%), Mediterranean mussel (4.5%), and Mediterranean horse mackerel (4.5%), with 17 other taxa making up the remaining 23.3% of catches.
14

Recreational fisheries
Recreational landings (all unreported) averaged 650 t∙year-1 in the early 1950s, peaked in 1988 with 2,400 t, crashed to 1,200 t∙year-1 from 1990-1992, and have since increased to 1,900 t∙year-1 in the late 2000s, but have slowly been declining since 1993 (Figure 2a, Appendix Table A1).
The major taxa which we assumed were caught by the recreational sector from 1950-2010 were Mediterranean horse mackerel (14.4%), Mediterranean mussel (11.6%), bluefish (11.0%), gobies (10.4%), whiting (10.0%), So-iuy mullet (Liza haematocheila, 7.6%), sea snails (5.1%), with 14 other taxa accounting for the remaining 30% of catch.
Subsistence fisheries
Subsistence landings (all unreported) gradually grew from 2,300 t in 1950 to 3,200 tons in 1985, declined to a low of 1,500 t in 1989, increased to 3,500 t∙year-1 just after independence and have since declined to average 2,800 t∙year-1 in the late 2000s (Figure 2a, Appendix Table A1).
The major species we assume were caught for subsistence purposes were Mediterranean horse mackerel (14.5%), Mediterranean mussel (12.2%), bluefish (11.6%), whiting (10.0%), gobies (8.9%), and So-iuy mullet (5.6%), and grey mullets (5.0%) with 14 other taxa accounting for the remaining 32.1%.
Discards
Discards were applied to industrial catches and hence followed their trend. Discards averaged 300 t∙year- 1 in the early 1950s, gradually increased to peak from 1980-1988, averaging 13,000 t∙year-1, after which they dipped to 600 t∙year-1 from 1993 – 2000 before rebounding to reach over 9,000 t by 2010. Discards were composed of mostly sprat (22%), picked dogfish (18%), skates (Rajidae; 14%) and whiptail stingrays (Dasyatidae; 14%).
Foreign fishing
Foreign fishing grew from 190 t in 1991 to 85,700 t in 2010, while discards grew from 20 t to 10,300 t, with Turkey accounting for 59% of catch, Ukraine for 27%, and Russia for 14% (Figure 3).
DISCUSSION
This reconstruction of fishery catches for Georgia in Georgian waters from 1950-2010 is a first attempt at comprehensively correcting omissions and improving on the taxonomic detail of locally caught species for the complete 1950-2010 time period. There is a serious lack of taxonomic knowledge transfer in the country which needs to be addressed so that the state of its resources can be tracked and managed.
The fisheries catches of Abkhazia from separation up until 2012 (when they began reporting exports) is completely unreported and the amount of catch is certain to be high, as is illustrated by the estimates presented here. There appear to be several formal foreign fishing agreements (none of which could be located for our purposes) as well as informal foreign fishing agreements, the latter of which are likely not reported in either the country fishing or in Abkhazia. The Abkhaz marine catches are understood here to be completely omitted from the data reported on behalf of Georgia to the FAO after 1992 and were reconstructed here using conservative best estimates which utilized the available published data and grey literature but catches may be much higher. These estimates are a first attempt at putting numbers to the unknown, and to present the issue using all available information.
15

The credibility of Georgia’s fisheries statistics deteriorated rapidly after the collapse of the Soviet Union due to major reductions to the formerly state-funded industrial fisheries, and severely reduced Monitoring, Control and Surveillance (MSC) capabilities. Statistics were not reported by Georgia to the FAO after 2004, with the exception of 2007, and the ‘reported’ totals were instead interpolated from previous years. This was still used as our baseline, with efforts made to improve upon this.
While it is understood that domestic enforcement ramped up in 2006, leading to arrests and hence influenced many to obey laws (Mathews 2007), the scale of foreign fishing is still known to be high, plus the other domestic sectors which are not reported for at all.
According to a 2012 GFCM ad hoc Working Group meeting on the Black Sea’s fisheries, future goals of the group will incorporate improving scientific information, develop regional databases, identify data required to develop an Ecosystem Approach for Fisheries (EAF), better understand the role of the artisanal sector, and to assess unreported fishing.16 It remains to be seen if this can be achieved.
A small stock assessment team and fishery management unit is urgently needed to assess, monitor and collect data on stocks and catches (Mathews 2007). The Center for Statistics, Monitoring and Prognostication (CSMP) lacks enough skilled technical staff, equipment and operation funds to carry out their mandate.
Georgia’s present quota for anchovy of 70,000 t·year-1 is not based on scientific advice, such as stock assessments, but rather based on the necessity of economic aid (Mathews 2007). Stock assessments of the most important and valuable commercial fishery stocks are urgently needed in Georgia, so that the remaining abundant anchovy fishery does not run out as anchovy seems to be the last existing commercially viable stock; sprat is also abundant but does not seem to be a prime commercial target since many fish meal/oil plants do not accept sprat for processing, nor is it used for human consumption. The future and sustainability of the resources are in question and should be made the primary goal to at least provide some fresh fish to locals, considering the fishing contribution to GDP has undoubtedly diminished over time.
ACKNOWLEDGEMENTS
We acknowledge support from the Sea Around Us, a scientific collaboration between The Pew Charitable Trusts and the University of British Columbia. We would also like to thank the Paul G. Allen Family Foundation for supporting the Sea Around Us.
16 http://151.1.154.86/GfcmWebSite/SAC/SubCommittees_2012/Farrugio-Blacksea.pdf
16

REFERENCES
Ceylan Y, Sahin C and Kalayci F (2014) Bottom trawl fishery discards in the Black Sea coast of Turkey. Mediterranean Marine Science 15(1): 156-164.
Daskalov G (2002) Overfishing drives a trophic cascade in the Black Sea. Marine Ecology Progress Series 225: 53-63.
Delyagin M (2009) A testing ground for modernization and a showcase of success. Russia in Global Affairs: 12.
Eremeev V and Zuyev G (2007) Commercial fishery impact on the modern Black Sea ecosystem: a review. Turkish Journal of Fisheries and Aquatic Sciences 7: 75-82.
FAO (2005) FAO Country Profile Georgia. http://www.fao.org/fi/oldsite/FCP/en/GEO/profile.htm. Gaerke I and MothPoulson T (2011) Potential and challenges for investments in the anchovy fish industry
in Georgia. Internal Report for FAO SEU/REU Budapest, ???? 35 p. Available at: http://www.fao.org/fileadmin/user_upload/Europe/documents/Publications/Report_Georgia_Fish_29092011.pdf [Accessed: April 5, 2013].
GFCM (2013) Joint GFCM-BSC Workshop on IUU Fishing in the Black Sea Black Sea Commission HQ, Istanbul, Turkey, 25-27 February 2013 17 p.
Kelleher K (2005) Discard's in the world's marine fisheries: An update. FAO Technical Paper 470, Rome, FAO: 131.
Khavtasi M, Makarova M, Lomashvili I, Phartsvania A, Moth-Poulson T and Woynarovich A (2010) Review of fisheries and aquaculture development potentials in Georgia. FAO Fisheries and Aquaculture Circular No. 1055/1, Food and Agriculture Organization of the United Nations (FAO), Rome. 82 p.
Komakhidze A, Goradze R, Diasamidze R, Mazmanidi N and Komakhidze G (2007) Fish, fisheries and dolphins as indicators of ecosystem health along the Georgian coast of the Black Sea. pp. 251-260 In Payne AIL, O'Brien CM and SRogers SI (eds.), Management of shared fish stocks. Blackwell Publishing Ltd, Cornwall.
Kukhianidze A, Kupatadze A and Gotsiridze R (2004) Smuggling through Abkhazia and Tskhinvali region of Georgia. American University, Transnational Crime and Corruption Center (TraCCC) Georgia Office, Tbilisi, Georgia. 106 p.
Martín JI (2012) The small-scale coastal fleet in the reform of the Common Fisheries Policy. Note IP/B/PECH/NT/2012_08, European Parliament, Directorate General for Internal Policies, Policy Department B: Structural and Cohesion Policies - Fisheries, Brussels (Belgium). 38 p.
Mathews CP (2007) Fisheries assessment for Ministry of Environment Protection and Natural Resources of Georgia. International Executive Service Corps. 100 p.
Mazmanidi N and Komakhidze A (1996) On the biodiversity of the Georgian Black Sea coast. pp. 129-150 In Kotlyakov V, Uppenbrink M and Metreveli V (eds.), Conservation of the biological diversity as a prerequisite for sustainable development in the Black Sea region. Proceedings of the NATO advanced research workshop on conservation of the biological diversity as a prerequisite for sustainable development in the Black Sea region, Batumi, Georgia, October 5-12, 1996.
Oztürk B, Keskin C and Engin S (2011) Some remarks on the catches of anchovy, Engraulis encrasicolus (Linnaeus, 1758), in Georgian waters by Turkish fleet between 2003 and 2009. Journal of the Black Sea/Mediterranean Environment 17(2): 145-158.
Pauly D (2009) Beyond Duplicity and Ignorance in Global Fisheries. Scientia Marina 73(2): 215-223. Pauly D, Christensen V, Dalsgaard J, Froese R and Torres FJ (1998) Fishing Down Marine Food Webs.
Science 6 279(279): 860-863. Punsman B (2009) Questioning the embargo on Abkhazia: turkey’s role in integrating into the black sea
region. Turkish Policy Quarterly: 12. Raykov V (2010) Fishery Report on suitability of BSIS data for calculation of indicators. pp. 165-184 In
‘Diagnostic Report’ to guide improvements to the regular reporting process on the state of the Black Sea environment. Commission on the Protection of the Black Sea Against Pollution, Istanbul, Turkey.
Rousou M (2009) Non-commercial marine invertebrate discards of small-scale coastal fisheries: a case study in Cyprus (Levantine, Eastern Mediterranean Sea). Biological Diversity thesis, University of Plymouth, Fisheries Research. 69 p.
Rukhadze V (2010) Georgia's demographic crisis. Center for Black Sea/Caspian Studies, School of International Service, American University, Washington, D.C. 13 p.
17
Tsiklauri S and Sulaberidze A (2013) Qualitative and methodological aspects of population projections in Georgia; Georgian Population Prospects: 1950-2050. Joint Eurostat/UNECE Work Session on Demographic Projections organised in cooperation with Istat (29-31 October 2013, Rome, Italy). United Nations Statistical Commission and Economic Commission for Europe, Eurostat. 11 p.
TÜİK (2010) Su Urunleri Anket Sonuclari- Fishery Statistics 2010. Türkiye İstatistik Kurumu, Ankara, Turkey.
Ulman A, Bekişoğlu Ş, Zengin M, Knudsen S, Ünal V, Mathews C, Harper S, Zeller D and Pauly D (2013) From bonito to anchovy: a reconstruction of Turkey’s marine fisheries catches (1950-2010). Mediterranean Marine Science 14(2): 309-342.
van Anrooy R, Millar A and Spreij M, editors (2006) Fisheries and aquaculture in Georgia- Current status and planning. FAO, FAO Fisheries Circular No. 1007, Rome, Italy. 160 p.
Zeller D, Booth S, Davis G and Pauly D (2007) Re-estimation of small-scale fisheries catches for U.S. flag island areas in the Western Pacific: The last 50 years. Fishery Bulletin 105: 266-277.
Zeller D and Rizzo Y (2007) Country disaggregation of catches of the former Soviet Union (USSR). pp. 157-163 In Zeller D and Pauly D (eds.), Reconstruction of marine fisheries catches by countries and regions (1950-2005). Fisheries Centre Research Reports 15 (2). University of British Columbia, Vancouver.
Zengin M, Genç Y and Ak O (2012) A preliminary investigation on the state of Turkish fishing fleet of anchovy along north eastern Black Sea- Translated from: Kuzeydoğu Karadeniz (Gürcistan, Abazya) Kıyılarında Hamsi Avlayan Türk Balıkçı Filosunun Durumu Üzerine Bir Ön Araştırma. Yunus Araştırma Bülteni 4: 27-43.
18

Figure 1. Map of Georgia, its ports of interest, continental shelf, and Exclusive Economic Zone (EEZ). The depth limit of the continental shelf here is shown to 100m, since there is very little life beyond that depth due to the anoxic layer.
19

Figure 2. Time-series of marine catches for Georgia from 1950-2010 by a) sector (plus discards) with reported data overlaid as a solid black line and b) by major caught taxa, with ‘Others’ grouping including 45 additional taxa.
-
20
40
60
80
100
120
140
1950 1960 1970 1980 1990 2000 2010
Cat
ch (
t x
103 )
Year
Subsistence
Discards
RecreationalIndustrial
Reported landings
Artisanal
-
20
40
60
80
100
120
140
1950 1960 1970 1980 1990 2000 2010
Cat
ch (
t x
103 )
Year
Engraulis encrasicolus
Sprattus sprattusSqualus acanthias
Gobiidae
Trachurus mediterraneus
Others
20

Figure 3. Foreign fishing catches of Turkey, Ukraine, and Russia in Georgia, including Abkhazia, from 1990-2010.
0
20
40
60
80
100
120
1990 2000 2010
Cat
ch (
t x
103 )
Year
Turkey
Russia
Ukraine
21

Table 1. Turkish catch of anchovy in Georgian waters from 2003-2009; data from (Oztürk et al. 2011). Year Catch (t) 2003 6,408 2004 3,906 2005 8,485 2006 4,944 2007 4,793 2008 10,259 2009 22,173
Table 2. Fish meal/oil statistics discrepancies from Georgia excluding Abkhazia. Year Catch equivalent (t) 2004 2,593 2005 9,243 2006 11,063 2007 12,883 2008 24,258 2009 8,560 2010 33,280
Table 3. Catch allocation proportions applied to artisanal catches for 1950 and 2010 in Georgia, with year in between interpolated. Taxa 1950 2010 Pomatomus saltatrix 0.10 0.08 Acipenseridae 0.10 0.00 Merlangius merlangus 0.10 0.10 Trachurus mediterraneus 0.06 0.06 Xiphias gladius 0.06 0.00 Mytilus galloprovincialis 0.06 0.06 Shrimps and prawns 0.06 0.00 Platichthys flesus 0.06 0.00 Mugilidae 0.06 0.02 Mullus barbatus barbatus 0.06 0.01 Gobiidae 0.05 0.15 Serranidae 0.05 0.00 Umbrina cirrosa 0.04 0.00 Engraulis encrasicolus 0.03 0.08 Sarda sarda 0.03 0.02 Belone belone 0.03 0.00 Squalus acanthias 0.01 0.15 Rajiformes 0.01 0.05 Scophthalmus maximus 0.01 0.01 Decapoda 0.01 0.01 Scomber scombrus 0.01 0.00 Atherinidae 0.00 0.04 Mugil soiuy 0.00 0.16
22

Table 4. Recreational and subsistence catch allocation proportions for Georgia, 1950-2010. Common name of species 1950 2010 Bluefish 0.13 0.04 Atlantic mackerel 0.01 0.00 Mediterranean horse mackerel 0.15 0.10 Mediterranean mussel 0.14 0.10 Shrimps 0.05 0.05 European flounder 0.05 0.00 Grey mullets 0.05 0.05 Red mullets 0.05 0.02 Gobies 0.05 0.20 Whiting 0.10 0.10 Groupers and seabream 0.04 0.00 Shi drum 0.04 0.00 Bonito 0.03 0.01 Garfish 0.03 0.00 Dogfish 0.02 0.02 Rays/skates 0.02 0.02 Turbot 0.02 0.02 Sturgeons 0.01 0.00 Crabs/lobsters 0.01 0.00 Sea snail 0.00 0.07 Pacific mullet 0.00 0.20
Table 5. Bottom trawl discards (%) Squalus acanthias 25.0 Rajidae 20.0 Dasyatidae 20.0 Misc. marine crustaceans 10.0 Scorpaenidae 5.0 Gobiidae 5.0 Echinoderms 5.0 Misc. marine molluscs 5.0 Congridae 2.5 Muraenidae 2.5
23

Appendix Table A1. Time series of domestic reported marine fisheries landings (t) in Georgia and its reconstructed total catch by sector, e.g., industrial, artisanal, recreational, and subsistence landings and discards, from 1950-2010. Year Reported landings Total reconstructed catch Industrial Artisanal Recreational Subsistence Discards 1950 6,320 9,490 2,150 4,170 643 2,280 258 1951 6,350 9,620 2,530 3,820 655 2,320 304 1952 6,380 9,750 2,910 3,470 666 2,360 349 1953 6,410 9,880 3,300 3,120 678 2,400 396 1954 6,440 11,100 3,690 3,810 689 2,440 443 1955 6,470 11,600 4,080 3,810 701 2,480 490 1956 6,510 12,100 4,480 3,810 712 2,520 538 1957 6,540 12,600 4,880 3,820 724 2,560 586 1958 6,570 13,100 5,280 3,820 735 2,600 634 1959 6,600 13,600 5,690 3,820 744 2,630 683 1960 6,630 13,600 6,100 3,310 753 2,670 733 1961 8,810 15,900 8,140 3,320 763 2,700 978 1962 11,000 18,300 10,200 3,340 772 2,730 1,230 1963 13,200 20,700 12,300 3,360 781 2,760 1,480 1964 15,400 23,100 14,400 3,370 790 2,800 1,730 1965 17,500 25,400 16,500 3,320 799 2,830 1,980 1966 21,200 29,400 20,000 3,360 809 2,860 2,400 1967 24,800 33,400 23,500 3,390 818 2,890 2,820 1968 28,400 37,500 27,100 3,420 827 2,930 3,250 1969 32,000 41,600 30,700 3,460 832 2,940 3,680 1970 35,600 45,600 34,300 3,350 837 2,960 4,120 1971 43,400 54,300 42,000 3,430 841 2,980 5,050 1972 51,300 63,200 49,800 3,500 846 2,990 5,990 1973 59,100 72,100 57,700 3,570 851 3,010 6,930 1974 66,900 81,100 65,700 3,640 856 3,030 7,890 1975 74,700 90,200 73,700 3,710 861 3,040 8,850 1976 82,600 99,500 81,800 3,790 1,010 3,060 9,830 1977 90,400 109,000 90,000 3,860 1,150 3,080 10,800 1978 98,200 118,000 98,200 3,460 1,290 3,100 11,800 1979 106,000 127,000 106,000 3,440 1,420 3,110 12,700 1980 111,000 133,000 111,000 3,260 1,550 3,130 13,400 1981 111,000 132,000 111,000 3,080 1,670 3,150 13,300 1982 110,000 131,000 110,000 2,900 1,790 3,160 13,200 1983 109,000 130,000 109,000 2,710 1,900 3,180 13,100 1984 108,000 129,000 108,000 2,560 2,000 3,200 13,000 1985 107,000 128,000 107,000 2,140 2,100 3,220 12,900 1986 107,000 126,000 107,000 1,760 2,200 3,130 12,800 1987 106,000 125,000 106,000 1,420 2,280 3,050 12,700 1988 105,000 124,000 105,000 1,110 2,390 3,000 12,600 1989 42,600 51,300 42,600 833 1,250 1,470 5,120 1990 12,700 18,200 12,700 845 1,290 1,800 1,530 1991 7,120 12,200 7,210 836 1,280 2,020 866 1992 7,790 15,500 9,870 1,380 1,200 1,880 1,190 1993 2,190 12,700 4,410 1,900 2,330 3,500 530 1994 1,400 12,300 3,760 2,430 2,260 3,390 452 1995 2,470 13,500 4,980 2,470 2,180 3,270 605 1996 2,450 13,600 5,100 2,500 2,150 3,230 620 1997 2,580 13,900 5,380 2,530 2,120 3,180 647 1998 3,000 14,400 5,930 2,570 2,090 3,140 713 1999 1,400 12,800 4,480 2,600 2,060 3,090 538 2000 1,770 13,900 5,510 2,630 2,030 3,050 664 2001 1,630 14,500 6,040 2,660 2,020 3,020 731 2002 1,800 15,400 6,880 2,700 2,000 3,000 831 2003 3,270 17,800 9,010 2,730 1,980 2,970 1,080 2004 11,900 28,200 18,300 2,750 1,960 2,950 2,200 2005 9,920 33,500 23,100 2,750 1,950 2,920 2,780 2006 9,660 35,400 24,800 2,750 1,930 2,900 2,980 2007 18,100 50,500 38,400 2,750 1,910 2,870 4,620 2008 26,500 76,200 61,300 2,750 1,900 2,840 7,370 2009 25,000 60,600 47,400 2,750 1,880 2,820 5,700 2010 25,000 91,800 75,400 2,750 1,860 2,790 9,060
24
Appendix Table A2: Domestic reconstructed catch (t) by major taxa in Georgia from 1950-2010. ‘Others’ grouping includes 45 additional taxa. Year Engraulis encrasicolus Sprattus sprattus Squalus acanthias Gobiidae Trachurus mediterraneus Others 1950 5,220 57 104 155 438 3,520 1951 5,280 67 180 159 446 3,490 1952 5,340 77 162 164 453 3,560 1953 5,400 87 136 168 461 3,630 1954 5,490 97 176 225 532 4,540 1955 5,560 108 209 247 562 4,870 1956 5,640 118 235 270 592 5,210 1957 5,710 129 261 293 622 5,550 1958 5,780 139 287 316 652 5,890 1959 5,860 150 314 339 681 6,230 1960 5,920 161 335 336 679 6,130 1961 7,880 215 425 341 678 6,370 1962 9,870 269 519 346 678 6,590 1963 11,900 324 617 353 679 6,810 1964 13,900 380 718 360 681 7,010 1965 16,000 435 823 366 680 7,150 1966 19,400 528 980 378 681 7,490 1967 22,800 621 1,130 393 685 7,830 1968 26,200 715 1,240 409 690 8,190 1969 29,800 810 1,350 426 694 8,540 1970 33,300 905 1,460 459 692 8,730 1971 40,900 1,110 1,720 492 694 9,450 1972 48,500 1,320 1,960 565 700 10,100 1973 56,200 1,520 2,180 616 711 10,800 1974 64,000 1,730 2,390 670 726 11,600 1975 71,900 1,950 2,590 725 746 12,300 1976 79,900 2,160 2,760 795 791 13,100 1977 88,000 2,380 2,910 871 840 13,900 1978 96,100 2,590 3,070 916 864 14,300 1979 104,000 2,800 3,150 991 887 14,600 1980 110,000 2,940 3,360 1,030 898 14,300 1981 109,000 4,210 3,030 1,050 908 14,000 1982 107,000 5,100 2,980 1,060 917 13,800 1983 105,000 5,970 2,930 1,070 926 13,600 1984 104,000 6,830 2,880 1,110 933 13,400 1985 102,000 7,680 2,810 1,090 926 13,000 1986 101,000 8,520 2,730 1,080 905 12,600 1987 99,100 9,340 2,660 1,080 885 12,200 1988 97,500 9,980 2,460 1,070 906 12,200 1989 32,500 10,800 1,040 541 476 5,920 1990 4,720 8,250 416 474 539 3,810 1991 5,710 1,460 304 486 545 3,710 1992 8,980 1,090 416 561 545 3,920 1993 3,950 348 417 956 989 6,020 1994 3,340 407 466 1,030 992 6,060 1995 3,930 405 487 1,040 966 6,680 1996 4,000 301 502 1,090 957 6,750 1997 5,200 224 564 1,100 966 5,800 1998 5,410 181 592 1,150 952 6,160 1999 4,470 163 574 1,190 929 5,440 2000 5,360 141 606 1,180 955 5,650 2001 5,480 176 626 1,190 898 6,110 2002 6,130 211 661 1,250 881 6,280 2003 8,530 232 732 1,250 903 6,130 2004 18,100 486 942 1,330 860 6,460 2005 22,900 607 1,050 1,340 829 6,780 2006 24,500 647 1,030 1,390 799 7,000 2007 37,800 998 1,320 1,460 768 8,180 2008 60,900 1,610 1,810 1,570 694 9,570 2009 47,000 1,240 1,510 1,530 666 8,570 2010 75,000 1,980 2,110 1,660 639 10,400
25