Embed Size (px)
Citation preview
This working paper is made available by the Fisheries Centre, University of British Columbia, Vancouver, BC, V6T 1Z4, Canada.
Fisheries CentreThe University of British Columbia
Working Paper Series
Working Paper #2014 - 13
Reconstruction of Marine Fisheries Catches for Ghana, 1950-2010
F.K.E. Nunoo, B. Asiedu, K. Amador, D. Belhabib and D. Pauly
Year: 2014 Email: �[email protected]; d.belhabib@�isheries.ubc.ca
NUNOO ET AL.: CATCH RECONSTRUCTION FOR GHANA
1
Reconstruction of marine fisheries catches for Ghana, 1950-2010
F.K.E. Nunoo1, B. Asiedu1, K. Amador2, D. Belhabib3 and D. Pauly3
1 Department of Marine & Fisheries Sciences, University of Ghana, P.O. Box LG 99, Legon, Accra, Ghana 2 Marine Fisheries Research Division, Ministry of Fisheries and Aquaculture Development, Tema, Ghana
3 Sea Around Us Project, Fisheries Centre, University of British Columbia, 2202 Main Mall, Vancouver BC Canada.
Corresponding authors E-mail: [email protected], [email protected]
ABSTRACT
Ghana was reputed to be a fishing nation in the past. The collapse of its industrial distant water fleet, mainly induced by the fact that many of the countries where Ghanaian fleets were venturing declared an EEZ in the 1980s, led the industrial fleet to over-exploit fish stocks in home waters. While official data reported to the Food and Agriculture Organization (FAO) shows this decline, the contribution to Ghanaians livelihoods of other sectors that are neither reported nor monitored is unknown, and thus their impacts on fish stocks further overlooked. Here, we try to grasp an image of the importance of these fisheries by reconstructing unreported segments of Ghanaian fisheries. Total domestic catches increased from around 63,000 t in 1950 to a peak of around 585,000 t in 1999 before declining slightly to around 470,000 t by 2010. These catches do not include catches by foreign fleets in Ghana’s waters (estimated at around 124,000 t for 1950-2010), nor Ghanaian catches taken outside of Ghana’s waters (estimated at around 487,000 t for 1950-1985, most in the 1960s and 1970s). Thus, total catches by Ghanaian fleets in their domestic waters were 1.8 times the landings reported by FAO on behalf of Ghana. Subsistence catches, notably from the Ghanaian coastal lagoons represented the bulk of unreported catches and seemed to have increased overall, while the artisanal (small-scale commercial) and industrial (large-scale commercial) sectors decreased.
INTRODUCTION
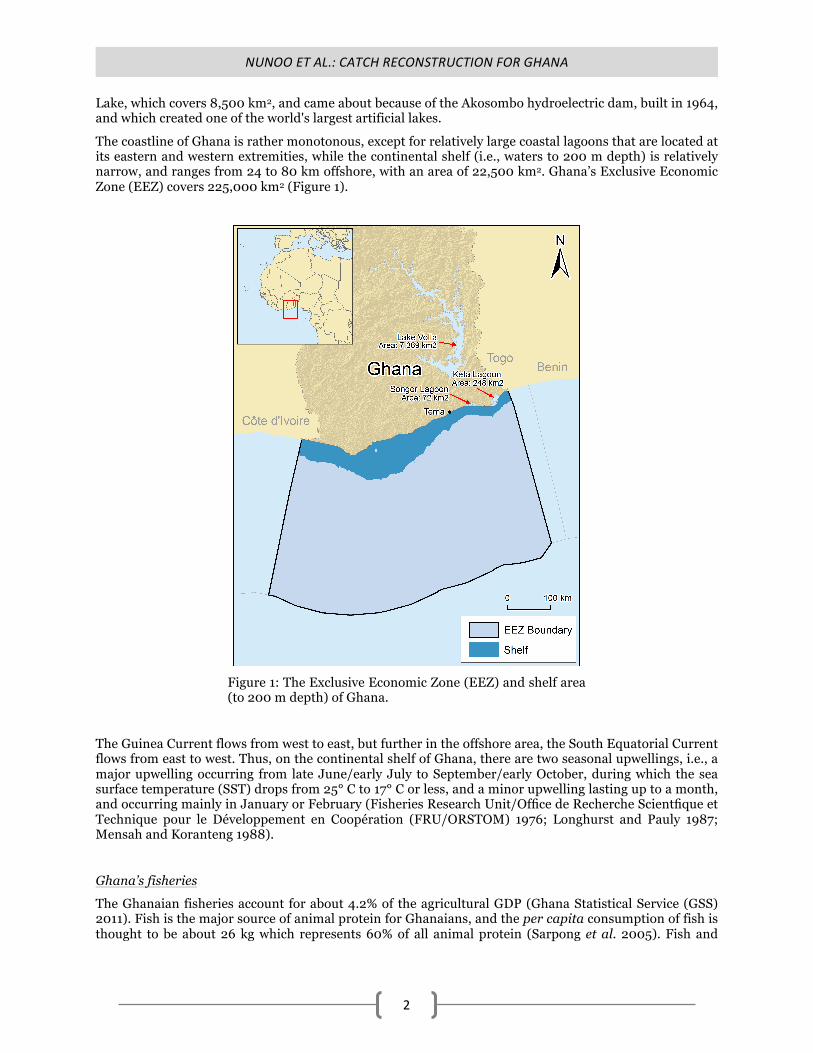
Ghana lies in West Africa, on the Gulf of Guinea, and has a land area of 238,540 km2, extending from 4 to 11 degrees north latitude and from 1 degree east longitude to 3 degrees west longitude. Ghana is bounded by Burkina Faso on the north, Côte d’Ivoire on the west, Togo on the east, and the Gulf of Guinea on the south. The country became independent from Britain in 1957 and its current present population is about 25 million. Accra is Ghana’s capital city, while other important cities are Takoradi, Kumasi and Tamale (Figure 1).
While one third of Ghana’s territory is covered with tropical rain forests, grass-covered plateau savannahs are found in the northern parts and steppes are found in some part of the southern coastal region, with major rivers in the western part, i.e., the Pra, Ankobra and Tano. In the eastern part, a plain extends all the way to the border with Togo. Within this plain, the Black Volta River flows from the north-western part and the White Volta River flows through the northern-central part. They empty their water into Volta
NUNOO ET AL.: CATCH RECONSTRUCTION FOR GHANA
2
Lake, which covers 8,500 km2, and came about because of the Akosombo hydroelectric dam, built in 1964, and which created one of the world's largest artificial lakes.
The coastline of Ghana is rather monotonous, except for relatively large coastal lagoons that are located at its eastern and western extremities, while the continental shelf (i.e., waters to 200 m depth) is relatively narrow, and ranges from 24 to 80 km offshore, with an area of 22,500 km2. Ghana’s Exclusive Economic Zone (EEZ) covers 225,000 km2 (Figure 1).
Figure 1: The Exclusive Economic Zone (EEZ) and shelf area (to 200 m depth) of Ghana.
The Guinea Current flows from west to east, but further in the offshore area, the South Equatorial Current flows from east to west. Thus, on the continental shelf of Ghana, there are two seasonal upwellings, i.e., a major upwelling occurring from late June/early July to September/early October, during which the sea surface temperature (SST) drops from 25° C to 17° C or less, and a minor upwelling lasting up to a month, and occurring mainly in January or February (Fisheries Research Unit/Office de Recherche Scientfique et Technique pour le Développement en Coopération (FRU/ORSTOM) 1976; Longhurst and Pauly 1987; Mensah and Koranteng 1988).
Ghana’s fisheries
The Ghanaian fisheries account for about 4.2% of the agricultural GDP (Ghana Statistical Service (GSS) 2011). Fish is the major source of animal protein for Ghanaians, and the per capita consumption of fish is thought to be about 26 kg which represents 60% of all animal protein (Sarpong et al. 2005). Fish and
NUNOO ET AL.: CATCH RECONSTRUCTION FOR GHANA
3
fishery products are now the country’s most important non-traditional exports, accounting for over 50% of earnings from non-traditional exports (Bennett 2002; Sarpong et al. 2005)
Fisheries in Ghana are currently governed by the Fisheries Act 625 and the Fisheries Regulations 2010, LI.1968. Under these Laws and Acts, regulations such as a banning of fishing in some areas and seasons, control on mesh sizes of nets, protection of juvenile fish or berried crustaceans, and fishery licensing have been introduced. The new lead agency in fisheries governance in Ghana is the Ministry of Fisheries and Aquaculture, under which the Fisheries Commission operates. The Directorate of Fisheries is the executing arm of the Ministry and thus also of the Commission. The Directorate of Fisheries has five sections under the supervision of the head of the Directorate. A deputy director is appointed to each section along with staff, and they are responsible for performing day-to-day business operations, notably the devising of fishery policies, the issuance of fishing permits, the collection of fisheries statistics and the supervision of fisheries.
Ghana already had a fishing industry long before the introduction of mechanized fishing in 1946 (Irvine 1947). From 1960 onwards, serious attempts were made to modernize Ghana’s fisheries. In those early days, there was a very powerful canoe-fleet using methods such as ‘ali’-nets, beach-seines, hooks, cast-nets, and set-nets. Thus, even in the pre-mechanization era, the fishing industry was having an impact on the economy by providing food for the population and employment for coastal people. In fact, it may be stated that the Fisheries Department, formed in 1946 by the Colonial Administration was not intended to start an industry, but only to mechanize and modernize the one which already existed.
About 85% of total fish caught in Ghana comes from the marine sector. Ofori-Adu (1988) listed 347 exploited fish species in Ghanaian coastal waters, i.e., 72% of the 485 species reported by FishBase (www.fishbase.org) from Ghanaian waters (as of August 2013). In addition to 347 fish species belonging to 82 families, Ofori-Adu (1988) listed 17 cephalopod species in 5 families, and 25 crustacean species in 15 families. In Ghanaian fisheries, pelagic and demersal species contribute about equally to the national catch.
The fisheries for small-pelagics
The most important pelagic fish species exploited in the Ghanaian coastal fisheries are the sardinellas, namely round sardinella, Sardinella aurita and Madeiran sardinella, S. maderensis, which are important in the entire Gulf of Guinea (Ansa-Emmim 1973).
Initially, the major upwelling was thought to be more important than the minor upwelling, apparently because more sardinellas are caught during the major upwelling period, but work by Koranteng (1989), Pezennec and Bard (1992) and others has shown that the minor upwelling is as important as the major upwelling to the recruitment of sardinella in the Ivorian-Ghanaian ecosystem. In addition to the upwelling, the distribution and abundance of sardinella in the western Gulf of Guinea have also been associated with rainfall (Binet 1982)) and year-class strength (Fisheries Research Unit/Office de Recherche Scientfique et Technique pour le Développement en Coopération (FRU/ORSTOM) 1976).
The sardinella season begins with the fall in the sea surface temperatures when the sardinellas initiate their migration. Usually, the bulk of the fish is first seen in the western region of Ghana and moves eastwards, into Togo and Benin (Ansa-Emmim 1973). Sardinella aurita is the main species involved in this migration, which was known by early fishers and which dictated their fishing activities. The abundance of S. aurita is limited to a number of environmental factors among which are the strength of the local upwelling (Mendelssohn and Cury 1987) and rainfall (Binet 1982). Madeiran sardinella, S. maderensis has lower catches in the Ghanaian coastal fishery than round sardinella, but S. maderensis is believed to be available for most months of the year (Muta 1964).
Other pelagic fishes exploited by Ghanaian fleets belong to the Scombridae, Carangidae, other Clupeidae and Thunninae. The most important of these to the coastal fishery are the Atlantic chub mackerel (Scomber colias), often found in association with sardinellas (Stromme 1983), and the more sedentary European anchovy (Engraulis encrasicolus).
Specialized fisheries for other pelagic fishes (except tunas) do not exist; most of the fishes mentioned above are by-catch of the sardinella fishery. However, there are occasions where the sardinella failed to
NUNOO ET AL.: CATCH RECONSTRUCTION FOR GHANA
4
appear but Atlantic chub mackerel was caught in large amounts (Fisheries Research Unit/Office de Recherche Scientfique et Technique pour le Développement en Coopération (FRU/ORSTOM) 1976). Generally, small pelagic fish catches constitute about 65% of total landings.
Demersal fishery resources
Demersal fishes are caught by trawlers and artisanal gears such as beach seines, set nets and long-lines. A number of fish species contribute to the demersal fishery in the waters off Ghana. The most important of these are Sparidae or porgies (mainly red pandora Pagellus bellottii, Canary dentex Dentex canariensis and bluespotted seabream Pagrus caeruleostictus), Haemulidae or grunts, (e.g., Pomadasys jubelini and Brachydeuterus auritus, a semi-pelagic species); Sciaenidae or croakers (e.g., Pseudotolithus spp. or cassava croaker) and Lutjanidae or snappers (e.g., Lutjanus fulgens). Others are Mullidae or mullets, (e.g., Pseudupeneus prayensis); Serranidae or groupers (e.g., Epinephelus aeneus) and Polynemidae or threadfins (e.g., Galeoides decadactylus).
The Fisheries Act establishes an Inshore Exclusion Zone (IEZ) which comprises the coastal waters between the coastline and the 30 m depth contour or six nautical mile offshore limit, whichever is furthest. Large semi-industrial vessels and industrial vessels are not permitted within the IEZ and canoe support vessels are also prohibited, as are all towing gear. The IEZ is reserved exclusively for canoes and semi-industrial vessels (the latter are not to use towing gears in the zone).
Lawson and Kwei (1974) trace the development of demersal fisheries in Ghana, starting from the use of two vessels in 1948 to around 360 vessels in 1973, and mentions that on its formation, the Fisheries Department imported two-thirty foot motorized boats from the United Kingdom. These two vessels were used by the Department for experiments intended to determine the effectiveness of the boats’ engines and their overall performance in Ghanaian waters.
The effectiveness of these vessels encouraged people to approach the Fisheries Department for permission to buy similar vessels. However, as the project was still at an experimental stage, people were unable to purchase such vessels. In fact, the government issued a ruling that, until further notice, no one was allowed to operate a vessel of over 30 feet in length in Ghanaian waters. However, the success of the 30-footers was such that, in 1952, a boatyard was set up in Sekondi to build similar vessels.
In the same year, the Fisheries Department began to sell vessels to the public on hire/purchase terms. Before the Department would release a vessel to prospective buyers, the owner had to make a deposit on its purchase price. Then the buyer and the crew had to present themselves for training and thus show full proof to the Fisheries Department that fishers were capable of operating and maintaining the vessel. Even when the owner eventually started to operate the boat, the Fisheries Department checked the maintenance of the boat and recorded the size and the value of the catches.
In 1958, Mankoadze Fisheries Limited introduced the first 58-foot vessel in Ghana. This vessel, The Provider A, had several advantages: a stronger engine, larger catching and carrying capacity, and a longer range than the smaller vessels in use at that time. At this stage, instead of phasing out the 30-footers and introducing in their place the superior 58-footers, the planners allowed the 30-footers to grow in number.
Tuna resources
The principal tuna species that occur throughout the eastern Atlantic Ocean are: yellowfin tuna (Thunnus albacares), skipjack (Katsuwonus pelamis) and big-eye (Thunnus obesus). Assessment of tunas in the Atlantic is coordinated by the International Commission for the Conservation of Atlantic Tunas (ICCAT). Recent assessments by ICCAT suggest that yellowfin and big-eye tuna resources in the Atlantic are being optimally exploited, while skipjack tuna may still be under-exploited (Directorate of Fisheries (DOF) 2004).
Fish processing
NUNOO ET AL.: CATCH RECONSTRUCTION FOR GHANA
5
Soon after it was established in 1946, the Fisheries Department set up a pilot cannery and fishmeal plant. The aim of the pilot cannery was to conduct trials into canning of Sardinella and mackerel of which there was, every year, a seasonal surplus. Trials were performed and it was found that the canned product was readily accepted by the general public.
At that point, a policy should have been formulated to establish canneries at such key landing sites as Tema/Accra and Elmina. However, this pilot cannery, which subsequently was handed over to Nsawam Canneries, remained a pilot plant. Had the planners succeeded in realizing the potentials of the cannery, they would have eliminated the need to import pilchards and sardines, thereby saving foreign exchange for the country.
Aims
The present study uses an established catch reconstruction approach (Zeller et al. 2007) to estimate total marine fisheries catches for Ghana for the period 1950–2010 to derive a historic baseline and evaluate the overall magnitude of underreporting.
MATERIALS AND METHODS
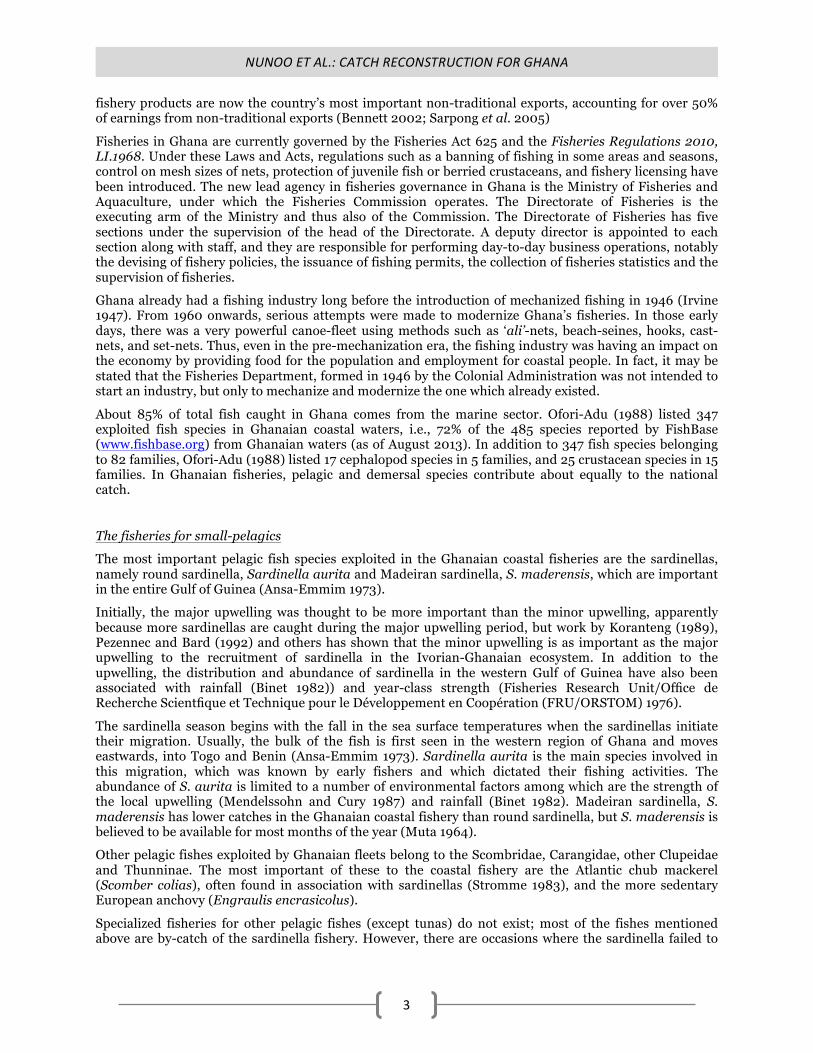
National landing datasets were compared with the data supplied to the FAO. The first dataset is presented in three categories, i.e., artisanal, industrial and tuna landings, whereas FAO landing data shows species or higher taxonomic grouping. The comparison revealed that, overall, national data were higher than the data supplied to FAO (Figure 2). While the reason behind this is unknown, we use the FAO data as a baseline and considered the difference as unreported catch (i.e., unreported with reference to FAO data) given that catch data for commercial sectors (artisanal, industrial and tuna) are comprehensively assessed. We assumed the ratio artisanal:industrial obtained from national data was similar for the FAO data which allowed to separate the FAO data into three categories, namely: the tuna category including “Atlantic bonito”, “Skipjack tuna”, “Bigeye tuna”, “Yellowfin tuna”, “Frigate and bullet tunas” and “Little tunny(=Atl.black skipj)”, artisanal and industrial (others). We then compared each of these segments to the segments extracted from national data reports.
Figure 2. Comparison between national landings data and FAO data, 1950-2010.
NUNOO ET AL.: CATCH RECONSTRUCTION FOR GHANA
6
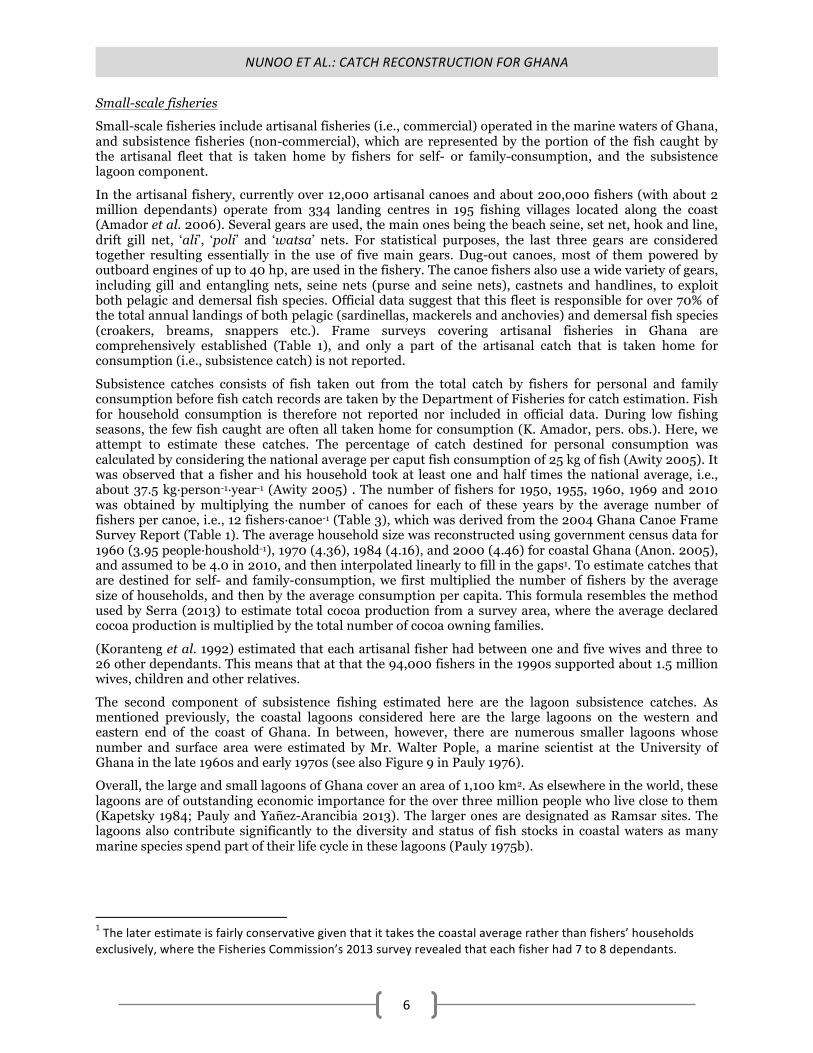
Small-scale fisheries
Small-scale fisheries include artisanal fisheries (i.e., commercial) operated in the marine waters of Ghana, and subsistence fisheries (non-commercial), which are represented by the portion of the fish caught by the artisanal fleet that is taken home by fishers for self- or family-consumption, and the subsistence lagoon component.
In the artisanal fishery, currently over 12,000 artisanal canoes and about 200,000 fishers (with about 2 million dependants) operate from 334 landing centres in 195 fishing villages located along the coast (Amador et al. 2006). Several gears are used, the main ones being the beach seine, set net, hook and line, drift gill net, ‘ali’, ‘poli’ and ‘watsa’ nets. For statistical purposes, the last three gears are considered together resulting essentially in the use of five main gears. Dug-out canoes, most of them powered by outboard engines of up to 40 hp, are used in the fishery. The canoe fishers also use a wide variety of gears, including gill and entangling nets, seine nets (purse and seine nets), castnets and handlines, to exploit both pelagic and demersal fish species. Official data suggest that this fleet is responsible for over 70% of the total annual landings of both pelagic (sardinellas, mackerels and anchovies) and demersal fish species (croakers, breams, snappers etc.). Frame surveys covering artisanal fisheries in Ghana are comprehensively established (Table 1), and only a part of the artisanal catch that is taken home for consumption (i.e., subsistence catch) is not reported.
Subsistence catches consists of fish taken out from the total catch by fishers for personal and family consumption before fish catch records are taken by the Department of Fisheries for catch estimation. Fish for household consumption is therefore not reported nor included in official data. During low fishing seasons, the few fish caught are often all taken home for consumption (K. Amador, pers. obs.). Here, we attempt to estimate these catches. The percentage of catch destined for personal consumption was calculated by considering the national average per caput fish consumption of 25 kg of fish (Awity 2005). It was observed that a fisher and his household took at least one and half times the national average, i.e., about 37.5 kg·person-1·year-1 (Awity 2005) . The number of fishers for 1950, 1955, 1960, 1969 and 2010 was obtained by multiplying the number of canoes for each of these years by the average number of fishers per canoe, i.e., 12 fishers·canoe-1 (Table 3), which was derived from the 2004 Ghana Canoe Frame Survey Report (Table 1). The average household size was reconstructed using government census data for 1960 (3.95 people·houshold-1), 1970 (4.36), 1984 (4.16), and 2000 (4.46) for coastal Ghana (Anon. 2005), and assumed to be 4.0 in 2010, and then interpolated linearly to fill in the gaps1. To estimate catches that are destined for self- and family-consumption, we first multiplied the number of fishers by the average size of households, and then by the average consumption per capita. This formula resembles the method used by Serra (2013) to estimate total cocoa production from a survey area, where the average declared cocoa production is multiplied by the total number of cocoa owning families.
(Koranteng et al. 1992) estimated that each artisanal fisher had between one and five wives and three to 26 other dependants. This means that at that the 94,000 fishers in the 1990s supported about 1.5 million wives, children and other relatives.
The second component of subsistence fishing estimated here are the lagoon subsistence catches. As mentioned previously, the coastal lagoons considered here are the large lagoons on the western and eastern end of the coast of Ghana. In between, however, there are numerous smaller lagoons whose number and surface area were estimated by Mr. Walter Pople, a marine scientist at the University of Ghana in the late 1960s and early 1970s (see also Figure 9 in Pauly 1976).
Overall, the large and small lagoons of Ghana cover an area of 1,100 km2. As elsewhere in the world, these lagoons are of outstanding economic importance for the over three million people who live close to them (Kapetsky 1984; Pauly and Yañez-Arancibia 2013). The larger ones are designated as Ramsar sites. The lagoons also contribute significantly to the diversity and status of fish stocks in coastal waters as many marine species spend part of their life cycle in these lagoons (Pauly 1975b).
1 The later estimate is fairly conservative given that it takes the coastal average rather than fishers’ households exclusively, where the Fisheries Commission’s 2013 survey revealed that each fisher had 7 to 8 dependants.
NUNOO ET AL.: CATCH RECONSTRUCTION FOR GHANA
7
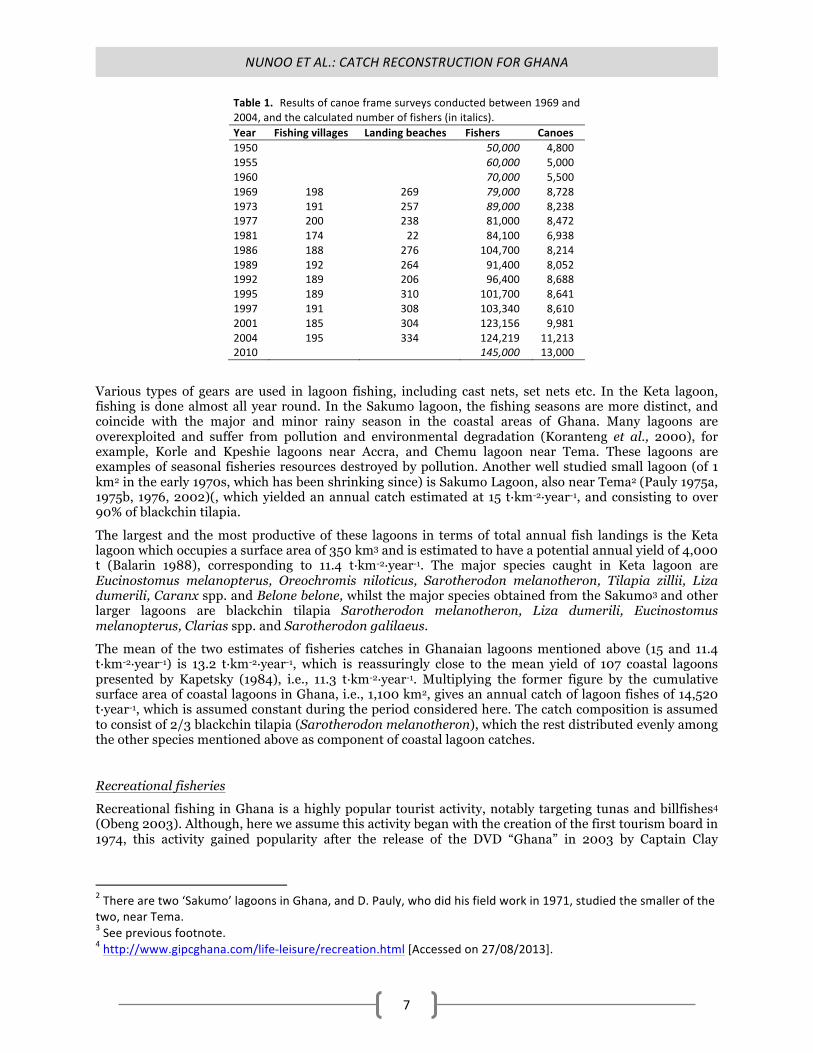
Table 1. Results of canoe frame surveys conducted between 1969 and 2004, and the calculated number of fishers (in italics). Year Fishing villages Landing beaches Fishers Canoes 1950
50,000 4,800
1955
60,000 5,000 1960
70,000 5,500
1969 198 269 79,000 8,728 1973 191 257 89,000 8,238 1977 200 238 81,000 8,472 1981 174 22 84,100 6,938 1986 188 276 104,700 8,214 1989 192 264 91,400 8,052 1992 189 206 96,400 8,688 1995 189 310 101,700 8,641 1997 191 308 103,340 8,610 2001 185 304 123,156 9,981 2004 195 334 124,219 11,213 2010
145,000 13,000
Various types of gears are used in lagoon fishing, including cast nets, set nets etc. In the Keta lagoon, fishing is done almost all year round. In the Sakumo lagoon, the fishing seasons are more distinct, and coincide with the major and minor rainy season in the coastal areas of Ghana. Many lagoons are overexploited and suffer from pollution and environmental degradation (Koranteng et al., 2000), for example, Korle and Kpeshie lagoons near Accra, and Chemu lagoon near Tema. These lagoons are examples of seasonal fisheries resources destroyed by pollution. Another well studied small lagoon (of 1 km2 in the early 1970s, which has been shrinking since) is Sakumo Lagoon, also near Tema2 (Pauly 1975a, 1975b, 1976, 2002)(, which yielded an annual catch estimated at 15 t·km-2·year-1, and consisting to over 90% of blackchin tilapia.
The largest and the most productive of these lagoons in terms of total annual fish landings is the Keta lagoon which occupies a surface area of 350 km3 and is estimated to have a potential annual yield of 4,000 t (Balarin 1988), corresponding to 11.4 t·km-2·year-1. The major species caught in Keta lagoon are Eucinostomus melanopterus, Oreochromis niloticus, Sarotherodon melanotheron, Tilapia zillii, Liza dumerili, Caranx spp. and Belone belone, whilst the major species obtained from the Sakumo3 and other larger lagoons are blackchin tilapia Sarotherodon melanotheron, Liza dumerili, Eucinostomus melanopterus, Clarias spp. and Sarotherodon galilaeus.
The mean of the two estimates of fisheries catches in Ghanaian lagoons mentioned above (15 and 11.4 t·km-2·year-1) is 13.2 t·km-2·year-1, which is reassuringly close to the mean yield of 107 coastal lagoons presented by Kapetsky (1984), i.e., 11.3 t·km-2·year-1. Multiplying the former figure by the cumulative surface area of coastal lagoons in Ghana, i.e., 1,100 km2, gives an annual catch of lagoon fishes of 14,520 t·year-1, which is assumed constant during the period considered here. The catch composition is assumed to consist of 2/3 blackchin tilapia (Sarotherodon melanotheron), which the rest distributed evenly among the other species mentioned above as component of coastal lagoon catches.
Recreational fisheries
Recreational fishing in Ghana is a highly popular tourist activity, notably targeting tunas and billfishes4 (Obeng 2003). Although, here we assume this activity began with the creation of the first tourism board in 1974, this activity gained popularity after the release of the DVD “Ghana” in 2003 by Captain Clay
2 There are two ‘Sakumo’ lagoons in Ghana, and D. Pauly, who did his field work in 1971, studied the smaller of the two, near Tema. 3 See previous footnote. 4 http://www.gipcghana.com/life-‐leisure/recreation.html [Accessed on 27/08/2013].
NUNOO ET AL.: CATCH RECONSTRUCTION FOR GHANA
8
Hensley showing record catches of tuna and marlin to the wide audience in 2003, onboard an icon in the sport fishing world “The Hooker”5, which made Ghana a dream place for recreational fishers.
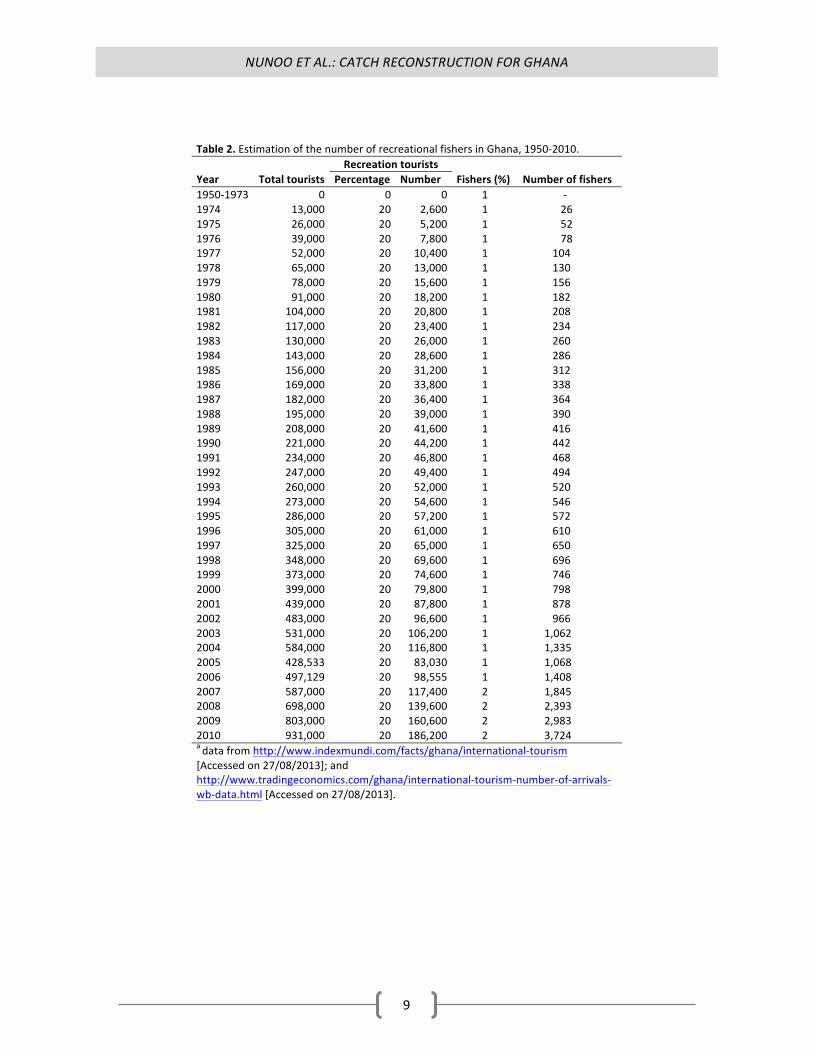
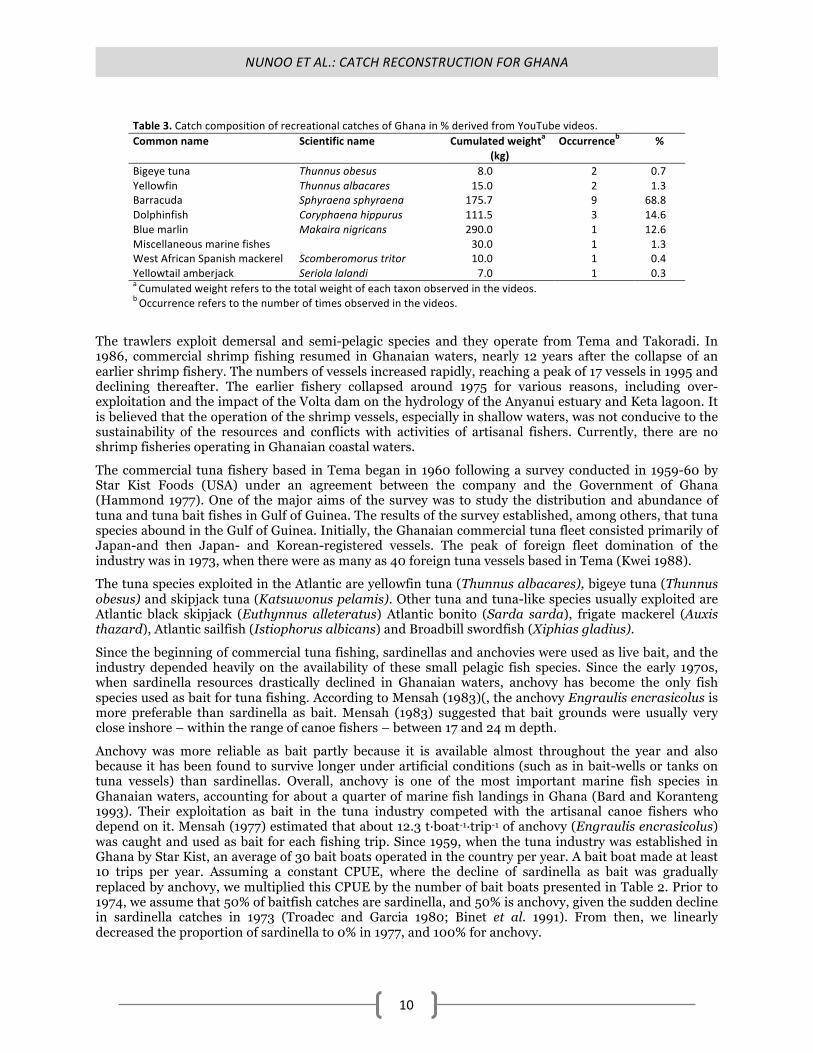
Here, we first reconstructed the number of tourists between 1973 and 2010. Data on the number of tourists were available between 1995 and 2010 from diverse sources (Table 2), we interpolated from 0 in 1973 to the first anchor point in 1995. According to official data on tourism, 20% of the total number of tourists visited Ghana for recreational activities (Anon. 2007). We assumed a constant rate over time and applied this rate to the total number of tourists. Since recreational fishing gained popularity since 2003, we assumed between 1973 and 2003, 1% of the recreational tourists visiting Ghana went fishing, and interpolated linearly to 2% in 2010, which allowed estimating the annual number of recreational fishers. Using videos posted on YouTube documenting 25 recreational fishers and the species they caught daily, we could estimate the average weight caught by each tourist daily at 32.58 kg·tourist-1·day-1. When the number of tourists was unclear in the videos, we used the number of lines observed as a proxy. We assumed the CPUE was 20% higher in the past, given the general over-exploitation pattern in Ghana. Each tourist spends on average 7 days fishing annually6. Therefore, we estimated total recreational catches as the product of the number of tourists per year by the number of days and the average daily CPUE. The total weight per species was weighted by the occurrence of each species in the videos, i.e., the number of times each species was observed; the fraction of the weighted catch of each species over the total represents the percentage for each species (Table 3).
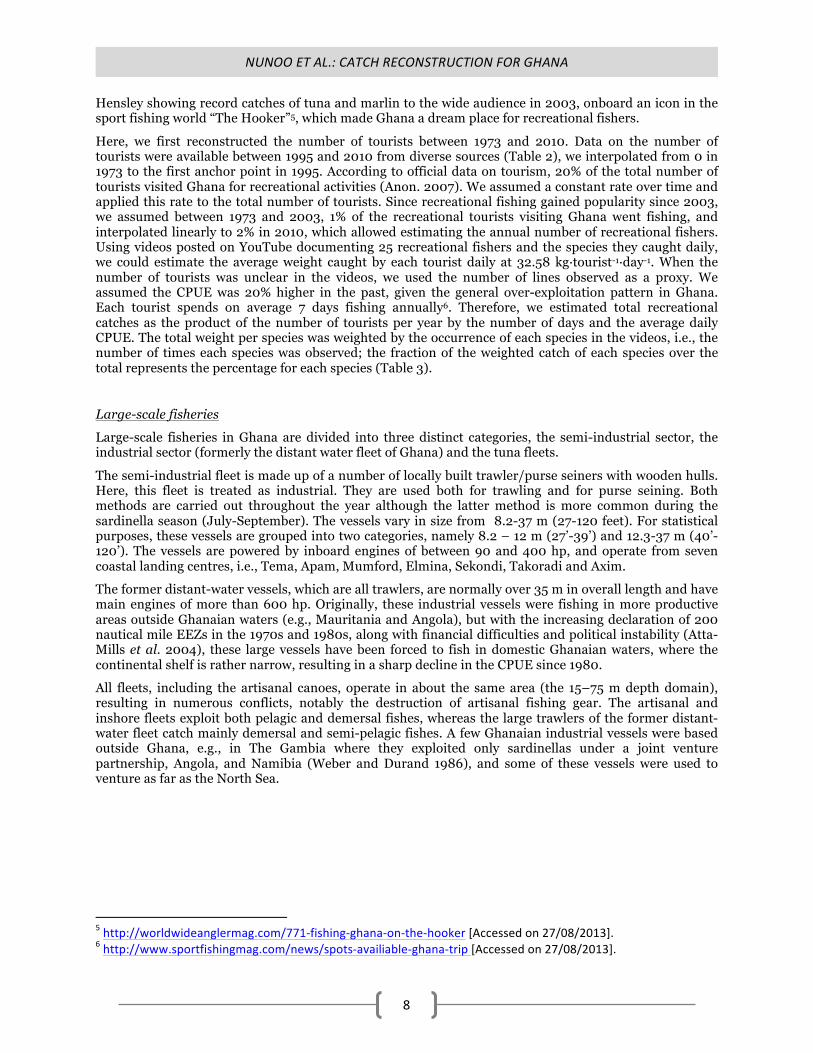
Large-scale fisheries
Large-scale fisheries in Ghana are divided into three distinct categories, the semi-industrial sector, the industrial sector (formerly the distant water fleet of Ghana) and the tuna fleets.
The semi-industrial fleet is made up of a number of locally built trawler/purse seiners with wooden hulls. Here, this fleet is treated as industrial. They are used both for trawling and for purse seining. Both methods are carried out throughout the year although the latter method is more common during the sardinella season (July-September). The vessels vary in size from 8.2-37 m (27-120 feet). For statistical purposes, these vessels are grouped into two categories, namely 8.2 – 12 m (27’-39’) and 12.3-37 m (40’-120’). The vessels are powered by inboard engines of between 90 and 400 hp, and operate from seven coastal landing centres, i.e., Tema, Apam, Mumford, Elmina, Sekondi, Takoradi and Axim.
The former distant-water vessels, which are all trawlers, are normally over 35 m in overall length and have main engines of more than 600 hp. Originally, these industrial vessels were fishing in more productive areas outside Ghanaian waters (e.g., Mauritania and Angola), but with the increasing declaration of 200 nautical mile EEZs in the 1970s and 1980s, along with financial difficulties and political instability (Atta-Mills et al. 2004), these large vessels have been forced to fish in domestic Ghanaian waters, where the continental shelf is rather narrow, resulting in a sharp decline in the CPUE since 1980.
All fleets, including the artisanal canoes, operate in about the same area (the 15–75 m depth domain), resulting in numerous conflicts, notably the destruction of artisanal fishing gear. The artisanal and inshore fleets exploit both pelagic and demersal fishes, whereas the large trawlers of the former distant-water fleet catch mainly demersal and semi-pelagic fishes. A few Ghanaian industrial vessels were based outside Ghana, e.g., in The Gambia where they exploited only sardinellas under a joint venture partnership, Angola, and Namibia (Weber and Durand 1986), and some of these vessels were used to venture as far as the North Sea.
5 http://worldwideanglermag.com/771-‐fishing-‐ghana-‐on-‐the-‐hooker [Accessed on 27/08/2013]. 6 http://www.sportfishingmag.com/news/spots-‐availiable-‐ghana-‐trip [Accessed on 27/08/2013].
NUNOO ET AL.: CATCH RECONSTRUCTION FOR GHANA
9
Table 2. Estimation of the number of recreational fishers in Ghana, 1950-‐2010. Recreation tourists Year Total tourists Percentage Number Fishers (%) Number of fishers 1950-‐1973 0 0 0 1 -‐ 1974 13,000 20 2,600 1 26 1975 26,000 20 5,200 1 52 1976 39,000 20 7,800 1 78 1977 52,000 20 10,400 1 104 1978 65,000 20 13,000 1 130 1979 78,000 20 15,600 1 156 1980 91,000 20 18,200 1 182 1981 104,000 20 20,800 1 208 1982 117,000 20 23,400 1 234 1983 130,000 20 26,000 1 260 1984 143,000 20 28,600 1 286 1985 156,000 20 31,200 1 312 1986 169,000 20 33,800 1 338 1987 182,000 20 36,400 1 364 1988 195,000 20 39,000 1 390 1989 208,000 20 41,600 1 416 1990 221,000 20 44,200 1 442 1991 234,000 20 46,800 1 468 1992 247,000 20 49,400 1 494 1993 260,000 20 52,000 1 520 1994 273,000 20 54,600 1 546 1995 286,000 20 57,200 1 572 1996 305,000 20 61,000 1 610 1997 325,000 20 65,000 1 650 1998 348,000 20 69,600 1 696 1999 373,000 20 74,600 1 746 2000 399,000 20 79,800 1 798 2001 439,000 20 87,800 1 878 2002 483,000 20 96,600 1 966 2003 531,000 20 106,200 1 1,062 2004 584,000 20 116,800 1 1,335 2005 428,533 20 83,030 1 1,068 2006 497,129 20 98,555 1 1,408 2007 587,000 20 117,400 2 1,845 2008 698,000 20 139,600 2 2,393 2009 803,000 20 160,600 2 2,983 2010 931,000 20 186,200 2 3,724 a data from http://www.indexmundi.com/facts/ghana/international-‐tourism [Accessed on 27/08/2013]; and http://www.tradingeconomics.com/ghana/international-‐tourism-‐number-‐of-‐arrivals-‐wb-‐data.html [Accessed on 27/08/2013].
NUNOO ET AL.: CATCH RECONSTRUCTION FOR GHANA
10
Table 3. Catch composition of recreational catches of Ghana in % derived from YouTube videos. Common name
Scientific name
Cumulated weighta
(kg) Occurrenceb
%
Bigeye tuna Thunnus obesus 8.0 2 0.7 Yellowfin Thunnus albacares 15.0 2 1.3 Barracuda Sphyraena sphyraena 175.7 9 68.8 Dolphinfish Coryphaena hippurus 111.5 3 14.6 Blue marlin Makaira nigricans 290.0 1 12.6 Miscellaneous marine fishes 30.0 1 1.3 West African Spanish mackerel Scomberomorus tritor 10.0 1 0.4 Yellowtail amberjack Seriola lalandi 7.0 1 0.3 a Cumulated weight refers to the total weight of each taxon observed in the videos. b Occurrence refers to the number of times observed in the videos.
The trawlers exploit demersal and semi-pelagic species and they operate from Tema and Takoradi. In 1986, commercial shrimp fishing resumed in Ghanaian waters, nearly 12 years after the collapse of an earlier shrimp fishery. The numbers of vessels increased rapidly, reaching a peak of 17 vessels in 1995 and declining thereafter. The earlier fishery collapsed around 1975 for various reasons, including over-exploitation and the impact of the Volta dam on the hydrology of the Anyanui estuary and Keta lagoon. It is believed that the operation of the shrimp vessels, especially in shallow waters, was not conducive to the sustainability of the resources and conflicts with activities of artisanal fishers. Currently, there are no shrimp fisheries operating in Ghanaian coastal waters.
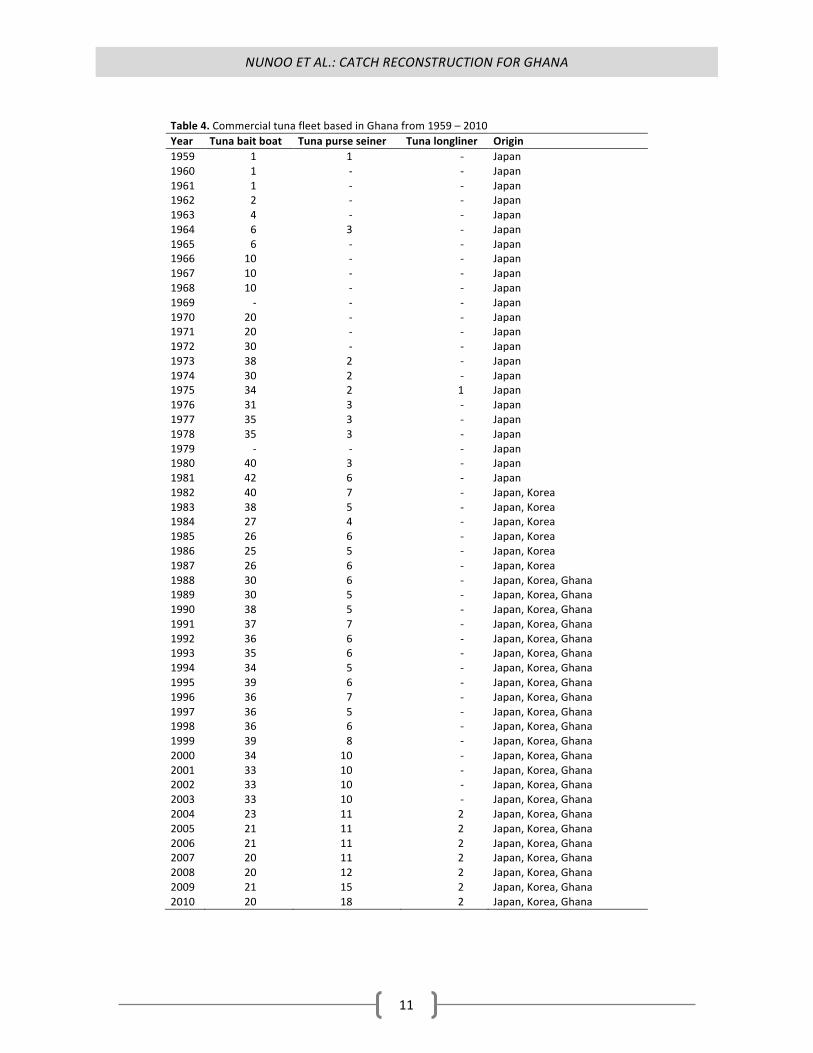
The commercial tuna fishery based in Tema began in 1960 following a survey conducted in 1959-60 by Star Kist Foods (USA) under an agreement between the company and the Government of Ghana (Hammond 1977). One of the major aims of the survey was to study the distribution and abundance of tuna and tuna bait fishes in Gulf of Guinea. The results of the survey established, among others, that tuna species abound in the Gulf of Guinea. Initially, the Ghanaian commercial tuna fleet consisted primarily of Japan-and then Japan- and Korean-registered vessels. The peak of foreign fleet domination of the industry was in 1973, when there were as many as 40 foreign tuna vessels based in Tema (Kwei 1988).
The tuna species exploited in the Atlantic are yellowfin tuna (Thunnus albacares), bigeye tuna (Thunnus obesus) and skipjack tuna (Katsuwonus pelamis). Other tuna and tuna-like species usually exploited are Atlantic black skipjack (Euthynnus alleteratus) Atlantic bonito (Sarda sarda), frigate mackerel (Auxis thazard), Atlantic sailfish (Istiophorus albicans) and Broadbill swordfish (Xiphias gladius).
Since the beginning of commercial tuna fishing, sardinellas and anchovies were used as live bait, and the industry depended heavily on the availability of these small pelagic fish species. Since the early 1970s, when sardinella resources drastically declined in Ghanaian waters, anchovy has become the only fish species used as bait for tuna fishing. According to Mensah (1983)(, the anchovy Engraulis encrasicolus is more preferable than sardinella as bait. Mensah (1983) suggested that bait grounds were usually very close inshore – within the range of canoe fishers – between 17 and 24 m depth.
Anchovy was more reliable as bait partly because it is available almost throughout the year and also because it has been found to survive longer under artificial conditions (such as in bait-wells or tanks on tuna vessels) than sardinellas. Overall, anchovy is one of the most important marine fish species in Ghanaian waters, accounting for about a quarter of marine fish landings in Ghana (Bard and Koranteng 1993). Their exploitation as bait in the tuna industry competed with the artisanal canoe fishers who depend on it. Mensah (1977) estimated that about 12.3 t·boat-1·trip-1 of anchovy (Engraulis encrasicolus) was caught and used as bait for each fishing trip. Since 1959, when the tuna industry was established in Ghana by Star Kist, an average of 30 bait boats operated in the country per year. A bait boat made at least 10 trips per year. Assuming a constant CPUE, where the decline of sardinella as bait was gradually replaced by anchovy, we multiplied this CPUE by the number of bait boats presented in Table 2. Prior to 1974, we assume that 50% of baitfish catches are sardinella, and 50% is anchovy, given the sudden decline in sardinella catches in 1973 (Troadec and Garcia 1980; Binet et al. 1991). From then, we linearly decreased the proportion of sardinella to 0% in 1977, and 100% for anchovy.
NUNOO ET AL.: CATCH RECONSTRUCTION FOR GHANA
11
Table 4. Commercial tuna fleet based in Ghana from 1959 – 2010 Year Tuna bait boat Tuna purse seiner Tuna longliner Origin 1959 1 1 -‐ Japan 1960 1 -‐ -‐ Japan 1961 1 -‐ -‐ Japan 1962 2 -‐ -‐ Japan 1963 4 -‐ -‐ Japan 1964 6 3 -‐ Japan 1965 6 -‐ -‐ Japan 1966 10 -‐ -‐ Japan 1967 10 -‐ -‐ Japan 1968 10 -‐ -‐ Japan 1969 -‐ -‐ -‐ Japan 1970 20 -‐ -‐ Japan 1971 20 -‐ -‐ Japan 1972 30 -‐ -‐ Japan 1973 38 2 -‐ Japan 1974 30 2 -‐ Japan 1975 34 2 1 Japan 1976 31 3 -‐ Japan 1977 35 3 -‐ Japan 1978 35 3 -‐ Japan 1979 -‐ -‐ -‐ Japan 1980 40 3 -‐ Japan 1981 42 6 -‐ Japan 1982 40 7 -‐ Japan, Korea 1983 38 5 -‐ Japan, Korea 1984 27 4 -‐ Japan, Korea 1985 26 6 -‐ Japan, Korea 1986 25 5 -‐ Japan, Korea 1987 26 6 -‐ Japan, Korea 1988 30 6 -‐ Japan, Korea, Ghana 1989 30 5 -‐ Japan, Korea, Ghana 1990 38 5 -‐ Japan, Korea, Ghana 1991 37 7 -‐ Japan, Korea, Ghana 1992 36 6 -‐ Japan, Korea, Ghana 1993 35 6 -‐ Japan, Korea, Ghana 1994 34 5 -‐ Japan, Korea, Ghana 1995 39 6 -‐ Japan, Korea, Ghana 1996 36 7 -‐ Japan, Korea, Ghana 1997 36 5 -‐ Japan, Korea, Ghana 1998 36 6 -‐ Japan, Korea, Ghana 1999 39 8 -‐ Japan, Korea, Ghana 2000 34 10 -‐ Japan, Korea, Ghana 2001 33 10 -‐ Japan, Korea, Ghana 2002 33 10 -‐ Japan, Korea, Ghana 2003 33 10 -‐ Japan, Korea, Ghana 2004 23 11 2 Japan, Korea, Ghana 2005 21 11 2 Japan, Korea, Ghana 2006 21 11 2 Japan, Korea, Ghana 2007 20 11 2 Japan, Korea, Ghana 2008 20 12 2 Japan, Korea, Ghana 2009 21 15 2 Japan, Korea, Ghana 2010 20 18 2 Japan, Korea, Ghana
NUNOO ET AL.: CATCH RECONSTRUCTION FOR GHANA
12
Foreign legal fisheries
There is relatively little access to Ghanaian waters by foreign fleets due to the already high pressure on Ghanaian fisheries resources (Atta-Mills et al. 2004). Dioury (1983)in his report on fisheries of twelve countries in Africa, did mention the distant water fishing fleet, and categorized industrial fleets as those built in Ghana (purse-seiners and trawlers) and those built elsewhere then imported to Ghana and most likely fish also elsewhere. Weber and Durand (1986) mentioned agreements with the former Soviet Union, rather believed to be for building and exporting fishing vessels to Ghana, and fisheries agreements with Japan. Thus, foreign fisheries in the Ghanaian EEZ are officially restricted to tuna fisheries7. While in the past, tuna vessels were mostly foreign (NOAA 1981), notably from Japan, since 1981, all tuna vessels are operated on a joint-venture basis with Korean and Japanese companies (NOAA 1981), with Ghanaians owing at least 25% of the shares in the past (Falaye 2008) and 50% today under the Ghana Fisheries Act 625 of 2002 (Anon. 2004). Similarly, tuna vessels who previously landed their catches elsewhere, and reported only a fraction of it, were constrained in 1981 to land at least 10% of their catches in Ghana, and today, all tuna is landed in Ghana and therefore catches are considered local (Falaye 2008). We estimated the unreported portion of these catches8, assuming that the unreported component was 10% of the declared national landings at the beginning of the fishery in 1959, and decreased linearly to 1% in 1986. We then re-allocated catches per flag of origin such as Japanese fleet caught 100% of industrial tuna catches between 1959 and 1981, half of catches were then taken by Korea in 1988, and then each of Japan, Korea and Ghana were responsible for around a third of these catches in 2010. We interpolated these rates, i.e., from 100% in 1981 to 50% in 1988 and then to 33% in 2010 for Japan, from 0% in 1981 to 50% in 1988 and then to 33% in 2010 for Korea, the remaining is allocated to Ghana.
All trawl vessels operating in Ghana are reported as Ghanaian regardless of their origin, however, the very Chinese names of a few companies found in literature reviews (Pramod and Pitcher 2006) and their respective vessels suggest these are not entirely Ghanaian. Indeed, China has recently begun operating pair-trawlers in the waters of Ghana. Literature reports 16 vessels in 2003, 10 in 2007 and 2 in 2010 (Pauly et al. 2013), despite the ban of pair-trawling in 2007 (Bromfield 2010). These, according to Pauly et al. (2013) catch on average 1,252 t·vessel-1·year-1. Given that the Chinese-Ghanaian cooperation in the fisheries sector is relatively recent (Ghana News Agency 2005), and that first records of pair trawler catches were made in 2002 (Anon. 2004), we assumed that pair-trawling by China corresponded to the official start date of the agreement, i.e., 2002. We interpolated the effort to fill in the gaps for the intervening years. We assumed the CPUE in 2002 was 10% higher than in 2010, given the over-exploitation pattern observed in Ghana. We multiplied the CPUE by the interpolated effort and obtained Chinese catches from the Ghana EEZ. Given the low level of catches reported in 2002, i.e., 1,259.7 t·year-1 (Anon. 2004), compared to a reconstructed catch of 11,018 t·year-1, i.e., 11.4% reported, we assumed a constant figure between 2002 and 2010 of under-reporting. As for the species composition, Anon. (2004) reported 36% of seabreams, 33% of cuttlefish, 1% of burrito, 2.3% of cassava fish, and 27.7% of other miscellaneous species.
Illegal fisheries
Unlike many other West African countries, the major domestic management problem in Ghana lies mostly in the licensed trawlers operating in the artisanal fishing zone (i.e., spatial violations), or using illegal fishing gear, illegal transhipments etc. (Falaye 2008). However incursions, notably by unlicensed trawlers from the EU, and China do happen (Antwi 2006; Pauly et al. 2013), and represent truly illegal fishing. MRAG (2005) estimated illegal unreported and unregulated catches to be 4% of the total legal catch. Arrests within Ghanaian waters documented in the literature were exclusively due to fishing without licenses/authorization (Kwadjosse 2009). Therefore, we assumed the previous rate to apply to illegal vessels only. Another reason is that nearly all the industrial fishing vessels that are flagged to Ghana are equipped with transponders for vessel monitoring (Kwadjosse 2009) . This percentage is
7 http://www.fao.org/docrep/v9982e/v9982e1o.htm [Accessed on 26/08/2013] 8 Considering the FAO data as the baseline, the total unreported tuna catch is the sum of the difference between the national tuna catch data and the FAO data to which is added this component.
NUNOO ET AL.: CATCH RECONSTRUCTION FOR GHANA
13
believed to be higher in the past given that the government commissioned new regulations notably on VMS tracking systems only recently. We therefore assumed that illegal catches were the equivalent of 8% at the introduction of the tuna commercial fishery to Ghana after the joint US-Ghana tuna survey of 1959, decreasing linearly to 4% between 2005 and 2010. We then multiplied tuna landings by this rate and estimated the total illegal catch from Ghana. We assumed 100% of these catches were of Spanish origin (incursions from Togo) before 1983, and that 50% were Chinese and 50% Spanish since then.
Discards
In the Ghanaian artisanal fisheries, discards are negligible as almost all catch is sold and consumed. In the industrial sector, however, and especially the shrimping sector, up to 80% of the catch is by-catch, and much of it is discarded. Similarly, tuna bait boats use only live bait, thus discard the rest. A barter system called ‘seiko’ fishing has developed between some canoe fishers and industrial shrimpers, trawlers and tuna bait boats, wherein vegetables and fruits are exchanged for such fish from the industrial vessels; alternatively, the fish is sometimes sold to these canoe fishers (often very cheaply). The ‘seiko’ system can be operated officially, i.e. with the consent of the fishing companies, or unofficially.
We estimated discards by tuna purse seiners and tuna bait boats by using Mensah (1977), who estimated that about 2,015 t·boat-1·year-1 of juvenile tuna were discarded at sea. Table 2 shows the numbers of tuna bait boat and tuna purse seiners which operated from Ghana from 1959 to 2010. If a bait boat discarded 2,015 tonnes per year, a purse seiner would have discarded at least twice that quantity in a trip, since purse seiners were less selective of size; they had higher fishing capacity than bait boats per trip (Kofi Amador, pers. obs.). We first interpolated the number of bait boats and purse-seiners and then multiplied the number of bait boats per year by a discard rate of 2,015 t·boat-1·year-1 and the number of purse-seiners by a discard rate of 4,030 t·boat-1·year-1 to estimate the quantity of discards of the tuna fleet operating from the Tema port in Ghana annually between 1959 and 2010.
In the industrial trawl and the shrimping fleet sectors of the Ghanaian fisheries, valuable demersal fish species like the breams, groupers, croakers, snappers, cephalopods, shrimps and lobsters are the target species. Small fishes, juvenile and species that are of lower value are discarded at sea and not landed. Discard rates were most often very high in these fleets. Discards rates were estimated to be equivalent to landings in the past, i.e., 50% of total catches (Koranteng 2003) and range between 30% and 80% (Kofi Amador, pers. obs.). Averaging these three estimates created a discard rate of about 50% of total catches. More recently, since evidence suggests that artisanal fishers would buy part of these catches, we conservatively assumed that only 40% was really discarded at sea. Since this practice is recent and unwanted by-catch in Ghana is increasingly being used (Nunoo et al. 2009), discard rates were likely higher in the past. Therefore, we assumed a linear decrease from 50% (average estimate) of total catches, i.e., 100% of landings in 1958, when trawling began in Ghana, to 40% of landings in 2010.
The main bycatch and discards during the course of a typical purse seine fishing trip were Atlantic bonito, Sarda sarda (Scombridae), the grey trigger fish Balistes capriscus (Balistidae), blue runner Caranx crysos (Carangidae), Pompano dolphinfish Coryphaena equiselis (Coryphaenidae); others were Atlantic sailfin Isthiophorus albicans, , wahoo Acanthocybium solandri (Scombridae), rainbow runner Elegatis bipinnulata (Carangidae). The rest were the red rover (‘Kwamisei’) Emmelichthys rubber (Emmelichthydae), Atlantic tripletail Lobotes surinamensis (Lobotidae) and sergeant-major Abudefduf saxatilis (Pomadasidae). Table 5 shows the major bycatch and their approximate percentages encountered during a trip.
NUNOO ET AL.: CATCH RECONSTRUCTION FOR GHANA
14
Table 5. Taxonomic breakdown of purse-‐seine discards Common name Scientific name % Atlantic bonito Sarda sarda 20 Triggerfish Balistes spp. 20 Blue runner Caranx crysos 19 Atlantic sailfin Isthiophorus albicans 15 Doctorfish Acanthurus chirurgus 9 Wahoo Acanthocybium solandri 8 Miscellaneous marine fishes 4 Atlantic tripletail Lobotes surinamensis 2 Red cover Emmelichthys ruber 2 Sergeant-‐major Abudefduf saxatilis 1
Geographic allocation of Ghanaian distant water catches (outside the Ghanaian EEZ)
As part of the improved spatial assignment process, large-scale catches that were taken from outside of FAO area 34 were filtered out. Catches from outside the EEZ declined by 50% between 1975 (a reported catch of 50,000 t) and 1981 (25,000), of which 22% were taken from The Gambia in 1974, 67% from Angola and Namibia (outside area 34) and the remaining from Ghana and Mauritania, i.e., 5.5% each (Dioury 1983). By multiplying catch rates for The Gambia (22%) by the total industrial reported catch (other than tunas) which were likely taken from inside and outside the Ghanaian EEZ, we estimated Ghanaian catches from The Gambia at 11,000 t·year-1 for 1974 (50% of the reported catch to the FAO) and 5,500 t·year-1 for 1981 (17% of the reported catch to the FAO) and assumed these to be 0 in 1985, since then the Ghanaian fleet rejoined the Ghanaian EEZ. Similarly, we applied the same method for catches from the Mauritanian and Ghanaian EEZs. Since 1985, all reported catches (landed in Ghana) were assumed to have been taken from the Ghanaian EEZ. This exercise is important since an important part of the industrial catch landed in Ghana by the Ghanaian distant water fleet was taken from outside Ghana’s waters.
RESULTS
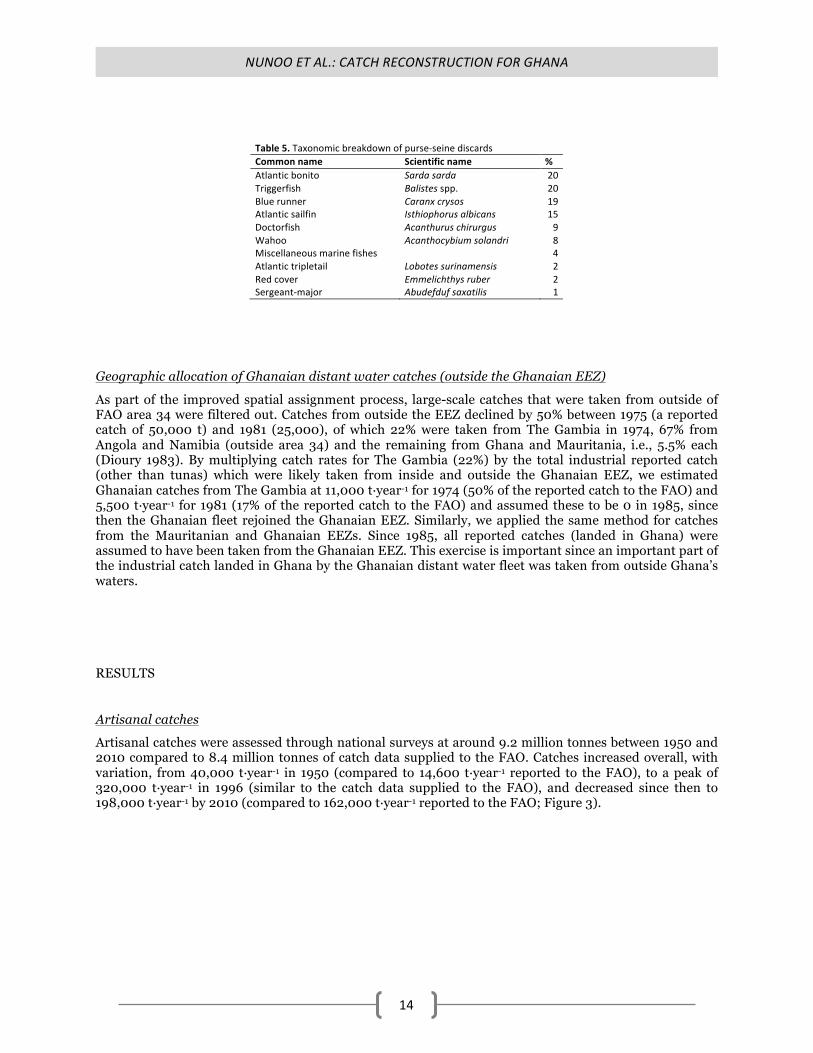
Artisanal catches
Artisanal catches were assessed through national surveys at around 9.2 million tonnes between 1950 and 2010 compared to 8.4 million tonnes of catch data supplied to the FAO. Catches increased overall, with variation, from 40,000 t·year-1 in 1950 (compared to 14,600 t·year-1 reported to the FAO), to a peak of 320,000 t·year-1 in 1996 (similar to the catch data supplied to the FAO), and decreased since then to 198,000 t·year-1 by 2010 (compared to 162,000 t·year-1 reported to the FAO; Figure 3).
NUNOO ET AL.: CATCH RECONSTRUCTION FOR GHANA
15
Figure 3. Reconstructed artisanal catch data compared to the data supplied to the FAO for Ghana, 1950-2010.
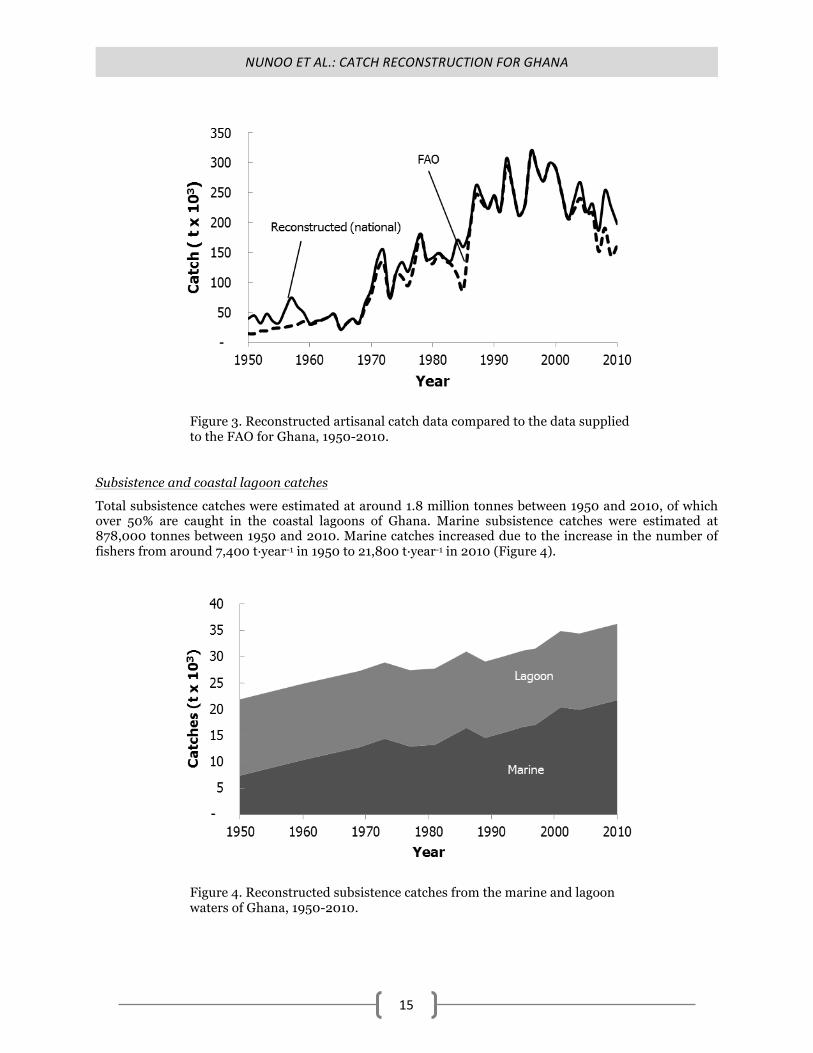
Subsistence and coastal lagoon catches
Total subsistence catches were estimated at around 1.8 million tonnes between 1950 and 2010, of which over 50% are caught in the coastal lagoons of Ghana. Marine subsistence catches were estimated at 878,000 tonnes between 1950 and 2010. Marine catches increased due to the increase in the number of fishers from around 7,400 t·year-1 in 1950 to 21,800 t·year-1 in 2010 (Figure 4).
Figure 4. Reconstructed subsistence catches from the marine and lagoon waters of Ghana, 1950-2010.
NUNOO ET AL.: CATCH RECONSTRUCTION FOR GHANA
16
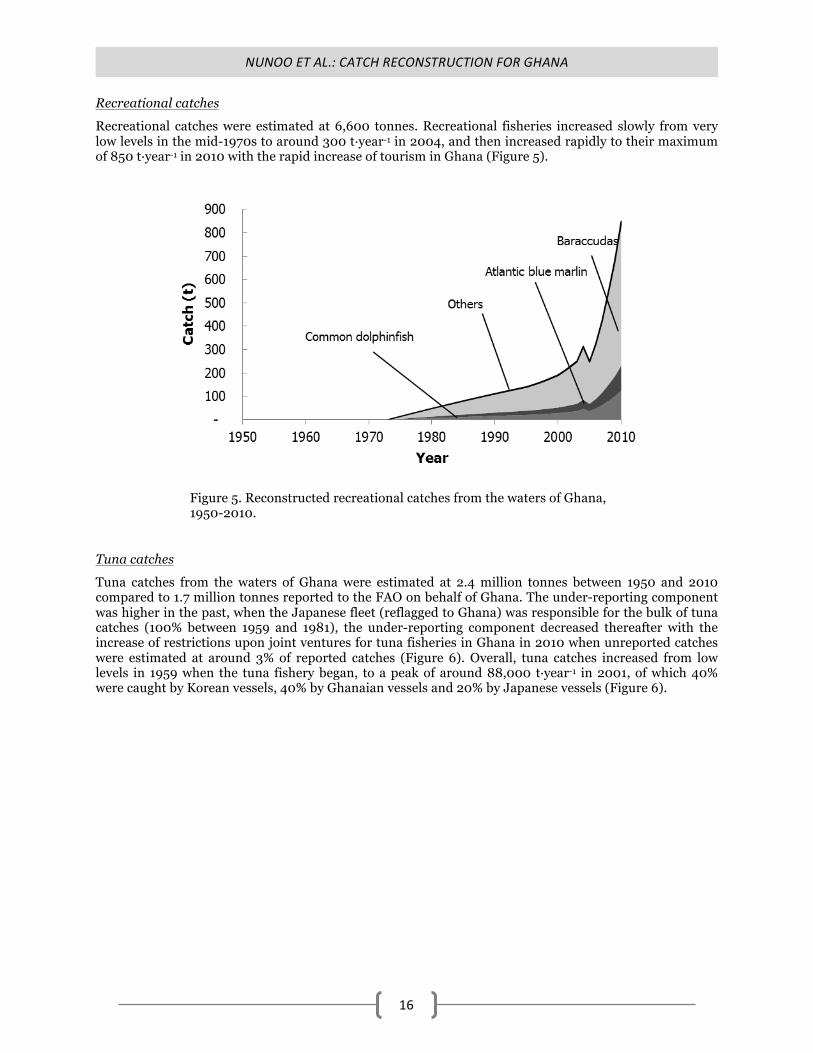
Recreational catches
Recreational catches were estimated at 6,600 tonnes. Recreational fisheries increased slowly from very low levels in the mid-1970s to around 300 t·year-1 in 2004, and then increased rapidly to their maximum of 850 t·year-1 in 2010 with the rapid increase of tourism in Ghana (Figure 5).
Figure 5. Reconstructed recreational catches from the waters of Ghana, 1950-2010.
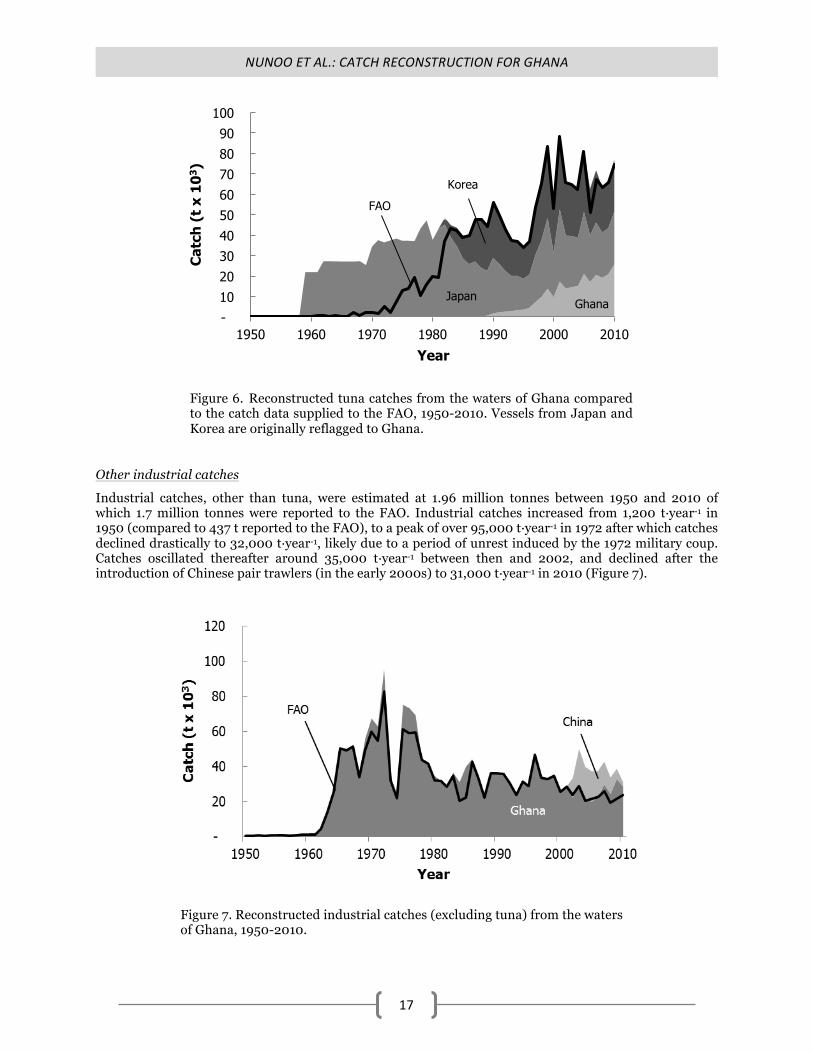
Tuna catches
Tuna catches from the waters of Ghana were estimated at 2.4 million tonnes between 1950 and 2010 compared to 1.7 million tonnes reported to the FAO on behalf of Ghana. The under-reporting component was higher in the past, when the Japanese fleet (reflagged to Ghana) was responsible for the bulk of tuna catches (100% between 1959 and 1981), the under-reporting component decreased thereafter with the increase of restrictions upon joint ventures for tuna fisheries in Ghana in 2010 when unreported catches were estimated at around 3% of reported catches (Figure 6). Overall, tuna catches increased from low levels in 1959 when the tuna fishery began, to a peak of around 88,000 t·year-1 in 2001, of which 40% were caught by Korean vessels, 40% by Ghanaian vessels and 20% by Japanese vessels (Figure 6).
NUNOO ET AL.: CATCH RECONSTRUCTION FOR GHANA
17
Figure 6. Reconstructed tuna catches from the waters of Ghana compared to the catch data supplied to the FAO, 1950-2010. Vessels from Japan and Korea are originally reflagged to Ghana.
Other industrial catches
Industrial catches, other than tuna, were estimated at 1.96 million tonnes between 1950 and 2010 of which 1.7 million tonnes were reported to the FAO. Industrial catches increased from 1,200 t·year-1 in 1950 (compared to 437 t reported to the FAO), to a peak of over 95,000 t·year-1 in 1972 after which catches declined drastically to 32,000 t·year-1, likely due to a period of unrest induced by the 1972 military coup. Catches oscillated thereafter around 35,000 t·year-1 between then and 2002, and declined after the introduction of Chinese pair trawlers (in the early 2000s) to 31,000 t·year-1 in 2010 (Figure 7).
Figure 7. Reconstructed industrial catches (excluding tuna) from the waters of Ghana, 1950-2010.
- 10 20 30 40 50 60 70 80 90
100
1950 1960 1970 1980 1990 2000 2010
Cat
ch (
t x
103 )
Year
Cymbium
Japan
Korea
Ghana
FAO
NUNOO ET AL.: CATCH RECONSTRUCTION FOR GHANA
18
Baitfish catches
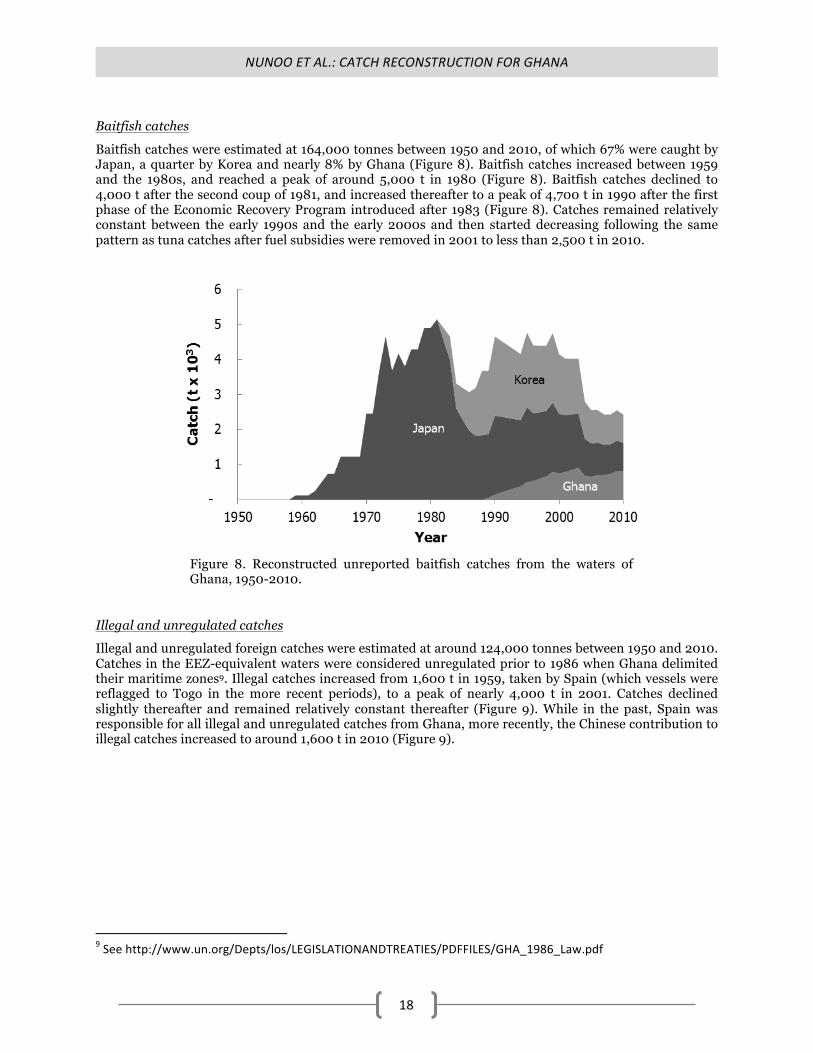
Baitfish catches were estimated at 164,000 tonnes between 1950 and 2010, of which 67% were caught by Japan, a quarter by Korea and nearly 8% by Ghana (Figure 8). Baitfish catches increased between 1959 and the 1980s, and reached a peak of around 5,000 t in 1980 (Figure 8). Baitfish catches declined to 4,000 t after the second coup of 1981, and increased thereafter to a peak of 4,700 t in 1990 after the first phase of the Economic Recovery Program introduced after 1983 (Figure 8). Catches remained relatively constant between the early 1990s and the early 2000s and then started decreasing following the same pattern as tuna catches after fuel subsidies were removed in 2001 to less than 2,500 t in 2010.
Figure 8. Reconstructed unreported baitfish catches from the waters of Ghana, 1950-2010.
Illegal and unregulated catches
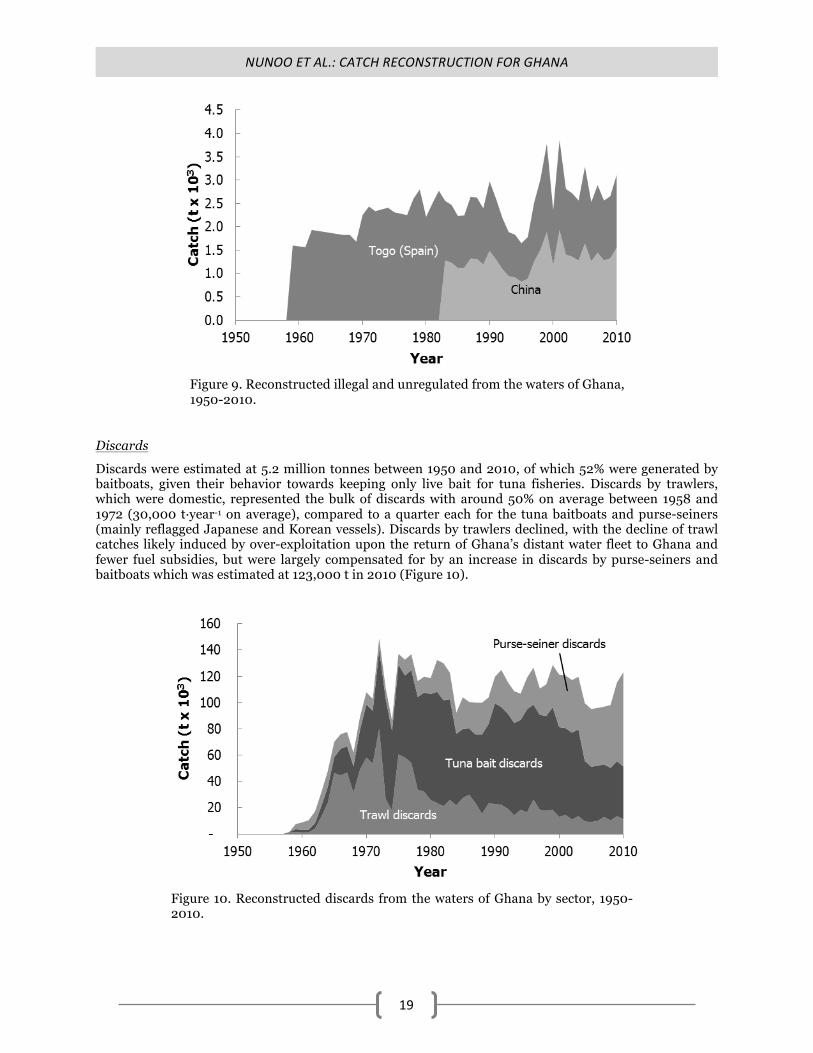
Illegal and unregulated foreign catches were estimated at around 124,000 tonnes between 1950 and 2010. Catches in the EEZ-equivalent waters were considered unregulated prior to 1986 when Ghana delimited their maritime zones9. Illegal catches increased from 1,600 t in 1959, taken by Spain (which vessels were reflagged to Togo in the more recent periods), to a peak of nearly 4,000 t in 2001. Catches declined slightly thereafter and remained relatively constant thereafter (Figure 9). While in the past, Spain was responsible for all illegal and unregulated catches from Ghana, more recently, the Chinese contribution to illegal catches increased to around 1,600 t in 2010 (Figure 9).
9 See http://www.un.org/Depts/los/LEGISLATIONANDTREATIES/PDFFILES/GHA_1986_Law.pdf
NUNOO ET AL.: CATCH RECONSTRUCTION FOR GHANA
19
Figure 9. Reconstructed illegal and unregulated from the waters of Ghana, 1950-2010.
Discards
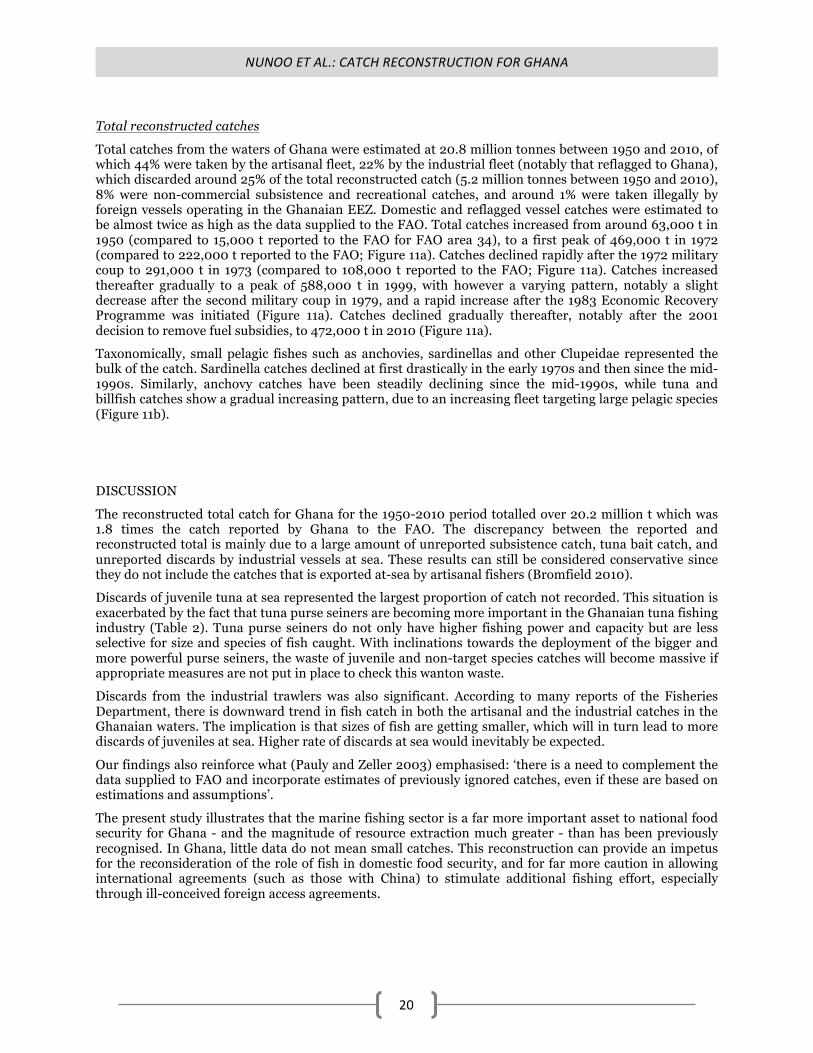
Discards were estimated at 5.2 million tonnes between 1950 and 2010, of which 52% were generated by baitboats, given their behavior towards keeping only live bait for tuna fisheries. Discards by trawlers, which were domestic, represented the bulk of discards with around 50% on average between 1958 and 1972 (30,000 t·year-1 on average), compared to a quarter each for the tuna baitboats and purse-seiners (mainly reflagged Japanese and Korean vessels). Discards by trawlers declined, with the decline of trawl catches likely induced by over-exploitation upon the return of Ghana’s distant water fleet to Ghana and fewer fuel subsidies, but were largely compensated for by an increase in discards by purse-seiners and baitboats which was estimated at 123,000 t in 2010 (Figure 10).
Figure 10. Reconstructed discards from the waters of Ghana by sector, 1950-2010.
NUNOO ET AL.: CATCH RECONSTRUCTION FOR GHANA
20
Total reconstructed catches
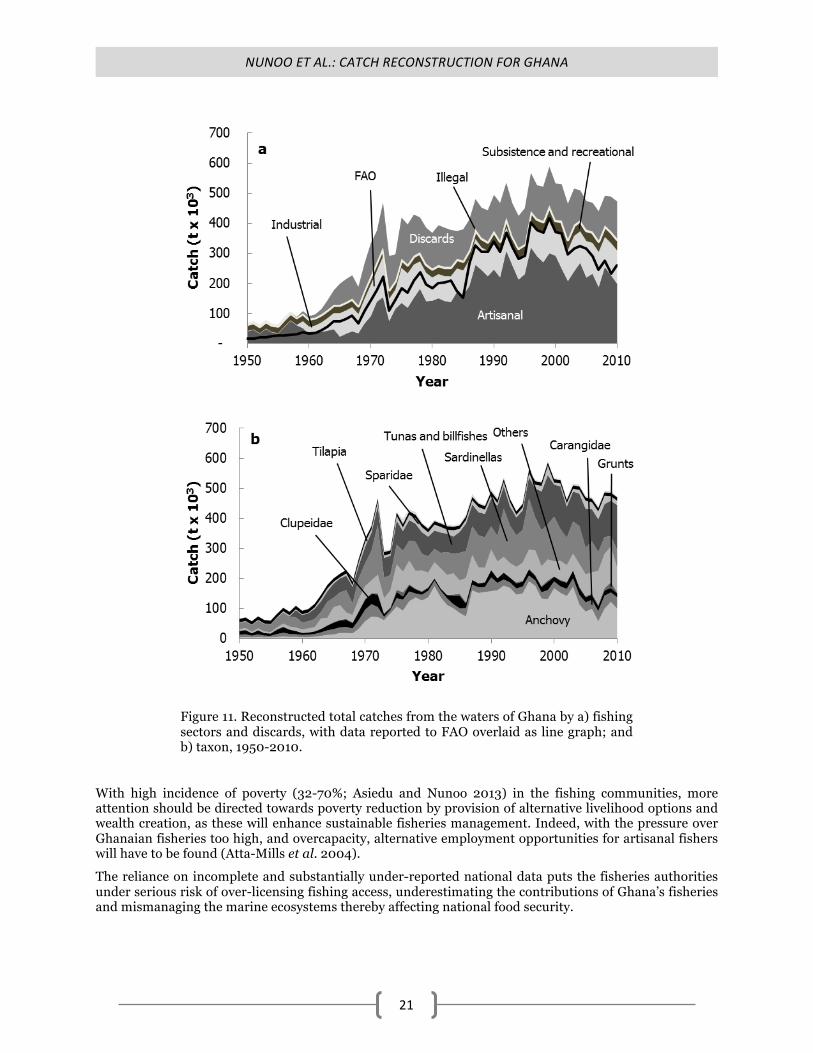
Total catches from the waters of Ghana were estimated at 20.8 million tonnes between 1950 and 2010, of which 44% were taken by the artisanal fleet, 22% by the industrial fleet (notably that reflagged to Ghana), which discarded around 25% of the total reconstructed catch (5.2 million tonnes between 1950 and 2010), 8% were non-commercial subsistence and recreational catches, and around 1% were taken illegally by foreign vessels operating in the Ghanaian EEZ. Domestic and reflagged vessel catches were estimated to be almost twice as high as the data supplied to the FAO. Total catches increased from around 63,000 t in 1950 (compared to 15,000 t reported to the FAO for FAO area 34), to a first peak of 469,000 t in 1972 (compared to 222,000 t reported to the FAO; Figure 11a). Catches declined rapidly after the 1972 military coup to 291,000 t in 1973 (compared to 108,000 t reported to the FAO; Figure 11a). Catches increased thereafter gradually to a peak of 588,000 t in 1999, with however a varying pattern, notably a slight decrease after the second military coup in 1979, and a rapid increase after the 1983 Economic Recovery Programme was initiated (Figure 11a). Catches declined gradually thereafter, notably after the 2001 decision to remove fuel subsidies, to 472,000 t in 2010 (Figure 11a).
Taxonomically, small pelagic fishes such as anchovies, sardinellas and other Clupeidae represented the bulk of the catch. Sardinella catches declined at first drastically in the early 1970s and then since the mid-1990s. Similarly, anchovy catches have been steadily declining since the mid-1990s, while tuna and billfish catches show a gradual increasing pattern, due to an increasing fleet targeting large pelagic species (Figure 11b).
DISCUSSION
The reconstructed total catch for Ghana for the 1950-2010 period totalled over 20.2 million t which was 1.8 times the catch reported by Ghana to the FAO. The discrepancy between the reported and reconstructed total is mainly due to a large amount of unreported subsistence catch, tuna bait catch, and unreported discards by industrial vessels at sea. These results can still be considered conservative since they do not include the catches that is exported at-sea by artisanal fishers (Bromfield 2010).
Discards of juvenile tuna at sea represented the largest proportion of catch not recorded. This situation is exacerbated by the fact that tuna purse seiners are becoming more important in the Ghanaian tuna fishing industry (Table 2). Tuna purse seiners do not only have higher fishing power and capacity but are less selective for size and species of fish caught. With inclinations towards the deployment of the bigger and more powerful purse seiners, the waste of juvenile and non-target species catches will become massive if appropriate measures are not put in place to check this wanton waste.
Discards from the industrial trawlers was also significant. According to many reports of the Fisheries Department, there is downward trend in fish catch in both the artisanal and the industrial catches in the Ghanaian waters. The implication is that sizes of fish are getting smaller, which will in turn lead to more discards of juveniles at sea. Higher rate of discards at sea would inevitably be expected.
Our findings also reinforce what (Pauly and Zeller 2003) emphasised: ‘there is a need to complement the data supplied to FAO and incorporate estimates of previously ignored catches, even if these are based on estimations and assumptions’.
The present study illustrates that the marine fishing sector is a far more important asset to national food security for Ghana - and the magnitude of resource extraction much greater - than has been previously recognised. In Ghana, little data do not mean small catches. This reconstruction can provide an impetus for the reconsideration of the role of fish in domestic food security, and for far more caution in allowing international agreements (such as those with China) to stimulate additional fishing effort, especially through ill-conceived foreign access agreements.
NUNOO ET AL.: CATCH RECONSTRUCTION FOR GHANA
21
Figure 11. Reconstructed total catches from the waters of Ghana by a) fishing sectors and discards, with data reported to FAO overlaid as line graph; and b) taxon, 1950-2010.
With high incidence of poverty (32-70%; Asiedu and Nunoo 2013) in the fishing communities, more attention should be directed towards poverty reduction by provision of alternative livelihood options and wealth creation, as these will enhance sustainable fisheries management. Indeed, with the pressure over Ghanaian fisheries too high, and overcapacity, alternative employment opportunities for artisanal fishers will have to be found (Atta-Mills et al. 2004).
The reliance on incomplete and substantially under-reported national data puts the fisheries authorities under serious risk of over-licensing fishing access, underestimating the contributions of Ghana’s fisheries and mismanaging the marine ecosystems thereby affecting national food security.
NUNOO ET AL.: CATCH RECONSTRUCTION FOR GHANA
22
ACKNOWLEDGEMENTS
This is a contribution of the Sea Around Us project, a scientific collaboration between the University of British Columbia and The Pew Charitable Trusts. We wish to extend our gratitude to the Marine Fisheries Research Division of the Fisheries Commission of the Ministry of Fisheries and Aquaculture Development for the data (both hard and soft records) used in compiling this study and Dr. Dirk Zeller for his advice.
REFERENCES
Amador K, Bannerman P, Quartey R and Ashong R (2006) Ghana Canoe Frame Survey, 2004. Technical Paper 34, Marine Fisheries Research Division, Accra. 43 p.
Anon. (2004) Information on fisheries in Ghana. Directorate of Fisheries, Ministry of Food and Agriculture, Accra. 24 p.
Anon. (2007) Tourism statistical fact sheet on Ghana. Ghana Tourist Board, Accra. 1 p. Ansa-‐Emmim M (1973) Pelagic Fisheries, pp 42-‐46 In The Ghana Fishing Industry. Proceedings of
Symposium on the Fishing Industry in Ghana, May 4-‐5, 1972. Fishery Research Unit, Tema. 50 p. Antwi V (2006) Sustainability impact assessment of proposed WTO negotiations: the fisheries sector.
Country case study: Ghana. Ministry of Fisheries, Accra. 32 p. Asiedu B and Nunoo F (2013) Alternative Livelihoods: A Tool for Sustainable Fisheries Management in
Ghana. International Journal of Fisheries and Aquatic Sciences 2(2): 21-‐28. Atta-‐Mills J, Alder I and Sumaila U (2004) The unmaking of a regional fishing nation: The case of Ghana
and West Africa. Natural Resources Forum 28: 13-‐21. Awity L (2005) Prospective analysis of future aquaculture development. National Aquaculture Sector
Review, Ghana. Accra, Ministry of Fisheries. 3 p. Balarin J (1988) National reviews for aquaculture development in Africa No 18 Ghana. FAO Fisheries
Circular 770, FAO, Rome. 18 p. Bard F and Koranteng K (1993) Dynamics and use of Sardinella Resources from Upwelling off Ghana and
Ivory Coast. Frankreich Office de la Recherche Scientifique et Technique Outre-‐Mer, ORSTOM ed., Paris. 438 p.
Bennett E (2002) The challenges of managing small-‐scale fisheries in West Africa. . CEMARE Report R7334, University of Portsmouth, UK. 61 p.
Binet D (1982) Influense des variations climatiques sur la peche de Sardinella aurita ivoiro-‐ghanéennes: relation secheresse-‐surpêche. Oceanological Acta 5: 443-‐452.
Binet D, Marchal M and Pezennec O (1991) Sadrinella aurita de Cote-‐d’Ivoire et du Ghana : fluctuations halieutiques et changements climatiques. pp. 320-‐353 In Cury P and Roy C (eds.), Pêcheries Ouest Africaines : variabilité, instabilité et changement. Editions de l’ORSTOM, Paris.
Bromfield T (2010) Atlantic rising: state of the fishing industry in Ghana. Ecologist. Available at: http://www.theecologist.org/blogs_and_comments/Blogs/atlantic_rising/397350/atlantic_rising_state_of_the_fishing_industry_in_ghana.html [Accessed: 26/08/2013].
Dioury F (1983) Monographie de la pêche dans douze pays riverains d'Afrique de l'Ouest, de la Mauritanie au Benin.Bruxelles: s.n.
Directorate of Fisheries (DOF) (2004) Fisheries in Ghana. Ministry of Food and Agriculture, Accra. 24 p. Falaye A (2008) Illegal Unreported Unregulated (IUU) fishing in West Africa (Nigeria and Ghana), report
of a Study prepared for MRAG. MRAG, London. 32 p.
NUNOO ET AL.: CATCH RECONSTRUCTION FOR GHANA
23
Fisheries Research Unit/Office de Recherche Scientfique et Technique pour le Développement en Coopération (FRU/ORSTOM) (1976) Rapport du groupe de travail sur la sardinelle (Sardinella aurita) des Côte d'Ivoire-‐Ghaéennes. ORSTOM, Abidjan. 32 p.
Ghana News Agency (2005) Minister meets Chinese fishing investors. GNA 25 November 2005. Available at: http://www.modernghana.com/news/90838/1/minister-‐meets-‐chinese-‐fishing-‐investors.html [Accessed: 26/08/2013].
Ghana Statistical Service (GSS) (2011) Country STAT Ghana. Ghana Statistical Service, Accra. 25 p. Hammond D (1977) Tuna fisheries in Ghana. Information Report 14, Fisheries Research Unit, Tema. 21 p. Irvine F (1947) The Fish and Fisheries of the Gold Coast,with illustrations and an account of the fishing
industry by A. P. Brown. The Crown Agents for the Colonies, London. 351 p. Kapetsky J (1984) Coastal lagoon fisheries around the world: some perspective on fishery yields and
other important fishery characteristics. pp. 97-‐139 In Kapetsky J and Lasserre G (eds.), Management of coastal lagoons1. FAO Studies and Reviews/GFCM 61, Rome.
Koranteng K (1989) The sardinella (“herring”) fishery in Ghana: The past, recent developments and the years ahead. Information Report 23, Fisheries Research and Utilization Branch, Tema. 20 p.
Koranteng K (2003) 1986-‐1995 Report on the Marine Fisheries Research Division. Directorate of Fisheries, Ministry of Food and Agriculture, Accra. 36 p.
Koranteng K, Nmashie O and Baddoo A (1992) Ghana Canoe Frame Survey 1992. Technical Paper 8, Marine Fisheries Research Division, Accra. 16 p.
Kwadjosse T (2009) The law of the sea: impacts on the conservation and management of fisheries resources of developing coastal states – the Ghana case study. Division for Ocean Affairs and the Law of the Sea. Office of Legal Affairs, the United Nations, New York. 88 p.
Kwei E (1988) Animals with particular reference to fisheries. 29th anniversary lectures, Ghana Academy of Arts and Sciences, Accra 21-‐25th November 1988. Ghana Academy of Arts and Sciences, Accra. 30 p.
Lawson R and Kwei E (1974) African entrepreneurship and economic growth: a case study of fishing industry of Ghana. Ghana Universities Press, Accra. 262 p.
Longhurst A and Pauly D (1987) Ecology of Tropical Oceans. Academic Press, San Diego. 407 p. Mendelssohn R and Cury P (1987) Fluctuations of a fortnightly night abundance index of the Ivorian
coastal pelagic species and associated environmental conditions. Canadian Journal of Fisheries and Aquatic Sciences 44: 408-‐421.
Mensah M (1977) Report of Biennium, 1975 – 1976 on the Fishery Research Unit. Fishery Research Unit, Tema. 59 p.
Mensah M (1983) Report for the Triennium 1980 – 1982. Fishery Research Unit, Tema. 34 p. Mensah M and Koranteng K (1988) A Review of the Oceanography and Fisheries Resources in the coastal
waters of Ghana, 1981-‐1986. Marine Fisheries Research Report 8, Fisheries Department, Research and Utilization Branch, Accra. 35 p.
MRAG (2005) Reviews of Impact of Illegal, Unreported and Unregulated Fishing on Developing Countries. Final Report, MRAG, London. 176 p.
Muta K (1964) Report on the biological survey of the sardine (Sardinella aurita). Government of Ghana, Mimeo. 30 p.
NOAA (1981) New Ghanaian tuna fishing regulations. Foreign fishery development. Marine Fisheries Review 43(8): 29-‐31.
Nunoo F, Boateng J, Ahulu A, Agyekum K and Sumaila U (2009) When trash fish is treasure: The case of Ghana in West Africa. Fisheries Research 96(2): 167-‐172.
Obeng V (2003) Towards and appropriate economic management regime of tuna fisheries in Ghana. Department of Economics. Norwegian College of Fishery Science, University of Tromso, Tromso. 66 p.
NUNOO ET AL.: CATCH RECONSTRUCTION FOR GHANA
24
Ofori-‐Adu D (1988) List of fishes, shellfishes and other marine food resources in the Ghanaian coastal waters. Technical Paper 1, Marine Fisheries Research Division, Accra. 20 p.
Pauly D (1975a) Investigations in Sakumo Lagoon. In: Fishery Research Unit. Tema, Ghana. Report for the Biennium 1973-‐1974. pp. Appendix 2, 3 In Pauly D and Yañez—Arancibia A (eds.), Fisheries in lagoon-‐estuarine ecosystems. Wiley-‐Blackwell, Hoboken, N.J.
Pauly D (1975b) On the ecology of a small West African lagoon. Berichte der Deutschen wissenschaftlichen Kommission für Meeresforschung 24(1): 46-‐62.
Pauly D (1976) The biology, fishery and potential for aquaculture of Tilapia melanotheron in a small West African lagoon. Aquaculture 7(1): 33-‐49.
Pauly D (2002) Spatial modelling of trophic interactions and fisheries impacts in coastal ecosystems: a case study of Sakumo Lagoon, Ghana. pp. xxxv & 289-‐296 In McGlade J, Cury P, Koranteng K and Hardman-‐Mountford J (eds.), The Gulf of Guinea Large Marine Ecosystem: environmental forcing and sustainable development of marine resources. Elsevier Science, Amsterdam.
Pauly D, Belhabib D, Blomeyer R, Cheung W, Cisneros-‐Montemayor A, Copeland D, Harper S, Lam V, Mai Y, Le Manach F, Österblom H, Mok K, van der Meer L, Sanz A, Shon S, Sumaila U, Swartz W, Watson R, Zhai Y and Zeller D (2013) China's distant-‐water fisheries in the 21st century. Fish and Fisheries.
Pauly D and Yañez-‐Arancibia A (2013) Fisheries in lagoon-‐estuarine ecosystem. pp. 465-‐482 In Day J, Crump B, Kemp W and Yañez-‐Arancibia A (eds.), Estuarine EcologySecond Edition. Wiley-‐Blackwell, Hoboken, N.J.
Pauly D and Zeller D (2003) The global fisheries crisis as a rationale for improving the FAO’s database of fisheries statistics. pp. 8-‐16 In Zeller D, Booth S, Mohammed E and Pauly D (eds.), From Mexico to Brazil: Central Atlantic fisheries catch trends and ecosystem models11 (6). Fisheries Centre Research Report.
Pezennec O and Bard F (1992) Importance écologique de la petite saison d’upwelling ivoiro-‐ghanéenne et changements dans la pêcherie de Sardinella aurita. Aquat. Living Resour. 4: 249-‐259.
Pramod G and Pitcher T (2006) An Estimation of Compliance of the Fisheries of Ghana with Article 7 (Fisheries Management) of the FAO (UN) Code of Conduct for Responsible Fishing. p. 29 In Pitcher T, Kalikoski D and Pramod G (eds.), Evaluations of Compliance with the FAO (UN) Code of Conduct for Responsible Fisheries14 (2). Fisheries Centre Research Reports
Sarpong D, Quaatey N and Harvey S (2005) The Economic and Social Contribution of Fisheries to Gross Domestic Product and Rural Development in Ghana. FAO Sustainable Fisheries Livelihoods Programme (SFLP) GCP/INT/735/UK, Rome. 53 p.
Serra G (2013) Towards a political economy of statistics: a study of household budget surveys in the gold coast, 1945-‐1957. Paper presented at the conference ‘ African Economic Development: measuring success and failure’. 33 p.
Stromme T (1983) Report of the R/V Dr. FRIDTJOF NANSEN fish resource surveys off West Africa, Morocco to Ghana and Cape Verde. May 1981-‐March 1982. CECAF Programme CECAF/ECAF Series 84/29, FAO, Rome. 190 p.
Troadec J and Garcia S (1980) The fish resources of the Eastern Central Atlantic. Part one: the resources of the Gulf of Guinea from Angola to Mauritania. Fisheries Technical Paper 186, FAO, Rome. 166 p.
Weber J and Durand H (1986) Le secteur des pêches dans les pays d'Afrique. Réunion préparatoire pour l'Afrique en vue de lâ première consultation sur l'industrie de la pêche. .86, Organisation des Nations Unies pour le dévelopement industriel, Dakar, Sénégal. 135 p.
Zeller D, Booth S, David G and Pauly D (2007) Re-‐estimation of small-‐scale fishery catches for U.S. flag associated island areas in the Western Pacific: The last 50 years. Fishery Bulletin 105(2): 266-‐277.

NUNOO ET AL.: CATCH RECONSTRUCTION FOR GHANA
25