Embed Size (px)
Citation preview
Taylor UniversityPillars at Taylor University
Master of Arts in Higher Education Thesis Collection
2013
Five Factors Relating to Students' AcademicAdvising Experience at a Small, Private, Liberal ArtsUniversityJeff StrietzelTaylor University
Follow this and additional works at: http://pillars.taylor.edu/mahe
Part of the Higher Education Commons
This Thesis is brought to you for free and open access by Pillars at Taylor University. It has been accepted for inclusion in Master of Arts in HigherEducation Thesis Collection by an authorized administrator of Pillars at Taylor University. For more information, please contact [email protected].
Recommended CitationStrietzel, Jeff, "Five Factors Relating to Students' Academic Advising Experience at a Small, Private, Liberal Arts University" (2013).Master of Arts in Higher Education Thesis Collection. 73.http://pillars.taylor.edu/mahe/73

FIVE FACTORS RELATING TO STUDENTS’ ACADEMIC ADVISING
EXPERIENCE AT A SMALL, PRIVATE,
LIBERAL ARTS UNIVERSITY
__________________________
A Thesis
Presented to
The School of Graduate Studies
Department of Higher Education and Student Development
Taylor University
Upland, Indiana
__________________________
In Partial Fulfillment
of the Requirements for the Degree
Master of Arts in Higher Education and Student Development
__________________________
by
Jeff Strietzel
December 2012
© Jeff Strietzel 2012
Higher Education and Student Development
Taylor University
Upland, Indiana
CERTIFICATE OF APPROVAL
_________________________
MASTER’S THESIS
_________________________
This is to certify that the Thesis of
Jeff Strietzel
entitled
Five Factors Relating to Students’ Academic Advising Experience
at a Small, Private, Liberal Arts University
has been approved by the Examining Committee for the thesis requirement for the
Master of Arts degree
in Higher Education and Student Development
December 2012
__________________________ _____________________________
C. Skip Trudeau, Ed.D. Date Scott Gaier, Ph.D. Date
Thesis Supervisor Member, Thesis Hearing Committee
_____________________________
Scott Moeschberger, Ph.D. Date
Member, Thesis Hearing Committee
______________________________
Tim Herrmann, Ph.D. Date
Director, M.A. in Higher Education and Student Development
iii
Abstract
Academic advising is an important part of the college experience but has innate
challenges. Much research has been done to try to improve the quality of students’
academic advising experiences, but limited research has focused on student factors that
contribute to their experiences. This project sought to discover if certain factors impacted
students’ academic advising experiences for better or worse at one institution. The
research question guiding the study was “Is there a relationship between students’
academic preparedness, school, gender, class, and ethnicity with their academic advising
experiences at a small, private, liberal arts university?” The 2012 NSSE 2.0 Pilot Study,
Academic Advising Module served as the dependent variable and Independent Samples
T-tests and Analyses of Variances were calculated for the five aforementioned factors.
Statistical results indicated that four factors did not strongly correlate to students’
academic advising experiences, positively or negatively. However, students’ ethnicity
(White vs. Non-White) did produce a strong statistical correlation between the means
(p = .002). A main reason for this may be the number of international students who were
part of the sample and the multiple ways in which they were supported at the institution
in the study. While contributing to academic advising literature, the study also draws
attention to the high value of multiple touch-points on students’ academic advising
experiences. The more faculty and staff take time to invest in students’ academic success,
the greater those students’ estimation and satisfaction with their advising.
iv
Acknowledgements
Much thanks and appreciation must go to my colleagues, friends, and family who
selflessly offered their time and energy in critically reading this manuscript through its
various iterations, including David Restrick, Aaron Gottier, and Dr. Cheryl Bremer.
Dr. Skip Trudeau, Thank you for your support, prompt turn-around time, patience,
and forthright, constructive, and encouraging input. Dr. Scott Moeschberger, Thank you
for your help and direction in the construction of my methodology. Brent Maher, Thank
you for your participation, direction, and humble instruction in utilizing NSSE and SPSS.
Dr. Tim Herrmann, Thank you for the many ways you have served and demonstrated the
courage to teach through the MAHE program, your classes, and the curriculum of your
life.
Julie Strietzel, my wife and best friend, Thank you for your countless
conversations, readings, and edits. Your sacrificial love and support are a great testimony
of your impressive character.
v
Table of Contents
Abstract ........................................................................... Error! Bookmark not defined.ii
Acknowledgements ............................................................................................................ iv
List of Tables .................................................................................................................. viiii
Chapter 1 Introduction ........................................................................................................ 1
Problem Statement .................................................................................................. 2
Chapter 2 Literature Review ............................................................................................... 4
Background: Student Engagement .......................................................................... 4
Faculty-Student Interaction ..................................................................................... 7
Other Values of Academic Advising ...................................................................... 8
Advising Models ..................................................................................................... 9
Advising Theories ................................................................................................. 10
Advising Methods ................................................................................................. 11
Advisor-Student Perspectives ............................................................................... 13
Factors Concerning Engagement and Advising .................................................... 15
Summary ............................................................................................................... 17
Hypotheses ............................................................................................................ 18
Chapter 3 Methods ............................................................................................................ 19
Instrument ............................................................................................................. 19
Procedures ............................................................................................................. 20
vi
Dependent Variable: Academic Advising Experience ......................................... 20
Independent Variables .......................................................................................... 22
Participants Summary ........................................................................................... 23
Analyses ................................................................................................................ 24
Summary ............................................................................................................... 24
Chapter 4 Results ............................................................. Error! Bookmark not defined.5
Ethnicity ................................................................................................................ 25
Class and Sex ........................................................................................................ 26
School and Academic Preparedness ..................................................................... 27
Summary ............................................................................................................... 28
Chapter 5 Discussion .................................................................................................................... 29
Ethnicity ................................................................................................................ 29
Instrument ............................................................................................................. 31
Academic Preparedness ........................................................................................ 31
School ................................................................................................................... 32
Class ...................................................................................................................... 32
Gender ................................................................................................................... 33
Hypotheses ............................................................................................................ 33
Limitations ........................................................... Error! Bookmark not defined.4
Future Research ................................................... Error! Bookmark not defined.5
Conclusion ........................................................... Error! Bookmark not defined.6
References ......................................................................................................................... 38
Appendix A: NSSE 2.0 Pilot 2012 Population File .......................................................... 50
vii
Appendix B: ADVEXP Reliability ................................................................................... 53
Appendix C: ADVEXP Inter-Item Correlation Matrix .................................................... 55
Appendix D: Descriptive Statistics of SAT and ACT Scores ........................................... 56
Appendix E: Academic Preparedness Quartile Descriptive Statistics .............................. 57
viii
List of Tables
Table 1. Cohen’s d of Ethnicity and AAE ........................................................................ 26
Table 2. Descriptives of Ethnicity, Class, Sex in Relation toAAE ................................... 27
Table 3. One-Way ANOVA Summary for Academic Preparedness and School ............. 27
1
Chapter 1
Introduction
Improving student retention, engagement, and success are significant challenges
for higher education. Every student is unique and each institution offers a distinct
environment for individuals to develop. Yet research has shown that high-quantity and
high-quality interaction between college students and faculty is directly and consistently
correlated to student satisfaction, success, and retention (Astin, 1999; Chickering &
Gamson, 1987; Kuh, 2003; Kuh & Hu, 2001; Pascarella & Terenzini, 1979, 1991, 2005;
Tinto, 1987, 1993, 2004). One of the best ways to provide exceptional opportunities for
meaningful student-faculty interaction is academic advising (Campbell, Nutt, & The
National Academic Advising Association [NACADA], 2007; Chickering & Gamson,
1987).
Students want and need various types of support, feedback, and information
(Chickering & Gamson, 1987; Kuh, 2005). When done well, academic advising
incorporates these practices (Hunter & White, 2004; NACADA, 2006; Tinto, 1987,
1993). Academic advising also provides space for naturally communicating other
valuable information—one-on-one—that provides positive results in students’ overall
success and satisfaction in college (Astin, 1999; Levitz, Noel, & Richter, 1999; National
Institute of Education, 1984; Pascarella & Terenzini, 2005; Seidman, 2005; Tinto, 1987,
1993). Hunter and White (2004) noted, “Academic advising, well developed and
2
appropriately accessed, is perhaps the only structured campus endeavor that can
guarantee students sustained interaction with a caring and concerned adult who can help
them shape [their college] experience” (p. 21).
Unfortunately, the results of academic advising have historically tended to be
poor for many reasons (Chun-Mei, Golde, & McCormick, 2007; Coll & Draves, 2009;
Tinto 1987). This may be attributed largely to some of its innate challenges (Habley,
1986). Faculty academic advisors often struggle to provide consistent, high-quality
advising to their students (Grites, 1984; Habley, 1986, 1994). Faculty academic advisors
regularly communicate that their advisory responsibilities feel like extra or “tag-on”
responsibilities (Allen & Smith, 2008; Pizzolato, 2008). They often teach full time,
research, write, assist in institutional governance, and have other responsibilities that can
take precedent over advising. Many faculty advisors also bear the internal struggle of
feeling (and being) under-supported and underappreciated for their time and energies
(Donnelly, 2009). The numbers of advising centers and professional academic advisors
have grown in recent years, but faculty advisors are still very common (Habley, 1997).
Numerous attempts have been made to improve the faculty academic advising experience
(Bean & Metzner, 1985; Crookston, 1978; Dassance & Batdorf, 1980; Hunter & White,
2004; Kroll, 1990; O’Banion, 2009; Pizzolato, 2008, Yarbrough, 2002), but academic
advising often receives low student satisfaction ratings on assessment instruments such as
the National Survey of Student Engagement (NSSE) (Kuh, 2003).
Problem Statement
Existing research has sought to examine key factors that impact students’ advising
experiences. Museus and Ravello (2010), for instance, found that students were most
3
satisfied when their advisors created a welcoming environment for personal interaction,
utilized multifaceted approaches, and were proactively engaged. If faculty and
administrators can discover what impacts students’ academic advising experience, then
they may be better equipped to address institutional weaknesses and meet their students’
needs. Few studies have focused on impacts of students’ undergraduate academic
advising experience at a small, private, liberal arts institution (Frost, 1990; Kroll, 1990).
This study sought to answer the question: Is there a relationship between students’
academic advising experience and their academic preparedness, school, gender, class, and
ethnicity at a small, private, liberal arts university in the Midwest?
From the results of the current study, practitioners should be able to gain a greater
understanding of whether any of the aforementioned factors students bring into the
advising experience affect what academic advisors are hoping to accomplish. There also
may be results that help influence advisors decision-making concerning their interaction
with particular groups of students. The hope would be that administrators will utilize the
study to inform decisions about strategic planning and academic advising structure at
their institutions. Regardless, the study should contribute to the valuable research that is
needed to improve such a vital component of students’ college experience and
institutions’ care for students.
4
Chapter 2
Literature Review
Academic advising has become a prevalent point of interest and research in higher
education because of its importance to issues like retention and engagement (Carstensen
& Silerhorn, 1979; Habley, 2009; Metzner, 1989; Seidman, 2005; Shane, 1981;
Yarbrough, 2010). Effective academic advising is a challenge for all stakeholders. The
students, advisors, and institutions would benefit from further research development of
this construct (Light, 2001; Schulenberg & Lindhorst, 2008). Healthy academic advising
involves a conscientious blending of meaningful structure, curriculum, pedagogy, and
learning outcomes (NACADA, 2006). Many have proposed and implemented effective
academic advising structures, theories, models, and methods to facilitate student
retention, engagement, and success. Research has shown that academic advising is a
highly valuable component of a broader student experience and that it incorporates
meaningful factors that contribute to student success (Tinto, 2004). Yet, there is very
little research surrounding the demographic factors, such as school, ethnicity, and gender,
that impact students’ academic advising experience.
Background: Student Engagement
Following Pace’s (1979) concept of Quality of Effort, Astin (1984) wrote a
seminal work entitled, Student Involvement: A Development Theory for Higher
Education. Astin argued that students’ behavior identified and defined their involvement.
5
He also described the value of quantifying this involvement, namely students’ physical
and psychological energy in their academic experience and its relationship to their
retention and success. A positive correlation has been found for students regardless of
what type of student they were before entering college (Tinto, 1987) or what college they
attended (Pascarella & Terenzini, 1991, 2005). Other research confirmed Tinto’s findings
that the higher the student’s level of involvement in academics, extracurricular activities,
and/or peer or faculty relationships, the greater the likelihood of their success and degree
completion (Astin 1993; Barefoot, et al., 2010; Chickering & Gamson, 1987; Chickering
& Kuh, 2005; Kinzie, Schuh, Whitt, & Kuh, 2010; Kramer, 2007; Pascarella & Terenzini,
1991, 2005; Seidman, 2005; Tinto 1987, 1993).
Similarly, Kuh (2001, 2005) developed a large body of research around the idea
of student engagement. As founder of the National Survey of Student Engagement
(NSSE), he described student engagement as “the time and energy students devote to
educationally sound activities inside and outside of the classroom, and the policies and
practices that institutions use to induce students to take part in these activities” (Kuh,
2003, p. 25). At first glance, Astin’s (1984) and Kuh’s (2001) student engagement may
seem the same. Indeed, many use the terms interchangeably. However, Wolf-Wendel,
Ward, and Kinzie (2009) clarified that the concept of involvement “focuses on the
individual and the activities the individual does to become involved” while student
engagement “emphasizes academic, out of class setting, and extracurricular activities” (p.
412). In other words, student involvement focuses on what the individual does to become
involved in his or her institution while student engagement seeks to understand and
6
quantify the student’s broader scope of interaction with his or her college experience.
Kuh (2003) put it candidly:
The engagement premise is deceptively simple, even self-evident: The more
students study a subject, the more they learn about it. Likewise, the more students
practice and get feedback on their writing, analyzing, or problem solving, the
more adept they become. (p. 25)
The likelihood of persisting and enjoying a postsecondary experience may be positively
related to the level of mental, emotional, and relational engagement during the college
years.
Students’ college experiences are greatly influenced by their relationships with
professors and other college professionals. For administrators and faculty, “the challenge
is directing students toward those activities that are the ‘right’ ones for student learning
and success” (Campbell & Nutt, 2008, p. 5). Kuh and his associates simplified some
educationally purposeful activities with five clusters, or benchmarks, which are included
in the NSSE (Kuh, Kinzie, Schuh, Whitt, & Associates, 2005). It is these benchmarks that
create a framework for the NSSE. They are (a) the level of academic challenge, (b) active
and collaborative learning, (c) student-faculty interaction, (d) enriching educational
experiences, and (e) supportive campus environment. Together, these factors are used to
quantify a student’s engagement in their collegiate pursuits and may be the best predictor
of student learning and development (Carini, Kuh, & Klein, 2006; Kuh, 2001; Umbach &
Wawrzynski, 2004; Wolf-Wendel, Ward, & Kinzie, 2009). The present study focused on
the student-faculty interaction benchmark of NSSE.
7
Faculty-Student Interaction
Tinto (1975, 2004) confirmed the importance and value of student-faculty
interaction. Other research corroborated Tinto’s studies. Student-faculty interaction
greatly benefits students, faculty, and their institutions (Astin, 1993; Beal & Noel, 1980;
Bean & Metzner, 1985; Chickering & Gamson, 1987; Heisserer & Parrette, 2002; Kuh,
Kinzie, & Indiana University Center for Postsecondary Research, 2005; Kuh, Nelson,
Laird, & Umbach, 2004; Pascarella & Terenzini 1979; Pascarella & Wolfe 1985;
Seidman, 2005; Umbach & Wawrzynski, 2004). Astin (1999) stated, “Frequent
interaction with faculty is more strongly related to satisfaction with college than any
other type of involvement or, indeed, any other student or institutional characteristic” (p.
525). Other research demonstrated that poor academic advising had a strong impact on
student departure, while positive faculty and staff attitudes seemed to be the strongest
contributors to students’ persistence and satisfaction (Bailey, Bauman, & Lata, 1998;
Beal & Noel, 1980; Frost, 1991; Kuh & Hu, 2001; Tinto, 1987, 1993).
Academic advising is an important component of any institution and has a
strategic place in the life and structure of the college experience. As Frost (1991)
contended:
The faculty-student relationship is important to advising coordinators and advisers
for at least three reasons: (1) Advising, unlike most out-of-class activities, is a
service provided to most students; (2) advising provides a natural setting for out-
of-class contacts with faculty to occur; and (3) advising involves intellectual
matters, the most important area of concern for students. For these reasons, those
8
responsible for advising cannot afford to discount the influence of frequent and
meaningful contact with students. (p. 10)
Hunter and White (2004) also argued that “academic advising, well developed and
appropriately accessed, is perhaps the only structured campus endeavor that can
guarantee students sustained interaction with a caring and concerned adult who can help
them shape such an experience” (p. 21). Campbell and Nutt (2008) agreed:
The concept of engagement is significant when thinking about academic advising,
for we would argue that all institutions have some control over the design and
delivery of academic advising. We would also argue that, when done well,
academic advising can serve as a powerful lever in improving the college student
experience and in supporting an institution’s goals with regard to persistence and
time to graduation because it provides the structured opportunity to direct student
behavior toward the ‘right’ activities. (p. 5)
Thus, finding ways to encourage students to seek out and engage their faculty and faculty
likewise to interact with students, especially in an advising context, appears to be highly
productive for colleges to foster and encourage.
Other Values of Academic Advising
Along with general faculty-student interaction, research has shown strong
relationships between academic advising and a host of variables including student
retention (Drake, 2011; King, 1993a; Seidman, 2005), engagement (Kuh, 2001),
satisfaction (Chickering & Gamson, 1987), and learning outcomes (Campbell & Nutt,
2007, 2008, 2010). Crockett (1978) considered academic advising the cornerstone of
student retention. Tinto (2004) noted, “…effective advising is an essential part of
9
successful retention programs…” (p. 8). The 2005 NSSE found that academic advising
was the most important factor in determining student satisfaction with their college
experience (Seidman, 2005).
Concerning student success, Kuh (1997) stated, “It is hard to imagine any
academic support function that is more important to student success and institutional
productivity than advising” (p. 11). Academic advising, in its own way, is not only at a
structural nexus, but an ideological and relational intersection of student and advisor
experience: “Academic advising synthesizes and contextualizes students’ educational
experiences within the frameworks of their aspirations, abilities and lives to extend
learning beyond campus boundaries and timeframes” (NACADA, 2006). Owing to this
general understanding of its potential, further research has explored productive structures
or models for academic advising.
Advising Models
Habley (1983, 1987, 1997) organized seven separate organizational advising
models. These include Faculty Only and Supplementary (each student is assigned a
faculty advisor with an ancillary advising office as a resource with advisor’s approval),
Split (faculty advisors and professional advisors are available for students who have not
declared a major), Dual (every student has two advisors—faculty and professional), Total
Intake (initial advising is handled by professional advisors until certain requirements are
met, at which time students are assigned to a faculty advisor), Satellite (each school or
department functions within its own choice of structure), and Self-Contained (all students
are advised by a centralized advising staff from entrance to departure). Virtually all
institutions utilize one or more of these advising structures.
10
For the sake of the present study, academic advising will be synonymous with
faculty advisors. This is largely motivated by faculty’s traditional role as advisor. Habley
(1997) notes, “the two models where all advising is conducted by faculty (Faculty Only
and Supplementary) account for the vast majority of structures utilized in…72% of the 4-
year colleges using one of those two systems” (p. 40). There is also a larger body of
research into faculty advising than into other advising organizational models (Frost,
1991), and it is easier to measure in conjunction with student engagement, faculty-student
interaction, and the NSSE than other advising models.
Advising Theories
Crookston (1972) wrote a foundational work on what he called a developmental
view of academic advising in which advising was part and parcel of the professorial
teaching process. This included the belief that:
[The advisor and student] differentially engage in a series of developmental tasks,
the successful completion of which results in varying degrees of learning by both
parties. These developmental tasks include reaching an agreement on who takes
the initiative, who takes responsibility, who supplies knowledge and skill, and
how they are obtained and applied. (Crookston, 1972, p. 6)
Crookston’s conclusions on student preference for developmental advising have been
supported by many (Carstensen & Silerhorn, 1979; Dassance & Batdorf, 1980; Ender,
Winston, Jr., & Miller, 1982; Frost, 1990; Shane, 1981; Winston & Sandor, 1984;
Winston, Jr., 1994).
O’Banion (1972) established a foundational and logical order for topics to be
discussed in the advising context while maintaining a whole-person paradigm. Others
11
have followed with their own attempts to improve advising models and the academic
advising experience for all parties involved. For example, Yarbrough (2002) suggested an
engagement model that allows the advisor and advisee to have a greater return on their
investment in the relationship. He suggested the perspective of a meaningful rite of
passage with the advisor rather than a set of obstructions to overcome. Pizzolato (2008)
also used Baxter-Magolda’s Learning Partnerships Model in the context of academic
advising.
Advising Methods
There is a great deal of responsibility and high expectations associated with
academic advising (Biggs, Brodie, & Barnhart, 1975). Many studies have been conducted
to help further define what advisors should know, be aware of, and strive for. Crockett
(1978) noted that dynamic advisors are characterized by frequent, high-quality contact
with their advisees throughout the semester and do not limit that interaction to their office
or a narrow set of topics. This additional time is important because academic advisors
should be familiar with each student’s needs and expectations (Barefoot, et al., 2010;
Fielstein, 1989; Museus & Ravello, 2010; Stebleton, 2011; Wiseman & Messitt, 2010).
Advisors often struggle to spend the necessary amount of time with their advisees
for many reasons, including the fact that they are noticeably outnumbered. To foster
consistent contact with students, especially those who would not normally seek
assistance, Glennen and Baxley (1985) proposed the idea of intrusive advising, a set of
planned interventions for advisors to deliberately create points of contact with students
throughout the semester. Others have investigated ways and areas in which intrusive
advising may be particularly helpful with students who are new (Garing, 1993), at-risk
12
(Heisserer & Parrette, 2002), under-prepared (Fowler, 2007, 2010), or on probation
(Austin, Cherney, Crowner, & Hill, 1997).
Advisor attitude (Broadridge, 1996), accessibility (Barnes, Williams, & Archer,
2010), experience (Ford & Ford, 1989, 1993), personality (Zhao, Golde, & McCormick,
2007), worldview (Coll & Draves, 2009), and advising style (Hale, Graham, & Johnson,
2009) all affect student-advisor interactions and relationship. How advisors think about
and pursue their roles as advisors impacts the quality of advisor-advisee relationships, too
(Frost, 1991). Other research has shown that other methods mesh nicely within an
academic advising context.
Paul, Smith, and Dochney (2012) studied the connection between servant
leadership and academic advising. They found that wisdom was the greatest predictor of
whether developmental advising behaviors would be implemented within the
relationship. Yarbrough (2010) suggested that mentorship may be a helpful way to view
the advising relationship when trying to make a difference in students’ lives. Shaffer and
Zalewski (2011) noted that advisors would do well to not only incorporate academic and
career advising, but also utilize a human capital approach. This means that advisors
should keep in mind the dynamic and fluid nature of the job market. Students’ should be
educated in the importance of investing in themselves as professionals, knowing that
most people will change jobs and even careers multiple times during their lifetime.
Similarly, Shockley-Zalabak (2012) was a proponent of interaction design,
creating deliberate interactions with students that “help them grow, understand their
options, and get them motivated to persist” (p. 14). Cooperrider and Whitney (1999)
proposed that advisors utilize appreciative inquiry within an advising context. In this
13
method, advisors guide students into formulating some of their own solutions to their
current issues through positively-phrased questions (Bloom & Martin, 2002; Cooperrider,
Whitney, & Stavros, 2008; Hutson, 2010). Naturally, the higher the quality of the
interaction with an advisor, the greater the student satisfaction.
Advisor-Student Perspectives
Many studies have focused on academic advising from the advisor’s perspective.
Most academic advisors acknowledge that advising is a vital component of the
undergraduate experience (Johnson-Garcia, 2010), and most report high satisfaction with
their position (Biggs, Brodie, & Barnhart, 1975; Donnelly, 2009). Yet it is difficult for
even for the most well-intentioned advisor to consistently operate at a high level due to
the time and effort required that is inconvenient and, at times, even unreasonable (Allen
& Smith, 2008; Carstensen & Silerhorn, 1979; Fant, 2010). Also contributing to advisor
burnout, few institutions provide meaningful emphasis on advisor training and
evaluation, or rewards for high-performing advisors (Artman & Gore, 1992; Crookston,
1972, 1994, 2009; Kuh & Kinzie, 2005; Ramos, 1993).
Another set of struggles that many faculty advisors report are situations in which
students themselves are responsible for a poor academic advising experience. Students
can make their situation more difficult by not being proactive (Grites, 1984; Pizzolato,
2008; Varney, 2007). It is not unusual for students to underutilize or even avoid their
advisor, only to discover a conflict in their schedule or have some other problem
(Alextich, 2002). These students either tend to sheepishly admit their mistake and ask
their advisor to fix the problem, or turn the advisor into an object of blame and contempt
(Henning, 2009; Hunter & White, 2004). Students may even avoid meeting with advisors
14
as an excuse for poor academic performance (Covington, 2000) or leaving college
(Seidman, 2005).
Research concerning the advisor-student relationship has also taken the student
perspective into account (e.g., Broadbridge, 1996; Light, 2001). Students often
experience difficulty in various aspects of their relationships with their advisors (Grites,
1984). Crookston (1972, 1994, 2009) found that the relationship itself was the most
critical component of the interaction between advisor and student. This was supported by
others, including Light (2001), whose extensive interviews with students found it very
common for them to view their academic advisors as mentors and role models. This
relationship, then, is a double-edged sword: the quality and satisfaction of the advisor-
student relationship, and their satisfaction with it, often affects their entire college
experience for better or worse (Bai & Pan, 2010; Bailey, Bauman, & Lata, 1998;
Dreisbach, 1990; King, 1993b; Seidman, 2005; Zelazek, 2011).
This relationship is usually based on a student’s major or department, can be
treated as an information transmission relationship, and can feel artificial or stilted
(Carstensen & Silerhorn, 1979; Crookston, 1972, 1994, 2009). Crookston (2009)
captured a poor, but all too common, situation:
The student also reacts to the confusion between what the advising concept
purports to be and what it really is. Presumably an advisor is a person whose
“advice” may be accepted or rejected at the option of the student. In reality, this
option does not, in many instances, exist. The student often must go to the advisor
to get his sanction or approval. Hence, from the student’s view, the advisor
controls the relationship as well as any resulting decisions, in spite of the
15
advisor’s conscientious efforts to advise and to place the responsibility for
decisions on the student. This ambiguity must be clarified early in the
development of a relationship between the advisor and student. In fact, the
developmental advisor makes the establishment of the relationship the first order
of business with the student. (p. 82)
Many advisors do not listen well or treat the student’s needs as most important
(Crookston, 1972). The situation is only exacerbated when students feel or legitimately
discover that their advisor is guilty of a logistical oversight (Grites, 1984). What may
make the student-advisor relationship most complicated, however, is the chemistry of the
relationship, which consists of the blending of unique personalities, expectations,
strengths, weaknesses, and perceptions. This chemistry may influence the success or
failure in the advising relationship (Allen & Smith, 2008; Grites, 1984; Light, 2001).
Successful academic advising, then, appears to be grounded in more than tactics
and values, but a mutual striving, centered on each individual student-advisor relationship
(Gordon, 1994). Fielstein (1989) found that students prefer a combination of personal
developmental advising activities and instructive prescriptive advising activities. Further
research is needed for each institution to be able understand who their students are and
organize how to address their needs.
Factors Concerning Engagement and Advising
A variety of studies have considered subsets of undergraduate students and how
their particular demographic features have impacted their engagement and, specifically,
their academic advising experience. Gonyea and Kuh (2006) explored the impact of
religious affiliation of an institution and its students’ engagement, finding that faith-based
16
institutions are most likely to foster learning, engagement, and development. Harper and
Quaye (2009) studied diverse populations, Pike and Kuh (2005) compared the
engagement and intellectual development of first-generation and second-generation
undergraduates, Umbach, Palmer, Kuh, and Hannah (2006) studied intercollegiate
athletes, and Zhao, Carini, and Kuh (2005) studied student engagement among male and
female science, mathematics, engineering, and technology majors. Although the NSSE
2003 annual results have, for over a decade, provided broad and insightful data
concerning student engagement that is applicable to academic advising, limited research
focuses on factors related to students’ academic advising experience.
Metzner (1989) investigated student and faculty perceptions of students’ first-year
experiences with academic advising and how it affected their retention. She found that
high-quality advising lessened student attrition and that even low-quality advising had
more positive results than when students received no advising at all. Unfortunately,
Jones’ (1998) study of new students, found that 49% of respondents never met with their
new faculty advisor. Of those who did, 60% indicated positive or neutral feelings when
asked whether the faculty advising experience had had a positive effect on them.
Abghari (2007) studied African-American, male business students at a historically
black institution and found that they were strongly dissatisfied with academic advising.
Incidentally, Museus and Ravello (2010) examined the role minority students’ academic
advisors played in facilitating their students’ success at predominantly white institutions.
They found that advisors who were proactive, who “humanized” the process, and who
did so within a multidimensional approach were most successful. These studies are
valuable and helpful in adding depth and clarity to the understanding of what various
17
student experiences are and how institutions can seek to meet their students’ needs. There
is, however, not only a gap in the literature, but also a need for further clarity in
understanding what affect academic preparedness, gender, ethnicity, class, and academic
discipline have on students’ academic advising experience.
Summary
Effective academic advising is valuable for both students and their institutions
(NACADA, 2006; Wiseman & Messitt, 2010). Many have sought to improve academic
advising structures and methods (e.g., Campbell & Nutt 2008, 2010; Crockett, 1978;
Crookston, 1972, 1994, 2009; Glennen, 1985; Grites, 1984; Habley, 1983, 1988, 1997;
Habley & Morales, 1998; O’Banion, 1978), but there is still room for improvement
(Gordon, Habley, & Grites, 2008; Habley, 1986, 2000; Johnson-Garcia, 2010; Jones
1998). Quality academic advising incorporates positive practices that facilitate student
learning and, in turn, retention, student success, and satisfaction (Astin, 1993; Campbell
& Nutt, 2008, 2010; Hunter & White, 2004; Tinto, 1993, 2004, 2005). However,
academic advising is a complex component of the higher education learning environment.
It is a convergence of institutional priorities and resources. Both advisors and advisees
also offer a range of engagement, expertise, and expectations (NACADA, 2006).
Institutions need to continue to place an emphasis on quality advising and must
seek to understand what impacts their students’ academic advising experiences on an
individual institutional basis. Kuh (2003) exhorted researchers to “probe more deeply into
the nature of the student experience at a particular institution, and not assume that all
colleges of a certain type and size are comparable” (p. 26). Answering his call to
research, students’ academic advising experiences were foundational to the present study.
18
Hypotheses
Based upon the available literature, students’ academic discipline, sex, and class
should not make a significant difference in their interaction with academic advisors;
advisors should be helpful and considerate of all students, university-wide. Generally,
however, students who are more academically prepared are more successful and satisfied
with their college experience. Minority students, on the other hand, tend to struggle for a
variety of reasons at institutions that accept largely White students. Thus, the hypotheses
for the current study were as follows:
Hypothesis 1. Students’ school, sex, and class will not impact advising quality
ratings.
Hypothesis 2. Academic preparedness will have a positive impact on the
academic advising experiences.
Hypothesis 3. Ethnicity will negatively impact students’ academic advising
experiences.
19
Chapter 3
Methods
Instrument
There is limited research concerning factors relating to students’ academic
advising experiences. Further understanding is needed as to whether students’ academic
preparedness, school, gender, class, and ethnicity impact their academic advising
experiences. The present quantitative study utilized secondary data from The National
Survey of Student Engagement, 2012 Pilot Study (NSSE 2.0) to address the gap in the
literature.
The original NSSE survey has been utilized by higher education professionals and
organizations since 2000 to assess the extent to which undergraduate students engage in
positive learning and developmental practices (Annual Results, 2011). NSSE annually
calculates participating institutions’ scores on five effective educational practices so that
colleges and universities can better understand and regularly monitor their performances.
These benchmarks are (a) academic challenge, (b) active and collaborative learning, (c)
student-faculty interaction, (d) enriching educational experiences, and (e) supportive
campus environment. Almost all post-secondary institutions in the U.S. and Canada have
participated (95%) in a NSSE survey at some point (Annual Report, 2011). Throughout
the years, survey reliability has been high (Cronbach’s α = .91).
20
The NSSE provides data on many important aspects of academic advising and its
relationship to student engagement on a national level (Kuh, 2003, 2001-2011). This
information is aggregated annually and provides significant insight on a macro level into
ways that colleges and universities can pursue greater success, including focusing on
student-faculty interaction. While NSSE data is useful at all levels, “too often, NSSE
results are delivered in too large a dose” (Annual Results, 2011, p. 10). Kuh (2001) made
the point that “the greatest impact and utility of NSSE data will come when they are
integrated with other institutional data about the student experience” (p. 15). The data can
also offer institution-specific information that should be taken into account, which the
current study also hoped to offer.
The new pilot NSSE 2.0 was administered in the early spring semester of 2012 to
50 different institutions, consisting of 126 questions which measured a wide variety of
student’s experiences and personal perceptions of their institutions. Additionally, schools
involved in the NSSE 2.0 pilot study were offered a choice of any two out of five
additional modules to draw out more data on specific undergraduate experiences. These
modules were (a) academic advising, (b) student engagement with diverse perspectives,
(c) development of transferable skills, (d) civic engagement, and (e) technology. The
institution in the present study chose to focus on students’ Development of Transferable
Skills and Academic Advising.
Procedures
Data for the quantitative study was retrieved from an existing data set. Five
invitations were sent to all first-year and senior students via email by the Office of
Assessment and Quality Improvement during February, 2012. Students voluntarily
21
completed a web-based version of the NSSE 2.0 pilot study. Permission was secured to
access 2012 NSSE 2.0 data files through a NSSE-University agreement.
Dependent Variable: Academic Advising Experience
The NSSE Pilot Study 2.0 Academic Advising Module (AAM) included 12
additional questions designed to explore students’ academic advising experience
(Appendix A). From a brief look at the AAM, it was apparent that the first question was
related strictly to the students’ satisfaction (“Overall, how would you rate your academic
advising experience at your institution?”) and the remaining questions sought to address
the quantity and quality of their advisors’ actions (e.g., “During the current school year,
to what extent has your academic advisor(s) helped you understand your school’s
academic rules and policies?”). Students were asked to rank how strongly or frequently
their experiences were consistent with the question on a four point Likert scale (Very
little, Some, Quite a bit, Very much).
Of the 315 participants, 62 skipped answering either some (at least 7) or all 12 of
the AAM questions. For intermittent questions marked as “Not Applicable” or left
blank/unanswered, the standard mean was inserted. This left 264 respondents who
answered most or all of the module questions and comprised the sample from which the
corresponding data and results were drawn (See Appendix B). The new composite
variable was chosen to serve as the dependent variable: academic advising experience
(ADVEXP). An inter-item correlation and factor analysis was performed on the
ADVEXP and Chronbach’s Alpha was .931, indicating very high reliability. Inter-item
correlations ranged from .472 to .616, indicating high correlation (see Appendix C).
22
Independent Variables
School. In order to classify each student into a School, respondents’ specific
majors were manually reassigned according to the institution’s online catalog. Three
students in the sample did not have a major recorded in institutional data at the time of
the survey. Their major was determined via institutional identification number during the
Fall of 2012 (1 respondent was enrolled in Natural and Applied Sciences, and 2 in the
School of Liberal Arts). Five students were “Undecided” at the time of the survey. Since
then, one has chosen a business major and the remaining four were still in the School of
Liberal Arts as of this study. In summary, of the 264 respondents, 56.8% (n = 150) were
in the School of Liberal Arts, 11% (n = 29) were in the School of Natural and Applied
Sciences, 11.7% (n = 31) were in the School of Business, and 20.5% (n = 54) were in the
School of Professional Studies.
Academic preparedness. For the purpose of the study, academic preparedness
was defined as the level of academic accomplishment according to the students’ college
entrance exam. Institutional data was utilized to find respondents’ SAT scores (n = 156).
Reading and math portions of respondents’ SAT scores were combined into one compute
variable, namely composite SAT (“COMPSAT”). The minimum score submitted was 570
(out of 1600), the maximum was 1600, and the mean was 1190. Institutionally recorded
composite ACT scores (“actt”) were also used (n = 185) in the quantifying of academic
preparedness. The minimum ACT score submitted was 16 (out of 36), the maximum was
35, and the mean was 26.42. Seven students did not have ACT or SAT scores submitted.
The composite ACT and SAT scores were then relabeled into quartiles. COMPSAT was
recoded (0 thru 1089=1; 1090 thru 1209=2; 1210 thru 1309=3; 1310 thru 1600=4) into
23
“SATQ” variable. Composite ACT scores (labeled as “act” in data set) were recoded as 0
thru 23=1; 24 thru 26=2; 27 thru 28=3; 29 thru 99=4 into “actt” variable. These quartiles
were labeled as follows: 1=Very Low, 2=Low, 3=Medium, and 4=High (see Appendix
D). These two variables were combined into one compute variable (“ACPREP”), which
served as the academic preparedness independent variable. For students who submitted
both SAT and ACT scores, the greater of the two quartiles was used (see Appendix E).
Gender. Institutional data indicated that of the 264 respondents, 32.6% were
male (n = 86) and 67.4% (n = 178) were female.
Class. The class of the students fell into two groups, first-year students (FY), and
seniors (SR). FY and SR students were the only respondents invited to take the survey
and the designation of respondent class status was based upon institutionally reported
data, ensuring accuracy. Of the 264 respondents, 46.2% (n = 122) were FY students and
53.8% (n = 142) were SR students.
Ethnicity. Respondents’ ethnicity was determined utilizing institutional data.
The ethnicity of respondents was as follows: 1.1% (n = 3) African American/Black, 86%
(n = 227) Caucasian/White, 2.3% (n = 6) Hispanic, 6.8% (n = 18) “Foreign,” and 3.7% (n
= 10) “Unknown.” Because of the vast majority of Caucasian/White respondents in this
sample (and at this institution in general), respondents were grouped into “Majority,”
meaning Caucasian/White, and “Minority,” including all other respondents. Thus, 86.7%
(n = 227) were Majority respondents and 13.3% (n = 35) Minority respondents.
Participants Summary
Participants in the study included 32.6% male (M, n = 86) and 67.4% female (F, n
= 178) First-Year (FR) and Senior (SR) undergraduate students, ages 17-32 (M = 20),
24
from a small, private, liberal arts institution in the Midwest. Students at the institution
were relatively similar in ethnicity, the majority being White/Caucasian. FY students
were determined according to cumulative credit hours earned after completing a high
school degree or equivalent. Seniors were those considered probable graduates for spring
or summer 2012. For the institution, seniors were within 12-24 hours or 6-8 courses of
graduation (based on semesters) at the start of spring semester. Fall 2012 graduating
seniors were not included in the file. Student anonymity was maintained through the use
of institutional ID numbers (Hayek & Kuh, 2004).
Analyses
Independent t-tests were chosen to compare the mean scores of the institutionally
reported gender (Male/Female), ethnicity (Majority/Minority), and class (FY/SR) of the
participants. Two separate one-way between-subjects ANOVAs were conducted to
compare the effect of school and academic preparedness on students’ academic advising
experiences.
Summary
The study was designed to quantify relationship(s), if any, between five factors
(Academic Preparedness, Gender, Ethnicity, Class, and School) and students’ academic
advising experiences as measured through the pilot NSSE 2.0 survey. Analysis of the
data was used to further understand students’ experiences and implement policies
targeting student populations experiencing lower academic advisor satisfaction. Through
the study, the institution gleaned quantifiable evidence of students whom their advisors
were serving well and those who may require more attention.
25
Chapter 4
Results
The present study conducted independent samples t-tests and One-Way Analyses
of Variance (ANOVAs) of NSSE 2.0 Pilot student data to gain a better understanding of
whether or not students’ Academic Preparedness, School, Gender, Class, or Ethnicity
were correlated with their Academic Advising Experience (AAE) at a small, private,
liberal arts university in the Midwest. More specifically, independent T-tests were used to
calculate Gender, Ethnicity, and Class variables. A One-Way ANOVA was used to
analyze and predict the impact of School and Academic Preparedness on students’
academic advising experiences. Statistical significance was determined at p < .05. Results
do not claim to be causal, but they do draw attention to whether any of the factors
provided a noticeable difference in students’ experiences at the institution.
Ethnicity
An Independent Samples t-test was utilized to calculate whether ethnicity
(Majority, White; Minority, all other ethnicities represented in the sample) had any
relationship to students’ AAE. Findings showed that Ethnicity had a statistically
significant difference (t(262) = 3.09, p = .002) between means of Majority (N = 229, M =
33.28, SD = 7.588) and Minority (N = 35, M = 37.49, SD = 7.00) students’ academic
advising experiences. Further statistical analysis found Cohen’s d to be -0.577. This
indicated a small effect-size or “practical strength” of the above conclusions (Creswell,
26
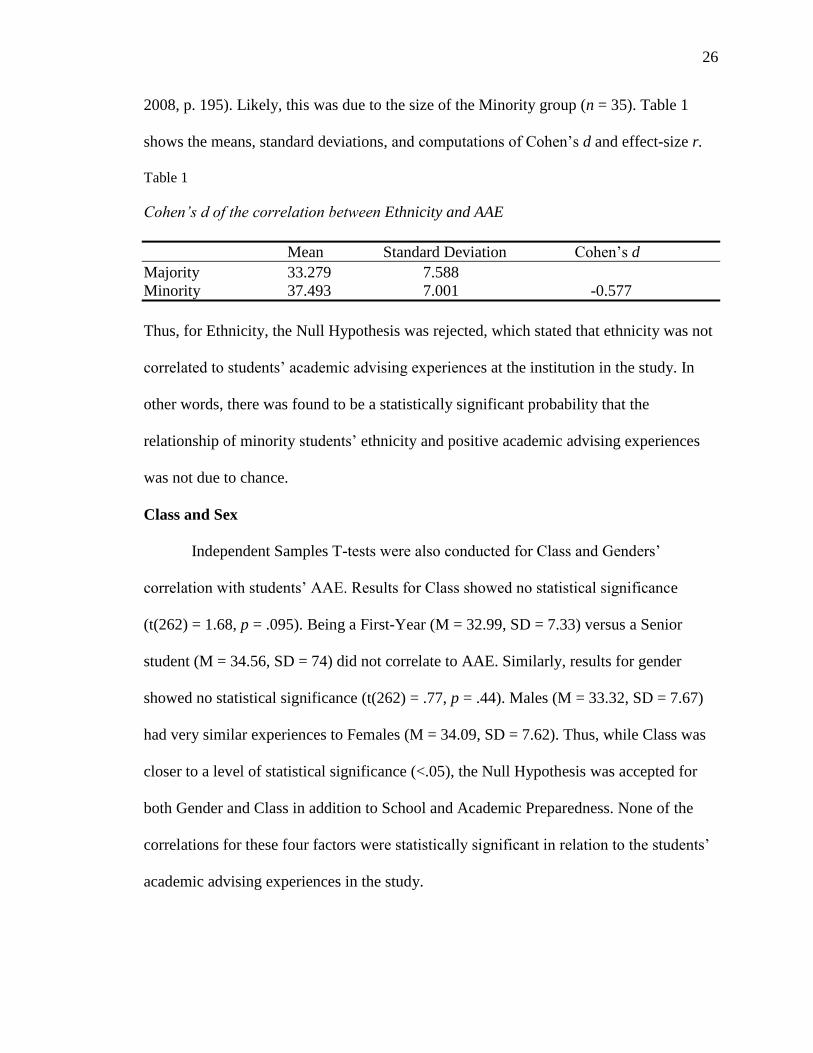
2008, p. 195). Likely, this was due to the size of the Minority group (n = 35). Table 1
shows the means, standard deviations, and computations of Cohen’s d and effect-size r.
Table 1
Cohen’s d of the correlation between Ethnicity and AAE
Mean Standard Deviation Cohen’s d
Majority 33.279 7.588
Minority 37.493 7.001 -0.577
Thus, for Ethnicity, the Null Hypothesis was rejected, which stated that ethnicity was not
correlated to students’ academic advising experiences at the institution in the study. In
other words, there was found to be a statistically significant probability that the
relationship of minority students’ ethnicity and positive academic advising experiences
was not due to chance.
Class and Sex
Independent Samples T-tests were also conducted for Class and Genders’
correlation with students’ AAE. Results for Class showed no statistical significance
(t(262) = 1.68, p = .095). Being a First-Year (M = 32.99, SD = 7.33) versus a Senior
student (M = 34.56, SD = 74) did not correlate to AAE. Similarly, results for gender
showed no statistical significance (t(262) = .77, p = .44). Males (M = 33.32, SD = 7.67)
had very similar experiences to Females (M = 34.09, SD = 7.62). Thus, while Class was
closer to a level of statistical significance (<.05), the Null Hypothesis was accepted for
both Gender and Class in addition to School and Academic Preparedness. None of the
correlations for these four factors were statistically significant in relation to the students’
academic advising experiences in the study.
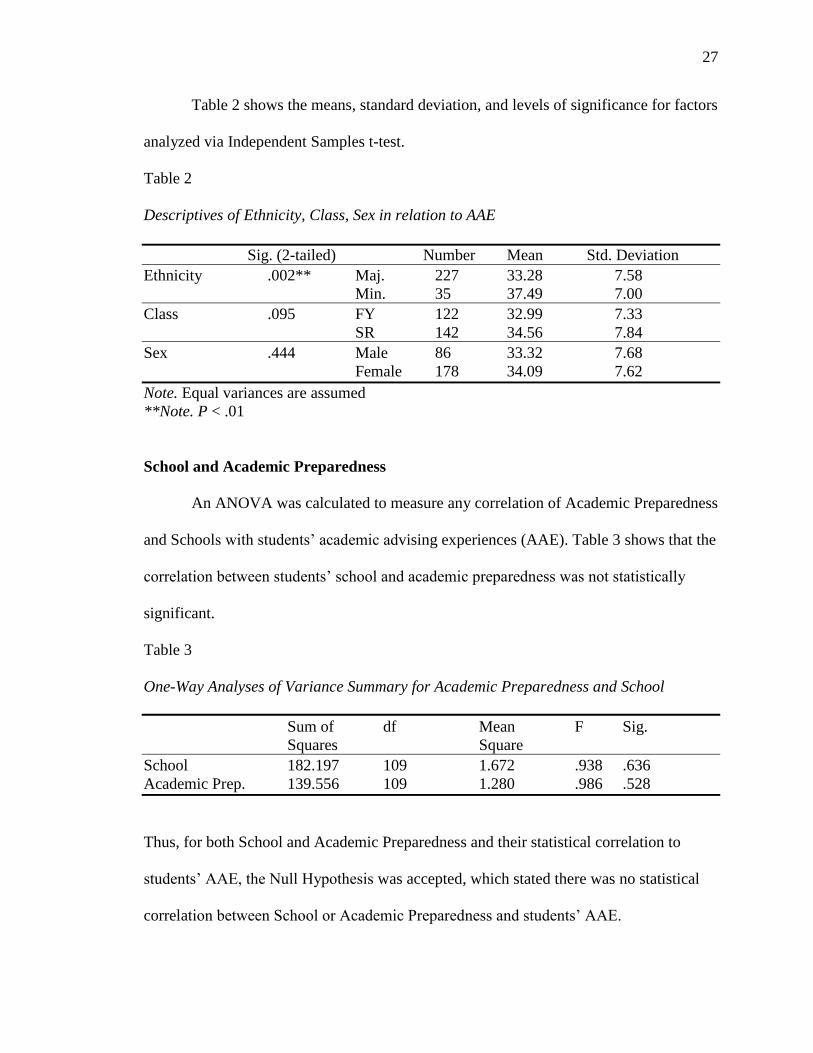
27
Table 2 shows the means, standard deviation, and levels of significance for factors
analyzed via Independent Samples t-test.
Table 2
Descriptives of Ethnicity, Class, Sex in relation to AAE
Sig. (2-tailed) Number Mean Std. Deviation
Ethnicity .002** Maj. 227 33.28 7.58
Min. 35 37.49 7.00
Class .095 FY 122 32.99 7.33
SR 142 34.56 7.84
Sex .444 Male 86 33.32 7.68
Female 178 34.09 7.62
Note. Equal variances are assumed
**Note. P < .01
School and Academic Preparedness
An ANOVA was calculated to measure any correlation of Academic Preparedness
and Schools with students’ academic advising experiences (AAE). Table 3 shows that the
correlation between students’ school and academic preparedness was not statistically
significant.
Table 3
One-Way Analyses of Variance Summary for Academic Preparedness and School
Sum of df Mean F Sig.
Squares Square
School 182.197 109 1.672 .938 .636
Academic Prep. 139.556 109 1.280 .986 .528
Thus, for both School and Academic Preparedness and their statistical correlation to
students’ AAE, the Null Hypothesis was accepted, which stated there was no statistical
correlation between School or Academic Preparedness and students’ AAE.
28
Summary
Results show Academic Preparedness, Gender, Class, and School did not have
statistically significant correlations to the sample of students’ Academic Advising
Experience. It appeared that students at all levels of academic preparedness, Males and
Females, First-Year students and Seniors, throughout all four Schools, had similarly
positive academic advising experiences at the studied institution. Ethnicity was found to
provide statistically significant results. The data supported the statement that Minority
students at the institution had better Academic Advising Experiences than Majority
students.
29
Chapter 5
Discussion
The current study utilized Independent Samples T-tests and Analyses of
Variances to investigate the correlations between students’ academic preparedness,
school, gender, class, and ethnicity and their academic advising experiences at a small,
private, liberal arts university in the Midwest. Results indicated four of the five factors
mentioned above did not significantly impact students’ AAE positively or negatively.
The exception was Ethnicity, which produced a very strong statistical correlation (p =
.002). The following dialogue includes discussion on how and why minority students
received better advising, limitations of the study, and ideas for future research. The intent
of the study was to provide broader applicability, to add to the academic advising
literature, and to draw attention to ways in which students can have an excellent AAE.
Ethnicity
Given the university’s homogeneity and sample size, it was interesting that
minority students rated their academic advising experiences higher than the majority. The
low level of racial diversity at the institution was difficult to overlook: about 91% to 9%,
Caucasian/White to Other ethnicities. So, why did students’ ethnicity correlate strongly
with their AAE? There could be at least a few reasons for this results.
Included in the minority populations were international students. These students
may have been compelled by any number of cultural forces to rate their advisors highly
30
(i.e., cultural respect for elders). Also, results may indicate a greater level of proactivity
on the part of minority students to seek out their advisors, whether motivated by
insecurities or a sense of duty. Regardless, consistent with the literature (Museus &
Ravello, 2010), proactive interaction with advisors may also lead to a greater level of
appreciation and thankfulness on the part of minority students for the efforts made by
faculty and personnel, hence a greater level of satisfaction.
Additionally, international minority students at the institution were required to
participate in an extended orientation before entering their first year, often creating strong
bonds with other international students and their facilitators, directors, and advisors.
Students may also be assigned an additional counselor from the English Language
Studies program to help with their English competency. The international students could
have asked probing questions and sought to facilitate their academic and personal success
in addition to their academic advisor and professors.
It would stand to reason that the more personal support students receive, the more
highly they will rate their overall advising experience. This being the case and consistent
with the literature (Abghari, 2007; Astin, 1993; Tinto, 1975), colleges and universities
should consider how they can increase students’ interaction with their assigned academic
advisors as well as other personnel who have a vested interest in students’ academic
achievement. This is the main lesson from the study: multiple touch-points of
collaboration among academic allies should facilitate student success and increase
student satisfaction with their AAE.
31
Instrument
The second strength of the study came from the creation of the dependent
variable: the students’ AAE. This was especially valuable for the study because of the
singular weight placed upon the dependent variable. With this in mind, factor analyses
and inter-item correlations were conducted as part of the study on the AAM itself to gain
a deeper understanding of the instrument and thus the dependent variable. The results
were pleasantly surprising. Consistent with NSSE’s past record, Chronbach’s Alpha was
calculated for the 11-question academic advising experience variable. It was .931 (see
Appendix C). Inter-item correlations ranged from .472 to .616 indicating unusually high
reliability and correlation. So, using the NSSE 2.0 Pilot study’s AAM proved to be a
strength of the study. In the future, institutions may utilize the Academic Advising
Module with confidence of its internal validity. Similarly, there were a number of
positive talking points that could be taken away from the four remaining independent
variables in the study.
Academic Preparedness
While students’ academic preparedness did not correlate strongly with their
academic advising experiences in this study (p = .528), combining test scores to create
the variable highlighted the high academic caliber of the institutions’ students. The
students in the sample placed in the “Very Low” and “Low” test score quartiles had ACT
test scores of 0-23 and 24-26, respectively, and SAT scores of 0-1089 and 1090-1209,
respectively. The national average students’ combined math and reading SAT scores is
currently 1010 (Princeton Review). For the ACT, average scores ranged from 20 to 21
(College Board). In other words, students considered to be less academically prepared
32
within the context of the study were actually over 5 points higher in the ACT and 80-199
points higher on the SAT than the national average.
School
The decision to divide the respondents into four schools was based solely upon
the structure of the institution in the study. This distinction made the decision simple and
pragmatic, but also produced an unevenly distributed sample. The School of Liberal Arts
had 123 respondents, making up almost half the sample. Professional Studies contained
80 of the 264 respondents and the schools of Natural and Applied Sciences and Business
had 30 and 31 respondents, respectively. It was hard to determine if this had any effect on
the results of the study, but given the sample sizes, other institutions should be able to
expect similar results; students were having positive experiences in their academic
advising regardless of the school in which they studied. This conclusion seemed to prove
true from the beginning to the end of the college experience.
Class
Comparisons of first-year versus senior students indicated a greater likelihood that
a correlation could be made than other variables (p value = .095), but were not
statistically significant. Nothing conclusive can be stated about these results, but the
institution in the study, along with all institutions, should consider how to carefully cater
their advising structure, staff, and communication to different classes of students. It
should not be assumed that any class needs more or less consideration. Rather, first-year
students may need different forms of encouragement and guidance than graduating
seniors, regardless of gender.
33
Gender
Results from the study showed very low probability that students’ gender
impacted their academic advising experiences at the institution. This was consistent with
a cross-tabulation of gender and academic advising satisfaction. This was a positive
reality. Two out of three respondents were female, but the majority of both males and
females reported positive AAEs. Nonetheless, considering most faculty members at the
institution are male, it was encouraging to see that the majority of both males and females
felt positively about their AAE.
For the university in the study, analyses indicated students were generally
receiving a high level of quality academic advising institution-wide. Evidence of this
claim was found in first question of the AAM (dropped from the compute dependent
variable), which asked students to rank their satisfaction with their academic advising
experience. Most (81.5%) indicated their experience was “good” or “excellent,” while the
rest (18.5%) indicated room for improvement. In other words, 4 out of 5 students at the
institution felt they had a positive academic advising experience. While appropriate
attention should be paid to the smaller group who have lower satisfaction with their
academic advising, so also should proper acknowledgment be offered for a largely
satisfied student constituency at the institution. Given the applicability of the study, its
hypotheses and limitations should be properly considered.
Hypotheses
Results from the study were not exactly as hypothesized. Consistent with the
available literature, students’ academic discipline, sex, and class did not make a
significant difference in students’ academic advising experiences. Contrary to
34
expectation, students who were more academically prepared were not more successful or
satisfied with their academic advising experiences. Most surprising, minority students
tended to have notably better academic advising experiences than their majority, White
peers.
Limitations
An implicit limitation of the study was the use of self-reporting surveys. Kuh
(2001) willingly noted that the NSSE “relies entirely on students’ testimony” (p. 13),
which poses a problem for some who infer biased responses by students. In its defense,
however, Kuh also countered,
The survey questions are clearly worded and refer to recent activities with which
student have first-hand experience. The questions don’t intrude into private
matters nor do they prompt socially desirable responses. Psychometric analyses
produce acceptable levels of reliability and demonstrate reasonable response
distributions for most items. (Kuh, 2001, p. 13)
Additionally, the survey for FY students was taken during their first semester on the
campus, and there was no account taken for their limited experience and exposure to their
academic advisor or their college experience as a whole.
A main limitation of the study was its scope. While the study was purposeful in
seeking institution-specific information for the betterment of that university, there was
limited value for other schools, even those of similarity. The institution in the study was a
private university in the Midwest with a student body of approximately 1900
undergraduate students. The sample size may be considered a limitation. While 264
respondents were plenty to run statistical analyses, a larger sample could have proved
35
useful. Even more valuable would have been a larger sample of minority students (n =
35). Still, 9% of the student body was minority students and 13% of the 264 respondents
were minority students, so the distributions of the institution were fairly well represented
in the study.
Another limitation of the applicability of the study was this institutions’ advising
structure. Given the variety of models represented nationally and internationally, it was
worth noting the institution in the present study utilized a Split model of academic
advising (Habley, 1997). There was an advising office that advised a specific group(s) of
students (e.g., those that were undecided about a major, underprepared, probationary). All
other students were assigned to academic units or faculty for advising. While many of the
same issues may be present regardless of the model, the degree to which the study could
be helpful to those at institutions using different advising models was unknown.
Lastly, having a correlational design, the study implicitly lacked any causal or
predictive conclusions. Statistical analysis (Cohen’s d of -0.577 and a Pearson r effect-
size of -0.27) indicated a small effect-size of practical strength of the results of the study.
Thus, the study should be accepted as valid yet incremental in its value to the literature
and carefully applied to other universities appropriately.
Future Research
Similar studies could be performed at other institutions to see if the findings of the
present study were consistent with their research. If enough institutions did such a study,
data could be aggregated and broader conclusions drawn concerning whether there were
trends based upon institutional type.
36
Individual institutions, including the one in the study, would likely benefit from
additional studies evaluating individual majors. Institutions may also benefit from
studying the quality of individual advisors through various research methods. If not
already in place, qualitative data could be gathered or evaluation forms utilized to
discover whether or not individual academic advisors are offering quality advising to
their advisees. This may prove worthwhile in assessing which advisors are doing well and
who may need further motivation in providing beneficial advising help to students.
Given the strong statistical difference between Minority and Majority students,
the institution in the study could do an assessment/evaluation of the process minority
students go through during their academic advising experiences and seek to model the
rest of the students’ care after it. Similarly, institutions could hone in on the group of
students who indicate they had a “poor” or “very poor” academic advising experience
and consider doing qualitative studies to discover themes of dissatisfaction with their
individual advisors or AAE.
Conclusion
Academic advising is an important component of the academic experience.
Although, every student has a unique experience, every student deserves a positive
advising experience. Administrators should note the high validity and reliability of the
NSSE 2.0 Academic Advising Module and feel confident in using it in the future to
gauge their students’ academic advising experiences.
The findings in the present study highlighted that minority students at the
institution were having a better academic advising experience. Since structures that are in
place for minority students were doing an outstanding job, administrators should consider

37
how they could assimilate a multiple touch-point strategy for all students. Whether
through institutional changes in structure, resources, or training, universities should
reaffirm and demonstrate that students’ academic success is everyone’s responsibility.
38
References
Abghari, S. (2007). African-American male business students’ perspective of academic
advising: A retention and success strategy. Journal of College Teaching & Learning,
4(11), 73-78.
Allen, J. M., & Smith, C. L. (2008). Importance of, responsibility for, and satisfaction with
academic advising: A faculty perspective. Journal of College Student Development,
49, 397-411.
Alexitch, L. R. (2002). The role of help-seeking attitudes and tendencies in students’
preferences for academic advising. Journal of College Student Development, 43(1),
5-19.
Artman, J. I., & Gore, R. C. (1992). Meeting individual needs fosters retention. Corpus
Christi, Texas: Del Mar College. (ERIC Document Reproduction Service No.
ED349070)
Astin, A. W. (1993). What matters in college?: Four critical years revisited. San Francisco,
CA: Jossey-Bass.
Astin, A. W. (1999). Student involvement: A developmental theory for higher education.
Journal of College Student Development, 40, 518-529.
Austin, M., Cherney, E., Crowner, J., & Hill, A. (1997). The forum: Intrusive group advising
for the probationary student. NACADA Journal, 17(2), 45-47.
39
Bailey, B. L., Bauman, C., & Lata, K. A. (1998). Student retention and satisfaction: The
evolution of a predictive model. AIR 1998 Annual Forum Paper.
Barefoot, B. O., Gardner, J. N., Cutright, M., Morris, L. V., Schroeder, C. C., Schwartz, S.
W., Siegel, M. J., et al. (2010). Achieving and sustaining institutional excellence for
the first year of college. Hoboken, NJ: John Wiley & Sons.
Barnes, B. J., Williams, E. A., & Archer, S. A. (2010). Characteristics that matter most:
Doctoral students’ perceptions of positive and negative advisor attributes.
NACADA Journal, 30(1), 34-46.
Bai, H., & Pan, W. (2010). A multilevel approach to assessing the interaction effects on
college student retention. Journal of College Student Retention: Research, Theory &
Practice, 11, 287-301.
Beal, P. E., & Noel, L. (1980). What works in student retention: The report of a joint project
of the American college testing program and the national center for higher education
management systems. American College Testing Program, Iowa City, IA. Retrieved
from http://www.
eric.ed.gov/ERICWebPortal/contentdelivery/servlet/ERICServlet?accno=ED197635
Bean, J. P., & Metzner, B. S. (1985). A conceptual model of nontraditional undergraduate
student attrition. Review of Educational Research, 55, 485-540.
doi:10.3102/00346543055004485
Biggs, D. A., Brodie, J. S., & Barnhart, W. J. (1975). The dynamics of undergraduate
academic advising. Research in Higher Education, 3, 345-357.
40
Bloom, J. L., & Martin, N. A. (2002). Incorporating appreciative inquiry into academic
advising. The Mentor, 4(3). Retrieved from http://dus.psu.edu/mentor/old/articles/
020829jb.htm.
Broadbridge, A. (1996). Academic advising--traditional or developmental approaches?:
Student perspectives. British Journal of Guidance & Counselling, 24(1), 97-111.
Campbell, S., Nutt, C., (2007, September 12). Academic advising’s integral role in the
academic success and persistence of students. NACADA Webinar.
Campbell, S., Nutt, C., & National Academic Advising Association. (2010). The role of
academic advising in student retention and persistence. Manhattan, KS: National
Academic Advising Association.
Carini, R. M., Kuh, G. D., & Klein, S. P. (2006). Student engagement and student learning:
Testing the linkages. Research in Higher Education, 47(1), 1-32.
Carstensen, D. J., & Silberhorn, C. (1979). A national survey of academic advising (final
report). Iowa City, IA: American College Testing.
Chickering, A. W., & Gamson, Z. F. (1987, March). Seven principles for good practice in
undergraduate education. AAHE Bulletin, 3-7.
Chickering, A. W., & Kuh, G. D. (2005). Prompting student success: Creating conditions so
every student can learn (Occaisonal Paper No. 3). Bloomington, Indiana: Indiana
University Center for Postsecondary Research.
Chun-Mei, Z., Golde, C. M., & McCormick, A. C. (2007). More than a signature: How
advisor choice and advisor behaviour affect doctoral student satisfaction. Journal of
Further & Higher Education, 31, 263-281. doi:10.1080/03098770701424983
41
Coll, J. E., & Draves, P. (2009). Traditional age students: Worldviews and satisfaction with
advising: A homogeneous study of student and advisors. College Student Affairs
Journal, 27, 215-223.
College Board reports national SAT scores down, ACT now more popular. (2012,
September 24). Associated Press. Retrieved from http://www.foxnews.com/
Cooperrider, D. L., & Whitney, D. K. (2005). Appreciative inquiry: A positive revolution in
change. San Francisco, CA: Berrett-Koehler.
Covington, M. V. (2000). Goal theory, motivation, and school achievement: An integrative
review. Annual review of psychology, 51(1), 171-200.
Crockett, D. S. (1978). Academic advising: A cornerstone of student retention. New
Directions for Student Services, (3), 29-35. doi:10.1002/ss.37119780306
Crookston, B. B. (2009). A developmental view of academic advising as teaching. NACADA
Journal, 29(1), 12-17. (Reprinted from Journal of College Student Personnel, 13,
1972, pp. 12-17; NACADA Journal, 14(2), 1994, pp. 5-9)
Dassance, C. R., & Batdorf, R. L. (1980, March). Educational advising for retention:
Applying the student development model. Forum presented at the Annual
Covention of the American Association of Community and Junior Colleges, San
Francisco, CA. Retrieved from http://www.eric.ed.gov/
Drake, J. K. (2011). The role of academic advising in student retention and persistence. About
Campus, 16(3), 8-12.
Dreisbach, C. (1990, July). Retention and advising: Paternalism, agency, and contract.
Revised version of a paper presented at the Noel/Levitz National Conference on
Student Retention, Washington, DC. Retrieved from http://www.eric.ed.gov/
42
Ender, S. C., Winston, R. B., Jr., & Miller, T. K. (1982). Academic advising as student
development. New Directions for Student Services, (17), 3-18.
doi:10.1002/ss.37119821703
Fant, G. C., Jr. (2010, February 18). Advising. [On Hiring section, Web log post].
Chronicle of Higher Education. Retrieved from
http://chronicle.com/blogs/onhiring/advising/21314
Ford, J., & Ford, S. (1989). A caring attitude and academic advising. National Academic
Advising Journal, 9(2), 43-48.
Ford, J., & Ford, S. (1993). Step-by-step guide to producing a comprehensive academic
advising handbook. NACADA Journal, 13(2), 50-51.
Fowler, P. (2010, October). Intrusive academic advising and the underprepared student: An
award winning model for increasing student success [PowerPoint slides handout].
Presentation at the NACADA Annual Conference, Orlando, FL. Retrieved from
http://www.nacada.ksu.edu/AnnualConf/2010/handouts/C257-H01.pdf
Fowler, P., & Dronet, Q. (2007, October). Gators in the rice fields: Academic advisors as
agents for success with underprepared students [PowerPoint slides’ handout].
Presentation at the NACADA Annual Conference, Baltimore, MD. Retrieved from
http://www.nacada.ksu.edu/NationalConf/2007/Handouts/S120H1.pdf
Frost, S. H. (1990). A comparison of developmental advising at two small colleges. National
Academic Advising Association Journal, 10(2), 9-13.
Frost, S. H. (1991, November). Academic advising for student success: A system of shared
responsibility. ASHE-ERIC Higher Education Report No. 3. Washington, DC: School
43
of Education and Human Development, the George Washington University. Retrieved
from http://eric.ed.gov/?id=ED340274
Glennen, R. E., & Baxley, D. M. (1985). Reduction of attrition through intrusive
advising. NASPA Journal, 22(3), 10-14.
Gonyea, R. M., & Kuh, G. D. (2006). Independent colleges and student engagement: Do
religious affiliation and institutional type matter?: A special report for the Council of
Independent Colleges. Bloomington, IN: Indiana University, Center for Postsecondary
Research. Retrieved from http://nsse.iub.edu/html/pubs.cfm
Gordon, V. N. (1994). Developmental advising: The elusive ideal. NACADA Journal, 14(2),
71-75.
Gordon, V. N., Habley, W. R., & Grites, T. J. (2008). Academic advising: a comprehensive
handbook. Hoboken, NJ: John Wiley & Sons.
Habley, W. R. (1986). Show us the future: The challenges facing academic advising.
NACADA Journal, 6(2), 5-11.
Habley, W. R. (1997). Organizational models and institutional advising practices. NACADA
Journal, 17(2), 39-44.
Habley, W. R. (2000). On a clear day-ja vu all over again. NACADA Journal, 20(1), 5-11.
Habley, W. R. & Morales, R. H. (1998). Advising models: Goal achievement and program
effectiveness. NACADA Journal, 18(1), 35-41.
Hale, M. D., Graham, D. L., & Johnson, D. M. (2009). Are students more satisfied with
academic advising when there is congruence between current and preferred advising
styles?. College Student Journal, 43, 313-324.
44
Harper, S. R., & Quaye, S. J. (Eds.). (2008). Student engagement in higher education:
Theoretical perspectives and practical approaches for diverse populations. New York,
NY: Routledge.
Heisserer, D. L., & Parette, P. (2002). Advising at-risk students in college and university
settings. College Student Journal, 36(1), 69-84.
Hunter, M. S., & White, E. R. (2004). Could fixing academic advising fix higher education?
About Campus, 9(1), 20-25.
Hutson, B. L. (2010). The impact of an appreciative advising-based university studies
course on college student first-year experience. Journal of Applied Research in
Higher Education, 2(1), 4-13.
Johnson-Garcia, M. (2010). Faculty perceptions of academic advising: Importance,
responsibility, and competence. (Doctoral dissertation). Retrieved from ProQuest.
Jones, G. (1998, July). Faculty academic advising: An examination of students’ and
faculty members’ perception of a first-year experience. Paper presented at the
National Conference on Student Retention, New Orleans, LA. Retrieved from
http://eric.ed.gov/?id=ED454889
King, M. C. (Ed.) (1993a). Academic advising, retention, and transfer. New Directions
for Community Colleges, (82), 21-31.
King, M. C. (1993b). Academic advising: Organizing and delivering services for student
success. San Francisco, CA: Jossey-Bass.
Kinzie, J., Schuh, J. H., Whitt, E. J., & Kuh, G. D. (2010). Student success in college:
Creating conditions that matter. Hoboken, NJ: John Wiley & Sons.
45
Kramer, G. L. (Ed.) (2007). Fostering student success in the campus community. San
Francisco, CA: Jossey-Bass.
Kroll, R. C. (1990, June). Development, implementation, and evaluation of an academic
advising model for use in the small, private college [Doctoral research project].
Retrieved from ERIC. (ED331333) Retrived from
http://eric.ed.gov/?id=ED331333
Kuh, G. D. (1997). The student learning agenda: Implications for academic advisors.
NACADA Journal, 17(2), 7-12.
Kuh, G. D. (2001). Assessing what really matters to student learning: Inside the national
survey of student engagement. Change, 33(3), 10-17, 66.
Kuh, G. D. (2003). What we’re learning about student engagement from NSSE. Change,
35(2), 24-32.
Kuh, G. D. (2005). Assessing conditions to enhance educational effectiveness: The inventory
for student engagement and success. San Francisco, CA: Jossey-Bass.
Kuh, G. D., & Documenting Effective Educational Practice (Project). (2005). Student success
in college: Creating conditions that matter. San Francisco, CA: Jossey-Bass.
Kuh, G. D., & Hu, S. (2001). The effects of student-faculty interaction in the 1990s. Review of
Higher Education, 24, 309–32.
Kuh, G. D., Kinzie, J., Schuh, J. H., Whitt, E. J., & Associates. (2005). Student success in
college: Creating conditions that matter. San Francisco, CA: Jossey-Bass.
Kuh, G. D., Nelson Laird, T. F., & Umbach, P. D. (2004). Aligning faculty and student
behavior: Realizing the promise of greater expectations. Liberal Education, 90(4), 24-
31.
46
Levitz, R. S., Noel, L., & Richter, B. J. (1999). Strategic moves for retention success. New
Directions for Higher Education, (108), 31-49.
Light, R. J. (2001). Making the most of college: Students speak their minds. Cambridge, MA:
Harvard University Press.
Metzner, B. S. (1989). Perceived quality of academic advising: The effect on freshman
attrition. American Educational Research Journal, 26, 422–442.
doi:10.3102/00028312026003422
Museus, S. D., & Ravello, J. N. (2010). Characteristics of academic advising that contribute to
racial and ethnic minority student success at predominantly white institutions.
NACADA Journal, 30(1), 47-58.
National Academic Advising Association. (2006). NACADA concept of academic advising.
Retrieved from http://www.nacada.ksu.edu/Clearinghouse/AdvisingIssues/Concept
Advising.htm.
O’Banion, T. (2009). An academic advising model. Junior College Journal, 29(1), 83-89.
(Reprinted from Junior College Journal, 42, 1972, pp. 62, 63, 66-99; NACADA
Journal 1994,14(2), pp. 10-16).
Pace, C. R. (1979). Measuring outcomes of college: Fifty years of findings and
recommendations for the future. San Francisco, CA: Jossey-Bass.
Pascarella, E. T., & Terenzini, P. T. (1991). How college affects students: Findings and
insights from twenty years of research. San Francisco, CA: Jossey-Bass.
Pascarella, E. T., & Terenzini, P. T. (1995). The impact of college on students: Myths,
rational myths, and some other things that may not be true. NACADA Journal, 15(2),
26-33.
47
Pascarella, E. T., & Terenzini, P. T. (1998). Studying college students in the 21st century:
Meeting new challenges. Review of Higher Education, 21, 151-65.
Pascarella, E. T., & Terenzini, P. T. (2005). How college affects students: A third decade of
research. San Francisco, CA: Jossey-Bass.
Pizzolato, J. (2008). Advisor, teacher, partner: Using the learning partnerships model to
reshape academic advising. About Campus, 13(1), 18-25. doi:10.1002/abc.243
Pike, G. R., & Kuh, G. D. (2005). First- and second-generation college students: A
comparison of their engagement and intellectual development. Journal of Higher
Education, 76(3), 276-300.
Seidman, A. (2005). College student retention : Formula for student success. Westport, CT:
Praeger.
Schulenberg, J. K., & Lindhorst, M. J. (2008). Advising is advising: Toward defining the
practice and scholarship of academic advising. NACADA Journal, 28(1), 43-53.
Shaffer, L. S., & Zalewski, J. M. (2011). A human capital approach to academic advising.
NACADA Journal, 31(1). 75-87.
Shane, D. (1981). Academic advising in higher education: A developmental approach for
college students of all ages. NACADA Journal, 1(2), 12-23.
Shockley-Zalabak, P. (2012). Advisers as interaction designers. NACADA Journal, 32(1), 12-
17.
Tinto, V. (1975). Dropout from higher education: A theoretical synthesis of recent research.
Review of Educational Research, 45(1), 89-125. doi:10.2307/1170024
Tinto, V. (1982). Limits of theory and practice in student attrition. The Journal of Higher
Education, 53, 687-700. doi:10.2307/1981525
48
Tinto, V. (1987). Leaving college: Rethinking the causes and cures of student attrition.
(1st ed). University of Chicago Press.
Tinto, V. (1988). Stages of student departure: Reflections on the longitudinal character of
student leaving. The Journal of Higher Education, 59, 438-455. doi:10.2307/1981920
Tinto, V. (1993). Leaving college: Rethinking the causes and cures of student attrition.
(2nd ed.). University of Chicago Press.
Tinto, V. (2004). Student retention and graduation: Facing the truth, living with the
consequences. The Pell Institute for the Study of Opportunity in Higher Education:
Occasional paper. Retrieved from http://files.eric.ed.gov/fulltext/ED519709.pdf
Tinto, V. (2005). Taking student success seriously: Rethinking the first year of college. Ninth
Annual Intersession Academic Affairs Forum, California State University, Fullerton.
Umbach, P. D., Palmer, M. M., Kuh, G. D., & Hannah, S. J. (2006). Intercollegiate athletes
and effective educational practices: Winning combination or losing effort? Research in
Higher Education, 47, 709-733.
Umbach, P. D., & Wawrzynski, M. R. (2004, June). Faculty do matter: The role of college
faculty in student learning and engagement. Paper presented at the annual forum of the
Association for Institutional Research, Boston, MA.
What’s a good SAT score or ACT score? (n.d.). Retrieved from
http://www.princetonreview.com/college/good-sat-score-act-score.aspx
Winston, R. B., & Sandor, J. A. (1984). Developmental academic advising: What do students
want? NACADA Journal, 4(1), 5-13.
Winston, R. B., Jr. (1994). Developmental academic advising reconsidered: Chimera or
unrealized potentiality? NACADA Journal, 14, 112-11.
49
Wiseman, C. S., & Messitt, H. (2010). Identifying components of a successful faculty-advisor
program. NACADA Journal, 30(2), 35-52.
Wolf-Wendel, L., Ward, K., & Kinzie, J. (2009). A tangled web of terms: The overlap and
unique contribution of involvement, engagement, and integration to understanding
college student success. Journal of College Student Development, 50, 407-428.
doi:10.1353/csd.0.0077
Yarbrough, E. (2010). An examination of academic advising style preference in
undergraduate students (Doctoral dissertation). Retrieved from ProQuest.
Zelazek, J. R. (2011, May). Intrusive advisement: A necessary process to retain graduate
student and bolster graduation rates. Paper presented at the Annual International
Conference on Education, Athens, Greece.
Zhao, C., Carini, R. M., & Kuh, G. D. (2005). Searching for the peach blossom Shangri-La:
Student engagement of men and women SMET majors. Review of Higher Education,
28, 503-525.
Zhao, C., Golde, C. M., & McCormick, A. C. (2007). More than a signature: How advisor
choice and advisor behaviour affect doctoral student satisfaction. Journal of Further
and Higher Education, 31, 263-281.
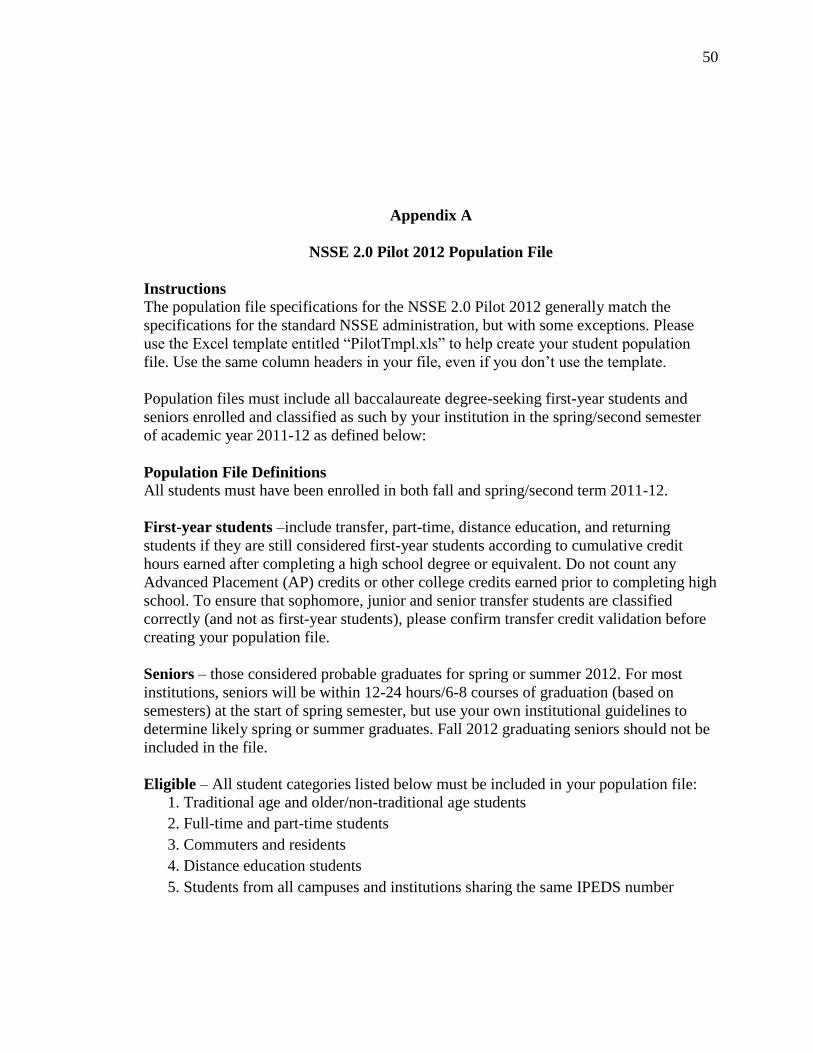
50
Appendix A
NSSE 2.0 Pilot 2012 Population File
Instructions
The population file specifications for the NSSE 2.0 Pilot 2012 generally match the
specifications for the standard NSSE administration, but with some exceptions. Please
use the Excel template entitled “PilotTmpl.xls” to help create your student population
file. Use the same column headers in your file, even if you don’t use the template.
Population files must include all baccalaureate degree-seeking first-year students and
seniors enrolled and classified as such by your institution in the spring/second semester
of academic year 2011-12 as defined below:
Population File Definitions
All students must have been enrolled in both fall and spring/second term 2011-12.
First-year students –include transfer, part-time, distance education, and returning
students if they are still considered first-year students according to cumulative credit
hours earned after completing a high school degree or equivalent. Do not count any
Advanced Placement (AP) credits or other college credits earned prior to completing high
school. To ensure that sophomore, junior and senior transfer students are classified
correctly (and not as first-year students), please confirm transfer credit validation before
creating your population file.
Seniors – those considered probable graduates for spring or summer 2012. For most
institutions, seniors will be within 12-24 hours/6-8 courses of graduation (based on
semesters) at the start of spring semester, but use your own institutional guidelines to
determine likely spring or summer graduates. Fall 2012 graduating seniors should not be
included in the file.
Eligible – All student categories listed below must be included in your population file:
1. Traditional age and older/non-traditional age students
2. Full-time and part-time students
3. Commuters and residents
4. Distance education students
5. Students from all campuses and institutions sharing the same IPEDS number

51
Ineligible – Students enrolled in programs that terminate with master’s or doctoral
degrees without earning a baccalaureate degree along the way (e.g., pharmacy,
occupational therapy, physical therapy, etc.). NSSE 2.0 2012 Pilot Population File
Instructions, page 2.
Population Field Content
Student ID is required for all students, and:
1. Must be unique for each student in your population (to eliminate confusion over
duplicate records and to ensure students with the same name are correctly
identified).
2. Must NOT be a social security number (SSN). Your file will be checked for the
appearance of SSNs as it is uploaded. If SSNs appear to be included, you will be
asked to confirm SSNs were not in fact used. If your institution currently uses
SSN to identify students, you must generate alternative student ID numbers for
your population file, and maintain records that will allow you to link the alternate
student ID number back to the SSN.
Student name – First and last names in separate columns are required for all students.
E-mail address – Please follow these guidelines:
1. Provide either the students’ school-provided e-mail addresses or their e-mail
addresses from outside Internet service providers. Use the e-mail addresses which
you believe students are most likely to check.
2. If you have two e-mail addresses available, provide both for each student in
“Primary e-mail address” and “Secondary e-mail address” fields. NSSE will
utilize both addresses to ensure message delivery to students.
3. Be sure to include domain names (e.g., [email protected]).
4. Verify student e-mail addresses before submitting your population file.
Student records – Class level, enrollment status, and gender are required for sample
selection and proper weighting. If your institution uses non-traditional enrollment status
or class level, please contact your client service team prior to submitting your file.
1. Class level –
o Use FY for First-year students
o Use SR for Seniors
2. Enrollment status –
o Use FT for Full-time
o Use PT for Part-time
3. Gender –
o Use F for Female
o Use M for Male
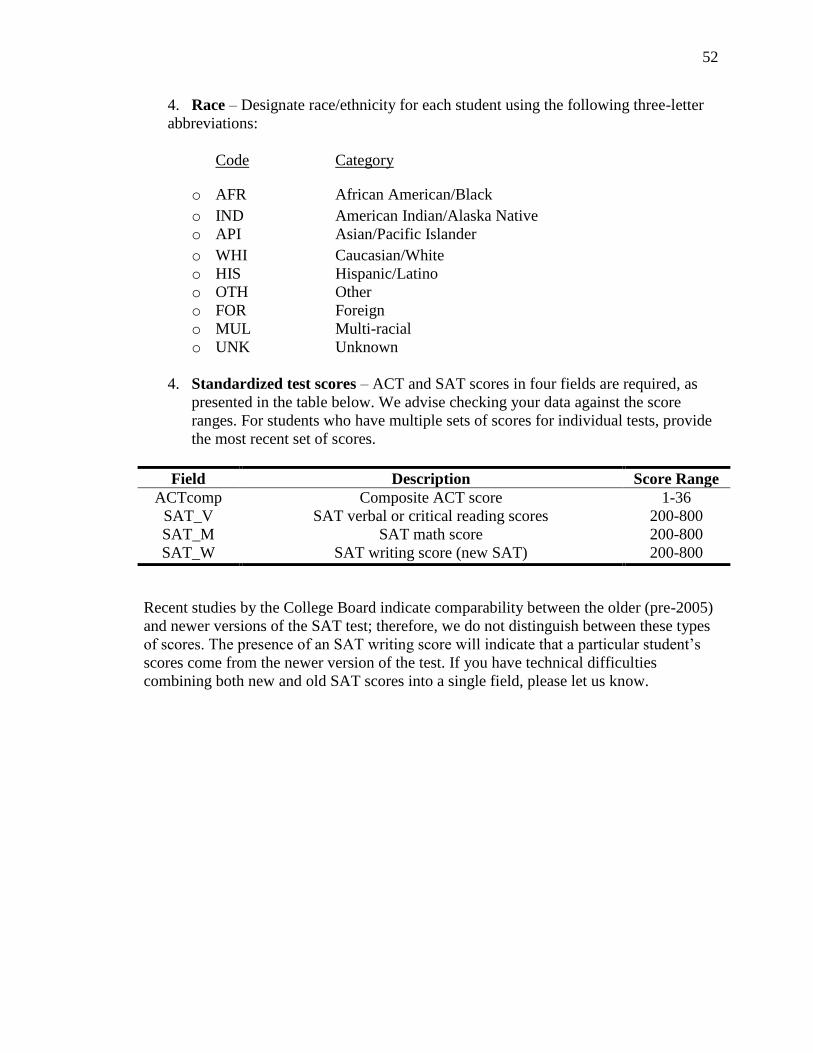
52
4. Race – Designate race/ethnicity for each student using the following three-letter
abbreviations:
Code Category
o AFR African American/Black
o IND American Indian/Alaska Native
o API Asian/Pacific Islander
o WHI Caucasian/White
o HIS Hispanic/Latino
o OTH Other
o FOR Foreign
o MUL Multi-racial
o UNK Unknown
4. Standardized test scores – ACT and SAT scores in four fields are required, as
presented in the table below. We advise checking your data against the score
ranges. For students who have multiple sets of scores for individual tests, provide
the most recent set of scores.
Field Description Score Range
ACTcomp Composite ACT score 1-36
SAT_V SAT verbal or critical reading scores 200-800
SAT_M SAT math score 200-800
SAT_W SAT writing score (new SAT) 200-800
Recent studies by the College Board indicate comparability between the older (pre-2005)
and newer versions of the SAT test; therefore, we do not distinguish between these types
of scores. The presence of an SAT writing score will indicate that a particular student’s
scores come from the newer version of the test. If you have technical difficulties
combining both new and old SAT scores into a single field, please let us know.
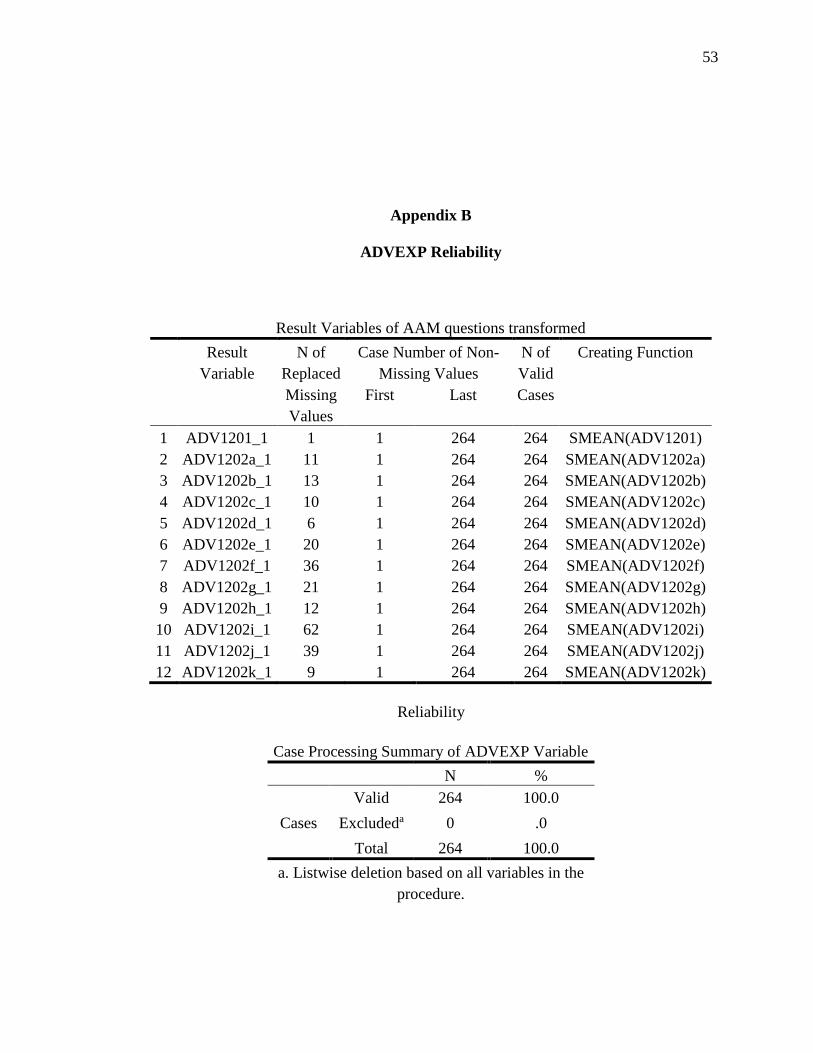
53
Appendix B
ADVEXP Reliability
Result Variables of AAM questions transformed
Result
Variable
N of
Replaced
Missing
Values
Case Number of Non-
Missing Values
N of
Valid
Cases
Creating Function
First Last
1 ADV1201_1 1 1 264 264 SMEAN(ADV1201)
2 ADV1202a_1 11 1 264 264 SMEAN(ADV1202a)
3 ADV1202b_1 13 1 264 264 SMEAN(ADV1202b)
4 ADV1202c_1 10 1 264 264 SMEAN(ADV1202c)
5 ADV1202d_1 6 1 264 264 SMEAN(ADV1202d)
6 ADV1202e_1 20 1 264 264 SMEAN(ADV1202e)
7 ADV1202f_1 36 1 264 264 SMEAN(ADV1202f)
8 ADV1202g_1 21 1 264 264 SMEAN(ADV1202g)
9 ADV1202h_1 12 1 264 264 SMEAN(ADV1202h)
10 ADV1202i_1 62 1 264 264 SMEAN(ADV1202i)
11 ADV1202j_1 39 1 264 264 SMEAN(ADV1202j)
12 ADV1202k_1 9 1 264 264 SMEAN(ADV1202k)
Reliability
Case Processing Summary of ADVEXP Variable
N %
Cases
Valid 264 100.0
Excludeda 0 .0
Total 264 100.0
a. Listwise deletion based on all variables in the
procedure.
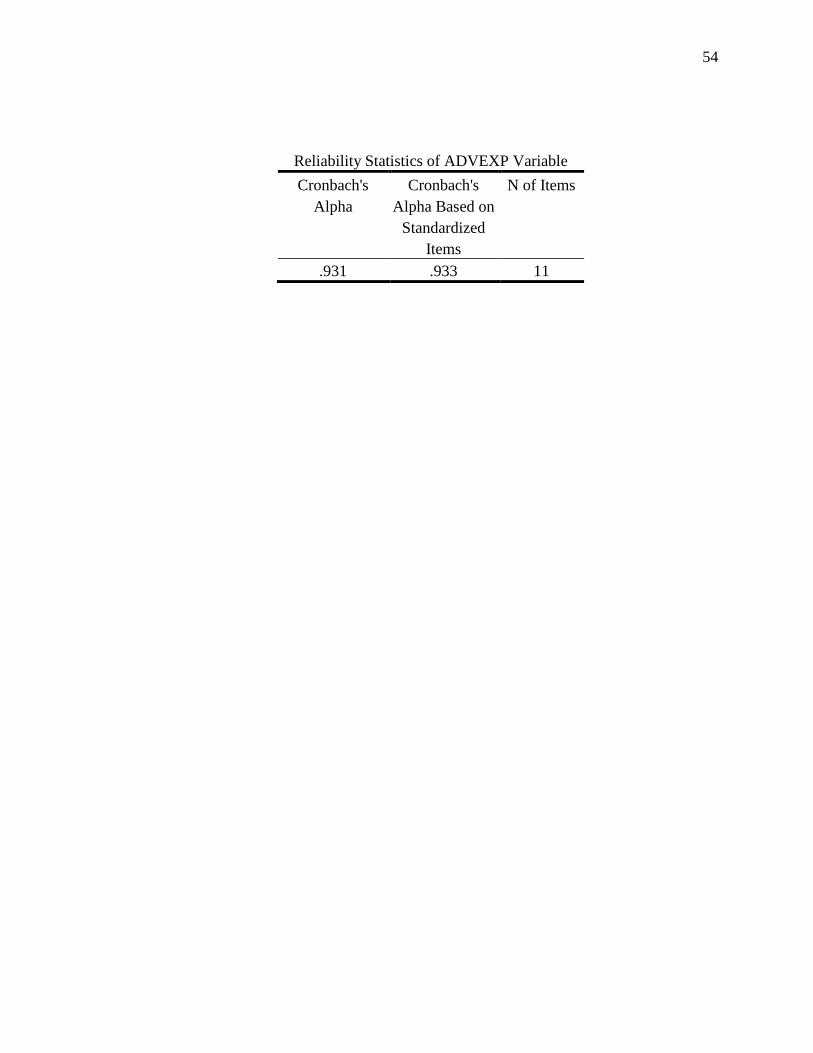
54
Reliability Statistics of ADVEXP Variable
Cronbach's
Alpha
Cronbach's
Alpha Based on
Standardized
Items
N of Items
.931 .933 11
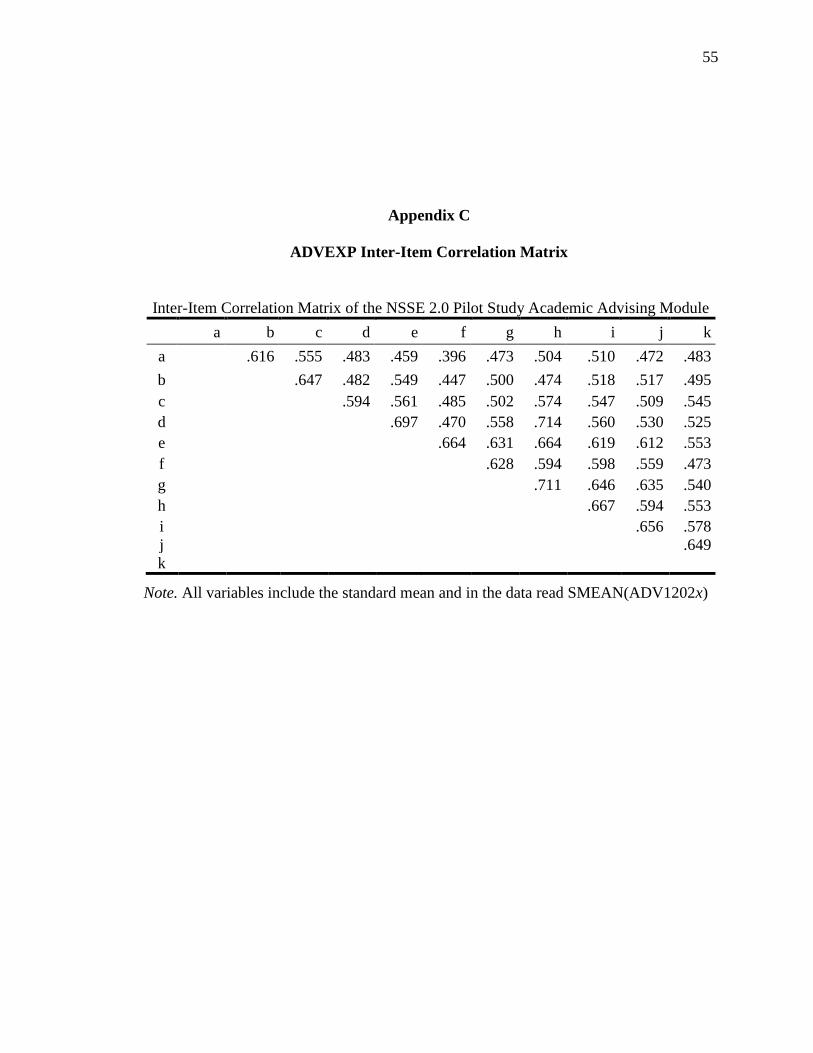
55
Appendix C
ADVEXP Inter-Item Correlation Matrix
Note. All variables include the standard mean and in the data read SMEAN(ADV1202x)
Inter-Item Correlation Matrix of the NSSE 2.0 Pilot Study Academic Advising Module
a b c d e f g h i j k
a 1.000 .616 .555 .483 .459 .396 .473 .504 .510 .472 .483
b .616 1.000 .647 .482 .549 .447 .500 .474 .518 .517 .495
c .555 .647 1.000 .594 .561 .485 .502 .574 .547 .509 .545
d .483 .482 .594 1.000 .697 .470 .558 .714 .560 .530 .525
e .459 .549 .561 .697 1.000 .664 .631 .664 .619 .612 .553
f .396 .447 .485 .470 .664 1.000 .628 .594 .598 .559 .473
g .473 .500 .502 .558 .631 .628 1.000 .711 .646 .635 .540
h .504 .474 .574 .714 .664 .594 .711 1.000 .667 .594 .553
i .510 .518 .547 .560 .619 .598 .646 .667 1.000 .656 .578
j .472 .517 .509 .530 .612 .559 .635 .594 .656 1.000 .649
k .483 .495 .545 .525 .553 .473 .540 .553 .578 .649 1.000
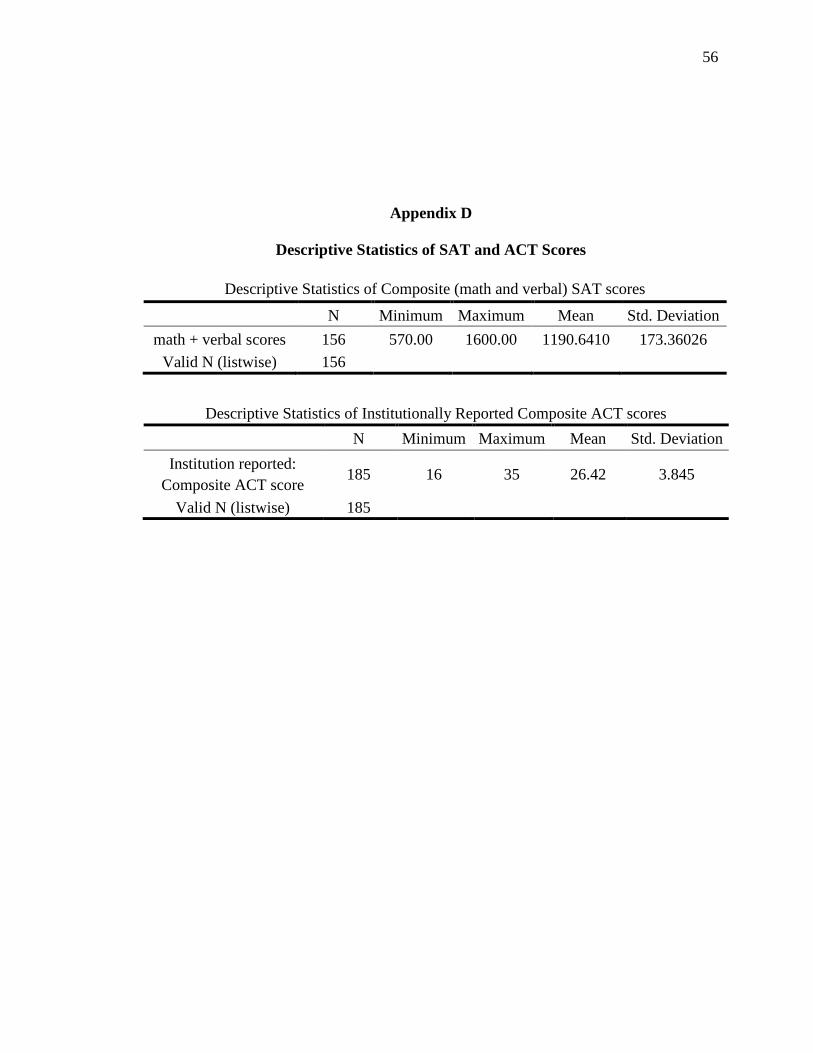
56
Appendix D
Descriptive Statistics of SAT and ACT Scores
Descriptive Statistics of Composite (math and verbal) SAT scores
N Minimum Maximum Mean Std. Deviation
math + verbal scores 156 570.00 1600.00 1190.6410 173.36026
Valid N (listwise) 156
Descriptive Statistics of Institutionally Reported Composite ACT scores
N Minimum Maximum Mean Std. Deviation
Institution reported:
Composite ACT score 185 16 35 26.42 3.845
Valid N (listwise) 185
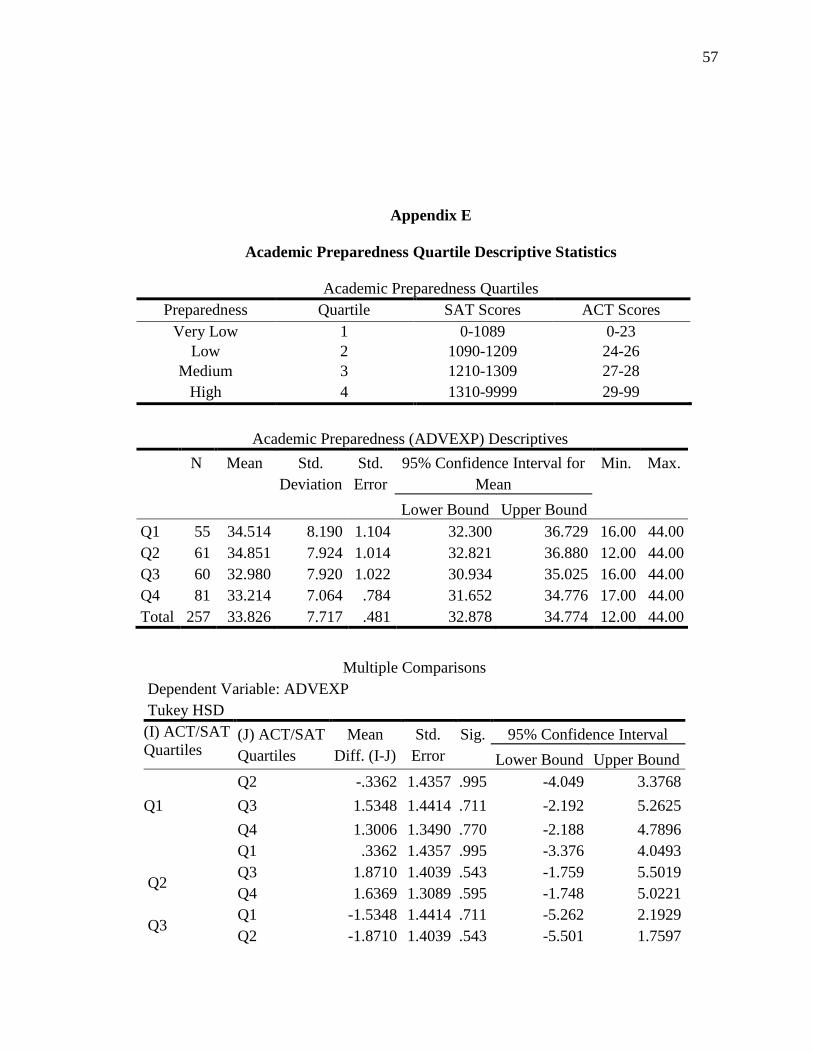
57
Appendix E
Academic Preparedness Quartile Descriptive Statistics
Academic Preparedness Quartiles
Preparedness Quartile SAT Scores ACT Scores
Very Low 1 0-1089 0-23
Low 2 1090-1209 24-26
Medium 3 1210-1309 27-28
High 4 1310-9999 29-99
Academic Preparedness (ADVEXP) Descriptives
N Mean Std.
Deviation
Std.
Error
95% Confidence Interval for
Mean
Min. Max.
Lower Bound Upper Bound
Q1 55 34.514 8.190 1.104 32.300 36.729 16.00 44.00
Q2 61 34.851 7.924 1.014 32.821 36.880 12.00 44.00
Q3 60 32.980 7.920 1.022 30.934 35.025 16.00 44.00
Q4 81 33.214 7.064 .784 31.652 34.776 17.00 44.00
Total 257 33.826 7.717 .481 32.878 34.774 12.00 44.00
Multiple Comparisons
Dependent Variable: ADVEXP
Tukey HSD
(I) ACT/SAT
Quartiles (J) ACT/SAT
Quartiles
Mean
Diff. (I-J)
Std.
Error
Sig. 95% Confidence Interval
Lower Bound Upper Bound
Q1
Q2 -.3362 1.4357 .995 -4.049 3.3768
Q3 1.5348 1.4414 .711 -2.192 5.2625
Q4 1.3006 1.3490 .770 -2.188 4.7896
Q2
Q1 .3362 1.4357 .995 -3.376 4.0493
Q3 1.8710 1.4039 .543 -1.759 5.5019
Q4 1.6369 1.3089 .595 -1.748 5.0221
Q3 Q1 -1.5348 1.4414 .711 -5.262 2.1929
Q2 -1.8710 1.4039 .543 -5.501 1.7597
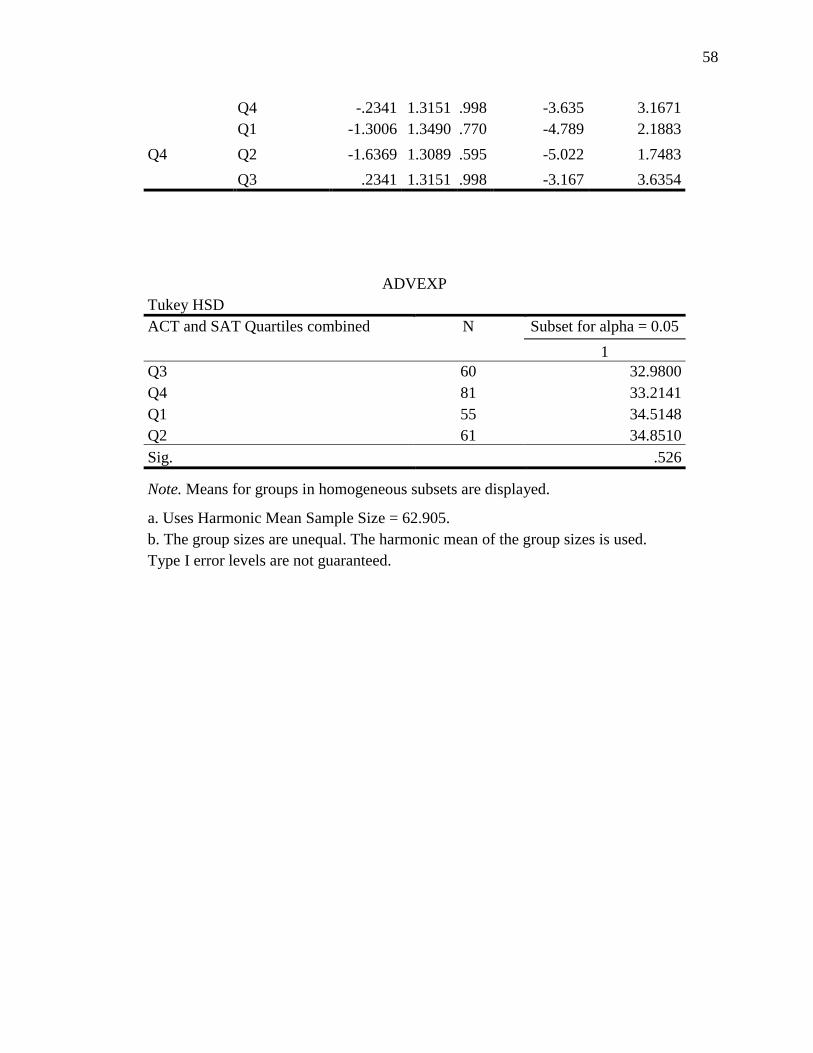
58
Q4 -.2341 1.3151 .998 -3.635 3.1671
Q4
Q1 -1.3006 1.3490 .770 -4.789 2.1883
Q2 -1.6369 1.3089 .595 -5.022 1.7483
Q3 .2341 1.3151 .998 -3.167 3.6354
ADVEXP
Tukey HSD
ACT and SAT Quartiles combined N Subset for alpha = 0.05
1
Q3 60 32.9800
Q4 81 33.2141
Q1 55 34.5148
Q2 61 34.8510
Sig. .526
Note. Means for groups in homogeneous subsets are displayed.
a. Uses Harmonic Mean Sample Size = 62.905.
b. The group sizes are unequal. The harmonic mean of the group sizes is used.
Type I error levels are not guaranteed.


![Advising Manual 2016-2017 - Monfort College of Businessmcb.unco.edu › pdf › advising › MCB-Advising-Manual-2016-2017.pdf · Advising Manual 2016-2017. 2 [AdvisingManual] 3](https://img.pdfslide.net/doc/110x75/5f1169150273b0207c355cff/advising-manual-2016-2017-monfort-college-of-a-pdf-a-advising-a-mcb-advising-manual-2016-2017pdf.jpg)