Embed Size (px)
Citation preview
Flexibility of Aromatic Residues in the Active-Site Gorge ofAcetylcholinesterase: X-ray versus Molecular Dynamics
Yechun Xu,*y Jacques-Philippe Colletier,z§ Martin Weik,§ Hualiang Jiang,{k John Moult,**Israel Silman,y and Joel L. Sussman**Department of Structural Biology and yDepartment of Neurobiology, Weizmann Institute of Science, Rehovot 76100, Israel; zUniversity ofCalifornia, Los Angeles-Department of Energy Institute of Genomics and Proteomics, University of California, Los Angeles, California 90095;§Laboratoire de Biophysique Moleculaire, Institute de Biologie Structurale, 38027 Grenoble, France; {Center for Drug Discovery and Design,Shanghai Institute of Materia Medica, Chinese Academy of Sciences, Shanghai 201203, China; kSchool of Pharmacy, East China Universityof Science and Technology, Shanghai 200237, China; and **Center for Advanced Research in Biotechnology, University of MarylandBiotechnology Institute, Rockville, Maryland 20850
ABSTRACT The high aromatic content of the deep and narrow active-site gorge of acetylcholinesterase (AChE) is a re-markable feature of this enzyme. Here, we analyze conformational flexibility of the side chains of the 14 conserved aromaticresidues in the active-site gorge of Torpedo californica AChE based on the 47 three-dimensional crystal structures available forthe native enzyme, and for its complexes and conjugates, and on a 20-ns molecular dynamics (MD) trajectory of the nativeenzyme. The degree of flexibility of these 14 aromatic side chains is diverse. Although the side-chain conformations of F330and W279 are both very flexible, the side-chain conformations of F120, W233, W432, Y70, Y121, F288, F290 and F331 appearto be fixed. Residues located on, or adjacent to, the V-loop (C67–C94), namely W84, Y130, Y442, and Y334, display differentflexibilities in the MD simulations and in the crystal structures. An important outcome of our study is that the majority of the side-chain conformations observed in the 47 Torpedo californica AChE crystal structures are faithfully reproduced by the MDsimulation on the native enzyme. Thus, the protein can assume these conformations even in the absence of the ligand thatpermitted their experimental detection. These observations are pertinent to structure-based drug design.
INTRODUCTION
The principal role of acetylcholinesterase (AChE) is termi-
nation of transmission at cholinergic synapses by rapid hy-
drolysis of the neurotransmitter acetylcholine (ACh) (1). Due
to its crucial biologic role, AChE is the target of the first
generation of anti-Alzheimer drugs, insecticides, and nerve
agents (2). Solution of the three-dimensional (3D) structure
of Torpedo californica AChE (TcAChE) revealed, unex-
pectedly, that its catalytic site is located near the bottom of a
deep and narrow gorge, ;20 A deep (3). Its cross section at
the narrowest point is substantially smaller than the diameter
of the quaternary group of choline; thus, AChE must undergo
substantial ‘‘breathing’’ motions to carry out its catalytic
activity (3,4). A remarkable feature of the gorge is that it is
lined by the rings of 14 conserved aromatic amino acids
(F120, F288, F290, F330, F331, W84, W233, W279, W432,
Y70, Y121, Y130, Y334, and Y442), which contribute
;60% of its total surface area. These residues are highly
conserved, and most of them can be assigned functional roles.
Thus, W84 and F330 are involved in the so-called ‘‘anionic’’
subsite of the catalytic site (CAS), making p-cation interac-
tions with the quaternary group of the substrate (3,5–8);
W279 and Y70 contribute to the peripheral anionic site (PAS)
at the mouth of the gorge, which serves as a relay station for
the substrate en route to the active site (7–12); and W233,
F288, and F290 contribute to the acyl pocket, which deter-
mines the specificity for ACh (6,13). Midway down the gorge
is the narrow bottleneck mentioned above, to which both
Y121 and F330 make important contributions (7,14,15).
Crystallographic studies have also established the involve-
ment of several of these conserved aromatic residues in in-
teractions with anticholinesterase agents via both p-cation
and p–p stacking interactions (5,16,17). A typical example
is the drug E2020 (Aricept), which is used to treat Alzheimer
disease. E2020 interacts with W84 at the bottom of the gorge
and W279 at the entrance to the gorge through p–p stacking
interactions, and it interacts with F330 in the middle of the
gorge via a p-cation interaction (16). Steered molecular dy-
namics (MD) simulations of the dissociation of E2020 from
AChE suggest a model in which the aromatic residues serve
as a conveyer belt for E2020 entering and leaving the active-
site gorge (18).
Since the solution of the initial crystal structure of
TcAChE, more than 17 years ago (3), 3D structures of the
native enzyme from several different species, as well as nu-
merous complexes and conjugates with various ligands, in-
hibitors and substrate analogs, have been deposited in the
Protein Data Bank (PDB) (www.pdb.org). Even though the
enzyme has been crystallized under a number of very different
conditions and in seven different space groups, the overall fold
of the enzyme is remarkably well conserved in all these
structures. The side chains of several aromatic residues,
doi: 10.1529/biophysj.108.129601
Submitted January 16, 2008, and accepted for publication March 31, 2008.
Yechun Xu and Jacques-Philippe Colletier contributed equally to this work.
Address reprint requests to Joel L. Sussman, Dept. of Structural Biology,
Weizmann Institute of Science, Rehovot 76100, Israel. Tel.: 972-8-934-4531;
Fax: 972-8-934-4159; E-mail: [email protected].
Editor: Ron Elber.
� 2008 by the Biophysical Society
0006-3495/08/09/2500/12 $2.00
2500 Biophysical Journal Volume 95 September 2008 2500–2511
however, appear to be quite flexible. Thus, several crystal
structures show that W279, at the PAS, can adopt several
different conformations in various ligand/enzyme complexes
(PDB codes 1q83 (19), 2gyu (20), 1odc (21), 2cek (22), 2ckm
(23), 2gyw (20), and 2gyv (20)). F330 is one of two residues
that form the bottleneck of the gorge, and it has been suggested
that the orientation of its phenyl ring controls the opening/
closing of the bottleneck (5,7,15,24,25). F330 has also been
shown to adopt a spectrum of conformations in various ligand/
AChE complexes (see the overlay representation in Fig. 7 in
the work of Kryger, Silman, and Sussman (16)). Another ar-
omatic residue that deserves attention is W84, which is the
main contributor to the stabilization of the substrate in the
active site. An early MD simulation of TcAChE suggested that
a conformational change in the orientation of its indole ring
could result in the transient opening of a short channel con-
necting the interior of the gorge with the bulk solvent (namely
the backdoor) through which solvent, and perhaps substrate
and products, might enter or leave the active site (4,26). Other
possible back and side doors to the active-site gorge have also
been suggested on the basis of theoretical studies (27–29).
Reexamination of the Drosophila melanogaster AChE struc-
ture (30) by Nachon et al. (31) revealed that a flip in W83
(equivalent to W84 in TcAChE) had generated a channel ;5 A
in diameter between W83, W472, and D482. Although various
lines of experimental evidence have been produced both for
(32,33) and against a functional backdoor (34,35), none of this
evidence can be considered decisive.
In this study, the side-chain flexibility of the 14 conserved
aromatic residues in the active-site gorge of TcAChE is ex-
amined in the 47 available crystal structures of TcAChE and
compared to those produced in a 20-ns MD simulation using
the native enzyme as a starting model. The data presented
emphasize the importance of taking into account side-chain
flexibility in evaluating protein-ligand interactions. The data
also suggest that MD simulation is an appropriate method for
studying side-chain conformations, especially of proteins for
which multiple crystal structures are not yet available (36).
METHODS
MD simulations
The monomer of native TcAChE, determined at 1.8 A resolution (3), was
used as the starting structure for the simulations (PDB code 1ea5). In brief,
the protein, together with crystal water molecules, was inserted into a box of
dimensions 10.6 3 10.6 3 10.6 nm3, with the minimal distance of the protein
from its walls being 2.0 nm. This box was solvated by use of a simple point
charge water model (37), and the resulting solvated box was then submitted
to energy minimization. Counterions were subsequently added to provide
a neutral simulation system. Energy minimization was then repeated on the
entire system. After convergence had been reached, the solvent, the coun-
terions, and the protein were coupled separately to a temperature bath at
300 K. The entire system was then equilibrated for 20 ns. To eliminate the
influence of the main-chain movement on the side-chain conformational
changes, a second 20-ns MD trajectory was run for the simulation system
with a force restraint of 1000 kcal/mol imposed on all the main-chain atoms
throughout the simulation time.
MD simulations were carried out with the GROMACS package (38,39),
using NPT and periodic boundary conditions. The GROMOS96 force field
(40) was applied to the protein. The pressure was kept constant at 1 bar by
coupling to a Berendsen barostat with tp ¼ 1.0 ps and a compressibility of
4.5 3 10�5 bar�1 (41). The temperature was maintained at 300 K by cou-
pling to a Berendsen thermostat with a coupling time of tT¼ 0.1 ps (41). The
LINCS method (42) was used to restrain bond lengths, allowing an inte-
gration step of 2 fs. The coordinates of the entire system were saved every
500 steps. Electrostatic interactions were calculated using the particle-mesh
Ewald algorithm (43,44).
To assess the effect of packing restraints on the flexibility of the side
chains of certain residues, MD simulations were also carried out on the
physiologic dimer (PDB code 1ea5) using the same protocol.
Crystallographic data
All the side-chain conformations of the 14 aromatic residues included in the
47 3D structures of TcAChE available from the PDB were examined by
calculating the x1 (N-CA-CB-CG) and x2 (CA-CB-CG-CD1) angles for each
residue. The structures included native data sets (PDB codes 1ea5, 1qid,
1w75, and 2ace), complexes with reversibly bound ligands (PDB codes 1acj,
1acl, 1amn, 1ax9, 1dx6, 1e3q, 1e66, 1eve, 1fss, 1gpk, 1gpn, 1gqs, 1h22,
1h23, 1hbj, 1jjb, 1odc, 1qti, 1u65, 1ut6, 1vot, 1w4l, 1w6r, 1w76, 1zgb, 1zgc,
2ack, 2c5g, 2cek, 2ckm, 2cmf, and 2j4f), and covalent conjugates (PDB
codes 1cfj, 1gqr, 1oce, 1som, 1vxo, 1vxr, 2bag, 2c4h, 2c5f, 2c58, and 2dfp).
To avoid introducing bias via redundant entries, only one of the nine
structures produced in the radiation damage study on TcAChE (45) was taken
into account in the analysis, namely 1qid. Three crystal structures of re-
combinant mouse AChE (mAChE), 1q83, 2gyu, and 2gyv, were used to
calculate the x1 and x2 angles of W286 (homologous to W279 in TcAChE).
RESULTS AND DISCUSSION
To our knowledge, 97 crystal structures of AChE are avail-
able from the PDB to date. The majority are for TcAChE (55
structures) and for mAChE (34 structures), as well as 2, 3,
and 3 structures, respectively, for human, Electrophoruselectricus, and D. melanogaster AChEs. Because the side-
chain conformations observed for the 14 aromatic residues in
the ensemble of TcAChE structures cover almost the entire
range of conformations that occur in the structures of the
AChEs of the other species and to eliminate any possible
effects of differences in amino acid sequence, only the 47
crystal structures of TcAChE were used for the side-chain
flexibility analysis of these residues.
The dihedral angles of an aromatic residue, x1 and x2,
suffice to describe its side-chain conformation; hence, x1/x2
plots provide a simple representation of the shuffling between
aromatic side-chain conformations along an MD trajectory.
The x1 and x2 angles of the 14 conserved aromatic residues
lining the active-site gorge of TcAChE were extracted from
the MD simulation performed for the native structure, 1ea5,
and plotted together with the experimental values obtained
from the crystallographic data (Fig. 1). The black triangles
represent the conformations observed in the crystal struc-
tures, whereas the gray dots are derived from the MD tra-
jectory. Because our protocol involved sampling at 1-ps
intervals, there are 20,000 such points in each representation.
For most of the residues, though not for all, the side-chain
Simulated and X-ray Structures of AChE 2501
Biophysical Journal 95(5) 2500–2511
conformational space explored by the MD simulation en-
compasses the space covered by the crystallographic data.
Conversely, much of the conformational space explored by
the simulation is devoid of experimental points.
The principal conclusions to be drawn from the data dis-
played in Fig. 1 are as follows. For most of the residues, the
distribution of the black triangles corresponding to the ex-
perimentally determined angles is quite narrow; thus, their
side-chain conformations in the various crystal structures,
whether of native TcAChE or of its complexes and conju-
gates, are very similar. Considering that ;80% of the crystal
structures are of complexes or conjugates, this result indi-
cates that the binding of a ligand to the enzyme has only
subtle effects on the side-chain conformations of most of the
aromatic residues lining the active-site gorge
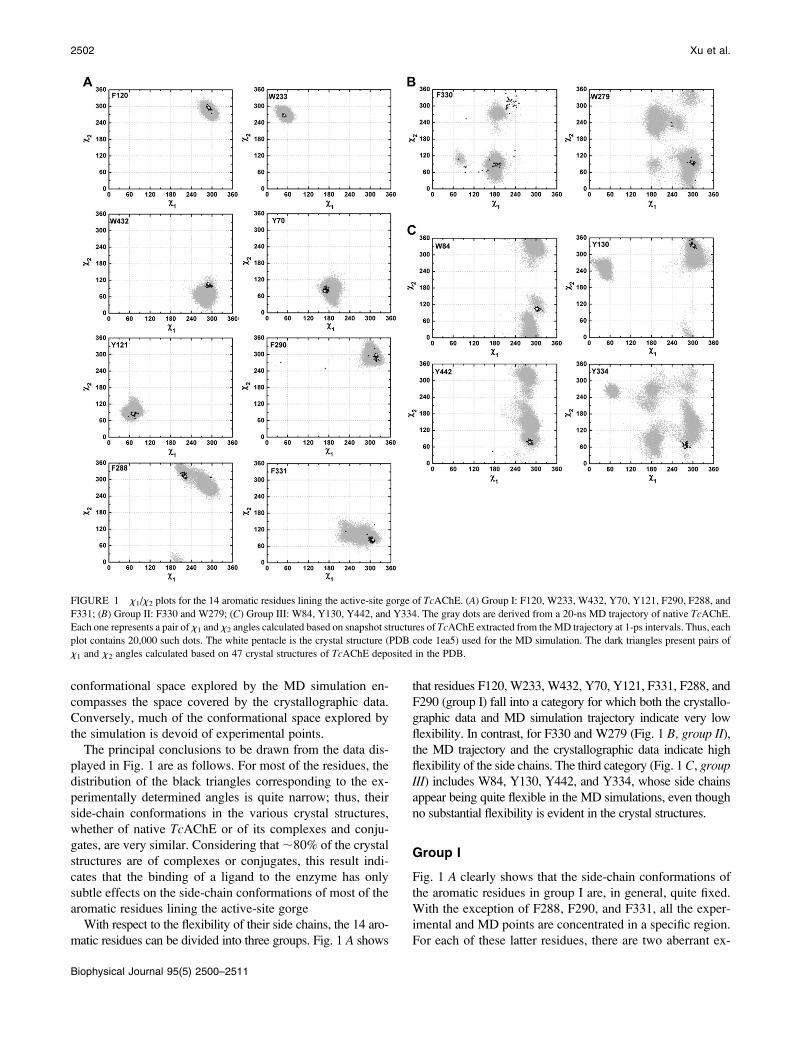
With respect to the flexibility of their side chains, the 14 aro-
matic residues can be divided into three groups. Fig. 1 A shows
that residues F120, W233, W432, Y70, Y121, F331, F288, and
F290 (group I) fall into a category for which both the crystallo-
graphic data and MD simulation trajectory indicate very low
flexibility. In contrast, for F330 and W279 (Fig. 1 B, group II),the MD trajectory and the crystallographic data indicate high
flexibility of the side chains. The third category (Fig. 1 C, groupIII) includes W84, Y130, Y442, and Y334, whose side chains
appear being quite flexible in the MD simulations, even though
no substantial flexibility is evident in the crystal structures.
Group I
Fig. 1 A clearly shows that the side-chain conformations of
the aromatic residues in group I are, in general, quite fixed.
With the exception of F288, F290, and F331, all the exper-
imental and MD points are concentrated in a specific region.
For each of these latter residues, there are two aberrant ex-
FIGURE 1 x1/x2 plots for the 14 aromatic residues lining the active-site gorge of TcAChE. (A) Group I: F120, W233, W432, Y70, Y121, F290, F288, and
F331; (B) Group II: F330 and W279; (C) Group III: W84, Y130, Y442, and Y334. The gray dots are derived from a 20-ns MD trajectory of native TcAChE.
Each one represents a pair of x1 and x2 angles calculated based on snapshot structures of TcAChE extracted from the MD trajectory at 1-ps intervals. Thus, each
plot contains 20,000 such dots. The white pentacle is the crystal structure (PDB code 1ea5) used for the MD simulation. The dark triangles present pairs of
x1 and x2 angles calculated based on 47 crystal structures of TcAChE deposited in the PDB.
2502 Xu et al.
Biophysical Journal 95(5) 2500–2511
perimental data sets. The two aberrant points in the plots for
F288 and F290 correspond to PDB entries 2dfp and 2cmf,
whereas those in the plot for F331 correspond to PDB entries
2dfp and 2cek. In both the 2dfp and 2cmf structures, the
W279–S291 loop undergoes a substantial conformational
rearrangement, due either to the modification of the catalytic
S200 by an organophosphate with a bulky alkyl leaving
group (2dfp) or to the binding of a bis-tacrine ligand with a
short linker between the two tacrines (2cmf). In both cases,
F288 and F290 rearrange and adopt side-chain conformations
very different from their native ones (23,46). The confor-
mational change observed for F288 in the 2dfp structure
disrupts the p–p stacking interaction between the phenyl
rings of F288 and F331. As a consequence, it increases the
flexibility of the side chain of F331, which thus adopts an
orientation different from its native one. In the 2cmf struc-
ture, the side-chain conformation of F331 is similar to its
native one, yet a backbone movement is observed. Finally,
there are two conformations for F330 and F331 in the 2cek
structure (22). In one conformation, the F330 ring is stacked
between the aromatic moiety of the ligand and F331, just as
in the 2ckm structure (23). In the second conformation, F330
has moved away from the aromatic moiety of the ligand, and
the aromatic ring of F331 assumes an unusual conformation.
Group II
This group includes the two mobile residues W279 and F330.
Figs. 1 B and 2 A show that the distribution of the experi-
mental x1/x2 data points for F330 is very broad, clearly
demonstrating an inherent flexibility of its side chain. Use of
the protein structure validation program PROCHECK
(47,48) to examine the allowed x1/x2 conformational angles
reveals that a number of the data sets are clustered in one
favored region. However, in many others, including all the
native structures except 2ace, F330 adopts various unfavored
side-chain conformations (Fig. 2, A and B). The unfavored
side-chain conformations of F330 in the complex and con-
jugate structures can be ascribed to steric restrictions imposed
by the respective ligands or covalently attached groups. But
the cause of F330 adopting unfavored side-chain orientations
in the three native structures, 1qid, 1ea5, and 1w75, was not
immediately apparent. We earlier reported that continuous
electron density observed within the active-site gorge in
certain data sets collected for native TcAChE (49) and for
complexes (50) could be ascribed to the polyethylene glycol
200 (PEG200), which had been used as a precipitant. Careful
reexamination of the electron density maps of the four nativestructures revealed that the three structures in which F330
adopts an unfavored side-chain conformation all contain a
PEG200 molecule bridging the PAS and the CAS, with the
proximal tip of the bound PEG200 pushing the side chain of
F330 into the unfavored position (Fig. 2 C). In the 2ace
structure (Fig. 2 D), no PEG200 molecule can be seen, al-
lowing the F330 side chain to assume a favored orientation.
The 2ace data set was collected at an earlier time than the
others, using a different batch of PEG200. Because PEG200
is a heterogeneous polymer, a difference in composition may
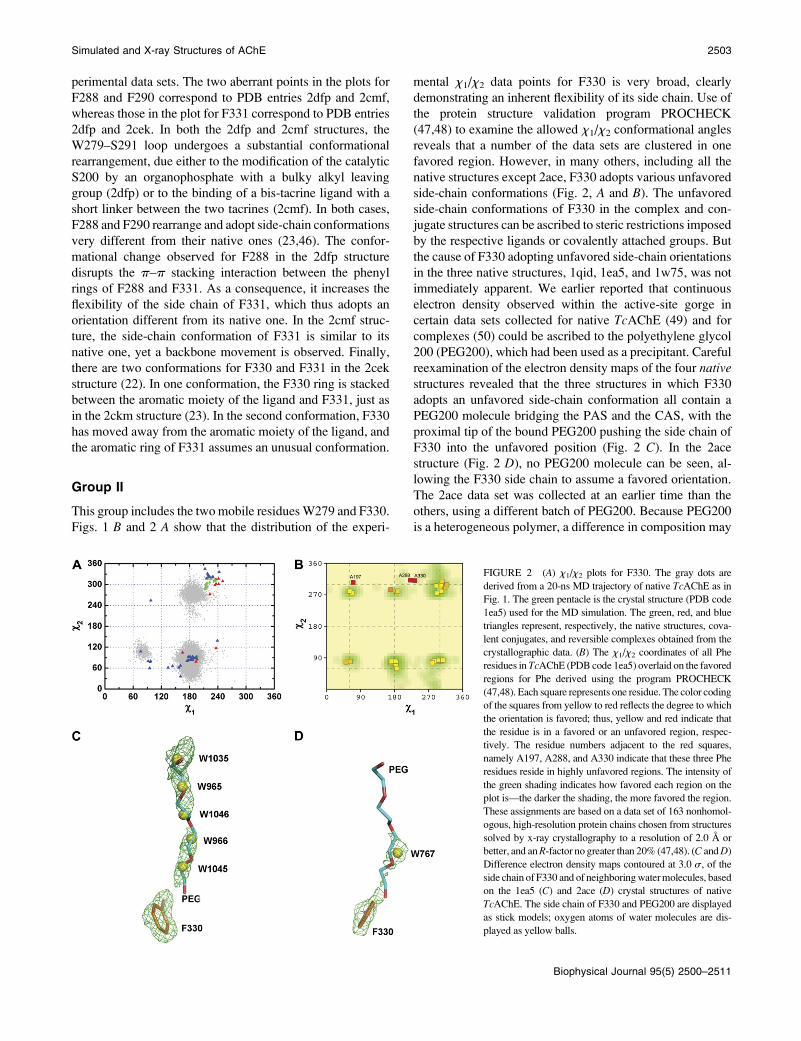
FIGURE 2 (A) x1/x2 plots for F330. The gray dots are
derived from a 20-ns MD trajectory of native TcAChE as in
Fig. 1. The green pentacle is the crystal structure (PDB code
1ea5) used for the MD simulation. The green, red, and blue
triangles represent, respectively, the native structures, cova-
lent conjugates, and reversible complexes obtained from the
crystallographic data. (B) The x1/x2 coordinates of all Phe
residues in TcAChE (PDB code 1ea5) overlaid on the favored
regions for Phe derived using the program PROCHECK
(47,48). Each square represents one residue. The color coding
of the squares from yellow to red reflects the degree to which
the orientation is favored; thus, yellow and red indicate that
the residue is in a favored or an unfavored region, respec-
tively. The residue numbers adjacent to the red squares,
namely A197, A288, and A330 indicate that these three Phe
residues reside in highly unfavored regions. The intensity of
the green shading indicates how favored each region on the
plot is—the darker the shading, the more favored the region.
These assignments are based on a data set of 163 nonhomol-
ogous, high-resolution protein chains chosen from structures
solved by x-ray crystallography to a resolution of 2.0 A or
better, and an R-factor no greater than 20% (47,48). (C and D)
Difference electron density maps contoured at 3.0 s, of the
side chain of F330 and of neighboring water molecules, based
on the 1ea5 (C) and 2ace (D) crystal structures of native
TcAChE. The side chain of F330 and PEG200 are displayed
as stick models; oxygen atoms of water molecules are dis-
played as yellow balls.
Simulated and X-ray Structures of AChE 2503
Biophysical Journal 95(5) 2500–2511

explain the apparent discrepancy with the other native data
sets.
The MD simulation predicts three principal conforma-
tional states for the F330 side chain, also indicating that it is
flexible. However, even though the starting side-chain con-
formation of F330 is unfavored, most of the points sampled
by the MD simulation are located in favored regions. Because
no bound PEG 200 is included in the simulation system, F330
can easily switch its side chain from an unfavored to a fa-
vored conformation. Because many of the experimental data
points are located in unfavored regions, whereas most of the
simulation points are in favored regions, the side-chain
conformations observed for F330 in the MD simulation,
unlike for other residues, do not encompass all the confor-
mational possibilities revealed by the crystal structures.
F330 is situated on an a-helix in the middle of the active-
site gorge and is one of two residues that form the bottleneck
of the gorge. This location permits it to interact with ligands
bound at the CAS and/or at the PAS. The crystal structures of
the various complexes reveal that F330 always adopts an
appropriate side-chain conformation that allows it to make
p–p stacking and/or p-cation interactions with the bound
ligand, resulting in the diverse repertoire of side-chain con-
formations observed. F330 and Y121 form the bottleneck of
the gorge; therefore, changes in the conformations of their
side chains influence its opening and closing. Fig. 1 A shows
that the side-chain conformation of Y121 is quite fixed in all
the crystal structures. This observation implies that it is the
flexibility of the side chain of F330 that permits ligands to
enter or leave the CAS. MD simulations of TcAChE in its
native and complexed/conjugated states do, indeed, show
that F330 is flexible, that the conformational switch of its side
chain can control the opening of the bottleneck, and that it
thus has the capacity to play a key role in both ligand binding
and release (7,15,18,25). Moreover, as discussed above, a
conformational change in F330 may affect the side-chain
orientation of the adjacent residue F331. The side-chain re-
orientation of F331 may, in turn, affect the conformation of
F288, as is seen in the structure of TcAChE complexed with a
bis-tacrine containing a shorter linker (PDB code 2cmf) (23),
also referred to above. Hence, the flexibility of F330 may
induce other residues along the active-site gorge to change
their conformations.
The side-chain conformations of W286 (corresponding to
W279 in TcAChE) in the mAChE structures 1q83, 2gyu and
2gyv were not included in Fig. 1. The x1 and x2 angles of
W286 in those three mAChE structures are, however, in-
cluded with those for W279 in the x1/x2 plot shown in Fig.
3 A. As for F330, the experimental data points for W279 (and
for mouse W286) are quite dispersed. To analyze these
conformations in more detail, the x1 and x2 values obtained
from the crystallographic data were grouped into six cate-
gories on the basis of their orientations (Fig. 3 A) (51). Group
a includes the majority of the crystal structures, including that
of native TcAChE. Group b is the single tacrine/TcAChE data
set (PDB code 1acj) (5). Group c represents the complex of
syn1 TZ2PA6/mAChE (PDB code 1q83) (19). There are two
data points, one for each of the monomers in the dimer in
1q83. Groups d and e include the structures of mAChE
complexed with the oximes HI-6 (PDB code 2gyu) (20) and
Ortho-7 (PDB code 2gyv) (20), respectively. In both these
cases, too, there are separate data points for each monomer in
the dimer, as was the case for 1q83. Group f includes com-
plexes of TcAChE with bis-tacrine derivatives (PDB codes
1odc (23), 2cek (22), and 2ckm (23)). If one side-chain
conformation of W279 is selected from each group and fitted
onto the backbone atoms of the residue, their superposition
(Fig. 3 B) reveals that the six side-chain conformations span
almost all the entire space (0–360�) around the Ca-Cb bond.
Thus, the flexibility of the side chain of W279 is very high. It
is noteworthy that a standard x1,x2 rotamer plot (47,48) of
tryptophan would miss several of these groups, in particular
group f (51).
We selected several representative structures and aligned
each of them with native TcAChE to illustrate how the
conformation of the protein around W279, at the PAS,
changes as a result of ligand binding (Fig. 4). Fig. 4 A shows
the monofunctional inhibitor tacrine bound at the CAS of
TcAChE. The orientation of the side chain of W279 is dif-
ferent from its position in the native data set. Fig. 4 B presents
the inhibitor that had been shown to be synthesized within the
active-site gorge by ‘‘click chemistry’’ (52); as might be
expected, the inhibitor spans the CAS and the PAS of
mAChE. Fig. 4 C shows a bis-tacrine derivative, NF595, with
an 8-carbon spacer, which spans the CAS and the PAS of
TcAChE. Fig. 4 D shows an example of a bifunctional oxime,
FIGURE 3 (A) x1/x2 plot for TcAChE W279 and
mAChE W286. The gray dots are derived from a 20-ns
MD trajectory of native TcAChE as in Fig. 1. The blue
pentacle corresponds to the conformation of W279 in the
crystal structure (PDB code 1ea5) used as a starting model
for the MD simulations. The dark triangles represent all the
crystal structures of TcAChE; the red triangles represent
those of mAChE (PDB codes 1q83, 2gyu, and 2gyv). (B)
The snapshots of W279 (286) (fitted onto the backbone of
the residue) corresponding to the six groups highlighted in
A: (a) 1ea5 (green); (b) 1acj (cyan); (c) 1q83 (magenta); (d)
2gyu (gray); (e) 2gyv (blue); and (f) 2ckm (orange).
2504 Xu et al.
Biophysical Journal 95(5) 2500–2511
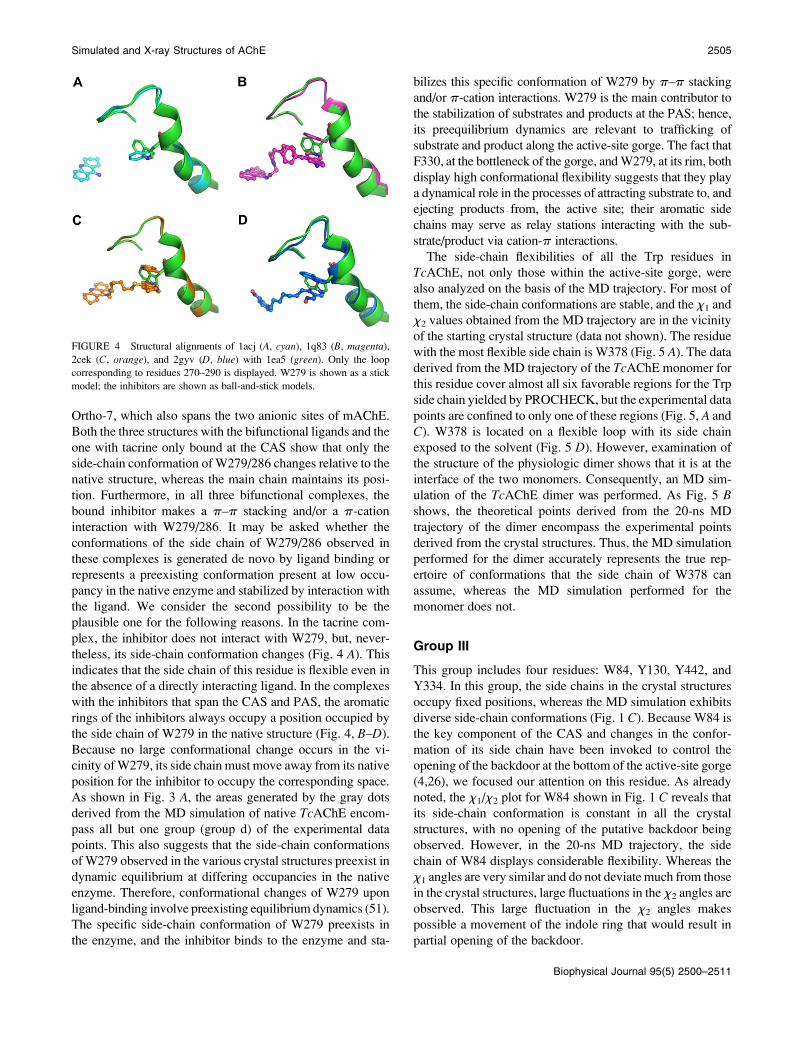
Ortho-7, which also spans the two anionic sites of mAChE.
Both the three structures with the bifunctional ligands and the
one with tacrine only bound at the CAS show that only the
side-chain conformation of W279/286 changes relative to the
native structure, whereas the main chain maintains its posi-
tion. Furthermore, in all three bifunctional complexes, the
bound inhibitor makes a p–p stacking and/or a p-cation
interaction with W279/286. It may be asked whether the
conformations of the side chain of W279/286 observed in
these complexes is generated de novo by ligand binding or
represents a preexisting conformation present at low occu-
pancy in the native enzyme and stabilized by interaction with
the ligand. We consider the second possibility to be the
plausible one for the following reasons. In the tacrine com-
plex, the inhibitor does not interact with W279, but, never-
theless, its side-chain conformation changes (Fig. 4 A). This
indicates that the side chain of this residue is flexible even in
the absence of a directly interacting ligand. In the complexes
with the inhibitors that span the CAS and PAS, the aromatic
rings of the inhibitors always occupy a position occupied by
the side chain of W279 in the native structure (Fig. 4, B–D).
Because no large conformational change occurs in the vi-
cinity of W279, its side chain must move away from its native
position for the inhibitor to occupy the corresponding space.
As shown in Fig. 3 A, the areas generated by the gray dots
derived from the MD simulation of native TcAChE encom-
pass all but one group (group d) of the experimental data
points. This also suggests that the side-chain conformations
of W279 observed in the various crystal structures preexist in
dynamic equilibrium at differing occupancies in the native
enzyme. Therefore, conformational changes of W279 upon
ligand-binding involve preexisting equilibrium dynamics (51).
The specific side-chain conformation of W279 preexists in
the enzyme, and the inhibitor binds to the enzyme and sta-
bilizes this specific conformation of W279 by p–p stacking
and/or p-cation interactions. W279 is the main contributor to
the stabilization of substrates and products at the PAS; hence,
its preequilibrium dynamics are relevant to trafficking of
substrate and product along the active-site gorge. The fact that
F330, at the bottleneck of the gorge, and W279, at its rim, both
display high conformational flexibility suggests that they play
a dynamical role in the processes of attracting substrate to, and
ejecting products from, the active site; their aromatic side
chains may serve as relay stations interacting with the sub-
strate/product via cation-p interactions.
The side-chain flexibilities of all the Trp residues in
TcAChE, not only those within the active-site gorge, were
also analyzed on the basis of the MD trajectory. For most of
them, the side-chain conformations are stable, and the x1 and
x2 values obtained from the MD trajectory are in the vicinity
of the starting crystal structure (data not shown). The residue
with the most flexible side chain is W378 (Fig. 5 A). The data
derived from the MD trajectory of the TcAChE monomer for
this residue cover almost all six favorable regions for the Trp
side chain yielded by PROCHECK, but the experimental data
points are confined to only one of these regions (Fig. 5, A and
C). W378 is located on a flexible loop with its side chain
exposed to the solvent (Fig. 5 D). However, examination of
the structure of the physiologic dimer shows that it is at the
interface of the two monomers. Consequently, an MD sim-
ulation of the TcAChE dimer was performed. As Fig. 5 Bshows, the theoretical points derived from the 20-ns MD
trajectory of the dimer encompass the experimental points
derived from the crystal structures. Thus, the MD simulation
performed for the dimer accurately represents the true rep-
ertoire of conformations that the side chain of W378 can
assume, whereas the MD simulation performed for the
monomer does not.
Group III
This group includes four residues: W84, Y130, Y442, and
Y334. In this group, the side chains in the crystal structures
occupy fixed positions, whereas the MD simulation exhibits
diverse side-chain conformations (Fig. 1 C). Because W84 is
the key component of the CAS and changes in the confor-
mation of its side chain have been invoked to control the
opening of the backdoor at the bottom of the active-site gorge
(4,26), we focused our attention on this residue. As already
noted, the x1/x2 plot for W84 shown in Fig. 1 C reveals that
its side-chain conformation is constant in all the crystal
structures, with no opening of the putative backdoor being
observed. However, in the 20-ns MD trajectory, the side
chain of W84 displays considerable flexibility. Whereas the
x1 angles are very similar and do not deviate much from those
in the crystal structures, large fluctuations in the x2 angles are
observed. This large fluctuation in the x2 angles makes
possible a movement of the indole ring that would result in
partial opening of the backdoor.
FIGURE 4 Structural alignments of 1acj (A, cyan), 1q83 (B, magenta),
2cek (C, orange), and 2gyv (D, blue) with 1ea5 (green). Only the loop
corresponding to residues 270–290 is displayed. W279 is shown as a stick
model; the inhibitors are shown as ball-and-stick models.
Simulated and X-ray Structures of AChE 2505
Biophysical Journal 95(5) 2500–2511
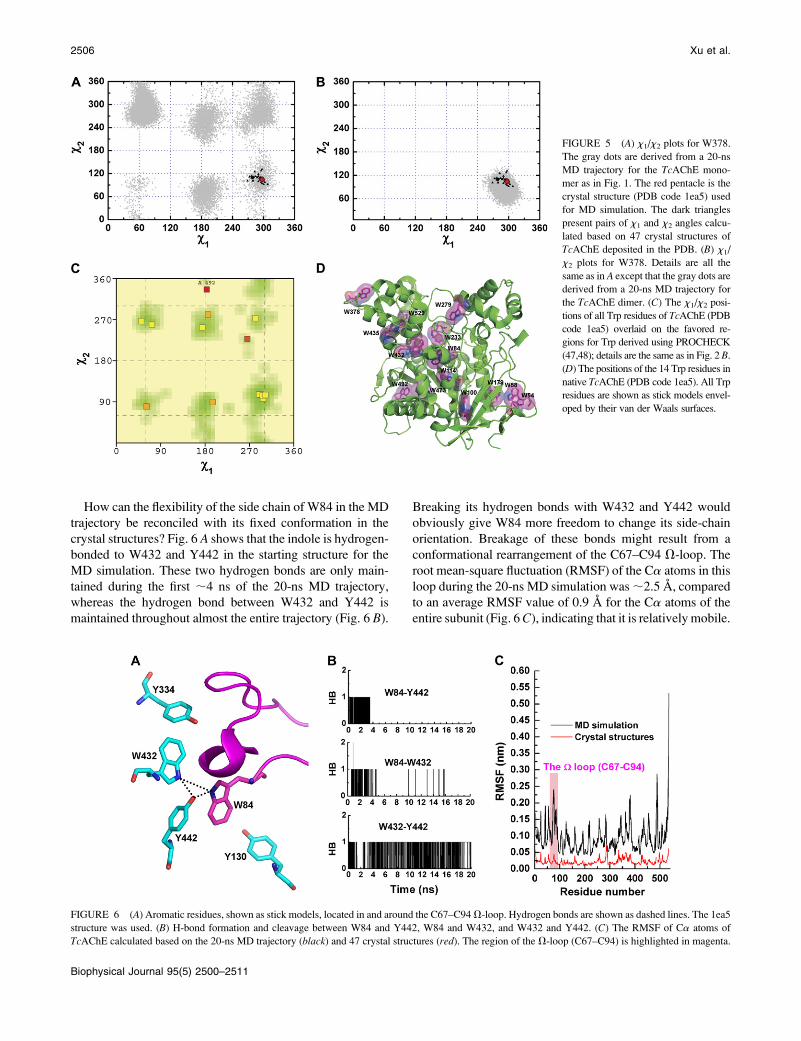
How can the flexibility of the side chain of W84 in the MD
trajectory be reconciled with its fixed conformation in the
crystal structures? Fig. 6 A shows that the indole is hydrogen-
bonded to W432 and Y442 in the starting structure for the
MD simulation. These two hydrogen bonds are only main-
tained during the first ;4 ns of the 20-ns MD trajectory,
whereas the hydrogen bond between W432 and Y442 is
maintained throughout almost the entire trajectory (Fig. 6 B).
Breaking its hydrogen bonds with W432 and Y442 would
obviously give W84 more freedom to change its side-chain
orientation. Breakage of these bonds might result from a
conformational rearrangement of the C67–C94 V-loop. The
root mean-square fluctuation (RMSF) of the Ca atoms in this
loop during the 20-ns MD simulation was ;2.5 A, compared
to an average RMSF value of 0.9 A for the Ca atoms of the
entire subunit (Fig. 6 C), indicating that it is relatively mobile.
FIGURE 5 (A) x1/x2 plots for W378.
The gray dots are derived from a 20-ns
MD trajectory for the TcAChE mono-
mer as in Fig. 1. The red pentacle is the
crystal structure (PDB code 1ea5) used
for MD simulation. The dark triangles
present pairs of x1 and x2 angles calcu-
lated based on 47 crystal structures of
TcAChE deposited in the PDB. (B) x1/
x2 plots for W378. Details are all the
same as in A except that the gray dots are
derived from a 20-ns MD trajectory for
the TcAChE dimer. (C) The x1/x2 posi-
tions of all Trp residues of TcAChE (PDB
code 1ea5) overlaid on the favored re-
gions for Trp derived using PROCHECK
(47,48); details are the same as in Fig. 2 B.
(D) The positions of the 14 Trp residues in
native TcAChE (PDB code 1ea5). All Trp
residues are shown as stick models envel-
oped by their van der Waals surfaces.
FIGURE 6 (A) Aromatic residues, shown as stick models, located in and around the C67–C94 V-loop. Hydrogen bonds are shown as dashed lines. The 1ea5
structure was used. (B) H-bond formation and cleavage between W84 and Y442, W84 and W432, and W432 and Y442. (C) The RMSF of Ca atoms of
TcAChE calculated based on the 20-ns MD trajectory (black) and 47 crystal structures (red). The region of the V-loop (C67–C94) is highlighted in magenta.
2506 Xu et al.
Biophysical Journal 95(5) 2500–2511
Such large movements of the V-loop would not only cause
W84 to adopt different side-chain orientations but might af-
fect the side-chain conformations of the other four aromatic
residues with which it is interacting, namely Y130, Y334,
W432, and Y442. However, in all the crystal structures, not
only the side-chain of W84, but also the conformation of the
entire V-loop is quite fixed. This is because the RMSF of its
Ca atoms for the 47 TcAChE crystal structures is 0.2 A, the
same value as obtained for the whole polypeptide (Fig. 6 C).
We considered the possibility that this might be due to
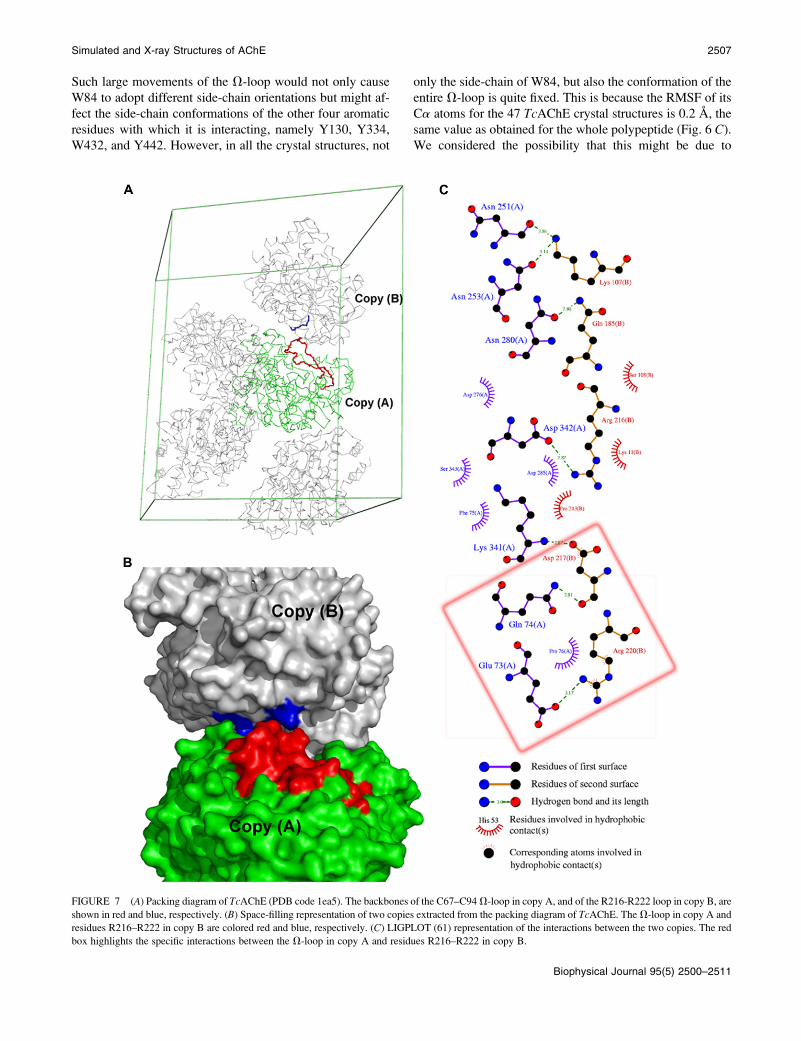
FIGURE 7 (A) Packing diagram of TcAChE (PDB code 1ea5). The backbones of the C67–C94 V-loop in copy A, and of the R216-R222 loop in copy B, are
shown in red and blue, respectively. (B) Space-filling representation of two copies extracted from the packing diagram of TcAChE. The V-loop in copy A and
residues R216–R222 in copy B are colored red and blue, respectively. (C) LIGPLOT (61) representation of the interactions between the two copies. The red
box highlights the specific interactions between the V-loop in copy A and residues R216–R222 in copy B.
Simulated and X-ray Structures of AChE 2507
Biophysical Journal 95(5) 2500–2511
restraints imposed by crystal packing. Native TcAChE crys-
tallizes in three space groups; there are actually 42 data sets in
P3121, 3 data sets in P212121, and a single data set in P3221.
In all three, the V-loop is in contact with a symmetry-related
copy of the enzyme. In the complex of TcAChE with the
snake venom toxin fasciculin II (PDB code 1fss), which
crystallizes in space group P21212, the V-loop interacts with
the toxin. Fig. 7 shows how, in the 1ea5 crystal structure,
which is in the P3121 space group, the V-loop in one copy
interacts with the R216-R220 loop in one of the symmetry-
related copies. E73 in copy A forms a salt bridge with R220
in copy B; Q74 in copy A forms a hydrogen bond to D217 in
copy B; and P76 in copy A makes hydrophobic interactions
with R220 in copy B (Fig. 7 C). These interactions, all of
which help stabilize the conformation of the V-loop in the
crystal structures, were not taken into account in the MD
simulations because only one copy of the enzyme was used.
Thus, in solution, the V-loop may be quite flexible, as may be
the side chains of W84 and those of Y130, Y334, W432, and
Y442. Indeed, using site-directed labeling in conjunction
with time-resolved fluorescence anisotropy, Shi et al. (53)
reported that the V-loop residues are significantly more
mobile than nonloop residues facing the interior of the gorge,
and so they are likely to contribute to transient gorge en-
largements in the nonliganded enzyme.
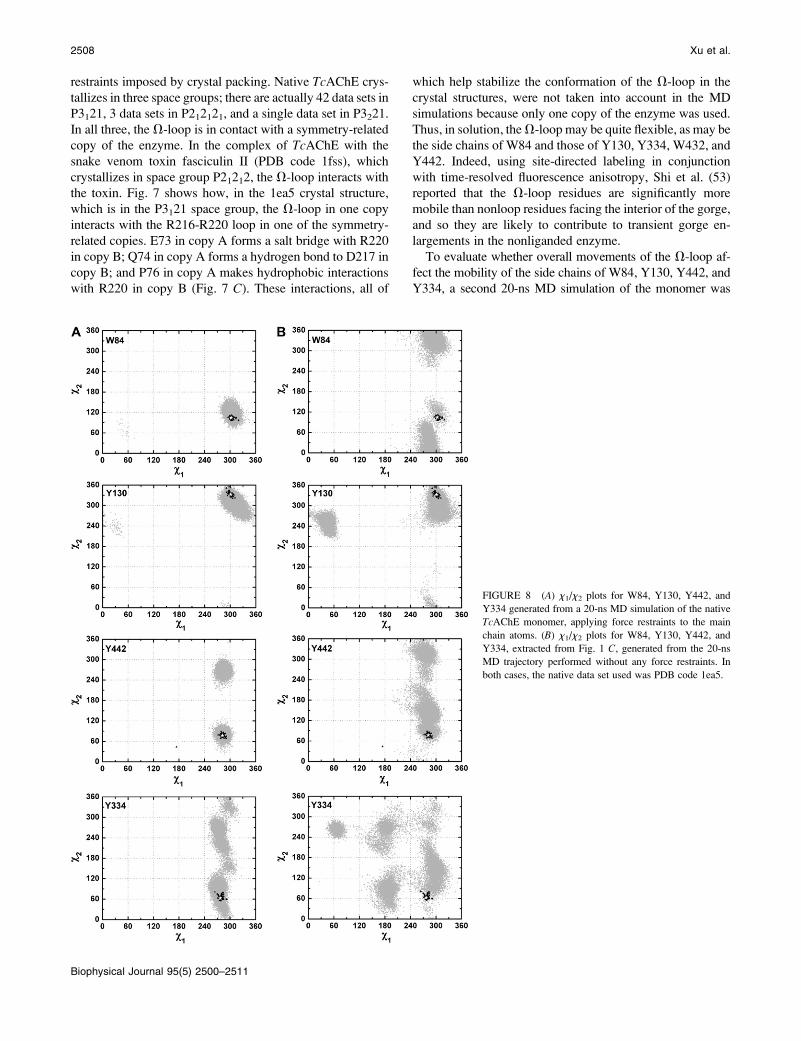
To evaluate whether overall movements of the V-loop af-
fect the mobility of the side chains of W84, Y130, Y442, and
Y334, a second 20-ns MD simulation of the monomer was
FIGURE 8 (A) x1/x2 plots for W84, Y130, Y442, and
Y334 generated from a 20-ns MD simulation of the native
TcAChE monomer, applying force restraints to the main
chain atoms. (B) x1/x2 plots for W84, Y130, Y442, and
Y334, extracted from Fig. 1 C, generated from the 20-ns
MD trajectory performed without any force restraints. In
both cases, the native data set used was PDB code 1ea5.
2508 Xu et al.
Biophysical Journal 95(5) 2500–2511
performed. This time, the simulation was performed with the
application of force restraints to the main-chain atoms. The
x1/x2 plots for these four residues obtained using this trajec-
tory are shown in Fig. 8 A. Clearly, the observed side-chain
conformations of W84 are more restricted than when the main
chain is not restrained (Figs. 1 and 8 B), and they agree well
with the crystallographic data. The side-chain flexibility of the
other three residues is also substantially reduced under the new
simulation conditions (Fig. 8). Therefore, the discrepancies in
side-chain flexibility of the residues in group III revealed by
the MD simulation and by the crystal structures can be prin-
cipally ascribed to the restricted mobility of the V-loop in the
crystal structures due to the effects of crystal packing.
We were curious to know if there were significant corre-
lations between conformational switches from one side-chain
conformation to another. Accordingly, we performed principal
component analysis (54) based on the coordinates of all 14
aromatic side chains, which were generated by the MD sim-
ulation with 1-ps intervals. Analysis of these results showed no
evident correlation between side-chain flexibilities.
CONCLUSIONS
The x1 and x2 analysis of side-chain conformations, based on
the ensemble of crystal structures and on the MD trajectories,
permits classification of the 14 conserved aromatic residues
in the active-site gorge of TcAChE into three groups. F120,
W233, W432, Y70, Y121, F331, F288, and F290 fall into
group I, which is the category of residues with fixed side-
chain conformations. In contrast, the experimental and the
MD data show that the side chains of F330 and W279 (group
II) are very flexible. For F330, certain alternate conforma-
tions can be ascribed to interactions with the ligands. How-
ever, the alternative conformations observed in some native
data sets appear to be due to the presence of the precipitant
PEG200 in the active-site gorge. The side chains of W84,
Y130, Y442, and Y334 (group III) display fixed side-chain
conformations in the crystal structures, but they appear to be
quite mobile in the MD simulations. This apparent discrep-
ancy can be ascribed to crystal packing restraints.
The mobility of W279 revealed by the MD simulations,
taken together with the crystallographic data, suggest that it
may occur in a repertoire of conformations, with varying
degrees of occupancies in the native enzyme, and that a given
ligand may select one of these preexisting conformations
preferentially. AChE has been shown to accelerate aggre-
gation of the Ab peptide, a process thought to be intimately
involved with the progression of Alzheimer disease (55,56);
this acceleration appears to involve the PAS, of which W279
is the key element (57,58). Many second-generation cholin-
esterase inhibitors for the treatment of Alzheimer disease are
thus compounds that span the CAS and PAS (23,59,60).
Structure-based drug design in this context, therefore, should
explore the landscape of conformations revealed by MD
simulations and not be confined to docking to a single av-
erage native structure. This concept should be of general
applicability to structure-based drug design.
This work was supported by the Commissariat a l’Energie Atomique, Centre
National de la Recherche Scientifique, Universite Joseph Fourier, National
Institutes of Health CounterACT program, U.S. Army Defense Threat
Reduction Agency, the European Commission Sixth Framework Research
and Technological Development Program ‘SPINE2-COMPLEXES’ Project,
under contract No. LSHG-CT-2006-031220, and ‘Teach-SG’ Project, under
contract No. ISSG-CT-2007-037198, Nalvyco Foundation, and Kimmelman
Center for Biomolecular Structure and Assembly. M.W. was supported by
a grant from the Agence Nationale de la Recherche (project number
JC05_45685). J.P.C. was supported by an EMBO short-term fellowship
(ASTF230-2006). I.S. was supported by the Benoziyo Center for Neuroscience.
J.L.S. is the Pickman Professor of Structural Biology.
REFERENCES
1. Rosenberry, T. L. 1975. Acetylcholinesterase. Adv. Enzymol. Relat.Areas Mol. Biol. 43:103–218.
2. Silman, I., and J. L. Sussman. 2005. Acetylcholinesterase: ‘classical’and ‘non-classical’ functions and pharmacology. Curr. Opin. Pharma-col. 5:293–302.
3. Sussman, J. L., M. Harel, F. Frolow, C. Oefner, A. Goldman, L. Toker,and I. Silman. 1991. Atomic structure of acetylcholinesterase fromTorpedo californica: a prototypic acetylcholine-binding protein. Sci-ence. 253:872–879.
4. Gilson, M. K., T. P. Straatsma, J. A. McCammon, D. R. Ripoll, C. H.Faerman, P. H. Axelsen, I. Silman, and J. L. Sussman. 1994. Open‘‘back door’’ in a molecular dynamics simulation of acetylcholines-terase. Science. 263:1276–1278.
5. Harel, M., I. Schalk, L. Ehret-Sabatier, F. Bouet, M. Goeldner, C.Hirth, P. H. Axelsen, I. Silman, and J. L. Sussman. 1993. Quaternaryligand binding to aromatic residues in the active-site gorge of acetyl-cholinesterase. Proc. Natl. Acad. Sci. USA. 90:9031–9035.
6. Harel, M., D. M. Quinn, H. K. Nair, I. Silman, and J. L. Sussman.1996. The X-ray structure of a transition state analog complex revealsthe molecular origins of the catalytic power and substrate specificity ofacetylcholinesterase. J. Am. Chem. Soc. 118:2340–2346.
7. Colletier, J. P., D. Fournier, H. M. Greenblatt, J. Stojan, J. L. Sussman,G. Zaccai, I. Silman, and M. Weik. 2006. Structural insights into substratetraffic and inhibition in acetylcholinesterase. EMBO J. 25:2746–2756.
8. Bourne, Y., Z. Radic, G. Sulzenbacher, E. Kim, P. Taylor, andP. Marchot. 2006. Substrate and product trafficking through the activecenter gorge of acetylcholinesterase analyzed by crystallography andequilibrium binding. J. Biol. Chem. 281:29256–29267.
9. Szegletes, T., W. D. Mallender, and T. L. Rosenberry. 1998. Non-equilibrium analysis alters the mechanistic interpretation of inhibitionof acetylcholinesterase by peripheral site ligands. Biochemistry. 37:4206–4216.
10. Szegletes, T., W. D. Mallender, P. J. Thomas, and T. L. Rosenberry.1999. Substrate binding to the peripheral site of acetylcholinesteraseinitiates enzymatic catalysis. Substrate inhibition arises as a secondaryeffect. Biochemistry. 38:122–133.
11. Johnson, J. L., B. Cusack, M. P. Davies, A. Fauq, and T. L.Rosenberry. 2003. Unmasking tandem site interaction in human ace-tylcholinesterase. Substrate activation with a cationic acetanilide sub-strate. Biochemistry. 42:5438–5452.
12. Morel, N., S. Bon, H. M. Greenblatt, D. Van Belle, S. J. Wodak, J. L.Sussman, J. Massoulie, and I. Silman. 1999. Effect of mutations withinthe peripheral anionic site on the stability of acetylcholinesterase. Mol.Pharmacol. 55:982–992.
13. Harel, M., J. L. Sussman, E. Krejci, S. Bon, P. Chanal, J. Massoulie,and I. Silman. 1992. Conversion of acetylcholinesterase to butyrylcho-linesterase: modeling and mutagenesis. Proc. Natl. Acad. Sci. USA. 89:10827–10831.
Simulated and X-ray Structures of AChE 2509
Biophysical Journal 95(5) 2500–2511
14. Botti, S. A., C. E. Felder, S. Lifson, J. L. Sussman, and I. Silman. 1999.A modular treatment of molecular traffic through the active site ofcholinesterase. Biophys. J. 77:2430–2450.
15. Xu, Y., J. Shen, X. Luo, I. Silman, J. L. Sussman, K. Chen, and H.Jiang. 2003. How does huperzine A enter and leave the binding gorgeof acetylcholinesterase? Steered molecular dynamics simulations. J. Am.Chem. Soc. 125:11340–11349.
16. Kryger, G., I. Silman, and J. L. Sussman. 1999. Structure of acetyl-cholinesterase complexed with E2020 (Aricept): implications for thedesign of new anti-Alzheimer drugs. Structure. 7:297–307.
17. Greenblatt, H. M., H. Dvir, I. Silman, and J. L. Sussman. 2003.Acetylcholinesterase: a multifaceted target for structure-based drugdesign of anticholinesterase agents for the treatment of Alzheimer’sdisease. J. Mol. Neurosci. 20:369–383.
18. Niu, C., Y. Xu, X. Luo, W. Duan, I. Silman, J. L. Sussman, W. Zhu, K.Chen, J. Shen, and H. Jiang. 2005. Dynamic mechanism of E2020binding to acetylcholinesterase: a steered molecular dynamics simula-tion. J. Phys. Chem. B. 109:23730–23738.
19. Bourne, Y., H. C. Kolb, Z. Radic, K. B. Sharpless, P. Taylor, and P.Marchot. 2004. Freeze-frame inhibitor captures acetylcholinesterase ina unique conformation. Proc. Natl. Acad. Sci. USA. 101:1449–1454.
20. Ekstrom, F., Y. P. Pang, M. Boman, E. Artursson, C. Akfur, and S.Borjegren. 2006. Crystal structures of acetylcholinesterase in complexwith HI-6, Ortho-7 and obidoxime: structural basis for differences inthe ability to reactivate tabun conjugates. Biochem. Pharmacol. 72:597–607.
21. Wong, D. M., H. M. Greenblatt, H. Dvir, P. R. Carlier, Y. F. Han,Y. P. Pang, I. Silman, and J. L. Sussman. 2003. Acetylcholinesterasecomplexed with bivalent ligands related to Huperzine A: experimentalevidence for species-dependent protein-ligand complementarity. J. Am.Chem. Soc. 125:363–373.
22. Colletier, J. P., B. Sanson, F. Nachon, E. Gabellieri, C. Fattorusso, G.Campiani, and M. Weik. 2006. Conformational flexibility in theperipheral site of Torpedo californica acetylcholinesterase revealedby the complex structure with a bifunctional inhibitor. J. Am. Chem.Soc. 128:4526–4527.
23. Rydberg, E. H., B. Brumshtein, H. M. Greenblatt, D. M. Wong, D.Shaya, L. D. Williams, P. R. Carlier, Y. P. Pang, I. Silman, and J. L.Sussman. 2006. Complexes of alkylene-linked tacrine dimers withTorpedo californica acetylcholinesterase: binding of bis5-tacrine pro-duces a dramatic rearrangement in the active-site gorge. J. Med. Chem.49:5491–5500.
24. Tai, K., T. Shen, U. Borjesson, M. Philippopoulos, and J. A.McCammon. 2001. Analysis of a 10-ns molecular dynamics simulationof mouse acetylcholinesterase. Biophys. J. 81:715–724.
25. Shen, T., K. Tai, R. H. Henchman, and J. A. McCammon. 2002. Moleculardynamics of acetylcholinesterase. Acc. Chem. Res. 35:332–340.
26. Axelsen, P. H., M. Harel, I. Silman, and J. L. Sussman. 1994. Structureand dynamics of the active site gorge of acetylcholinesterase: syner-gistic use of molecular dynamics simulation and X-ray crystallography.Protein Sci. 3:188–197.
27. Kovach, I. M., N. Qian, and A. Bencsura. 1994. Efficient productclearance through exit channels in substrate hydrolysis by acetylcho-linesterase. FEBS Lett. 349:60–64.
28. Wlodek, S. T., T. W. Clark, L. R. Scott, and J. A. McCammon. 1997.Molecular dynamics of acetylcholinesterase dimer complexed withtacrine. J. Am. Chem. Soc. 119:9513–9522.
29. Van Belle, D., L. De Maria, G. Iurcu, and S. J. Wodak. 2000. Pathwaysof ligand clearance in acetylcholinesterase by multiple copy sampling.J. Mol. Biol. 298:705–726.
30. Harel, M., G. Kryger, T. L. Rosenberry, W. D. Mallender, T. Lewis,R. J. Fletcher, J. M. Guss, I. Silman, and J. L. Sussman. 2000. Three-dimensional structures of Drosophila melanogaster acetylcholinesteraseand of its complexes with two potent inhibitors. Protein Sci. 9:1063–1072.
31. Nachon, F., Y. Nicolet, M. Harel, T. L. Rosenberry, P. Masson, I.Silman, and J. L. Sussman. 2007. A second look at the crystalstructures of Drosophila melanogaster acetylcholinesterase: evidence
for backdoor opening and stabilization of an enzyme/carboxylatecomplex. Abstract. IXth International Meeting on Cholinesterase,Suzhou, China. p 113.
32. Bartolucci, C., E. Perola, L. Cellai, M. Brufani, and D. Lamba. 1999.‘‘Back door’’ opening implied by the crystal structure of a carbamoy-lated acetylcholinesterase. Biochemistry. 38:5714–5719.
33. Colletier, J. P., A. Royant, A. Specht, B. Sanson, F. Nachon, P.Masson, G. Zaccai, J. L. Sussman, M. Goeldner, I. Silman, D.Bourgeois, and M. Weik. 2007. Use of a ‘caged’ analogue to studythe traffic of choline within acetylcholinesterase by kinetic crystallog-raphy. Acta Crystallogr. D Biol. Crystallogr. 63:1115–1128.
34. Kronman, C., A. Ordentlich, D. Barak, B. Velan, and A. Shafferman.1994. The ‘‘back door’’ hypothesis for product clearance in acetyl-cholinesterase challenged by site-directed mutagenesis. J. Biol. Chem.269:27819–27822.
35. Faerman, C., D. Ripoll, S. Bon, Y. Le Feuvre, N. Morel, J. Massoulie,J. L. Sussman, and I. Silman. 1996. Site-directed mutants designed totest back-door hypotheses of acetylcholinesterase function. FEBS Lett.386:65–71.
36. Dooley, A. J., N. Shindo, B. Taggart, J. G. Park, and Y. P. Pang. 2006.From genome to drug lead: identification of a small-molecule inhibitorof the SARS virus. Bioorg. Med. Chem. Lett. 16:830–833.
37. Berendsen, H. J. C., J. P. M. Postma, W. F. van Gunsteren, and J.Hermans. 1981. Interaction models for water in relation to proteinhydration. In Intermolecular Forces. Pullman B, editor. Reidel Pub-lishing, Dordrecht (Holland). p 331–342.
38. Berendsen, H. J. C., D. van der Spoel, and R. van Drunen. 1995.GROMACS: A message-passing parallel molecular dynamics imple-mentation. Comput. Phys. Commun. 91:43–56.
39. Lindahl, E., B. Hess, and D. van der Spoel. 2001. Gromacs 3.0: Apackage for molecular simulation and trajectory analysis. J. Mol.Model. 7:306–317.
40. van Gunsteren, W. F., S. R. Billeter, A. A. Eising, P. H. Hunenberger,P. Kruger, A. E. Mark, W. R. P. Scott, and I. G. Tironi. 1996.Biomolecular Simulations: The GROMOS96 Manual and User Guide.vdf Hochschulverlag, Zurich.
41. Berendsen, H. J. C., J. P. M. Postma, W. F. van Gunsteren, A. DiNola,and J. R. Haak. 1984. Molecular dynamics with coupling to an externalbath. J. Chem. Phys. 81:3684–3690.
42. Hess, B., B. Bekker, H. J. C. Berendsen, and J. G. E. M. Fraaije. 1997.LINCS: a linear constraint solver for molecular simulations. J. Comput.Chem. 18:1463–1472.
43. Darden, T., D. York, and L. Pedersen. 1993. Particle mesh Ewald: anNlog(N) method for Ewald sums in large systems. J. Chem. Phys. 98:10089–10092.
44. Essmann, U., L. Perera, M. L. Berkowitz, T. Darden, H. Lee, and L. G.Pedersen. 1995. A smooth particle mesh Ewald potential. J. Chem.Phys. 103:8577–8592.
45. Weik, M., R. B. Ravelli, G. Kryger, S. McSweeney, M. L. Raves, M.Harel, P. Gros, I. Silman, J. Kroon, and J. L. Sussman. 2000. Specificchemical and structural damage to proteins produced by synchrotronradiation. Proc. Natl. Acad. Sci. USA. 97:623–628.
46. Millard, C. B., G. Kryger, A. Ordentlich, H. M. Greenblatt, M. Harel,M. L. Raves, Y. Segall, D. Barak, A. Shafferman, I. Silman, and J. L.Sussman. 1999. Crystal structures of aged phosphonylated acetylcho-linesterase: nerve agent reaction products at the atomic level. Bio-chemistry. 38:7032–7039.
47. Laskowski, R. A., M. W. MacArthur, D. S. Moss, and J. M. Thornton.1993. PROCHECK: a program to check the stereochemical quality ofprotein structures. J. Appl. Cryst. 26:283–291.
48. Morris, A. L., M. W. MacArthur, E. G. Hutchinson, and J. M.Thornton. 1992. Stereochemical quality of protein structure coordi-nates. Proteins. 12:345–364.
49. Koellner, G., T. Steiner, C. B. Millard, I. Silman, and J. L. Sussman.2002. A neutral molecule in a cation-binding site: specific binding of aPEG-SH to acetylcholinesterase from Torpedo californica. J. Mol.Biol. 320:721–725.
2510 Xu et al.
Biophysical Journal 95(5) 2500–2511
50. Greenblatt, H. M., G. Kryger, T. Lewis, I. Silman, and J. L. Sussman.1999. Structure of acetylcholinesterase complexed with (-)-galantha-mine at 2.3 A resolution. FEBS Lett. 463:321–326.
51. Xu, Y., J. P. Colletier, H. Jiang, I. Silman, J. L. Sussman, and M. Weik.2008. Induced-fit or preexisting equilibrium dynamics? Lessons fromprotein crystallography and MD simulations on acetylcholinesterase andimplications for structure-based drug design. Protein Sci. 17:601–605.
52. Lewis, W. G., L. G. Green, F. Grynszpan, Z. Radic, P. R. Carlier, P.Taylor, M. G. Finn, and K. B. Sharpless. 2002. Click chemistry in situ:acetylcholinesterase as a reaction vessel for the selective assembly of afemtomolar inhibitor from an array of building blocks. Angew. Chem.Int. Ed. Engl. 41:1053–1057.
53. Shi, J., K. Tai, J. A. McCammon, P. Taylor, and D. A. Johnson. 2003.Nanosecond dynamics of the mouse acetylcholinesterase cys69-cys96omega loop. J. Biol. Chem. 278:30905–30911.
54. Amadei, A., A. B. Linssen, and H. J. Berendsen. 1993. Essentialdynamics of proteins. Proteins. 17:412–425.
55. Inestrosa, N. C., A. Alvarez, C. A. Perez, R. D. Moreno, M. Vicente, C.Linker, O. I. Casanueva, C. Soto, and J. Garrido. 1996. Acetylcholin-esterase accelerates assembly of amyloid-beta-peptides into Alz-heimer’s fibrils: possible role of the peripheral site of the enzyme.Neuron. 16:881–891.
56. Bartolini, M., C. Bertucci, V. Cavrini, and V. Andrisano. 2003.b-Amyloid aggregation induced by human acetylcholinesterase: inhibi-tion studies. Biochem. Pharmacol. 65:407–416.
57. Eichler, J., A. Anselmet, J. L. Sussman, J. Massoulie, and I. Silman.1994. Differential effects of ‘‘peripheral’’ site ligands on Torpedo andchicken acetylcholinesterase. Mol. Pharmacol. 45:335–340.
58. Radic, Z., R. Duran, D. C. Vellom, Y. Li, C. Cervenansky, and P.Taylor. 1994. Site of fasciculin interaction with acetylcholinesterase.J. Biol. Chem. 269:11233–11239.
59. Bolognesi, M. L., R. Banzi, M. Bartolini, A. Cavalli, A. Tarozzi, V.Andrisano, A. Minarini, M. Rosini, V. Tumiatti, C. Bergamini, R. Fato,G. Lenaz, P. Hrelia, A. Cattaneo, M. Recanatini, and C. Melchiorre.2007. Novel class of quinone-bearing polyamines as multi-target-directed ligands to combat Alzheimer’s disease. J. Med. Chem. 50:4882–4897.
60. He, X. C., S. Feng, Z. F. Wang, Y. Shi, S. Zheng, Y. Xia, H. Jiang,X. C. Tang, and D. Bai. 2007. Study on dual-site inhibitors ofacetylcholinesterase: Highly potent derivatives of bis- and bifunctionalhuperzine B. Bioorg. Med. Chem. 15:1394–1408.
61. Wallace, A. C., R. A. Laskowski, and J. M. Thornton. 1995.LIGPLOT: a program to generate schematic diagrams of protein-ligandinteractions. Protein Eng. 8:127–134.
Simulated and X-ray Structures of AChE 2511
Biophysical Journal 95(5) 2500–2511


![13C]-Labeled Aromatic Residues as a Means to Improving](https://img.pdfslide.net/doc/110x75/61e47ecfea0d7b53be7292cc/13c-labeled-aromatic-residues-as-a-means-to-improving-.jpg)