Embed Size (px)
Citation preview

University of South FloridaScholar Commons
FMHI Publications Louis de la Parte Florida Mental Health Institute(FMHI)
1-1-1986
Flood hazard management in government and theprivate sector: Proceedings of the Ninth AnnualConference of the Association of State FloodplainManagers, April 29-May 3, 1985Association of State Floodplain Managers
Follow this and additional works at: http://scholarcommons.usf.edu/fmhi_pubPart of the Mental and Social Health Commons
This Conference Proceeding is brought to you for free and open access by the Louis de la Parte Florida Mental Health Institute (FMHI) at ScholarCommons. It has been accepted for inclusion in FMHI Publications by an authorized administrator of Scholar Commons. For more information, pleasecontact [email protected].
Scholar Commons CitationAssociation of State Floodplain Managers, "Flood hazard management in government and the private sector: Proceedings of the NinthAnnual Conference of the Association of State Floodplain Managers, April 29-May 3, 1985" (1986). FMHI Publications. Paper 89.http://scholarcommons.usf.edu/fmhi_pub/89
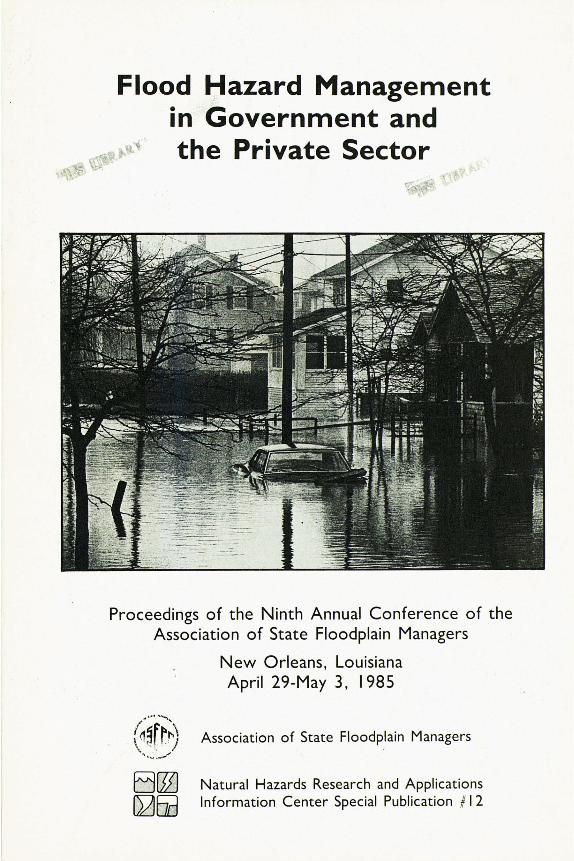
Flood Hazard Management in Government and the Private Sector
Proceedings of the Ninth Annual Conference of the Association of State Floodplain Managers
New Orleans, Louisiana April 29-May 3, 1985
Association of State Floodplain Managers
Natural Hazards Research and Applications Information Center Special Publication # I 2

Flood Hazard Management in Government and the Private Sector
Proceedings of the Ninth Annual Conference of the
Association of State Floodplain Managers
April 29-May 3, 1985 New Orleans, Louisiana
The opinions contained herein are those of the authors and do not necessarily represent those of the funding or sponsoring agencies or organizations, or those of the Association of State Floodplain Managers.
Cover photo: Scituate, Massachusetts in January of 1979 by John Goldie III
Available from: The Natural Hazards Research and Applications Information Center
Campus Box 482 University of Colorado Boulder, CO 80309
or The Association of State Floodplain Managers
P.O. Box 2051 Madison, WI 53701
PREFACE
"Flood Hazard Management in Government and the Private Sector--Where Are
We?" was the theme of the Ninth Annual Conference of the Association of State
Floodplain Managers, held in New Orleans in May of 1985. Flood hazards
reviewed included riverine, coastal, alluvial channels, ice jams, and various
human-caused problems. Activities to manage those hazards involve mapping,
regulation, mitigation, warning systems, and public education. The private
sector was represented by consultants, developers, the insurance industry, the
news media, financial institutions, and the legal profession.
The conference provided an excellent opportunity to learn of the latest
developments in flood hazard management. These proceedings contain information
that will be most helpful in continuing governmental and private efforts to prevent and reduce flood damages. For those unable to attend the conference,
and even for those who were there, this volume will be a valuable reference
work. The Association of State Floodplain Managers hosts a national technical
conference annually. and sponsors other smaller meetings throughout the year.
Through these meetings and our other activities--designing training programs,
conducting research, a bi-monthly newsletter, and technical committee
projects--we strive to provide our members and anyone interested in managing
flood hazard areas with the latest, most useful information.
French Wetmore, Chair
Association of State Floodplain Managers

This page
. IS
intentionally blank
ACKNOWLEDGEMENTS
These proceedings are published by the Natural Hazards Research and Applications Information Center, at the University of Colorado, with principal
funding from the U.S. Army Corps of Engineers. The Association of State
Floodplain Managers thanks William Donovan of the Corps and William Riebsame of the Center. Thanks are also extended to Susan Tubbesing, David Butler, and Sarah Nathe, all of the Center, who worked with everyone from start to finish to make the conversion from conference to proceedings smooth.
Our special thanks to Secretary Dorothy Taylor of the Louisiana Department of Urban and Community Affairs and to Wes Steiner of the Arizona Department of Water Resources for allowing our schedules to shift to meet conference deadlines. Susan Kelly, Dan Hawkins, and Ed Koch of the Louisiana Floodplain
Management Section did an outstanding job of planning and handling the multitude of small but essential details of a national conference. We especially want to thank Jake Mullican and the Louisiana Floodplain Management Association for their contributions to, and participation in, the conference.
Of course, the speakers make the conference, and those at the New Orleans meeting did an excellent job of preparation and presentation. The Association
extends warm thanks to all of them and their employers.
Many other individuals and organizations provided ideas, time, and money
to ensure the success of the conference, and they are remembered with gratitude if not specifically mentioned here.
Bob Cox, Conference Chair Louisiana Department of Urban
and Community Affairs
Les Bond, Program Chair Arizona Department of Water
Resources

This page
. IS
intentionally blank

TABLE OF CONTENTS
List of Speakers and Panelists ...
KEYNOTE ADDRESS
Trends in Floodplain Management John M. Tettemer . . . .
PART ONE: ASPECTS OF FLOOD HAZARD REDUCTION
Status of Floodplain Management Among Federal Agencies Frank H. Thomas ............. .
Status of State Flood Hazard Management Programs Larry A. Larson . . . . . . . . . .
Status of Local Programs in Flood Hazard Reduction Raymond J. Burby .......... .
I. Training, Assistance, and Information Programs
The Connecticut Coastal Homeowners' Flood Preparedness Program
Alan M. Levere
Training and Educational Programs of the Arizona Floodplain Management Association
David A. Smutzer ......... .
Effectiveness of Public Information Programs During 1983 Colorado River Flooding
Julian F. Rhinehart ......... .
Wisconsin's Board of Adjustment and Board of Appeals Informational Training Programs
Ken C. Christopherson ........ .
The Everglades in Suburbia Alf Siewers .....
II. Disaster Awareness and Response
At-Risk Residents' Knowledge and Beliefs about Structural and Nonstructural Flood Mitigation
Shirley Laska . . . . . . • . . . • . . .
xii
3
11
15
21
27
32
37
43
47
52

viii
Community Response to Recurring and Nonrecurring Floods
George O. Rogers ..•...•....
Emergency Response and Land Use Management Planning: The Hurricane Alicia ~isaster
Philip Berke and A. Kim Ludeke ....
Residents' Awareness of the Coastal Flood Hazard: Lower Florida Keys Case Study
John A. Cross _..............
III. Technical Topics
The Variability of Floodway Encroachment Determination J.F. Harp and R.J. Hayes ...........•
NASA/ERL Technology Applied to Floodplain Management Susan A. Howard . . .
Modeling Unsteady Flows in Large Basins: The Santa Cruz Experience
V. Miguel Ponce, Zbig Osmolski, and David Smutzer
IV. Determining Damages and Benefits
The Rise and Rise of the Great Salt Lake: A Continuing Lesson in Floodplain Management for Desertic Terminal Lakes
CONTENTS
60
67
73
79
86
89
Clancy Philipsborn. . . . . . . . . . . . . . 95
The Development of Residential Stage-Damage Curves for Application in Western Canada
Stephen W. Shawcross and Augusto R.V. Ribeiro 100
Assessing Flood Control Benefits in Lake A Dynamic Process
Greg Clumpner, L. Douglas James, Terry Holzworth, and Clyde Naylor.
Floodplains--
Expected Annual Damages With and Without Levees Robert M. Watson
PART TWO: APPROACHES TO FLOOD HAZARD MITIGATION
I. Selected Programs and Problems
A Disaster that Doesn't have to Happen: The East Baton Rouge Parish Flood of 2001
Rod E. Emmer . . • • . . • . . • • • . • •
106
117
131

CONTENTS
Relocation: A Floodplain Management Alternative Byrt Wammack . . . . . . . 138
Relocation of a Large, Slab On-Grade House from a Floodplain Edwin C. Endacott . . . . . . . . . . . . . . 143
Section 406 Hazard Mitigation Planning: Changes in the Federal Approach
Larry Zensinger and Clancy Philipsborn. . . . 150
II. The Insurance Industry
The Role of Insurance Associations in Developing Community Floodplain Management Programs
Robert Ross, Jr.
Galveston Before and After Alicia: How the Insurance Agent Can Assist in the Development of High-Risk Areas
Fred E. Madsen .. . . . . . . . .
The Role of the Small Community Agent in Flood Hazard Management
John Z. Norris
III. Nonstructural Measures
Limited-Detail Flood Insurance Studies Conducted by the U.S. Geological Survey
Ernest D. Cobb .. . ..
Implementation of Nonstructural Floodplain Management Measures by the Army Corps of Engineers
Jerry L. Greer ....... .
Soil Conservation Service Assistance to Floodplain Residents
Phillip A. Renn
IV. History and Theory of the NFIP
The Evolution of Nonstructural Techniques in Comprehensive Floodplain Management Programs
154
157
161
163
169
175
James E. Goddard. . . . . 180
Flood Insurance and Its Relationship to Floodplain Management Nicholas Lally •••••...•••••••••••• , 186
ix
x CONTENTS
PART THREE: NATIONAL AND STATE ISSUES
I. Coastal Floodplain Management
A Proposed Strategy for a National Coastal Development Plan Marguerite M. Whilden. . . . . . . . . . 201
Greenhouse Effect and Sea Level Rise James G. Titus ....... . 207
Sea Level Rise and Subsidence in Coastal Louisiana Karen E. Ramsey, Thomas F. Moslow, and Shea Penland 213
Local Government Involvement in Coastal Projects' Flood Hazard Reduction
James B. Edmonson . .
II. NFIP Concepts and Programs
Flood Insurance Study Revisions: Blessing or Curse? Mark W. Headly . . . . . . .
Multiple Use Concepts in Floodplain Management Will iam G. DeGroot, L. Scott Tucker, and Mark R. Hunter .....
Density Development Criteria for Floodwater Conveyance Carl L. Cook, Jr. . ........... .
A Consulting Engineer's Assessment of the National Flood Insurance Program
Edwin G. Paulson
III. State Floodplain Management
The Louisiana Statewide Flood Control Program Dorothy D. McConnell, A. Todd Davison, and Glen L. Daigre .....
"Backing Up the Locals": The State Floodway Permit Program in Illinois
Dav i dR. Boyce and Karen C. Kabbes. .
Strategy for Floodplain Management in the U.S. Virgin Islands
Roy Adams, O.K. Buros, and Pamela Johnston.
220
226
232
239
247
255
260
264

CONTENTS
PART FOUR: ON LOCATION
I. Know the Territory
Development Management to Reduce Coastal Storm Hazards David J. Brower and Jane Hegenbarth ...
Floodplain Management in Southern California's Antelope Va 11 ey
James L. Easton
Flood Ordinances: National Models vs. Local Problems Maggy Hurchalla .......... .
The San Diego County Floodplain Management Program Joseph C. Hi 11 and A. Jean Brown ...
II. Shooting at Moving Targets
Channel Change in Southern Arizona--Implications for Floodplain Management
Marie S. Pearthree
Water Level Frequency Analysis in Cold Climates George R. Alger and Henry S. Santeford ...
Management of Floodplain Sand and Gravel Mining Joann Mossa . . . . . . . .
III. Warning and Response
Local Flood Warning Systems--Wherp are We? Curtis B. Barrett .....
Utilization of the Sea, Lake and Overland Surge from Hurricanes (SLOSH) Model in Evacuation Studies
John K. Graham ................ .
xi
273
283
290
294
301
316
321
329
333

This page
. IS
intentionally . blank
LIST OF SPEAKERS AND PANELISTS
Dan ,Accurt i Floodplain Management Division 578 Forum Building Harrisburg, Pennsylvania 17120
George Alger Department of Civil
Engineering Michigan Tech University Houghton, Michigan 49931
Curtis Barrett NOAA/National Weather Service 8060 13th Street Silver Springs, Maryland 20910
Philip Berke Texas A&M University Research
Center College of Architecture and
Environmental Design College Station, Texas 77843
D. Lee Boggs III Floodplain Management Program Tennessee Valley Authority 219 Liberty Building Knoxville, Tennessee 37902
Leslie Bond Arizona Department of Water Resources 99 East Virginia Phoenix, Arizona 85004
David Boyce Illinois Department of
Transportation Division of Water Resources 2300 South Dicksen Parkway Springfield, Illinois 62764
David Brower Center for Urban and Regional
Studies Hickerson House 067A University of North Carolina Chapel Hill, North Carolina
27514
A. Jean Brown California Department of Water
Resources P.O. Box 388 Sacramento, California 95802
O.K. Buras Water Resources Division CH2M Hill, Inc. P.O. Box 1647 Gainesville, Florida 32602
Raymond J. Burby Center for Urban and Regional
Studies Hickerson House 067A University of North Carolina Chapel Hill, North Carolina
27514
Ken C. Christopherson Wisconsin Department of Natural
Resources P.O. Box 7921 Madison, Wisconsin 53707
Greg Clumpner CH2M Hi 11, Inc. 555 Capitol Mall, Suite 1290 Sacramento, California 95814
Ernest D. Cobb U.S. Geological Survey, WRD 415 National Center Reston, Virginia 22092
Carl L. Cook, Jr. FEMA, Regi on X Federal Regional Center Bothell, Washington 98011
Robert R. Cox Louisiana Department of Urban
and Community Affairs P.O. Box 94455 Baton Rouge, Louisiana 70804
John A. Cross University of Wisconsin
Oshkosh Department of Geography Oshkosh, Wisconsin 54901
xiv
David C. Curtis International Hydrological
Sciences 13 Westbrook Road Bloomfield, Connecticut 06002
Todd Davidson Louisiana Geological Survey P.O. Box G Baton Rouge, Louisiana 70893
William DeGroot Urban Drainage and Flood
Control District 2480 West 26th Avenue, #156-B Denver, Colorado 80211
Janie Douglass Kentucky Flood Control Advisory
Commission P.O Drawer 839 Harlan, Kentucky 40831
James Easton Los Angeles County Engineer's
Office P.O. Box 2418, Terminal Annex Los Angeles, California 90051
James Edmonson Terrebonne Parish Council P. O. Box 2768 Houma, Louisiana 70361
Rod E. Emmer Coastal Environments, Inc. 1260 Main Street Baton Rouge, Louisiana 70802
Edwin C. Endacott U.S. Army Corps of Engineers,
Tulsa District P.O. Box 61 Tulsa, Oklahoma 74121
Sherwood Gagliano Coastal Environments, Inc. 1260 Main Street Baton Rouge, Louisiana 70802
SPEAKERS AND PANELISTS
James E. Goddard Consulting Engineer 1600 Calle El Cid Tucson, Arizona 85718
John Graham U.S. Army Corps of Engineers,
Mobile District P.O. Box 2288 Mobile, Alabama 36628-0001
Jerry L. Greer U.S. Army Corps of Engineers P.O. Box 1159 Cincinnati, Ohio 45201
Charles Groat Louisiana Department of
Natural Resources Coastal Management Section P.O. Box 49124 Baton Rouge, Louisiana 70804
James F. Harp Bureau of Water Resources
Research University of Oklahoma 202 West Boyd Norman, Oklahoma 73019
Mark Headly Dewberry & Davis 8401 Arlington Boulevard Fairfax, Virginia 22031
John D. Helm 3910 South Rural Road Tempe, Arizona 85282
John F. Henz Henz, Kelly & Associates 1776 South Jackson, Suite 912 Denver, Colorado 80210
Susan A. Howard NASA/Earth Resources Lab HA 30 NSTL, Mississippi 39529

SPEAKERS AND PANELISTS
Maggy Hurcha 11 a Commissioner of Martin County 5775 S.E. Nassau Terrace Stuart, Florida 33494
John Kusler, Esq. P.O. Box 528 Chester, Vermont 05143
Nicholas Lally Flood Hazard Consultant 1301 64th Street West Bradenton, Florida 33529
Larry A. Larson Wisconsin Department of
Natural Resources P.O. Box 7921 Madison, Wisconsin 53707
Shirley Laska Department of Sociology University of New Orleans New Orleans, Louisiana 70179
Alan Levere Natural Resources Center 165 Capitol Avenue, Room 553 Hartford, Connecticut 06106
Dorothy D. McConnell Louisiana Department of Trans-
portation and Development P.O. Box 44245 Capitol Station Baton Rouge, Louisiana 70804
Fred E. Madsen USAA Group USAA Building San Antonio, Texas 78288
Fred Michaud Maine State Planning Office State House Station 38 Augusta, Maine 04333
xv
Joann Mossa Louisiana Geological Survey Box G, University Station Baton Rouge, Louisiana 70893
Jake Mullican Louisiana Floodplain
Management Association Box 3164 Lake Charles, Louisiana 70602
Mary Fran Myers Illinois Division of Water
Resources 310 South Michigan Avenue Room 1606 Chicago, Illinois 60604
Joanne M. Nigg Office of Hazards Studies Arizona State University Wilson Hall, Room 130 Tempe, Arizona 85287
John Norris Norris Insurance Agency, Inc. P.O. Box 45186 Baton Rouge, Louisiana 70895
Edwin Paulson Boyle Engineering Corporation 1501 Qua i 1 Street P.U. Hox 3030 Newport Beach, California
92658
Marie S. Pearthree Pima County Department of
Transportation and Flood Control
1313 South Mission Road Tucson, Arizona 85713
Clancy Philipsborn FEMA, Region VIII Denver Federal Center Building 710 Denver, Colorado 80225
xvi
Orrin H. Pi lkey Department of Geology Duke University Box 6665 College Station Durham, North Carolina 27708
Rutherford H. Platt Land and Water Policy Center University of Massachusetts Amherst, Massachusetts 01003
Stephen A. Prokopiak Greiner Engineering Sciences 570 West 44th Avenue Denver, Colorado 80216
Karen Ramsey Louisiana Geological Survey University Station, Box G Baton Rouge, Louisiana 70893
Phillip A. Renn USDA Soil Conservation Service 16 Professional Park Road Storrs, Connecticut 06268
Julian Rhinehart Bureau of Reclamation P.O. Box 427 Boulder City, Nevada 89005
George O. Rogers 1617 Cathedral ot Learning University of Pittsburgh Pittsburgh, Pennsylvania 15260
Robert Ross, Jr. Florida Association of
Insurance Agents P.O. Box 12129 Tallahassee, Florida 32317
Henry S. Santeford Civil Engineering Department Michigan Tech University Houghton, Michigan 49931
SPEAKERS AND PANELISTS
John Scheibel FEMA/FIA 500 C Street, S.W. Washington, DC 20472
Stephen Shawcross IBI Group 700 9th Avenue, S.W. Suite 2720 Calgary, Alberta T2P 3V4 Canada
John R. Sheaffer Sheaffer & Roland Co. 130 North Franklin Street Chicago, Illinois 60602
Alf Siewers Chicago ~ Times 401 North Wabash Chicago, Illinois 60611
Dav idA. Smutzer Pima County Department of
Transportation and Flood Control
1313 South Mission Road Tucson, Arizona 85713
Joseph Suhayda Department of Civil
Engineering Louisiana State University Baton Rouge, Louisiana 70803
John M. Tettemer John M. Tettemer & Associates 1352 Fairburn Avenue Los Angeles, California 90025
Frank H. Thomas FEMA/FIA 500 C Street, S.W. Washington, DC 20472
James Titus Environmental Protection
Agency 401 M Street, S.W. Washington, DC 20460
SPEAKERS AND PANELISTS
William L. Trakimas Indiana Department of Natural
Resources 2475 Director's Row Indianapolis, Indiana 46241
Virginia R. Van Sickle Louisiana Department of
Wildlife and Fisheries P.O. Box 15570 Baton Rouge, Louisiana 70821
Mary Ellen Vollbrecht Association of State Floodplain
Managers P.O. Box 727 Harpers Ferry, West Virginia
25425
Byrt Wammack Army Corps of Engineers,
Los Angeles District 300 North Los Angeles Street P.O. Box 2711 Los Angeles, California 90053
Robert M. Watson Wisconsin Department of Natural
Resources P.O. Box 7921 Madison, Wisconsin 53707
French Wetmore Illinois Division of Water
Resources 310 South Michigan Avenue Room 1606 Chicago, Illinois 60604
Marguerite Whilden Maryland Water Resources
Administration Tawes State Office Building Annapolis, Maryland 21401
Allan Williams Connecticut Department of
Environmental Protection 165 Capitol Avenue, Room 553 Hartford, Connecticut 06106
xv; ;

KEYNOTE ADDRESS

This page
. IS
intentionally blank
TRENDS IN FLOODPLAIN MANAGEMENT
John M. Tettemer John M. Tettemer & Associates, Ltd.
When one is invited to keynote a conference, one should create a mood,
create a focus. But since you are experts, with ideas and conviction, I'll
leave the discussion of floodplain management for the presenters. You will be
hearing an excellent group of papers, some looking back, some looking forward.
I would like to talk about how we as an association might adjust our activities
to be even more effective in the next decade. I hope this will be a popular
topic of conversation for all of you this week, and that you will determine a
process for the Association to use in organizing itself for the next ten years.
will 1) provide you with my observations about the national and local
scene, 2) describe the trends I see, and 3) offer a series of initiatives that I recommend your association adopt as its core program for the next ten years.
Some changes will be required by events beyond our control. Some we can
control. The roots of this organization are in a program that is changing.
There is reason to believe those changes will affect us. I will talk quite
generally. All of you may not agree.
I want to represent the local community. At the local level we: develop
zoning, approve subdivisions, and require floodproofing. We are the people who
caused the problem we're trying to solve. We are the people who will solve
it!
Let me explain to you my biases:
• I am a strong advocate of floodplain management and the
National Flood Insurance Program.
• I have been involved for years in the federal program at the local government level and as a consultant.
• I am presently involved in planning flood control solutions for over 200 square miles of land in five states. All have
substantial hazards.
4 TRENDS IN FLOODPLAIN MANAGEMENT
• I believe the best local programs and the worst local programs are the result of local attitudes and interest, not
federal or state regulations.
• I believe that a little bit of excellence is preferable to a
lot of mediocrity.
• I have a Western perspective. Let's start with my learning something about you. I need a show of
hands. 1) How many of you are from east of the Mississippi? 50%
West of the Mississippi? 50%
2) How many are here for the first time? Many. Good! 3) How many of you feel there is a need for added federal
support for the floodplain management programs? Many.
4) How many of you feel the national debt might affect your
Association's future? A few!
Trends
Today we are in a period of major change. This is not a political
comment. It is derived by being attentive to available information. The 50's,
60's, and 70's were different periods, but as we look at the 30-year period, we
can see some very clear trends in our country.
• Growth ethic has lessened. • Environmental concerns have heightened. • Public works have yielded to social works or "quality of
life" issues.
• Public support for programs is harder to obtain.
• Our standard of living is not increasing. It is probably decreasing.
• Social programs have increased. • Our basic industries, steel and agriculture, are in serious
trouble.
• Our service industries are increasing.
• Our banking system is having difficulties.
• Oi 1 and its price were controlled outside the United States,
and we were in lines at gas stations.
• Inflation rates around the world are nearly out of control, even in Israel, a western-thinking country.

Tettemer
• We have seen a blizzard of legislation at all levels affecting our lives and making our jobs more difficult.
• We are internationalized in trade, our dollar, and basic resources.
• Global unrest has increased, including that in Central America.
• There has been major growth in U.S. government and centralization of decision making.
5
As a nation we are in debt. Our national debt is growing at a rate of
$200 billion a year. Our balance of payments deficit exceeds $100 billion
annually. This, our third year of recovery, has still left many segments of
the economy and areas of the U.S. in near-depressions. We have loaned billions
of dollars to other countries that have no way to repay it. The interest on
the national debt is fast becoming the major budget item. The programs that
we started or expanded during the last 20 years have now exceeded our ability
to pay for them. The next ten years will be a period of program cuts after
severe competition by advocates. There will be less and less federal funding
of public works type programs. Flood insurance and other social programs will be reduced slowly.
The Association and its Future
If the Association plans to organize itself to become a stronger
advocate for federal funding and to become a stronger voice in federal
policy, it will 1) find itself competing with very powerful social programs,
2) find that the strategies of the last 20 years for dealing with the federal
government don't work, 3) find it doesn't have a constituency, and 4) find that
new, expanded programs will not be funded. The development of land is
continuing. The reduction of hazards to existing homes and businesses is
continuing at the local level. Local people see quite clearly that federal
financing for projects is reduced and delayed and are slowly turning back
toward home-grown solutions. In short, the federal government will be a
smaller not larger player. The weakness in the NFIP will not be fixed. We
must fix it at the state and local level.
Local government and those developing land need thoughtful solutions and
our help more than ever. In spite of what may sound like a bleak future, this
Association now has an opportunity to become the major force for improved
floodplain management throughout the country. My initiatives can get you started. My initiatives for the Association recognize the reality of future

6 TRENDS IN FLOODPLAIN MANAGEMENT
federal funding and the use of good management principals. They are the basis
for the next stage of the implementation of successful floodplain management.
Initiatives
1) Build your organization, its structure and its objectives around
helping local floodplain managers. Make it downward-service
oriented.
2) Find and support programs that are master-planned solutions to
floodplains in each locality.
3) Establish local or regional studies, workshops, and seminars
that stress master-planned solutions and successful models to be
copied.
4) Involve yourselves in local decisions on behalf of good
floodplain management practices. Include planning commissions,
city councils, and boards of supervisors. 5) Use each disaster as an opportunity to improve local
regulations. Move in, help, and lobby.
6) Review local disaster relief requests and comment on
justification for relief and mitigation provisions. Be prepared
to oppose inappropriate applications.
7) Encourage master-planning! Other solutions are only temporary or
confusing to locals
8) Develop unique solutions for unique regional problems and
publicize. Publish standards.
9) Focus your energy on communities that want your assistance.
10) Actively involve the private sector. Owners and developers are
allies of good programs, have dollars to help you, and have political strength.
11) Establish competition in each state or region for innovative
programs and publicize! Publish the results!
12) Focus your attention on creating a few examples of excellence.
Provide leadership.
13) Consider organizing around regional issues rather than by
states.
Local government and developers want master-planned solutions that they
can understand. Sell those to them! They also want real life solutions that apply in a cost-effective way. They would contribute to regional solutions if

"Tettemer 7
they understood them. They must consider, as is appropriate, both structural
and nonstructural solutions, and so should we. I strongly recommend your Association observe the trends and adopt a
"grass roots
government.
local level.
service" program. Team with, but be less dependent on, the federal
You have the intellectual resources to provide excellence at the
The federal government needs your help. Quality floodplain
management in this country will take some courage and some redirection, but it
will be very rewarding. I stand available to help.
Thank you.

This Page
. IS
intentionally blank

PART ONE ASPECTS OF FLOOD HAZARD REDUCTION

This page
. IS
intentionally blank
STATUS OF FLOODPLAIN MANAGEMENT AMONG FEDERAL AGENCIES
Frank H. Thomas Federal Emergency Management Agency
My assignment today is to review the status of floodplain management among federal agencies. At first glance, it is a very discouraging task. The
Tennessee Valley Authority's (TVA) proposed FY 1986 budget is zero. The Soil
Conservation Service's (SCS) proposed budget is sharply cut back. The Federal
Emergency Management Agency's (FEMA) proposed budget cuts the number of
regional offices from ten to six. In short, the federal floodplain management effort seems to be in trouble.
However, the proposed budgets do not provide an adequate context in which
to view federal floodplain management activity. Therefore, I will first review
progress made during the last 20 years, and then discuss the FY 1985 budgets
and personnel levels.
Progress Since 1965
In 1965 it became apparent that the costs of various flood control
programs were continuing to rise. Disaster assistance payments were also
accelerating. Additionally, the extent of the flood hazard itself was poorly
identified. All this led the Executive Office of the President to establish a
task force of nine experts to examine the status of floodplain management in
the U.S. The task force found a variety of problems, in particular, inadequate
consideration of non structural measures for mitigating flood losses. The task
force declared the need for a unified national program for floodplain
management, and set out five goals: 1) to improve basic knowledge about the
flood hazard; 2) to coordinate and plan new developments on the floodplain; 3)
to provide technical services to managers of floodplain property; 4) to move toward a practical national program for flood insurance; and 5) to adjust flood
control policy to sound criteria and changing needs. The task force also recommended ways to achieve each of the goals. Four
of the recommendations addressed the goal of improving our basic knowledge
about flood and flood hazards. The first one--to define and outline the flood hazard--has led to a federal expenditure of almost $700 million, and resulted
12 ASPECTS OF REDUCTION
in the publication of flood hazard boundary maps for more than 18,000
communities, including more than 7,500 with detailed flood hazard studies. The
second recommendation--determination of flood frequencies--has led to federal
agency adoption and application of a uniform technique for determining flood
flow frequencies in flood hazard studies. The third suggestion that a national
program be established to collect more useful flood damage data has prompted
considerable discussion but little action. The fourth recommendation--to
establish a program of research on floodplain occupance and hydrology--has been
real ized in part through several national efforts
Another four recommendations addressed the goal of improving coordination
and planning for new floodplain development. The first of these--specify
criteria for using flood information and encourage state coordination of
floodplain regulation--has been met by the adoption of the 100-year base flood
standard and its use by all states in the regulation and management of
floodplains. The second recommendation--assure that state and local planning
take proper account of flood hazard--has been realized in large measure through
the requirements of the National Flood Insurance Act, which prohibit federal
assistance to those communities with identified flood hazards that refuse to regulate land use. The third suggestion was to give more consideration to
relocation and floodproofing as alternatives to repetitive construction in floodplains; this is followed in the requirements of the hazard mitigation team
program, and through limitations on the amount of casualty losses that can be
claimed as federal income tax deductions. The fourth directive called for an
executive order that all federal agencies consider the flood hazard in their
actions and facility siting; Executive Order 11988 was just such an order.
Two recommendations addressed the goal of providing technical services to
managers of floodplain property. The first one called for the establishment of
programs to disseminate information and provide technical assistance on
alternative methods for reducing losses; it has been met through new and
strengthened federal and state programs to provide studies and technical
assistance, and by publication of numerous handbooks and guidance documents.
The second recommendation-- improvement of a national flood forecasting system
-has been accomplished in part by improved data collection and communication
systems and flood forecasting models.
A single recommendation addressed the goal of moving toward a practical national program for flood insurance by calling for an insurance feasibility
Thomas 13
study. This led to the passage of the National Flood Insurance Act in 1968;
currently, 17,500 communities participate and there are 1.9 million insured
properties.
Five recommendations addressed the goal of adjusting federal flood control
policy to sound criteria and changing needs. The first one--broaden federal
flood control authority--has been carried out in part by administrative
procedures requiring evaluation of alternative plans and nonstructural plans.
The second recommendation--modify federal cost-sharing requirements--has been
the subject of extensive studies, but basic differences between the Congress
and the Administration remain. The third suggestion to report flood control
benefits in the future distinct from benefits to existing property caused there
to be administrative procedures that specify benefit classes and cost
allocation procedures. The fourth recommendation--give authority to include land acquisition as part of federal flood control p1ans--has been met in part
through individual project authorizations and the National Flood Insurance
Act's authority to permit purchase of insured, severely damaged properties. The last recommendation was to broaden the loan authority to allow local
contributions to flood control projects, but that has been rendered invalid by
revenue-sharing and block grant programs.
Twenty years later, the task force report must be regarded as a powerful
catalyst and a benchmark for major advances in the nation's efforts to reduce
f1uud losses. Because of the task force report, the intensive development of
the nation's floodplains during the last 20 years has been accompanied by a
growing number of flood loss mitigation actions.
Today, among the federal agencies there is conceptual concurrence on a
fr~nework for floodplain management, common hazard identification standards,
consistency of flood hazard evaluation procedures, and the need for cooperation
among the federal agencies. There are now interagency agreements, an interagency floodplain management task force, a floodplain management
coordinator in each state, and skilled state floodplain management staffs in
many states to carry out extensive programs. The existence of a strong and
active Association of State Floodplain Managers testifies to the new role of
the states.
Levels of Federal Activity
With this background, let us look at the current federal picture as sketched by FY 1985-1986 budgets and full-time staff equivalents for the ten

14 ASPECTS OF REDUCTION
agencies on the Federal Interagency Floodplain Management Task Force. Data are
based on best estimates and on some budget information. In 1985, 730 full-time
staff equivalents and $83.3 million were allocated to activities directly
involved with floodplain management. In 1986, 672 full-time staff equivalents
0nd S82.7 million are projected for the same activities.
Full-time equivalent staff shows an apparent net decline of 58, or 8%.
This reflects projected elimination of the entire TVA staff of 33, and
reduction of 38 SCS staff as the first step toward program termination in 1987.
Partially offsetting is projected increase of ten staff by the Corps of
Engineers and three by the Department of Housing and Urban Development. Staff
levels of the other agencies are unchanged.
The FY 1985-1986 apparent reduction in available funds of $.6 million, or
less than 1%, is deceptively small. It represents elimination of $1.95 million
in TVA funds and a negligible amount of SCS monies, offset by a $1.4 million
increase in Corps funds. A precipitous decline in SCS funds will not appear
until 1987 because of the multiyear nature of ongoing projects. Other agency
funding is unchanged.
STATUS OF STATE FLOOD HAZARD MANAGEMENT PROGRAMS
Larry A. Larson Wisconsin Department of Natural Resources
Introduction
States have been active in flood hazard management programs for over 20
years. Within that time period, there have been significant changes in the quality and sophistication of state programs. State programs have gone from requiring zoning only, to many other forms of flood hazard management. Over
35 states require direct regulation of the flood hazard area by local or state government. Each one of the states, the District of Columbia, and the terri
tories of Puerto Rico, Guam, and the Virgin Islands have a designated coordinator for the National Flood Insurance Program. The number of state employees
working on flood damage reduction has increased between 50 and 100 full-time equivalents since 1979 (Larson, 1983).
State Program Content Regulations
Some of the early state programs involved direct state regulation of the
floodplain, or at least the floodway. Floodfringe development was generally left to local regulation. As more and more states adopted legislation, however, they realized that regulation through land use zoning provided the best opportunity for preventing future flood damages. As with most land use regulatory programs, it is not a popular issue with most local governments. For those
reasons, state oversight and minimum state standards are considered essential.
The state standards generally provide for no structures (open space use only)
in the floodway where obstructions could cause increased flood elevations on other property owners upstream. The federal standard allows an obstruction to increase
flood elevations up to 1.0 foot. However, more and more states are requiring small
or zero increases in flood elevation due to obstructions in the floodway (New Jersey, Maryland, Iowa and Wisconsin allow essentially zero increase). Compensation for property owners for flood increases, or actions to compensate for
the increase are options to handle the "taking without just compensation" issue.
16 ASPECTS OF REDUCTION
Engineering and Mapping Assistance
Well over a dozen states have developed hydrologic and hydraulic engineering
capabilities. This includes performing full blown engineering studies to identify flood hazard areas. States tend to do studies in communities where the Federal Emergency Management Agency will not be doing a Flood Insurance Study. This may mean the Flood Insurance Study is not scheduled at all, or that one could not be
done in a quick enough time frame to be in place before significant development would occur, since flood insurance studies generally take at least five years. It
could also be a case where the existing study is incorrect or needs updating, which was discovered when a local community reviewed local permit applications.
States also perform case-by-case engineering analyses for local communities to determine floodway location and flood elevation. This occurs in areas where no study exists or where the Flood Insurance Study has identified only a general flood hazard area but provides no detailed engineering data. Some states will provide that calculation at no cost to single family property owners, whereas such case-by-case studies will be done by consultants for commercial ventures, as a cost
of doing business.
In addition to actual engineering calculations, a number of states provide mapping assistance. This may be the actual production of flood hazard maps as part of an engineering study done by the state, or others, or it may involve review and revision of existing maps at the request of locals. Mapping errors are usually discovered when someone applies for a permit or the community has some reason to utilize the existing maps. Often the state will develop adequate data and submit it to FEMA for correction of flood insurance and regulatory maps.
Technical Assistance
Flood hazard management involves more than regulations. Accordingly, states provide technical assistance to local communities to develop and implement many
such elements. Technical assistance to local communities is a key role for states. It is unquestionably an activity they are better able to provide than
nearly any level of government. There are logical reasons for this: states are

La rson 17
closer to local communities than federal agencies so they can not only get to the community easier, but get to know community officials on a one-to-one basis. Communities are more inclined to call and trust someone they know and see often.
The state person also has the advantage of being able to integrate the floodplain management programs with other related state programs such as septic tanks, wetland shoreland, subdivision and erosion control regulations, water supply and waste treatment programs, and many others. This results in the state person becoming a valuable resource person for the local community.
There are over 17,000 flood prone communities in the nation. Many of them are smaller communities with part time or volunteer staff with no technical background. They need assistance to help them review and interpret maps, develop adopt and administer ordinances and to act properly on permits appeals and variances. In the National Flood Insurance Program (NFIP) the requirement to zone is federally mandated in order to get flood insurance benefits. However, the legal mechanism and authority to zone is given to the community under state law. This
means that legal procedures are different from state to state and must be tailored to the state law, an ability which state agencies best possess.
States have filled this need very well. t~ost of them have developed model
flood hazard ordinances, attend meetings, hold training sessions and respond to day-to-day requests for technical assistance from local communities.
Flood Hazard Mitigation
Flood hazard mitigation is becoming increasingly important. Floodplain regulations are really effective only in reducing flood damages to future construction. Very fe~1 existing structure will ever be replaced or brought up to flood protection standards through the regulatory process. As a result flood losses will continue to those structures. Mitigation efforts are needed to flood proof, relocate or to provide warning, evacuation etc.
Historically, federal assistance has produced structural projects such as dams, levees, etc., to protect existing structures. Despite over $14 billion in
federal expenditures in the past 40 years, flood damages in the nation continue to
increase.
18 ASPECTS OF REDUCTION
Only in few rare cases have federal programs provided planning and implementation assistance for non-structural approaches to mitigation. States are beginning to fill this void. Maryland's watershed program and Louisiana's statewide Flood Control Program which provides flood hazard mitigation cost sharing, are excellent examples. Other states legislatures such as Minnesota, are considering enacting cost sharing programs for these efforts. The required mitigation plans following a presidential declaration are also providing in an impetus for passage of funding programs in Connecticut, California and Utah.
Related Resource Programs
Comprehensive programs or related resource protection programs provide excellent flood loss reduction at the state level. Examples are Michigan's scenic rivers protection act and shoreland programs and Maryland's watershed program that requires comprehensive planning and cost sharing if local communities commit to the watershed plans for existing and future development and runoff conditions. Also, the wetland protection programs in New York, Maryland, Maine, Florida and Wisconsin and others prohibit most any development in the wetlands. Since nearly all wetlands are in the floodplain, this provides automatic flood hazard protection and prevents future increases in flood elevation.
States playa key role in tailoring local programs to local needs and conditions. For example, federal programs to study and map flood hazard areas are generally based on technology that can apply to a variety of flooding conditions. This may be inadequate in certain high risk areas such as alluvial fans, ice jams, areas below dams, etc. A few communities, usually with the assistance from states, are addressing ways to better manage these high risk areas. States, through the Association of State Floodplain Managers are working with federal agencies to improve study standards, mapping and development standards in these areas in order to reduce flood losses.
Larson 19
How States Can Improve Flood Loss Reduction Programs
While states have made significant progress, especially in the last five years, there is much yet to be done. The key state role is to assist locals in managing flood hazard areas. A review of existing successful state programs and their impact on improving local programs suggest some ways other states can improve. This would include:
1) Adopt legislation requiring local regulation of flood hazard areas. An
increased state regulatory role in land use is very important (Burby, 19B3).
2) Develop a diversity of state staffs that includes planning and engineering professionals in order to provide a broad array of technical assistance to local communities.
3) Provide the key state agency with authority for more than oversight of
regulatory standards. This could include authority for assisting in flood warning, mitigation and other key floodplain management programs.
4) Insure that all state related programs such as SUb-division regulations,
highways, state facilities, wastewater treatment facilities and state funding programs, incorporate and address flood hazard management concerns early in the process. This can usually be done effectively through a state executive order.
5) Develop a data base to help states set priorities for efforts which will be most effective in reducing flood losses. This would include data on the number of structures in the floodway and the floodfringe of each community in the state, data that would indicate where future development will occur, and ongoing collection of hydrologic data for refinement of studies.
6) The cost of mapping and research by federal agencies should continue in order
to free states to provide the most effective and efficient tools in their bag of tricks, that of providing technical assistance to locals.
20 ASPECTS OF REDUCTION
Studies indicate that local programs are more likely to be effective where there are effective state programs. A review the programs around the nation leads to the conclusion that building state capability, getting states to assist each other and improving that capability and tailoring flood hazard management programs for delivery through the states to the locals will most effectively reduce flood losses in the nation and protect the life, health and property of the nation's citizens. Each level of government must contribute in the way it can be most effective toward this overall effort. The pivotal role of the state is a key essential element.
References
Burby, R., and B. Cigler
1983 Effectiveness of State Assistance Programs for Flood Hazard Mitigation. Center for Urban and Regional Studies, UNC-Chapel Hill.
Larson, L.
1983 FEMA and the States: A Cooperative Effort in Flood Hazard Mitigation. An Evaluation of the State Assistance Program. Association of State Floodplain Managers.

STATUS OF LOCAL PROGRAMS IN FLOOD HAZARD REDUCTION*
Raymond J. Burby Center for Urban and Regional Studies
University of North Carolina at Chapel Hill
Sixteen years have passed since passage of the National Flood Insurance Act in 1968 spurred a massive increase in local flood hazard reduction programs. During that period, we've witnessed a revolution in local floodplain management and a reduction in the rate of increase in flood losses. Having said that, however, I think that most would also aqree that we have a long way to go before we get on top of flooding as a serious national, state, and community problem. In this paper, I will briefly review what local governments are doing to reduce flood hazards and then look at how effective those efforts have been in terms of achieving private sector compliance with flood hazard management objectives. The paper concludes by identifying those states where compliance is most advanced, indicting how those states differ from states where private sector compliance with flood hazard management objectives is less complete, and suggesting what states and
localities should do next about community flooding problems.
Local Flood Hazard Reduction Programs
Local flood hazard management programs are designed to reduce flood damages to existing development at risk and to minimize the risk of flooding to new development locating in flood-hazard areas. In order to reduce flood damages to existing development, communities have two choices: keep flood waters away from structures and people at risk or move the structures and people out of the way of
flood waters. The first approach is very popular. About 70% of the flood-prone communities in the U.S. have in place some sort of engineering solution (e.g., channel improvements and dikes and levees) to their flooding problems. Those structures, however, usually do not solve the problem entirely. Our research suggests two reasons: communities with structural protection in place have a higher rate of new floodplain development than communities without structural protection, but in many cases those structures do not provide protection against flooding from very large (and very rare) storm events. The second approach to

22 ASPECTS OF REDUCTION
dealing with flood losses to existing structures--moving buildings and people out of the way of the flood waters--is more effective than the first approach, but it is rarely used. Recent national surveys we've conducted indicate that only 2% to
3% of the flood-prone communities in the U.S. have relocated buildings from flood hazard areas.
In addition to preventing damages to existing development, local flood hazard
management programs seek to prevent losses to new construction, either by guiding that development away from flood-prone areas or by requiring that buildings locating in the floodplain bp elpvated Hnd/or floodproofed so that they are reasonably
free of flooding. Our research indicates that localities are much more likely
to use the second approach than the first. Most communities in the National Flood Insurance Program have adopted new ordinances or amended their existing development
codes (zoning and subdivision regulations) so that, if properly enforced, new construction in flood-prone areas will be free of damage from most flood events. Communities are much less likely, however, to have done anything to keep new development from locating in flood hazard areas. About two of every five flood
prone communities in the U.S. have adopted floodway regulations, but less than one in five have taken steps to minimize development of the floodway fringe through
land use regulation, land acquisition, preferential taxation, or capital improvements policies designed to minimize the attractiveness of flood-prone areas for development.
The amount of attention communities pay to floodplain management varies
depending upon who is in charge of the local program. Across the nation, we found responsibility for floodplain management distributed as follows. The chief executive is in charge of the program in a quarter of the localities; the building
inspector in a quarter of the localities; the planning director in about a fifth; the public works director or city engineer in about a fifth; and in the remaining tenth of the communities' programs are run by a variety of persons, such as the town
clerk, city council, planning board, or a regional agency. Contrary to what most people might expect, the best programs aren't found where the chief administrator is in charge; in fact, those tend to be the programs with the lowest priority,
fewest flood control and land use management measures in place, and programs that are not rated as very effective. Instead, localities pay the most attention to floodplain management when either the planning department or public works depart
ment runs the program. Where planners are in charge, programs tend to focus on
Buroy 23
land use management measures; where public works is in charge, programs tend to focus more on flood control, but in both cases programs tend to be more fully developed than in localities where floodplain management is directed by the chief
administrator or city councilor where program responsibilities have been assigned to the building inspector, planning board, or some other group.
Program Effectiveness
Given the floodplain management measures localities have adopted and who's
in charge, how good a job are localities doing with floodplain management? We tried to gauge that in three ways: 1) by the amount of new construction occurring in flood hazard areas; 2) by local program officials' and state officials' judgements about how well programs are achieving flood management objectives; and 3) by the extent to which property owners are complying with what we call "best management practices" for floodplain development. Here is what we found in a national survey of over 900 flood-prone localities conducted in 1983.
Preventing Encroachment on Flood Hazard Areas Of 956 communities we surveyed in 1983, 65% had issued no building permits for
floodplain development during the preceding year. Across all 956 communities, 94% of the building permits they issued during 1982 were for construction located outside of designated flood hazard areas; 6% of those permits were for construction located in an area subject to flooding (in coastal communities that figure rose to 18% of all new development). Since we do not have data on the proportion of those communities located in the floodplain, it is difficult to say whether, on average, flood hazard areas are receiving a greater or lesser proportion of new development than would occur in those locations by chance. In general, however, it does not appear that local floodplain management programs are having much effect on where new construction occurs in a community.
Officials' Perceptions of Program Effectiveness When local officials were asked to evaluate the effectiveness of their flood
plain management programs, about half rated their programs as very effective in preventing flood damage to new construction occurring in areas subject to flooding; about a third rated their programs as very effective in preserving the natural

24 ASPECTS OF REDUCTION
values (flood storage, aquifer recharge, etc.) of flood hazard areas; and less than a third rated their programs as very effective in reducing flood damages to existing structures or public property. Hhen state officials were asked the same question, they were about half as likely as local officials to rate local floodplain management programs as very effective in achieving any of those objectives. From either a state or local perspective, however, there is obviously room for improvement in the performance of local floodplain management programs.
Property Owner Compliance with Best Management Practices In addition to asking local officials about overall program performance, we
also asked them how well property owners in their jurisdictions were complying with what we term "best management practices" for development of flood hazard areas: elevating structures above the level of the lOO-year flood; avoiding fill and other obstructions of the floodway; installing adequate storm drainage systems in new subdivisions and other development; and floodproofing existing structures. If we rate compliance as good when over half of the property owners are complying with those best management practices, then here is what we found. In two thirds of our national sample of communities, compliance with elevation and floodway fill practices is good; compliance with storm drainage practices is good in about half of the communities; and compliance with floodproofing practices is good in about a quarter of the communities. Again, there seems to be room for improvement at the local level.
High Compliance States
The top ten states in terms of local officials' ratings of property owner compliance with the four best management practices for development in flood hazard areas are, in order: Illinois, Hawaii, Minnesota, Rhode Island, Michigan, New Jersey, Washington, Virginia, South Carolina, and Nebraska. How do those and other high-ranking states' flood management programs differ from states where property owner compliance is not rated as well? To find out, we gathered data from the states about their flood management programs and combined those data with information obtained from our national sample of local governments. Here is what we found.

25
Thirteen of the factors we looked at seem to have a significant effect on property owner compliance. In order of the magnitude of that effect, they are: 1) scope of local government floodplain management programs in a state; 2)
scope of state flood hazard information and education programs; 3) percent of the
population in a state living in communities in the regular phase of the National Flood Insurance Program; 4) degree to which state program goals emphasize environmental protection as well as property damage abatement; 5) degree of state offi
cials' contact with local government officials; 6) percent of a state's population living in metropolitan areas; 7) degree to which local officials are satisfied with technical assistance received from federal agencies; 8) degree to which
flood-free sites for new development are available within a state's flood-prone localities; 9) absence of Corps of Engineers expenditures on new works in a state during the period 1978-1982; 10) number of state personnel working in flood hazard
management programs; 11) presence of a "moralist" political culture in a state (people in the state tend to value positive governmental action in the public interest); 12) scope of state floodplain regulations; and 13) extent to which
flood hazard management is a priority interest of the governor. Overall, those thi rteen factors exp 1 a in about 40:; of the va ri ati on from s tate to state in property owner compliance with floodplain best management practices.
Next Steps
To conclude, I'd like to suggest where I think local floodplain management programs should be heading, based upon the results of our research at the University of North Carolina at Chapel Hill conducted over the past decade. To start,
we need to think of ways of getting floodplain management onto local political agendas more often than we have in the past. States can help with that in a number of ways. They can work to increase local officials' awareness of the flood problem.
They can work at the state level to link floodplain management to other program objectives; for example, the U.S. Environmental Protection Agency's recent move to require states to regulate major nonpoint sources of pollution, such as large
shopping centers, should create opportunities to combine water quality and flood management objectives in state and local stormwater management programs. Finally, states can use various carrots and sticks to get local governments to think more
26 ASPECTS OF REDUCTION
seriously about flooding. Our research indicates that state regulatory programs,
for example, are effective not only because of their direct effects on property owners but also because of their indirect effects in persuading localities to give floodplain management more attention than they otherwise WOUld.
Once floodplain management gets on the local political agenda, our research suggests that local programs are more effective when localities use multiple methods to achieve their objectives for flood hazard areas. Thus, we've found that while local regulations are a necessary first step in floodplain management, local programs should also encompass, depending upon local circumstances, flood
control measures, watershed treatment measures, land acquisition, flood warning, and other local activities that will reduce the potential for flood losses and envi ronmenta I damage. Furthermore, those multi pI e measures wi 11 likely work together better if they are formulated as components of a local floodplain
management plan. We also think that localities should be paying more attention to various
innovative techniques for floodplain management. We believe the "cutting edge" of floodplain management at the local level will include the establishment of various exactions on new private development in flood hazard areas so that such development
starts paying the full costs associated with a flood-prone location. Revenues
raised through such exactions can be set aside in a fund earmarked for reconstructing public infrastructure damaged as a result of flood events. We also think
that localities also need to begin paying more attention to stormwater management than they have in the past. Finally, we expect to see a number of innovative land use management techniques, such as transfer of development rights, applied to floodplain management.
State governments are in position to help localities with all of the "next steps" I've outlined here. We've made tremendous progress in floodplain management
at the local level over the past two decades. With continued and expanded efforts
at the state level, that progress should continue.
*The research reported in this paper was supported, in part, by National Science Foundation research grants DAR78-07603 and CEE-8209884. Any opinions, findings, conclusions or recommendations expressed herein, of course, are those of the author and do not necessarily reflect the views of the National Science Foundation.
THE CONNECTICUT COASTAL HOMEOWNERS' FLOOD PREPAREDNESS PROGRAM
Alan M. Levere Connecticut Department of Environmental Protection
Introduction
The Coastal Homeowners' Flood Preparedness Program (CHFPP) brings munici
pal flood information to potentially vulnerable coastal homeowners, and it is
delivered to them in their homes.
As the pilot program was being developed, we realized that there was no
significant funding or staff time set aSide. There was no allotment for it in
the various departmental work plans, and the more thought we gave it, the more unclear it became where the responsibility for it should lie. Possibly our
Coastal Management staff or Water Resources staff should have led the way, or
maybe the Office of Civil Preparedness or the towns themselves should have, and what about Federal Emergency Management Agency (FEMA)? The Department of
Environmental Protection had no authorization to take responsibility, but it
seemed to be the logical next step to accompany the flood information we had on
hand. Utimately, we took charge.
We spread the information because the residents do not know about
flooding, and because their lack of knowledge results every year in deaths.
Flooding also has huge monetary repercussions at every level of government.
Unfortunately, when all of the NFIP rate maps (FIRMs) are drawn and the Flood
Insurance Studies (FIS) are in order, the information leaves the federal ranks
and begins to trickle down through the system. It gets to the state level and
then down to the municipality, but the trickle usually ends before the informa
tion gets to those who need it most to protect themselves--the homeowners. The
whole reason for these programs was the vulnerable position of the homeowner,
who frequently never sees the work that has been done regarding his or her
actual homesite.
Program Goals Our intent was to inform the participants of the nature of the coastal
processes, the formation and intensities of coastal storms, the probable
28 ASPECTS OF REDUCTION
coastal effects, and the best ways to combat individual loss. The first major
goal of the program was to structure it so that each individual would know
exactly what the next hurricane would do to his or her home. We wanted them to
ask, "How can I protect myself from the possible loss when the hurricane
comes?"
The second main goal was to advance the program with no misunderstanding of our intent. We did not want homeowners to think we were big government
coming in to tell them what to do, or worse, suggesting that we wanted to take their homes. We tried to emphasize the effects of the natural processes. For
example, the movement of one spit along the Connecticut coast has been charted
for the last 130 years or so. In one 111-year period of time, the littoral
movement and erosional actions, on both the spit and the attached shoreline,
combined to produce a net land loss of approximately 40 acres. The emphasiS
was that the coast is not static and as residents they have good reason for
long-term concern.
Groundwork
The groundwork for this program was laid over the course of two summers.
In 1982 an inventory was ta~en of all the structures in the A-, B- and V-zones
of Connecticut's 25 coastal communities. The boundaries of the flood zones on
the FIRMs were transposed onto the aerial photographs and the structures
tallied. The results showed 3,941 structures in the V-zones and 19,099 in the
A-zones, representing about 57,600 residents.
In 1983, as part of a public information project, a questionnaire was sent
out regarding coastal flooding. The results showed that 87% of the people who
now live at the coast did not live there when we had our last hurricane in
1955. Ninety-eight percent were the owners of the homes they lived in, and
about 75% of those that answered were not aware of any type of municipal flood mitigation or preparedness programs.
Location of Presentation
The first step was to locate the chief elected official of the town, the beach association president, and a home in which to make a presentation to all
property owners. The desired location for the presentation was the living room
of a flOOd-prone home, in order to keep the presentation on a personal level
with a small group (15-20 people). The first meeting was held in a V-zone home
with the ocean physically there in the backyard. The combination of the high
tide and the posted flood and wave height levels had the hoped-for effect on
Levere 29
the listeners.
Alternative locations were in either the less dynamic A-zone homes or the
beach association meeting house. These were used when a V-zone home was not
available (sometimes because of owner reluctance and other times because the
beach association president was adamant about using the hall so more people
would benefit). In these instances, the group met at the shorefront and
observed the elevations posted on the outside of a volunteer's home, and then
moved to the hall for the balance of the presentation.
Contents of the Presentation
The introduction included an explanation of the FEMA flood frequency
terminology and related flood elevations. The first phase is to help homeowners
understand what this terminology means, and the greatest tool of the entire
program is used to accomplish this. It is two pieces of string placed along an
outside length of the house at different levels. One level is the projected
100-year flood elevation for that home, and the second, higher level is the
wave height elevation. The impact of actually seeing the storm level of the
ocean has proved to be very sobering. This display, coupled with two strings
inside the meeting place at the same elevations, brings home the damage poten
tial of the 100-year event.
Occasionally we encountered the sentiment that the flood levels displayed
were not of much importance locally because of a protective seawall. However,
a slide sequence, borrowed heavily from the FEMA New England presentation,
demonstrates what happens to a seawall in a severe coastal storm. The town of
Scituate, Massachusetts was hit by a winter gale in the spring of 1978, and
though it did not reach hurricane proportion, the destruction of the storm was
great. The slides show the direct wave attack on the seawall, its resulting
collapse, and the destruction of the supposedly safe homes behind it.
It becomes obvious to those in attendance that when a storm of magnitude
does strike the Connecticut coast, they will be in danger. If it is a large
and destructive storm, there may be nothing anyone can do but evacuate. How
ever, there are plenty of things for homeowners to do before the storms to
lessen their losses, and instruction in mitigation methods is the third phase of the seminar.
Each person receives a copy of a hazard mitigation manual and we go
through it together, section by section, concentrating heavily on the chapter entitled, "Options and Techniques for Reducing Flood Damages." Permanent,

30 ASPECTS OF REDUCTION
contingent, and emergency measures are all described and the options--from
elevated structures to wet and dry floodproofing to sandbagging--are well
illustrated. A close review of each is included. The home in which the
meeting is being held is then assessed for its potential losses. Preventive
measures and proper cleanup and repair techniques make up the greatest portion
of the information in the text.
Information on the NFIP, and a floodproofing cost-benefit analysis follow
to make the manual and seminar as comprehensive as possible. Residents' Current Awareness
It was a surprise to the DEP staff, on one hand, that current awareness of flood hazards and mitigation was as high as it was. One resident had raised
the utility wiring in his basement to above the highest water line he had seen,
and others had put in new patio porches at, or above, the 100-year flood eleva
tion. Still others knew about littoral drift and erosion. On the other hand,
there were groups similar to one gathering of beach association presidents and
their elected leader. Of the nine people in attendance, eight were not aware
of the existence of the NFIP, and they had a grand time locating their land
holdings on the FIRMs.
The greatest percentage of the population was between the two extremes.
Most residents had some knowledge about flooding in their area, but some of
them felt that they had already seen the greatest wrath of the ocean. Indeed,
they had been through seasonal, and sometimes potent, localized storms, but
they have ranged from nuisance flooding, to some severe, highly localized damages.
Exposure
The bulk of the publicity for the CHFPP in its pilot year was through word
of mouth. However, we were fortunate to get some "press" in a small circula
tion regional magazine, as well as an article in the DEP's monthly publication.
The desired time of publication for these articles was simultaneous with the storm season.
Applicability
The program proves versatile in its applicability to almost any flood
prone area, whether the concern is wave-induced coastal flooding, still-water
inundation, or riverine floods. The emphasis can easily be changed from
barrier beach housing to larger homes behind a seawall with little format
adjustment. The principles of flood prevention are similar wherever there is
31
the potential for high water.
The smaller scale of Connecticut's coastal flood problem made the program easily workable, but larger coastal states would have to expand their efforts
correspondingly. While the results of every such program are extremely valu
able, a larger state's problems are magnified by both population size and
geographical problems of coordination. This program is definitely workable,
but easier to do on a county-wide basis than statewide.
The Future of the Program
The pilot Coastal Homowners' Flood Preparedness Program of 1984 was a
success. Overall cooperation of the municipalities was good. The beach asso
ciations had an honest interest in their constituents' safety, the preservation
of their community niche, and increasing their own general knowledge. The
homeowners that attended the seminars proved their interest by virtue of their
voluntary attendance, the questions they asked, and their compliments to the
program.
The information the coastal residents receive in the Flood Preparedness
Program is the information that can save the federal government money through
reduced insurance claims.
With three summers of research behind us, we are firmly convinced that
shoreline property owners don't understand the potential catastrophic flood losses that they face, but they will listen to us if we prepare materials they
understand, and if we, as public agencies, leave our government office
buildings and go out to them at the shorefront.
Because we set up, experimented with, and worked the bugs out of our pilot
project at our own expense in 1984, FEMA has funded us to improve and expand
the 1985 program. Our immediate goal this year is effectively instructing
1,000 heads of households, representing about 2,100 coastal residents, in a
large cross-section of our potentially hazardous shoreline communities.
If we can convince ten residents to purchase flood insurance, or persuade
as many households to move expensive rugs and miscellaneous other valuable
furnishings above predicted flood levels when they realize flooding is immi
nent, our program will pay for itself in reduced insurance claims.
Everyone who attended any seminar has been sent, one year later, a quest
ionnaire to establish whether or not any mitigative precautions have been
taken. Only when these results come in will the long-term impact of our seminars be known.

TRAINING AND EDUCATIONAL PROGRAMS ARIZONA FLOODPLAIN MANAGEMENT ASSOCIATION
David A. Smutzer Vice Chairman, Arizona Floodplain
Management Association &
Manager, Flood Control Planning Pima County Department of Transportation
and Flood Control District
AFMA The Arizona Floodplain Management Association (AFMA) was founded in 1982
by floodplain administrators responsible for management, enforcement of regu
lations, and flood hazard mitigation in their respective communities. The
Association is the first of its kind in the country and was the first state
chapter to be accepted into the Association of State Floodplain Managers.
AFMA is a non-profit corporation that provides a means of communicating
changing state and federal regulations, and the latest methods available to
accumulate and analyze technical data. The necessity of such an organization is
evident by the fact that all 89 communities within the state participate
actively in the National Flood Insurance Program (NFIP). Specific goals of AFMA
include: 1) enhance cooperation among the private sector, local, state, and federal agencies responsible for floodplain management; 2) encourage and pro
mote new and innovative approaches to managing the state's floodplains in order
to achieve the greatest social and economic benefit and general welfare for the
citizens; 3) provide a forum for the education and training of those involved in floodplain management.
Membership
The Arizona municipalities and communities that have elected to partici
pate in AFMA are afforded one representative with voting privileges. These
general voting members serve as elected officers and vote on all Association
business. Associate membership in AFMA is open to all citizens and private
firms with an interest in floodplain management. These members contribute to
the various technical and educational workshops and programs, and provide
valuable input to assist the Association in meeting its goals. AFMA has grown
Smutzer
from 18 general voting members and eight associate members in 1982, to 49
general voting members and 99 associate members in 1985.
O~nization
33
The general voting members hold quarterly meetings at various municipali
ties throughout the state each year to which the associate members are invited.
From the membership, specific committees are formed to concentrate on the
mechanics and goals of the Association.
The training and education of floodplain administrators and associate
members in various technical and non-technical subjects is necessary to enable
the Association to meet its goals and objectives. There are five vehicles
within AFMA to provide training and education: 1) technical and non-technical
seminars held during quarterly meetings; 2) sponsorship of short courses;
3) workshops; 4) quarterly newsletter; 5) participation on ASFPM committees.
Technical and Non-Technical Seminars
Technical Topics
During each quarterly meeting the Association offers technical and non
technical seminars and lectures by its general membership and guest speakers recognized for expertise in their specific fields. The topics are related to
floodplain management problems generally associated with the region of the
state where the meeting is being held. Technical topics have included:
Sand and gravel operations. An actual court case involving a sand and
gravel operator versus Pima County regarding enforcement of its floodplain
management ordinance. The case was used to present the various hydraulic and
geomorphic effects the operation had on existing floodplain development struc
tures (including bridges) and river morphology. The discussion detailed the
impacts on the river system, including headcutting, channel bed degradation and
aggradation.
Case history of bridge failure. Review and analysis by Simons, Li & Associates of a bridge failure due to flooding and erosion caused by upstream
floodplain encroachment. The presentation outlined specific documentation and
photographs detailing the changes to the natural floodplain due to encroachment.
u.S. Army Corps of Engineers Urban Study Program. Explanation of the
procedures for communities to request assistance for flood control projects.
An ongoing urban study program within the Phoenix metropolitan area was discussed in detail to demonstrate the extent of the Corps involvement.

34 ASPECTS OF REDUCTION
~~charge frequency ~f!.~lysis. A presentation by an expert hydrologist on
flood frequency analysis for the Santa Cruz River in Pima County, Arizona.
Due to the discharge recorded during the flood of October 1983 (largest flood
of record), a need to revise the regulatory discharge developed for the Federal
Flood Insurance Studies was apparent. Due to urbanization of the lower portion
of the basin since 1960, in conjunction with increase of average annual rain
fall, frequency of significant floods increased as compared to the record
preceding 1960. By utilizing the annual maximum floods for the past 25 years,
a log extreme value line indicates a threefold increase over the existing
regulatory discharge.
Fundamentals of levee and d~~~~~~. Arizona Department of Water Re sources officials explained their role in the review of design plans, inspec
tion and construction coordination of dams, reservoirs and miscellaneous flood
control projects. Also, discussed were the criteria for obtaining funding
assistance from the state for flood control projects.
Real time flash flood warning. Presentation by Maricopa County Flood
Control District on the selection of equipment, the installation, and function
of precipitation and stream gauges for various watersheds surrounding the
Phoenix metropolitan area.
Other technical topics have included the influence of geology on storm
water runoff management, impact of urbanization on channel stability, design of
protection for existing development on alluvial fans, and soil celllenL appli
cation and use in Pima County for flood control projects. Non-Technical Topics
State legislative issues. Ongoing reports by attorneys associated with
AFMA on proposed state legislative issues involving floodplain management
regulations. These presentations guided the Association's successful effort to improve state floodplain management legislation.
Public immunity laws. Municipal Attorney's definition and interpretation
of immunity protection for public officials. Specifically, public agencies and
employees no longer can rely on good faith immunity as a defense in an immunity case filed against public officials.
Panel discussion. To present various viewpoints, panel discussion have
been held involving representatives from the federal and state agencies, public
and private engineers, attorneys and university professors. Topics have included the Letter of Map Amendment Process, interpretation of state and
Smutzer 35
federal regulations, various floodplain management ordinances, assistance to
smaller communities, flooding on the Colorado River, and the October, 1983, floods in southern Arizona.
Multi-use flood control projects. A presentation on and tour of a unique multi-use urban flood control project given by a former city official. The
presentation included a discussion of the planning and construction of the
project which successfully incorporated flood control design with open space,
parks, golf course and transportation facilities.
Real world data base. A presentation by an aerial photogrammetric firm
on the processes of aerial photography and topographic mapping as it relates to
floodplain delineations. The presentation outlined scheduling of aerial photo
graphy as dictated by weather conditions, types of photographic equipment, and
the various mapping scales and desired accuracy, and the associated costs.
Manufactured housing regulation. Representatives from the State Office
of Manufactured Housing outlined state standards and laws regarding the instal
lation of mobile homes in floodplains. It was noted that due to an unenfor
ceable regulation, neither state nor local building inspectors are inspecting for the required support systems and/or wind tie-downs.
Floodplain management tools for alluvial fans. A presentation by Anderson
Nichols on identifying the flooding characteristics, flood dynamics and flood hazard of alluvial fans. The discussion detailed comprehensive approach to
non-structural floodplain management techniques and structural flood control improvements including planning, design and construction of development on
alluvial fans. A video tape to aide the discussion of a physical model was
shown to demonstrate structural and non-structural approaches to development on
a alluvial fan.
Other topics have included a three-part seminar on non-technical hydrol
ogy, efforts to promote similar organizations in California, Nevada, Utah and
New Mexico, presentation by the U.S. National Park Service and their experien
ces of flash floods and early warning systems, and channel bank erosion and
lateral migration of channels and their impact of floodplain management regula
tions.
Short Courses
AFMA has sponsored two short courses: one with the American Society of
Civil Engineers, and the second as a sole sponsor. The course books used for both short courses were made available to AFMA members who could not attend
36 ASPECTS OF REDUCTION
to insure that all members are familiar with current technology.
Open channel hydraulics. The Civil Engineering Department of New Mexico
State University discussed the fundamentals of open channel flow and gradually
varied flow principles. The intensive, concentrated program also involved the
use of computers to analyze hydrologic and hydraulic problems.
Rainfall-runoff modelling. Consulting engineers from Denver, Colorado
presented the concepts of runoff modelling, rainfall losses, runoff hydraulics,
and applications of computer models.
Wor~shops
In addition to the seminars, AFMA also has had several workshops held between the scheduled quarterly meetings to discuss special problems. Topics
have included legislative issues and review and participation in FEMA's Map
Initiatives Project Study (MIPS). Quarterly Newsletter
The Association publishes a quarterly newsletter to inform members of the
activities in flood hazard management, current and proposed changes in the
NFIP, and important legislative activities affecting state and local flood
hazard management programs. In addition, the minutes from each meeting and
items of interest to the Association members are also included.
ASFPM Committees
AFMA, as a member of the Mapping and Engineering Standards Committee
of ASFPM, played a major role in participating in the Mapping Initiatives
Project Study. Of the 300 nationwide responses to FEMA's questionnaires, more
than 65 questionnaires were completed by AFMA Members. AFMA members participate
actively in various ASFPM committees, and can thereby aid in the dissemination
of information to all AFMA members.

EFFECTIVENESS OF PUBLIC INFORMATION PROGRAMS
DURING 1983 COLORADO RIVER FLOODING
Julian F. Rhinehart Bureau of Reclamation -- Boulder City, Nevada
What once was one of America's wildest rivers is now one of its most important.
Although the majority of its drainage has four inches or less of rain annually, the
Colorado River is a reliable source of water for over 14 million people and one and a
half million acres of some of the world's most productive farmland.
Operated to provide both flood control and much needed water storage, the
Colorado now is also one of the world's most regulated rivers. In order to provide
flood control while still maintaining consistently high storage levels, the ColoradO
River must be controlled to the extent that under normal conditions only enough water
is released from reservoirs to meet downstream water orders.
Although predicted many years earl ier, the conflict between Colorado River
storage and flood control needs did not become visibly evident until 1983 when
unusual conditions combined in an unprecedented manner.
Late spring snows, unseasonably cool weather followed by a sudden heat wave, and
full reservoirs combined to quickly push a slightly above average runoff forecast
into a record inflow in less than a month. Subsequent flood control releases during
the remainder of 1983 created a challenge to both Bureau of Reclamation engineering
and i nformat i on personnel.
From a public information perspective, five pOints stand out in the 1983
Colorado River flood control operations:
1. Colorado River Floodway Encroachment
2. Public Information Efforts Prior to High Releases
3. Public Information Program
4. Position of News Media
5. Reaction of News Media
38 ASPECTS OF REDUCTION
Colorado River Floodway Encroachment
The damage sustained was unusual in that, with one exception, structures damaged
were in a floodway which had been identified over 40 years earlier. These were
structures which had been constructed inside the floodway, and even sometimes between
levees, after the floodway had been defined.
Encroachment in the three-hundred-mile-long floodway between Davis Dam and the
Mexican border occurred primarily on land in private ownership. Problem areas
occurred in each of the three lower basin states -- Arizona, California, and Nevada.
This reach of the Colorado River bisects a desert, and it is one of the few
water resources in the area. Much of the river is just a few hours drive from the
metropolitan areas of Las Vegas, Los Angeles, and Phoenix.
The 1960-1980 push for recreational and second home development occurred during
a 20-year period of artificially low and stable Colorado River flows caused by the
filling of upstream reservoirs. In the absence of rountinely occurring flood control releases and in the presence of newly constucted dams, people gained a false sense of
security. The flood plain was invaded and developed in some areas. Local officials,
often located in a county with a low tax base, were lax in the enforcement of flood
plain regulations.
Public Information Efforts Prior to High Releases
For many years, Bureau of Reclamation and local governmental personnel had been
discussing the inevitable forthcoming high water situation with the local citizenry.
Their reaction was generally polite, but doubting.
As upstream Lake Powell behind Glen Canyon Dam approached its upper levels in
1976, the Bureau of Reclamation published a report forecasting the eventual return to
routine flood control releases. The following year, an information program was
conducted in six of the riverside communities along the lower reaches of the river.
Although well publicized in the news media and supported with informational

Rhinehart 39
pamphlets, the program drew little public interest. This was mainly because it was
being conducted during one of the worst droughts in recent western history.
Two years later, a public information program jointly conducted by the Bureau of
Reclamation and the Corps of Engineers met with little more success. Once again the
same riverside communities were visited, and while meeting attendance was good, the
inevitability of flood control releases was not comprehended. Rather than to accept
the realities of flood control being presented, residents offered objections and
criticism to the flood control release plan being discussed.
Lake Powell behind Glen Canyon Dam filled in 1980, but this was followed by two
dry years. In 1983 the era of artificially low and stable releases in the lower
Colorado River valley came to an end. Forecasted runoff had been only slightly
above normal until mid-May. By June 1 the predicted runoff was 131% of normal, a
figure which would jump to 210% by the end of the month.
Public Information Program
In early June, releases from Parker Dam were increased to 21,000 cubic feet per
second (cfs), a damaging release level. Public information personnel and Bureau
engineers visited the area and met face to face with potential flood victims and
members of the news media. Engineers provided technical information on protective
measures as well as estimates to water level elevations with the flood control
releases.
The Region's river scheduling office initiated telephone contact with emergency
service coordinators in Arizona, California, and Nevada. In the months following,
any change in river operations would be preceded by a lengthy series of calls to
these offices.
Long before the high water became a concern, the regional office in Boulder
City, Nevada, had developed a Public Affairs Plan. It emphasized that the primary
mission of the information program during this time would be to get information out
for the protection of life and property. This effort would be directed to both the
people being affected, and to the news media serving them.
40 ASPECTS OF REDUCTION
An aggressive information effort would be conducted to get river operation facts
out to those most likely to be impacted. The Bureau of Reclamation recognized that while the flood situation was naturally caused, the damaging releases would be
man-scheduled. For this reason some public criticism of their river operations was anticipated. No attempt was initially made to defend these actions. Instead of
attempting to place blame for the flood damage on the people who encroached upon the
floodway, emphasis was placed upon objectively getting the facts out. Bureau
statements were not to be defensive or accusatory.
Nearly all media contacts were coordinated through the regional office rather
than from the field. This eliminated conflicting reports and answers, while at the
same time providing a single contact point for answering questions and quelling
rumors.
Public information personnel, particularly those brought in on temporary duty
from other offices, were encouraged to be both open and responsive to questions from
the public and news media. Both the Regional Director and Regional Public Affairs
Officer, who served as primary spokespersons for the Bureau, provided members of the
news media with their home telephone numbers.
The Regional Director frequently, and in some case daily by telephone, briefed
Congressional staffs from the three lower basin states on forthcoming river
operations. This provided another route for relaying info~ation to their
constituents.
Toll-free 800 telephone lines were installed to provide a daily update of river
operations, levels, and projected changes. These not only were extremely
well-received by the public, but they greatly reduced the number of relatively routine telephone calls which information personnel must handle. These people
remained available to respond to more detailed inquiries.
Position of News Media
Most members of the news media were newcomers to Colorado River operations.
Without background on how or why the river is operated to provide both flood control
Rhinehart 41
and water storage, they had difficulty understanding the significance of the
floodway. Numbers also posed a problem. Frequently reporters would be overwhelmed
with four sets of five digit releases expressed in cubic feet per second. A fact
sheet of river operation terms and procedures would have greatly facilitated their
comprehens i on.
Reaction of News Media
Rather than to explain the facts, many news articles sensationalized and focused
on the damage which occurred. This negative publicity seriously affected the local
economies. Many people normally vacationing on the Colorado River rescheduled their
plans even though some of the river, particularly reservoir areas, remained open to
recreation use. Losses of tourism and recreation revenues exceeded the physical
flood losses sustained along the river in 1983.
After the first wave of sensationalism, coverage of the media was generally fair
and objective, even though usually laced with inaccuracies. A wire service reporter,
unfamiliar with Hoover Dam operations, was told that in a few days water would begin
to flow over the top of the Hoover spillway gates. The next morning newpapers across
the country carried accounts of how water would soon be flowing over the top of
Hoover Dam.
Most of the flooded areas were located in sparsely populated areas without local
daily newspapers or television stations. The most reliable manner of communicating
with these publics through the news media was with their local radio stations, many
of which did not have wire service connections. Any time these media outlets were
called upon for assistance, they eagerly responded with news interviews, actualities,
or talk shows.
Through the channels listed, the Bureau of Reclamation was able to successfully communicate flood information to the victims and the general public. Although they
may not have liked what they heard, for the most part they did understand what they
heard.
42 ASPECTS OF REDUCTION
Though much criticism of the Bureau's river operations was encountered
at first, the initial non-defensive policy of responding just to river operations
eventually paid off. Later in the summer, after emotions had subsided but the high
releases had not, third party spokepersons spoke positively on behalf of the Bureau and its procedure for operating the river.
The centralized media response policy lessened conflicting reports and was most
effective in addressing rumors, but the remote location may have created a feeling of
detachment from the scene and inaccessability.
Two series of Congressional hearings in September and October pointed out that
the Bureau had correctly operated the river and that if changes were in order, those
changes would have to be brought about in coordination with the seven basin states to
whom the river water belongs.
This was substantiated even further the following year when an even larger
runoff occurred in a more traditional manner. Because the initial forecasts were
high, a sufficient amount of space was created in the reservoir system to handle this
inflow with only a minimum of damage.

WISCONSIN'S BOARD OF ADJUSTMENT AND BOARD OF APPEALS
INFORMATIONAL TRAINING PROGRAMS
Ken C. Christopherson Wisconsin Department of Natural Resources
Introduction
Historically, the agencies charged with implementing the state and federal floodplain management programs have always recognized the need for providing program information to both the general public and the local municipality's chief zoning officials. Little effort, however, has been expended to provide good technical information for use by the local city, village or town boards of appeals or county boards of adjustment, who have the statutory authority to grant variances and overturn decisions of the zoning administrator. It has long been recognized that a community can have an excellent zoning ordinance and a good zoning administration staff which administers the local zoning program correctly only to have their decisions overturned by well intentioned boards who are swayed by the emotional issues rather than the factual evidence they are required to consider.
These situations have long been noted and documented through the Federal Emergency Management Agency (FEMA) initiated Community Assistance Program Evaluations (CAPE) and through the Wisconsin Department of Natural Resources (WDNR) program audits which are now being conducted on a regular basis. Based upon these facts, the WDNR has undertaken an effort to develop and disseminate good technical information for these Boards to use. The ultimate objective of this effort has been to improve the decision making abilities of the local boards of adjustment and boards of appeals, thereby maintaining and securing the integrity of the local floodplain zoning ordinance and the state and federal floodplain management programs.

44 ASPECTS OF REDUCTION
Board of Adjustment and Board of Appeals Informational Materials
Wisconsin used a $2,500 training grant obtained from FEMA through Wisconsin's Division of Emergency Government (WDEG) to develop the board of adjustment and board of appeals informational materials. The WDNR contracted with a local attorney who was a recognized municipal zoning authority to develop the materials in a manner applicable to county boards of adjustment and city, village and town boards of appeals.
Although boards of adjustment and boards of appeals are similar in nature, the statutory authority and case law differed enough to warrant individual handbooks to be produced along with separate documents establishing rules of procedure for city, village and town boards of appeal and rules and by-laws governing county boards of adjustment. The remaining information which was developed entailed five checklists addressing the following topics: 1) Procedures for applicants: zoning appeals, variances and special exceptions; 2) consideration of staff recommendations; 3) conducting public hearings and on site inspections; 4) preparing and submitting board decisions; and 5) preparing case files and presentations for court hearings. Contained within these checklists are numerous forms and explanations of how to implement the information into a local zoning program.
Distribution of Materials
In Wisconsin, there are 70 counties and more than 485 incorporated cities and villages which have been recognized as having a flooding hazard potential. All of these municipalities (i.e., counties, cities and villages), were sent a complete packet containing the appropriate information for their respective boards.
Included with the distribution of materials was a letter explaining who could be contacted for additional copies of the handbooks. Sufficient copies of the handbooks were produced so that each member of each board of adjustment or board of appeals in Wisconsin could have a personal copy.
The expenses involved in editing, producing and distributing the packets of information and the handbooks were absorbed by the WDNR.

Chri stopherson 45
Implementation of Training Programs
In an effort to provide a clear understanding of what statutory authority and responsibility a quasi-judicial board of adjustment or board of appeals possesses, a statewide training program was initiated.
City, Village and Town Boards of Appeals
The worm and the University of Wisconsin Extension (UWEX) joined forces in presenting a series of three Educational Telephone Network (ETN) programs presented through a statewide radio telephone system. The UWEX has ETN outlets in central locations within each county in Wisconsin. Because of the relatively large numbers of incorporated municipalities (greater than 550) throughout the state, it was recognized that individual workshops could not be effectively conducted statewide. By utilizing the statewide telephone network system of the UWEX, the entire state was effectively canvased within a reasonable period of time at a minimal expense.
The ETN sessions consisted of presenting and discussing the board of appeals handbook over a period of three aO-minute sessions during which the participants were able to have questions answered through an open discussion format.
County Board of Adjustment
The WDNR conducted board of adjustment informational workshops throughout the state's 70 counties. The local county zoning administrators have an active state organization entitled "Wisconsin County Code Administrators" (WCCA). The organization assisted the WDNR in scheduling and coordinating the date, time and
place of the informational workshops.
Staff from the WDNR comprised of an attorney and myself, as the program staff specialist, have conducted 11 workshops in centralized locations throughout the state. More than 60 of the state's 70 county boards of adjustment and their zoning staff and legal advisors (i.e., corporation counsels or district attorneys) have
attended the informational workshops.
46 ASPECTS OF REDUCTION
Follow-up Informational Programs
Based upon the attendance and discussion generated by the ETN sessions and the county board of adjustment workshops, it is apparent that a real need exists for continued informational programs for not only boards of adjustment and their
supporting zoning and legal staff, but also for municipal planning and zoning committees who are responsible for adopting and amending zoning maps and ordinances.
At the end of each of the board of adjustment workshops participants were asked to complete an evaluation critique. The critiques that were returned were complimentary for both the information contained in the handbook and the opportunity for the discussion during the workshop. The majority of the comments favored the development of a follow-up workshop discussion format which would address such items as what the Board should and should not do when conducting a hearing, how to determine what is and isn't factual evidence, and how to properly document decisions. All the remarks received favored the workshop discussion format and seemed to evolve around one main theme which was that the materials and workshops should have been provided when the floodplain management program first began.
Reports from municipal zoning administrators indicate that their boards of adjustment and appeals have shown marked improvements not only in the hearing
procedures, but also in the manner by which the boards consider the factual evidence associated with the application request, and how decisions are made by applying conclusions of law.

THE EVERGLADES IN SUBURBIA
Alf Siewers Chicago Sun-Times
know a town where local officials spent millions of dollars to build a
system of dikes. The system was unveiled with great ceremony as the final solution to the town's flooding problems, pending completion of a larger
federal project. Spring came, and basements were wet again.
That's typical of the kind of publicity that flood control projects often
garner, and that floodplain management is often unfairly confused with. People
not in the neighborhood tend to see such efforts as ineffective boondoggles,
subsidizing people who shouldn't have built there anyway, or as government
intrusion into private property rights.
Journalists, who often don't take time to know better, cover flood issues
when they reach a crisis, but often don't offer any consistent coverage of
floodplain issues.
What can be done about this situation? suggest the answer is twofold,
and involves substance as well as style. The importance of the topic is
obvious. According to the National Weather Service, flooding tends to cause
greater average annual losses in lives and property damage than any other
natural disaster. At the same time, the whole issue of water management is gaining attention in the media. The Water Resources Council, for example,
estimates that "seventeen subregions have or will have a serious problem of inadequate surface-water supply by the year 2000" (Anderson, 1983). Projecting
a truthful image of floodplain management as a water issue, not just a techni
cal one, and as an environmental approach, not just a public works one, is essenti al.
This is the difference between just larger levees, dams and reservoirs,
and landscaped water parks that also provide water supplies for the community.
It's the difference between headlines about pork-barrel water projects adding
to the federal deficit, and ongoing coverage of innovations that involve pri
vate entrepreneurs and community groups.
Floodplain management itself provides a departure from the necessary but
48 ASPECTS OF REDUCTION
perhaps excessive government approaches of the past to flood control. As one
study concluded of old-style flood control projects, "Flooding eased upstream,
but downstream areas grew increasingly vulnerable as their neighbors upriver
sent them their flood problems, C.O.D." (Krohe, 1982).
Treating floodwater more as an economic resource, as a solution to prob
lems of water scarcity and pollution, will link floodplain management more to
economic development. There are approaches available for making this relation
more clear. In the form of pilot projects, these approaches can garner more
attention for floodplain efforts, become a forum for educating the public, and
answer local officials who fear floodplain management will reduce tax revenues
without tangible benefits.
The use of land treatment methods for dealing with waste and storm water
is an important example, a system that has been compared to a spaceship in its
self-contained potential. (As an aside, I note that one conservation publication in Illinois has suggested sending wetlands into outer space to manage
water resources on space stations.) Such "space age" systems that combine solutions to waste, water and flood problems will capture the imagination of
both the public and skeptical journalists, particularly if their cost-effectiveness holds true in the future. This cost-effectiveness is indicated by the
involvement of private developers.
In Itasca, Illinois, for example, the Hamilton Lakes project of Trammell
Crow Company is using a land treatment system that has significantly reduced
runoff problems. "Outside of Hamilton Lakes," says one description, "hardly
any other community in the nation can look favorably upon urban stormwater as
an added, valuable source of water supply" (Sheaffer and Stevens, 1983). Here,
after government water systems proved inadequate, the company built its own
system by which landscape lakes take waste and storm water from the hotel
complex and filter it back into shallow aquifers through irrigation systems.
Another development, a high-tech park planned for Colorado Springs, Color
ado, is designing a similar system to be run by a special government district
matching the development's borders. The proposal for the district says: "An
innovative on-site wastewater management plan will be incorporated into the
development, providing the basis for recreational open spaces and campus-like
environs, as well as achieving goals of recycling, conservation and efficiency" (Sheaffer and Roland, 1984).
A final example of the type of pilot program that can generate excitement

Siewers 49
among the media because of its larger vision, and among the public because of
potential cost-effectiveness, is the artificial wetland. In the Chicago area, a
private environmental group has incorporated and obtained corporate and govern
ment funds to design such large wetlands on public land along a floodplain.
The environmentalists want to restore an example of the wetlands habitat that
once covered Chicago. Interested officials want to find out the potential for
waste treatment and flood control of such a natural system strengthened by
careful human management. Corporate officials are interested in the potential
of such systems as low-cost (and more aesthetic) alternatives to mandated
treatment plants and drainage systems. Proponents argue it has potential both on a small-scale private level and on a larger scale in public lands along
rivers and streams, where it can double as conservation and recreation land.
That's the kind of happy marriage of interests that the free market
ideally is supposed to foster. And it's the kind of marriage that floodplain
management is all about, and rightly so at a time when people are increasingly
concerned about the cost of government expenditures.
Nobel Prize-winning economist Friedrich Hayek puts it this way: "It is
most important for a healthy society that we preserve between the commercial
and the governmental a third independent sector which often can and ought to
provide more effectively much that we now believe must be provided by govern
ment. Indeed, such an independent sector could to a great extent, in direct
competition with government for public service, mitigate the gravest danger of
governmental action, namely the creation of a monopoly with all the powers and
inefficiency of a monopoly. It just is not true that, as J. K. Galbraith
tells us, 'there is no alternative to public management.' There often is, and
at least in the U.S.A. people owe to it much more than they are aware of. To develop this independent sector and its capacities is in many fields the only
way to ward off the danger of complete domination of social life by government"
(Hayek, 1979).
Of course, there will be a large continuing role for government in flood control. But floodplain management lends itself naturally to this so-called
independent sector. And this kind of private and community involvement not only
ensures that those most interested in floodplain management will be involved
and accountable, it also ensures good publicity and public support for flood
plain management efforts.
How does this work in practice? Let's take a few examples of the indepen-
50 ASPECTS OF REDUCTION
dent sector in action. It can start with something as small as a Boy Scout
troop adopting a wetlands area as an ongoing conservation project, or adoption of a floodplain area by a local Audubon Society. In Chicago, an Audubon chap
ter actually owns a few acres of land in a marsh that it is working to turn
into a larger park, using flood control as an argument. In Elgin, Illinois, a
private game preserve owns a large tract of land along a river where it is
restoring a wetlands area that will benefit flood control.
The potential for large-scale and consistent involvement of the indepen
dent sector in floodplain management is indicated in the efforts of Ducks
Unlimited, a group that has collected money from thousands of individual
hunters to create wetlands preserves covering millions of acres in Canada. Now
this same group is providing matching funds to state governments for wetlands
efforts.
Creating tax incentives for open lands along floodplains and preservation
and creation of wetlands is an important policy tool for future private-sector
involvement in floodplain management. Further development of legal tools is
important as well. Ducks Unlimited often purchases conservation easements and
creates land trusts; such mechanisms, as well as deed restrictions and covenants, could be a creative, popular, and economical supplement or, in some
cases, alternative to centralized floodplain planning. And obviously insurance
companies have an important role to play in this process as well. The potential for such involvement for both flood control and environmen
tal preservation has been indicated in studies done by the Political Economy
Research Center at Montana State University (Baden and Blood, 1984). Resource
economist Terry Anderson has raised the possibility of revising water law to
establish clearer property rights to water and greater accountability for water
runoff, thus increasing incentives for floodplain management.
Administratively, devices such as user fees and consolidation of parks and
flood districts need to be examined. New EPA mandates on storm runoff may be a
vehicle for change. These efforts will create interest in floodplain manage
ment, greater awareness of floodplain efforts, and build support for projects.
People need to be told what they can do as individuals. Besides holding
subsidized insurance or keeping a portable radio handy in case of flood, neigh
borhood groups should be given information on how creation of small fenlike
areas of yards and parks can make for better management of storm runoff and floods. Home owners can be told how grading of land and planting of shrubs can
Siewers 51
prevent runoff pollution. Tax incentives could even be offered for such very
local efforts, which will also increase media focus on floodplain needs as a
consumer issue.
Finally, I'm reminded of a friend of mine who is a Potawatomie Indian. He
once took me on a tour in his pickup truck through Chicago's south suburbs,
pointing out where ancient trails and villages of his people were. Here were
the swamps, here were the highlands where the trails ran, he'd point out. He
told of how the marshes once rivalled the Everglades in size, extending far
into Indiana, providing Indians with bountiful hunting and fishing as well as
sanctuary from enemy raiders.
I think his favorite point on the tour came as we passed a spanking new office development. "They built that on a capped spring," he said, shaking his
head. "They don't know you can't really cap a spring."
Then he let out a whoop and pointed. Along the side of the building was a
small lake where the parking lot was supposed to be. "Now they're so worried
about water supplies," he said. "Well, the water was all here."
It still is. And whether you're a Potawatomie or not, that vision of the
interrelatedness of floodplain and water issues will go a long way toward
improving media coverage of floodplain management.
References ---------Anderson, Terry L. 1983 Water Crisis: Ending the Policy Drought. Washington, DC: The Cato
Institute.
Baden, John and Tom Blood 1984 The Spring Creek-Prairie Pothole Paradox. Bozeman, Montana:
Political Economy Research Center.
Hayek, Friedrich A. 1979 Law Legislation and Liberty, Volume 3. Chicago: University of
Chicago Press.
Krohe, James Jr. 1982 Water Resources in Illinois: The Challenge of Abundance. Springfield
Illinois: Illinois Issues.
Sheaffer and Roland, Inc. 1984 Nova Metropolitan District Service Plan. Chicago, Illinois.
Sheaffer, John R. and Leonard A. Stevens 1983 Future Water. New York: William Morrow and Company.
AT-RiSK RESIDENTS' KNOWLEDGE ANU BELIEFS ABOUT STRUCTURAL
AND NONSTRUCTURAL FLOOD MITIGATION ACTIONS
Shirl ey Laska
Department of Sociology
University of New Orleans
Introduction
Recently a newspaper editorial appeared in the local newspaper of a Louisiana
cOOlllunity which is in the process of detennining how best to protect itself fran a
repeat of three devastating floods which have occurred in the 1 ast six years. The
editorial was in response to the final publ ic meeting held by the U.S. Anny Corps of
Engineers on a proposed levee system. The canmunity has been infonned that the cost
to the community (with the proposed new cost-sharing ratio of 65/35 will be 7
mill ion dollars). The canmunity has several concerns: whether the federal govern
ment will actually fund the project, how they will fund the canmunity's portion of
the cost and why the 1 evee wi 11 not protect all affected neighborhoods.
Sane six years after the first major flood and two years after the initiation
of the Corps's study to suggest flood mitigation action the editorial states:
"In view of this (the problems cited above), local officials and
the publ c might do well to explore Grice!' FZ~od contPOZ pPOtcction
meaBUy'e" (ital ics mine) that wouldn't require federal doll ars."
(Sl idell Daily Times, April 19, 1985)
It is the contention of thi s author that to have such a statement made by a
seriously and repeatedly flooded canmunity some six years into the process of deter
mining flood mitigation action is an indicator of a planning and decision-making
process much in need of rev ision both in terms of the steps taken and second in
tenns of the options provided.
While the actual implementation of the flood mitigation actions has been gener
ally in the hands of government officials, the decision-making process as to which
mitigation actions are to be taken is a shared one between residents and official s.
It is evident fran the violations of FIA flood elevation requirements that when the

Laska 53
government decision to implement a mitigation action is not supported by the local
community, limited effectiveness will be realized (Houck, 1984). It is also evident
that as the local community is forced to pay a larger portion of the bill, the
community will becOOle even more the locus of the decision-making. And, in addition,
to the extent that individual homeowners COOle to determine that individual household
mitigation actions may be cheaper and more controllable than publ ic ones, the locus
of decision-making will becOOle even more "local," in this case household based.
If these proposed assumptions about the locus of decision making are correct,
it follows that affected residents of flooded communities should be seen as key
"actors" in the efforts to reduce the impact of flooding and the cost of damage.
However, as the above editorial impl ies, the 1 evel of knowl edge about possibl e flood
mitigation actions may be very 1 imited and may be quite uneven among types of action
and types of residents. It is the goal of this research to examine empirically the
1 evel of knowl edge and bel iefs which are held by at-risk residents about both
structural and nonstructural flood mitigation actions.
Methods
The community of Sl idell, Louisiana is a small-town turned suburb of New
Orleans sOOle 30 miles northeast of the city. It is located in St. Tammany Parish,
one of the 12 fastest-growing counties in the United States. The topography of the
community is flat and laced with rivers and bayous. It is located both within the
floodplain of the Pearl River and the coastal zone adjacent to Lake Pontchartrain, a
brackish body of water sOOle 30 by 50 miles wide connected by passes to the Gul f of
Mexico. The residents of the community have migrated there either from the inner
city areas of New Orleans or from out-of-state as a result of federal government
aerospace industry and other federal government fac il ities. The income of the
community does vary although the middle and upper middle classes predOOlinate. The
community experiences three types of flooding: fl ash, river and lake (ocean) and has
been seriously flooded three times since 1979, the last time in 1983 when over 750
houses were flooded and some 3500 people were affected.
The data reported herein were collected by the administering of a 10-page, 135-
item questionnaire to residents 1 iving on streets which had been flooded in the 1983
flood to the extent that at least one house had been flooded. SOOle 31 neighborhoods
54 ASPECTS OF REOUCTION
--distributed among the three types of f1ooding--were identified as the most seri
ously flooded and residents in them surveyed. The response rate was 43 percent
which yielded 897 questionnaires.
Findings
Residents were asked to review a list of flood mitigation actions. Included in
the 1 ist were both structural and non-structural actions which could be taken either
prior to residential development to prevent flooding or after development to reduce
future flooding and damage. The actions were obtained from numerous studies of
flooding and were restricted to those which appeared to have re1 evance to the
flooding in Sl ide11. Respondents were asked to indicate (1) if they were fami1 iar
with the terms, (2) if they bel ieved in general they are useful and (3) if they
bel ieved the actions would be useful in their neighborhood or home.
Out of the 23 mitigation actions mentioned the average number of actions with
which respondents were fami1 iar was 16.4 (71 percent) lsee Tab1 e 1). The structural
actions were the most well known (84 percent) while the non-structural the least (65
percent). House fl oodproofing actions were in the midd 1 e (74 percent). Resident
knowl edge of specific actions al so shows that structural changes are much more
ccmrnonly recognized than is floodproofing and especially the nonstructural actions.
The least well known of the structural--diverting the flow with dams--was famil iar
to 75 percent of the respondents.
The nonstructural actions were sharply dichotomized between those with which
the respondents had famil iarity and those which they did not. Four nonstructura1
actions--acquiring flood insurance, restricting neighborhood density, hav ing fl ood
gauges in pl ace to prov ide early warn ing and the purchase of hanes by the government
ranked high in recognition. However, considerably less well known were those
actions which would resul t in the government control 1 ing floodplain development:
restricting of the types of use of the fl oodpl ain, the transferring of development
rights and the actual acquisition of the floodplain by the government. Also in
c1 uded in the group with which the residents had 1 itt1 e famil iarity was the enforce
ment of the 100 flood elevation. That only a small percentage (40 percent) indi
cated know1 edge of this action is very surprising. Two possibi1 ities exist. First
the phrasing of the question may have been confusing. It was phrased, are you

TABLE
I
kHO
I/LEDG
E AND B
EL
IEfS ABOUT FLO
OD
M
ITIGA
TION
A
CTION
S (STRO
CTURA
L AHD N
ON
STROCTU
RAL)
BY AN
AT
-RISK
PO
PULA
TION
I~ A
CTION
U
SEFUL
IN
NEI6H
BORH
OO
Il
TYPES
Of
ACTIO
N
FAM
ILIAR
A
CTION
U
SEfUL
TOTA
L W
ITH A
CTIO
N
IN
GEN
ERAL
C~posi te
Sco
re 1
2.S
9
.1
4.6
3
.3
3.5
6
.2*
6
.6*
6
.0*
( .. an
' actio
ns o
ut o
f 17)
Stru
ctu
ral
Coaoposite
Sco
re (ou
t of 9
) 7
.6
5.S
3
.2
2.5
2
.3
4.2
*
4.4
*
4.0
*
lion S
tructu
ral
toap
osite
Sco
re 5
.2
3.3
1
.4
.9
1.2
2
.0*
2
.3*
2
.0*
(o
ut o
f S)
Stru
ctu
ral A
ction
s (p
erc
en
t)
Rellove o
bstru
ctio
ns
92 85
60 54
35 75"
SO*
72* Im
prove storm
dra in
s 92
SI
62 7b"
55 54
63 69
Bu
ild p .
. pin
g sta
tion
s 92
7J 40
47 51 *
29 33
44 A
dju
st roiidbeds 90
80 54
43 36
71* 71*
67* B
uild
gen
eral lev
ee system
S6
62 2S
10 15
4S
" 4
3*
3
6
Dredge ... te
r ... ys
85 64
35 10
14 66*
66* 4S
* B
uild
h
old
ing
ponds
79 44
13 12
9 1
8
12 IS
B
uild
ring
lev
ees and walls
77 51
21 2
8 43*
43* 30*
Div
ert flo
w w
ith d
cs
75 45
13 4
6 25*
25* 21
No
nstru
ctura 1 A
ct ion
s
Acq
uire fl ood
insu
rance
93 7S
54 37
49 70"
74* 72*
llestric
t neig
h.
den
sity
82 54
20 25
J7 20
21 24
Flo
od
warn
ing
: flo
od
g
aug
es S
I 54
22 10
IS
36* 38*
27* G
ovt p
urch
ase of h
on
es 81
26 9
I 4
17* 24*
IS-
Restr itt ty
pe o
f use
55 44
15 8
12 23*
21 20
Govt acq
uire
floo
dp
la in
55 26
9 S
S 12
14 13
En
force flo
od
ele
vatio
n
40
35
16 9
12 25*
24 20
Tra
nsfe
r dev
elop
oen
t righ
ts 36
16 6
6 2
7 9
9
Flo
od
pro
ofin
g
Coaoposi te
Sco
re 3
.6
1.6
.6
.3
.6
.8
1
.0-
.9-
(Out o
f 5)
Floodollaoofing H
OllIe
F1 w
alls o
r .ini
levees
85 46
19 5
12 3
4-
42
-3
4-
Pie
r co
nstru
ctio
n o
r lDO
dif. 77
26 12
I 2
2-
17 22*
17 F
i 11 co
nstru
e tion
75
37 17
J1 23
17 15
18 ljain
scoated
sealed
walls
67 29
8 6
8 9
11 12
I~ "W
rapping" house
65 27
8 7
9 9
11 16*
MinillU
lll ,.,.498
n=250 133
300 142
_J88 ·sig
n1
f1can
t <.001

56 ASPECTS OF REDUCTION
famil iar with: "enforcing the IOU-year flood elevation"? If the low rate cannot be
attributed to the phrasing, the finding is particul arly significant given the fact
that the el evatiny of structures to above predicted flood level s is at the core of
the FEMA program and ignorance on the part of the homeowner that such a requiremment
exists puts all of the responsibil ity of compl iance on the developer and the per
mitting agency.
Turning to the fl oodproofing actions it ev ident that a good deal is known about
such activities. Even the "wrapping" of homes--a relatively recently-proposed, and
not well developed technique was known by 65 percent of the respondents. That "pier
and fill construction" (phrased this way) were less well-known than flood wall s or
1 evees may be an artifact of the phrasing. If it is not, again the impl ications of
only 77 and 75 percent recognition are considerabl e given that these actions are so
commonly used to elevate homes above the flood level.
Examining the residents' perceptions of the util ity of the mitigation action in
general, it is ev ident that the opinions vary considerably more than the knowl edge
level. The bel ief that providing for a more rapid drainage of the water from
flooded areas is the direction mitigation action should go is strongly held. Much
less confidence is expressed in levees, flood walls, and adjustments to major water
ways such as dredg ing and dams. These opin ions are interesting in 1 ight of the
(;orps 1 evee proposal. Locdl support for raising the community's cost sharing contri
bution may not be forthcoming.
Nonstructural actions take a dramatic decl ine from recognition to uti 1 ity.
Only flood insurance is seen by more than half of the respondents as being useful in
general and only one restriction on development of the floodplain--limiting neigh
borhood density--was considered useful by even hal f of the respondents. Floodproof
ing actions 1 ikewise fell considerably in support from the 1 evel of recognition.
Only flood wall s or mini 1 evees were perceived by about half of the respondents as
having general utility.
Turning to the question of specific uti 1 ity of the mitigation actions for the
neighborhood and home of these at-risk residents, it is possible first to see that
there is 1 imited support for the appropriateness of the mitigation actions for the
respondents. The average nlJ11ber of structural/non structural actions which respon
dents support is 4.6. And for f1 oodproofing, only .6. Noteworthy al so is the
considerable range of opinion.
Laska 57
In order to consider the perceived util ity of specific mitigation actions for
these residents it is useful to separate the residents according to the types of
flooding which they experience as well as the severity of their flooding and their
perceptions of future risk. It is ev ident from the breakdown of the composite
scores that those individuals who are flooded by river floods, those most seriously
flooded and those who perceive that they will be most likely to flood in the future
are supportive of the greater number of mitigation actions. Specifically, those
resident who experience river flooding are significantly more likely to be support
ive of all structural actions except for storm drains and pumping stations, tne
latter both more useful in flash floods. As severity is very strongly associated
with type of flooding (river flooding) and perceived risk 1 ikewise somewhat strongly
associated, the same structural actions emerge as significant for these two sub
groups.
Turning to the nonstructural actions, the first striking finding is the low
support for any of the actions. Flood insurance is seen only by half of the respon
dents as useful to their neighborhoods. Managing the density is only approved of by
20 percent of the residents while those actions which would give government consid
erable control over the floodplain are almost universally rejected. Looking at the
differences between types of flooding, the river-flooded emerge as more supportive.
However, those most severely flooded and who anticipate future serious flooding are
only more supportive (at a statistically significant level) of flood insurance,
flood gauges and gov ernmen t purchase of homes.
Finally, support for the floodproofing of homes is almost unanimously rejected
by the total sampl e. Several actions emerge as more popul ar with residents experi
encing different types of flooding: fl ood wall s for river flooding and pier con
struction for the 1 ake fl ooding. Those most severely flooded are in favor of flood
wall s (the highest support given with 42 percent) and pier construction. And those
who perceive future risk are twice as 1 ikely to support the "wrapping" concept.
Con c 1 us ions
In summary the findings indicate considerabl e knowl edge about structural miti
gation sol utions with considerably less awareness of the nonstructural and flood
proofing actions. The findings al so indicate 1 imited support for the uti 1 ity of the

58 ASPECTS OF REDUCTION
actions in general and specifically in the respondents' neighborhood or hane, espec
ially the nonstructura1 and f100dproofing. As it hdS becane increasingly evident
that floodplain development has not been curbed sufficiently by regulation nor
structures adequately protected by the hoped-for e1 evation of structures above flood
stage, it has becane popu1 ar to emphasize nonstructura1 and f1 oodproofing actions as
viable alternatives. The findings of this study however indicate only 1 imited
support for such actions by flooded residents even when the actions are proposed for
f1 oodp1 ain residents in general and the respondent does not have to cane to grips
with whether they themselves would wish to "endure" the solution. Such a 1 imited
acceptance of the nonstructura1 suggests considerable difficulty in developing a
community consensus for their use. The response to the question of the uti1 ity of
such mitigation actions for residents' own neighborhoods and homes reinforces the
pessimistic outlook. Once a person owns a hanes in a floodplain, they are unwilling
to accept or perceive as ineffective most possibl e mitigation sol utions, especially
nonstructura1 and f10odproofing.
It appears ev ident from these find ings that more emphasi s must be pl aced on
developing nonstructura1 actions (U.S. Army Corps of Engineers, 1983) and that
educational programs must be developed to inform at-risk homeowners and communities
of mitigation possibilities (Motz, 1983). But it is also evident that care must be
taken to (1) be sure that those actions proposed are v iab1 e, useful sol utions and
(2) that the re1 uctance and uncerta inty with which residents appear to approach
mitigation are taken into consideration. Homeowners appear to have a perceived
personal benefit/cost ratio which causes them to reject mitigation sol utions, espec
ially non structural and f1 oodproofing. This ratio must be understood by f1 oodp1 ain
managers and greatly modified--both the perception and the real ity (Ill inois Depart
ment of Transportation, 1984)--in order for mitigation to actually be the fruitful
program wh ich it appears flood p 1 a inman ager s ar e coun t ing on.
This work is a result of research sponsored by the National Oceanic and
Atmospheric Aaninistration, Office of Sea Grant, Department of Commerce, under grant
No. NA81AA-D-00103. The University of New Orleans Sea Grant activities are a part
of the Louisiana Sea Grant Program which is a<ininistered by Louisiana State Univer
sity.

Laska 59
References
Houck, 01 iver A. 1983 The Nationa 1 Flood I nsurance Program and ~ State .Q!. Louisiana:
The View from Downstream. Center for LegalStudies on Intergovernmental ReT ations-;-TUl ane Un iv ersity.
Illinois Uepartment of Transportation, Division of Water Resources. 1984 "A Proposal to Reduce Federal Flood Subsidies." June 8. Unpubl ished docu
ment.
Motz, Annabelle B. 1983 Nonstructural Flood Control Measures: 'l Sociological Study.Q!.
Innovation. Ft. Belvoir, Va.: Institute for Water Resources, U.S. Army Corps of Engineers.
U.S. Army Corps of Engineers 1983 Seminar Proceedings: Implementation of Nonstructural Measures.
POllCY Study 83-G520. July.
COMMUNITY RESPONSE TO RECURRING AND NONRECURRING FLOODS!
George Oliver Rogers University Center for Social and Urban Research
University of Pittsburgh
Abstract
Analysis of communlty response to recurring and nonrecurrlng floods has significant implications for flood preparedness programs. Comprehensive flood preparedness takes advantage of the most adaptive characteristics of public response to floods. In dealing wlth the community subjected to a flood, perhaps for the first tlme in recent history, utilized in enhancing adaptive
lessons from recurring flood communities can response. Conversely, the adaptive aspects
be of
response to nonrecurring floods can be used to lncrease adaptive behavior in areas where floods recur with some regularity. This paper examines the nature of this cross-over effect and its implications tor community preparedness programs.
Introduction ----------
flooding may wei I be one of the least problematic hazards confronting human society. While it effects a large proportion ot the population, frequent experience with floods and its relatively predictable nature, reduces the band of uncertainty associated with community exposure to floods. Rossi et ~ (1983) describe the victimization rates for various hazards. ~Iood victimization by region of the country ranges from a high of 31.7 in the Middle Atlantic States, to 10.7 victimlzations per 1,000 households in the Pacific States. Like emergency preparedness otficials, people use thelr database of (emergency) experlence in responding to the lmpending hazard. Rogers (1984) conciudes that the experience of living near nuclear power plants has a direct impact on our attitudes about their operation, safety and acceptability. A minimal linkage between prior experience with various hazards, and perception and recognition ot other hazards has been suggestea (c.f. Rogers, In Press). rhis paper addresses the general issue concerning the use of experience with a single hazard in making an adaptive community response. To what extent can emergency preparedness take advantage of the
1. This research was partially supported by the Federal Emergency Management Agency (Cooperative Agreement No. EMW-K-I024). This paper has not been reviewed by FEMA and in no way reflects the views or policies of the Agency. The Author accepts full responslbility for th contents herein and gratefully acknowledges the support. comments and criticisms offered by colleagues at the University of Pittsburgh and the Association of State Floodplain Managers Ninth Annual Conference.

Rogers 61
experiences of communities with different flooding histories. The more specific question examines community response to floods, how the experience gained in communities stricken with recurring floods may be used in responding to floods in nonrecurring communities, and how experience w1th relatively rare floods can inform emergency preparedness plans in communities of recurring floods.
Experience ana Recognition of Hazard
Public recognition of hazard reduces the uncertainty associated with hazards by delineating the relatively r1sky and potentially risky from the less risky. Public recognition of hazard seems to rest on a foundation of experience and social values (Rogers, In Press). Historically people have relied on actual experience with hazard as the primary mechanism tor recognizing potentially hazardous situations. Many hazards have limitations on actual experience, either because of the limited duration of the experience, or because of the delayed or hidden aspect of the consequences of part1cular (usually technology based) risks. Because ordinary knowledge 1S comprised of exper1ence, and the perception of hazard rests firmly on this data-bank of knowledge, prior experience, hazard perception, and emergency response are inherently related. Whi Ie it m1ght be argued that prior emergency experience has historical meaning beyond the particular hazard, by reflecting a self-efficacy associated with dealing with crisis, reported experience and estimated likelihoods seem to be most strongly related among simi lar hazards (Rogers 1983 and In press). Furthermore, the strongest relationships among experiences and estimated likelihood of risk result under conditions of exposure to single hazards, particularly flooding and hurricanes. in that order. Hence, the examination of community response to recurring and nonrecurring floods addresses the implications of prior experience for emergency preparedness under favorable conditions. This paper considers the extent to which prior aggregate flooding experience in a commun1ty may be used to enhance emergency preparedness for flooding under other circumstances.
Adaptive Response to Flooding
fypically adaptive response to flooding is considered as either structural or nonstructural. Another way of class1fying adaptive responses to flooding describes the nature of the response in terms of required level of investment, effort, and coordination. Structural mechanisms are usually employed at the community, or regional level. Technological in nature, they often require considerable investment in achieving effectiveness. Primary examples include the achievements of the Tennessee Valley Authority and the extensive technological accomplishments in the New Orleans area. Technological responses to flood also include weather monitoring

62 ASPECTS OF REDUCTION
technologies (e.g. sate I lite ana ground station weather monitoring). These technological systems are typically designed to enhance warning time, and monitor flood progress10n in an area (Curtis 1985).
Organizational responses are usually directed at regional, neighborhood level adaptation to flooding. While some communities and
community or neighborhoods
take advantage of technological mechanisms, organizational predominantly used by local governments. Organizational responses laws and flood insurance programs are wei I known (Lally 1985), but large-scale sandbagg1ng and sheltering (e.g. Salt Lake City,
responses are such as zoning other efforts at UT) also reflect
organizational etfort. More indirect organizational responses inclUde the monitoring of weather, snowpack and river systems, warn1ng and 1nformation systems. While many of these systems are technological in nature, reasonably effective organ1zational systems can either stand alone or work in conjunction with available technology.
Indiv1dual or household response to tlooding is comprised of adaptive mechanisms employed by individuals or small groups, often iamil1es. Because people tend to respond to impending crisis in family groups, the individual/household responses to floods playa central role in overall flood m1tigation (Rogers and Nehnevajsa 1984, Mileti, Drabek and Haas 1975, Perry Lindel I and Greene 1981, Flynn and Chalmers 1980, Drabek 1984 and Drabek and Stephenson 1971). Hence, it is extremely important that flood pla1n managers understand the dynamics of public response to flooding so that they are aole to develop etfective emergency plans. Inaividual/household level adaptive action usually consists of relatively simple actions taken in response to impending danger. Laska (1985) examines public awareness and perceived usetulness of a broad range ot flood mitigation actions, while implications of residential choice, as one 1ndividual/household mechanism for flood mitigation, is discussed in terms of purchase behavior (Cross 1985).
Public Response and the Cross-Over Effect
Public response to recurring flooding is characterized by an experiential based understanding or the subjective mean1ng of the impending event. Prior flood exper1ence under relatively unchanged local conditions creates a contextual meaning for rlood warnings (e.g. flood stages interpreted in terms of the meaning established by prior reported or anticipated water levels). The prior flooding exper1ence 1n a given community or region also establishes the nature of adaptive responses in terms of the timing of potential onslaught and utility of specific actions. People exposed to recurring floods are likely to be operationally better equipped to deal with the implementation of emergency procedures. For example, they
63
are likely to know how to fill sand bags, what things to move, where, how and when to turn off utility service, and in general, the effectiveness of alternative actions. In essence, they have had the opportunity to learn trom their PdSt experience with the hazard. Conversely, to the extent that prior experience is inadequate, in the sense of being significantly different from the impending hazard, potentially adaptive response is degraded. rhis arises when: a) inappropriate responses succeed in prior experlence, or b) the impending event is potentially devastating beyond expectations fostered by prior events, or c) prior experience is with particularly devastating events. Success of prior inappropriate activities and impending rare events tend to render inadequate response to hazard, whi Ie prior experience with particularly devastating events can lead to over response and misuse of scarce resources. rhe critical point is to help people, emergency officials and public alike, distinguish between the relatively "rare" and "routine" emergencles.
Public response to nonrecurring floods is characterized by a marked need for lnrormation concerning adaptive activity. Without prior experience people are left to adapt rather spontaneously to the changing environment. Hence, the public must be alerted as to the potential for hazard, and notified concerning appropriate actions to be taken in response to the impending hazard. The absence of hazard experience provides the emergency manager with some advantages. For example, it is somewhat easier to contrast crisis with the relatively normal, than it is to distingulsh varying degrees of hazard. rhe lack of hazard experience can leave people to improvise appropriate emergency action, but the emergency manager can emerge as the authoritative leader by directlng the response to effective ends. People wlthout experience may indeed turn to the emergency official for guidance in the emergency period. People in nonrecurrlng flood communities are likley to need greater specification ot activlty than their experienced counter-parts --- including the appropriate timing of adaptive response. People are likely to find suggestions regarding appropriate actions useful (e.g. locating and unifying family, areas of potentlal flooding, where to go, what to take, where to meet with family, actions to take prior to evacuation). In essence, a need to teach people concerning their response to the impendlng flood is likely, but emergency officials must exercise care not to patronize their constituents.
The cross-over effect from recurring to nonrecurring flood situations takes advantage of enhanced knowledge associated with prior experience. The experience of communities subjected to repeated flooding provides information concerning the effectiveness of individual/household acts of protection and avoidance. Such experience provides direct opportunity for evaluation of existing programs (e.g. zoning, flood insurance, and existing emergency plans and preparedness). In short, repeated flood experience provides information concerning the programs that work,

64 ASPECTS OF REDUCTION
and may suggest modifications needed for communities with different flood problems. People in communities with recurring flood situations nave an existing knowledge base wnich helps them distin~uisn the ut11ity (vs. futi lity) of specific behav10rs. fhis 1S in marked contrast to the need for information (i.e. locus and t1ming of impact, and adapt1ve behavior) 1n nonrecurring flood communities. Establisning the experiential context for flooding situations serves not only to get people's attention, but determine their information needs. Providing too much information can De patronizing, While providing too little may leave people unable to respond etfectively. People respond to emergencies on the basis of now the warnings stimulate them to behave (Rogers and Nehnevajsa 1984 and White and Haas 1975), but that behavior is directly intluenced by the prior experience context. Hence, it is rundamentally important to understand that context and compare and contrast the anticipated event with prior flooding experience in the community. The experience of other communities besieged by floods is important in repeatedly flooded communities when the impend1ng tlood 1S a "rare" or particularly devastating event. By establishing the experiential context, and comparing the impending event to prior exper1ences emergency officials are most likely to elicit an adaptive response trom potentially impacted people.
Conclusions and Implications
in communities where the knowledge base is rather extensive, like it often is in communities with a recurring flood problem and a relatively stable population, emergency officials are primarily respons1ble tor making existing programs available to the public, accurately comparing impending events with prior experience and assisting the public response. Hence, people in recurring flood communities share tne responsibility for knowing about appropriate behavior and available institutional support systems in the community. Emergency managers may effectively rely on institutional support when these support systems are relatively well developed --- as they often are in commun1ties besieged by repeated floods. While emergency preparedness drills are very important tor effective emergency preparedness, they may be less important for communities impacted by recurring floods because of the experience of repeatedly responding to actual hazards. In nonrecurring Tlood communities, flood dri lis comprise a significant part of the contextual exper1ence, and are thus extremely lmportant in obtaining adaptive public response.
Emergency management based on a comprehensive understanding of underlying social processes places emphasis on programs that work effectively with a minimum of authoritative control. Emergency management officials can systematically take advantage of likely adaptive responses while avoiding associated pitfalls, by
Rogers 65
understanding the existing knowledge base created by prior experience. Emergency managers may minImize costs by identifying clear need for specific programs, using standards and regulations to fi I I significant gaps in "natural emergency" preparedness. Reguiations and standards set wIthout such Identified need are likely to be ineffective at best. Regulations, standards and social process assocIated with emergency management are local abominations of global and more abstract measures of flood plain management. A natIonal policy of flood plain management cannot De used wIthout careful consideration ot local cIrcumstances any more than water resource policy can be established nationally. People, like watersheds, have dIfferent character, they bring aifferent resources and understanding to emergency situations. When flood plain management accounts for these differences it is most likely to De effective. Establishing the existing knowledge base and effectively relating the pending event to events ot the recent past are fundamentally important in maximizing adaptive public response in emergency situations, while minimizing cost.
Reterences
Curtis, David C. 1985 "How Do You Let Somebody Besides the Computer Know What's Going On?"
~resented at the Ninth Annual Conference of the Association of State Floodplain Managers (April 29 to May 3, 1985), New Orleans, LA.
Cross, John A. 1885 "Residents' Awareness of the Coastal Flood Hazard," Presented
at the Ninth Annuai Conference of the Association of State Floodplain Managers (April 29 to May 3, 1985), New Orleans, LA.
Drabek, Thomas E. 1984 "Human Response to Disaster: An Inventory of Sociological Findings,"
Dept. of Sociology, U. of Denver, Denver, CO.
Drabek. rhomas E. and John J. Stephenson 1971 "l·Jhen Disaster Strikes," ~ of ~ Social Psychology
Vol 1:p187-203.
Flynn, C. B. and J. A. Chalmers 19BO The Social and Economic Effects of the Disaster at Three Mile
Island U. S-:-Nuclear Regulatory Commission, ~JashTilgton D.-Y:-
Lally, NiCholas 1985 "Flood Insurance and Its Relationship to Flood Plain Management"
Presented at the Ninth Annual Conference of the Association of State Floodplain Managers (Aprii 29 to May 3, 1985), New Orleans, LA.
Laska, Shirley 1985 "Types of Adaptation to Repeated Flooding," Presented at the Ninth
Annual Conference of the Association of State Floodplain Managers (April 29 to May 3, 1985), New Orleans, LA.
66 ASPECTS OF REDUCTION
Nileti, Dennis S., Thomas E. Drabek and J. Eugene Haas 1975 Human System in Extreme Environments Institute of Behavloral
SClence, U. of Colorado, Boulder, CO.
Perry, Ronald I~., Michael K. Lindell and Marjorle Greene 1981 Evacuation Planning i.!! Emergency r~anagement Lexington, Mass.,
Lexlngton Books.
Rogers, George O. 1983 roward ~ Sociology Qi Risk: Values, Experience, Perceived and
Acceptable Risk, Ph.D. Thesis, U. of Pittsburgh, Pittsburgh-:-PA.
1984 "Reslaential Proximity, Percelved and Acceptable RiSk," In LowProbabi Ii ty/Hi gh-Consequence Ri sk edi tea by Vi ncent Cove 11 a and Robert Waller, Plenum Press, New York.
In Press "Public Recognition of Hazard," In Uncertainty i.!! Risk Assessment, Risk Management and Declsion Making, Vincent Covello et ~ (eds), Plenum Press, New York.
Rogers, George O. and Jiri NehnevaJsa 1984 Behavlor and Attitudes Under Crisis Conditions, Government
Printlng Office, Washington D-.C-.-
Rossi, Peter et al. 1983 Victims of the Environment, Plenum Press, New York.
White, Gilbert F. and J. Eugene Haas 1975 Assessment of Research on Natural Hazards, M.I.T. Press,
Cambridge Mass. - --- ---
EMERGENCY RESPONSE AND LAND USE MANAGEMENT PLANNING: THE HURRICANE ALICIA DISASTER
Philip Berke
Texas A&M University A. Kim Ludeke
Texas A&M University
Introduction
Hurricanes are a serious national problem. Average annual losses from hurricanes have been projected to reach $5 bill ion (1978 doll ars) by the year 2000
(Wiggins 1979). Some officials alarmed at intensive coastal population growth pressures and increasing time required to evacuate residents from high risk areas
have described hurricane scenarios that could claim the 1 ives of more than 10,000 people in large metropolitan areas (Simpson and Riehl 1981).
Traditionally communities have responded to the risks posed by hurricanes by adopting emergency response and land use management planning programs. Emergency response planning programs are concerned with identifying problems that might arise during a disaster and subsequent design of plans of action aimed at coordinating the
immediate response and recovery activities of public and private groups and individuals. Land use management planning programs, on the other hand, deal \;ith
long-term risk mitigation issues by attempting to influence the location, density and design of public and private development in hazardous areas.
In this paper, we examine the effectiveness of local emergency response and land use management planning programs during the Hurricane Alicia disaster in August 1983.
The primary purpose of this examination is to identify the factors that help explain
program effectiveness. The authors also draw some preliminary conclusions about the success of local response.
Data on local response to Alicia were collected through a mail-out questionnaire
to 51 jurisdictions within the impact area during the fall of 1984. In those communities with both an emergency management coordinator and a city planner a
questionnaire was sent to each official in order to obtain as accurate information as possible for both types of programs. A total of 64 questionnaires were mailed.
Fifty-one were returned for an 80% response rate. To provide background material for

68 ASPECTS OF REDUCTION
questionnaire development, we reviewed mail questionnaires (Brower et al. 1983 and
Kartez 1984) and interview schedules (Rubin 1983) used in other natural hazard
studies.
Effectiveness of Emergency Response and Land Use Management Planning Programs
Communities use a wide range of emergency response and land use management
measures to reduce hurricane risks. The survey-questionnaire contained a list of
emergency response and land use management measures. Respondents were asked to
indicate which measures were used by their jurisdictions. Respondents were then
asked to rate each measure using scales where the scores would range from "do not
reduce risk" (1) to "greatly reduce risk" (5). A mean score for each measure was
derived by summing the scores of each measure divided by the number of respondents.
Emergency Response
Four types of activities dominate local government responses to a disaster such
as a hurricane: (1) finding information for emergency response decision making; (2)
organizing public and private organizations and individuals to maximize use of
limited time and resources; (3) communicating with citizens to get them to comply
with local emergency management plans; and (4) finding equipment from public and
private sources in the communiLy dnd from external sources. Table 1 illustrates the
percentage of communities using each of these emergency response measures and the
perceived effectiveness of each measure.
A critical initial step during a crisis is the acquisition of information to aid
in activating appropriate contingency procedures. The principal information base
communities can use during a hurricane crisis is a public-domain hurricane hazard
model known as SLOSH (Sea, Lake and Overland Surge Height) which estimates surge
heights and wind speeds at 10 minute intervals for a range of hurricane disaster
scenarios. This dynamic surge height and wind speed data can be used by local
governments to compute when evacuation routes are cut-off relative to time of
hurricane landfall. Sixty-two percent of the respondents said their communities
employed a procedure to compute estimated cut-off times based on SLOSH data.
Surprisingly, however, this procedure was rated least effective (mean 2.52) of all
emergency response measures used. Since the SLOSH model data and procedures for
computation of local evacuation route cut-off times was first introduced in 1983 -
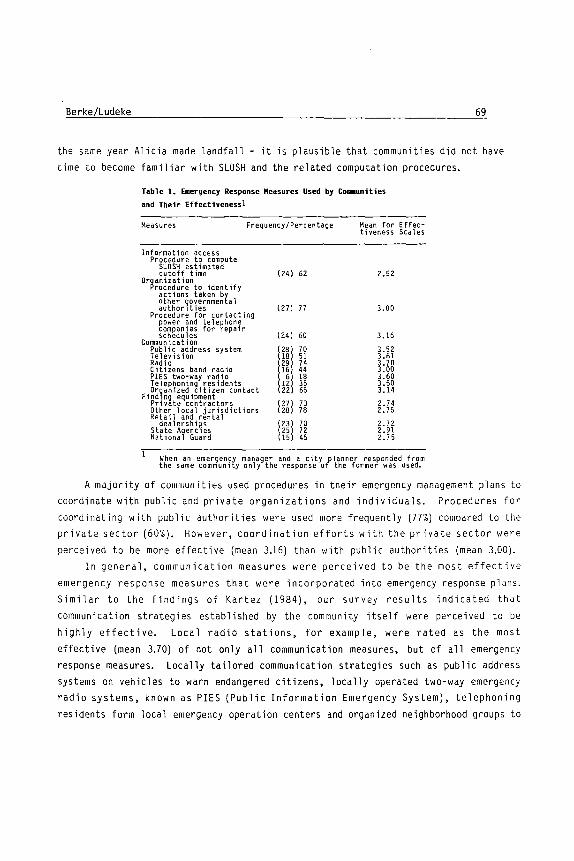
Berke/Ludeke 69
the same year Alicia made landfall - it is plausible that communities did not have
time to become familiar with SLOSH and the related computation procedures.
Table 1 .. Emergency Response Measures Used by Co_unities
and Their Effectivenessl
Measures Frequency / Percen tage
Information access Procedure to compute
SLOSH estimated cutoff time (24) 62
or~:~~~d~~~nto identity
g~~~~n~o~:~~~e~{a 1 (27) 71 authorlties
Procedure for contact ing power and telephone companies for repair
(24) 60 schedules Corrmunication
Public address system 28 70 Televi 5 ion 18 51 Radio 29 74 Citizens band radio 16 44 PIES two-way radio 6 18 Telephoning residents 12 35 Organized citizen contact 22 65
Findlng equipment
1m Pri vate contractors 73 Other local jurisdictions 78 Retail and rental
dealerships !~~l 70
~~rf~n~~eH~~~a 72 15) 45
Mean for Effectiveness Scales
2.52
3.00
3.16
3.52 3.61 3.70 3.00 3.60 3.50 3.14
2.74 2.75
2.72 2.91 2.75
A majority of cOllllliunities used procedures in their emergency management plans to
coordinate with public and private organizations and individuals. Procedures for
coordinating with public authorities were used more frequently (77%) compared to the
private sector (60%). However, coordination efforts with the private sector were
perceived to be more effective (mean 3.16) than with public authorities (mean 3.00).
In general, communication measures were perceived to be the most effective
emergency response measures that were incorporated into emergency response plans.
Similar to the findings of Kartez (1984), our survey results indicated that
communi cat ion strategi es estab 1 i shed by the community itself were percei ved to be
highly effective. Local radio stations, for example, were rated as the most
effective (mean 3.70) of not only all communication measures, but of all emergency
response measures. Locally tailored communication strategies such as public address
systems on vehicles to warn endangered citizens, locally operated two-way emergency
radio systems, known as PIES (Public Information Emergency System), telephoning
residents form local emergency operation centers and organized neighborhood groups to

70 ASPECTS OF REDUCTION
give door to door instructions to residents were all rated above the mean (3.00) on
the effectiveness scale. Regional television news networks were rated relatively
high (mean 3.61), whi le one-way citizens band radio was rated as average in
effectiveness (mean 3.00). A majority of respondents indicated that their community
used public address systems, television, radio and organized citizen contact
procedures, while citizens band radio, PIES and telephoning residents were less
frequent ly used.
Finding equipment from local and external sources was the predominant activity
of local governments during the immediate response and recovery period. With the
exception of the National Guard, 70% or more of all respondents indicated that their
community used private contractors, other local jurisdictions, retail and rental
dealerships and state agencies as a source of emergency equipment. However,
procedures incorporated into local emergency management plans for finding equipment
were generally given low effectiveness scores (mean of 2.91 or less). Notably, state
agencies ranked the highest of all sources (mean 2.91).
Land Use Management
The second principal local activity for reducing hurricane risks is land use
management for long term mitigation. Table 2 illustrates the percentage of
communities using vQrious land use management measures and the perceived
effectiveness of each measure in reducing the risk of recent coastal storms.
Police power regulations were the most widely used and most effective land use
management measures used by communities to mitigate storm risks. Of all land use
management measures (including police power regulations) flood elevation requirement
to ensure that flooding in buildings is minimized are used most frequently (91%) and
are the most effective at reducing risks (mean 4.43). Storm resistant building
standards were used by a majority of communities (58%) and were given the second
highest effectiveness score of all land use management measures (mean 4.17). The
high frequency of use and high effectiveness scores for building elevation and storm
resistant standards is due, in part, to their mandated use for local participation in
the National Flood Insurance Program. Also, building improvement regulations take
less effort for communities to adopt and implement than regulations that involve
controlling land use such as zoning and subdivision regulations. A majority of
communities (83%) used subdivision regulations, however, these regulations received

Berke/Ludeke 71
the lowest effectiveness score of all police power regulations (mean 3JO). Although
a relatively low percentage of communities used special hazard area ordinances (27%)
such as critical area designation of high risk areas and shoreline setback and dune
protection ordinances, their effectiveness score was quite high (mean 4.10). This
infrequent usage is attributable to the inclusion of both shoreline communities that
would use these ordinances and inland areas that would be less 1 ikely to use such
ordinances.
Table 2. land Use Management Measures Used by COIIIIIunities
and Their Effectiveness l
Frequency IPercentage Mean for t i venes s
Police power regulations Storm resistant building
~m standards 58 4.17
Zon i ng 45 3.88 Subdivision regulations 83 3.70 Flood elevation
regu irements (34) 91 4.43 Speclal hazard zone
( 8) ordinance 27 4.10 Pl ans
~~~~~e~~~~~~n ~ 1 ~~ (16) 43 2.87
comprehensive plan ( 5) 14 3.60 Recover~ plans and
(17) 46 3.20 pol iCles Land acquisition
Land acquisition for (7) open space parks 18 3.60
Relocation of existing ( 4) 4.00 development 10
Public facilities location Location of public
facilities outside hazard areas 9) 23 2.86
Development incentives Preferent; a 1 taxat i on
for open space uses ( 2) 4.00 Density transfer from
hazardous sites to less hazardous sites ( 0) 0 n.a.
Hazard disclosures Hazard disclosure
requirements (10 ) 29 3.14
Effec-Scores
Comprehensive planning (43%) and recovery plans and policies (46%) were used by nearly half of the communities in their land use management programs. These planning
measures were considered to be moderately effective in reducing storm risk. The
remaining land use management measures, however, were used for less frequently (29%
or less). These measures included a storm component of comprehensive plans, land
acquisition and relocation schemes, public facility location and hazard disclosure
requirements and development incentives. Of these remaining measures, relocation of

72 ASPECTS OF REDUCTION
existing development (mean 4.00) and preferential taxation for open space uses (mean
4.00) were given high effectiveness scores for reducing storm risks while the other
measures were rated as moderately effective.
Summary and Conclusions
The survey results discussed in this paper are based on preliminary findings of
an ongoing study. From this initial analysis the following preliminary conclusions
can be drawn. Of all emergency response measures employed by local governments
during Hurricane Alicia, the procedure for accessing information about evacuation
route cut-off times was the least effective. Procedures for finding equipment were
the most frequently used emergency response measures, however, they were given low
effectiveness scores. Of all land management measures, building improvement
regulations were used most frequently and were given the highest effectiveness
scores.
Note
The research for this paper was supported by the Texas A&M Sea Grant Program.
References
Brower, David, nRvid Godschalk, and Timothy Beatley 1983 Hurricane Hazard Reduction Through Development Management. National
Science Foundation Grant.
Kartez, Jack 1984 "Crisis Response Planning: Toward a Contingency Analysis."
the American Planning Association. Vol. 50. No. l.
Rubin, Claire
Journal of
1983 Case Studies of Communities Recovering from Natural Disasters, George Washington University, Washington D.C.
Simpson, Robert and Herbe Riehl 1981 The Hurricane and Its Impact. Louisiana State Press, Baton Rouge,
Louisiana.
Wiggins, J.H Company 1979 Building Losses from Natural Hazards:
Redondo Beach. CA. Wlggins Co. Yesterday, Today and Tomorrow.

RESI Dnns' AWARENESS OF THE COASTAL FLOOD HAZARD: LOWER FLORIDA KEYS CASE STUDY*
John A. Cross
University of Wisconsin-Oshkosh
The rapidly growing coastal population's awareness of coastal flood hazards
has become a topic of great interest to planners, civil jefense personnel, and
hazards researchers. The population within the coastal areas of the U.S. has not
only been growing at three times the national rate, but most of this population
lacks experience with coastal storm flooding.
This paper reviews the public awareness of the hurricane flood hazard in one
of the most vulnerable areas of the United States, the Lower Florida Keys. This
area, in which the highest elevation is a mere eight feet and in which over 90~ of
the homesites are below the five-foot contour, has experienced hurricanes in an
average of one in seven years, although the last direct hit occurred in 1966.
Furthermore, the minimum base flood elevation shown on the Federal Insurance Rate
Maps for the area is nine feet, and it could take 31.5 hours to evacuate the Keys
(Pn~t, pt al. 1983:117). Nevertheless. the population of the Florida Keys,
excluding Key West, increased by 66;; between 1970 and 1980. This paper summarizes
the responses of approximately 700 recent home buyers to a survey conducted during
the 1983 hurricane season and compares their attitudes with those expressed by
nearly 200 long-term residents.
Awareness of the Hurricane Flood Hazard
Residents who purchased their houses or mobile home sites within the Lower
Florida Keys since 1979 are generally aware that hurricane destruction may occur,
with 60.6% believing that a damaging hurricane is "very likely" or "likely" within
the next ten years. Furthermore, two-thirds of the residents felt that "hurricane
* This paper is based upon work supported by the National Science Foundation under Grant No. CEE-8211441. Any opinions, findings, conclusions, or recommendations expressed in this paper are those of the author and do not necessarily reflect the views of the National Science Foundation.

!.:.74~ __________ . __________ ASPECTS OF REDUCTION
waves and flooding" were either a "major problem" or "somewhat a problem" facing
their households in living in the Florida Keys, although like residents of the
Florida Panhandle (Baker et al. 1976:18), they anticipate that property damage would
be more likely from hurricane winds than coastal flooding. Other problems were of
greater salience to most recent home purchasers. For example, larger proportions of
the survey population indicated that public ~Iater supplies, mosquitoes, and even
hurricane winds were "major problems" than was the potential for hurricane waves and
flooding. When asked to indicate the "single most important problem to their house
hold in living in the Florida Keys," 80.L mentioned conditions other than hurri
canes, 11.0% claimed hurricane flooding; 7.5% hurricane winds; and 1.4~ both hurri
cane flooding and winds. Indeed, everyday problems are of far greater concern.
Long-term residents (those who purchased their homes before the county adopted
Ordinance 3-1975 which first required homes to be elevated above the base flood
levels) were nearly twice as likely as recent residents to view this potential
flooding as not a problem at all, although similar proportions considered hurdcane
flooding as a major problem. The concerns reported in 1983 by both the recent home
buyers and the long-term residents ~Iere, nevertheless, considerably greater than the
responses of Lower Florida Keys residents in 1976 to the same survey question. Then
59% considered hurricane flooding as either a minor problem or not a problem at all
(Cross 1980:157), while in 1983 only 32~ of the new residents expressed such minimal concerns.
Respondents to the 1976 survey were resurveyed in 1982. Responses to the same
questions showed a small overall increase in concern, with 47% claiming that hurri
cane flooding was at least somewhat a problem in 1976, compared with 53S in 1982.
Individually, 64;; of the respondents expressed different evaluations on the t\~O
surveys, with 37.5% indicating heightened concern and 26.7% expressing diminished concern.
The recent homebuyers' storm awareness does not reflect the high probabilities
of storm flooding. Indeed, 21.5% bel ieved that the Florida Keys are less 1 ikely to
be hit by hurricanes, "compared with other locations along the Gulf and Atlantic
coasts of the U.S.," while 68.6% thought that the area is equally likely to experi
ence hurricanes. Furthermore, if a hurricane were to hit the area, only 34.9% of
the respondents felt that it would be more likely to cause property damage than in
other coastal locations, notwithstanding the area's very low elevation. Compared
with other portions of the Florida Keys, the Lower Keys were viewed as either less
Cross 75
likely or equally likely to suffer damage by 90.3% of the new homeowners. Long-term
residents and recent homebuyers did not significantly differ in their evaluations of
the Keys' probability of experiencing hurricanes or vulnerability to damage should a
storm hit, although long-time residents were more 1 ikely to feel that the Lower Keys
were less vulnerable to damage than the Middle or Upper Keys.
Over one-third of the recent homebuyers were uncertain as to whether or not
their homes were located within a designated hurricane flood zone, with 6.5~ indica
ting that they were not. However, the entire study area has no natural elevations
above the base flood levels, and 83% of the survey respondents' homes were on lots
either along the shore or canals. Old and new residents did not differ in their
knowledge of their own flood zone location.
If a hurricane were to directly strike the Lower Keys, 78.6% of the house
owners and 94.7;; of the mobile home buyers expect that their homes would suffer at
least "moderate damage." Nevertheless, 37.0% of the house buyers, compared with
8.5% of the mobile home owners, believed that they could safely ride out such a
storm within their homes. Furthermore, 23.4% of the households occupying houses and
6.4% within mobile homes indicated that if hurricane warnings were issued for their
area of the Florida Keys, they would "plan to ride out the storm in their own Keys
home. "
Awareness and Adoption of Flood MiLigation Measures
The adoption of various flood hazard mitigation measures is now fairly high.
Although realtors reported that homeseekers were often ignorant of flood insurance
requirements when they began their home search, 74.5% of the recent house buyers and
62.9% of the mobile home owners had acquired flood insurance in 1983, up from 53%
and 31%, respectively, in 1976. Only 56% of the long-time residents had insurance,
however. Even among those new residents without home mortgages, and thus not legally
required to obtain insurance, 66.5% had acquired flood insurance. Indeed, coastal
flood plain residents are far more likely to have obtained flood insurance coverage
than residents within river floodplains (Kusler 1983:7). Nevertheless, these figures
were less than the 88.3% windstorm insurance coverage reported by recent homebuyers.
Seventy-one percent of the residents acquiring their homes since 1979 selected stilt
houses, compared with 37% of the households who purchased their homes in 1975 or
earlier. Furthermore, 90.5% of the houses built since 1976 are upon stilts, with

76 ASPECTS OF REDUCTION
most of the remainder being built upon fill. However, the additional safety for
which stilt houses were promoted has been substantially negated by enclosure of the
space beneath many of these homes, by what often cannot be considered break-away walls.
Indeed, 40% of the over one thousand stilt houses constructed within the study area
since 1976 have at least half their lower levels enclosed for storage, garages, and
living space. Flood protection was not the primary motivating factor in the choice of a home.
When asked to indicate the importance of various factors in the selection of their
homes, the home price, beauty of the neighborhood area, investment potential, crime
rate, and particularly, access to deep water boating and nearness to shore or canals
were all considered more important than elevation of the house above ground, the
safety of home during a hurricane, or the vulnerability of the homesite to storm
flooding. Even when realtors informed homeowners that houses were in a flood zone
or that flood insurance might be required (a disclosure given to 49~ of the home
buyers since 1979), only 12.4~ of the recipients indicated that it made any differ
ence in their choice of home or homesite. The disclosures dissuaded few potential
residents, with fewer than one in five realtors able to recount losing a sale because
of the potential for hurricane flooding. On the other hand, the provision of hurri
cane flood zone information by the realtor or home seller vias significantly associ
ated with the homebuyers' flood insurance coverage, even with those residents lacking
mortgages (Cross 1985).
Recent buyers of both houses and mobile homes generally favored the local flood
mitigation regulations. Three-quarters of the residents felt the "present 8 feet
minimum elevation requirements" were "about right," although they were "too restric
tive" for nearly a fifth. Nevertheless the majority of the residents were in favor
of the county using the new Federal Insurance Rate Maps (in preliminary form at the
time of the survey) to set minimum elevation levels for new home construction, even
though they require greater elevation with the inclusion of wave action effects.
Factors Associated with Coastal Flood Hazard Awareness
The environmental setting of the homesites, including their flood hazard zones
(V vs. A Zones), base flood elevations, lot elevations, and proximity to the shore,
were generally not associated with variations in the residents' evaluation of the
Keys' vulnerability vis-a-vis other coastal areas, the expectation of a damaging
Cross 77
storm in ten years, the knowledge of their home's flood zone location, or the percep
tion of hurricane flooding as a problem. However, residents, particularly owners of
houses, whose homes were located along either canals or the shore were significantly
more aware (60.1'; vs. 42.1%) that their homesites were within flood zones.
The avlareness that Lower Florida Keys residents have concerning hurricane
flooding and their perception of this hazard as a problem are related to few socio
economic parameters, not unlike observations among river floodplain residents (Smith
and Tobin 1979:43). Indeed, the homeowners perception of hurricane flooding as a
problem was not related to their age, income, educational level, or the sex of the
respondent. On the other hand, recent home buyers who previously lived outside the
South Atlantic states were more likely (29.3% vs. 20.3~) to consider hurricane flood
ing as a major problem. Residents migrating from other coastal counties had higher
expectations that a damaging hurricane was "likely" or "very likely" within ten years.
Furthermore, the expectations of a damaging hurricane were significantly related to
the respondents' income and educational levels, although not to their age or sex.
Fifty-five percent of the post-1979 homebuyers claim to have experienced a
hurricane. Although their descriptions of the events indicate that many of these
experiences were with hurricanes which threatened and then missed the area or with
tropical storms--similar to pseudo-experience reported by residents throughout south
eastern Florida (Post, et al. 1983:61) and the Bahamas (Lewis 1975:29)--these experi
ences are related to their concerns about hurricane damages. Although experienced
and inexperienced residents did not differ in their expectations of future hurricanes,
larger proportions of the "experienced" residents claimed the Lower Keys were less
likely to receive damages during a hurricane than either other U.S. coastal areas or
the other a rea s of the Keys. Furthermore, 12.9% of the "experi enced" res idents
claimed hurricane flooding was no problem at all within the Lower Keys, a claim made
by only 6.6% of the inexperienced homebuyers. Experience has generally had a nega
tive impact upon the residents' hurricane concerns. Thirty-five percent of those
residents without hurricane experience claim to be more concerned about hurricane
damages now than when they first began living in the Keys, a claim made by only 20.6;,
of the "experienced" residents.
Concl usions
These findings clearly indicate that coastal residents are highly aware of the
78 ASPECTS OF REDUCTION
coastal flood hazard and are willing to accept many hazard mitigating adjustments. Indeed, their awareness and willingness to purchase flood insurance far exceeds that
found within riverine floodplains. At the same time the awareness which these residents have raises many severe problems for planners. Just because they are aware of coastal flooding does not mean residents will faithfully maintain flood resistant
housing or evacuate if urged, nor that they fully appreciate their risk. While residents' hazard perceptions change with time, it is not clear that experience leads to heightened awareness, particularly when minor events are construed as experience
leading residents to underestimate their vulnerability to the rarer, but far more dangerous flood event.
References
Baker, E. J., J. C. Brigham, J. A. Paredes, and D. D. Smith 1976 "The Social Impact of Hurricane Eloise on Panama City, Florida" Florida
Resources and Environmental Analysis Center Technical Paper No. 76-1 Tallahassee: Florida State University.
Cross, J. A. 1980
1985
Kusler, J. A.
"Residents' Concerns about the Hurricane Hazard within the Lower Florida Keys." Pages 156-161 in E. J. Baker (ed.) Hurricanes and Coastal Storms Gainesville: Florida Sea Grant College Report 33.
The Effects of Flood Hazard Information Disclosure by Realtors: The Case of the Lower Florida Keys. Boulder: University of Colorado Natural Hazards Research Working Paper No. 52.
1983 "Welcome and Overview" Pages 3-34 in J. Monday (ed.) Preventing Coastal Flood Disasters Boulder: University of Colorado Natural Hazards Research and Applications Information Center Special Publication No.7.
Lewi s, J. 1975 A Study in Predisaster Planning. Disaster Research Unit Occasional Paper
No. 10. Bradford: University of Bradford.
Post, Buckley, Schuh & Jernigan, Inc. and U.S. Army Corps of Engineers 1983 Lower Southeast Florida Hurricane Evacuation Study - Technical Data
Report. Jacksonville, Florida: U.S. Army Corps of Engineers.
Smith, K. and G. A. Tobin 1979 Human Adjustment to the Flood Hazard. London: Longman.
THE VARIABILITY OF FLOOD\~AY ENCROACHMENT DETERlltlNATION
J. F. Harp
The University of Oklahoma Norman, Oklahoma
R. J. Hayes Hydrologic Engineering Center
Introduction
Designated floodways may be determined by any of several methods. This paper will treat the designated floodways as they can be determined from Corps of
Engineers computer program HEC-2, Water Surface Profiles. This program is very powerful, well documented, and supported, which exemplifies why it is probably
the most vlidely used backwater program in the world. Other cOl11l1lonly used computer methods are deemed to be similar to at least one of the several encroachment
algorithms pcogrammed into HEC-2. The purpose of this paper is to elucidate the variability of designated
floodways that might be determined by different investigators. The aspects of
the nonuniqueness of designated floodways must be critically addressed since property va 1 ues, 1 and use, and mun i ci pa 1 bu i 1 ding permits are affected by the
exact delineation of the left and right encroachment stations, which define the
designated floodway.
Methods of Floodway Determination
The Hydrologic Engineering Center (HEC) has developed six different methods
for establishing floodway encroachment stations using HEC-2. These may be briefly
summaried below as: METHOD ONE: An encroachment procedure which allows the program user to specify
directly the desired encroachment stations (left and right). With this method, HEC-2 will determine the water surface elevation and other hydraulic data with the given fixed encroachment stations.

80
r'1ETHOD HIO:
ASPECTS OF REDUCTION
This prOCedUI"e util izes a fixed top \·lidth of encroachment whereby
the left and right encroachments are made equidistant from the
channel centerline, which is delineated by the left and right
overbank stations. This method is useful to simulate the hydraulic
effect of ordinances which provide a uniform flow easement centered
on the stream.
METHOD THREE: This algorithm provides for a specified reduction (in percent) in
r'lETHOD FOUR:
METHOD FIVE:
METHOD SIX:
the natural conveyance which is to be removed from the overbank areas.
Normally, half of the specified conveyance reduction is eliminated
from each side of the cross-section. There is also provision to
reduce the conveyance in proportion to the distribution of the
natural conveyance which occurs on each overbank. With
this method HEC-2 determines encroachment stations as well as the
resultant hydraulic properties of the floodway.
This method computes encroachment stations so that the conveyance
within the encroached cross-section (at a higher elevation) is equal
to the conveyance of the unencroached (natural) cross-section (for
the same discharge) at the natural water level. The encroachment
stations are determined so that an equal or proportional loss of
conveyance occurs on each overbank. A desired rise in the water
surface elevation is specified, in this method.
This method has the same goals as method four (i .e., determine
encroachment stations given a target rise in the water surface
elevation) except that a different algorithm is used. Method five
uses the percentage reduction in conveyance as an objective function,
which is optimized to determine encroachment stations. Equal or
proportional conveyance reduction may also be specified.
The procedure is much like method five except, the energy grade
elevation change is the targeted difference which is optimized.
Method six was initially developed for applications involving steep
streams in which encroachments by methods four and five often
resulted in an encroached profile which has elevation lower than the
unencroached (natural) profile.
Harp/Hayes 81
A Critical Review of Each Method
Method one will provide a water surface elevation consistent with the
conveyance that will be computed by the encroachment limits that are subjectively
provided by input left and l'ight encroachment stations. If a target increment of
one unit above the natural water surface is desired, a trial and error procedure
is necessary before an elevation difference of that one unit is ever achieved with
method one. Actually, it is not likely that an exact targeted difference of any
specified precise value is ever feasible even though possible. A better concept
is to view any target-difference as a maximum value rather than an exact value that
must be achieved. A tolerance, or range of values, would be more logical. Method
one does not require that an initial unencroached profile be computed prior to the
profile using specified method one encroachment stations. Actually, however, when
determining floodway encroachments, an initial run using one of the automatic
methods (methods four, five or six) should be made, and must be made if a known
targeted I'later surface increment is to be achieved. It must be remembered, that
no targeted increment is actually an objective method one algorithm, but exists
only in the mind of the user. Sometimes, method one is the sale procedure which
1'1111 yield the results at all cross sections that engineering judgement dictates
to be reasonable and prudent in light of all the considerations. Method one does
not require, nor is it restricted to, encroachment stations exterior to the left and right overbank stations. Most of the other methods (thl-ee thru six) are "overbank
constrained" as I'li11 be seen later in this paper. It is obvious to even casual
users of method one that an infinite number of answers are possible. This procedure
does not require equal or portiona1 removal of conveyance from either side. In fact,
some of the channel itself can be used. However, the spirit of floodway designation
is that logic and engineering judgement be applied. Unreservedly, any percentage of
the conveyance can be removed from either side. Therefore, selfish, ruthless, or
unethical application of method one procedures would favor a landowner on either
side of the stream. Also, any changes in the f100dway width at one cross-section
will cause changes at cross-sections upstream. These changes may be adjusted until
the desired result is achieved. Guidelines will be presented later in this paper
to provide for this and other situations. Finally, method one can be prudently
utilized to provide cessation of encroachment by one of the automatic methods,
as may be necessary, or desired.

82 ASPECTS OF REDUCTION
Method two makes sense in that if a floodway width could be somehow specified,
estimated, or even legislated, then each encroachment station would be located at
the'same distance from the computed streambed centerline, as set up based upon the
location of the left and right overbank stations. Method two is not overbank
constrained, that is, the encroachment stations could properly be set within the
channel itself, as far as the procedure itself is concerned. Thus, no provision
is made that all of the channel area is retained as flow area. This method makes use
no particular increment in the water surface elevation. In any flood study where
an unimproved channel is studied, simply setting the top width seems inconsistent
with consideration of the natural conveyance, flow distribution, or associated
topographic features which must form a basis for delineating a logical floodway.
In an improved channel or prismatic configuration, method two seems most appropriate.
Simply setting the floodway at the upper channel overbank stations, even if they are
high and dry, is most logical and has been used by the authors with acceptable results
to everyone concerned.
Method three is perhaps a logical choice if the user has an estimate of the
conveyance reduction percentage that might be appropriate. If the user had properly
called for the HEC-2 flow distribution option, then an educated estimate of conveyance
reduction and its division between left and right sides could be made. This method is
infrequently used by most investigators but could be a valuable tool once experience
in its utilization and application is achieved. Method three is one of the automatic
methods in that encroachment station are uniquely set by the program.
r4ethod four is perhaps the most I'lidely used and most popular of all of the
methods available for floodway encroachment determinations. This is so due to the
output which is produced. Even though, a target water surface rise, of say, one
foot, or any amount, is called for, experience shows that it will rarely be achieved
at precisely that value. This is explained in the basic algorithm assumption that
conveyance is a parabolic function of distance between data points in the overbank.
This is appropriate as long as depth is constant, but is less exact as depth changes
with station distance across the channel segments. Due to this inexactness, several
profiles are usually computed with varying targeted water surface increments until
the water surface rise computed is the one desired. Sometimes, there is just no
Harp/Hayes 83
solution available that will achieve the target water surface elevation rise at a
particular cross-section. In this event default encroachment stations would be set
at the overbank stations. Method four is overbank constrained in that the
encroachment stations can never be set within the channel. From a practical
engineering point of view, this is highly desirable, and is in conformance with
the f100dway determination guidelines for flood insurance studies of the Federal
Emergency Management Agency (FEr~A). Thus, when an improved channel has been created,
the encroachment stations are logically set at exactly the left and right overbank
stations. Informed users of any encroachment techniques will realize, early, that
some aspects of f100dway designation are logical while others are simply a matter
of engineering judgement.
r,1ethod four is deemed automatic in that no top \'Iidth, or specified encroachment
stations are specified. Realistically, one might take the best results from
several runs using method four, and make a few final runs with method one to really
sharpen the results numerically. A criteria for this procedure is set out later in
this paper.
Method five has most of the characteristics of method four. It was developed
later in the evolution of HEC-2 and is deemed by many to be a better procedure than
method four. For riverine corridors where channel geometry is radical and
topographically varying, perhaps this procedure is an improvement over method four.
Experience will quickly show that sometimes this is so, and sometimes not so in
striving for the target water surface elevation increment. Method five, like
method four, requires an initialization (natural) profile to establish the natural
conveyance prior to the f100dway computation profile. Since method five employes
an optimization procedure the length of time for computations and hence computer
cost can be significantly greater than method four.
Method six operates similar to method five except that the optimization is
based upon an incremental rise in the energy grade elevation rather than the water
surface itself. The concept is that the energy grade line is a more stable criteria
to meet. This might be particularly useful for larger energy gradients in high
velocity streams. A natural profile is also required prior to the profile applying
method six. Equal or proportional conveyance reduction may be specified for both
methods five and six. A judicious application of method six will elucidate the fact
84 ASPECTS OF REDUCTION
that several runs may be required to achieve a targeted increment. Users should
be aware that with any of these methods, floodway velocities can increase significantly
and water surface profiles may decrease. Decreases in water surface elevation are
deemed unacceptable to most governing agencies, but are in fact a possibility in the
real world.
General Guidelines for Prudent Establishment of Encroachment Stations
The general guidelines to be followed for establishing floodway encroachment
stations which delineate the designated floodway are few in number, but important
in scope and concept. A suggested compilation of essential criteria factors might
be as fo 11 O\~s:
1. That the hydrology and hydraulics be based upon existing conditions.
2. That the discharges be based upon one percent exceedance frequency.
3. That the flood plain will be divided into a central designated fl QadI-lay and a
floodvlay fringe area on each side of the designated floodway. 11 The designated floodway \~i 11 pass the flood discharge without causing the \~ater
surface to rise by more than one foot (acceptable rise may be less in some states
or communities) above the natural water surface elevation.
5. The floodway fringes are assumed filled solid for purposes of hydraulic
computation.
6. That there should not be a significant increase in stream velocity.
7. That there should not be unreasonable depths in the floodway fringes.
8. That there should not be undulating top widths.
9. That the floodway should be consistent with local needs.
10. That the results should be consistent with engineering judgement.
11. That in improved channels where the capacity of that channel will carry the
one percent exceedance discharge, the encroachment stations can be set at the
channel overbanks where they will be high and dry, and meet all agency rules
and regulations.
Harp/Hayes 85
Conclusions
Whenever the natural floodway elevations have been determined by one of the
preferred methods, the outer fringe lines can be drawn onto contour maps by those
with engineering experience. The designated floodway stations cannot, however, be
drawn in by the same procedure because no contour interpolation is possible. To
mitigate some of the problems in accurately drawing the floodway onto maps a
greater number of cross-section can be used, or engineering judgement be
judiciously applied. In radically changing topography, this becomes virtually
impossible and some of the above criteria must be applied. Certainly rugged
topographic features and constancy of widths should be recognized. At any rate,
these designated floodway encroachment stations are often a matter of opinion,
and that opinion is hopefully rendered by competent engineers with great experience
and good engineering judgement.
References
Federal Emergency Management Agency 1983 FEMA Publication 37, Flood Insurance Study, Guidelines and
Specification, for Study Contractors. Washington D.C.
UoS. Army Corps of Engineers 1982 HEC-2 Water Surface Profiles, Users Manual. Hydrologic Engineering
Center, Davis, California
NASA/ERL TECHNOLOGY APPLIED TO FLOOOPLAIN MANAGEMENT
Susan A. Howard
NASA/NSTL Earth Resources Laboratory
Optimal development of the floodplain requires information based on the
integration of land use, topographic, socioeconomic, and hydro- meteorologic data. In
most communities these data are stored on hard copy maps, graphs, and charts. The
floodplain manager is faced with the complex task of keeping these data up to date,
and also with converting these data into usable information. Today I am speaking
about a technology for rapidly building and updating a community's floodplain
informatiun system.
The technology of which I speak is a product of NASA's Earth Resources
Laboratory (ERl) at the National Space Technology laboratories (NSTl) near Bay St.
louis, Mississippi. Since the early 1970's, ERl has been developing a software
technology designed for the analysis of data collected by multispectral scanners
flown on board Landsat satellites. The software modules are grouped in a broad
package called ELAS, the acronym for Earth Resources Laboratory Applications
Software. 1 Satellite scanners are optical-mechanical devices which record the
reflection of light energy from the earth's surface, and in doing so, produce an
image. Multispectral scanners record data in two or more spectral bands, such as in
the visible and infrared.
In support of NASA's scanning system research, ERl builds and tests simulator
scanners to fly aboard aircraft. As a result, software designed specifically for
integrating aircraft scanner data into a digital data base has been created.
In order to incorporate aircraft data into a digital data base, it must be
accurately georeferenced. Because of the difficulties in maintaining an aircraft along a steady and even course, such a georeferencing program has to correct for data
errors caused by flightline and altitude deviations. The ELAS module Rubber Sheeting,
or RUBS for short, addresses these deviations.
Prior to running the RUBS module, the investigator selects an evenly spaced network of control points. Map coordinates and digital scan line and element
Howard 87
coordinates are identified for each control point. RUBS joins these control points
into a network of triangles and georeferences within each triangle. Following
georeferencing, the individual flightlines are ready for joining into one data plane.
This data plane can be viewed on a cathode ray monitor for land use and land
cover analysis. For example, the Southwestern Division of the U.S. Army Corps of
Engineers has recently collected 5- and 10-meter resolution aircraft scanner imagery
over a number of study areas. The Corps is utilizing this imagery for mUlti-purpose
planning applications, such as flood control, lakeshore management, agricultural crop
production, and documenting land use change over time. 2
For the past two years ERL has investigated equipment which could be used to
rapidly digitize map and photographic data. ERL recently obtained an Eikonixscan
Model 78/99. This is a laboratory image digitizer which has a push-broom array
scanner mounted behind a camera lens. For color scanning, color filters are placed in
front of the lens. The array scans 2048 elements per scan line, advancing down the
image one scan line at a time. The array configuration precludes skewing of the data,
a problem common to video digitizers. By varying the size of the image scanned, the
technician can vary the spatial resolution of the resulting data file. For example,
if a 1:24,000 scale topographic map were scanned at one setting, the resulting da~a
file would contain 2048 elements for each scan line. If the same topographic map were
quartered, with each quarter scanned separately, the resulting data fil e can be
subdivided into 4096 elements per scan line.
The image digitizer will be utilized in four ways. It will be used to digitize
aerial photography, which can then be georeferenced with the RUBS module. These
photographic data files will be used at ERL as a base for testing the accuracy of
multispectral scanner classification software. The image digitizer will also be used
to digitize isolines, such as mapped elevation data. Supporting software has been
developed to classify these contour lines and to interpolate between these lines. A
third use for the data will be to create digital areal imagery such as soil maps.
Line-dividing software will blend the outlines which occur on published soil survey
maps into the soil data file. A fourth use will be to digitize polygonal data. If,
for example, the investigator required outline data, but not the areal data within
the polygons, that areal data would be subtracted out.
While ERL is not in the business of mapping the nation's floodplains per se,
spinoffs of ERL technology are directly applicable for that purpose. And, as private
88 ASPECTS OF REDUCTION
industry is rapidly developing micro-systems which are affordable at the community
level, this spinoff technology will find wide application. The message I want to
leave you with is that the technology now exists for building and updating your
community's floodplain information system. Land use maps can be rapidly updated and
overlaid on Flood Hazard Boundary Maps, contour maps, zoning maps, and socioeconomic
maps. These data files can be rapidly integrated to provide such information as the
current land use within the 100 year floodplain.
References
NASA Earth Resources Laboratory 1980 ELAS Earth Resources Laboratory Applications Software
Earls, G. 1985 "SWD Appl ications of Remote Sensing Technology to Resource Management."
In Wi 1 dl i fe Resource Notes Information Exchange Bull et in. Washi ngton D.C. U.S. Army Corps of Engineers. March 31.
MODELING UNSTEADY FLOWS IN LARGE BASINS: THE SANTA CRUZ EXPERIENCE
v. Miguel Ponce*, Zbig Osmolksi** and David Smutzer***
A case study modeling unsteady flows in a basin in the semiarid Southwest
is presented here. The site is the Upper Santa Cruz River basin upstream of the Town of Marana, in the vicinity of Tucson, Arizona. The evaluation uses novel
techniques of mathematical modeling in a data-intensive computational environment to calculate frequency-based flows at specific locations. A computer model capable of simultaneously handling the complex topology of the entire basin is driven by lOO-year frequency rainfall events of 24, 48 and 96-hour durations.
Introduction ----------The use of computational methods to evaluate the hydrology of large basins
is currently enjoying wide acceptance among practicing engineers and flood hydrologists. For basins exceeding 1000 square miles, the task of simulating flood flows by the computational method can be exceedingly complex. Theesti
mation of hydrologic abstractions is difficult indeed, in light of the wide
range of antecedent moisture conditions. However, other unresolved problems
still remain, most notably the choice of spatial and temporal distribution of
the input design storm, the channel routing parameters, and infiltration losses
through the channel bed.
*Professor of Civil Engineering, San Diego State University, San Diego,
CA 92182. **Manager, Flood Control Design, Pima County Dept. of Transportation and
Flood Control District, Tucson, AZ 85713.
***Manager, Flood Control Planning, Pima County Dept. of Transportation and
Flood Control District, Tucson, AZ 85713.

90 ASPECTS OF REDUCTION
The Basin
The Upper Santa Cruz River basin drains 3,503 miles in southeastern
Arizona and northern Sonora, Mexico. At Tucson, the Santa Cruz River is joined
by two major tributaries--the Rillito Creek and the Canada Del Oro--both
located downstream of Tucson. Precipitation varies greatly from year to year, with an annual average
of 12 inches per year. Summer precipitation is usually of high intensity and
short duration, resulting, as it does, from thunderstorms covering small areas. Winter precipitation is mainly the result of frontal activity, usually covering
most of the basin with less intense but longer duration storms. Moisture from tropical depressions located off the Baja Coast of Mexico, combined with low
pressure systems in Arizona, also supplies precipitation to the basin.
Most streams in the Upper Santa Cruz basin are ephemeral, being dry for
long periods of time. Flow in such streams occurs only in direct response to
precipitation, except in isolated cases. The streambeds are extremely perme
able, and large amounts of water are lost to the subsurface as the flow moves
downstream. The desertic conditions characteristic of the basin are highly
conducive to quick runoff, but potential flood peaks are reduced by the rela
tively large capacity for streambed infiltration.
Case Study
The objective here is to evaluate the hydrology of the Upper Santa Cruz
Basin, focusing in particular on the 100-year frequency floods at the Continental (Green Valley), Congress (Tucson), and Cortaro (Marana) USGS gages.
These gages have 37, 80, and 44 years of non-continuous record and drain 1,682,
2,222 and 3,503 square miles, respectively. Prior to the October, 1983, flood
event, the maximum USGS floods of record were 26,500, 23,700 and 23,000 cfs, respectively.
The Flood
During the last week of September, 1983, a low pressure system originating
off the coast of California and a tropical storm moving in from the Gulf of
Mexico combined to produce a steady, long duration, widespread rainstorm over
southeastern Arizona. Rain gage records indicate that 6 to 8 inches of rain
fell over the Santa Cruz and neighboring basins in the six-day period of
September 28-0ctober 3, 1983. The event was preceded by the wettest September of Record.
The heavy rainfalls triggered new record flows on the San Francisco River
Ponce/Osmolski/Smutzer 91
at Clifton (132,000 cfs), the Gila River at Safford, and the Santa Cruz River
at Tucson (52,700 cfs). Flood damage caused by the flooding of the Santa Cruz
River and tributaries included severe bank erosion which led to structural
damage to numerous bridges, the collapse of several homes and businesses which
fell into the streams, .and overbank flooding which inundated many homes with
water and sediment. Overall damage estimates were in the neighborhood of $500
million.
Peak flows during the flood of October, 1983, were estimated by the USGS
at 45,000, 52,700 and 65,000 cfs, for the Continental, Congress and Cortaro
gages. Due to the washout of the gage during the flood, the Cortaro value is
considered only an estimate.
The Model
The modeling approach consists of using a computational hydrologic simula
tion model to calculate peak flows at the three locations mentioned above, using rainfall events of 100-year frequency. Given the basin's size, the choice
of stream channel routing method, and the spatial and temporal distribution of
the input design storm and stream infiltration losses are considered the most
critical modeling decisions. Regional rainfall patterns indicate that for a basin of this size, it is
necessary to consider both general and local storms. General (winter) storms
are usually of low intensity but tend to cover most of the basin rather uni
formly. Local (summer) storms cover only portions of the basin, buL are usually
of high intensity. Rainfall durations are selected to reflect the time of
concentration for the entire basin for a 100-year frequency rainfall event.
Accordingly, durations of 24, 48 and 96 hours are chosen for the storm simula
tions.
The model used in this study is a comprehensive modeling system to
simulate the rainfall-runoff process in complex watersheds and stream channel
networks. The user specifies the network in terms of a set topological numbers.
Using this set, the model orders the calculations to enable the subwatershed
hydrograph generation and the routing of flows through stream channels and
reservoirs. The total basin area is subdivided into upland subwatersheds, which
generate upland inflows to the stream network, and reach subwatersheds, which
generate lateral inflows. The model uses SCS methods for hydrograph generation for subwatersheds
less than 6.2 square miles. The watershed lag time is based on the curve
92 ASPECTS OF REDUCTION
number method (Soil Conservation Service, 1973). For subwatersheds greater
than 6.2 square miles, the time lag is based on the time of concentration. The
unit hydrograph duration is based on the time lag. The time-to-peak is based on the unit hydrograph duration. The peak flow is calculated by the SCS synthetic unit hydrograph formula. The synthesized unit hydrograph is convoluted with
the effective storm pattern to generate the outflow hydrograph at each subwatershed outlet.
The stream channel routing module is a version of the comparatively recent Muskingum-Cunge method (Ponce and Yevjevich, 1978); therefore, it has the inherent advantage of being physically based. In actual practice, this means that the subreach parameter calibration which is necessary in conventional models (such as Hec-1 and TR-20) is all but eliminated. This enables the modeling of large basins at a level of detail hitherto only possible at a prohibi
tive cost. Unlike the classic Muskingum, the Muskingum-Cunge method calculates
routing parameters through local flow values, channel cross-sectional charac
teristics, and overall stream gradients. This enables the flood wave and flow
variables, while circumventing the need for large amounts of historic data to
ascertain ("calibrate") the values of these parameters. In this way, numerous yet accurate routings are possible.
A unique feature of the channel routing module is its capability to route
flows with parameters which vary in time as a function of the local flow values. This is specially indicated for routing overbank flows, since the routing parameters are recalculated every time step to follow the rating curve more closely.
Channel transmission losses are accounted for in the subreach routing process (Ponce, 1979). This feature is particularly applicable to the Santa Cruz Basin where streambed infiltration constitutes an important component of the overall hydro109Y of the basin. Data Requirements
The Santa Cruz Basin and stream channel network was configured into 119 reaches and 60 upland watersheds for a total of 179 subwatersheds. Each reach was assigned a topological number and each upland subwatershed a sequential
number. Subwatershed areas, stream delineation, hydraulic lengths and stream
slopes were evaluated using USGS 7.5' quadrangle maps. Coordinate data for 189
cross-sections was compiled from different sources, including actual field

Ponce/Osmolski/Smutzer 93
measurements.
Soil and vegetation data were assembled from publications of the USDA Soil
Conservation Service and the U.S. International Boundary and Water Commission.
These data were evaluated for vegetative cover types, land use and hydrologic
condition. SCS methods were used to determine a baseline set of runoff curve
numbers. Base flows along the Santa Cruz Basin were considered to be negligible for purposes of simulating flood flows.
Baseline streambed infiltration rates were estimated based on a literature
search. Matlock (1965) reported measurements in the range 2-10 ft/day along
the Santa Cruz mainstem and for Rillito Creek. A tendency for the infiltration
rate to increase with flow velocity--largely because of the higher heads
associated with higher velocities and stages--and measured infiltration rates
as high as 76 ft/day, but mostly under 20 ft/day. Average infiltration rates
of 2-4 ft/day were chosen for the baseline set, to be adjusted during the calibration stage.
Rainfall data for the hindcast simulation included records for 31 gaging stations, spatially distributed throughout the basin. Data for 21 of the
stations was hourly, and daily for the remaining ones. Point rainfall data
obtained from NWS reference sources indicated that the 100-year frequency, 24,
48 and 96-hour duration storms are 4.6, 6.0 and 6.7 inches, respectively (National Oceanic and Atmospheric Administration, 1973).
Results
Hindcast, general and local storm simulations were performed using a time
interval of 7.5 minutes. This interval time was judged to be adequate to
satisfy the lag requirements of the smaller subwatersheds. A maximum subreach
length of one mile was chosen to match the 7.5-minute time interval and guaran
tee the numerical consistency of the channel routing (Ponce and Theurer, 1982).
The one-mile upper limit on the subreach length triggered the automatic genera
tion of additional cross-sections, up to ten cross-sections per reach in
certain cases.
Calibration runs showed the need for a downward adjustment of the curve
numbers and an upward adjustment of the infiltration rates. After a series of
trials, the values of 44,500, 56,900 and 83,000 cfs were simulated at
Continental, Congress and Cortaro gages, respectively, for the October 1983
flood. To accomplish this, it was necessary to reduce the runoff curve numbers by 10 on the average, and to increase the infiltration rates up to five times
94 ASPECTS OF REDUCTION
the baseline values. In light of Woodward's findings (1973), the reduction in runoff curve numbers was deemed necessary to properly account for rainfall
duration and corresponding basin size. The calibrated median runoff curve
number was 76 and infiltration rates were in the range 2-20 ft/day.
Results of the general storm simulations indicate that the critical storms
are of 24-hour duration. Peak values at Continental, Congress and Cortaro are
58,700 45,600 and 55,600 cfs, respectively. These values were obtained by
driving the model with low-intensity storm covering the entire basin. Results
of the local storm simulations indicate that the critical storms are of 48
hours duration. Peak values at Continental, Congress and Cortaro are 47,200 cfs, 67,000
cfs, and 47,800 cfs, respectively. These values are obtained by driving the
model with high intensity storms covering cells of approximately 400 square
miles, critically positioned immediately upstream of the gages.
Matlock W.G. 1965
References
"The Effect of Silt-Laden Water on Infiltration in Alluvial Channels." Ph.D Dissertation, Department of Civil Engineering, University of Arizona. Tucson, Arizona.
National Oceanic and Atmospheric Administration 1973 Precipitation Atlas of the Western United States, Volume VII:
Arizona. Washfngton,DC-:U.S~ept. of Commerce. ------
Ponce, V.M., and V. Yevjevich 1978 "Muskingum-Cunge Method with Variable Parameters." Journal <!f. the
Hydraulics Divisi~~, ASCE 104 (December).
Ponce, V.M. 1979 "A Simplified Muskingum Routing Equation." Journal of the
Hydrau~ Division, ASCE 105 (January).
Ponce, V.M. and F.D. Theurer. 1982 "Accuracy Criteria in Diffusion Routing." Journal of the
Hydraulics Division, ASCE 108 (#HY6). ------
Soil Conservation Service 1973 National Engineerin9 Handbook, Section 4: Hydr~. Washington,
Dc: O.S. Department of Agrlculture.
Woodward, 1973
D. "Runoff Curve Numbers for Semiarid Range and and Forest Conditions." Paper #73-209. ASAE Annual Meeting, Lexington, Kentucky.

THE RISE AND RISE OF THE GREAT SALT LAKE:
A CONTINUING LESSON IN THE FLOODPLAIN MANAGEMENT
FOR DESERTIC TERMINAL LAKES
Clancy Philipsborn
FEMA Region VIII
As the Federal Hazard Mitigation Coordinator for the two Major Presidential Disaster Declarations in Utah (1983 and 1984), one of my responsibilities has been to facilitate the development, coordination, and implementation of the recommendations of the Federal Interagency Hazard Mitigation Team. Coupled with another responsibility to provide technical assistance to the State of Utah for development of its State "406" Hazard Mitigation Plan, I have become increasingly familiar with the problems of floodplain management in an obscure area, fluctuating lakes.
As a partial consequence of three years of above normal precipitation and excessive groundwater, the Great Salt Lake has risen an unprecedented ten feet in two years. This rise has inundated 625 square miles of perimeter lands, creating enormous economic, political, social, and environmental impacts. Damage estimates to date exceed $176 million.
Although lake level fluctuations are not unusual, historical meteorological and geological records only provide limited indications of what is to come. As the Great Salt Lake continues to rise, it continues to destroy development, fluster its users, and challenge "the experts." Protective and preventive measures have been and will continue to be taken, but additional expected and unforeseen problems arise as quickly as the lake.
The geologic history of documented for the past however, date back only was installed in 1875. been observed.
elevations for the Great Salt Lake is well 25,000 years. Actual recorded historic data, to Fremont's observations in 1843. The first gage Since that time numerous minor fluctuations have
Having established that fluctuations of the surface elevation of the Great Salt Lake are not unusual, or unlikely, it logically follows that the astronomical damages resulting from the lake's current level are the result of man having developed in a known hazardous location. At present, damage has occurred to Interstate 80, the numerous mineral extraction industries, private, State and Federal wildlife refuges, power transmission towers,
96 ASPECTS OF REDUCTION
State parks, privately owned resorts, two railroad lines, sewage treatment plants, and housing. Potentially, Salt Lake International Airport and the new International Business Center could be affected. The impacts of this lake rise would be even greater in the absence of the existing consumptive uses (agricultural use of inflow, reservoir retention, and evaporation ponds).
In response to the most recent lake rise, all levels of government have been intensely involved. At the Federal level, the Federal Highway Administration has funded the raising of portions of Interstate 80. The U.S. Army Corps of Engineers has participated in the diking of several sewage treatment plants. The National Oceanic and Atmospheric Administration has maintained precipitation, river inflow, and lake level prediction data. FEMA will be providing funding for the replacement/ restoration of publicly owned damaged facilities, and has maintained a coordination role for the Federal agencies' activities. The Bureau of Reclamation has repaired damaged dikes along Willard Bay. The U.S. Fish and Wildlife Service has diked the Federal migratory bird refuge. The Federal Interagency Hazard Mitigation Team has offered both short and long-term recommendations to all levels of government on how to minimize present and future impacts of Great Salt Lake flooding.
State government has been involved in numerous mitigation projects as well. The Utah Department of Transportation participates in the protective work along Interstate 80, as well as many other inundated roads. The Division of Parks and Recreation has attempted to protect the public parks, beaches, and islands. The Division of State Lands and Forestry, the State Engineer's Office, the Division of Water Resources, the Utah Geological and Mineral Survey (all within the Department of Natural Resources) have performed monitoring and reporting functions, as well as funding at least 17 different studies and plans for immediate response and long-term managem~nt of the lake. The State legislature has provided the necessary funding for these projects.
Counties have been involved with selected diking and pumping projects, as have private land developers. The universities and State and Federal agencies have directed selected efforts at improving forecasting techniques in an attempt to reduce the "window of probablity" that future lake levels could be expected to fall within. Present predictions are for the lake to peak at 4210.25 this year, and even higher in 1986.
Valuable lessons in the floodplain management of fluctuating lakes have been learned in the process of responding to, postulating about, planning for, and recovering from the recent rise of the Great Salt Lake. It is important to take note not only of what information has been gained, but also those areas where it appears we have learned nothing. By assimilating and assessing these data sets we better prepare ourselves for similar problems occurring elsewhere, or those that have yet to appear.
Quite simply, we have learned about the enormity of the problem of fluctuating lakes, and the multivariate implications caused by the conflicting land uses in areas that are subject to occasional, repetitive inundation. Scientific investigations into forecasting techniques have led to discussions of El Nino, El Chichon, tree rings, sunspots, groundwater,
Philipsborn 97
run-off, precipitation, evaporation, lake effect, drainage, and consumptive use. Economic impacts have affected all levels of government, industry, and private individuals. Multi-jurisdictional political interests are forced upon each other. For example, the Great Salt Lake lies within five different counties, each with their own particular interests, tax base, and set of constituents.
We have also learned of the mentation and information. which existing technologies cation of further potential impact studies.
expanded uses of specific scientific instruThere has been identification of new needs to can be applied. There has been the identifiimpacts in a host of areas through economic
Unfortunately, it is apparent that there are lessons that we have yet to learn.
[As we know] "The Great Salt Lake lies at the bottom of a closed basin. Due to the wide range of inflow to the lake, the surface level, surface area and volume of the lake has experienced wide fluctuations in the recent past. Efforts have been made to predict future levels of the fluctuations to avoid problems of development around the lake that would be damaged by high lake levels. Recent studies have predicted levels to elevation 4212 in the near future. The general consensus of researchers and climatologists is that such predictions cannot yet be made with any degree of assurance. The data should, however, serve as a warning that the lake could rise to levels that would cause considerable damage to new and existing development around the Lake."
These are the exact words of Lloyd Austin, Division of Water Resources, Utah Department of Natural Resources, in an abstract to his paper, "Lake Level Predictions of the Great Salt Lake." Written in 1979, his words provide an indication of how well his advice has been heeded. Here we are, six years later, repeating the same concerns.
Another point can be made that, even with the recent (past five years) emphasis on nonstructural floodplain management techniques, the only serious response plans considered have been structural, primarily west desert pumping schemes, selective protective diking, and upstream retention and/or diversion. Even the proposed long-term management strategies are based on structural alternatives. These plans merely address lakeshore uses at particular lake level elevations. When all response plans are prefaced by, "From an engineering point-of-view" (inferring a structural response), one cannot help but to think we have a flat learning curve.
I find it ironic that the Southern Pacific Railroad, whose tracks cross the Great Salt Lake on the causeway that contributes to south shore flooding, owns another set of tracks that have been submerged since 1907 beneath the Salton Sea; another fluctuating inland desertic saline terminal lake.
98 ASPECTS OF REDUCTION
Most important though, we have learned that the rise of the Great Salt lake is not an unusual event. Across the United States we have found that fluctuating lakes are not unusual. There are documented cases of repetitive flooding from fluctuating lakes in Oregon, California, Utah, North Dakota, Minnesota, New York, and in areas around the Great lakes. What is disturbing is to find that there has been no semblance of an established methodology, at any level of government, for responding to and planning for these events.
FEMA Region VIII, along with the Natural Hazards Research Applications and Information Center in Boulder, Colorado, are jointly planning to document the responses to these events in order to provide a basis for consistent future policy decisions.
For now though, it is time to institute and implement long-term management strategies for the Great Salt lake. This event, though unprecedented in its frequency to recur, should not be the problem it is. The problem is not that the Great Salt lake goes up and down, or that Utah has experienced consecutive years of abnormal precipitation, but that Man has allowed development to occur where maybe he shouldn't have. We accept a certain degree of risk with everything we do. If what we are experiencing now is the risk accepted in the past, then fine, accept it. But let's not make the same mistake twice. Two years from now, or whenever the lake recedes, a long-term strategy should be in place, and enforced. We should define what risk is acceptable to highways, airports, wildlife areas, recreation facilities, private housing, sewage treatment plants, mineral extraction industries, and business and industrial parks, and then direct our future efforts toward operating within those parameters.
* * *
June 1985 Update:
The Great Salt Lake is at its highest level since 1877. On May 21, the lake's elevation peaked at 4209.95 feet ASL. This is 1.6 feet higher than last year at the same time. Since December, Utah has experienced a dry weather pattern with below normal precipitation. Temperatures have been warm and evaporation has increased.
In February, the legislature passed Senate Bill 97 which appropriated $96 million; $20 million to be used for flood mitigation projects and studies and $76 million to be held in a flood mitigation reserve account. One of the lake management options that the legislature is considering is the West Desert Pumping Project. This approach has been determined to be the most effective method to lower the lake level. Four to six pumps would be installed which would pump water from the south arm of the lake through an intake canal to the west pond where the majority of evaporation would occur. The water would then pass through an overflow canal into the east pond. After evaporation, the more concentrated brine would flow by gravity through a canal into the north arm of the lake. In addition to the pumps, dikes would be constructed to protect the Southern Pacific Railroad, the Bonneville Salt Flats, and the Air Force flight training area east of the west pond. Construction of the pumping project would take 15-18 months and
Phil ipsborn 99
cost approximately $52 million. Yearly operation costs would be $4 million. The pumping project would maintain the lake elevation below 4212 feet. During the first year of operation it is estimated that the project would lower the lake by 16 inches. An Environmental Impact Statement is bein9 conducted on the project and should be completed this fall.
Questions have been raised as to the economic feasibility of such a plan. Construction and maintenance of the West Desert Pumping Project are very expensive propositions. It will take 15-18 months for the purchase and installation of special saltwater pumps; by then the lake may be receding. The frequency of the abnormal weather conditions that Utah has experienced the last three years is expected to occur less than once everyone hundred years. Concern has been expressed by the State legislature's Energy, Natural Resources and Agriculture Study Committee about private landowners, private roads, mining, and oil claims in the project area. It was also unclear how the brine re-entry into the north arm of the lake would affect mineral extraction industries around the lake, particularly those located on the south shore. For these reasons, alternatives should be carefully cons i dered.
As a nonstructural method to address the lake's rise, the 15-Day Interagency Hazard Mitigation Report recommended the use of a working elevation of 4217 feet for planning and design activities. Scientists at the conference on "Problems of and Prospects for Predicting Great Salt Lake Levels" held in March 1985, also endorsed this recommendation. The State "406" Hazard Mitigation Plan is addressing this issue and is recommending the formation of an Intergovernmental Beneficial Development Council to establish a strategy for planning and development in the Beneficial Development Area, the area between the shoreline and 4217 feet. Meetings were held with State policymakers to brief them on such a proposal. The Great Salt Lake Tech Team, within the Department of Natural Resources, also made this recommendation at their April 18 meeting. They felt that the State should work with the counties to define the floodplain, consider it a hazard area, and plan accordingly. FEMA has informed the State of Utah that damages from future flooding of the Great Salt Lake may not be eligible for Federal Disaster Assistance under PL 93-288.
THE DEVELOPMENT OF RESIDENTIAL STAGE-DAMAGE
CURVES FOR APPLICATION IN WESTERN CANADA
Stephen W. Shawcross
IBI :Group, Calgary
Augusto R. V. Ribeiro
ECOS Engineering Services Ltd.,
Introduction
Edmonton
Flood damage estimates are required for evaluating the cost effectiveness of
projects designed to alleviate flood impacts. In the past, flood damages have
been examined by virtue of three basic techniques: 1) the first entails an
examina~ion of the flood plain immediately after the water recedes; if such
estimates were available for every flood over a period of many years, a damage
frequency curve could be created; 2) an alternative method is to determine the
damage caused by three or four recent floods whose hydro logic frequency can be
determined and a smooth damage-frequency curve plotted through these pOints; 3)
the third method entails hydrologically determining various flood elevations for
specific flood frequencies and deducing synthetically the damages that would occur
gi ven these fl ood events. Th i sana lys is prov i des a synthet i c damage-frequency
curve from which one can estimate average annual damages for a given study area. 1
The latter method is the one most frequently utilized primarily due to a number of
limitations inherent in the first two techniques, the most critical being that for
most flood plains, changes in land use with calendar time prevent the direct usage
of a damage-frequency relationship based on historical damages.
Residential stage-damage relationships are an essential component of overall
damage estimates. The depth of water above or below the first floor is the most
crit i ca 1 est imator of flood damage to the structure and contents of res i dent i a 1
buildings) There are several approaches which have been employed to develop
residential stage-damage relationships in Western Canada. These are briefly
described hereinafter.
Shawcross/Ribeiro 101
Past Studies
The Templeton Curve was developed from actual flood damages incurred as a
result of the devastating Winnipeg Flood of 1950. A single generalized curve was
der i ved based upon a fi xed percentage of the market va 1 ues of the structure s
affected. 3
A 1975 study of the Fraser River, British Columbia, by the Department of the
Environment,4 estimated damages employing a classification system for
categorization of residential units; however, they did not develop a
representative stage-damage function for each class and instead employed a fixed
stage-damage function based upon the Squamish River Flood Study.5 Contents were
evaluated at 40% of the market cost of the building based upon information
provided by the Canadian Underwriters Adjustment Bureau.
IBI/ECOS in a 1980 study of flood damages in Swift Current, Saskatchewan
employed the Acres classification system,6 for determining residential unit types,
and indexed stage-damage curves. 7 These synthetic curves of unit depth-damage
relationships for residential structures and contents were developed for the Joint
Task Force on Water Conservation Projects in Southern Ontario in 1968 by Acres.
The Curves were derived from field surveys of a representative sample of various
unit types located within the City of Galt (Cambridge).
Stage-damage curves produced by the Federal Insurance Agency in the United
States, (FIA Curves), which are premised on actual flood damage claims by unit
type, have been employed on a number of other flood damage reduction studies undertaken in Alberta. 8 ,9
The Fort McMurray Flood Damage Reduction Study
In 1981 the Alberta Department of the Environment, which is the provincial
agency responsible for the management of water resources, initiated a
comprehensive study of flood damages for the City of Fort McMurray in northeastern
Alberta. A subsidiary objective of the study was to develop stage-damage curves
that could be applied on future flood damage studies undertaken throughout
102 ASPECTS OF REDUCTION
Alberta. An important component of the study was the evaluation of past
estimation techniques. This review raised a number of concerns regarding use of
these data: 1) With respect to the FIA Curves, there is no adjustment factor
developed for application to Canadian situations. As well, this approach requires
individual market appraisals of each unit and finally, basement damage is not
adequately considered; 2) Regarding the Templeton and Acres data, this
information was 30 and 16 years old respectively; needless to say, construction
techniques as well as content types and distrubutions had changed considerably
since the curves were initially developed. In addition, these data sources did
not adequately consider different housing types i.e. 1 storey, 2 storey, split
level, etc.
Context
The City of Fort McMurray, with a population of 34,000 people, is located at
the conf 1 uence of the Athabasca and Clearwater Rivers in nor the as tern Alberta.
The oldest developed areas of Fort McMurray, the Lower Townsite and Waterways, are
situated in the floodplain of the Clearwater River and have a history of flooding
which dates back to 1835. The severest flooding is associated with the occurrence
of an ice jam on the Athabasca River and the last major flood in 1977, which
approximated a 1:17 year event, caused damages in the order of 20 million dollars.
Inventory of Residential Structures
A total of 3,341 residential units were inventoried and classified according
to basic quality (A,8 and C) and unit type (1 storey, 2 storey, split level). The
classification system (See Exhibit 1) was also expanded to reflect several
categories not addressed in previous studies i.e. mobile homes and multi-family
dwe 11 ings.
Content Damage Curves
Individual content damage curves were derived for each classification and
unit type based on a detai led contents survey of a statistically significant
number of residential structures. The survey was directed toward obtaining up
to-date total depreciated contents per residential category. Survey questionaires
were operat i ona 1 i zed for easy computeri zat i on and a content damage program was
developed. The extent of direct flood damages to various objects as well as
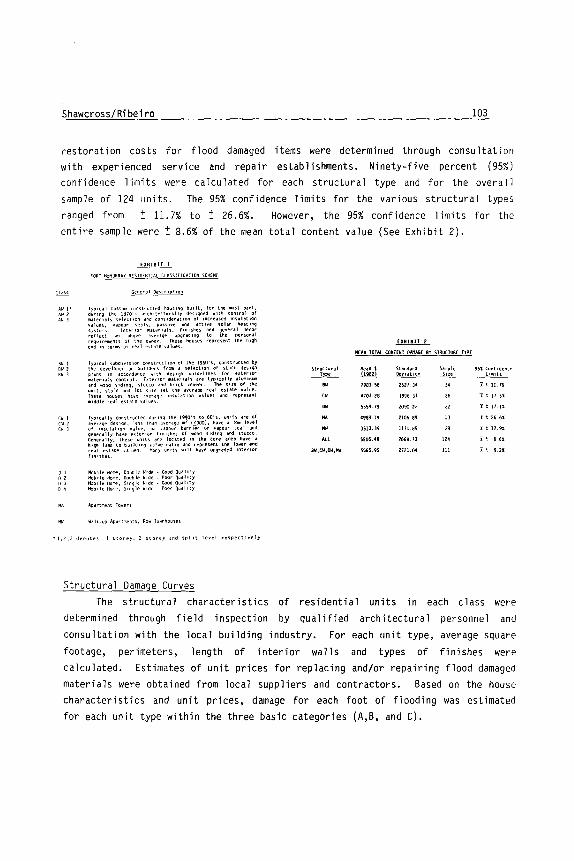
Shawcross/Ribeiro 103
restorat ion costs for flood damaged items were determined through consu Hat i on with experienced service and repair establishments. Ninety-five percent (95%) confidence limits were calculated for each structural type and for the overall sample of 124 units. The 95% confidence limits for the various structural types ranged from ~ 11.7% to ~ 26.6%. However, the 95% confidence limits for the entire sample were ~ 8.6% of the mean total content value (See Exhibit 2).
EXHIBI~
rORTHcHURIiAYRESIOEkTIAlCLASSIF!CArJONSCHEME
~ Gen{>r41Des(rllltlon
A~ l' TYP1(<l1 (uH'!m constructed hOUSIng bUIlt. for the !ll)st part, Alol 2 durmg the 1970's drChltecturally deSIgned loth control of All ] mater '" 1~ se leet 1011 dlld cons Ide,."l 1011 of ,ncrease-1 'nsulat Ion
values, vallour ~'!41~. pdSSlve .nd active solar henlng syHems. [nterlor mdterldls, finishes dnd general decor reflect an abo_!' average upgradIng to the personal reqUIrements of the own~r. These hOuses represent the 1\'911 end 10 terms oi red! estltl' values.
BW I TYP1Cdi SUbdl~lslon conH~uctlon of the 1950's, const~ucted by BW 2 the deve loper or bUilders fr()T] & ~elect 100 of stock de~ Ig" BW 3 pldns In dccordanCe ."th des Ign gUld~1 lnes for ealerlOr
materials control. E.terlormaterldls are tYPIcally alulnlnum dnd wood sldlnQ, ~tucco and brick veneer. The SIll' of the un It, style and lot s Ill' set the dveraQe real e~tate vdlue. These houses have dv~rd'le Insulat Ion va lues dnd represent m I dd Ie red I es t ale v d I u,,~
CW I TyplCd Ily con~tructed rl\lr In9 the 1940'~ to 60's, unIts dre of CW 2 dver~ge deslqn, less thdn average m2 (~)OO). have a 10" level cw3 of 'nwldllon yalue, OJ vapo"r barrier or vapour seal dnd
generallyh4ve exterIor f""shes of wood Siding alld stucco. Gener,,"lly, these un,ts are located.n the core area have a h'lIland tobUlld.ng >al..e ratio 4nd represent tile lo .. erend real estate ¥&Iues "'Jny un.t', .. ,II have upgraded interIor finishes.
01 MoblleHome,OoubleWlde-GOodQudllty 02 MoblleHome,OoubleWlde- PoOr Qu41.ty n ) HoJb 111' lIorrl!', ~ln9le Wide - Good QuJllty 04 Hoblle Home, Single WIde - Poor Quality
Apartment To .. ers
Wdll_upApdrtments, Raw Townhouses
'1,2,3 denote5 1 storey, 2 storey and split level respectively
Structural Damage Curves
Structural
~
" CW
ALL
aw,CW,OW,HW
1.!!!.!..!!!... H[AN TOTAL COHl(PH DNIAGE BY STRUCTURE TYP[
KeanS Standard Sample 9SlConfidence
llim. ~ ~ ~ 19B3.'i6 2621.]4 14 j! I1.1';
4703.28 1996.31 26 X! 11.5';
5554.19 2090.21 21 7. t 11.1';
4989.19 210689 IJ l"t 26.6';
3513.39 1110./:!9 Z9 7.tI2.9l
5505.48 2668.13 124 7. "t 8.1i';
5565.95 2121.04 111 j t 9.2';
The structural characteristics of residential units in each class were determined through field inspection by qualified architectural personnel and consultation with the local building industry. For each unit type, average square
footage, perimeters, length of interior walls and types of finishes were calculated. Estimates of unit prices for replacing and/or repairing flood damaged materials were obtained from local suppliers and contractors. Based on the house character i st i cs and un it pri ces, damage for each foot of fl oodi ng was est imated for each unit type within the three basic categories (A,B, and C).
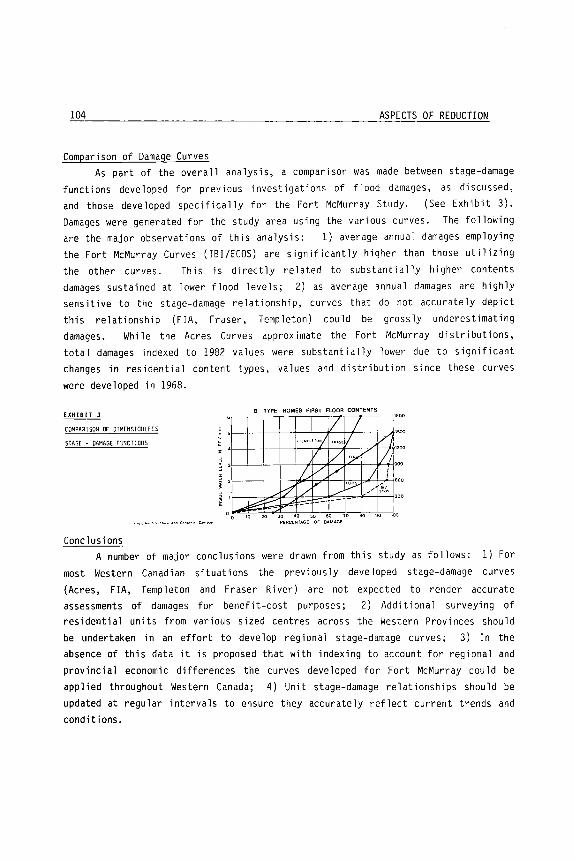
104 ASPECTS OF REDUCTION
Comparison of Damage Curves As part of the overall analysis, a comparison was made between stage-damage
functions developed for previous investigations of flood damages, as discussed,
and those developed specifically for the Fort McMurray Study. (See Exhibit 3).
Damages were generated for the study area using the various curves. The following
are the major observations of this analysis: 1) average annual damages employing
the Fort McMurray Curves (rBI/ECOS) are significantly higher than those utilizing
the other curves. This is directly related to substantially higher contents
damages sustained at lower flood levels; 2) as average annual damages are highly
sensitive to the stage-damage relationship, curves that do not accurately depict
this relationship (FIA, Fraser, Templeton) could be grossly underestimating
damages. Whil e the Acres Curves approx imate the Fort McMurray d i str i but ions,
total damages indexed to 1982 values were substantially lower due to significant
changes in res i dent i a 1 content types, va 1 ues and d i str i but ion since these curves
were developed in 1968.
EXHIBIT J
CQMPARISQrl OF elMENSIOtlLESS
STAGE - CAMAGE FUIICTIOfIS
Conclusions
B TYPE HOMES FIRST FLOOR CONTENTS , / J' , )
'''''''0,,/ rRASE V VA , V V ,
7 V V 'f---- f----I-
k1 /' / , k:::: v ~ ±-=:= -- -
0 0 10 20 30 40 50 60 PERCENTAGE or DAMAGE
/"V 1~lj.' J : i
P / (,,, I .;' !CQS
-I
A number of major conclusions were drawn from this study as follows: 1) For
most Western Canadian situations the previously developed stage-damage curves
(Acres, FIA, Templeton and Fraser River) are not expected to render accurate
assessments of damages for benefit-cost purposes; 2) Additional surveying of
residential units from various sized centres across the Western Provinces should
be undertaken in an effort to develop regional stage-damage curves; 3) In the
absence of this data it is proposed that with indexing to account for regional and
provi nc i a 1 economi c di fferences the curves deve loped for Fort McMurray cou 1 d be
applied throughout Western Canada; 4) Unit stage-damage relationships should be
updated at regular intervals to ensure they accurately reflect current trends and
conditions.

Shawcross/Ribeiro 105
1. James, L.D. 1971
References
and R.R. Lee Economi cs of Water Resources P 1 anni ng, McGraw-H i 11 Ser i es 1 n Water Resources and Environmental Engineering, New York: McGraw-Hill
2. Davis, A. Stewart
3.
4.
1981 User's Guide to the Federal Insurance Administration's 1978-1979 Flood Claims Fi le for Computation of Depth-Damage Relationships, U.S. Army Corps of Engineers, Virginia.
Templeton, C. 1960 Benefit-Cost Analysis of the Greater Winnipeg Floodway, The
Proceedings of the Engineering Institute of Canada, Annual General Meeting, Paper No. 34.
Book, A. N. 1975
and R. Princic Estimating Flood Damages in the Fraser Environment Canada, Inland Waters Directorate, Water Planning and Management Branch.
River Basin, Pacific Region,
5. Canada Department of Energy, Mines and Resources
6.
1967 Squamish Benefit-Cost Study, Unpublished Report, Engineering Division, Inland Waters Branch.
Acres Ltd. 1968 Guidelines for Analysis, Vol 2. For the Governments of Canada
and Ontario, Joint Task Force on Water Conservation in Southern Ontario.
7. IBI Group and ECOS Engineering Services Ltd. 1981 City of Swift Current Flood Plain Management Plan, Canada
Saskatchewan Flood Damage Reduction.
S. Proctor Redfern Butler and Krebes 1979 Fort McMurray Flood Damage Estimates, Alberta Municipal
Affairs, Fort McMurray.
9. The Dalcor Group
10.
1979 Drumheller Flood Control Study, Alberta Environment, Calgary.
IBI Group and 1982
ECOS Engineering Services Ltd. Phase lIB, Flood Damage Estimates, Fort McMurray Flood Damage Reduction Program, Technical Report, Alberta Environment and the City of Fort McMurray, Fort McMurray.

ASSESSING FLOOD CONTROL BENEFITS IN LAKE FLOODPLAINS-A DYNAMIC PROCESS
Greg Clumpner CH2M Hill
L. Douglas James Utah Water Research Laboratory
Terry Holzworth Salt Lake County Flood Control Office
Clyde Naylor Utah County Engineer's Office
Introduction
During 1982, 1983, and 1984, unusually high precipitation produced excep
tionally large flows into Utah Lake. The lake drains through a gate structure
into the Jordan River that, in turn, flows through an urbanized area of Salt
Lake City into the Great Salt Lake. The control structure was built more than
100 years ago to add storage in the lake for summer irrigation. It has also
been used to constrain Jordan River flows, thereby reducing flood damage along
the river. During the last three years, the lake level rose to record levels.
This resulted in flood damages exceeding $20 million and inspired local
agencies to investigate three flood control measures: 1) a new outlet control
structure, 2) dredging to increase the Jordan River channel capacity, and 3) a
new operational plan for lake releases. In the study described in this paper, the economic feasibility of these
three flood control measures was evaluated by estimating the benefits from the
alternatives for each measure. A stage-damage curve was developed and used for
this purpose. The dynamic nature of stage-damage curves used in assessing
flood control benefits in the Utah Lake and other lake floodplains is specific
ally addressed. Riverine Stage-Damage Curves
The damage caused by a riverine flood depends primarily on the maximum
flood stage. Consequently, stage-damage curves are developed to estimate flood damages corresponding to a peak water surface elevation.
Clumpner/James/Holzworth/Naylor 107
People respond to flood events during three stages: 1) warning, 2) inun
dation, and 3) recovery. The Water Resources Council (1979) identified three separate classifications of flood-induced costs associated with these stages:
1) protective costs involving emergency measures between the warning and inun
dation, 2) income losses during inundation until the property can be used
again, and 3) repair costs for restoring property to its original state after
the water recedes. The three are often summed to estimate flood damages, but
economists (Milliman, 1984) have cautioned against double counting where these
classifications overlap.
For river flooding, the first two stages (warning and inundation) are
relatively short and most of the damages are associated with repair costs. The
relationship of repair cost to river stages can be readily expressed in a
stage-damage curve. For a given flood frequency, one can estimate the flow,
stage, and the damage. By repeating the process, damages can be plotted
against frequency, with the area under the curve then used to estimate average
annual flood damages on a probability-weighted basis.
Dynamic Stage-Damage Curves for Lake Flooding
For lake flooding, the warning and inundation stages can take place over a period of months or even years, allowing plenty of time to construct protective
measures and, for unprotected property, causing extended periods of income
loss. Nevertheless, a stage-damage curve can still be applied. By starting with initial conditions, a stage-damage curve can be constructed for the
current year. During that year, individuals will respond to rising lake levels
and/or the threat of flooding by protecting their property. They may also have
damages when forced to abandon their property or when their protective efforts
fail. At the end of the year, certain protective measures will have been
implemented and capital damages (repair costs) incurred, and the lake will be
at a new stage. At that point, a different set of damages will be associated
with the same range of stages. The stage-damage curve must therefore be
adjusted to reflect these new conditions before going on to estimate the
damages for the next year. An example of this adjustment is illustrated in
Figure 1.
Simulation provides one tool for adjusting stage-damage relationships
annually. Flood damages for lake floodplains (James et al., 1985) and frequent
riverine flooding (Breaden, 1973) can be simulated by combining decision rules on property protection, abandonment, and repair with different sequences of
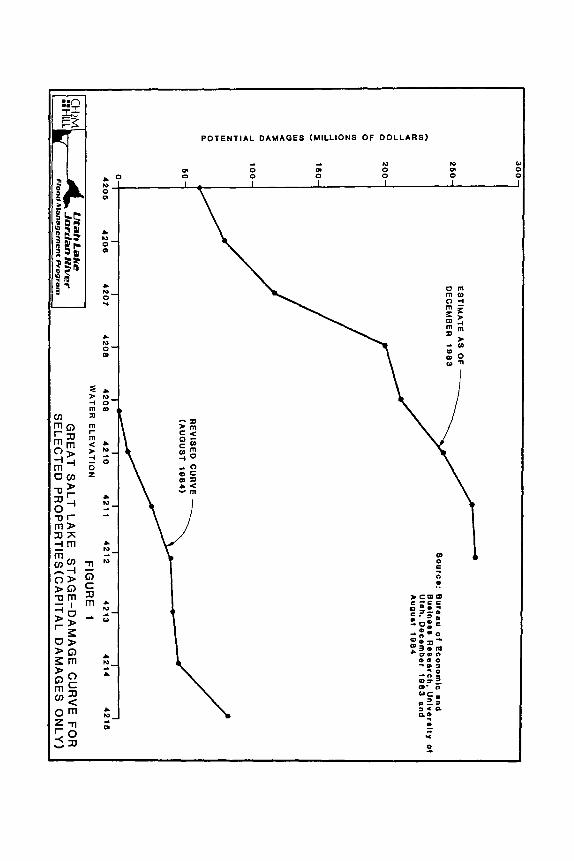
~
U)
a: <C ..J ..J o Q
u.
o U)
z o ::; ..J
30
0
25
0
20
0
i 1
50
U)
w
CJ <C :i <C Q
..J 1
00
<C
.... Z
W
.... o CI.
50
ES
TIM
AT
E
AS
O
F
RE
VIS
ED
C
UR
VE
(A
UG
US
T 1
98
4)
So
urc
e:
Bu
rea
u o
f E
co
no
mic
a
nd
B
Ulln
e .. R
ea
ea
rch
, U
niv
erilly
o
f U
tah
, D
ece
mb
er
19
83
a
nd
A
ug
ult
19
84
01 ~
42
05
4
20
8
42
07
4
20
8
Llta
hL
ah
e
• 7 ~ J
ord
an
Rilie
r
42
09
4
21
0
42
11
4
21
2
42
13
4
21
4
42
15
WA
TE
R
EL
EV
AT
ION
F
IGU
RE
1
GR
EA
T
SA
LT
LA
KE
S
TA
GE
-DA
MA
GE
C
UR
VE
FO
R
SE
LE
CT
ED
P
RO
PE
RT
IES
(CA
PIT
AL
D
AM
AG
ES
O
NL
Y)
Clumpner/James/Holzworth/Naylor 109
flood events. The lake flood levels can be either deterministic forecasts or
stochastic sequences (Chadwick, 1985; Bowles and James, 1985) of inflow,
precipitation on the lake, and evaporation combined to generate new water
surface elevations. The decision rules can also be deterministic or contain a
stochastic element to represent the uncertainty of property owner response to
lake level rises.
Developing weather scenarios and their corresponding decision rules is
another method of simulating the dynamics of the stage-damage relationship.
This is basically a simplified version of the simulation technique noted above.
Weather scenarios should be selected to cover the range of possible inflow, precipitation, and evaporation conditions, and require a different set of
stage-damage curves for each scenario. The closer these curves can represent
the dynamic protection and abandonment decisions of property owners during lake
level rises, the more reliable they become as damage estimators.
Whether the probabilistic simulation or the weather-scenario technique is
used, annual adjustments to the stage-damage relationship are necessary to
represent the changing damage potential on the floodplain. Sensitivity analy
sis can be used to determine how changes in property owner responses, lake
levels, or other parameters would affect study conclusions.
Utah Lake Stage-Damage Curves
Figure 2 outlines the flood-prone and levee-protected areas at Utah Lake.
The outlet control structure noted in the figure has a limited capacity and
flow is further constrained by an operating policy incorporating legal and
political agreements established to protect irrigation water supplies. This,
along with the inadequate channel capacity of the Jordan River, has prevented
sufficient water releases to keep the lake below flood stage the last several
years. An initial stage-damage curve was developed to reflect conditions on the
Utah Lake floodplain in the summer of 1984. The first step in this process was
to use aerial photos to determine areas inundated at the peak of the 1983 flood. Elevation contour lines from USGS maps were then used used to determine
areas that would be inundated at water surface elevations of the nearest
contour lines above and below the level of the 1983 flood (i.e., 4490 and 4500
feet). A land use study of these potential flood areas determined the acreages
and types of crops grown, the acreage of native vegetation, and the endangered residential, commercial, and industrial areas. Areas expected to be protected

"'I"J '~I
' 1-;
'.':' .:'
".'
I ~>J.
. i~
r~.· ~r"
. "( , " ' .. , ... ,.,.
"t·"
.... ···
~i~(~;:~~'i ~',,;."';i "'~ .~ ';I"lt~''''''l : ':
.. ~~. ",A~~.'irtr~r
~)j1~;~')j~~ ... i ";;.":',' ! ~.:
.. ,,:'~~~"~~41MIIl~ft/ ,:~ 'It, r·· .-.
f' .
;~t' . ',,'.
j.,'
UT
AH
LA
KE
",<
FIG
UR
E 2
UT
AH
LA
KE
-E
XIS
TIN
G A
ND
PR
OP
OS
ED
LE
VE
ES
. F
LO
OD
ED
AN
D
FO
TE
NT
IAL
FL
OO
DE
D A
RE
AS
_
__
__
z-4!!!!!!!!!!"[
~ ~
D '·. "
",
..L.E
Jill!lL
~~:,:~~=~~:~n£l.HWL"Kll.u()
~wo:JltC1U>BYI.C\llU""",'...o..lDO~.fl.OOOUl"'o.M<l
B.C\f"'I1JH'~fU1
I'AJP
06EO
UT
lH5oO
<,.. U
lSlH
l L£Y
U a
RD
I<l T
OA
lOffC
fIO tlllX
lnC
l
Il.A.IIIEDro.M'IRC\oOD~III;CU4-.rr":Hfl.OOIll'l'lOnCII; ... T
OU
"fU
1
,,' :~'
" 'r-.. ",r
. "
\ , ... :,.\~.--."-
¥ _ i
~'" -
-'1 1-f
I"
:'0
'
_ .. -., .. '.'~"\>J
" -~~;
:''T
" "",'.
" •. ~
,:~, .. J,.
. -.b".~:o!-"" ,;:
I I
i "
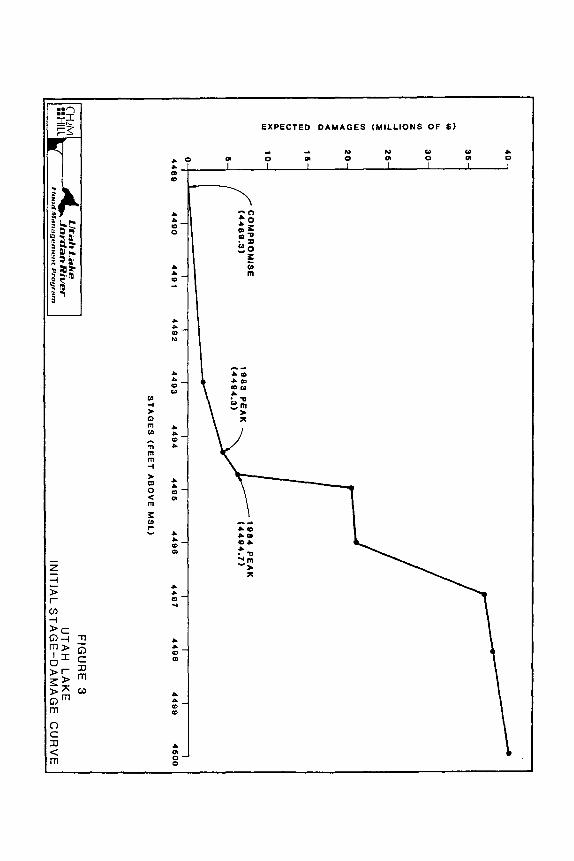
- lit II. 0 (f)
z 2 ...J ...J
::E
(f)
w
CI c :E c Q
Q
w
I-0 W
II. )(
w
40
36
30
26
20
111
10
CO
MP
RO
MIS
E
L..---1
98
4
PE
AK
(4
48
8.3
) 1
88
3
PE
AK
..........
(44
84
.71
II '
(44
84
.3)
o I \ ~
44
89
4
49
0
44
91
4
49
2
44
93
Uta
/. La
he
Ito
, ~ J
ord
an
Riv
er
44
94
4
49
6
44
96
ST
AG
ES
(F
EE
T A
BO
VE
M
SL
)
44
97
4
49
8
44
99
FIG
UR
E
3
UT
AH
L
AK
E
41100
INIT
IAL
ST
AG
E-D
AM
AG
E
CU
RV
E
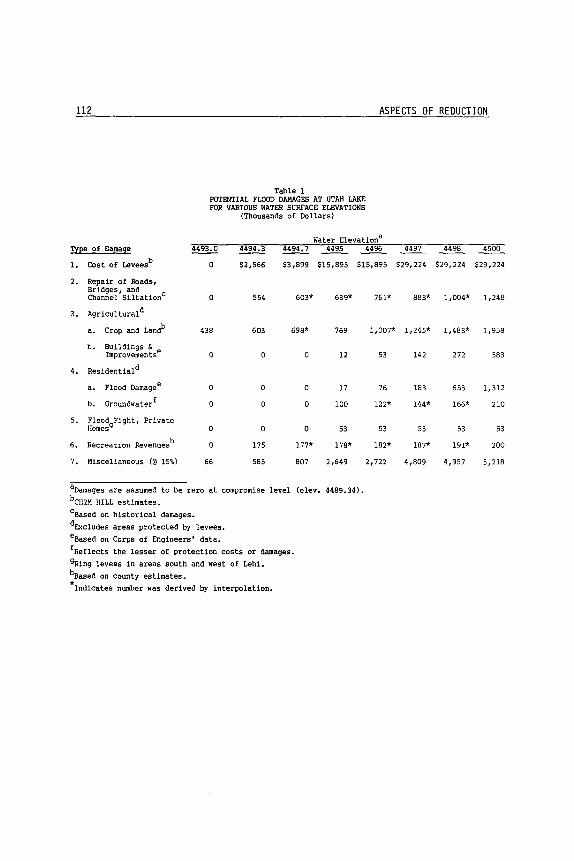
112 ASPECTS OF REDUCTION
Table 1 POTENTIAL FLOOD DAMAGES AT UTAH LAKE FOR VARIOUS WATER SURFACE ELEVATIONS
(Thousands of Dollars)
Water Elevationa
!n~e of Damage 4493.0 4494.3 4494.7 4495 4496
l. Cost of Levees b
0 $2,566 $3,899 $15,895 $15,895
2. Repair of Roads, Bridges, and c Channel Siltation 0 554 603* 639*
3. Agricultural d
a. Crop and Landb 438 603 698* 769
b. Buildings & Improvementse 12
4. Residential d
a. Flood Damagee 0 0 0 17
b. Groundwa ter f 0 100
5. Flood Fight, Private Homes9 0 0 53
6. Recrea tion Revenues h 0 175 177* 178*
7. Miscellaneous (@ 15%) 66 585 807 2,649
aOamages are assumed to be zero at compromise level (elev. 4489.34). bCH2M HILL estimates.
cSased on historical damages.
dExcludes areas protected by levees.
eBased on Corps of Engineers I data.
fReflects the lesser of protection costs or damages.
9Ring levees in areas south and west of Lehi.
hBased on county estimates. * Indicates number was derived by interpolation.
761*
1,007*
53
76
122*
53
182*
2,722
4497 4498 4500
$29,224 $29,224 $29,224
883* 1,004* 1,248
1,245* 1,483* 1,958
142 272 583
183 653 1,312
144* 166* 210
53 53 53
187* 191* 200
4,809 4,957 5,218
Clumpner/James/Holzworth/Naylor 113
by existing or new levees were not included in these estimates.
These data were used with information on historical damages, engineering cost estimates, field surveys, and consultations with public, governmental, and
local authorities in estimating damages for various types of property. Some of
the general rules used in estimating annual damages for this initial and subse
quent-year curves were: 1) Protective costs were counted as a damage and estimated by an
engineering cost analysis for necessary protective measures.
2) Income losses associated with temporarily or permanently unusable
property were counted as damages. Operations that were discontinued
or forced to shift to a less profitable location were also included.
3) Repair costs included only those occurring in the current year.
Costs associated with previously destroyed or damaged property were
excluded because the same degree of damage cannot occur twice unless
the property had been repaired. In most cases, this had not
happened.
The results for the initial curve are depicted in Figure 3 and summarized in
Table 1.
Once the initial curve was completed, three weather scenarios were then
developed to reflect a range of possible future weather patterns. These included "worst-case," "best-case," and "most-likely-case" scenarios. Sets of
stage-damage curves corresponding to these scenarios were then derived from the
initial curve. Adjustments were made to account for the previous year's
damages and to reflect other changes, including those to endangered facilities,
lake levels, and various decision rules. Adjusting the decision rules involved forecasting the protection strategies that corporate and public entities would
follow. This was a critical step in the analysis.
Flood Control Benefits
It was readily apparent that the flood control measures would yield very
few benefits for the best-case scenario in which the weather returned to a
long-term normal or dry pattern. The focus was on benefits that would occur if
the abnormally high precipitation were to continue, as in the most-likely and
worst-case scenarios. These two scenarios were defined as 1) a continuation of inflow to Utah Lake at approximately 1984 levels for the period 1985-87
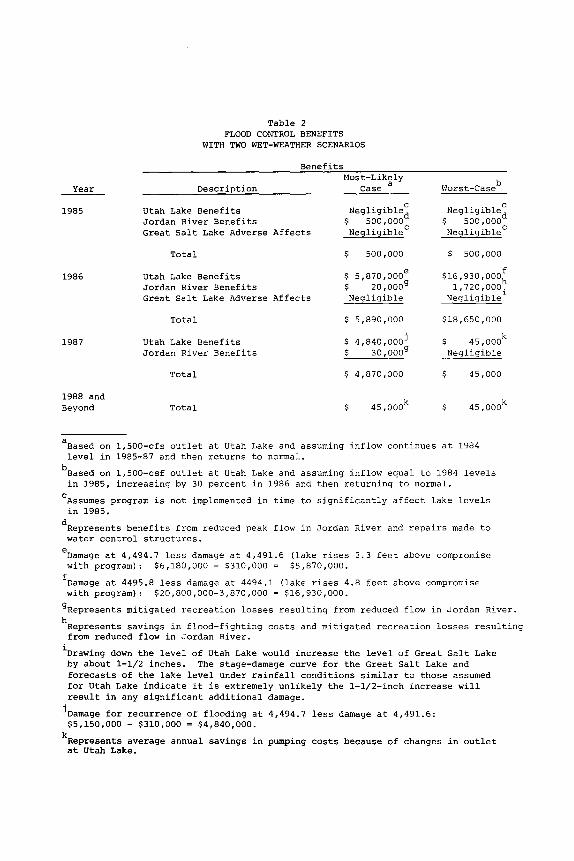
Year
1985
1986
1987
1988 and Beyond
Table 2 FLOOD CONTROL BENEFITS
WITH TWO WET-WEATHER SCENARIOS
Description
Utah Lake Benefits Jordan River Benefits
Benefits
Great Salt Lake Adverse Affects
Total
Utah Lake Benefits Jordan River Benefits Great Salt Lake Adverse Affects
Total
Utah Lake Benefits Jordan River Benefits
Total
Total
Most-Lik~ly
Case
.. c Negl1g1ble d
$ 500,000 Negligible c
$ 500,000
$ 5,870,000e $ 20,000g Negligible
5,890,000
$ 4,840,000j $ 30,000g
$ 4,870,000
45,000k
l'iorst-caseb
.. c Neg11g1ble
d $ 500,000 NegligibleC
500,000
f $16,930,000h
1,720,000. Negligible 1
$18,650,000
45,000k Negligible
$ 45,000
45,000k
aBased on 1,500-cfs outlet at Utah Lake and assuming inflow continues at 1984 level in 1985-87 and then returns to normal.
bBased on 1,500-csf outlet at utah Lake and assuming inflow equal to 1984 levels in 1985, increasing by 30 percent in 1986 and then returning to normal.
cAssumes program is not implemented in time to significantly affect lake levels in 1985.
dRepresents benefits from reduced peak flow in Jordan River and repairs made to water control structures.
eDamage at 4,494.7 less damage at 4,491.6 (lake rises 2.3 feet above compromise with program): $6,180,000 - $310,000 ~ $5,870,000.
fDamage at 4495.8 less damage at 4494.1 (lake rises 4.8 feet above compromise with program): $20,800,000-3,870,000 ~ $16,930,000.
gRepresents mitigated recreation losses resulting from reduced flow in Jordan River.
hRepresents savings in flood-fighting costs and mitigated recreation losses resulting from reduced flow in Jordan River.
iDrawing down the level of Utah Lake would increase the level of Great Salt Lake by about 1-1/2 inches. The stage-damage curve for the Great Salt Lake and forecasts of the lake level under rainfall conditions similar to those assumed for Utah Lake indicate it is extremely unlikely the 1-1/2-inch increase will result in any significant additional damage.
jDamage for recurrence of flooding at 4,494.7 less damage at 4,491.6: $5,150,000 - $310,000 ~ $4,840,000.
kRepresents average annual savings in pumping costs because of changes in outlet at Utah Lake.
Cl umpner/ James/Hol zworth/Nayl or 115
followed by a return to normal, and 2) an inflow to Utah Lake approximately
equal to 1984 levels in 1985, increasing by 30% in 1986 and then returning to
normal. A summary of the flood prevention benefits by year for these two
weather scenarios is presented in Table 2. Benefit-cost ratios for these two
scenarios were computed assuming a 30-year useful life of the facilities and an
8% interest rate. The most cost-effective flood-control alternative was to
enlarge the outlet structure and Jordan River channel capacity to allow approx
imately l,500-cfs releases. Based on a cost of $10.5 million for this alter
native, the most-likely case weather scenario had a B-C ratio of 1.0 compared
to a ratio of 1.7 for the worst-case scenario.
References Bowles,
1985 David S. and L. Douglas James
"Issues Associated with Stochastic Modeling of Great Salt Lake Levels for Planning Purposes." Proceedings of Problems of and Prospects for Predicting Great Salt Lake Levels. March 26-28, 1985. Salt Lake City: University of Utah.
Breaden, John P. 1973 "The Generation of Flood Damage Time Sequences." UKWRI Report # 33.
Lexington: University of Kentucky.
Bureau of Economic and Business Research 1983 "Actual and Potential Damages Incurred by Industries, Governments,
and Other Lake Users Due to the Rising Level of the Great Salt Lake." Salt Lake City: Graduate School of Business, University of Utah.
1984 "Flooding and Landslides in Utah: An Economic Impact Analysis." Salt Lake City: Graduate School of Business, University of Utah, and Utah Department of Community and Economic Development, Utah Office of Planning and Budget.
Chadwick D., George Jr. 1985 "Forecasting Water Surface Elevations of the Great Salt Lake."
James, L. 1985
Milliman, 1984
Unpublished dissertation. Logan: Utah State University,
Douglas, David S. Bowles, and E. K. Israelsen "The Use of Hydrologic Data on the Economic and Financial Analysis of Lake Level Control Alternatives." Proceedings of Problems of and Prospects for Predicting Great Salt Lake Levels. March 26-28, 1985. Salt Lake City: University of Utah.
J. W. "A Needed Economic Framework for Flood Plain Management." Water International 9 (#3). Lausanne, Switzerland: International Water Resources Association.

116 ASPECTS OF REDUCTION
Salt Lake County and Utah County 1984 "Utah Lake-Jordan River Flood Management Program,
Phase I Report." Submitted by CH2M HILL. Sacramento California.
Water Resources Council 1979 Procedures for Evaluation of National Economic Benefits (NED) and
Costs in Water Resources Planning, Final Rule. Washington, DC.
EXPECTED ANNUAL DAMAGES WITH AND WITHOUT LEVEES
Robert M. Watson Wisconsin Department of Natural Resources
Introduction
Since the inception of the National Flood Insurance Program in 1968, the
federal government has struggled to develop a clear policy with regard to
levees. In the early 1970's, any levee with a crown elevqtion above the 100-
year level was credited with providing 100-year protection. Then in February
1981, an "Interim Levee Policy" was issued from Federal Emergency Management
Agency (FEMA). Many issues previously overlooked were addressed in the policy,
especially the design height. The policy, still in force today, requires a
minimum height three feet above the 100-year flood elevation. This "freeboard"
requirement provides assurance that the degree of protection afforded by a
levee system is at least 100-year. The policy also established criteria rela
tive to ownership, inspection and evaluation, closure structures, mapping,
design, and construction standards for new levees. If a levee meets all of the
requirements, areas protected by the levee will be removed from 100 year floodplain designation. This in turn will remove floodplain zoning restrictions and
the mandatory purchase of flood insurance. The policy has been applied on a
case by case basis since 1981.
In October, 1982, the National Research Council of the National Academy of Sciences presented a report titled A Levee Policy for the National Flood
Insurance Program to FEMA (NRC, 1982). Many issues were presented in the
report, including structural criteria, inspection, operation, maintenance,
warning, evacuation, mapping and design height. Within the introduction of the
report six areas of concern are listed, as previously indicated by FEMA. Of
the six, two relate directly to the focus of this paper. They are:
"4) ... the degree of protection to be expected from a 100-year design levee
is less than that obtained by elevating individual buildings to the 100-
year flood elevation because of ..• greater depths of flooding experienced
in unelevated structures upon levee overtopping or failure."
118 ASPECTS OF REDUCTION
and
"5} Crediting a levee system with protection against the lOO-year flood
would, under present interim procedures, remove essentially all floodplain
management requirements, lender notification requirements, and insurance
purchase requirements within the levees area .... " This could violate the
spirit of the National Flood Insurance Act by encouraging development in
areas subject to major flood damage.
The committee recommended, in spite of the initial recognition that levees
do not offer "permanent" protection, that a lOO-year design levee is sufficient
to remove the requirements for elevating structures built behind a levee. The committee conversely recommended that a levee providing at least 500-year
protection is sufficient to remove the requirement for mandatory purchase of flood insurance. If statements 4} and 5} above are accurate, then these stan
dards should not be established until criteria is developed which accurately
determine the effects of such a policy. Both the Corps and FEMA currently evaluate risk in floodplains based on an
annual assessment of potential damages. The Corps derives benefits (i.e.,
reduction in damages) based on a decrease in the frequency of flooding due to a
proposed flood protection structure. FEMA derives actuarial insurance premiums
based on the frequency of flooding in an area. However, neither approach
evaluates the disparity of the residual risk behind a levee caused when flood
plain management and/or mandatory purchase of flood insurance are removed.
Two questions will be addressed in this paper: I} Does a lOO-year design
levee provide the same degree of protection as elevation of individual struc
tures in compliance with current regulations? and 2} If the answer to question
#1 is NO, what design level does?
Scope
A comparison of annual damage has been conducted for I} a residential
structure built in compliance with federal requirements and, 2} a similar
structure located behind a levee built on grade. The methodology used is modeled after the Hydrologic Engineering Center (HEC) "Expected Annual Damage"
(EAD) technique. This technique is being used since it appears to be the only method to make a valid comparison of risk behind a levee. It also relates
directly to current policy within both the Corps (to evaluate the benefits of
levees), and FEMA (to determine actuarial flood insurance rates). Recommendations will be made at the end of this paper to apply the results of the

Watson 119
comparison to develop criteria for the design height of new levees and the
removal of floodplain management/flood insurance.
The comparisons of EAO contained in this paper are based on the following assumptions:
1) The levee will fail by overtopping (without breach failure).
2) The levee meets Corps design, construction, operation, and maintenance requirements with regard to structural stability.
3) The levee will provide protection only to the design flood, not to the
freeboard elevation, to account for the uncertainties of hydrology and hydraulics.
4) Damages to structures are based only on inundation depth, not flowing
water, where damage from velocity would occur.
5) There is no threat of flooding by interior drainage.
Admittedly, all fo the above assumptions present a somewhat idealistic
situation. For example, lack of maintenance will obviously decrease the level
of protection as originally designed, and therefore increase a calculation of
annual damages. Any serious attempt to utilize the EAD comparison will there
fore need to consider these additional factors.
Expected Annual Damage Comparisons
The Expected Annual Damage, as Johnson (1985) explains in his paper, is
computed from damage/frequency relationships which relate estimates of damage
to expected frequency of occurrence. Elevation/damage relationships are
developed for damageable property and elevation/frequency relationships are
developed to define the flood hazard. The two relationships are combined to produce a relationship between damage and frequency. These elevation/frequency
curves are commonly developed through the use of 1) a rating curve which relates water surface elevation to channel flow, and 2) the flow/frequency
relationship which is derived from watershed characteristics. In the process
of developing an elevation/damage curve, the first flood elevation of the
structure is required. The second step is to relate the elevation of a speci
fic flood frequency to the elevation of the structure. Figure 1 illustrates
exactly how expected annual damage is calculated. The combination of the
elevation/frequency curve and elevation/damage curve results in the combined
curve (damage vs. frequency). The area defined under this curve is the expec
ted annual damage for the structure (or structures). As mentioned above, EAO comparisons have been derived for the following
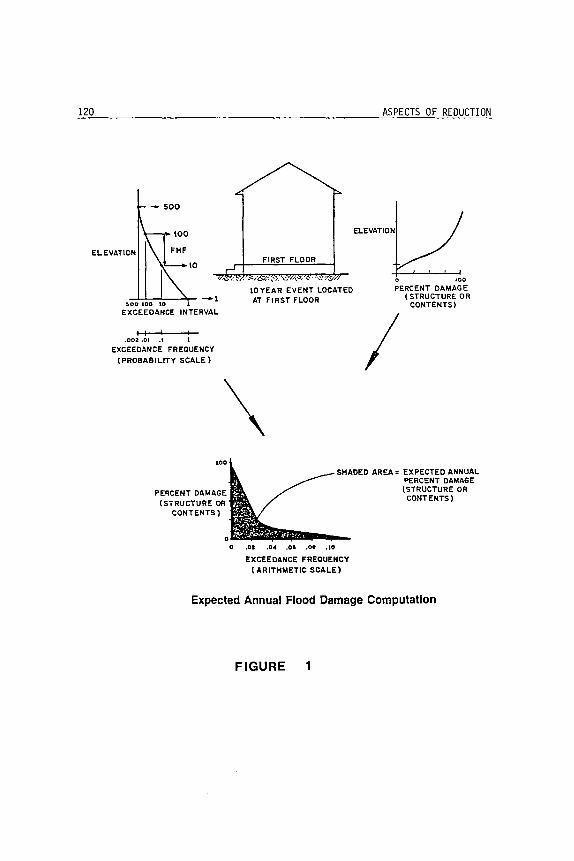
120 ASPECTS OF REDUCTION
- 500
.- I I ~ aEVATION! /
~~ 10
'-00-'-"00::0--'-'0--->"'" - -1 EXCEEOANCE INTERVAL
I I I .002,Ol.\ 1
EXCEEDANCE FREQUENCY
(PROBABILITY SCALE)
10YEAR EVENT LOCATED AT FIRST FLOOR
o 'DO PERCENT DAMAG E
(STRUCTURE OR CONTENTS)
/ \
,00
PERCENT DAMAGE (STRUCTURE OR
CONTENTS)
.02 .04 .01 .01 .,0
SHADED AREA = EXPECTED ANNUAL PERCENT DAMAGE (STRUCTURE OR
CONTENTS)
EXCEEDANCE FREQUENCY
(ARITHMETIC SCALE)
Expected Annual Flood Damage Computation
FIGURE 1
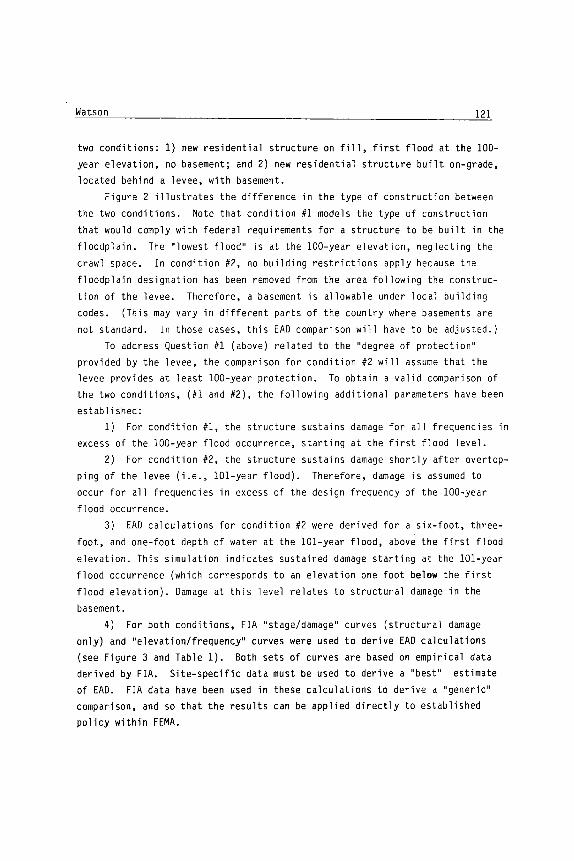
Watson 121
two conditions: 1) new residential structure on fill, first flood at the 100-
year elevation, no basement; and 2) new residential structure built on-grade,
located behind a levee, with basement.
Figure 2 illustrates the difference in the type of construction between
the two conditions. Note that condition #1 models the type of construction
that would comply with federal requirements for a structure to be built in the
floodplain. The "lowest flood" is at the lOO-year elevation, neglecting the
crawl space. In condition #2, no building restrictions apply because the
floodplain designation has been removed from the area following the construc
tion of the levee. Therefore, a basement is allowable under local building
codes. (This may vary in different parts of the country where basements are
not standard. In those cases, this EAD comparison will have to be adjusted.)
To address Question #1 (above) related to the "degree of protection"
provided by the levee, the comparison for condition #2 will assume that the levee provides at least 100-year protection. To obtain a valid comparison of
the two conditions, (#1 and #2), the following additional parameters have been
established: 1) For condition #1, the structure sustains damage for all frequencies in
excess of the lOO-year flood occurrence, starting at the first flood level.
2) For condition #2, the structure sustains damage shortly after overtop
ping of the levee (i.e., 101-year flood). Therefore, damage is assumed to
occur for all frequencies in excess of the design frequency of the lOO-year
flood occurrence.
3) EAD calculations for condition #2 were derived for a six-foot, three
foot, and one-foot depth of water at the 101-year flood, above the first flood
elevation. This simulation indicates sustained damage starting at the lOl-year
flood occurrence (which corresponds to an elevation one foot below the first
flood elevation). Damage at this level relates to structural damage in the
basement.
4) For both conditions, FIA "stage/damage" curves (structural damage
only) and "elevation/frequency" curves were used to derive EAD calculations
(see Figure 3 and Table 1). Both sets of curves are based on empirical data
derived by FlA. Site-specific data must be used to derive a "best" estimate
of EAD. FIA data have been used in these calculations to derive a "generic" comparison, and so that the results can be applied directly to established
policy within FEMA.
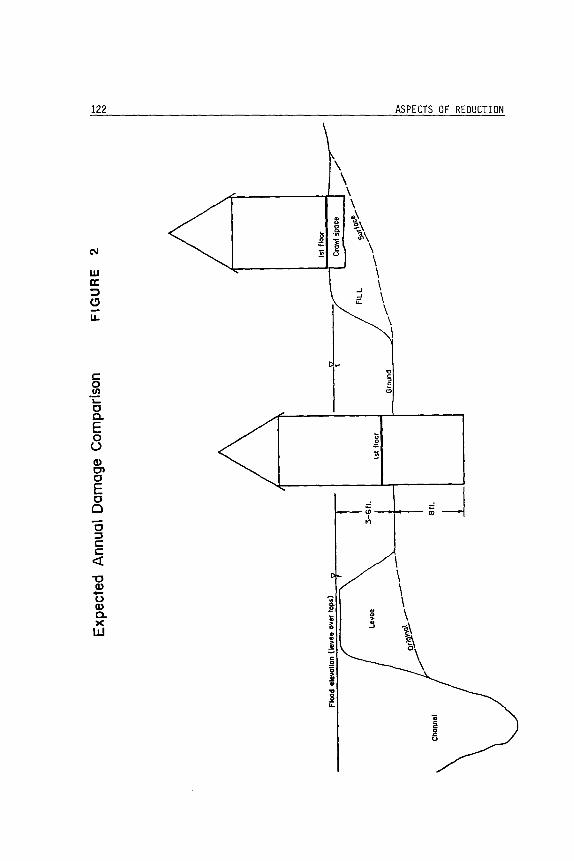
122 ASPECTS OF REDUCTION
\ \ \ \ .. ~\ u ~\ 0
I; .(;l- 3>\ ,g "i N ~
e \ u \
UI \ 0: \ ::J ...J
...J \ (!) i.: \ u. \
\
c ~ 0 en i5 "C: 0 a. E 0 0
u 0
!! Q) Ol 0 E j 0 D iii
0 :J C C
c::( \ -0 \ Q) \ -0 \ Q) ..
\ a. .. X .5 ~\ w
.~
'\ \
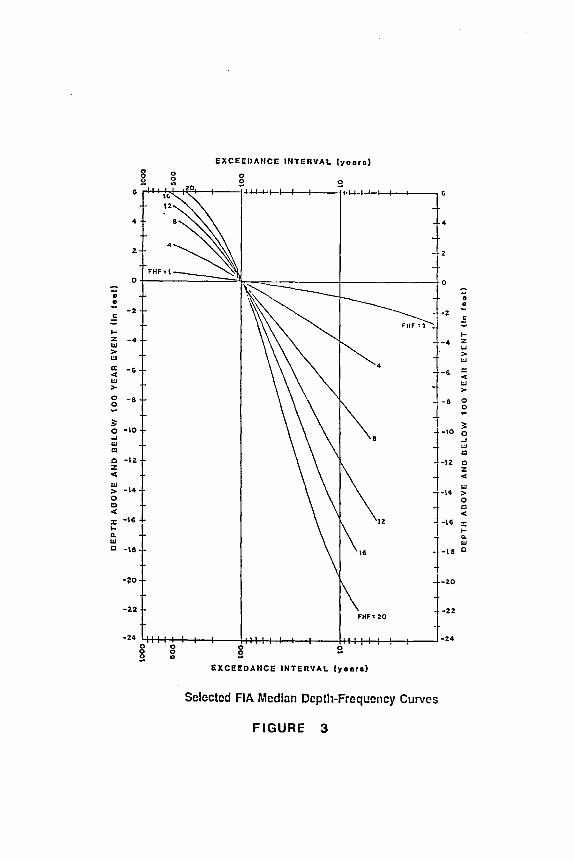
EXCEEflAliCE trlTERVAL (yo oro'
8 0
2 0 2 '" 20
6
'" t-H-I--"-
4 4
2 - 2
0 0
" 0
! 0 -2
~ -2 .: c
>- I-% -4 -4 Z III U > > I:J UJ a: -6 -6 J:
'" '" I:J W >- >-0 -8 -8 0 0 0
:;: ?; 0 -10
r 0 .... .... w UJ CI CI Q -12 -12 0 % Z
'" '" W w > -14 r > 0 0 CI '" '" '" :I: -16 12 -16 :<: >- I-...
}-18 0.
w w Q -18 c
-?O l20
-22 -22 FHF' 20 -24 -24
0 0 0 2 0 0 g g .. EXCEEDAIICE INTERVAL (yoar"
Selected FIA Mcdlnn Depth-Frequency Curves
FIGURE 3
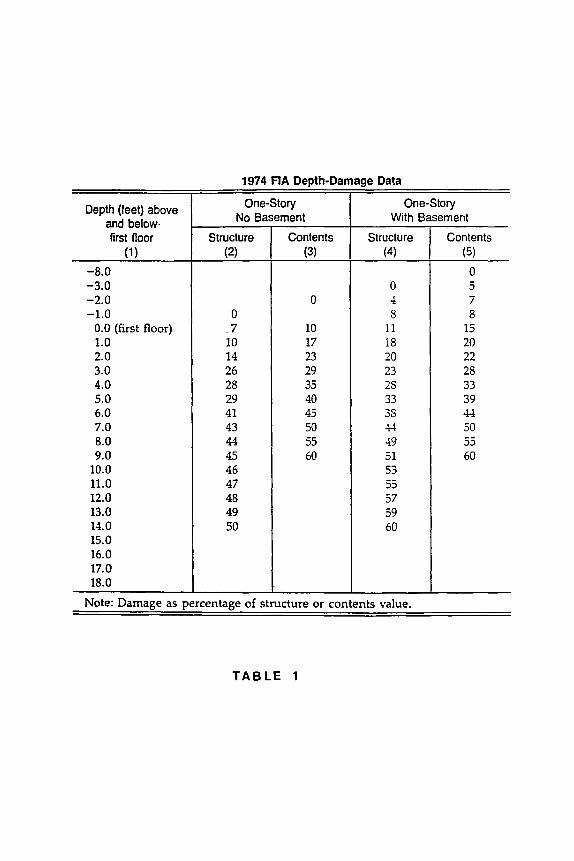
1974 FIA Depth-Damage Data
Depth (feet) above One-Story One-Story
and below· No Basement With Basement
first floor Structure Contents Structure Contents (1 ) (2) (3) (4) (5)
-8.0 0 -3.0 0 5 -2.0 0 -! 7 -1.0 0 8 8
0.0 (first floor) _7 10 11 15 1.0 10 17 18 20 2.0 14 23 20 22 3.0 26 29 23 28 4.0 28 35 28 33 5.0 29 40 33 39 6.0 41 45 38 4-! 7.0 43 50 ++ 50 8.0 44 55 49 55 9.0 45 60 51 60
10.0 46 53 ll.O 47 55 12.0 48 57 13.0 49 59 14.0 50 60 15.0 16.0 17.0 18.0
Note: Damage as percentage of structure or contents value.
TABLE 1

Watson 125
EAD comparisons were also made for both conditions #1 and #2 for two
different "Flood Hazard Factors" (FHFI and FHF4) to reflect differing watershed
conditions. The numerical subscript in FHFl, for instance, relates to the
difference in feet between the 100-year flood elevation and the ten-year elevation. FHFI simulates a river system with a wide flat floodplain, where there
will be very little difference in elevation between flood frequencies (above
the channel bank). FHF4, on the other hand, simulates a larger difference in
elevation between flood frequencies, related to the river system where the
overbank is steeper or where the river valley is relatively narrower. These
two simulations should represent a large majority of river systems nationwide.
Table 2 shows the EAD calculations for all of the parameters indicated above. The results indicate that annual damages for condition #1 and condition
#2 are equal only when the first floor for condition #2 is one foot above the
100-year elevation.
This indicates, based on the assumptions listed above, that a 100-year
design levee does not provide the same "degree of protection" as current
federal requirements for construction in floodplain areas.
FHF1
FHF4
Condition #1
d = 0
EAD = 60
d = 0
EAD = 84
d: depth of flooding above
Table 2
Condition #2
(lOO-year design levee)
d EAD
6 252
3 162
-1 72
6 270
3 186
-1 90
first floor (lOl-year flood)
EAD: Expected Annual Damage in dollars, structure value
equals $60,000.

126 ASPECTS OF REDUCTION
To address Question #2 above related to the "optimum" design level, an
iterative procedure was used to determine the design height required to provide
the same degree of protection for condition #2. The results indicate that at
the six-foot depth condition, a 500-year design is necessary. Obviously, since
the EAD will decrease with a small depth of flooding (as shown in Table 2), the
required design level for less than a six-foot depth condition will be less
than a 5DO-year design. The results indicate, therefore, that in order to
provide "equal protection" the required design level will vary, depending on
local topography and frequency of flooding, ranging between the lOO-year and
the 500-year design for depths of flooding less than six feet.
Recommendations
Application of the EAD comparison must obviously be made only on a site
specific basis, given the limitations of the empirical data used herein.
However, the results point out the apparent inconsistency of the present Levee Policy within FEMA and the Corps design approach.
Annual damages could become increasingly higher as new construction occurs
behind a certified levee (as compared to annual damages with floodplain manage
ment standards in place). This new construction in all likelihood will not be covered by flood insurance since there will be no requirement to purchase it.
In addition, those that do purchase insurance will pay a premium that will not
reflect the "annual damage" calculation. This could either be a financial
burden on the NFIP or unfair to the policy holder, depending on how the EAD
calculation compared with the subsidized rate. Based on the results of this
study, the policy holder will be overcharged.
Implications of this comparison go beyond floodplain management. It would
seem appropriate, for instance, for the Corps to determine the optimum "degree
of protection" for proposed flood control structures in tandem with optimizing
the cost-benefit ratio. This seem especially appropriate since the Corps
obviously takes into account benefits derived on the assumption that floodplain
management (i.e. fill requirements) will be removed. It seems inconsistent to
include benefits which assume these construction requirements are removed, while neglecting that residual risk created by their removal.

Watson 127
References Federal Emergency Management Agency
1981 "FEMA Interim Levee Policy." February 10. Washington, DC.
Hydrologic 1984
Engineering Center Expected Annual Flood Damage Computation--EAD, Users Manual. Fort Belvolr, VA: U.S. Army Corps of Engineers, Water Resources Support Center.
Johnson, 1985
Wi 11 i am T. "Significance of Location in Computing Flood Damage." Journal of Water Resources Planning and Management Division, Ameri~retY of civil Engineers.
Natural Resources Council 1982 A Levee Policy fo the National Flood Insurance Program. Washington,
DC: Commlttee on Levee POllCY.

This page
. IS
intentionally blank

PART TWO APPROACHES TO FLOOD HAZARD MITIGATION

This page
. IS
intentionally blank
A DISASTER THAT DOESN'T HAVE TO HAPPEN:
THE EAST BATON ROUGE PARISH FLOOD OF 2001
Rod E. Emmer
Coastal Environments, Inc.
In 1983, the A mite River Basin and East Baton Rouge Parish (County) suffered a record flood
that caused damages of $171.7 million in the Basin, including $65.3 million in the Parish
(USACE 1984). This was only the most recent event for the watershed which has experienced
four major floods from 1972-1983. Floods are certainly not a new occurrence to the region, but
the events are becoming more costly and as a result are causing a greater public cry for
government action to reduce the problem. The personal hardships and monetary losses could
have been avoided to a significant degree had state and local governments initiated and
i m ple m ented a rationale flood da m age reduction progra m during the past 20 years. Instead
inaction and myoptic planning for single purpose projects resulted in the present hazardous
situation. It is the purpose of this paper to describe the problem and suggest a long-term
solution that has been ignored by decision- makers.
A long with other sunbelt states, Louisiana grew rapidly during the sixties and seventies; this
growth was particularly evident in East Baton Rouge Parish, the site of the state capital, the
location of two major universities, and a center of petrochemical industries within the
Mississippi River industrial corridor. In 1980, the population was 366,200, a 63% increase from
1960. Population projections (M aruggi and Fletes 1983) show that the Parish could grow to
551,100 by the year 2000, an increase of 66% over 1980. The earliest flood worthy of note was
in 1907 when the population of the parish was approximately 33,000.
East Baton Rouge Parish is approximately 293,500 acres, 113,000 acres of which are within the
100-year flood zone (Federal Emergency Management Agency). The urban or built-up area grew
from 24,500 acres in 1956 (Singleton 1972) to 81,400 acres in 1979 (USGS 1979). With pressures
to convert m ore lands fro m agricultural uses, forests and open space, develop m ent extended
more and more into floodprone areas, while at the same time compounding the problem by
increasing runoff as a result of impervious surfaces, such as roads, roofs, and parking lots. The
topography contributes to the proble ms through the low elevation and overall low relief of the
Pleistocene terrace and Mississippi River valley. Streams are contained within well defined
132 APPROACHES TO MITIGATION
channels most of the year but during flood the waters spread across valley floors. Most damage
results when winter or spring fronts linger in the area and cause headwater flooding, i.e., high
stages due to runoff fro m excessive precipitation over the drainage basin. To co m plicate
matters, backwater flooding occurs along the lower reaches of tributaries when high water on
the A mite River impedes runoff from secondary streams and causes impounded water to
overflow onto adjacent areas. In 1983, the most devastating flood inundated 55,000 acres in the
parish and damaged 1578 homes and 37 businesses (USACE 1984).
Flood dam ages are not attributable to a lack of planning. Beginning in 1946, land use plans
were prepared for the parish. The first was by Harland, Bartholomew and Associates (1946)
that described the city as complicating the natural flooding of the metropolitan area by
providing inadequate facilities. The Bartholomew plan (1946) recognized that "the drainage
problem is not a problem only of the Baton Rouge metropolitan area, it has certain regional
aspects that must be given consideration before the problem can be solved." A more recent
independent plan (Singleton 1972) suggested setting aside the floodplains for open space use and
flood conveyance. In 1983, the East Baton Rouge Plannng Com mission Staff (1983) made a
strong recom mendation aimed directly at reducing future flood losses by stating: "Prevention
of the development of residential subdivisions or multi-family residential complexes in areas
subject to inundation should be a prim ary consideration in determining which vacant land should
be earmarked for future residenLial use." However, elected and appo·inted decision-makers do
not implement these recom mendations and voters defeat tax proposals that would pay for
drainage costs (M orning Advocate 1984a).
Greater dam age is attributable to obstructions to flo w, increased runoff fro m develop m ent, and
encroachment into the more hazardous areas. Subdivision filings, elevations, and higher
percentages of subdivisions in floodprone areas show the attraction to the m ore hazardous
locations (Dudash 1984, East Baton Rouge Planning Com mission Staff 1983). In addition,
subdivisions originally built above flood levels now are victi m s because of upstrea m
development that pours more water through them faster than existing drainage channels can
handle.
Government suggests structural public works projects as the best alternative for reducing flood
damages. Channelization of watercourses partially resulting from recom mendations in the

Emmer 133
Bartholomew plan, was intitiated in 1957 by the state and parish (USACE 1974) and shifted the
problem to the then less densely populated areas along the A mite River. In 1965, additional
drainage and flood control projects were i m ple m ented. The U.S. Army Corps of Engineers
(1979) studied a flood control plan for the A mite River Basin, but the benefit to cost ratio did
not exceed one. Several dams, channelization, and diversion projects were studied by the State
Department of Public Works but were not implemented because of opposition or the defeat of
financing proposals.
In 1983 the Office of Public Works, Louisiana Depart m ent of Transportation and Develop m ent,
undertook still another study and prepared a Preliminary Engineering Report on a Comite River
Diversion Channel and an Engineering and Economic Feasibility Report for a dam and reservoir
on the A mite River (Office of Public Works 1984a & 1984b). The Comite Channel diverts a
portion of the Comite flood waters into the Mississippi River through a corridor north of the
more densely populated floodplains of the City of Baton Rouge. The Office of Public Works
estimates the cost to be between $62 million and $104 million, depending on capacity, location,
and nature of channel, i.e., earthen or paved. The multi-purpose A mite River project, located
north of East Baton Rouge Parish, is an earthen dam, 19,950 feet long and 80 feet high, creating
a 15,000 acre perm anent reservoir providing "flood control, recreation, a large supply of potable
(drinking) water and hydroelectric power" (Office of Public Works 1984). Storage of
floodwaters requires an additional 4000 acres. The $130 million project reduces water levels
from an event similar to the 1983 flood by as much as 6.6 feet in some parts of East Baton
Rouge Parish and may have reduced damages from $171 million to $35 million in the basin. For
the first time benefit to cost ratio is above unity (U SA C E 1984).
These structural plans are proceeding with little or no study or evaluation of the pri mary and
secondary beneficial and adverse impacts of the actions on the physical, biological, and cultural
setting of the basin. R ather than early integration of these concerns into the planning process
(National Environmental Policy Act of 1969, as amended), the environmental issues apparently
are being included as an afterthought to satisfy Federal permitting requirements. Analysis of
all issues and realistic alternatives in a full disclosure document may result in identification of
better solutions for flood dam age reduction that must either be integrated with the projects,
result in modification of the proposed projects, or cause abandon m ent of it.
134 APPROACHES TO MITIGATION
The plans and benefits attributed to the projects envisioned by engineers sound ominous because
they very closely parallel the project and proclamations of safety and savings described by Platt
(1982) for Jackson, Mississippi. Both study areas have similar flood characteristics; the
floodplains are multi-jurisdictional with special flood districts; studies were conducted by U.S.
Army Corps of Engineers; and both basins selected structural techniques for the solution to the
flood proble m. The 1973 USA C E report "did not call into question Jackson's planning and zoning
policies which allowed further encroachm ent upon floodplains" (Platt 1982). The Office· of
Public Works' Reports do not mention regulation or zoning of flood prone lands within the A mite
River Basin and in particular in East Baton Rouge Parish where most of the existing and
potential damage occurs. Short-sighted planning is unfortunate because the flood victims wil.l
pay for the agency's inadequate flood dam age reduction planning as well as having to pay for
the project.
A long-term solution to flooding in East Baton Rouge Parish and the A mite Basin is a
co m prehensive flood da m age reduction plan for the Basin. Where feasible, structural
techniques protect existing develop m ent; w hen necessary the govern m ent purchases property
and relocates people; and throughout, zoning and regulation prevent the rampant filing of
subdivisions and building of ho m es in the highest risk area. These issues and the mix of
components in the basin need to be systematically evaluated and can be efficiently completed
by modelling land use changes and benefits as well as costs. The first step is to delineate the
floodway, which, in the case of this basin, includes the backwater areas. Simultaneously, zoning
laws can be formulated for adoption and financing methods can be proposed and evaluated. The
vehicle for this type of planning exists.
The A mite Basin Drainage and Water and Conservation District was formed in 1981 to propose
long-term solutions for flood dam age reduction. The Board, appointed by the governor,
included at one time or another mayors, councilmen, police jurors, and other com munity leaders
representing the six parishes in the A mite River Basin. Instead of having an active, innovative
program which includes subco m mittees to evaluate alternatives, investigation of approaches for
generating revenue to implement a plan, and which involves more of the general public, the
board has waited for directions fro m the state. D ne past Board President said he was
disappointed that the state didn't come forward with funds and stronger directives for the Board
(Morning Advocate 1982). The Board relies on the Office of Public Works and its single-minded
Emmer 135
approach to flood damage reduction for solutions. Only one or two on the Board has ever
spoken of reducing damages; most only desire lowering water levels; but this does not
automatically result in less damage in the long term. The Board needs to be revised if it is to
take a lead in reducing flood da mages.
However, changing leadership is only the first step. Implementation of a comprehensive
approach will take education of the general public. Public and private attitude at this time may
not allow for a comprehensive plan. An ordinance proposed in 1981 (Morning Advocate 1981) to
severely limit construction in East Baton Rouge Parish floodplains was not implemented. One
councilman is on record as stating the key to keeping development going in the fastest growing
areas of the parish is cleaning drainage canals to make the floodplain smaller (Morning
Advocate 1981). Other elected officials feel that the state or local goverments cannot prevent
people fro m building in floodplains (State Ti m es 1983). Flood victi m s have strongly expressed a
desire for the dam and diversion at public meetings and meetings sponsored by special interest
groups such as Friends United for 0 arlington (F UNO), a coalition of flood victi m s living in thE
lower end of the basin. Controversy has lead to the expected upstream-downstream conflict
between those who demand protection and those whose lands are being taken (Morning Advocate
1984, State Times 1984). Opposed to the dam are landowners from the parishes of East
Feliciana and St. Helena whose properties will be seized for the project. The A mite River
Conservation League is an action oriented group of upstream residents who believe the burden
of flood dam age reduction should be shared with downstream flood plain occupants by including
zoning for open space use of floodplains, floodproofing, and use of small structures strategically
distributed throughout the watershed.
A 11 of the factors are rapidly co m ing together in East Baton Rouge Parish for a devastating
flood of unequalled dimensions. Populations pressures cause homes to be built in high risk
areas; a structural plan, as proposed, provides the false sense of security necessary to
encourage additional accelerated growth; heavy frontal precipitation occurs every three to four
years; the govern m ent and the private sector syste m atically ignore floodplain manage m ent; and
finally no comprehensive plans are being considered. Once all the pieces come into place, at
about the same time the dam and diversion are completed in 1997, a flood of record will
inundate East Baton Rouge Parish by the year 2001. Population projections forecast more than
prosperity, they foretell of devastation for those m any who buy and build in the floodplain,
136 APPROACHES TO MITIGATION
thinking the dam and diversion have solved the spring problems. It is a disaster that can be
prevented if parish decision-makers implement some of the recom mendations of their
professional staff and work with others in the Basin to prepare and implement a comprehensive
flood da m age reduction program that will reduce the long-term impacts and the short-term
proble ms.
REFERENCES
o udash, J.S. 1984 A Zone ~proach U!r DeveloPJR.ent ill East Baton Roug~ Parish Determined Qy
Floog H a!,ard~ and 1J..nd. Suitability. M S thesis, Depart m ent of L andsc ape Architecture, Louisiana State University, Baton Rouge, La. Unpublished draft.
East Baton Rouge Planning Com mission Staff 1983 .prelimil1_~ Report 1;9. East Baton FUl!d.Qf.. City-Parish Planning Com mission.
Land Use Develop m ent Study E astern Sector. A dvanced Planning Section. Baton Rouge, La. 0 ctober 55 p.
Harland, Bartholomew and Associates 1948 The Master City-P arish Plan. Metropolitan Baton Rouge, Louisiana. St. Louis,
Mo. 109 pp.
M aruggi, V. and R. Fletes 1983 Popula.tiQ!1 Projections N 2000 for l-ouisiana Q.v. Race, Sex, and ~ and for
L ouisian~ P arishes ~ Race gnd Sex with £. Detailed Description Qf the Projection Methodology. Series 1 Report. The University of New Orleans' Division of Business and Economic Research and the Louisiana State Planning Office. New Orleans, La. June. 97 pp.
Morning A dvoc ate 1981 Floodplain Filing Halt Eyed. Baton Rouge, La. Wednesday, July 8.
1982 A mite Flood Funding Stalled Again. Baton Rouge, La. August 9.
1984 Responses to Reservoir Plan Mixed. Baton Rouge, La. Friday, July 13.
1984a Planning an Issue in Races. Baton Rouge, La. Septe m ber 6.
NaturalE nviron m ental Policy Act 1970 42 U.S. C. Sections 4321 et seq.

EllIIler 137
Office of Public Works 1984a Conceptual Stage E nginee!i.!:l_9 and .E cono mic Feasibility Report: Pre_~~,
Introduction, ~u m mary. Proposed Darlington Reservoir. Louisiana Depart m ent of Transportation and Development. Brown & Butler, Inc., Consulting Engineers. March. 22pp.
1984b Comite River Diversion Channel. Louisiana Department of Transportation and Development. May. 13 pp. plus appendices.
Platt, R.H. 1982 The Jackson Flood of 1979. A Public Policy Disaster. APA Journal. Spring. pp.
219-230.
Singleton, W.B. 1972 The Proposed_ PJ£n. for Future Land Use. East Baton Rouge Parish, Louisiana.
Prepared for the C ity-P arish Planning Com mission. City and Industrial Planners: Baton Rouge, La. February. 71 pp.
State Tim es -- J:9F.l Baker Urges Search for M ore Flood Ideas. Baton Rouge, La. Wednesday, June
29.
1984 Reservoir Plan Stirs Controversy. Value in Flood Control, Recreation Debated. Baton Rouge, La. Wednesday, July 11.
U.S. Army Corps of Engineers 1974 Flood Plain Inform ation. Baton Rouge, Louisiana, No.3. Claycut Bayou, Jones
Creek and Tributaries. New Orleans District, New Orleans, La. September. 45 pp. plus plates.
U.S. Army Corps of Engineers 1979 Fact Sheet. A Flood Control Plan for A mite River Basin. New Orleans District,
New Orleans,La. November 15."5 pp. plus map,- --
1981 New Orleans - Baton Rouge Metro Study. New Orleans District, New Orleans, ca:- Septe m ber. 4VO'Tu m es. ----
1984 A mite River and Tributaries Study. New Orleans District, New Orleans, La. for the October 30 Public Meeting. 16 p.
U.S. Geological Survey 1979 Land Use and Land Cover Maps. 1:250,000. Rollo, Mo.
RELOCATION: A FLOODPLAIN MANAGEMENT ALTERNATIVE
Byrt Wammack U.S. Army Corps of Engineers,
Los Angeles District
Introduction
As a floodplain management alternative, relocation provides unique oppor
tunities to maximize local, regional, and national benefits from flood control
projects. This paper illustrates how these benefits can be realized through
cooperative master planning efforts. Relocation is consistent with federal
policy and can satisfy the federal objective to lessen flood losses. It also
provides nonfederal interests unique opportunities to get more for their
dollar. In light of proposed cost-sharing reforms and recent policies, this
should be even more desirable. A brief review of a completed relocation project
and a description of an ongoing relocation study illustrate how cooperative
master planning can lead toward more efficient use of resources and maximiza
tion of local, regional, and national benefits. Economic and Policy Framework
In the Flood Control Act of 1938, Congress authorized the Corps of
Engineers to consider relocation as an alternative to structural measures. But since 1974, Public Law 93-251 requires federal planners to consider relocation
or other nonstructural alternatives in the survey, planning, or design of any
federal flood protection project.
For evaluation of flood protection alternatives, economic efficiency has
remained the primary federal objective, although secondary objectives such as
environmental quality, regional economic development, and social welfare have
also been included. Currently, there is only one federal objective for water
and related land resources planning--"to contribute to national economic devel
opment consistent with protecting the Nation's environment, pursuant to
national environmental statutes, applicable executive orders, and other Federal
planning requirements." Contributions to national economic development (NED
benefits) are defined as "increases in the net value of the national output of goods and services" (P&G 2.0.0, 1983).

Wammack 139
The other criteria--environmental quality, social welfare, and other
social effects--may still be included, but are not required. Although RED is
no longer a federal objective, it cannot be completely separated from the NED
objective. RED benefits include NED benefits realized at the regional scale,
income transfers, and employment benefits (P&G. 1.7.1, 1983). Thus, RED should
be seriously considered at the federal scale and should be the primary nonfed
eral objective.
External Benefits and the Nonfederal Share
Nonfederal interests already share in the costs of flood control projects,
but in efforts to improve efficiency and equity, cost-sharing reforms are being
proposed. These are reflected in the Reagan administration's water project
financing and cost-sharing policy which states in part that, "project benefici
aries, not necessarily governmental entities, should ultimately bear a substan
tial part of the cost of all project development" (Reagan, 1984). According to proponents of this policy, cost-sharing "would 1) reduce the
bias toward projects which are larger than is optimally efficient, or not
efficient at all, 2) reduce the bias toward nonreimbursable purposes, and 3)
reduce the proportion of the project cost paid by the general taxpayer"
(Waelti, 1985). More importantly, however, such policies should provide addi
tional incentive for nonfederal interests to get more from their investments.
This means maximization of RED as well as NED benefits; and one source of RED
benefits is from external project benefits.
In addition to flood control, projects have other impacts. In some pro
jects, such external effects will be negligible, but in others they can be
substantial. If these external effects are beneficial, they can significantly
increase the total benefits of a project. Thus, maximization of a project's
external benefits, in addition to its direct benefits, will provide the optimal
return on both the federal and nonfederal investment. This can be achieved
through cooperative master planning at the federal and nonfederal levels.
Relocation Relocation provides unique opportunities to maximize the return from both
the federal and nonfederal investment. Not only is it possible to eliminate
completely future flood-related costs, but opportunities also exist to 1)
replace declining flood-prone neighborhoods with improved flood-free neighbor
hoods, and 2) to conduct the relocation process in the broader context of
community and regional economic development.

140 APPROACHES TO t1ITIGATION
Relocation is not always the best alternative. However, if a community
has a severe flood problem, if the depth of inundation makes floodproofing
impractical, if structural measures are expensive, and if the community can
benefit from economic development or redevelopment, then relocation may be the
best alternative. Soldiers Grove, Wisconsin--A Completed Relocation Project
Soldiers Grove is currently receiving attention as America's only solar village, yet only a few years ago it was merely another village in the flood
plain. Situated along the banks of the Kickapoo River, Soldiers Grove was
flooded in 1907, 1912, 1917, 1935, and 1951. A levee was proposed, but the
cost of maintenance would have been prohibitive and would have done little to
solve the other problems--"the outmigration of young people to urban areas, the
severe blight in the downtown, the feeling that Soldiers Grove was slowly
dying" (Becker, 1980). In 1978 another flood hit, but by that time the commu
nity was convinced that relocation was the answer, and a concerted effort
began. Four years later, in 1983, the work was nearly done.
"[T]he village gained enterprises it didn't have before. They include a
dental clinic, restaurant, nursing home and pharmacy." Total employment in
creased from 95 to 155. In 1980, "Soldiers Grove's population was up for the
first time in years, from 514 in 1970 to 622 in 1980". "Its tax base grew by
nearly 2 million dollars" (~~.oNews & World Report, 1985). In short, reloca
tion of Soldiers Grove did more than eliminate the costs of floodplain occupancy. A new comprehensive community plan which integrates relocation, energy
efficiency, and city ordinances provides the community with a more stable
economic future, and thus benefits the regional and national economies. Clifton, Arizona--Flood Control and Redevelopment
The Los Angeles District Corps of Engineers is currently conducting a study
of flood control measures for the town of Clifton, Arizona. A major feature of
the plan under consideration is relocation of over 100 families and businesses
to a flood-free site. Historically, Clifton has been dependent on the copper
industry. Because of a downswing in the copper market, a recent strike and a
severe flood, it is necessary to integrate the flood control plan into
Clifton's plans for redevelopment.
Clifton was founded in 1873 in a deep narrow canyon on the banks of the
San Francisco River, after copper was discovered nearby. Lands outside of the floodplain were either public or in the ownership of the mines. Due to the
Wammack 141
lack of land for development, economic growth and diversification were limited
and the community remained dependent on the mines. Frequent floods posed a
continual threat to the community. Velocities were high and depths great.
Floodwalls provided limited protection and a flood warning system was installed
for safety. Other solutions such as dams, levees, and channels were considered
by the Corps of Engineers and others, but because of excessive costs or imprac
ticability, nothing was constructed.
In April of 1982 the mine was shut down and did not open again until
October, with a reduced workforce. In July of 1983, the union struck rather
than accepting further concessions (The Register, 1983). Three months later on
October 1, 1983, the flood-of-record hit, inundating over 300 homes and busi
nesses. Now, a year and a half after the flood, the Town of Clifton is still
trying to pull itself together from the flood, the strike, and years of depen
dence on "the company."
Planning efforts immediately following the flood concentrated on flood
recovery and permanent solutions to the flood problem. Because of the numerous
federal, state, and local agencies involved in these efforts, the need for
cooperative planning was apparent. To coordinate these activities, the
Governor of Arizona formed a special task force to provide a forum for agencies
who could assist in flood recovery. Another group, the Clifton Flood Recovery
Working Group, was formed to work with the Corps study team. The Corps study
proceeded from reconnaissance to the feasibility phase, largely as a result of
the efforts of this nine-agency working group.
Even before others got involved, the Town of Clifton saw a need to plan
for redevelopment of their community towards a future free of flooding and
independent of the mine. Since these two goals are so interrelated, master
planning became the focus of the cooperative planning efforts. Two committees
were formed by town council resolution. The Technical Advisory Committee, which
includes representatives of federal, state, and local agencies and the Chamber
of Commerce, was formed to develop a comprehensive plan for the community. The
Citizen's Relocation Committee was formed to provide an interface between the
community residents, the Technical Advisory Committee, and the Planning and
Zoning Board. The Citizen's Committee is also working to gain Congressional
support for the flood control project. The ultimate goals of the committees are
1) business retention, 2) economic growth and diversification, and 3) implementation of the structural/nonstructural flood control plan.
142 APPROACHES TO MITIGATION
Because of the downswing in the copper market, the strike, and the flood,
the survival of Clifton is dependent on economic redevelopment. Redevelopment
is a process, and relocation could impinge on that process. Yet, without flood
control, redevelopment would not be possible. This potential for problems
simply provided the opportunity to rally additional expertise to aid in master
planning the community. If redevelopment is successful, it will be the result
of cooperative master planning. If the future Clifton is a flood-free community that is in harmony with
the environment and meets the social needs of its people, if it is a community with economic diversity that contributes to the growth of the region, the state, and the nation, then the federal and nonfederal objectives will be met and the project will provide the maximum return for the investment.
References Becker, W. S.
1980 The Making of a Solar Village. Madison, Wisconsin: Wisconsin Energy Extension Service.
Reagan, R. 1984 Letter to Honorable Paul Laxalt, United States Senate.
January 24.
The Register 1983 "Troubled Water in Clifton, Arizona." Orange County California.
October 17.
U.S. News & World Report 1985 "In Solar Village, Sunshine is Put in Harness."
February 11.
U.S Water Resources Council 1983 Economic and Environmental Principles and Guidelines for
Water and Related Land Resources Implementation Studies (P&GJ. March 10.
Waelti, J. J. 1985 "Cost Sharing for Federal Water Projects: Trends and
Implications." Water Resources Research 21 (February): 153-158.
RELOCATION OF A LARGE, SLAB ON-GRADE HOUSE FROM A FLOODPLAIN
Edwin C. Endacott US Army Corps of Engineers
Introduction
Haikey Creek is one of several creeks that flow outward from the city of Tulsa, Oklahoma, toward the Arkansas River. The 37-square-mile Haikey Creek watershed is funnel shaped. It 1 ies entirely within southern Tulsa County
and the rapidly developing southeast quadrant of the Tulsa metropolitan area. The area receives an average of 37 inches of rain a year and is prone to
violent thunderstorms that often cause serious flooding problems along
creeks and rivers. Before the 1960's, the Haikey Creek basin was largely devoted to agricultural uses, and frequent floods curtailed truck farming on
the rich bottom lands. The Soil Conservation Service recorded 35 major floods and 80 minor ones along Haikey Creek between 1940 and 1960, with damages almost exclusively confined to agricultural activities.
Today, the watershed is about 25% developed with mixed residential and commercial. Development occurs mostly throughout the nothern part of the watershed that encompasses the city limits of Tulsa and its suburb, Broken
Arrow. Rapidly spreading urbanization is spilling over these uplands, but much of the watershed rema i ns un incorporated and undeve loped, dotted with
farm dwellings and scattered developments. A burgeoning suburb, Bixby, extends into the southwestern portion of the watershed.
In the lower two mi les of the watershed, the creek skirts about 50 floodprone structures, mostly built during the 1970's and priced to attract
upper-middle-income families. The rural isolation, tall trees, and lush vegetation attracted development in the years before flood plain management was extended to this and other unincorporated areas of Tulsa County. After
serious flooding in 1974 and 1976, officials of Tulsa County requested that the US Army Corps of Engineers investigate the possibility of a local flood
protection project on the lower reach of the creek. Subsequently, the lower area became the site for the US Army Corps of Engineers flood control
project described in this report. Some of the owners of the homes in this
144 APPROACHES TO MITIGATION
area have received flood insurance payments that exceed the homes' values.
Work began in 1982 on the Corps project, which includes construction of
a levee around a subdivision and acquisition/clearance of some scattered
upstream structures. One of the homes acquired was a large two-story house
that the homeowner elected to move to a new floodfree site. Although moving structures is fairly common in the Tulsa area, few
large, two-story houses built on a concrete slab had been relocated. The
owner agreed to allow the Tulsa District Corps of Engineers to document the
process in this report, in the hope that it might help others considering
such a move.
Flooding Problem
In early 1972, Ms. Nancy Kincaid built what she calls her "dream house"
in rural Tulsa County. The two-story house contained 3,200 square feet with
a rock and frame exterior, two large porches, and a native rock fireplace.
It was built on 13 wooded and grassland acres, providing pastureland for the
horses and slop i ng gent 1 y down toward a wooded creek about 600 feet beh i nd
the house.
The Kincaid house was built on an old, normally dry oxbow of Haikey Creek, near the bottom of the funnel-shaped watershed now being rapidly
covered by suburban sprawl. Hased on a September 1979 flood insurance study
performed for the Tulsa County area, an estimated 2 feet of water, flowing
as fast as 4 feet per second, could enter the house in a 100-year flood;
flooding in the yard would be about 3.7 feet deep. The 100-year flood is a
magnitude of flood flow that has a 1% chance of occurring in any given
year. With future upstream development, the threat of flooding would
increase.
June 1974 Flood
On the night of June 8, 1974, a trio of tornadoes and violent
thunderstorms hit the Tulsa area, inflicting widespread damage that totaled
nearly $50 million.
It was far into the night before the flood waters made their way down
the meandering Haikey Creek to the bottom lands, where the water washed away
an upstream levee and routed neighbors from their homes. "A family that
lived near me escaped by walking out with three children on their shoulders
Endacott 145
through waist-deep-water and they discovered later they had just missed some
downed power lines," Ms. Kincaid remembers.
Downstream in the Hickory Hills subdivision, about 40 homes were
flooded, including one where a family of 10 cut a hole through the roof to
escape water that rose as high as 6 feet in their house. In all, the flood
caused about $1 million in damages in the Haikey Creek project area. The
return frequency for the June flood was estimated as that of a 10 to 15 year
storm.
For Ms. Kincaid, the flood provided tangible proof of the flood
predictions, but the interior of her home received no damage. "The water
came within 2 inches of coming in the door, but none got inside the house,"
she says.
In the ensuing years, Tulsa County and the cities of Tulsa, Broken
Arrow, and Bixby -- which all share jurisdiction within the watershed -
adopted regulations on flood plain development to comply with the Federal
flood insurance program. In the mid 1970's, the Corps began planning a
1 oca 1 flood protect i on project under the authority of Sect i on 205 of the
Flood Control Act of 1948, as amended.
May 1976 Flood
The second major flood hit on May 30, 1976. Again, the storm inf1 icted
widespread damage throughout the metropolitan area. Total damages were
estimated at more than $34 million, of which about $650,000 was in the
Haikey project area. Flood stages in the Hickory Hills area were 1-1/2 to 2
feet lower than the 1974 flood. Three persons drowned in the 1976 flood
within the city of Tulsa.
Once again on Haikey Creek the water moved more slowly down the largely
unmodified channel, so that the peak occurred in the early morning darkness.
"After it became clear that we were probably in for another flood, I
made what emergency preparations I could and waited -- for a long time,"
Ms. Kincaid remembers.
"The water rose very slowly until it surrounded the house. It rose into
the garage, which is lower than the rest of the house."
At about 3 a.m., water was 3 inches from her doorway. The level hovered
there for several hours, then almost imperceptive1y began to recede. Once
again, no water had entered; the house was safe.
146 APPROACHES TO t1ITIGATION
Corps Project
In April 1975, the Tulsa County Commission requested that the Corps
investigate the flood problem along Haikey Creek under the authority of Section 205 of the 1948 Flood Control Act, as amended. The Corps received
authorization to begin detailed studies in September 1975. The 1976 flood sparked renewed interest in the Corps' Haikey Creek
project, and planning meetings were well attended in the late 1970's when alternative flood control methods were debated. Some local officials and citizens wanted to channelize the creek to the Arkansas River; others favored a levee or upstream reservoirs; and sti 11 others wanted to move as many structures as possible out of the flood plain.
Forty-seven res i dences, three mobil e homes, and three greenhouse
complexes had been built within the standard project flood plain in the project area. The standard project flood results from the most severe storm expected in the watershed. Most of the houses lie within the Hickory Hills
subdivision, about one-half mile upstream from Haikey Creek's confluence with the Arkansas River. Most of the other structures are scattered upstream of the subdivision.
The recommended plan is a combination plan combining a traditional structural solution with a nonstructural plan. The plan required
construction of a levee and the removal or elevation of some flood plain structures. Benefits from the plan would exceed the costs by 2.5 to 1.
The structural part of the plan calls for a 5,700-foot levee to be built around the relatively dense development in Hickory Hills, tying into a hill that rises west of the subdivision.
In the upstream project area, which included the Kincaid house, deve 1 opment was more scattered, and other so 1 ut ion s were requ ired. The
Corps estimated that the levee, which would restrict flows downstream, could raise the level of a 100-year flood by as much as 0.5 foot in the upstream
area for about one-half mile. Clearly, the government would have to take some action to offset that induced flooding in the upstream area. But levee
or channel works were not economically justified in the upstream area. Among opt ions posed to upstream owners were fl oodproofi ng or bu il di ng
ring levees around their structures. As the Corps plan was being finalized, most of the inhabitants of the upstream area said they favored evacuation --
Endacott 147
that is, total removal of their homes -- over floodproofing. They rejected
floodproofing plans that they said could make their homes isolated "islands"
during major floods. The Corps determined that the depths and velocities of
water made floodproofing a questionable option for most upstream residents.
For these reasons, the approved plan for the upstream area includes
acquiring and removing most structures. Owners of one mobile home and one
farmhouse preferred floodproofing, and the approved plan gave them the
option to raise their structures in place.
In the plan implementation, Tulsa County was to be responsible for
acquiring the lands, easements, and rights-of-way. The county was also to
pay 20% of the cost of the nonstructural portion of the project -- the
acquisition/clearance of upstream structures. The county portion was
approximately $820,000 of the total $3.3 million project.
The Corps' Haikey Creek Local Flood Protection Project was approved in
October 1981.
Moving The House
ACquisition One of the homes to be acquired as a part of the Haikey Creek Local
Flood Protection Project was the large two-story house owned by Ms.
Kincaid. She decided to relocate the house, if it was feasible, rather than
allowing it to be demolished on the site.
Properties needed for the Corps project were acquired by the local
sponsor, the Tulsa County Board of Commissioners, with Corps approval. The
county in turn contracted with a local agency with long experience in
property acquisition, the Tulsa Urban Renewal Authority, to conduct the
actua 1 acqu i s it ions. Th i s arrangement resu lted in extens i ve negot i at ions
for Ms. Kincaid, because she and the staffs of three agencies had to reach
consensus. Negotiations lasted several weeks, but agreement ultimately was
reached in mid-October 1982. The price was based on fair market value, as
determined by appraisers.
From the sale proceeds, Ms. Kincaid purchased back the structure for its
estimated salvage value. The salvage value is the amount the government
estimates as the value of the improvement for off-site removal.
148 APPROACHES TO tlITIGATION
Determining Feasibility
Before many firm decisions could be made, Ms. Kincaid had to determine
the technical, economic, and legal feasibility of moving the structure.
This step involved making a number of decisions, at least tentatively,
including selecting a new site and a house mover.
A new site had been purchased before the decision was made to move the
existing house. The purchase included 10 acres on a hill about 15 miles
west and north of the Haikey Creek site. The new site is within the city of
Tulsa but in a suburban fringe area that is still largely rural.
To select a mover, she queried government officials for the names of
persons who had moved structures successfully within the Tulsa area. She
interviewed those individuals and their movers. Many of the movers declined
to bid because of the size of the house and its slab construction.
She selected a Tulsa-area mover, Mr. Charlie Frunk, after inspecting
previous structures he had moved, obtaining his bid, and receiving his
assurances that her home could be moved successfully. "You learn a lot in this interviewing process about moving houses," Ms.
Kincaid says, "because you really have to investigate each step of the
process to evaluate the movers and their bids." She also obtained bids from
contractors for plumbing and electrical work. For some people, this step
might be simplified by obtaining a general contractor; Ms. Kincaid served as
her own general contractor. Again, obtaining these bids involved a learning
process about the steps involved in the move.
"The contractors' bids are really only estimates, because the scope of
their work may change after the move, in ways you can't predict," Ms.
Kincaid says. "For example, we lost some heating ductwork during the move
that we hadn't counted on; the contractors' advance bids couldn't have taken
that into account."
The next step was to assemble all the bids and estimate the price of the
move. Ms. Kincaid checked with builders and government officials to
estimate what she would have to pay for a comparable new house. She
compared the costs of new construction, estimated at $40-$50 a square foot,
against the estimated moving costs and determined that moving her structure
was economically feasible.
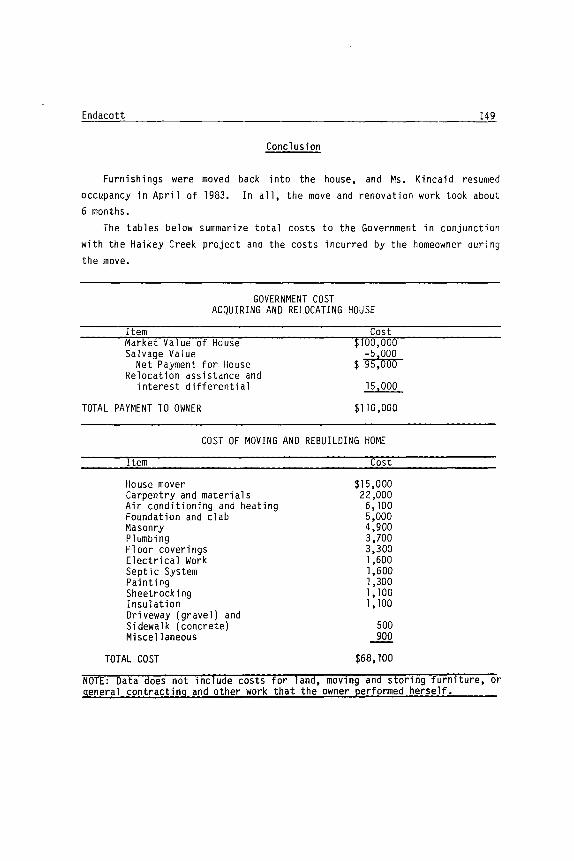
Endacott 149
Conclusion
Furn i sh i ngs were moved back into the house, and Ms. K inca i d resumed occupancy in April of 1983. In all, the move and renovation work took about 6 months.
The tables below summarize total costs to the Government in conjunction with the Haikey Creek project and the costs incurred by the homeowner during the move.
GOVERNMENT COST ACQUIRING AND RELOCATING HOUSE
Item Market Value of House Salvage Value
Net Payment for House Relocation assistance and
interest differential
TOTAL PAYMENT TO OWNER
Cost $100,000
9~'~~~ $ ,
~
$110,000
COST OF MOVING AND REBUILDING HOME
Item
House mover Carpentry and materials Air conditioning and heating Foundation and clab Masonry Plumbing Floor coverings Electrical Work Septic System Painting Sheetrock i ng Insulation Driveway (gravel) and Sidewalk (concrete) Miscellaneous
TOTAL COST
Cost
$15,000 22,000 6,100 5,000 4,900 3,700 3,300 1,600 1,600 1,300 1,100 1,100
500 900
$68,100
NOTE: Data does not include costs for land, moving and storing furniture, or general contracting and other work that the owner performed herself.
SECTION 406 HAZARD t-lITIGATION PLANNING: CHANGES IN THE FEDERAL APPROACH
Larry Zensinger, Chief Hazard Mitigation Branch, FEMA/Washington
Clancy Philipsborn Hazard Mitigation Specialist, FEMA/Denver
Section 406 of Public Law 93-288 (The Disaster Relief Act Amendments of 1974) requires that Federal disaster assistance be conditioned upon appropriate actions taken by recipients of the assistance (for the most part State and local governments), to "mitigate" hazards and reduce the potential for future occurrences of disasters. These mitigation actions can include such things as building standards and land use and construction practices. During the past ten years, this section of the law has been applied with varying degrees of success. This paper will attempt to identify some initiatives the Federal Emergency Management Agency (FEMA) will be proposing to improve the consistency with which this section is applied, and will describe some recent experiences in field testing some new concepts for administration of Section 406. The authors specifically chose these ASFPM annual meetings for presentation of this material. Many of the problems that are identified, and FEMA's new approaches designed to mitigate them, are the result of direct input from ASFPM members. Thus, this forum is an appropriate means of communicating FEMA's responsiveness to the ASFPM's concerns.
Following enactment of PL 93-288, the Federal Disaster Assistance Administration (FDAA), then part of the Department of Housing and Urban Development, assumed responsibility for developing regulations implementing the new provisions of the Federal Disaster Act (The Act) including Section 406. Section 406 was assigned a relatively low priority in this process, however, and it was not until November 8, 1979, that regulations were published (at 44 CFR Part 205, Subpart M) to implement Section 406 of the Act. These regulations focused primarily on defining responsibilities and concepts and establishing procedures for FEMA and intergovernmental coordination. While this definitional and procedural approach was probably necessary in introducing the concept of post disaster hazard evaluation and mitigation, experience in working with the present format, and structural changes such as the development of the Intergrated Emergency Management System, have revealed shortcomings in the present program approach and regul at ions.
Three problems in the current approach which FEMA recently has begun to address include lack of guidance on 406 plan scope and content, not viewing State hazard mitigation planning as an evolving and cumulative process, and not integrating 406 mitigation requirements into the comprehensive emergency management program of the State. By not providing guidance on Section 406 plan scope and content, FEMA has made it difficult, if not impossible, to condition disaster assistance on the implementation of appropriate mitigation measures by grantees. New Subpart M regulations, scheduled to be proposed some time during Fiscal Year 1985, will rectify this. By not viewing Section 406 planning as an evolutionary or cumulative process, FEMA has probably caused many States a great deal of frustration by not giving any credit for past accomplishments. Under the scant

Zensinger/Philipsborn 151
Section 406 plan guidance currently in effect, all that States are technically required to do is a hazard mitigation plan for each disaster, regardless of their history of previous Section 406 or non-disaster related mitigation planning. The new regulations mentioned above will encourage States to establish ongoing state-wide hazard mitigation strategies and programs requiring, where these exist, only an updating and review of mitigation policies following a disaster, rather than drafting of a "plan." Finally, although mitigation has been included as one of the four phases of comprehensive emergency management (along with preparedness, response and recovery), it has not been integrated well by FEMA into the programs which support State emergency management planning. The creation of the IEMS, however, which starts with hazard identification and capability assessment, provides an ideal format for the Section 406 "hazard evaluation" and assessment of current State mitigation programs and capabilities. This will allow emergency planning assistance provided to States to be used, in many instances, to accomplish mitigation obj ect i ves •
Even though these concepts have not been formally established through the promulgation of regulations as yet, recent examples demonstrate how FEMA has begun to move in this direction. While these examples are from FEMA Region VIII, it should be noted that these efforts have their roots in the strategies of Alan William's work in the State of Connecticut, and the fundamental framework of IEMS. Mr. Williams has successfully demonstrated the importance and effectiveness of the involvement of all State agencies and particularly the Office of the Governor, in orchestrating a comprehensive State-wide hazard mitigation program. The IEMS format of hazard identification, capability assessment, multi-year development planning (HICA/MYDP) and implementation readily lends itself to the 406 process, while additionally providing FEMA the opportunity to practice what we preach; integrated emergency management.
Since last August, when many of us participated in the Emergency Management Institute's prototype course for State 406 hazard mitigation planning, Region VIII has developed State-wide multi-hazard 406 plans in South Dakota, Colorado, and Utah. Each planning effort was similar in that their framework, objectives, and methods were based on the IEMS and Connecticut examples. Each plan follows the HICA/MYDP format, and each plan thoroughly examined the eXisting authorities of appropriate State agenCies as a means of accomplishing the capability assessment.
However, each planning effort differed due to initial information available, and differing levels of political acceptance and support. In South Dakota, this was the State's initial 406 plan, and it was partially based on recommendations of the Interagency Hazard Mitigation Team (IHMT). In Colorado, there was an existing 406 plan, but no IHMT was activated for this particular disaster. In Utah, there was not only an existing plan, but also an IHMT that offered suggestions for the new plan.
Most importantly, each planning process specifically addressed the three previously identified problems. Increased, organized, and goal-oriented guidance was provided. Previous mitigation efforts were recognized and expanded upon, rather then being ignored or duplicated. Initiatives were taken in order to create an avenue by which 406 implementation would be integrated into the States' emergency management programs.
152 APPROACHES TO MITIGATION
In each of the three planning efforts mentioned, the Federal and State Hazard Mitigation Coordinators approached appropriate personnel within State agencies and local governments to explain the purpose and implications of the 406 requirement as well as each entity's responsibilities. FEMA hazard mitigation staff remained on-site in each instance in order to initiate State hazard mitigation task forces, identify potential areas of opportunity, develop a 406 outline, suggest recommendations, and to provide through coordination, the technical assistance and available resources of the other Federal agencies. In South Dakota, FEMA coordinated and paid travel expenses for representatives from six Federal agencies to travel to the State capitol and provide the State Mitigation Task Force with the requested technical assistance. These representatives also had served on the IHMT, and were therefore familiar with the situation. This group became the Federal-State planning team that developed and reviewed the State plan. In Colorado, a similar Federal-State planning team was developed. Since there was no IHMT for this disaster, the Federal representatives were from the local offices, in order to limit expenses. Many, however, had served on the IHMT and Federal-State Planning Team following the 1982 Lawn Lake/Estes Park disaster. In Utah, the same assistance was offered but declined by the State. 406 guidance now included procedures for format, content, implementation, monitoring, and enforcement.
The Colorado and Utah 406 efforts clearly demonstrate how past mitigation efforts are no longer ignored or duplicated. From the day of the Presidential declarations, this was explicit as the "standard" paragraph in the FEMA-State agreement which requires the 406 Plan was modified from,
to,
The State agrees ••• to prepare and submit ••• a hazard mitigation plan or plans for the FEMA designated areas •••
(FEMA-State Agreement, FEMA-665-DR-CO, 07/26/82) (FEMA-State Agreement, FEMA-680-DR-UT, 05/04/83)
The State shall review the status of implementation measures from the current State 406 hazard mitigation plan in the light of the recent flooding, and modify or update such plan as appropriate to address new or additional hazard mitigation needs or issues.
(FEMA-State Agreement, FEMA-719-DR-CO, 07/27/84) (FEMA-State Agreement, FEMA-720-DR-UT, 08/23/84)
This created the precedent of mitigation program reviews (MPR). The States' original 406 planning efforts strived to develop State hazard mitigation programs through establishing an increased priority for hazard vulnerability and loss reduction within existing authorities. Subsequent disasters then allow for an MPR rather than plan duplication. The intent of MPR's is to recognize and build upon past efforts; to analyze what initiatives did and did not work; to develop new or improved ideas; and to identify those recommendations that may well have reduced the current impact had they been implemented. (This is not entirely new. Illinois should be noted for their annual review of their 406 plan.) This type of program review then allows a plan to be updated not only in future disaster situations, but also on an annual basis as States fulfill their HICA/MYDP requirements for IEMS. Conversely, a disaster declaration could provide the opportunity to update a State's HICA at the county level where that

Zensinger/Philipsborn 153
work had not yet been completed.
Finally, as a means of addressing the continual and critical problem of little or no funding for mitigation activities, several examples exist of efforts to integrate 406 planning efforts into States' emergency management programs. Following the Connecticut example of funding specific 406 recommendations through FEMA's CCA mechanism using SAP supplemental funds, FEMA Region VIII has requested State Hazard Mitigation Coordinators, through State Emergency Services Directors, to identify and include in their annual CCA negotiations, 406 tasks that can be funded and implemented through use of existing programs. FEMA provides States with funds through a variety of disaster preparedness and emergency management grants that can be applied to mitigation initiatives. As we work with States to establish mitigation as a priority, we are dOing the same within FEMA. Further, as an evaluative criteria established for Hazard Mitigation Assistance Grants, (a new source of Regional funds to support mitigation activities) CCA proposals that indicate a State's willingness to apply these other program dollars to 406 items will be favored.
In conclusion, FEMA, both Nationally and Regionally, feels responsive towards the identified weaknesses and needs of State 406 planning efforts. We are attempting new, aggressive strategies to address problems as they arise. While it should not be expected that each new methodology prove successful, it can be anticipated that each will further our knowledge of this evolving process, and serve to improve our capability to decrease our nations vulnerability to our increasing hazards.
THE ROLE OF INSURANCE ASSOCIATIONS IN DEVELOPING COMMUNITY FLOODPLAIN MANAGEMENT PROGRAMS
Robert Ross, Jr. Florida Association of Insurance Agents
Insurance Associations for years have played an important role in providing training and education on insurance programs to the general public/consumer. The National Flood Insurance Program is no exception. Mr. Robert Ross, Jr., Director of Education for the Florida Association of Insurance Agents has been actively involved with the NFIP in Florida since its inception in 1968. In the following question and answer format, Mr. Ross will provide an insight into the role of Insurance Associations and the agent/producer in community flood plain management programs.
Q In general terms, what is the function of Insurance Associations in the insurance industry?
A The function of the Florida Association of Insurance Agents as a trade association involves a myriad of activities: legislative relations, marketing, agency management, insurance company/insurance agency relations for the consumer, and education.
Q Specifically, what role does the Florida Association of Insurance Agents (rAIA) play in the implementation of the NFIP in Florida? (i.e., training, education •..• )
A In the implementation of the NFIP in Florida, FAIA develops educational programs for its agent members, puts on schools in many cities throughout the state, provides technical expertise in policy interpretation and rating, and directly involves itself in efforts to make the processing of flood insurance more efficient, and the agent's role more productive.
Q What areas of the NFIP do agents get involved in other than policy writing and processing?
a) Do Agents get involved with the floodplain management regulations?
b) Do Agents have the capability to get involved in these areas?
c) Are Agents interested in these areas?
d) Is their involvement with the insured or the local official or both?

Ross 155
e) If the involvement is with local officials, how is this relationship initiated?
A In other than policy writing and processing, insurance agents are involved in the following other NFIP areas:
a) The clients of insurance agents call on them for interpretation of flood plain management regulations. When a building is built in violation of these regulations and no variances issued, the agent is often thrust into a battle between the community and the client because of the difficulty in obtaining a flood policy, and then the subsequent high premium involved.
b) It is difficult to say whether the agent has the capability to get involved in these areas. Some do. Some don't. Most, because they feel they have a responsibility to the client, become involved and try to learn as much about the flood plain management regulations as they possibly can. They often are the only ones who are willing to go that extra step.
c) As a result of their client involvement, agents are interested in these areas.
d) Their involvement is with the insured and the local official in most cases. Actually, the agent becomes a traffic cop between the i~sured (client), community officials, lenders, engineers, and any others involved. The agent ends up having to try to inform each of the parties where their responsibility lies and what might be expected of them.
e) The involvement with local officials is initiated by the agent at the request of the client, in most cases. We find that community officials don't seem to understand the tie-in between flood plain management and insurance. The fact that a community official is responsible for the estimated BFE (in unnumbered A Zones) tends to marry the agent to that community official. In many other ways, the community official can be helpful, but very often he has not been sufficiently informed of the role he might play by his superiors and by such agencies as FEMA and ASFPM.
Q Specifically speaking for the FAIA, what problems (if any) do you see that hinder the effectiveness of the NFIP in reducing future flood damages in Florida?

156 APPROACHES TO fUTIGATION
A The primary problem that hinders the effectiveness of the NFIP in reducing future flood damages in Florida is lack of communication. Areas of responsibility, as mentioned above, should be more specifically defined.
Q What suggestions can the FAIA make which will improve the effectiveness and the efficiency of the NFIP, not only in Florida but across the nation as well?
A To improve the effectiveness and efficiency of the NFIP, we would suggest:
a) Better communication.
b) Simplification in all respects; i.e., flood plain management insurance writing, manual preparation, written communications, verbal communications training, et al.
GALVESTON BEFORE AND AFTER ALICIA: HOW CAN THE INSURANCE AGENT ASSIST IN THE
DEVELOPMENT OF HIGH-RISK AREAS
Fred E. Madsen United Services Automobile Association (USAA)
USAA is the leading producer of flood insurance policies, under the NFIP, writing in all 50 states. Mr. Madsen, Director of Property Insurance Plans has been a key figure in the development and growth of the NFIP since its beginning in 1968. Hurricane Alicia, in August 19S3, wreaked havoc with the Texas coast, especially the Galveston area. USAA, a prime insurer in that area, was actively involved in the redevelopment of the devastated coastline. Mr. Madsen, in the following question and answer format, will provide some insight into the role of the Agent/Producer in the development and redevelopment of high risk areas such as the Galveston coast.
Q As a large insurance producer, what role did your company play in preparing your insureds for Hurricane Alicia?
A We did not participate as an individual company. As a member of the Texas Insurance Information Institute and the Texas Catastrophe Property Insurance Association, we supported and encouraged a Hurricane Awareness program. Almost one million brochures entitled, "Texas Coastal Hurricane Preparedness Information" were distributed from key points along the Texas coast (copy attached). Much of this same information was printed on the grocery bags used by supermarkets in coastal areas. In this way, the information was carried home by the customer. Public Service Announcements were prepared for the various media and distributed.
The Institute for Storm Research held a three-day Hurricane Awareness Seminar, primarily for the benefit of community officials. This seminar provided a wealth of information on concepts of hurricane awareness.
Q The processing of claims of Hurricane Alicia uncovered a significantly large number of policies that were misrated largely due to enclosures below the elevated first floor. In your opinion, when did these violations of the NFIP Minimum Flood Plain Regulations occur; at the time of construction or during the term of the policy?
A In our considered opinion, most of these violations occurred after completion of the initial construction and after the initial elevation certification was

158 APPROACHES TO MITIGATION
obtained. Some enclosures were anticipated as a part of the original plan and some were built as an afterthought on the part of the insured. We are led to believe that one contractor was actually coaching property owners as to how to answer inquiries after the enclosure had been put into place. In other instances, the enclosure was constructed due to ignorance on the part of the property owner.
Q If the violations occurred during the term of the policy, why were they not corrected at renewal time?
A The Agent or Producer is not required to inspect the property either at the time of taking the application or at the time of renewal. Accordingly, the Agent/Producer was probably unaware of the problem. Many Agents/Producers lived in Houston and wrote insurance on property in Galveston or Galveston County. Even after the loss, they did not see the property.
Also, the computer direct-bill process makes it unnecessary for the producer to contact the insured at renewal time unless the premium is not paid. The lack of contact amplifies the problem.
Q When alterations to a structure, covered by a flood policy, are made, who has the responsibility to provide this information in order to update the conditions of the policy?
a) The Homeowner--According to policy condition, the homeowner must notify the agent if changes are made. This is rarely done.
b) Agent--The Agent/Producer might be apprised of the alterations in the unlikely event of an inspection. Otherwise, the only clue an Agent/Producer would have is if the insured increases coverage on the structure.
c) local Officia1--We feel that the ultimate responsibility lies with the local official. If building permits and building codes are enforced, the local official should always know of the alterations and the nature of the alterations.
Q At what time during the policy term should this information be made available?
A The information should be made available no later than the time the changes are made. Ideally, prior knowledge of the anticipated changes would allow local officials and/or the Agent/Producer to advise the property owner of potential problems or actual violations.
Madsen 159
Q During the rebuilding period after Alicia, did property owners continue to build in the same area, ignoring the potential risk to life and property? Did owners build in compliance with NFIP minimums, and if not, why not?
A Following Alicia, property owners did rebuild in the same areas. Some properties were built in compliance with NFIP minimums, especially where building permits were required and secured. Some community officials allowed the property to be built in such a manner as to exactly reproduce or replace the damaged structure. Easily secured grants, low interest loans and insurance payments were so readily available that there was no deterent to rebuilding.
The National Flood Insurance Program has instituted a reinspection program whereby a substantial number of the properties damaged in Hurricane Alicia were scheduled for reinspection and inspected after the reconstruction was completed. Unfortunately, this applied only to those structures which had been insured under the NFIP.
Q What role did your company play in the rebuilding period after Alicia?
a) Did you provide information to insureds, who suffered substantial damages, on how to rebuild safely? ANSWER: Only if they requested information.
b) Did you encourage insureds to relocate outside the high risk areas? ANSWER: Only if they requested comments.
c) What role, if any, did you play in assisting local officials in the rebuilding of the severely damaged areas? ANSWER: No assistance was provided on a direct basis. However, we cooperated with the NFIP and the Texas Insurance Information Institute.
Q Isolation is a major problem along the Texas coast. Because of isolation and budget constraints, structures are completed without being inspected by qualified authorities. Alterations and additions are being completed without benefit of a building permit. This only adds to the problem. The obvious solution is, of course, to require and enforce the obtaining of building permits and to have the construction inspected for compliance with building codes as well as flood plain management compliance.
a) What are the problems? ANSWER: So long as the public is convinced that losses will be covered by insurance, government grants or low-interest loans, building will continue. The property owner is able to transfer his risk to someone else.
160 APPROACHES TO MITIGATION
b) What are the causes? ANSWER: There is a shortage of risk-free land to be developed. The coastal lifestyle is very desirable. Insurance is the cornerstone of credit. With insurance for the peril of wind readily available from Wind Pools or Beach Plans and the Flood Program insuring the risk of Flood, there is no deterant to building in these areas.
c) How can they be resolved? ANSWER: The Coast Barrier Resources Act is a step in the right direction. We have a myriad of separate problems and an array of actions for resolving these problems; community compliance should be rigidly required and rigidly enforced; all program deficiencies should be corrected and all violations abrogated; compliance efforts in other communities should not be undermined.
The Federal Emergency Management Agency is the authority to enforce community compliance by probation, suspension, conditional reinstatement, and subrogation action. Further, they should also consider community-wide verification of insurance rates and recertification of flood insurance policies at renewal.
With regard to individual structures, NFIP can deny insurance on the basis of Section 13.16 and should actively engage in the rerating of individual noncompliance structures. They can also deny claims or collect back premiums on misrated policies. Subrogation action should be taken where appropriate.
THE ROLE OF THE SMALL COMMUNITY AGENT IN THE FIELD OF FLOOD HAZARD MANAGEMENT
John Z. Norri s Norris Insurance Agency, Inc.
Sound flood hazard management programs are the result of a successful marriage of federal, state, and local resources. The key remains the involvement of local communityofficials. Floods, more often than not, occur in smaller communities with little or no professional planning/engineering staff. Therefore, it is so essential that in these communities, everyone in both the public and private sector works together to build a successful program of flood hazard management. In this scenario, what is the role of the local agent/producer, if any, and how can his resources be used. Mr. Norris of Norris Insurance Agency, located in Baton Rouge, Louisiana, provides some insight into the role of the small agent/producer in the following question and answer format.
Q As an active member of the Producers Services Review Committee, what do you see is the role of the small community agent/producer?
a. In the field of educatioll b. In the field of local flood plain management c. In the field of flood disaster response
A a. The role of the small community agent in education primarily relates to helping educate the buyer and prospective buyer of the need for flood insurance.
b. In local flood plain management issues, his role is probably limited to working through his agent's association.
c. In flood disaster response, he can be of real assistance to flood victims not only with individual counseling but also through mass media news releases.
Q Having heard the presentations of Bob Ross (FAIA) and Fred Madsen (USAA), what comments can you offer from the perspective of the smaller producer to what they have said?
A The small agent introduces both advantages and disadvantages into sale of flood insurance. unfamiliar policies.
Small agents who write few flood insurance policies are sometimes with procedures, rules, rating and can cause delays in issuance of However, many small-town agents are familiar with flood insurance.
162 APPROACHES TO rUTIGATION
Such agents are good vendors because they are usually much more familiar with risk location, flood geography and community status than their big city cousins. For the large city agent, a major problem is locating the risk on a flood map.
Q What problems in the implementation of the NFIP at the local level have you noticed and what suggestions could you offer for resolution to these problems? (Perspective should be from a producer's standpoint.)
A A major problem of implementing NFIP is conducting a continuous program of education for agents who sell flood insurance. NFIP flood insurance is a complicated, intricate and detailed program to work with. This is necessarily so because flooding in and of itself is a complicated physical event. NFIP was constructed by congress on principles which differ greatly from those of commercial insurance programs. Finally, NFIP has a history of changing its program regularly and frequently. It is a difficult insurance product for a salesman to keep current on.
Q Do you have any suggestions for improving the overall success of the NFIP at the local level?
A The success of the NFIP can be improved by improving communications between the parties. NFIP needs better communications with both agents and flood plain managers. Flood plain managers need to communicate more with agent groups and associations. Agents need better communication with the buyer of flood insurance.
LIMITED-DETAIL FLOOU INSURANCE STUDIES CONDUCTED BY THE U.S. GEOLOGICAL SURVEY
Ernest D. Cobb
U.S. Geological Survey
Introduction
The Federal Emergency Management Agency (FEMA) required a less costly and
quicker means of conducting flood studies for insurance purpqses than those methods
used in the detailed flood studies. In February 1984, the U.S. Geological Survey
(USGS) entered into an agreement with FEMA to evaluate 2,349 communities for the
application of limited-detail study (LOS) methods. This paper discusses the LOS
methods that were considered, the results of the evaluation, and present USGS-LOS
activities.
Limited-Detail Study Methods
Eight LOS methods were considered during the community evaluations. They
are: 1) simplified step backwater; 2} historical floods; 3) slope conveyance;
4} depth frequency; 5) reservoirs; 6) information from previous studies; 7)
tidal flooding; and 8) profile interpolation.
Common to all of the limited-detail studies are the following:
• The profile and inundation boundaries are determined only for the IOO-year
flood.
• No floodway is computed. • The summary report is greatly reduced relative to that required for the
detailed studies •
. , Profiles must be tied to a datum, usually the National Geodetic Vertical
Datum of 1929.
When more than one LOS method would provide a suitable profile, the choice
of method is based on an assessment of the level of development in the flood
plain, a comparison of the cost of applying the LOS methods, and the expected
accuracy of the methods. For highly developed areas, it was a goal of the evalu
ations to select the most accurate LOS method available. The historical data
164 APPROACHES TO MITIGATION
method generally provides the most accurate results and is a relatively low-cost
method to apply where available high-water mark information is sufficient to
define a flood profile at, or near, the IOO-year level. The simplified step
backwater method is a high-accuracy method but it is usually the most expensive
to apply of the several methods. Combinations of the methods may be applied in
many studies. A description of the various LOS methods follows.
Simplified Step-Backwater Method
This method is most similar to the fllethod commonly used in the detai led
flood-insurance studies. In addition to those differences that are common to all
LOS methods, cross sections are spaced as far apart as possible, few or no sections
are obtained for profile convergence purposes, cross sections are interpolated
where the channel is fairly uniform or gradually converging or diverging, and
bridge and culvert configurations are superimposed on valley cross sections where
the valley section is fairly uniform through the bridge or culvert area. Slope
conveyance methods are often used to estimate starting elevations for the simpli
fied step-backwater method.
Historical Floods Method
This method utilizes historical flood information. This information may be
available in reports or on maps that have been prepared for major floods, from
high-water marks, rrom gaging station data, or from indirect flood-discharge
measurements made in the study area. Historical flood information may often be
found in USGS flood or data reports, or in USGS files. The information may also
be available in reports or files of other agencies. In all cases the information
must be evaluated for accuracy and applicability to the present conditions.
Historical information may be used directly if it approximates a IOO-year
flood. Otherwise, the IOO-year flood profile will have to be determined by
interpolation or extrapolation. Sometimes historical information is not adequate
in itself to define a IOO-year flood profile. In this situation, the historical
information may be used to define water-surface slope and roughness coefficients
or to confirm a profile developed by another method.
Slope-Conveyance Method
This method is similar to the simplified step-backwater method. A primary
difference is that the energy equations are not balanced. This method is used on
long, fairly uniform reaches, at the start of a simplified step-backwater study
reach, or with historical information.
Cobb 165
One of the problems with this method lies in the estimation of the energy
slope. This can be estimated with information from high-water marks, historical
flood profiles, discharge measurements, bed slope, or, generally as a last resort,
from topographic maps.
Depth Frequency Method
This method was recommended for use In the community evaluations for only
those areas for which a depth-frequency relationship had already been determined.
Many depth-frequency studies determine the height of the 100-year flood profile
above the elevation of the 50% flow duration or the height above the average
streambed profile. These heights are then physlographically regionalized and
related to drainage area or other profile characteristics.
The depth-frequency method Is not applicable at bridges, culverts, contrac
tions, in areas of backwater from downstream obstructions, or in channels modified
by man's activities. Backwater elevations for manmade constrictions or obstruc
tions must be computed through the use of appropriate hydraulic equations. The
method should be used only for channels for which the depth-frequency relationship
was developed. For example, If the relationship was developed from information
obtained from alluvial channels, this relationship should not be applied to
channels in other morphological settings.
The base profile used for application of the depth-frequency method can
usually be established by surveying a low-water profile through the study reach.
This profile will often approximate the water-level elevation of the 50% duration
flow. A rough approximation of the base profile can be obtained from a topographic
map if the contours are fairly close together. The contours at stream crossings
generally represent low-flow elevations. However, owing to Inaccuracies in most
topographic maps, field surveys are usually needed to make the necessary elevation
adjustments.
Reservoirs Method
There are two approaches using this LDS method. The first Is used where
100-year flood elevations are needed in the reservoir area. In this approach, a
rating is determined for the outlet from the reservoir. The stage for the 100-
year flood peak is then determined and that stage is used to define the 100-year
flood elevation around the reservoir. It is assumed in this case that reservoir
166 APPROACHES TO MITIGATION
storage is small and has little affect on the 100-year flood peak. The method is
not applicable where this assumption is significantly violated.
The second approach is used where 100-year flood stages are needed down
stream from a reservoir. Flows must be routed through the reservoir and the 100-
year flow downstream from the reservoir determined. This method is not used as
an LOS method downstream from large, complex reservoirs.
Information From Previous Studies Information is obtained from other studies. This may be information
resulting from model or other types of studies. The information must be evaluated
for its adequacy and applicability to current conditions. If the profile from
this other information cannot be tied to a datum, it may still be of value for
estimating water-surface slopes and roughness coefficients.
Tidal-Flooding Method
This method is used only in coastal areas that are protected from signifi
cant wave action. The method uses 100-year tide elevations provided by other
agencies such as the National Oceanic and Atmospheric Administration. These
elevations are then applied to maps. This method was recommended in the community
evaluations for only two States.
Profile-Interpolation Method This method is used to interpolate the 100-year profile between stream
segments where the lOO-year profile is already defined. This method is applicable
generally only for short stream segments, the length depending on the uniformity
of the channel and channel slopes.
Evaluation Results
Evaluations were made of 2,349 communities for the application of LOS
methods. The evaluated communities are located in 38 States (see figure 1).
Pennsylvania had by far the largest number of communities with 817 communities
evaluated. The State with the next largest number of communities evaluated was
Mississippi with 151.
Of the 2,349 communities evaluated, it was determined that LOS methods could
be used in 1,710 of the communities. Detailed studies were considered appropriate
for 62 communities and no studies were considered appropriate for 577 communities.

Cobb 167
In the 1,710 communities for which LOS methods could be applied, 9,390
miles of streams were esti~ated to be appropriate for the application of LOS
methods. The estimated cost of conducting studies in these communities was about
$23 million or about $2,500 per mile of stream studied. Many of the stream
segments that were evaluated were less than one mile long. These short stream
segments tend to elevate the cost per mile of these studies.
The following lists the length of stream for which various LOS methods
could be applied.
LOS method
Simplified step backwater
Historical method
Slope conveyance
Depth frequency
Reservoi rs
Previous studies
Tidal flooding
Profile interpolation
Combinations of methods
and other methods
Percent of total stream length
40
12
11
3
1
30
Present USGS LOS Activities
The USGS has entered into an agreement with FEMA to begin work on about
515 communities in 1985 using LDS methods (see figure 1). Most of these studies
are to be completed by September 1986. The remainder will be completed in 1987.
Limited-detail studies include eight methods. They are: 1) simplified
step backwater; 2) historical floods; 3) slope conveyance; 4) depth frequency;
5) reservoirs; 6) information from previous studies; 7) tidal flooding; and
8) profile interpolation. The simplified step-backwater method was found to be
the most appropriate for use on about 40% of the total stream lengths for which

168 APPROACHES TO MITIGATION
LOS methods could be applied. The average cost of application of LOS methods is
about $2,500 per mile of studied stream length. The USGS is beginning studies in
515 communities in 1985. All of these studies will be completed by 1987.
14 (5)
21 (6)
24 (9)
19 (7)
:-",
~' \ "", .. .J ..
\ ALASKA 0 '. - \
,. l-.
., ................ . itI '. "\
\ 0. c::> '---.~
HAWAII "s:;:. - {)
.0 PUERTO RICO
c:=:J
3 (1)
12 (8)
4 (2)
Explanation
Number of Communities Evaluated
Number of Studies Being Conducted
Figure 1. - Number of communities evaluated for the application of limited-detail study methods and the number of communities where limited-detail studies are being conducted.

IMPLEMENTATION OF NONSTRUCTURAL FLOODPLAIN MANAGEMENT MEASURES
BY THE U. S. ARMY CORPS OF ENGINEERS
Jerry L. Greer Ohio River Division Corps of Engineers
Introduction
The evolution of flood damage prevention measures in the United States
portrays a continuing effort to separate flood waters from people and their
possessions, all within the framework of an ever-changing set of circumstances. During the early development of this nation, principal concerns were with the
most fundamental of human objectives such as dependable food supplies, shelter from the elements, and security from physical danger. The initial development
of water resources related directly or indirectly to these needs in the context of an expanding country, and focused mainly on water transportation and water
supply. Population centers inevitably clustered along river valleys and in floodplains. Uncontrolled clearing of forested areas for agricultural uses and
grading and drainage activities for urban uses changed rainfall-runoff charac
teristics to compound an already worsening proliferation of unwise uses of
floodplain lands.
At this point, flood problems became recognized as a significant concern
of the federal government. Early solutions to flood problems were almost
always based on the premise that flood waters should be controlled to protect
areas of the floodplain for developmental purposes. However, ultimately it
became obvious that flood control projects could not protect against all
floods, especially if uncontrolled development continued. It was apparent that
actions designed to influence land use decisions must become an added dimension
to public policy on floodplain management. "Floodplain management," as used
herein, is a comprehensive term which covers a full range of actions encompas
sing both structural and nonstructural measures. History of the Corps of Engineers in Water Resources Development
The Corps of Engineers has played a major role in the development of water

170 APPROACHES TO MITGATION
resources in this nation. As early as 1824, the Congress established a Board
of Internal Improvements to plan a national transportation system of roads,
canals, and waterways. Various River and Harbor Acts and, later, Flood Control
Acts have provided authorization for the Corps' water resources program. The
Corps' mission had to do primarily with navigation improvements until 1879,
when the Mississippi River Commission was created with flood control as an
added function. Flood control on the Mississippi River, however, remained
incidental to navigation until 1917 when the first specific flood control legislation made flood control, by law, as much a part of the Commission's work
as navigation.
The first nationwide survey of mUltiple-use possibilities for development
of the nation's rivers was assigned to the Corps by Section 308 of the 1927
River and Harbor Act. In the next decade, the Corps prepared some 200 "308
Reports" outlining possible developments for purposes of navigation, flood
control, irrigation, and hydroelectric power. These studies are generally
acknowledged to have provided the basis for much of the intensive multiple
purpose water resources planning and development over a period of more than 50
years. Public support for large annual expenditures on conventional flood
control projects waned with the recognition that the rate of annual flood
damages continued to increase in spite of these expenditures. These concerns
were reflected by Section 206 of the River and Harbor and Flood Control Act of
1960, which authorized the Corps to provide information, technical planning
assistance, and guidance to other federal and non-federal entities to identify
the magnitude and extent of flood hazards, and to assist them in planning for
wise use of floodplain lands. This was the genesis of the Corps' Flood Plain
Management Services program. The wise use concept added a new dimension to flood plain management and became the forerunner of Section 73 of the Water
Resources Development Act of 1974, which requires that nonstructural alterna
tives for flood damage reduction be considered in the project formulation process.
Status of Implementation
The Civil Works mission of the Corps of Engineers is very complex and
comprehensive. It is funded under Public Works Appropriations and is not a
part of the Defense budget. Under the Command of the Chief of Engineers,
programs are executed by military and civilian staffs in 11 division offices
and the 36 subordinated district offices. Geographical areas of responsibility

Greer 171
are separated by drainage divides and river basin boundaries. Policy guidance
comes from the headquarters office in Washington. However, the Corps has a policy of decentralization that provides for authority to be delegated to
commanders at division and district levels, in order that differing needs and
perspectives of the various regions of the country can be considered. The
currently changing emphasis in floodplain management from structural measures
to nonstructural measures has not yet resulted in clearly defined procedures
for the implementation of plans which include nonstructural measures as a
principal component. This does not mean that projects utilizing these compo
nents are not being formulated, a high degree of originality is being used by
Corps planners to develop locally acceptable solutions to flood problems within
established financial and administrative constraints.
Seminar on the Implementation of Nonstructural Measures
The Civil Works Directorate of the Corps of Engineers hosted a seminar on
the Implementation of Nonstructural Measures at Fort Belvoir, Virginia, in
November of 1982. The seminar focused on the need for new initiatives in
research, information and experience transfer, procedural guidance, and policy
issues. Discussions gave strong support for equal consideration of structural and non structural flood plain management measures. The seminar was attended by representatives of federal, state and local agencies and the private sector.
The Corps was represented by participants from 40 of the 47 district and divi
sion offices. The proceedings were published and distributed in July of 1983.
A Corps committee was assembled in July of 1984 to identify key issues and
problems discussed at the seminar and develop recommendations for follow-up
actions needed to enhance the implementation of nonstructural measures in Corps
feasibility studies. Committee members represented Corps headquarters, three
division offices and four district offices. Recommendations of the committee
are not yet final. However, as a member of that Committee, I will enumerate
and discuss some of the primary issues.
Definition of Nonstructural Flood Plain Management Measures
A universally accepted definition of "nonstructural measures" has not yet
been developed. A part of the difficulty in defining the term stems from the
fact that floodproofing actions are sometimes not clearly distinguishable from
structural measures. A clear separation between the two terms becomes critical
when considering an item of construction such as a ring levee. If it protects only one to two houses, it is considered a nonstructural measure and, as such,
172 APPROACHES TO MITIGATION
has no requirement for freeboard. However, if the ring levee is extended to
provide protection to a few more houses, it becomes a structural measure. The
difference affects not only the design criteria, but also qualification for
(80/20) cost-sharing under Section 73 .
.Inventory of _t:!.0nstruc~~l Measures A definitive consolidation of information on nonstructural measures com
pleted or recommended in various Corps projects and plans is essential. It is
important for Corps planners to know what has been done by others and how their
efforts have been received.
Emergency Preparedness Pla~~ Corps participation in the implementation of flood warning systems or
temporary evacuation plans, as elements of an overall floodplain management
plan, is generally limited to the provision of technical assistance and plan
ning guidance to appropriate government levels, and to the provision of equip
ment devoted exclusively to this purpose. Corps assistance in the development
of these measures over the last decade has been provided as a technical service
under the Flood Plain Management Services program (Section 206, River and
Harbor and Flood Control Act of 1960) or the Planning Assistance to States
Program (Section 22, Water Resources Development Act of 1974). The effective
ness of emergency preparedness planning as an element of comprehensive flood
plain management plans would he maximized if the flood warning and emergency
evacuation portions of nonstructural plans could be implemented as early-action
items. Under current procedures, none of the plan is funded until the total
plan is authorized by Congress and monies are made available. Another signifi
cant problem centers on the need for uniform guidance on the evaluation of
flood damage reduction benefits specifically applicable to emergency preparedness measures.
Floodplain Regulations
Floodplain regulations may be required as a part of a flood control project. However, adoption and enforcement of regulations for floodplain manage
ment are entirely local responsibilities. Local interest may be required to
adopt and enforce such regulations as a necessary component to the protection
of the federal investment, or to achieve expected project benefits.
Permanent Floodplain Relocation/Evacuation Projects
Policies and regulations for planning and implementation of Corps projects
are not easily adapted to meet the special requirements of flood plain reloca-

Greer 173
tion/evacuation measures. The following issues have bearing on such projects.
The reduction of flood damages borne by floodplain activities is not claimed as a benefit of evacuation or relocation because they are already accounted for in the fair market value of floodplain properties. These mea
sures are difficult to justify economically because the costs are high.
Uniform implementation responsibilities and procedures for field manage
ment of such projects have not yet been established. These critical items can be undertaken by the local sponsor or by the Corps.
Corps policies and regulations on real estate acquisition and disbursement
of project funds are not designed to meet the special needs of relocation/
evacuation projects. Currently, the Corps cannot provide advance financing for
the purchase and resale of optional flood-free relocation sites.
A clear distinction between "financial costs" and "economic costs" is a
concern in the application of existing guidance to the evaluation of benefits.
"Financial costs" require no economic justification because they are assumed to
be offset by equal benefits. Remaining "economic costs" must be shown to be
justified by calculated benefits.
Voluntary vs. Mandatory Participation Implementation procedures are not clearly established in regard to whether
permanent relocation/evacuation and floodproofing measures are voluntary or
mandatory. There appears to be a legal and policy consensus that implementation of an authorized evacuation /relocation project is mandatory (eminent
domain can be applied), but floodproofing of individual homes is voluntary.
Level of Protection for Nonstructural Measures
Comprehensive guidance for establishing appropriate levels of protection
for nonstructural measures should be formulated. Current guidance establishes
no specified minimum level of protection for non structural plans. The level of
protection for individual floodproofing measures may be selected on the basis
of maximizing net benefits. This procedure can result in the selection of less
than IOO-year level of protection for some measures, which would be inconsis
tent with the requirements of the National Flood Insurance program, because the
protected areas still would be considered flood-prone
Conclusion
We have reached an awareness that the contribution of nonstructural mea
sures to the objective of flood damage reduction is not only a function of how these measures relate to the physical aspects of a given flood problem, but
174 APPROACHES TO r~ITIGATION
also to what extent the benefiting public understands and accepts them. Future
success in the implementation of nonstructural projects will depend on the acceptance of an actively involved public. This challenge affects the states
and local levels of government, as well as the Corps of Engineers and the rest of the federal establishment. The Association of State Floodplain Managers is
a dynamic association of professional floodplain managers representing all levels of government and the private sector which can play an essential role in the achievement of the numerous objectives of this critical period.
References .-----House Document No. 465 1966 A Unified National Program for Managing Flood Losses. A report by
the Task Force on Federal Flood Control Policy. August 10.
Steinberg, Bory 1984 Flood Damage Prevention Services of the U. S. Army Corps of
Engineers: An Evaluation of Policy Changes and Program Outcomes During 1970 to 1983 Measured Against Criteria of Equity, Efficiencg. and Responsiveness. Dissertation #84-D-2.ashington, DC: School of Government and Business Administration, The George Washington University. February.
Yoe, Charles 1981 The Declining Role of the U. S. Army Corps of
Development of the Nation's Water Resources. Water Resources Research Institute, Colorado August.
Engineers in the Fort Collins: Colorado State University.

SOIL CONSERVATION SERVICE ASSISTANCE TO FLOODPLAIN RESIDENTS
Phillip A. Renn USDA Soil Conservation Service
Introduction -------Floodplain management assistance to reduce upstream flood damages is
provided through numerous Soil Conservation Service (SCS) programs. Some of the
efforts, such as floodplain management studies, river basin studies, and con
servation operations provide only technical information. Programs offering
both technical and financial assistance are the Watershed Protection and Flood Prevention Act (PL-566) and Resource Conservation and Development (RC&D). Most
of the assistance under these programs goes directly to units of government and
indirectly to the actual residents living in the floodplain.
Flood Plain Management and River Basin Studies have been conducted on 1)
breach routing and inundation mapping below dams, 2) hydraulics and hydrology
in areas not covered by flood insurance studies, 3) stormwater management
modeling, and 4) project planning. Each study is carried out in accordance
with a plan of work developed by the local government and SCS. River Basin
Studies have been used for large river systems where other resource problems
exist which need to be evaluated.
Flood prevention measures under the PL-566 and RC&D programs are planned, designed, and constructed to reduce flood damages on residential, commercial
and industrial properties, railroads, roads, utilities, and agricultural crops
in watersheds smaller than 250,000 acres. Historically, structural measures
such as dams and channelization have been favored, but nonstructural measures
can also be used.
Flood Warning System
In Connecticut, the Soil Conservation Service has undertaken a special
study and pilot project to test the use of a flood warning system and indivi
dual assistance to reduce flood damages. SCS and the Connecticut Department of
Environmental Protection (DEP) are funding a system of 21 automated precipita
tion gages for a statewide flood warning network. In addition, five precipita-

176 APPROACHES TO MITIGATION
tion gages and two river gages will be installed for two local warning systems
-one on the Yantic River in Norwich and one on the Quinnipaic River in
Southington. The major components of the automated flood warning system include precip
itation gages, river gages, radio transmitters, radio receivers, and a micro
computer. The gages will continuously monitor and instantly transmit data to
receivers located at the municipal police station and at a National Weather
Service River Forecast Center. There, the data will be processed using a
microcomputer system. Along with the hardware, SCS has contracted with the
Connecticut Council on Soil and Water Conservation to conduct flood audits on
all floodplain properties in the two local areas. The two areas receive almost
$500,000 in damages on the average annually. The flood warning system and
flood audits are expected to reduce the damages by 10-30%.
Flood Audits
Individual flood audits focus on providing flood preparedness training to
potential flood victims in a local community. The audits are one way to give
residents information on the corrective actions that they can take to reduce
their flood losses. Without individual flood audit assistance, most people
will only know that a flood will occur at a predicted time and it may reach a
certain height at the gage. They will not know how a flood of this height at
the gage will affect their individual property nor what action to take to
reduce flood damage.
The property owners are interviewed to obtain structural and physical
information for the building (see Table 1). After the interview, the flood
heights and their relationship to the individual building are identified and
added to the Flood Audit Interview Worksheet. The action items for each flood
height are identified and shown on the Sheet on Prescribed Actions (Table 2).
When a person who has had a flood audit is alerted to a predicted river
flood stage, he or she can use the information on the worksheets to:
1) Determine whether or not they will be affected by the flood stage predicted.
2) Utilize each additional hour and minute gained through the ALERT system
in preparation for the flood.
3) Take damage reduction actions for a given flood stage as specified in
the list of recommendations resulting from the individual flood audits. 4) Evacuate in a timely manner using a predetermined route.
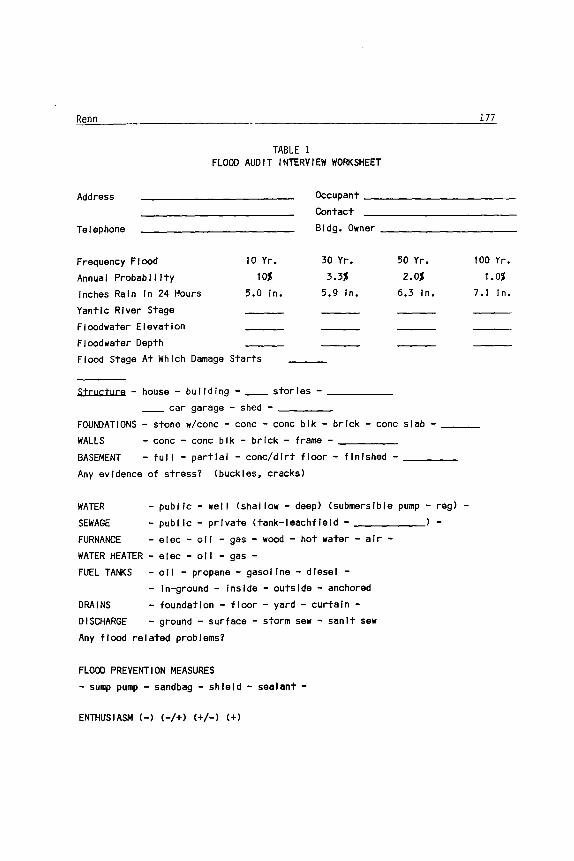
Renn
TABLE 1 FLOOD AUDIT INTERVIEW WORKSHEET
Address
Telephone
Frequency Flood
Annual Probability
Inches Rain In 24 Hours
Yantic River Stage
Floodwater Elevation
Floodwater Depth
10 Yr.
10%
5.0 In.
Flood Stage At Which Damage starts
Occupant
Contact Bldg. Owner
30 Yr.
3.3%
5.9 In.
Structure - house - bu I I ding - __ stor I es - ____ _ __ car garage - shed - ___ _
50 Yr.
2.0%
6.3 In.
FOUNDATIONS - stone w/conc - conc - conc blk - brick - conc slab -
WALLS
BASEMENT
- conc - conc blk - brick - frame - ____ _
- full - partial - conc/dlrt floor - finished - ___ _
Any evidence of stress? (buckles, cracks)
WATER
SEWAGE
- public - wei I (shal low - deep) (submersible pump - reg) -
- public - private (tank-leachfJeld - ) -
FURNANCE - elec - 011 - gas - wood - hot water - air -
WATER HEATER - elec - 011 - gas -
FUEL TANKS - 011 - propane - gasoline - diesel -- In-ground - Inside - outside - anchored
DRAINS - foundation - floor - yard - curtain -
DISCHARGE - ground - surface - storm sew - sanlt sew
Any flood related problems?
FLOOD PREVENTION MEASURES
- sump pump - sandbag - shield - sealant -
ENTHUSIASM (-) (-/+) (+/-) (+)
177
100 Yr.
1.0%
7.1 In.
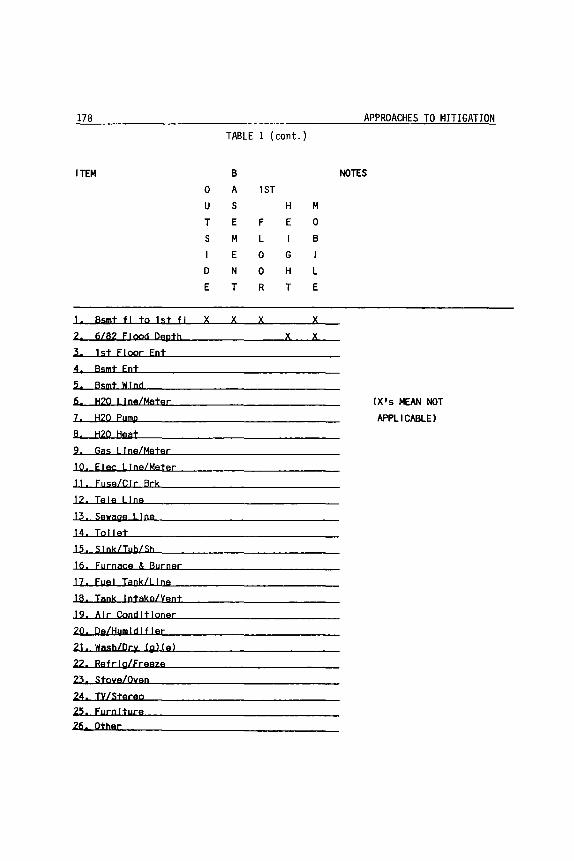
178
ITEM
1. Bsort fl to 1st fl
2. 6/82 FIQQd Depth
3. 1st FIQQr Ent
4. Bsmt Ent
5. Bsmt Wind
6. H2O LIne/Meter
7. H2O Pump
8. H2O Heat
9. Gas Line/Meter
10. Elec LIne/Meter
II. Fuse/Clr Brk
12. Tele LIne
13. Sewage LIne
14. Toilet
IS. Sink/Tub/ Sh
16. Furnace & Burner
17. Fuel Tank/LIne
18. Tank Intake/Vent
19. Air Conditioner
20. De/Humidifier
21. Wash/Dry (gl(el
22. Refrlg/Freezft
23. Stoye/Oyen
24. IV/Stereo 25. Furniture 26. Other
TABLE 1 (cont.)
B
0 A 1ST
U S H
T E F E
S M L I
E 0 G
D N 0 H
E T R T
X X X
X
M
0
B
I
L
E
X
X
APPROACHES TO ~1ITIGATION
NOTES
(X's MEAN NOT
APPLICABLE)

L.OC61I Ctl .illt:t
Basem
ent
Furnace
Hot W
ater Heater
Floor D
rain
Canning
Jars C
arpets
Misc.
Contents
Fuse Box
Appliances
Lavatory
TABLE 2
PRESCRIBED ACTIONS TO TAKE FOR THE GIVEN FLOQQ STAGES
.lZ..f.EEI ll....E
EE
I .16....f.EfI
Sand B
ag B
asement
No Action
No Action
Disconnect B
urner and
bag circulato
r motor
No Action
No Action
Shut o
ff power
No Action
Block F
loor Drain
No Action
No A
ction No A
ction R
aise 3 feet No A
ction No A
ction R
aise 3 feet
No Action
No Action
Raise 3
feet
No Action
No Action
Turn
off M
ain S
witch
No Action
No Action
Disconnect &
Enclose
In bag No A
ction B
lock Drain
No Action
SA
M P L
E
~
::J ::J
I;:;:;
THE EVOLUTION OF NONSTRUCTURAL TECHNIQUES IN COMPREHENSIVE
FLOODPLAIN MANAGEMENT PROGRAMS
James E. Goddard Consulting Engineer
The nation's first full-scale regional program of floodplain management
was launched in 1953 in the Tennessee Valley. Initially it involved floodplain
regulations; later other non structural measures were added as complements to
flood control structures to reduce flood damage potential and urge wise use of floodplains. The success in the Tennessee Valley led to our national program
that is growing in effectiveness.
Regional and urban planning was only three decades old in 1953 and many
people questioned the appropriateness of such an approach. Just as important
was the historical flood-structure-only school of thought, in which floodplains
had been subsidized for years. That had cost many billions of dollars but had
been unable to reverse the nation's increasing flood damage potential. This
was the setting when the new management program was initiated. IL WdS to have
people consider the adoption of self-restraints that would control and some
times restrict use of their lands and related resources, along with the consid
eration of structural protection heavily subsidized by the federal government.
Major criteria set out for floodplain regulations perhaps had, and conti
nue to have, the greatest effect on comprehensive floodplain management. How a
few of those criteria were determined is presented herein. It was decided
early that the following must be accomplished for a successful program:
1} States must be an active partner in the local-state-federal team for an effective program.
2} Engineers and town (regional) planners must cooperate closely for the best acceptable solution to local flood problems.
3} Officials and the public must understand the problem and be aware of
alternate solutions.
4) An intermediate between "no use" and full use" of the floodplain must
be determined. It must permit wise use and also be acceptable.
Below each of these goals is discuss~0 in more detail.
Goddard 181
Local-State-Federal Cooperation
Many of the floodplains are too large for local government or even state government to handle alone. Furthermore, it is neither feasible nor desirable
for the federal government to act independently. An increased degree of coop
eration between local, state, and federal agencies and individuals was considered a necessary element in proper management.
States have statutory powers and have granted many of those powers to
local governments. They should play an active role in shaping and administer
ing state programs in accordance with their respective state constitutions and
organization. Local governments must play the major role because they have
been granted necessary statutory powers and they can insure that the solution
is appropriate to their problem.
Federal technical and financial assistance, encouragement, guidance, and
related activities should be channeled through state agencies. This would lead
to greater confidence of local officials and public, better administration, and
greater continuity of the program. This policy was adopted and followed.
Engineers-Planners Cooperation
The expertise of planners and the technical expertise of engineers must be
coordinated for the best solution to flood problems. Calling on both profes
sions and obtaining input from each in a timely fashion was arranged early in
the program. This cooperation resulted in actions acceptable to the public and
to the courts. Public Understanding of Problem and Possible Solutions
Officials and the public must understand the problem and all alternate
solutions in order to select and implement the best solution. This "informed
public" is even more important when breaking away from the limited, traditional
approach that had been found lacking.
Nomenclature for Understanding
One of the actions to change and broaden the thinking was to adopt a new
and more descriptive term or name for the comprehensive concept. The term
"floodplain management" was coined as a part of coordinating efforts of local,
state, and federal officials, water resource planning engineers, geographers,
planners, economists, lawyers, foresters, recreation specialists, naturalists,
and other officials and disciplines concerned with an overall comprehensive
approach. It appeared to be the most acceptable (or the least objectionable) to the various groups and interests. It is now widely accepted.
182 APPROACHES TO mTIGATION
The Legal Question The skepticism concerning zoning or regulating areas for flood hazards had
to be overcome early. Court cases were scarce and generally unknown. Most
communities did not have, nor could they afford, full-time attorneys. Since
few of the community attorneys were versed in this phase of the law, it was
decided to give advice in a general way and be more specific upon request. A
brief legal treatise with ample references was prepared in layperson's lan
guage. It stated the case and finally declared that "courts have upheld the
regulation of land use for the prevention of flood damages." This article was
printed in the National Civic Review in 1961. Thousands of reprints were distributed in the Tennessee Valley and nationwide. This article proved very
effective.
The Flood Report Another action was to design a simplified type of report that could be
understood by lay as well as technical people. This went counter to tradition
in presenting the engineering data. Technical terms were held to a minimum.
The best data available were included for general interpretation and use. Maps
showing areas inundated by various floods, profiles showing elevation of the
floods, photos showing flood heights on prominent structures, and a short
history of flooding at the site were among the data presented in the reasonably
brief reports. The reports were distributed to respective officials and indi
viduals. They were explained and discussed to insure an understanding of the
problem.
Following presentation of the basic flood report, possible alternate
solutions to the flood problem were presented and explained. These were de
scribed and illustrated in booklet or leaflet form. Planning and engineering
assistance and guidance were given to state and local officials to help them
choose the appropriate approach for the community. A floodplain regulations
solution was generally the first action taken. A comprehensive solution often
followed--sometimes with structures--after much more study and time. Wisely Limiting Use of FloodPlains
Many advocated that the floodplains should not be developed, but be kept
clear and open to prevent heavy losses from flooding. Others contended that
natural resources of flood plains were too great to sacrifice through no use.
Urban planners, engineers, economists, lawyers, geographers, administrators, officials of several states and several communities, and authorities in a few
Goddard 183
universities and federal agencies were consulted. These discussions indicated
that the "zero" approach could result in the inefficient use of the flood
plains. The need for a reasonable, intermediate approach with a judicial balance of development was suggested.
£.~qdways
The concept which evolved from this process was an intermediate that allowed encroachment onto the floodplain. The decision was to preserve a
floodway to accommodate nature's flood waters and require the elevation or
floodproofing of structures outside the floodway. The floodway was to be the
channel and that portion of adjacent floodplains necessary to carry the speci
fied flood without increasing flood elevations significantly.
The criterion for "significant increase" determined to be a reasonable
amount was "no more than one foot." The number "one" did not suggest an
accuracy or degree of guidance that a fraction or fractions of a foot might
connote. It related' realistically to the engineering judgment applied in
hydrologic and hydraulic computations. It was to be a minimum criterion inten
ded as a regional standard, recognizing that there were urbanizing areas where
elements might indicate a smaller rise might be appropriately considered. The
criterion has proven to be reasonable, justifiable, and acceptable.
Selecting Flood Magnitude for Regulations
The devastating effects of failing structures (levees, walls, dams) are
quite different from the inundating effects of gradually rising flood waters. That is a major reason why a flood of lesser magnitude can reasonably be consi
dered for regulations.
In selecting a flood criterion it was recognized that an excessively high
level would result in wasted resources, but an insufficient level would increase the probability of costly damage in the future. It was believed a
"regional flood" based on flood experiences in the immediate region could be
reasonably expected to occur at the subject site. Also, local people, offic
ials, and decision makers would be more likely to understand and accept a flood
of such magnitude. For those reasons, a regional flood was selected.
Developed at a time before the highly theoretical and largely misunderstood
frequency designation came into common use, this regional flood was sometimes a
little higher than the statistically derived lOO-year flood minimum standard
selected in 1966 as part of the national program.
184 APPROACHES TO 11ITIGATION
~~~~ Flood for Greater Safety In addition to basing regulations on this regional flood, it was thought
that users should be aware that larger floods could be expected. Therefore, it
was decided to present data (elevations and areas that would be inundated) for
the Tennessee Valley Authority's 'maximum probable flood'--the flood related to
designing flood control structures by TVA. This was to alert users to the
probability of greater floods and provide a guide for those that wished to
accept very little, if any, risk.
Floodproof~~
Floodproofing was another element of floodplain management given early
attention. In order to better understand the possible role of floodproofing in
comprehensive floodplain management, assistance was given the University of
Chicago and one of its graduate students (John R. Sheaffer) to make a study.
That report, 'Flood Proofing,' and a later publication prepared by Sheaffer, "Introduction to Flood Proofing,' have been used nationwide and extensively.
Knowledge gleaned from the study was used in integrating floodproofing into the
Tennessee Valley program.
Corps of Engineers Criteria
The U. S. Army Corps of Engineers (Corps) started its nationwide Flood
Plain Management Services program late in 1966. The successful experiences in
the Tennessee Valley were reviewed and most were incorporated into the Corps'
effort. The concept name of floodpldin management was used to denote the
broadened approach. The brief, simplified type of report in layperson's lan
guage adopted was similar to that of TVA. The floodway concept with the "sig
nificant increase" criterion of "no more than one foot" was made a part of the
program.
The selected flood chosen by the Corps was termed "Intermediate Regional
Flood" to connote a flood that was intermediate between lesser floods and the
large damaging floods that could reasonably be expected in the region. The
lOO-year flood was chosen for this, but it was identified on maps and profiles
as an intermediate regional flood. It related reasonably close to, but varied
somewhat from, TVA's regional flood. The Corps' standard project flood was
used to alert users to the probability of greater floods.
FEMA (FIA) Criteria The Federal Insurance Administration (now FEMA) later established some
national minimum requirements for federal flood insurance eligibility. Those

Goddar.~d ______________________________________________________ l~8~5
included adoption of floodplain regulations meeting certain minimum standards.
The terminology of floodplain management, a base flood of lOO-year frequency,
and the floodway concept using the "no more than one foot" criterion were
adopted. Review of Criteria
Congressional committees have reviewed the lOO-year flood and the "no more
than one foot" criterion for floodways two or more times. The criteria have
also been reviewed and sometimes challenged by some officials and communities. The reasonableness and acceptability of the criteria have withstood all such
reviews. However, some states and some communities in other states have recog
nized the "minimum" intent of the "one foot" standard and adopted more restric
tive standards. Further information concerning the evolution of floodplain management
criteria can be found in TVA's report, "Flood Plain Management--The TVA
Experience," December, 1983. Also, a history of the "Corps And Flood Plain
Management" may become available in the next several months.

FLOOD INSURANCE AND ITS RELATIONSHIP TO FLOODPLAIN MANAGEMENT
Nicholas Lally Flood Hazard Consultant
(Former Director of Flood Plain Management Division, FIA, 1969-1979)
Evolution of the Man~ement Program
The National Flood Insurance Program has had the greatest impact of any
federal program in developing an awareness of the need to manage our nation's
floodplains. It involves all three levels of government--local, state, and
federal--and has, therefore, engendered many conflicts over regulations, stan
dards, and policies. The national impact took many years to evolve and its
effectiveness has been hampered by some of the policy decisions in the politi
cal arena.
Flood insurance first became a national topic in 1951 following a disastrous flood along the Missouri River. President Truman asked the insurance
industry to re-examine its traditional position of not underwriting flood
damages. In response, the Insurance Executives Association appointed a commit
tee to study the problems of floods and flood damage. In May of 1952 a report
was published with the conclusion that insurance companies:
could not prudently engage in this field of underwriting.
It is our considered opinion that insurance against the
peril of flood applicable to fixed property cannot
successfully be written and that any specific promise
of indemnity for loss by flood must therefore be regarded
~s in the nature of a subsidy or relief payment,
which are quite outside the scope of private insurance ....
As a long-range program, it appears that an accelerated
flood control program supplemented by such relief payments
as are necessary on account of flood damage would be more
in the interest of the public than a program of so-called 'flood insurance' which would not be self-supporting.

Lally 187
In August of 1955, rainfall associated with Hurricanes Connie and Diane
created catastrophic losses in the northeastern United States. These disas
ters, coupled with a December, 1955, storm along the California coast, resulted
in strong political pressure on the Congress for disaster assistance. Once
again the insurance industry was asked to re-examine its position on flood
damages and it quickly responded with the same conclusion as in 1952.
The Congress then proceeded to enact its own program called the Federal
Flood Insurance Act of 1956. This legislation intended to provide reimburse
ment to individual homeowners who suffered flood losses up to a maximum of
$10,000. Despite the fact that the legislation was enacted, funds were never
provided because there were those in Congress who recognized that this was a "giveaway program"--without some control on construction in the floodplain, it
would be encouraging more spiraling flood damages and further raids on the
federal treasury.
In 1966, the President's Task Force on Federal Flood Control Policy recom
mended that the feasibility of insurance be studied with rates to be establish
ed to reflect annual potential damage, and an "occupancy charge" that would
preclude new development unless the advantages were expected to equal or exceed
the total social (public and private) cost. These concepts were incorporated
in a pilot program which led to the creation of the National Flood Insurance
Program in the Housing & Urban Development Act of 1968. This new program had a
"double-barrel" approach--indemnification for those suffering damage was
contingent on the local authority adopting criteria that would assist in reduc
ing damage caused by floods and guide new construction away from flood hazard
areas. It was hoped that this approach would eventually make the program self
supporting as the subsidized portion of the annual losses became a smaller and smaller percentage of the total insurance pool. NFIP
For the first five years of its operation (1968-1973), as a purely voluntary program, the National Flood Insurance Program had little national impact.
Relatively few flood-prone communities had adjusted building codes and con
struction practices to gain eligibility for federally subsidized flood insurance. In spite of the low subsidized rates, few owners purchased flood insur
ance when their communities became eligible for coverage during the period between 1968-73.
During this period, Congress made some changes which to this day are being

188 APPROACHES TO MITIGATION
debated as having a negative impact from a flood plain management perspective.
These were done in the 1969 amendments to the program as follows:
1) The word flood in the legislation was to include the phenomena called
"mudslides." This action was the result of severe storms in California which,
combined with unstable soil conditions, resulted in earth movement down a
slope, often carrying with it existing structures or covering them with a "sea
of mud." To my knowledge, federal land use criteria for these conditions have
never been promulgated, but some counties have made a major effort in trying to
control the problem. This issue, along with alluvial fans and high-velocity
shallow flooding, will be noted further in this presentation.
2) The second debatable change in the law was making available flood
insurance for existing structures in an area that had not been studied for
actual flood risk, provided that the community promised to adopt the necessary
criteria when the study was completed. New structures could not obtain insur
ance until the final study, but were permitted to locate in the floodplain in
ignorance of the true risk. This change, which later was called the Emergency
Program, did expand the availability of insurance, but may have induced many
unwise decisions for new construction. A positive change took place in
December 1971 when the Federal Insurance Administration modified its regula
tions to require the 100-year flood be used as a minimum standard for the
necessary Land Use Criteria. Prior to that time, it was suggested as a guide but not required. Along with that change, a limitation of a one-foot rise was
established for the maximum impact of any future floodway criteria. The
evolution of this criterion and the lOO-year flood standard will be discussed
further.
The chain of flood disasters in 1972 and 1973 under the voluntary program
-Rapid City, South Dakota; Hurricane Agnes-caused flooding in Pennsylvania,
Virginia, and New York; Buffalo Creek, West Virginia; and Mississippi River
floods found thousands of uninsured flood victims, and federal outlays for
these and other disasters were in the neighborhood of $5 billion. Confronted
with the enormous loss of life in these disasters as well as spiraling federal
costs for national recovery efforts, Congress passed the Flood Disaster
Protection Act of 1973 (Public Law 93-234). This law put "teeth" into the
Flood Insurance Program by requiring flood insurance as a condition for any
federal or federally connected financial assistance in flood-prone areas. Significantly, the 1973 act also prohibited loans from conventional or public
Lally 189
sources for existing or proposed construction in identified flood-prone areas
of communities that fail to adopt minimum floodplain management standards by
certain deadlines.
The significance of this positive change in the direction of the program
emerges in sharp relief when we consider that in January of 1970, only four
communities were in the program; seven years later (1977) there were over
15,600 flood-prone communities that had adopted minimum floodplain management
standards to gain eligibility for flood insurance and the long-sought federal
financial assistance. At that time, about 97% of the structures in the
nation's floodplains were eligible for coverage under the program.
At issue with the 1973 Act was the problem of administering the program
with increased numbers, and the fact that the mandatory requirements brought many legal challenges and a demand for more specificity in the land use
criteria, hydraulic and hydrologic procedures, and field surveys for mapping.
In response to these problems, the Federal Insurance Administration proceeded
to standardize its processes and revamp its regulations. These proposed
changes were published in The Federal Register on January 21, March 26, and
June 3, 1975. After all comments had been reviewed and evaluated, the final
regulations were published on October 20, 1976.
E. O. 11988
The impact of the revised regulations were further enhanced in February of
1978 whe~ Lhe U. S. Water Resources Council published guidelines to federal
agencies for the implementation of Executive Order 11988--Flood Plain
Management Guidelines. The Guidelines required that all federal agencies use
the floodplain standards established by the Federal Insurance Administration in
preparing their procedures for compliance.
The new E. O. directed federal agencies to avoid floodplains unless it was
the only practicable alternative. If it could not be avoided, the objectives
of the National Flood Insurance Program would be used. For the first time, a
set of standards was adopted for universal use by the federal agencies. This
was a major breakthrough in "bureaucratic red tape" and gave the Federal
Insurance Administration the national recognition it deserved.
Technical Issues
As stated previously, the National Flood Insurance Program affected all levels of government, often causing conflicts of standards and policies for regulation. The following is a brief history of the evolution of the more
190 APPROACHES TO r~ITIGATION
critical technical standards that had to be accepted at all levels of govern
ment. 100-Year Flood
When the Congress created the NFIP, it mandated that flood hazard areas
would be identified, but did not establish the definition of a "flood." There
fore, the Federal Insurance Administration, with the assistance of the University of Chicago, invited experts in the field to a national symposium in
December of 1968. As chairman of the New England River Basins Commission Task Force on Flood Plain Management, I was invited to participate and was assigned
to a committee to recommend hydrologic standards for the identification of
flood-prone areas and their eventual regulation. Prior to the symposium, the
federal agencies such as the Corps of Engineers, TVA, U.S. Geological Survey,
SCS, and Weather Service had been using varying standards based on their indiv
idual aSSigned missions. Those standards varied from a 50-year flood (USGS) to
a lO,OOO-year flood (TVA).
After extensive deliberation, the committee recommended that the 100-year
flood would be a reasonable level to use in identifying flood-prone areas. It
was considered to be large enough to identify a serious problem area which is
normally beyond the imagination of most of the local people, but was not catas
trophic and could readily be exceeded. There was insufficient time for an
economic analysis, but the recommended level was a compromise that the commit
tee members could support. It was a compromise between extreme values of flooding, but most important it was a compromise between an individual's right
to develop his or her property and the public interest which must monitor the
disaster assistance costs associated with those decisions.
The lOO-year flood standard was accepted by the U.S. Senate Committee on Banking, Housing and Urban Affairs following hearings in 1973, and amended to
the National Flood Insurance Act in 1974. The mandatory requirement of partic
ipation in the NFIP as a condition of federal financial assistance in identi
fied flood hazard areas brought about many legal and technical challenges to
the adopted standard. It has continued to have general acceptance and has
proven economically prudent in most cases.
The economics of elevation versus the potential for damages or the high
cost of insurance was demonstrated in the FIA publication, Elevated Residential
Structures (1976). This conclusion was reinforced by the Corps of Engineers Hydrologic Engineering Center in its publication of 1978 entitled, Physical and

Lally 191
Economic Feasibility of Nonst~uctura1 Flood Plain Management Measures. The
examples shown demonstrate that costs are exceeded by benefits for all loca
tions, all flood hazard factors and all types of structures. Additional publi
cations by FIA and FEMA--F100dproofing of Small Commercial Buildings (1979),
Coastal Construction Manual (1981), and Elevating to Wave Crest Level (1981)-
all provide expanded methods for determining the magnitude of costs and bene
fits which justify elevating to the 100-year level.
Floodways
The issues of floodway determination, selection, regulation, and manage
ment are complex and therefore the least understood at the local levels of
government. These issues become much more critical when a community realizes
that development can actually be denied if the proposed location falls with a
"designated floodway." Thus the potential for litigation.
The floodway is a device to insure that once a 100-year flood elevation has been established for a riverine situation, subsequent development should
not cause an increase in that level in a recurrence of the 100-year storm analyzed. It is effective by reserving a portion of a floodplain closest to
the channel for general open space use. It assumes that the remainder of the
floodplain can become fully developed and full encroachment on the valley
cross-section will not result in an increase of more than one foot in elevation
for a recurrence of the design storm. The one-foot rule is intended to be a
maximum allowance in a compromise to permit development.
In terms of legal liability, it should be a "zero rise" so new development
cannot encroach and make the problem worse. However, recognizing the state of
the art of hydraulic computations, the one-foot allowance is reasonable assum
ing complete development in the entire cross-section of the floodway fringe
areas, which is an extreme supposition. Studies by the Corps of Engineers have
indicated that, on the average, full development of the flood fringe areas has
resulted in 0.5 foot increase in water surface elevation. This lower elevation
is due to the fact that floodway fringe development often includes street areas
and open spaces between buildings that act as supplemental floodways parallel
to the direction of the flow. It is recognized that in many small urban flood
plains, any downstream modification which creates a backwater problem could be subject to litigation.
The FIA regulations do not address this issue except to say that a maximum of one foot is allowable. However, the selection of a floodway is not a FIA

192 APPROACHES TO MIT! GAT! ON
decision, but a local planning decision constrained by FIA requirements. In
the planning process, the impact of new development on existing properties must
be a major consideration. The economic health of a community and the manner
and direction of projected growth are all part of the normal planning process
exclusive of flood-prone areas. Therefore, the floodway issue is an additional but very vital consideration. In an effort to minimize the possibility of
future litigation due to adverse impact of development, many states have estab
lished standards more restrictive than FlA. These lower allowances which FIA
has supported range from 0.2 to 0.5 feet.
The typical engineering analysis includes a procedure whereby both sides
of a stream must be treated equally to avoid the charges of bias or discrimina
tion in the planning decisions on permitting future development. An engineer
ing solution that has been supported legally is called an "equal conveyance"
method. This method, used by FIA and its contractors, attempts to establish
lines of equal hydraulic efficiency, which is a function of the physical char
acteristics of the embankments, thereby removing any political bias. This
generally results in the final floodway being centrally located in the flood
plain where the greatest depths of flooding and velocities are located. How
ever, there are other options for planning purposes where a meandering stream
does not have a well-defined channel, or perhaps pressure for growth is taking
place on one side of the river only. These require many alternate studies and
considerations and must withstand legal challenges before ~IA will accept oLher options. A "density floodway" concept is currently being considered to control
encroachment by establishing the degree of development without establishing
limits on location. This may have limited application, but may be the only
equitable solution to those desiring to occupy the floodplain. The engineering
and legal issues imply that it is complex but feasible.
Coastal Flood~ Most floodplain discussions center on river or watershed problems, yet a
significant amount of annual flood damage is due to coastal flooding, normally
the effect of wind-driven water associated with hurricanes, tropical storms,
and "northeasters" in the Atlantic and Gulf areas. On the Pacific coast, there
are severe storms. Flooding in large lakes may be a parallel situation. In the
above situations, elevating and floodproofing structures in ways similar to
those used in riverine areas are still valid solutions, provided the velocity
of moving water is considered as an additional factor. The designation "V
Lally 193
zone" is a reminder of that additional hazard. In these areas the 100-year
anticipated water level is also required. The original published maps by FIA included a still-water level which
reflected all of the dynamic forces except for the wind-generated waves.
However, the insurance rates assigned to these areas were increased with a
surcharge to reflect the potential of wave damage above the design level in a
recurrence of the 100-year storm. In 1980, FIA revised its policy and required
that the wave height effect be incorporated into the mandatory design level for
coastal structures. These issues are still being debated. Technically both
are good guidelines, with the inclusion of the wave height requiring more
specificity with location and proximity of other development. In either case,
they are intended to reflect a cost of occupancy in the coastal flood plain.
This cost of occupancy has not been a deterrent to development often considered
unwise in unstable coastal areas. In fact, the NFIP has been accused of
encouraging this development which accelerates the instability of the coastal
1 and forms. Coastal Barrier Islands
These unstable areas are most prevalent in coastal barrier islands, which consist of unconsolidated material and are subjected to significant wind and
wave energies. There has been much public debate over the last several years
about the negative impact of the NFIP on these coastal barriers. This public
outcry resulted in the Omnibus Budget Reconciliation Act of 1981 including a
provision amending the National Flood Insurance Act as follows:
Section 1321(a} No new flood insurance coverage shall
be provided under this title on or after October 1, 1983
for any new construction or substantial improvements of
structures located on undeveloped coastal barriers which
shall be designated by the Secretary of the Interior.
The impact of provisions of this legislation is difficult to project. It
only addresses flood insurance and not the various federal programs which
provide assistance to the development of the barriers infrastructure. Once the
infrastructure is in place, the areas will develop even without flood insur
ance. Hopefully the communities will continue to enforce stringent building codes.
From the standpoint of the National Flood Insurance Program, the greatest significance of the Omnibus Budget Reconciliation Act of 1981 is that it is the
194 APPROACHES TO tUTIGATION
first instance where a decision has been made to deny insurance in a particular
area. Denial of flood insurance is being used to deter and slow down develop
ment on undeveloped coastal barriers not simply due to the hazards but also to
preserve fish and wildlife habitat and unique and valuable natural areas. This
in itself represents a major change in direction and a conscious decision by
Congress to use the NFIP to achieve goals beyond merely idemnifying property owners from flood losses and getting communities to adopt and enforce sound
floodplain management regulation.
Shallow Flooding There are other types of flood conditions unrelated to, or not readily
associated with, channel flooding and flood profiles. These have been referred
to collectively as "shallow flooding." These include flows over alluvial fans
and over broad areas where channels or water courses are imperceptible, the
direction of flow or overflow is often indeterminable, and/or variable reliable
determinations of depth or extent of such flow by normal methods would be
expensive and time-consuming. These have loosely and inconsistently been
referred to as ·sheet flow,· ·sheet flow flooding,· and sheet flooding,· with
different meanings in various regions.
Flooding characteristics and depth vary between the types of shallow
flooding. Architectural and building practices vary with region of the coun
try. These differences, along with the possibility of sheet erosion or
increased velocities around corners of buildings, had lu be considered in
developing the necessary standards for damage reduction. The objectives are
well defined, but the translation of those objectives into descriptive language for the regulations has been the most difficult part of the management.
Mudslides and Erosion These two phenomena are being constantly debated as to their appropriate
ness in the NFIP. These are generally storm-related but their correlation with
a specific meteorological condition is difficult to establish. Hence the
controversy.
They are both the result of slope failure where soils became unstable from
saturation or wind-driven water. In the case of mudslides in California, they
have resulted in cases where loss in vegetation, due to a recent forest fire,
left the slopes vulnerable to the onslaught of winter rains. The soils become
unstable and slide, often burying structures with mud or carrying foundations
and buildings away to destruction. The development of actuarial rates becomes

Lally 195
very difficult. FIA has relied very heavily on local governments and their
experiences in developing the necessary management tools.
The problem of erosion is measurable over a period of time and therefore can be predicted. The question that FIA raises is: should the federal govern
ment provide a short-term role until the states involved develop management
procedures to minimize losses? There have been several attempts to repeal this
portion of the Flood Insurance Act, but the Great Lakes area representatives
have resisted the change.
Community ComRliance
When the NFIP was a voluntary program (1969-1973), community compliance
was easily achieved. Communities that saw the advantages of the program were
quick to provide the necessary documents and give assurances of enforcement. A
simple annual report was sufficient.
When the program changed direction and made insurance mandatory as a
condition of federal assistance in flood-prone areas, the FIA took on a
"policing" role to monitor communities and establish suspension procedures and rights of appeal. The increase in number of communities made individual inves
tigations an impossibility. Annual reports were formalized to be used as legal
documents with "spot checking" by personnel when abuses were reported or witnessed.
Much of the abuse reported early in the program was due to lack of under-
5Landing by the local enforcement officials. In many rural communities, the elected or assigned officials had not had previous experience in this type of
endeavor.
As discussed with reference to some of the earlier issues, this can be a
complex program in some areas, and monitoring is more a problem of education
and technical assistance than a policing effort. FIA has published many docu
ments to provide this help and has initiated extensive research to simplify the
procedures and requirements. The issuance of variances is the source of major
abuses by local officials. FIA has tried to establish policies on this proce
dure, but there are legal limitations. Currently, the states are being consi
dered as sources of talent to provide the necessary overview of the communities.
Role of the States When the National Flood Insurance Program was enacted in 1968, the states
were bypassed as an authority and the Federal Insurance Administration was

196 APPROACHES TO t1ITIGATION
authorized to operate directly with communities. This created many problems,
since the required land use regulations FIA was seeking from the community had
to be authorized by the state. However, it may have been the Congress' opin
ion that the states had failed to enforce their "police powers," and thereby
created the raid on the federal treasury.
In January of 1971, a quick survey was made of state land use control
activities that would benefit communities wishing to participate in the NFIP.
It was found that the states' involvement fell into five categories:
1) State establishment and enforcement of floodways, channel lines, and
encroachment lines (California, Connecticut, Maryland, New Jersey). 2) State establishment of Flood Plain Regulation Standards; mandatory
compliance within one year of data availability or state will enforce
(Minnesota, Nebraska, Wisconsin).
3) State establishment of Flood Plain Standards; local adoption
voluntary, but must meet standards. (California, Iowa, Kansas,
Michigan; North Carolina pending).
4) State programs providing for assistance only; enabling legislation
permitting local land use controls (Hawaii and Texas).
5) Enabling legislation only (most states).
Following this survey, inquiries were sent to all states inviting them to
establish a role for themselves in the administration of the NFIP and indicate
what standards they would recommend. In the absence of concrete responses, rIA
adopted the 100-year standard and the floodway requirements previously discus
sed. At a later date, FIA did agree to recognize those states whose standards
exceeded those published for the NFIP.
The publication of the regulations in October of 1976 put the states on
notice that they had to establish procedures for controlling the location and
design of state structures or structures built with state assistance. This
required states to be responsible for their own actions in floodplains and brought them into line with local requirements and federal actions. Most
states accomplished this by an executive order from the governor which was
followed by individual agencies promulgating their own regulations and proce
dures to meet the requirement.
Program Assessment
The objective of the NFIP is to find ways to decrease loss potential while
providing for the economic feasibility of continued and desired growth. Over-

Lally 197
restriction can be an economic waste, but under-regulation results in an unnec
essary social cost. Individual decisions are still permitted provided they do not impose costs on others. The NFIP has all the features to carry out the above objectives.
Unfortunately, some of the amendments to the program have benefited spec
ial interests, and hampered the program from achieving its full national bene
fit. It appears that some in the Congress do not fully comprehend what its
potential could be. The failure to provide funding to accelerate studies or
permit more community assistance reflects this attitude.
Also preventing the program from achieving a greater impact have been the
administrative decisions to reorganize assignments and staff for the responsi
ble department within FIA or FEMA. In all these changes, floodplain management
was relegated to a lower priority. However, that trend appears to be revers
ing. There were times that conflicts between the FPM regulations and the
Insurance Agents Manual created serious problems in the field. With the cur
rent reorganization, those conflicts should be resolved soon.
The present mechanism for requiring insurance on federally assisted mort
gages has many weaknesses, including poor monitoring. Some procedure should be found to establish the true costs of a potential disaster before a structure is
built. This must include some vehicle for financial relief at the time of the
disaster. Insurance appears to be the best mechanism to provide funding for a future need.
It should be understood that once a decision is made on bUilding in a
floodplain, the potential cost goes with that structure forever until a struc
tural change is made. The decision makers should not be permitted to disregard
those costs which the present loopholes allow. This is especially critical
where variances from the required standards have been granted. If the decision
to build in the floodplain includes a false sense of risk or financial hard
ship, the system should provide a mechanism of prepayment for flood insurance
over the "useful life" of the structure. This cost would be a construction
cost, no different than a cost for insulation or floodproofing. The cost would
be in7luded in the building or sale price and would not be separated from the
otherlmonthly costs of financing. With these prepaid costs identified, the
decision to build in a flood-prone area versus flood-free areas would be made
with all the facts at hand. Without this type of procedure, any variance granted would be ignoring the eventual public cost.

198 APPROACHES TO MITIGATION
The "prepaid insurance" concept would satisfy the requirement that development did not create a greater demand on the federal treasury. The only monitoring required under that concept would be development in a f100dway. The threat of litigation by upstream property owners should be sufficient to dis
courage major abuses in a f100dway.

PART THREE NATIONAL AND STATE ISSUES

This page
. IS
intentionally blank

A PROPOSED STRATEGY FOR A NATIONAL COASTAL DEVELOPMENT PLAN
Marguerite M. Whilden Maryland Water Resources Administration
Introduction
Our nation's coastal conservationists had high hopes for the Coastal
Barriers Resources Act (CBRA) as a means to limit coastal development in a
comprehensive manner. CBRA provides for wildlife habitat preservation and
minimizing the wasteful expenditure of revenues by curtailing federal invest
ment on identified undeveloped coastal barriers. However, eliminating federal
financial incentives may not achieve the desired level of environmental protec
tion and hazard mitigation that Congress intended for these vulnerable coastal
areas. Although the CBRA states that: "A program of coordinated action by
Federal, state, and local governments is critical to the more appropriate use
and conservation of coastal barriers," such a program does not exist.
Our coast is a national resource that should be protected against excessive exploitation. The federal effort initiated by CBRA should be expanded
through the establishment of a National Coastal Development Plan which is considerate of 1) developed and undeveloped barriers and adjacent mainland
areas; 2) natural interdependent coastal processes and capacities; 3) state and
local economies; and 4) the private investor. Such a National Coastal
Development Plan would rely on a quota system, individual state participation, and voluntary plan enforcement.
The Coastal Barrier Resources Act
The Coastal Barriers Resources Act (CBRA) and the Department of Interior's
report to Congress were important first steps in establishing a comprehensive
federal policy for the nation's coastal barrier system. However, without
additional cooperative federal and state incentives and disincentives, con
tinued piecemeal development will continue on the nation's developed, partially
developed, and undeveloped barrier resources.
CBRA and its accompanying studies provide an excellent basis for further-

202 NATIONAL AND STATE ISSUES
ing national and state policies and initiatives which will:
1) Establish more specific guidelines for developing and conserving both
developed and undeveloped coastal resources,
2) Encourage cooperation among coastal states, and
3) Provide federal and state financIal incentives for both barrier
resources and possibly non-barrier resource areas in coastal states
to make barriers less vulnerable to flood and ecological
catastrophes, and less of a liability to taxpayers through careful
coastal development and greater use of open space.
Despite its strengths, CBRA will not halt development of undeveloped
barriers, nor will it, in its present form, deal with the problems of developed
or semi-developed barriers. It is, at best, a "negative" planning act with a
relatively weak implementation mechanism as long as there is sufficient private
funding for new development. The interdependencies between developed and
undeveloped barriers have not been recognized by CBRA. Nor is there any effort
to balance development and conserVation needs except by endorsing the status quo.
Determining appropriate levels of additional development and redevelopment
for undeveloped, semi-developed, and developed barrier resources and guiding
public and private actions consistent with such levels will not be easy; how
ever, more definitive procedures and implementing mechanisms are badly needed.
For starters the following could be considered for establishing such develop
ment levels:
1) Health and safety considerations for individual barriers such as
evacuation capacity during time of hurricane, ground water supplies,
and sewage disposal capability,
2) Ecological considerations for not only the individual barriers but
the entire regional barrier, estuarine, and marine system including
wetlands, littoral zone, and dune systems,
3) Existing development on the entire system within the state, and
Whilden
4)
203
Economic considerations for the barrier system as a whole in the
state and/or region including need for fishing ports, future
residential development for tax base considerations, fuel
exploration, etc.
From a federal and statewide perspective, the whole regional system must
be considered in establishing policies for individual barriers. This will
require inputs from all levels of government. A Coastal Conservation Quota
In spite of the many problems in establishing quotas, such an approach is
one of the few viable ways to consider when managing coastal growth. A Barrier
Resources Coastal Conservation Quota could be established for each state which
would reflect a variety of factors and inputs from all levels of government,
and from social and scientific disciplines. A coastal conservation quota would
be jointly established by the states and federal government and apply to devel
oped, semi-developed, and undeveloped barrier resources. It would be implemen
ted through a broad range of measures--not simply federal subsidies for the
barriers themselves.
A quota system could reflect the realities and benefits of economic devel
opment as well as environmental protection. Based upon total barrier resource
system acreage, barrier characteristics, and other factors, a development limit
in the state might be set for each state with flexibility as to how this quota
would be achieved (i.e., condominiums, industrial development). The incentives to develop barrier resources are much stronger than those incentives intended
to protect these coastal areas.
This nation is not adverse to using quotas, standards, or funding in order
to achieve social changes. However, such mechanisms have been called various things and generally depend upon voluntary state and/or local participation and
cooperation. Consider the 55-mile-an-hour national speed limit. States have
voluntarily set the maximum speed limit at 55 miles per hour on all state and county road systems, and must demonstrate that they are properly enforcing the
speed limit. States may increase the limit within their jurisdiction, but they
will most certainly lose federal transportation funds. In any event, the speed
limit program remains voluntary. The same may be said for certain affirmative
action programs.
The Coastal Conservation Quota system suggested here would be voluntary.
States which chose to participate and conserve a good portion of their coast

204 NATIONAL AND STATE ISSUES
would be compensated for the loss in revenue in other areas of the state
through federal funding. Those states which decide to exploit the coast to the
maximum extent in order to increase state and local revenues would suffer a
decrease in general federal funding. A Prototype
The tax and economic development benefits of barrier resource development
have not been adequately considered by previous coastal zone management
efforts. During the last decade (without major storms), many developed barrier
communities have been contributing significantly to the National Flood
Insurance pool, state property taxes, and other taxes.
Over the past twelve years, the Town of Ocean City in Maryland has paid a
conservatively estimated $3.7 million in flood insurance premiums. Since 1978,
$187,589 has been paid in claims to Ocean City residents. Ocean City has been
a moneymaker for the Federal Insurance Administration and the State of
Maryland, although this may not continue when a major northeaster or hurricane
strikes the area. Economically speaking, Ocean City is the third most import
ant city in the state. The 5.5 square-mile area which comprises Ocean City
supports an assessable base of over $.5 billion dollars, which is third only to the City of Rockville and Baltimore City--both physically larger cities. Other
revenues generated by Ocean City are equally impressive to the point that the
state of Maryland would realize a significant economic blow if the island
development were not there. In other words, it behooves the state to contri
bute to shore erosion protection measures and assist with the rebuilding after
an Ocean City disaster simply to protect the state economy. Compared to other
areas in Maryland, state and federal aid to the Ocean City area is next to
nothing.
Another interesting aspect of Maryland is that all of the state's coastal
barrier development is concentrated within a 5.5 square-mile area. The remain
ing portion of the 30-mi1e coast is total open space, state and federal park
land. The infrastructure serving the Ocean City area is concentrated along two
main accesses and in the immediate island and back bay area.
The state of Maryland has informally established a de facto conservation
quota of approximately 80% of its total barrier resources system. This conser
vation quota was made possible only through prudent state and federal acquisi
tion and management programs years ago. Such massive public funds are no longer available for acquisition purposes. Therefore, other states would need
Whilden 205
a companion policy to CBRA, relying on regulation and financial incentives to
achieve the purposes of minimizing loss of life, curtailing wasteful expendi
tures of federal revenues, and mitigating damages to coastal natural
resources.
fl~n Implementation
In coastal states, barrier resources are often viewed as a valuable commo
dity similar to oil, natural gas, and minerals. It is not inconsistent with
established state resource policies to set limits on exploitation of such resources. Assuming that adequate criteria and a federal/state process were
developed for establishing conservation and development quotas, how would such quotas be implemented? Three steps might be followed.
First, a coastal conservation quota would be established for each state.
Such a quota would consider the natural capacity of the barrier system to
support development, acreage in the system, the value of the environmental resources on the barriers, economic development potential, and the level of
development which could be tolerated before the barrier resource becomes a
financial liability to the state. High-density development on smaller islands
might be less of a liability than low-density development on larger islands
because of the extra miles of infrastructure and expense of evacuation. In
some cases, it may be best to encourage high-density development in specific
areas in order to leave remaining barriers free of development. For develop
ment areas, it may be preferable to choose a section of the barrier on which
all environmental concerns would be secondary to development concerns, and to
allow for optimum density with the condition that no other section of the
barrier would be disturbed. Second, a Coastal Development Plan would be developed for each state.
Federal agencies would assist states and local communities with the development
and implementation of such a plan. Similar to the assistance provided under the National Flood Insurance Program and the Coastal Zone Management Act, federal
and state agencies would cooperate technically and financially in the planning
process consistent with the conservation quota.
Third, all federal financial assistance appropriated for each coastal county with barrier resources would be conditional upon proper implementation
of the Coastal Development Plan. For example, if the City of Wilmington
applied for federal urban renewal funds, a clearing house system similar to
E.O. 11988 could reveal whether coastal conservation measures were in order,

206 NATIONAL AND STATE ISSUES
and funds would be distributed only after a satisfactory finding. It is also suggested that perhaps non-coastal federal financial assistance
and flood insurance should be conditioned upon each state and local government's proper management of its coastal barriers. It is taking CBRA considerably farther and making the entire state dependent upon prudent use of the coast.
GREENHOUSE EFFECT AND SEA LEVEL RISE
James G. Titus Environmental Protection Agency
Introduction
Most of our discussions and policies address flood losses as acts of God. There is a certain probability that the forces of nature will combine to create a flood from a storm surge or rainfall. Because we cannot predict where or when the next major storm will strike, we tell everyone in a certain area that there is a certain probability that a storm will strike them, and we ask them to plan accordingly. Although there are some notable examples of people disregarding the risk of a serious storm, policies have moved a long way toward addressing the risk of flood losses.
The papers by Groat, Gagliano, Edmonson, Pilkey, and others in this volume address a different aspect of the problem: the loss of land. Even though the loss of land is more predictable than the occurrence of a storm, our flood prevention policies often ignore the future increase in flood damages resulting from this factor. In Louisiana, for example, where the loss of 50 square miles per year will almost certainly make many developed areas extremely vulnerable in the next 30-40 years, no one has even estimated the flood claims that can be expected in the year 2015 if present trends continue.
In the coming decades, most of the U.S. coast may be experiencing rates of land loss similar to the current Louisiana situation. Increasing concentrations of carbon dioxide and other gases are expected to cause a global warming that could raise sea level several feet in the next century and one foot in the next 30-40 years. This paper discusses the basis for expecting a rise in sea level and
the implications for strategies to prevent land loss in Louisiana. l
1 For a comprehensive review of the implications of sea level rise, see Barth, M.C. and J.G. Titus (Eds.), 1984. Greenhouse Effect and Sea Level Rise: A Challenge for This Generation. New York: Van Nostrand Reinhold.
208 NATIONAL AND STATE ISSUES
Sea Level Rise and the Greenhouse Effect
A planet's temperature is determined primarily by the amount of sunlight it
receives, the amount of sunlight it reflects, and the extent to which its atmosphere retains heat. When sunlight strikes the earth, it warms the surface,
which then radiates the heat as infrared radiation. However, water vapor, carbon dioxide, methane, chlorofluorocarbons and other gases in the atmosphere absorb
some of the energy rather than allowing it to pass undeterred through the
atmosphere to space. Because the atmosphere traps heat and warms the earth in a
manner somewhat analogous to the glass panels of a greenhouse, this phenomenon is generally known as the "greenhouse effect."
Since the industrial revolution, the combustion of fossil fuels, deforestation, and cement manufacture have released enough CO 2 into the
atmosphere to raise the atmospheric concentration of carbon dioxide by 20 percent (Hoffman, 1984). Energy experts generally expect the concentration of CO2 to
double in the latter half of the 21st century, and the concentration of all
greenhouse gases is expected to double by 2050, perhaps sooner. Because the extent to which these gases absorb infrared radiation is well-established, Hansen
et al. (1984) calculate that a doubling would directly raise the earth's average temperature 1.2°C if nothing else changed, an estimate that is universally accepted by physicists and climatologists.
The direct effect of the doubling of greenhouse gases would most likely be amplified, however, because of the effect on other climatic factors. For example,
a warmer atmosphere would retain more water vapor, also a greenhouse gas, and snow
and floating ice would retreat, decreasing the extent to which sunlight is
reflected into space, thus causing an additional warming. After evaluating all of
the evidence, two National Academy of Sciences (NAS) panels concluded that the
eventual warming from a doubling of greenhouse gases would be 1.5 to 4.5°C (3_8°F)
(Hoffman, Keyes, and Titus, 1983).
A global warming of a few degrees and the resulting expansion of sea water
could be expected to raise sea level by one-half meter in the next century.
Mountain glaciers, which have retreated in the last century, could melt and
Titus 209
release enough water to raise sea level 12 centimeters (5 inches) (Revelle, 1983). Antarctica could contribute to sea level rise either by meltwater running
off or by deglaciation (ice discharge); however a complete deglaciation of the
west antarctic ice sheet would take several centuries (Bentley, 1983; Hughes,
1983). Revelle estimates that a 3°C warming could cause Greenland's glaciers to
melt enough water to raise the sea another 12 centimeters in the next century and
that the combined impact of thermal expansion and melting of Greenland and
mountain glaciers could raise sea level 70 centimeters (2 and 1/3 feet) in the
next century (Revelle, 1983). Although Revelle stated that Antarctica could
contribute two meters per century to sea level starting around 2050, he declined
to add this contribution to his estimate.
In a report by the U.S. Environmental Protection Agency (EPA) entitled
Projecting Future Sea Level Rise, Hoffman, Keyes, and Titus (1983) stated that the
uncertainties regarding the factors that could influence sea level are so numerous
that a single estimate of future sea level rise is not possible. Instead, they
consulted the literature to specify high, medium, and low estimates to account for
all of the major uncertainties, including fossil fuel use; the portion of carbon
dioxide that remains in the atmosphere; future emissions of trace gases; the
global warming that would result from a doubling of greenhouse gases (the NAS
estimate of 1.5-4.5°C); the diffusion of h~nt into the oceans; and the impact of
ice and snow. Figure 1 illustrates the EPA and NAS estimates.
Implications for Louisiana
A rise in sea level from the greenhouse effect would accelerate the loss of
wetlands that Louisiana is experiencing today. Marsh drowning and saltwater
intrusion would both increase. The required time for Terrebonne Parish to convert
to open water, for example, would be reduced from 100 to 60-75 years, if no action
is taken. The local government there has developed a 25-year construction plan to
help restore natural processes and curtail wetland loss. Given the long lead time
necessary for gaining a public consensus on the public works that may have to be
built or modified, decisions that local officials might like to delay until 2020
will probably be necessary within the next ten years.
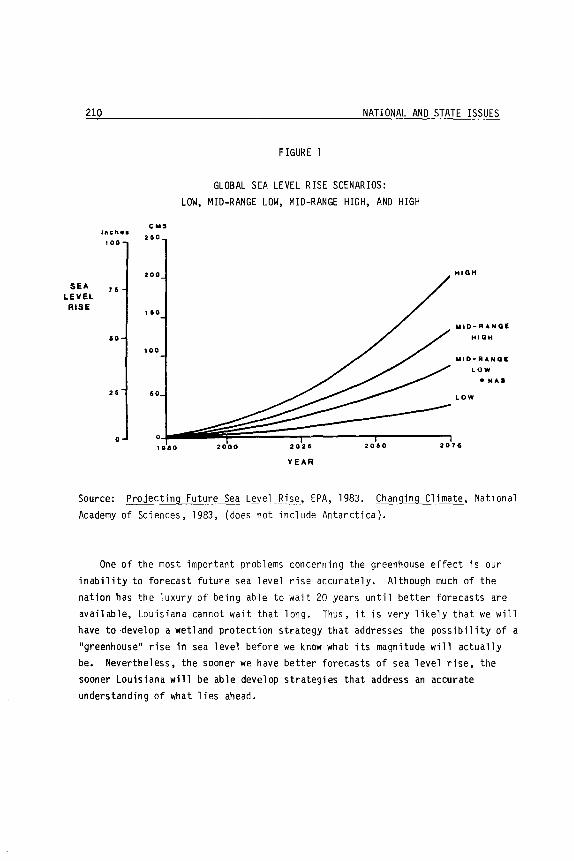
210
e .. s Inl;" ••
250 ,00
200
SEA 75 LEVEL RISE
150
50
'00
25 50
0 1810
NATIONAL ANO STATE ISSUES
FIGURE 1
GLOBAL SEA LEVEL RISE SCENARIOS: LOW, MID-RANGE LOW, MID-RANGE HIGH, AND HIGH
2000 2026 2060
YEAR
HIGH
.. ID-RANGE
HIGH
WID-RANGE
LOW
• HAS
LOW
2076
Source: Projecting Future Sea Level Rjse, EPA, 1983. Changing Climate, National Academy of Sciences, 1983, (does not include Antarctica).
One of the most important problems concerning the greenhouse effect is our inability to forecast future sea level rise accurately. Although much of the nation has the luxury of being able to wait 20 years until better forecasts are available, Louisiana cannot wait that long. Thus, it is very likely that we will have to ·develop a wetland protection strategy that addresses the possibility of a "greenhouse" rise in sea level before we know what its magnitude will actually be. Nevertheless, the sooner we have better forecasts of sea level rise, the sooner Louisiana will be able develop strategies that address an accurate understanding of what lies ahead.
Titus 211
The most fundamental threat to any government is the possibility that its land will be taken away. In response to current trends, local governments and the
State of Louisiana have initiated a level of effort unprecedented in the history
of environmental protection. The Louisiana Legislature created a $35 million
Coastal Protection Trust Fund to research, develop, and demonstrate methods to
slow coastal erosion. Local governments have also appropriated millions of
dollars and have been joined by private landowners such as Texaco and Tenneco
LaTerre. Terrebonne Parish has initiated a public awareness campaign that
includes billboards, pamphlets, slide shows, and its secondary school curriculum
(Edmonson, this volume).
Although there are many uncertainties surrounding the issue of future sea
level rise, we feel that two recommendations are appropriate. First, the state
must take a more active role to ensure that the research necessary to accurately
forecast sea level rise is undertaken in a timely manner. If coastal interests
ignore the issue of future sea level rise until conclusive predictions are
available, the predictions may never become available; the substantial increase in
basic research that is necessary will not take place until the people who need the
information start to make that need clear.
Secondly, the state must recognize th~t it will prob~hly have to make major
decisions before the verdict is in, even if an acceleration in research does take
place. We will probably not have accurate forecasts of future sea level rise
before 1995; action to address land loss will be necessary before then. In the
meantime, it would be very unwise to assume that a rise in sea level will not take
place. Instead, our policies should be based on the fact that we do not know what
will happen. This will require assessing the consequences of particular actions
if the sea does rise and if it does not.
It would be nice if we could ignore this issue until it is proven, but
certainty is not always possible. Like financial markets, we should follow the
principle of using all available information and treat sea level rise as a risk to
be recognized. The fact that the future is unknown does not mean that we cannot
have confidence in policies that leave us better prepared for what could happen.

212 NATIONAL AND STATE ISSUES
References
Bentley, L. 1983 "The West Antarctic Ice Sheet: Diagnosis and Prognosis." In U.S.
Department of Energy, Proceedings: Carbon Dioxide Research Conference: Carbon Dioxide, Science, and Consensus, DOE Conference 820970 Washington, D.C.: U.S. Department of Energy.
Hansen, J.E., A. Lacis, D. Rind, and G. Russell 1984 "Climate Sensitivity to Increasing Greenhouse Gases." In Barth, M.C.
and J.G. Titus, Eds. Greenhouse Effect and Sea Level Rise: A Challenge for This Generation. New York: Van Nostrand Reinhold.
Hoffman, J. S., D. Keyes, and J. G. Ti tus 1983 Projecting Future Sea Level Rise. Washington, D.C.: Government
Printing Offi ce.
Hoffman, J.S. 1984 "Estimates of Future Sea Level Rise." In Barth, M.C. and J.G. Titus.
Hughes, T.
Greenhouse Effect and Sea Level Rise: A Challenge for This Generation. New York: Van Nostrand Reinhold.
1983 "The Stability of the West Antarctic Ice Sheet: What Has Happened and What Will Happen." In U.S. Department of Energy, Proceedings: Carbon Dioxide Research Conference: Carbon Dioxide, Science, and Consensus, DOE Conference 820970 Wash,ngton, D.C.: U.S. Department of Energy.
Revell e, R. 1983 "Probable Future Changes in Sea Level Resulting From Increased
Atmospheric Carbon Dioxide." In National Academy of Sciences, Changing Climate. Washington, D.C.: NAS Press.

SEA LEVEL RISE AND SUBSIDENCE IN COASTAL LOUISIANA
Karen E. Ramsey
Thomas F. Mos 1 ow
Shea Pen 1 and
Louisiana Geological Survey Coastal Geology Program Baton Rouge, LA 70893
Introduction
The major impact of relative sea level (RSL) in Louisiana is: 1) land loss within the wetlands and marshes and 2) erosion of beaches and barrier islands along the shorel ine. However, the exact role sea level rise plays in the nature and severity of land loss and coastal erosion remains unresolved. This question is most important to wetland managers and coastal planners in assessing the future existence of southern Louisiana's coast~ zone.
A number of depositional environments are represented within the 26 million sq. km of coastal wetlands in southern Louisiana. The most common environments are the coastal marshes which account for 40% of all coastal wetlands in the United States (Gosselink, 1980; Davis, 1983). The coastal wetlands are flat, low lying areas with average elevations of less than 1 m and are being converted to open water bays or lagoons at a progressive geometric rate exceeding 101 sq. km per year (Gagliano et al,1981). Louisiana faces the most critical barrier shoreline erosion problem in the United States due to relative sea level rise upon which storms and man's activities are superimposed accelerating the problem (Penland and Boyd 1982).
Data Analysis
Eighty-one tide gauge stations, maintained by the Army Corp of Engineers (ACE) and National Oceanic and Atmospheric Administration (NOAA) (Fig. 1), and several kilometers of historical leveling data have been analyzed in this study for the purpose of determining the history of recent sea level rise in coastal Louisiana.
Yearly means have been calculated for 20 tidal stations with continuous records from
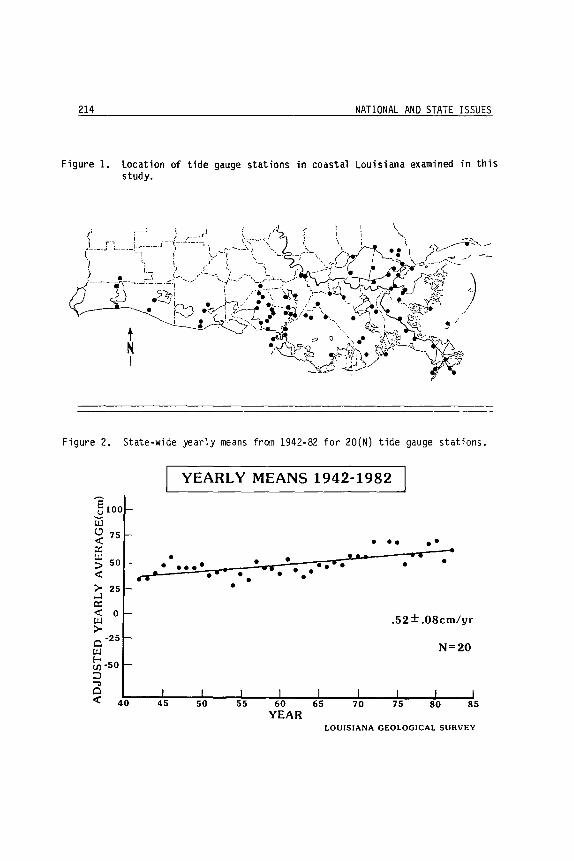
214 NATIONAL AND STATE ISSUES
Figure 1. Location of tide gauge stations in coastal Louisiana examined in this study.
Figure 2. State-wide yearly means from 1942-82 for 20(N) tide gauge stations.
E 100 u i:U <.:) 75 <X: e::: ~ 50 <X:
>- 25 ...J e::: <X: 0 UJ >-0-25
UJ
1;; -50 ::> "':)
YEARLY MEANS 1942-1982
• • •••• • .,' ....
•
.. ... .i •••••••
•
• ••
• •• •• -•
.52 ± .08cm/yr
N=20
o <X: 4~0----~--~~--~~--~--~~--~----~--~~--~·
LOUISIANA GEOLOGICAL SURVEY
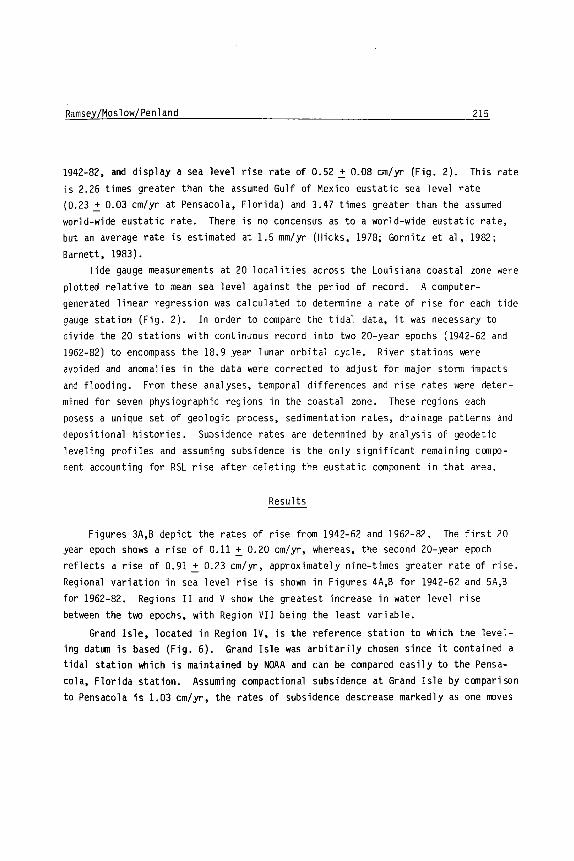
Ramsey/Moslow/Penland 215
1942-82, and display a sea level rise rate of 0.52 ~ 0.08 cm/yr (Fig. 2). This rate
is 2.26 times greater than the assumed Gulf of Mexico eustatic sea level rate (0.23 ~ 0.03 cm/yr at Pensacola, Florida) and 3.47 times greater than the assumed
world-wide eustatic rate. There is no concensus as to a world-wide eustatic rate, but an average rate is estimated at 1.5 mm/yr (Hicks, 1978; Gornitz et al, 1982;
Barnett, 1983). Tide gauge measurements at 20 localities across the Louisiana coastal zone were
plotted relative to mean sea level against the period of record. A computer
generated linear regression was calculated to determine a rate of rise for each tide gauge station (Fig. 2). In order to compare the tidal data, it was necessary to divide the 20 stations with continuous record into two 20-year epochs (1942-62 and 1962-82) to encompass the 18.9 year lunar orbital cycle. River stations were
avoided and anomalies in the data were corrected to adjust for major storm impacts
and flooding. From these analyses, temporal differences and rise rates were determined for seven physiographic regions in the coastal zone. These regions each posess a unique set of geologic process, sedimentation rates, drainage patterns and
depositional histories. Subsidence rates are determined by analysis of geodetic leveling profiles and assuming subsidence is the only significant remaining component accounting for RSL rise after deleting the eustatic component in that area.
Results
Figures 3A,B depict the rates of rise from 1942-62 and 1962-82. The first 20 year epoch shows a rise of 0.11 ~ 0.20 cm/yr, whereas, the second 20-year epoch reflects a rise of 0.91 ~ 0.23 cm/yr, approximately nine-times greater rate of rise.
Regional variation in sea level rise is shown in Figures 4A,B for 1942-62 and 5A,B for 1962-82. Regions II and V show the greatest increase in water level rise
between the two epochs, with Region VII being the least variable.
Grand Isle, located in Region IV, is the reference station to which the leveling datum is based (Fig. 6). Grand Isle was arbitarily chosen since it contained a tidal station which is maintained by NOAA and can be compared easily to the Pensa
cola, Florida station. Assuming compactional subsidence at Grand Isle by comparison to Pensacola is 1.03 cm/yr, the rates of subsidence descrease markedly as one moves
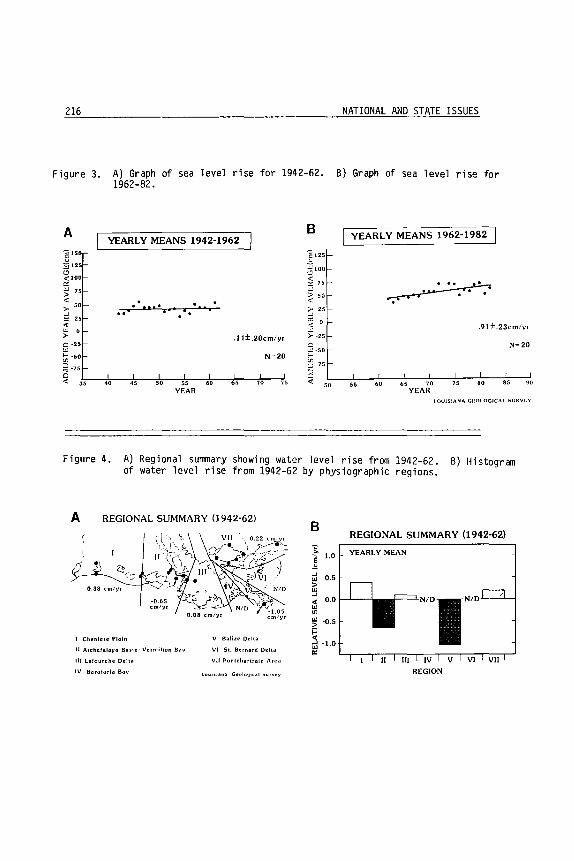
216
Figure 3. A) Graph of sea level rise for 1942-62. 1962-82.
A
"B 150
t;J 125 r.:> <100
~ 75
'" > 50 ..J 0: 25
'" CJ 0 > Cl -25 OJ ~ -50
~.7S
[YEARLY MEANS 1942-1962
. • ...••• .e,
.11±.20cm/yr
N=20
C .L-__ ~ __ ~~ __ ~ __ ~ __ ~~~~ __ ~ __ ~, -< 35 40 45 50 55 60 65 70 75
YEAR
B
2125 c a 100
< '" 75
:; 50 < > 25
~ 0
:; -25
::: -50
'!:. -75
50
NATIONAL AND STATE ISSUES
B) Graph of sea level rise for
YEARLY MEANS 1962-1982
.. ~ ~ .*.
.91 ±.23cm/yr
N=20
55 60 65 70 75 80 85 90
YEAR LOUISIANA GEOLOGICAL SURVEY
Figure 4. A) Regional summary showing water level rise from 1942-62. B) Histogram of water level rise from 1942-62 by physiographic regions.
A REGIONAL SUMMARY (1942-62)
I Chenlere Plain
II Alchafalaya 8asln! Vermilion Bay
III Lafourche Delta
IV Baralaria Bay
V Balin Della
VI 51. Bernard Delta
VII Ponlcharlrain Area
louhlana Geological Survey
B REGIONAL SUMMARY (1942-62)
REGION
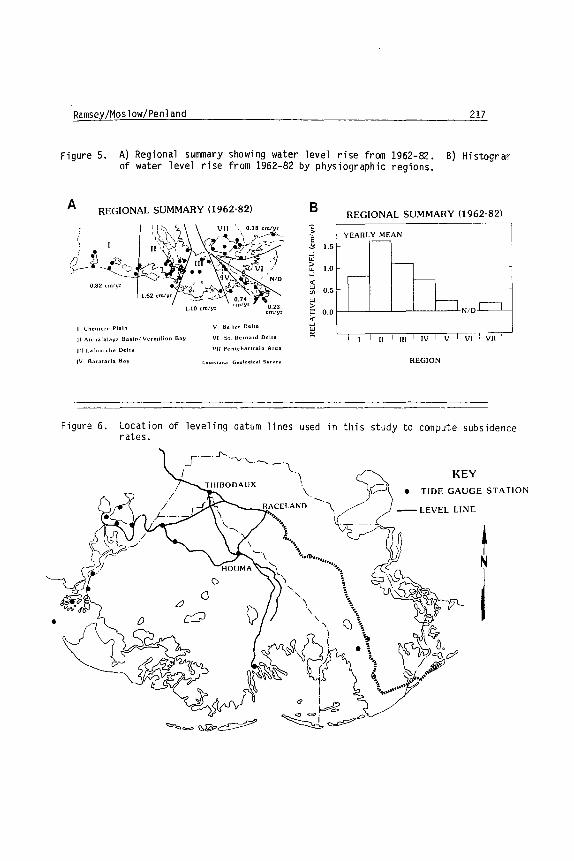
•
Ramsey/Moslow/Penland 217
Figure 5. A) Regional summary showing water level rise from 1962-82. of water level rise from 1962-82 by physiographic regions.
B) Histogram
A REGIONAL SUMMARY (1962-82)
~.
I Clu'nicre Plain V BaJizc Delta
II AlchafaJaya Basinl Vermilion Bay VI SI. Bernard Ddla
III Lafourche Delta VII Ponlcharlrain Area
IV Barataria Bay louisiana GeologIcal Su." .. y
B
>-
~ 1.5 ..J
"' r;; \.0 ..J
'" "' 'J)
"' ::-i=
'" ..J
"' 0:
REGIONAL SUMMARY (1962-82)
YEARLY MEAN
III IV V VI VII
REGION
Figure 6. Location of leveling datum lines used in this study to compute subsidence rates.
KEY
\.. • TIDE GAUGE STATION '--.
"\ -- LEVEL LINE
I
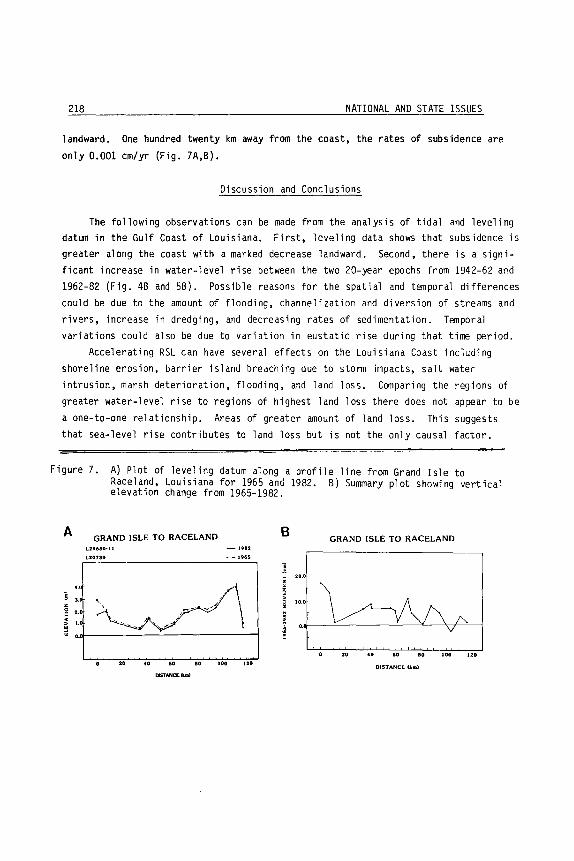
218 NATIONAL AND STATE ISSUES
landward. One hundred twenty km away from the coast, the rates of subsidence are
only 0.001 cm/yr (Fig. 7A,B).
Discussion and Conclusions
The following observations can be made from the analysis of tidal and leveling datum in the Gulf Coast of Louisiana. First, leveling data shows that subsidence is greater along the coast with a marked decrease landward. Second, there is a significant increase in water-level rise between the two 20-year epochs from 1942-62 and 1962-82 (Fig. 48 and 58). Possible reasons for the spatial and temporal differences could be due to the amount of flooding, channelization and diversion of streams and rivers, increase in dredging, and decreasing rates of sedimentation. Temporal variations could also be due to variation in eustatic rise during that time period.
Accelerating RSL can have several effects on the Louisiana Coast including shoreline erosion, barrier island breaching due to storm impacts, salt water intrusion, marsh deterioration, flooding, and land loss. Comparing the regions of greater water-level rise to regions of highest land loss there does not appear to be
a one-to-one relationship. Areas of greater amount of land loss. This suggests that sea-level rise contributes to land loss but is not the only caus~ factor.
Figure 7. A) Plot of leveling datum along a profile line from Grand Isle to Raceland, Louisiana for 1965 and 1982. 8) Summary plot showing vertical elevation change from 1965-1982.
A GRAND ISLE TO RACELAND B GRAND ISLE TO RACELAND
L24680·11 -1982
L20730 - - 1965
20.0
2. •• 6 • 10 100 120
2. •• 6. 80 100 120 DISTANCE (km)
oosr",."" ....

Ramsey/Moslow/Penland 219
References
Barnett, T. P. 1984 "The Estimation of 'Global' Sea-level Change: A Problem of
Uniqueness". Journal of Geophys ical Research 89 (September): 7980-7988
Davis, D.W. 1983 "Economic and Cultural Consequences of Land Loss in Loui s i ana". Shore
and Beach 51 (4). p. 7980-7988.
Gagliano, S.M. et al 1981 "Land Loss in the Mississippi River Deltaic Plain" Gulf Coast
Association of Geological Societies Transactions. 31 p. 295-300.
Gornitz, V.S., et al 1982 "Global Sea-Level Trend in the Past Century". Science. 215. p. 1611-
1614.
Hicks, S.D., and Crosby, J.E. 1974 "Trends and Variability of Yearly Mean Sea-Level 1983-1972". Nation~
Oceanic and Atmospheric Administration, Tech Memo. NOS 13.
Hicks, S.D., et a 1 1983 "Sea Level Variations for the United States - 1855-1980". National
Oceanic Atmospheric Administration, U.S. Dept. of Commerce. 170 pgs.
Penland, S. and Boyd, R. 1982 "Assessment of Geological and Human Factors Responsible for Louisiana
Coastal Barrier Erosion". Proceedinqs of the Conference on Coast~ Erosion and Wetland Modification in Louisiana: Causes, Consequences, and options. U.S. Fish and Wildlife Service, Biological Services Program FWS/OBS-82/59. p. 14-38.
Acknowl edgements
This study was conducted as part of a regional investigation of statewide trends in subsidence, land loss and sea level rise in coastal Louisiana. Funding for this study was provided by the Act 41 Coastal Environmental Protection Trust Fund through the Louisiana Geological Survey and also by the Terrebonne Consolidated Government (LSU Contract No. 137-50-4108). Karen Westphal and Carol Terry are acknowledged for their cartographic skills. Laree Lejune and Robin Sanders helped compile the summaries of historical tide gauge and leveling data and were invaluable to the completion of this study.
LOCAL GOVERNMENT INVOLVEMENT IN COASTAL PROJECTS' FLOOD HAZARD REDUCTION
James B. Edmonson Terrebonne Parish Council Staff
Houma, Louisiana
Introduction
Although Terrebonne Parish lies near the terminus of North America's largest river system, its flood problems are caused by coastal deltaic proces
ses. The channelization of the Mississippi River has contributed to the accel
erated destruction of the deltaic plain. The combined influences of subsid
ence, sea level rise, and erosion have forced the Parish to address two types
of flood hazard reduction: protection of homes, businesses and infrastructure;
and protection of estuarine habitats. Regional flood hazards include tidal,
backwater, and runoff flooding, and saltwater intrusion. To protect itself,
the Parish has adopted a multi-faceted floodplain management program. Program
activities include research, public education, construction, and management.
The lack of a state-implemented coastal management and protection program
has made the Parish realize it has to undertake the management of its barrier
islands and wetlands itself. We further understand that these management plans
need to go beyond the land use regulatory nature of CZM to a long-range, capi
tal-intensive maintenance and construction program.
Identification of the Problem
The disruptions in the natural cycles of Louisiana's deltaic plain have
produced extreme land loss problems for Terrebonne Parish. Over a 23-year
period from 1955-1978, it was documented that Terrebonne Parish lost 15% of its
land area and 42% of its barrier islands to subsidence, erosion, and sea level
rise (Wicker, et al., 1980). At these rates it is calculated that all of Terrebonne's erodible land will be gone in 98 years.
As erosional forces continue unchecked, flood hazard reduction measures
become increasingly important not only for the protection of infrastructure,
but also for the protection of valuable estuarine habitats. As the sea contin
ues to encroach upon the mainland, natural drainage patterns are affected as

Edmonson 221
gradients are reduced. Reduced gradients, tides, and winds cause extreme
backwater flooding problems in many areas of the Parish. Rainfall in excess of 65" per year compounds this problem. The interdistributary basin floods first,
followed by the back side of the natural levee ridge. Bayous receive very little natural runoff.
With the continual breakup of the barrier islands and marsh ecosystems,
saltwater travels further northward during tropical storms and southerly winds,
further feeding the cycle of land loss, erosion and flooding. Saltwater intru
sion, flooding, land loss, subsidence, and sea level rise are interrelated.
When the people of Terrebonne Parish recognized this fact, we determined the
only long-term solution was to manage the total ecosystem including the barrier
islands and the wetlands. If the Parish can stabilize its land loss problem,
it will be able to lessen salt water intrusion and flooding.
Program Goals
After identifying its problems, Terrebonne Parish developed goals to
address the identified problems:
1) To develop additional facts about the barrier islands
and our marshes. 2) To draw public attention to the problems associated
with barrier island and marsh deterioration.
3) To develop and implement programs and plans for the
preservation and protection of Terrebonne's estuary. 4) To reduce the scope of damage to the barrier islands
through physical change.
Comprehensive Data Base
In the mid 197Ds, the Parish recognized that it had little information on
the subjects of shore erosion, subsidence, drainage, marsh preservation, and
restoration of its barrier islands. As a result, several habitat and barrier
island studies were conducted. The Parish is currently continuing the follow
ing studies to develop additional facts about its barrier islands and marshes:
1) Sand Resource Inventory
The gulf bottom around the coastline is being
investigated to locate sand resources for our barrier
islands.

222 NATIONAL AND STATE ISSUES
2) Marsh Valuation Study A study is being conducted to develop economic
valuations of Terrebonne Parish wetlands for input into the Corps' present studies and benefit/
cost ratio procedures. 3) Oyster Contamination Study
The oyster contamination study deals primarily with the question of the sources of sewerage or fecal contamination, and the methods used by health authorities in monitoring for fecal contamination.
4) Subsidence Study The subsidence study will classify the marsh and ridge lands as either stable, erodible, or accretional, and will aid the Parish with management and development decisions.
5) FEMA Appeal An appeal of FEMA's information base and methods for calculating FIRM projects is in process.
6) Sea Level Rise Study Marsh protection strategies will be analyzed
against sea level rise scenarios in an anticipated
upcoming study.
7) Master Drainage Plan A comprehensive parish-wide drainage plan is being
prepared.
8) Potable Water Supply Plan To determine the long-range (20 years) potable water supplies and distribution requirements, the Parish has prepared an engineering economic feasibility and capital improvement program.
Public Education
Last year Terrebonne Parish began a public education campaign in recognition of the fact that it would need full public cooperation and support in
order to combat all its problems with coastal erosion, land subsidence, sea level rise, saltwater intrusion, and flooding. The education program has a
Edmonson
number of facets: 1) Slide Presentations--Recently, the Parish produced
two slide shows on the environment and the economy.
2) Handouts--To supplement the slide shows, three
brochures were developed for distribution to the general public and the school students.
3) Posters--To convey the importance of preserving our
barrier islands and wetlands, a set of posters was
designed and printed.
4) Barrier Island Foundation--A foundation has been
formed to encourage and support the continuation of
efforts to preserve and protect the Parish and its
inheritance.
5) School Programs--The Parish government and the school
board developed and implemented an eighth grade
curriculum dealing with geology, erosional problems,
utilization of renewable and non-renewable resources,
and solutions.
Wetland Preservation
223
Terrebonne Parish has recognized that its wetlands have immense monetary and aesthetic value. Presently, Terrebonne's estuary produces over $30 million
per year in seafood and recreational income alone. The Parish is unwilling to
abandon its wetlands to the forces of nature. Therefore, plans and programs
are now being generated and/or implemented by both the public and private
sectors. Included in these programs is the maintenance of, and hazard mitiga
tion in, over 1,600 acres of wetlands within our present forced drainage sys
tem. The Parish is also preparing to construct salt water barriers to protect
the interdistributary basins. These levees will follow water courses such as
Bush Canal, Falgout Canal, and Lake Boudreaux. Water control structures will
also be installed at critical locations to control flooding and manage
habitats.
The overall scheme of wetland protection and flood hazard reduction incor
porates several rings of protection levees: one at the wetland-nonwetland
interface to protect infrastructure (present force drainage system), and one at
the wetland-gulf water interface to protect the estuary (proposed).

224 NATIONAL AND STATE ISSUES
Barrier Island Preservation
Terrebonne's barrier islands are its first line of defense against attacks
from the sea. If these islands are lost, it is predicted that Terrebonne's
land loss will accelerate geometrically, and increased flooding will follow.
The state of deterioration on the barrier islands of Terrebonne Parish is quite
dramatic. Specific erosion rates for the Isles Dernieres chain over a 25-year
period have been estimated at 33% of its total land area. Shoreline erosion
rates average 34' per year (Wicker et al., 1980).
Despite the various physical processes that are contributing to the loss
of the barrier islands, remedial measures can be taken to retard them.
Terrebonne Parish was the first to reconstruct 35 acres of barrier island in
the state of Louisiana. Our nonstructural/flexible structural approach will allow the islands to migrate. Eventually, the island will migrate northward
and abut the proposed levee, adding further toe protection. It is important to keep the overall integrity of the islands intact as they migrate. This does
not require massive dune construction measures. Conclusion
Terrebonne is fortunate that the extent of erosion caused by severe storms
has been minimal over the past several years, and that it has not been subjec
ted to the erosion forces of a major hurricane. However, if existing processes
continue unchecked, all of Terrebonne's wetlands will be gone in 75 years.
With the loss of the islands and the estuary, Terrebonne, Louisiana, and the
nation will lose billions of dollars in renewable resources and recreational
industries. In addition, the increased cost of hurricane and flood protection
will become staggering for the Terrebonne-Lafourche Metro area.
References Davis, D. W.
1983 Land Loss in Terrebonne Parish. Terrebonne Parish Police Jury, July.
1984 "Economic Cultural Consequences of Land Loss in Terrebonne Parish." Terrebonne Magazine, July.

Edmonson 225
Edmonson, J. B. and R. S. Jones 1984 "Terrebonne Parish Barrier Island and Marsh Management Program:
Executive Summary." Terrebonne Parish Government, September.
Maloze, W. 1984 "Memorandum on Saltwater Intrusion." Staff Report to Terrebonne
Parish Government, September.
Wicker, .T.S. et al. 1980 "Mississippi Deltaic Plain Region Habitat Mapping Study." United
States Fish and Wildlife Service, Report #FWS/OBS-79-07.
FLOOD INSURANCE STUDY REVISIONS: BLESSING OR CURSE?
Mark W. Headly
Dewbe rry & Da vi s
Introduction
This paper examines the Federal Emergency Management Agency's (FEMA) current
processes for maintaining the accuracy and usability of a community's Flood Insurance
Study. The paper is written from the perspective of a contractor to FEMA and, as
such, carri es no endorsement by FEMA.
Background
FEMA's current study effort is directed toward reaching the Congressionally
mandated goal of converting all flood-prone communities to the Regular Phase of
participation in the National Flood .Insurance Program. As the number of communities
entering this phase increases, FEMA's efforts will logically shift to maintenance,
that is, keeping the Flood Insurance Studies up to date.
Two alternatives are available to FEMA to update a community's Flood Insurance
Study: 1) Hire a contractor to generate new information and produce a restudy; or 2)
Revise the Flood Insurance Study via a map revision or map amendment based on com
munity-supplied information.
It is unlikely that a restudy program will ever receive as intensive a commit
ment of money and resources as has FEMA's current study effort. While it once may
have been envisioned that communities would be restudied every five years, this kind
of comprehensive maintenance program will be impossible under FEMA's current fiscal
constraints. Therefore, in order to achieve a maintenance program of any value, FEMA
must seek community support in sharing the responsibility for keeping studies up to date.

Headly 227
Why Flood Insurance Studies Become Outdated
In order to define the applications of the revision and restudy processes, the
reasons why a Flood Insurance Study becomes outdated must be examined. The hydro
logic and hydraulic impacts of development are by far the most common contributors to
making a Flood Insurance Study, or portions of it, obsolete. Channel modifications,
fill, and the construction of dams, levees, berms, bridges, and culverts affect the
validity of Flood Insurance Study analyses. Projects of these types are sometimes
built to protect existing development; however, they are most often constructed to
allow for new development.
The potential for development in a given area is another factor contributing to
the need for Flood Insurance Study revi s ions. Non-cons truct i on-gene rated revi s ion
requests may stem from the potential for development in a flood plain. For example,
requestors submitting a new hydraul ic analysis for a stream are often motivated to do
50 because they have new development plans that would be facilitated by the new
analysis. Two of FEMA's goals are to supply communities with the most accurate, up-to-date
Flood Insurance Studies possible and to maintain the accuracy of these Flood In
surance Studies over time, thereby providing the communities with the best bases for
making sound flood plain management decisions. The restudy process, which is cur
rently applied only to the most out-of-date Flood Insurance Studies, does not keep up
with development. It is more a means of catching up, rather than staying ahead.
Therefore, communities face a Catch-22 situation: development causes a Flood In
surance Study to become outdated, but they need an up-to-date Flood Insurance Study
to monitor the impacts of development. Thus, a periodic restudy plan is not appro
priate for most maintenance purposes. However, predicated on updating a study with
community-supplied information, the revision process can be an effective means of
keeping Flood Insurance Studies up to date. Clearly, it's a blessing!
Communities' and States' Roles in the Study Maintenance Effort
Communities must recognize that for the revision/amendment approach to Flood
Insurance Study maintenance to succeed, they must assume the responsibility of sup
plying FEMA with the new information. The responsible communities must then learn

228 NATIONAL AND STATE ISSUES
what type of information FEMA requires and what FEMA can accomplish toward study
maintenance with that information. The distinction should be made between map revisions and map amendments. ~
amendments were originally designed to remove structures that, due to graphical
limitations, were inadvertently included in the Special Flood Hazard Area from that
designation. To obtain a Letter of t~ap Amendment, an appellant must prove that his
structure is above the base flood elevation by submitting surveyor other topographic
infonnation to FEMA. Letters of Map Amendment have also been granted conditionally;
that is, a proposed structure as located on a grading plan could obtain a deter
mination that it would be above the base flood elevation if constructed as proposed.
The process has been corrupted over the years in that conditional Letters of Map
Amendment have been granted for structures proposed to be elevated above the base
flood elevation on fill. This practice will probably be discontinued in the future.
Map revisions are needed if any change in the base flood elevation is involved.
All of the construction-related flood plain modifications mentioned earlier, as well
as the non-construction-related development of new hydrologic or hydraulic analyses,
fall under the scope of map revisions. Map revisions are also granted conditionally,
by FEMA stating that if a project were constructed as designed, it would be cause for
a map revision. These conditional Letters of Hap Revision, or "belief letters," are
often needed by developers to obtain financing, construction permits, or buyers.
State flood plain managers can assist communities in working with FEMA in two
general areas: education and coordination.
Education
The appropriate State agency should be familiar with FEMA processes and require
ments for revisions and amendments to flood insurance maps. FEMA has published
several documents that detail the steps necessary to obtain a revision or amendment.
These documents are termed Conditions and Criteria and cover Map Revisions, Floodway
Revisions, and Letters of Map Amendment; the State agency should have a supply of
these available for distribution. FEMA spends a substantial amount of time and
effort responding to and educating individuals who are not aware of the revision/
amendment policies; these citizens realize that they need help too late, when they
are unable to obtain financing or various permits. FEMA's map revision and amendment
policies and procedures should be presented by the States to communities during
visits. If, as with some States, representatives of the State Coordinator's office
Headly 229
attend the fi nal comrnun ity Consultation and Coordi nat i on Offi cer' s meet i ng, where the
Flood Insurance Study is presented to community members, the revision process could
be brought up at that point, thereby arming citizens witil the program knowledge they
need to maintain a useful Flood Insurance Study before the fact. Of course, "mon
itoring visits" to communities already participating in the Regular Phase of the
program would be appropriate occasions to di scuss study maintenance.
Another area of responsibility the States can assume is to develop the role of
the State repository. Under current revision procedures, it is essentidl that any
new analyses be based on those in the original study. The original study data should
be catalogued and stored such that it is easy to locate and distribute. If facil
ities or funding limit the State's ability to maintain the data, the State should
work with individual communities in developing well-inventoried, accessible repos
itories in a uniform manner.
Coordi nat ion
There are many coordination efforts that the States can undertake to help com
munities keep their Flood Insurance Studies up to date and thus more usable. For
example, they can coordinate, to the extent possible, with other State or non-FEMA
Federal projects that will ultimately affect a community's Flood Insurance Study.
States should encourage the development of information that would lend itself to a
study revision. For example, many bridge replacements and channel modifications
carried out by a State highway department will result in a change to the water
surface elevations and/or flood boundary and floodway delineations. Many of these
projects (especially the replacement of an undersized bridge or culvert) will result
in a reduction in flood hazards. A community will then request that its study be
revised to reflect the change. If the data from the original study has been utilized
by the highway department in the design phase of the project, and if any hydraulic
analyses are performed so that they are compatible with the existing study, a map
revision can most easily be accomplished by FEMA.
In keeping with a general National Flood Insurance Program principle, State
agencies can also encourage the use of information presented in map revisions, con
ditional Letters of Map Revision, and conditional Letters of Map Amendment as minimum
criteria. Communities should be aware that data and analyses have been reviewed with
FEMA minimum criteria in mind and, as such, it is their prerogative to be conserva
tive in the application of FEMA's findings. For example, in a rapidly developing

230 NATIONAL AND STATE ISSUES
area, perhaps channel modifications or other structural measures should be designed
with future conditions or ultimate development discharges, even though FEMA, for
purposes of a conditional Letter of Map Revision, compares the design to existing
Flood Insurance Study data. Likewise, while FEMA could grant a conditional Letter of
Map Amendment for structures proposed to be built at or above the base flood eleva
tion, perhaps community requirements to build one or even two feet above the base
flood elevation would be more prudent.
Observations on and Expected Changes to the
Study Maintenance Effort
Revisions can effectively put off the pressure or need for a restudy of a com
munity's flood hazard. It is entirely feasible that revisions can be effective in
keeping a c~nmunity's Flood Insurance Study up to date. Factors that help deter
mine the effectiveness of the revisions process include:
• the amount and rate of development
• the accuracy of the effective Flood Insurance Study analyses
• community awareness and monitoring of development in flood plains
• development of information/analyses documenting the flood plain changes.
Another related aspect of the revisions process is the fact that for the process to
be at all successful, it inherently involves the community. This is not to say that
revisions are the only way of involving communities in flood plain management, but
they do lead to the community's being more aware of what is happening in its flood
plains and the resultant impacts of development. Finally, revisions can save FEMA
money, since the data is usually provided by the requestor. The infonnation must
still be reviewed and mapped as necessary.
The revision/amendment processes do have their criticisms. One is the patchwork
nature ("band-aid approach") of updating a community's Flood Insurance Study. It is
essential, though sometimes very difficult, to detennine if the cumulative impacts of development are being properly considered. This is especially important in the
rapidly growing communities with multiple revision requests.
Revision requests, particularly those involving proposed projects, also tend to
draw FEMA into regulating a community's flood plain development. As mentioned
earlier, many things can hinge on FEMA's "verdict," including construction pennits,
Headly 231
financing, and large amounts of money in general. FEMA's conditional determinations
are often used by developers as leverage with the community: "The Federal govern
ment endorses my plans; you have to grant me my construction permit." FEMA is also drawn into provi di ng "free" engi neeri ng (at the taxpayers' expense) for revi ewi ng
design concepts, as opposed to a developer's final design that has the community's
endors ement. As a result of the experience FEMA has gained by processing an increasing number
of revision requests each year, several changes in their philosophy toward current
maintenance systems can be anticipated. For example, Letters of Map Amendment will
probably be granted only for structures inadvertently included in Special Flood
Hazard Areas; projects based on elevating structures on fill would be handled as map
revision requests.
FEMA recently published a proposed rule on adopting a reimbursement procedure for
condi tiona 1 determi nat ions. Through th is procedu re, FEMA hopes to recove r much of
the cost associated with the review and processing of conditionals by billing the requestor. It would follow tllat knowing they will be charged for this, whether they
get a favorable response or not, requestors will put together a better submittal.
Ideally, the request would come through the community, with their endorsement and
certification that the project is compatible with their flood plain management
objectives. The experience gained with revisions based on community-supplied infor
mation may also be evidenced in FEMA's restudy philosophy. It is safe Lo dssume that
FEMA will be working more and more closely with communities, keeping their needs and
resources in mind. The concept of cost-sharing will probably become more evident.
The community that supplies new topographic mapping or survey data will be in a better position to convince FEMA to perform a restudy.
In conclusion, the procedures and policies for FEMA's Flood Insurance Study
maintenance system are constantly evolving. The map amendment/revision process is sure to playa key role in the maintenance system's future.
MULTIPLE USE CONCEPTS IN FLOODPLAIN MANAGEMENT
William G. DeGroot, L. Scott Tucker, Mark R. Hunter
Urban Drainage and Flood Control District
Introduction
A complete floodplain management program must include all activities necessary to reduce future flood hazards (preventive) while correcting past mistakes
(remedial). These actions include land use controls; and the planning, design, construction and maintenance of flood control facilities.
Local governments, which are the agencies usually responsible for providing remedial flood control facilities, are being increasingly squeezed between revenues and the demand for services. The public wants relief from flooding problems while
also looking for more amenities, including recreational facilities. It therefore makes sense to combine public uses whenever feasible. Flood control facilities, while necessary and useful, are dry most of the time; and are therefore available
for other public uses (such as recreation and open space) which are compatible with the flood hazard.
Land developers also face multiple requirements when subdividing or building.
These can include floodplain regulation requirements, park and school land dedication requirements, stormwater detention facilities, open space or landscaping
requirements and marketing considerations. These requirements can break a project -or make it.
Both public agencies and private developers should look to the concept of
multiple use to provide needed facilities and desirable amenities which improve the quality of life. Shared land, shared facilities, and shared construction and
maintenance responsibilities can all help meet the needs of society at reasonable cost. Good planning can assure multiple use. Bad planning results in loss of opportunity for multiple use and higher costs to the public.

DeGroot/Tucker/Hunter 233
This is not a new concept but it is too often overlooked or ignored. The
purpose of this paper is to focus on concepts of multiple use and examples of
public-and private-sector multiple use projects in the Denver area.
Channels
Flood control channels, whether built for remedial purposes or as part of new
development, offer the opportunity for greenbelts and trail systems. Maintenance
trails can easily double as hiker/hiker trails (Figure 1). Pocket parks can be
created at intervals along the channels. These are small parks which can consist of
play ground equipment, benches, picnic tables, bicycle racks, exercise stations,
drinking fountains, trash recepticles, etc.
The type of channel can obviously affect the amenity provided. For example,
the Urban Drainage and Flood Control District (UDFCD) and the City of Denver had
planned to construct a concrete channel for a section of Weir Gulch at its
confluence with the South Platte River to remove a public housing area from the
floodplain. A citizen's group called the Platte River Development Committee (PRDC,
now the Greenway Foundation), which was revitalizing the South Platte River with
parks, trails and other amenities, proposed a joint flood control and recreation
project for Weir Gulch. With additional funds provided by the PRDC the three
parties were able to acquire additional right-of-way which permitted the
construction of a blue grass channel, boat launching lagoon providing access to the
river, parking lot with basketball court, and play structure. The end result was a
facility that not only provides the desired flood protection, but is a park for the
housing area and provides a link to the South Platte River facilities (Figure 2).
Detention
Detention facilities can include every type of facility from major Corps of
Engineers' flood control projects to the smallest of "on-site" ponds. Several
examples of multiple use detention facilities are given below.
Holly Dam. Holly Dam controls a drainage area of 2.1 square miles. The
lOO-year flood volume of 252 acre-ft. will be contained in the flood pool which is owned by the South Suburban Recreation and Park District. The park district has
234 NATIONAL AND STATE ISSUES
constructed tennis courts in a terraced fashion stepping down into the flood pool. The lowest courts are at the IO-year flood pool elevation. They have been flooded once in the 7 years since they were built (Figure 3). A soccer field was rough graded into the flood pool in the embankment borrow area at the time of construction
but has not yet been developed. Maintenance of the facility is shared by the UDFCD and the park district.
Englewood School Detention. The UDFCD and the City of Englewood determined that the best solution to a flood control problem on Little Dry Creek was the
construction of a side-channel storage facility to shave the peak from flood hydrographs. Fortunately, the ideal location for such a facility was the 11 acre athletic fields of Englewood High School. The School Board, although originally
skeptical of the idea, eventually agreed to the concept. The resulting project provides 89 acre-feet of flood storage. In return for the authorization of the school board to use the land, the project added blue grass sad, one additional soccer field, concrete bleachers, concession stand and an office/press box. The school district maintains the bulk of the facilities, with the flood control
maintenance responsibility limited to the inlet and outlet facilities, as well as after storm clean up.
On-Site Detention. Local on-site detention to maintain peak discharges at pre-development levels is required by many Colorado communities. These facilities can be stuck away in a corner where they are neglected, become maintenance problems and/or loose their effectiveness; or, they can be integrated into the overall
development plan where they become assets to the development, and, because they are
assets the chances of them receiving the needed maintenance are greatly enhanced. Figures 4 and 5 show how these on-site facilities can function as multiple use assets.
Open Space
Open space, particularly riparian land, is most beneficial to the overall quality of life of an area. In many instances in the Denver area, developers have found that the best way to address the flood hazard potential is to set the floodplain aside as open space area as an integral part of the development plan.
With the addition of trails for hikers/bikers and for maintenance activities the
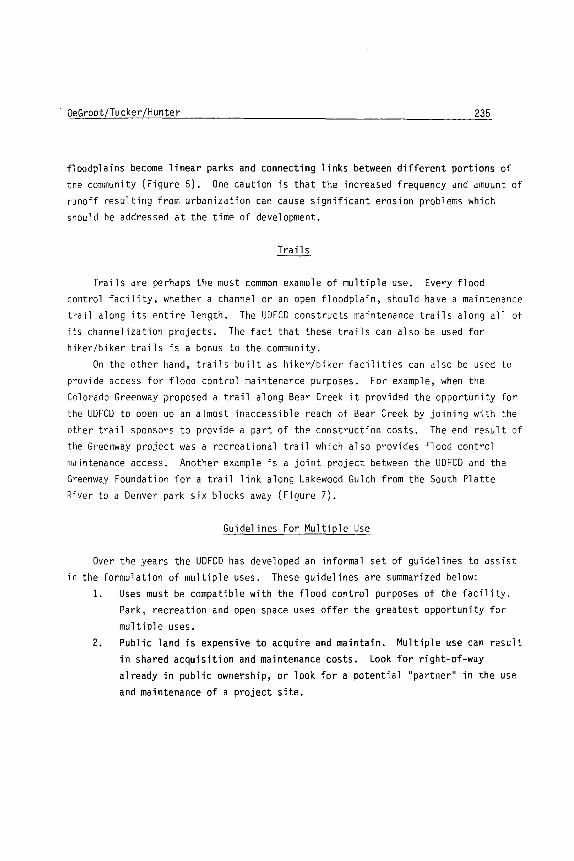
DeGroot/Tucker/Hunter 235
floodplains become linear parks and connecting links between different portions of
the community (Figure 6). One caution is that the increased frequency and amount of
runoff resulting from urbanization can cause significant erosion problems which
should be addressed at the time of development.
Tra il s
Trails are perhaps the most common example of multiple use. Every flood
control facility, whether a channel or an open floodplain, should have a maintenance
trail along its entire length. The UDFCD constructs maintenance trails along all of
its channelization projects. The fact that these trails can also be used for
hiker/biker trails is a bonus to the community.
On the other hand, trails built as hiker/biker facilities can also be used to
provide access for flood control maintenance purposes. For example, when the
Colorado Greenway proposed a trail along Bear Creek it provided the opportunity for
the UDFCD to open up an almost inaccessible reach of Bear Creek by joining with the
other trail sponsors to provide a part of the construction costs. The end result of
the Greenway project was a recreational trail which also provides flood control
maintenance access. Another example is a joint project between the UDFCD and the
Greenway Foundation for a trail link along Lakewood Gulch from the South Platte
River to a Denver park six blocks away (Figure 7).
Guidelines For Multiple Use
Over the years the UDFCD has developed an informal set of guidelines to assist
in the formulation of multiple uses. These guidelines are summarized below:
1. Uses must be compatible with the flood control purposes of the facility.
Park, recreation and open space uses offer the greatest opportunity for
multipl e uses.
2. Public land is expensive to acquire and maintain. Multiple use can result
in shared acquisition and maintenance costs. Look for right-of-way
already in public ownership, or look for a potential "partner" in the use
and maintenance of a project site.
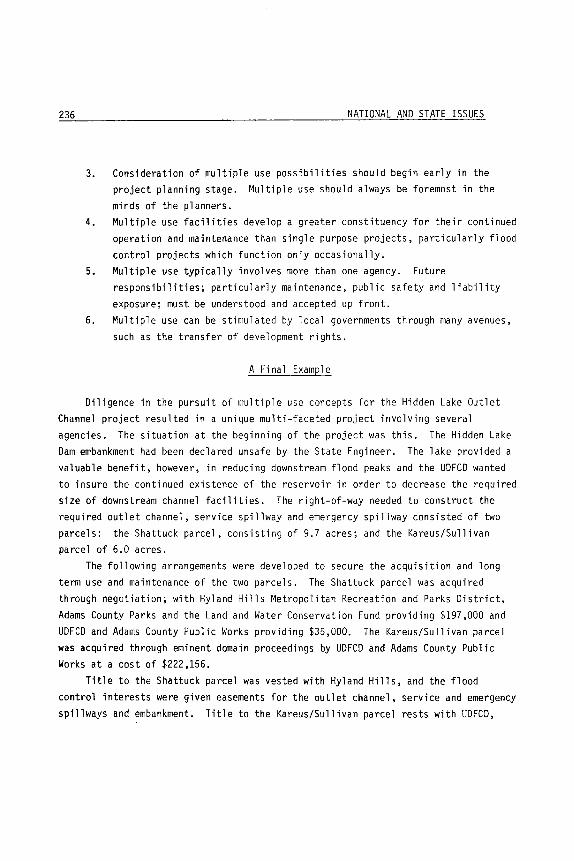
236 NATIONAL AND STATE ISSUES
3. Consideration of multiple use possibilities should begin early in the project planning stage. ~1ultiple use should always be foremost in the
minds of the planners. 4. Multiple use facilities develop a greater constituency for their continued
operation and maintenance than single purpose projects, particularly flood
control projects which function only occasionally. 5. Multiple use typically involves more than one agency. Future
responsibilities; particularly maintenance, public safety and liability
exposure; must be understood and accepted up front. 6. Multiple use can be stimulated by local governments through many avenues,
such as the transfer of development rights.
A Fi na 1 Example
Diligence in the pursuit of multiple use concepts for the Hidden Lake Outlet Channel project resulted in a unique multi-faceted project involving several
agencies. The situation at the beginning of the project was this. The Hidden Lake Dam embankment had been declared unsafe by the State Engineer. The lake provided a
valuable benefit, however, in reducing downstream flood peaks and the UDFCD wanted to insure the continued existence of the reservoir in order to decrease the required size of downstream channel facilities. The right-of-way needed to construct the required outlet channel, service spillway and emergency spillway consisted of two
parcels: the Shattuck parcel, consisting of 9.7 acres; and the Kareus/Sullivan parcel of 6.0 acres.
The following arrangements were developed to secure the acquisition and long term use and maintenance of the two parcels. The Shattuck parcel was acquired
through negotiation; with Hyland Hills Metropolitan Recreation and Parks District,
Adams County Parks and the Land and Water Conservation Fund providing $197,000 and UDFCD and Adams County Public Works providing $35,000. The Kareus/Sullivan parcel was acquired through eminent domain proceedings by UDFCD and Adams County Public Works at a cost of $222,156.
Title to the Shattuck parcel was vested with Hyland Hills, and the flood
control interests were given easements for the outlet channel, service and emergency spillways and embankment. Title to the Kareus/Sullivan parcel rests with UDFCD,

· DeGroot/Tucker/Hunter 237
although it will eventually be transferred to Adams County. Hyland Hills has
executed a long term lease with UDFCD for the use of the parcel with such uses being
consistent with the proposed emergency spillway. Hyland Hills has constructed four
ball fields on the two parcels using proceeds from the Colorado Lottery. A major
concession facility is also planned.
The end result of this project is a 15.7 acre park and flood control facility.
The combined funding (from 6 sources) resulted in facilities which would have been
significantly more expensive to implement independently. The UDFCD will maintain
the flood control facilities, while Hyland Hills will maintain the ball fields, including the emergency spillway area.
Multiple use concepts are a viable way in which to combine uses of land and
monetary resources to obtain multiple objectives at a lesser cost to each of the
individual interests. Flood control uses are particularly suited to be combined
with park, recreation and open space uses. Examples of various types of multiple
use projects in the Denver area demonstrate the value of this concept.
Fiqure 1 - Little Dry Creek Channel and Trai 1
Fiqure 2 - Weir Gulch Channel and Park
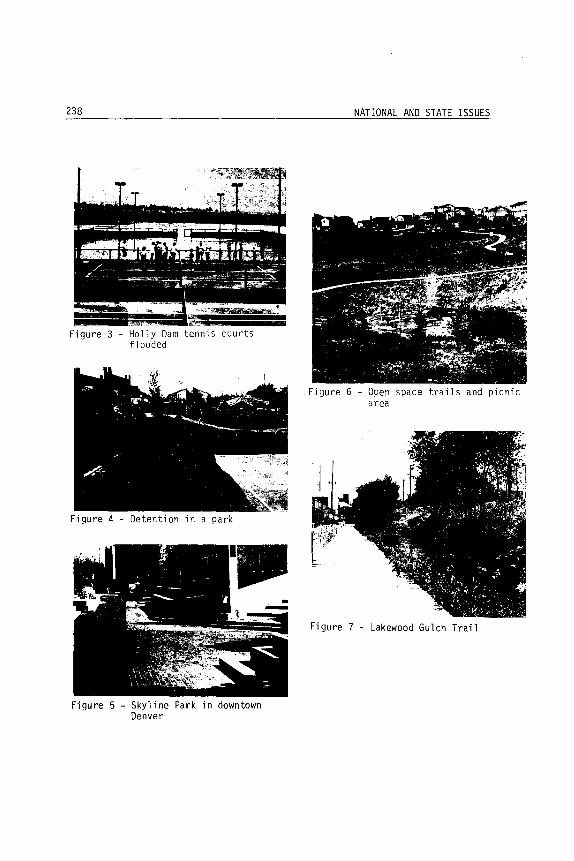
238
Figure 3 - Holly Dam tennis courts flooded
Figure 4 - Detention in a park
Figure 5 - Skyline Park in downtown Denver
NATIONAL AND STATE ISSUES
Figure 6 - Open space trails and picnic area
Figure 7 - Lakewood Gulch Trail

DENSITY DEVELOPMENT CRITERIA FOR FLOODWATER CONVEYANCE
Carl L. Cook, Jr. Federal Emergency Management Agency
Region X
The concept of limiting development density has been used for such plan
ning purposes as 1) maintaining agricultural and forest uses, 2) discouraging
certain types of development, and 3) restricting development in order not to
overstress existing services. Typically, specifications for lot size, volume
of structural development, and configuration are components of density criteria. This same concept has numerous applications in flood-prone areas where
maintaining adequate floodwater conveyance area is the objective. This presen
tation will explain these applications and will illustrate mechanics and case
studies.
The floodway concept is one of the two major floodplain management tools
used in the United States. The other tool is the elevation criteria for new
structures. The floodway is specifically required in the regulations of the National Flood lnsurance Program for most participating communities, and is a
component of the floodplain programs of virtually every other governmental
program which deals with floodplains. Under the floodway provision, a desig
nated area within the floodplain won't be encroached upon, thereby assuring
that floodwaters of the lOO-year magnitude will pass with no more than a one
foot rise. This rise is caused by, and allows for, encroachment in the fringe
area up to a total filling. In the "standard" floodplain configuration consis
ting of a defined channel and a floodplain where topography gradually rises
away from the channel, the conventional floodway is, indeed, appropriate. In
most cases, the central portion of the floodplain will contain waters of the
greatest depth and velocity.
Therefore, the "conventional" floodway located by the equal conveyance principal will usually coincide with this central area of greatest hazard,
though another hydraulically feasible location may be adopted. In any case,
the location chosen, in order to be hydraulically efficient, would generally coincide with the area of greatest depth and velocity.
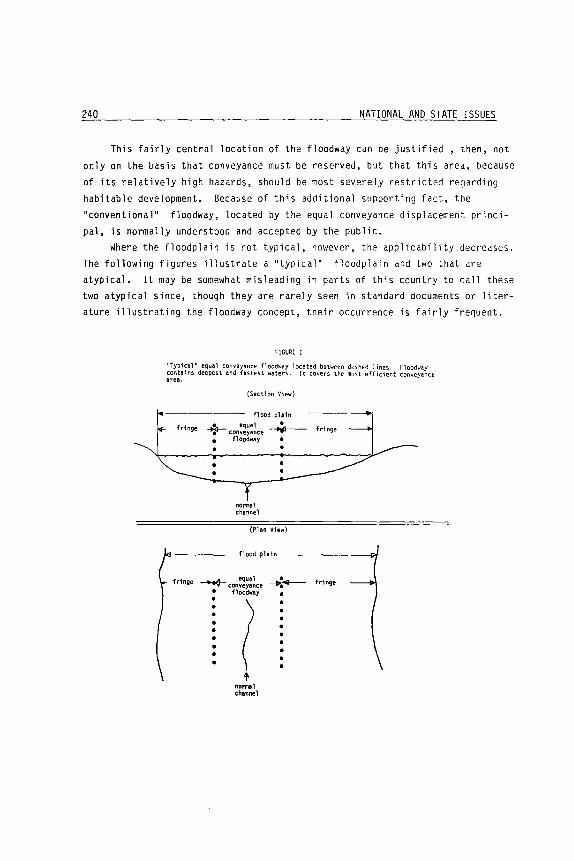
240 NATIONAL AND STATE ISSUES
This fairly central location of the floodway can be justified , then, not
only on the basis that conveyance must be reserved, but that this area, because
of its relatively high hazards, should be most severely restricted regarding
habitable development. Because of this additional supporting fact, the
"conventional" floodway, located by the equal conveyance displacement princi
pal, is normally understood and accepted by the public. Where the floodplain is not typical, however, the applicability decreases.
The following figures illustrate a "typical" floodplain and two that are
atypical. It may be somewhat misleading in parts of this country to call these two atypical since, though they are rarely seen in standard documents or liter
ature illustrating the floodway concept, their occurrence is fairly frequent.
FIGURE I
"Typi ca 1" equa 1 convey!!lnce f1 oodway 1 Dca ted between de-shed 11 nes. FloodwlIY contains deepest and fastest waters. It covers the most efficient conveyance area.
fringe
fringe
(Section View)
flood plain
+- con~~~:~ce • ~
floodwlIY
nomal channel
(Plan View)
flood plain
~ con:~~:~ce • floodway
· ---t>.-•
( • • •
• • t
normal channel
fringe
fringe
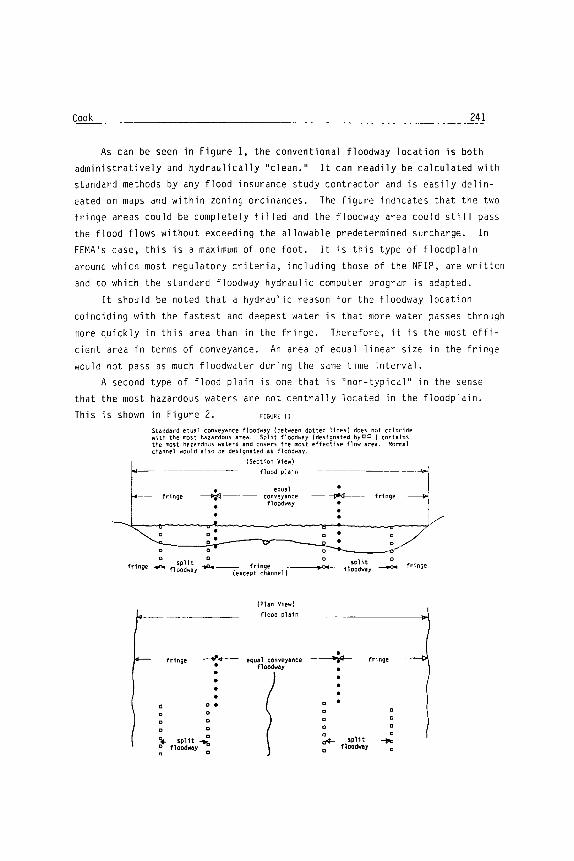
Cook 241
As can be seen in Figure 1, the conventional floodway location is both
administratively and hydraulically "clean." It can readily be calculated with
standard methods by any flood insurance study contractor and is easily delin
eated on maps and within zoning ordinances. The figure indicates that the two
fringe areas could be completely filled and the floodway area could still pass
the flood flows without exceeding the allowable predetermined surcharge. In
FEMA's case, this is a maximum of one foot. It is this type of floodplain
around which most regulatory criteria, including those of the NFIP, are written
and to which the standard floodway hydraulic computer program is adapted.
It should be noted that a hydraulic reason for the floodway location
coinciding with the fastest and deepest water is that more water passes through
more quickly in this area than in the fringe. Therefore, it is the most effi
cient area in terms of conveyance. An area of equal linear size in the fringe
would not pass as much floodwater during the same time interval.
A second type of flood plain is one that is "non-typical" in the sense
that the most hazardous waters are not centrally located in the floodplain.
This is shown in Figure 2. FIGURE 11
Standll rd equa 1 conveyance f1 oodwllY (between dot ted 11 f'les) does not c01 nc 1 de with the most hazardous tired. Split floodwlIY (designated byCC ) contains the most h/lUlrdous waters and covers the most effective flow area. NOnllel channpl would aho be desfl)nllted H floodway.
(Sectlon View)
flood phin
• equi!ll ~--- conveyllnce ---;:.a<l-- fringe
floodwllY
D
fr1nge ~-f1 split -fiC.oI-- fringe oodway (except channel)
fringe
D
-"'.-• · • • · D •
'1t- split D
o f100dwlY"""b D D
(Plan View)
flood plain
equlI 1 conveyance noodway
D
~-----<>/
fl~~~!!Y ~ fringe
fr1nge
D D rJ4-- split --i>a
floodway
242 NATIONAL AND STATE ISSUES
Because the channel is not lower than all the surrounding floodplain (i.e., the
topography does not slope up from the channel), the most hazardous floodwaters
are not located centrally, but in the two deep areas outboard of the channel.
The standard equal conveyance calculations would delineate a floodway
shown by the dotted lines ( ••••• ). However, common sense and good engin
eering judgement would indicate that such a central location is inappropriate.
Such a location, though acceptable by the standard hydraulic computer model,
would encompass neither the most hazardous area nor the most efficient flow
area. The two locations encompassed by ([J [J [J [J [J) indicate two areas
through which portions of the floodwaters could logically be passed. This
would represent a split floodway configuration that would encompass the most
effective flow areas. In addition, it would seem logical that these areas
should come under the most severe regulations, the floodway development con
straints.
As one can imagine, it would be very difficult to sell the idea that the
area between the dotted lines (the equal conveyance location) should not be
encroached upon, while the fringe ,could be completely filled. This would not
only run contrary to sound environmental practice, but would be much more
expensive to develop than would be the high ground area closer to the channel.
The split floodway, with its fringe areas located where there is the least
flood hazard, would be more economically developed while also being supported
by common sense.
The split floodway concept was adopted for use several years after flood
way regulations were generally accepted. Though it was the target of some
resistance from FEMA, the Corps of Engineers, and other engineering staff, it was applied in a limited number of cases and has now become a frequently accep
ted method of floodway location. Since in those cases where it has been appro
priately applied it has appeared to be the most logical choice, this location
alternative has been much easier to "sell" to the public.
To the layperson, it appears to encourage development away from the worst
areas, and into the "safer" areas. Though not presented on Figure 2 for rea
sons of visual clarity, the natural channel itself would also be designated as
a floodway area. This would be the case in any type of floodplain configura
tions.
The second type of "non-typical" floodplain is shown in Figure 3. In this

Cook 243
type, the hazard, with its components of depth and velocity, is generally
constant from one edge of the floodplain to the other. In other words, the
hazard at A is equal to the hazard at B. The standard equal conveyance floodway can be easily computed and delineated. It is also as easy to describe on a
map and in an ordinance as was the example shown in Figure 1.
fIGURE III
Huards (in depth and veloc1ty) generlllly constant tn flood platn.
fringe
fringe
. ---.'-
•
.
(Section View)
flood plAtn
equal conveyance
floodway
(Phn View)
.q~l
rOT' B
• ... " fringe
:A \ The paramount difference is that though the hazards are equal, the flood
way regulations, particularly those of FEMA, treat A and B far differently. A,
being in a fringe, has the ability to completely fill the property. Of course,
any structure would have to meet applicable elevation requirements, but the
owner could fill the areas with earth, concrete, or any other encroachment up
to a total fill and still be within FEMA criteria. There could be as many
habitable structures as the owner pleased on the property. S, however, could
not, for most practical purposes, fill any of the property and could only build
a structure if there was a detailed engineering analysis to demonstrate this
the structure, along with all future anticipated possible developments, would
not cause any rise in water surface elevation. Though the regulations envi
sioned no development in a floodway, it has been found that some very limited
types of structures can be placed in a floodway without causing any measurable riSe in water surface elevation. Howevf'" his kind of effort is both time-
244 NATIONAL AND STATE ISSUES
consuming and costly and, very often, not really practical.
The reason B, and others inside the floodway, cannot cause any rise is
that the allowable surcharge (e.g., FEMA's one foot) has been "used up" by the
designation of the fringe as an area where unregulated encroachment can take
place. Though, in reality, the fringe in most cases would not be totally
filled, only by making this assumption is a community able to allow any measure
of development without having to make a detailed case-by-case analysis to
measure the encroachment potential of each development.
The inequity of the situation becomes apparent. The only significant
difference between A and B is that B is unfortunate enough to be on the wrong side of the floodway line. B and other neighbors within the floodway are
shouldering the entire burden of conveyance assurance, while A and neighbors
are enjoying full use of their properties at the expense of B.
The density criteria are is designed to alleviate this inequity while at the same time assuring that an adequate conveyance area is provided. The
density concept is based on the principal that the burden of assuring adequate
conveyance can be shared among all floodplain occupants who are subjected to
s imil ar hazards.
Figure 4 shows a floodplain configuration onto which no standard floodway
has been drawn. The plan view shows, approximately to scale, what would be
developed when density criteria have been imposed. The criteria for this
example are those currently used by the City of Richland, Washington.
By applying the development criteria shown across the entire floodplain,
the imposition of a designated floodway was avoided. Every property owner had
to bear some of the burden of conveyance assurance, but these constraints
allowed an economically reasonable use of the land for all. Not every parcel
in the floodplain was exactly five acres in size when the criteria were
imposed. Those that were smaller than five acres could not be built upon, and
those smaller than ten acres could accommodate only one habitable structure which had to meet the rest of the criteria. Since existing structures are
taken into consideration during the calculation of the base flood elevations
(BFE) for the area, encroachments (structures, fills) were already considered
in determining the flooded area and elevations need not be included when calcu
lating maximum density allowable by the one-foot surcharge regulation.
The density criteria are only an option for floodplain configurations shown in Figures 3 and 4 because an argument for density criteria should be

Cook
FIGURE IV
~ Density - aut .. m nulltler of structures
allOt1ed
Density - aaximum area of fill allowed
Maxi ...... cross-sectional blockage al1o\lfed:
Stucture PI acement
Other constraints
~ 1 per 5 acres
tal of lot
301, not to exceed 200'
only parallel to flow
no blockage of defined overflow channels
~~T~:ac;:n~i:~:ml~~: !~;: 10 acres can only contain one ·structure" due
A
'''0_(..
r .....
245
made only when the hazard components of depth and velocity are generally con
stant. It can further be shown that if the product of these two components is constant, it makes little difference how great that product is since the equal
conveyance floodway fringe regulations would allow habitable structures to be
built anyway. In other words, even if the depth or velocity or both are great,
the greatest restriction FEMA could place on new development is that only the
floodway area could be preserved, while the fringe, with this same magnitude of
hazard, could be completely developed.
The technology for analyzing density criteria for conveyance maintenance
is now available, as is documented in a study done by the Army Corps of
Engineers Hydrologic Engineering Center (HEC) for FEMA. While the method produced by this study has not been widely applied, those who have used the

246 NATIONAL AND STATE ISSUES
method seem to be pleased with the results. Any engineering firm capable of
using the HEC programs and/or producing a flood insurance study would also be
capable of running a density criteria analysis. FEMA Region X has recently
funded Corps sponsorship of a training session for all Corps' Districts within
the region on the use of the method.
In conclusion, the advantages of a density criteria are: 1) the burden of
development restriction is spread to all property owners in the area, 2) prop
erties of equal risk are regulated equally, and 3) no arbitrary placement of
varying restrictions (i.e., floodway/fringe) is necessary. These advantages
can make administration of floodplain regulations much more acceptable to local
property owners. The approach can be utilized in areas with various degrees of
mapping accuracy (approximate to very detailed), and be made to comply with
various government regulations (Section 60.3(c)(10), NFIP). Its most obvious
application is in areas where detailed floodplain data are available, but a regulatory floodway has not been provided. It can also be used in shallow flow
areas and as a supplement to a regulatory floodway.
Cases in which density criteria have been adopted demonstrate that it is a
workable concept and one that achieves conveyance assurance while providing a
high degree of equity. These cases include Richland, Washington; Scio, Oregon;
and Tualatin, Oregon.
A CONSULTING ENGINEER'S ASSESSMENT OF THE NATIONAL FLOOD INSURANCE PROGRAM
by Edwin G. Paulson Boyle Engineering Corporation
Introduction
One of the basic requirements of the National Flood Insurance Proqram (NFIP) is
a flood insurance study (FIS), which determines water surface elevations in
flood-prone areas. The Federal Emergency Management Aqency (FEMA) has responsibility
for supervisinq these studies, which are contracted to public agencies and private
consultinq firms. The writer has been involved in the performance of seven major FIS
contracts and appeals, resultinq in mappin~ of over 20 different cities and counties.
As a result, he has experienced a number of levels of the NFIP, from fulfillino its
technical requirements to interpreting its results to the publ ic.
This paper offers an assessment of the NFIP from the viewpoint of a consultinq
enoineer working as a study contractor. Areas of consideration consist of the FIS
"Guidel ines and Specifications," involvement of federal and state floodplain
aqencies, involvement of community officials, and public participation.
Recommendations are presented regarding practical solutions to identified limitations
or problems with the present NFIP from the engineer's perspective.
FIS Guidel ines
The FIS "Guidelines and Specifications" have been developed by FEMA to outline
the technical procedures to be followed by the study contractor in performing the
engineering study. These Guidel ines provide direction for conducting tasks rel ated
to reconnaissance, surveys, hydrology, hydraulics, mapping, report preparation, and coordination. The purpose of the Guidelines is not to be a definitive manual for
hydrologic and hydraulic analyses, but rather to assist experienced engineers in
selection of the most appropriate methods for use in the FIS. The Guidelines must be general enough to provide a nationwide standard for conducting floodplain studies in
a wide variety of areas.
In recent years, FEMA has made efforts to develop more detailed study
248 NATIONAL AND STATE ISSUES
procedures for certain types of flooding conditions. As a result, technical
appendices and addenda have been prepared for the Guidel ines which address coastal
flooding, shallow flooding, alluvial fan floodina, and levees. These supplements are
extremely helpful to the engineer and save considerable time durina the study which
might otherwise have been spent coordinating study methods with the PO and community
officials. Further efforts to develop specialized stud v criteria for unique classes
of floodina would be valuable in reducing the time and cost required for future FISs.
Situations we have encountered in prior studies in which efficiency could have been
improved by a new or expanded technical appendix include:
1. Desert watersheds and floodplains in which sediment and debris bulkina
and channel miqration are important factors.
2. Extensive areas subject to pondinq due to neqliqible qradient and levee
systems.
3. Alluvial fans. Present procedures (i.e., the "Dawdy Method") are
adequate only for simple (younq) fans. Methods for handlinq more complex
fans are being studied by FEMA and should be incorporated into a new
techn i cal append i x soon.
An area where the GIJirielinE'<; should be relaxed is in the use of rainfall-runoff models (e.g., TR-20, HEC-l) to perform hydroloqic analyses. At present, these models
may be used only on unqaged streams when no reaional methods are available. However,
in many cases, a rainfall-runoff model which is deve'\oped usinq site-specific data
can be a better tool in predictinq flood flows than a reqression equation that may be
based on spatial averaging of only two or three measurable parameters (e.g., area,
mean annual precipitation). With improving computer capabilities and software, more
defendable hydrologic results should usually be obtainable for ungaged watersheds
using tailored rainfall-runoff models rather than generalized reaional regression
equations. It is suqgested that this approach become the norm rather than the
exception in study areas with little or no historical streamflow data.
The discussion over whether movable bed hydraulic models (e.g., HEC-6) should
be used to compute flood profiles in alluvial channels has continued for several
years. Although the technology is pres2ntly available to model channels susceptible
Paulson 249
to scour and sedimentation, the val idity of this technolO(1y to an FIS is questionable
due to substantial data requirements, difficulty of calibration, and expense.
Althouah it would appear that it is not yet cost effective to apply movable bed
hydraulic models to FISs, FEMA should continue to evaluate these procedures and
incorporate them into the Guidelines at a time when the volume of available data and
the expertise of the engineerina community make their use economically feasible.
The Guidel ines refluire preparation of a very standardized FIS report and map
which are the only formal results of the study. The report and map focus primarily
on the floodplain manaaement aspects of the studv, and thus, much of the technical
material develofled by the enaineer is never presented in report form. The effort
invested in conductina an FIS would be more valuable to the enqineerinq community if
a separate technical report were prepared by the studY contractor in addition to the
standard FIS report. This technical report should include detailed discussions of
hydroloay (statistical methods, raw data, model parameters), hydraulics (HEC-?
input, model ina techniques, alternative floodways), and recommendations for further
floodplain analysis and for providina solutions to identified flooding problems. The
last item is an important but often overlooked benefit of the FIS. An enqineer viho
has studied and mapped a floodplain is in a aood position to recommend alternative
flood control plans aimed at mitiaating problems identified in the study. Without
thi~ element of a technical report, much of the enqinccr's insight reaardina the
study area is not utilized.
State and Federal Water Resources Agencies
There are two primary levels at which state and federal water resources
agencies become involved with the en9ineer during the performance of the FIS:
1) providing basic data and previous studies at the outset of the analysis; and
2) coordination of hydrologic results and other results of the study. Both
activities can involve interaction between the engineer and state floodplain
management agencies, state water resources departments, U.S. Geolo9ical Survey
(USGS), U.S. Army Corps of En9ineers (CDE), U.S. Soil Conservation Service (SCS), and
others.
It has been our experience that involvement by state aqencies in FISs performed
by pri vate consultants v ari es from no i nvo 1 vement to extens i ve i nvo 1 vement. The most
250 NATIONAL AND STATE ISSUES
active involvement tends to come from state agencies which occasionally serve as FIS
contractors themselves. State aqencies which are interested in our work but do not
have direct experience as FIS contractors often find themselves with differinG
expectations and desires from the FIS than FEMA. As a result, the study contractor
may be asked by state agencies to perform analyses and provide information which are
outside the scope of work of a normal FIS (e.g., more detailed hydroloqic or
hydraul ic analyses, consideration of future conditions). State water resources
agencies could improve their efficiency in obtaining desired enqineerinG material by
cooperating with FEMA in the fundinq of FISs. In this way, state agencies would be
able to make maximum use of the basic FIS itself and, with a relatively small
investment of funds, could allow the study contractor to extend the analysis to meet
specific needs of state floodplain manaqers. In addition, consultants would be able
to produce higher qual ity studies if states were more prepared to provide reI ated
data and reports and to assist in coordinating hydrolooic and other study results.
Assistance provided by federal aqencies in making backup data and reports
available to the private engineer has been only marqinally helpful in the past. In
general, the staffs of these aaencies (USGS, COE, SCS) are too busy to do more than
the minimum in coordinating with outside consultants. For example, the CDE
frequentl,v has a significant amount of useful open-file material available, but the
consultant is required to travel to the CDE office in person, sort throuGh thp filp
material, and copy what he thinks wi1l be helpfu1. A more widespread use of
computeri zed databases by federal water resource agencies (simil ar to the USGS
computer files of streamflow data and flood frequency analyses) would assist private
firms in gaining access to this public information.
The study contractor is required by the Guidelines to submit hydrologic results
to federal and state agencies for coordination. About half of the time these
agencies are able to provide constructive review comments, but the other half of the
time their staffs are either too busy to review the discharges and study methodoloqy
or they have no data or previous studies with which to compare the proposed flows.
It has been our experience, however, that federal agencies havinq current or
proposed projects in the FIS study area take an active interest in our work and are
willing to provide more direct, constructive input. Occasiona1ly, this can be a
problem when the goals of the federal oroject are different than those of the FIS,
Paulson 251
because considerable coordination may be required to assure that the correct data and
study procedures are utilized for each project and that the results are consistent.
An excellent example of this situation is southern Nevada (Las Veqas and vicinity),
wnere the FIS is being performed concurrently with reconnaissance-level flood control
studies by both the COE and SCS. The consultant and the federal agencies have each
exchanged information a number of times which has been mutually beneficial, ann
coordination of results and procedures has been extensive.
We believe that for most FISs performed by private consultants, more interest
and constructive review by federal a~encies could greatly improve the efficiency of
the work and the quality of the product. One possible aid to this situation would be
to include in the NFIP procedures a stioulation that as soon as a specific study
nackaae is advertised by FEMA, all appropriate federal agencies would beoin
collectina pertinent engineering data and previous studies. In this way, the aaency
would be able to accumulate the related material as time permits, and yet it would
still be ready for the contractor at the very outset of the study. As a benefit in
return, it is recommended that at the completion of each study, a technical report,
as previously discussed, should be transmitted directly to interested aaE'ncies for
their information and use on concurrent and future flood control projects.
ConIDlun it i es
The enqineering and administrative staffs of communities for which detailed
FISs are beinq performed are in a potentially awkward position. A technical
floodplain study is conducted for their community which will serve as a basis for
future floodplain management and flood insurance rates, yet the technical criteria
for the study are determined by an outside (federal) agency and the community has no
voice in selection of the consultant. Thus, it should come as no surprise that
cities and counties are often relatively uninvolved in the project until the
technical work has been completed and it is time to apply the results.
There are at least three reasons why it appears that community officials tend
to remain uninvolved in the technical aspects of the NFIP. The first is what seems
to be a general distrust of federal programs and administrators which threaten to
increase outside regulation over local issues at the expense of local control.
Second, local officials would be more interested in providing input to the technical
252 NATIONAL AND STATE ISSUES
FIS if the qoal of the NFIP were solving flooding prohlems (ie. designing and fundinq
projects) rather than merely identifying and mappinq them. Finally, many
communities, particularly smaller ones, simply do not have the technical data or
resources available to provide extensive assistance to the enaineer.
The frequent lack of involvement of local communities in the FIS process is
unfortunate because involved communities invariably receive better floodplain
mapping. In addition, an involved community can often benefit tremendously from the
FIS by usinq the technical data (aerial mappinq, hydroloqy and hydraulics) for its
own stormwater manaqement efforts. Most communities do not realize that in the
technical analyses performed by the study contractor they could have information
useful for feasibility studies of channel improvements, detention basins, and bridqes
and culverts. The preparation of a formal technical report in addition to the
standard FIS report would hel p make the enqineerinq data reauired for stormwater
manaqement more readily accessible to the studied community.
Communities also often fail to realize the value of an enqineer who has
developed an understanding of reqional and local floodina problems as a result of
performinq the FIS. The engineer is in an excellent position to provide the
community with services in stormwater manaqement in a very efficient manner due to
the in-house data and technical tools obtained from the FIS. If a community has the
foresight at the beqinninq of the FIS process to plan to employ the study contractor
for its own project, then it can coordinate closely with the engineer throuqhout the
study and thereby maximize his efficiency in performing the community's project later
on.
How should community involvement be fostered within the bounds of the NFIP?
First, FEMA should continue to stress to the community the importance of close
coordination with the study contractor. However, the primary responsibility for
educating communities should fall to the study contractor. The enqineer is in the
best position to objectively encouraqe participation in the study by the community
and keep it informed regarding technical developments. An extension of this would be to allow communities to share a portion of the cost of the study in return for expanding the scope of work to include areas, methodoloqies or assumptions (e.g.
future conditions) which are of interest to the community but which are outside the
normal FIS scope.

Paulson 253
Second, the enaineer should be required ta hold form~ monthly or bi-monthly
proaress meetings with the community, attended also by FEMA if desired. The meetinos
would prevent the situation in which the community meets with FEMA and the enoineer
at the initial scopina rneetino hut has little or no contact with either until the
preliminary study results are presented.
Third, the technical information qenerated by the enaineer should become the property of the community (or the appropriate state repository) at the completion of
the study. The enqineer should hold a formal meetinq with the technical staff of the
community to explain this material to them. In this way, the information would he
available to the local community to assist them in their own floodplain manaaement
and drainaqe control efforts, rather than remaininq with the engineer and eventually
beina stored by FEMA.
The Publ ic
As consultants who have conducted FISs in a variety of locations, it has been
our observation that the public is almost completely unaware of the qoals of the
NFIP. Furthermore, the puhlic is uninformed regarding the scope of work and level of detail of the technical FIS. These two factors lead to the development of
misconceptions of the NFIP on the part of the public and make coordination difficult
for the engineer.
Interaction between the enaineer and the public qenerally is most intense
during the initial data collection process and the final meetings to present the
study results. Local residents living in flood-prone areas are often contacted ~en
conductinq field reconnaissance to obtain eyewitness accounts of recent floodina.
Comments typically made by residents durinq these contacts include:
DOh good, so someone is finally going to solve our floodinq problem."
"You're wasting your time. I've lived here for 15 years and I've never seen any floodinq."
"Flood insurance? don't talk to insurance salesmen."

254 NATIONAL AND STATE ISSUES
Despite the above initial reactions, observations of residents contacted in the field
are often extremely helpful in evaluating flooding conditions. In the field, we have
found that people are more free to tal k to us if we avoid mentioning the words
"federal government" and "insurance." Many study contractors would probably benefit
from training in effectively soliciting public input in the field.
Publ ic input at meetings where prel iminary and final study results are
presented does not usually result in substantive chanaes to the study. Attendance is
generally poor, unless the community has experienced recent flooding, and those
present are more interested in solutions to floodina problems rather than new maps.
They have difficulty relating flood insurance maps to their own experience because
they do not understand concepts of hydroloaic frequency.
The question of how the NFIP can increase public participation in and awareness of the FIS process is a difficult one. The study contractor and community officials
should meet at the beginning of the study to outline ways to solicit public input to
the study and keep them informed of its progress. The approaches used to meet these
objectives may be unique to each community but could include neighborhood meetinos,
special releases to newspapers (in addition to the formal notification), and delivery
of special flyers to homes in flood-prone areas.
Conclusions
Th is paper has offered an assessment of the NF IP from the perspect i ve of the
consulting engineer involved primarily in the technical and coordination aspects of
the program. Several specific recommendations for improving the NFIP have been
offered. These have included modifications to the present FIS Guidelines, improved
coordination with state and federal water resources agencies, and methods of increasing local community and public involvement in the FIS process. A key
recommendation is to require study contractors to produce a technical report which
would provide extensive detail on the engineering analyses performed. Such a report
would be val uabl e to state and federal agencies as well as local communities concerned with stormwater management. Another key recommendation is to provide state
and local floodplain agencies with the opportunity to contribute to the cost of the
FIS and expand its normal scope to include other tasks specifically related to their own stormwater planning and management efforts.
THE LOUISIANA STATEHIOE FLOOD CONTROL PROGRAM
Dorothy D. McConnell
Louisiana Departm ent of Transportation and Develop m ent Office of Public Works
A. Todd Davison Louisiana Geological Survey
Glen L. Daigre Louisiana State Planning Office
Situated at the terminus of the Mississippi River drainage basin, Louisiana receives the
drainage of 41 percent of the land area of the United States. Unlike the steep slopes and
relatively narrow floodplains of the upper reaches of the river, the lower Mississippi flows through
a wide flat-lying flood plain in which the natural levees are the highest topographic features.
Early Louisiana settlers quickly recognized that flood control measures were essential to protect
crops and populated areas, though initial efforts were rudi m entary measures by individual
landholders. Eventually, this responsibility cam e to be shared by parish govern m ents, levee
districts, the state, and the Federal govern m ent.
With each governmental entity focusing on problems within its legislated jurisdiction,
measures were often devised that si m ply displaced the flooding fro m one locality to another --
solving a problem here, and causing one there. Due to increased development in flood prone areas
and a series of unusual precipitation events, extreme flooding was experienced in the years
between 1977 and 1983. In 1983 alone, more than $134.4 million was paid on over 16,500 flood
insurance clai m s in Louisiana (F. E. M. A., pp. 183-204). This is approxi m ately one-fourth of all
clai ms paid in the United States for that year. With such significant da m ages, flooding beca mea
major political issue in the state.
In 1982 the Louisiana legislature recognized the need for a unified approach to flood control
problems and passed Act 351 creating the Statewide Flood Control Program. This innovative
program provides state funding on a 70/30 percent matching basis to assist local govern m ents in

256 NATIONAL AND STATE ISSUES
dealing with flood problems. The program provides for long-term solutions to flooding without
encouraging further develop m ent in flood-prone areas. F or a proposed project to be considered
eligible for participation in the program, it must have documented flood damages, have a
minimum construction cost of $100,000 and have no adverse effects upstream, downstream or on
adjacent areas. The program provides for a priority approach to funding these projects. Thus, for
the first time, need, rather than political interest, was recognized as the primary factor in
obtaining funding fro m the state.
To assist local governments in systematically evaluating drainage and flood problem areas,
Act 351 required the Louisiana Geological Survey to develop and periodically revise a flood
information base. As a result, the Louisiana Atlas of Flood Plains and Flooding Problems was
prepared. (Available from the Louisiana Geological Survey, P. O. Box G, Baton Rouge, LA 70893).
The Atlas combines Louisiana's hydrologic watersheds into 15 basins at a 1:250,000 scale. Each
basin is depicted in a series of seven color maps showing recent geologic floodplain deposits, the
100-year floodplain, land use and land cover, soils, flood control projects, flood problem areas, and
federal and state lands.
Act 351 also established the Flood Control Evaluation Com mittee, consisting of the
Assistant Secretary of the Office of Public Works, the Director of the Louisiana Geological
Survey and the Director of the State Planning Office or their designated representative. The
Assistant Secretary of the Office of Public Works serves as Chairman. This com mittee
establishes procedures for the implementation of the program. Toward this objective the
"Guidelines and Procedures" for the program were developed and published. (Available from
DOTD, Office of Public Works, P. O. Box 94245, Baton Rouge, LA 70804).
The Guidelines provide for a two-step application process. Local governments interested in
participating must sub mit to the co m mittee a pre application and an application by May 1 and
Nove m ber 1, respectively. The preapplication emphasizes docu m entation of the flooding proble m
and is used to determine if the flood problem is eligible for assistance under the Statewide Flood
Control Program. Once this decision has been made, the applicant is advised and, if determined

McConne ll/Da vi son/ Da i gre 257
appropriate, is told to proceed with development of an application. The application is an
engineering study which requires a technical approach to the resolution of the flooding problem.
Sponsors whose jurisdictions include a population of less than 50,000 may request, in the
preapplication, that the Office of Public Works provide engineering services to develop their
application.
Once applications are submitted, the Flood Control Evaluation Com mittee begins a thorough
review of each project. The varied backgrounds of the com mittee members allow for a multi
disciplined review. The following subject areas reflect key factors which are scrutinized closely.
Technical Feasibility - The project must be designed in accordance with accepted
engineering practice and must be certified by a professional engineer. Amini mum return
frequency of two years should be used for undeveloped areas and 25 years for developed
areas. Hydraulic calculations, profiles and other technical data must be provided to verify
that the proposed solution will bring about flood dam age reduction as described. This data
should define conditions before and after implementation of the project. The area which
was flooded before but no longer floods after the project beco m es the "benefited area".
Consideration of Cost/Benefits - While the program does not requil-e a specific cost/benefit
ratio, it does require that damage value calculations be determined for properties within the
benefited area. Tables for this purpose are provided in the "Guidelines and Procedures".
The cost of the project relative to the benefits that will be provided is an important factor
in the scoring process which is used to prioritize the projects. Applicants should select the
most cost-effective solution to their proble m consistent with other progra m require m ents.
Environmental Considerations - Applications must provide a preliminary assessment of
environ m ental effects anticipated as a result of the proposed project. Para meters that must
be addressed include water quality, habitat modification, fish and wildlife resources, noise
and air quality, cultural, historical and archeological features and special geologic features.
Consideration of Alternatives - Floodplain management measures fall into two categories;
structural and non-structural. Structural flood control alternatives include public works
258 NATIONAL AND STATE ISSUES
projects (pu m p stations, channel alterations, levees, strea m diversion, etc.), storm water
detention and storm water retention. Non-structural flood control alternatives include flood
proofing, regulations, flood easement acquisition and relocations. The application should
address an adequate number of alternatives to ensure that the project was selected on the
basis of an objective analysis.
Local, State and Federal Agency Review - Applicants are required to submit com ments from
nine state, local and federal agencies. This provides the Evaluation Com mittee with
valuable input from agencies that might eventually be issuing permits for the project. If
problems are anticipated, they can be addressed at an early stage of development.
After the Flood Control Evaluation Com mittee completes the review of these applications,
a prioritized list of projects is presented to the Joint Legislative Com m ittee on Transportation,
Highways and Public Works. The Joint Com mittee then holds public hearings around the state to
accept public com ments. Taking these com ments into consideration, the Joint Com mittee
prepares a recom mended construction program to present to the legislature. During regular
session, the legislature determines an appropriate level of funding.
In order to insure an equitable distribution of program funds throughout the state, a funding
formula has been devised. This formula is based on a two-tiered system which includes (1) the
nine major urban areas in Louisiana and (2) five funding districts for rural projects which generally
correspond to drainage areas in the northeast, northwest, southeast, south central and southwest
portions of the state.
Forty-five percent of total program funds is allocated to projects within the nine designated
urban areas. Projects within urban areas must compete with other urban projects for funding. No
single urban area can receive m ore than 20 percent of the urban allocation.
Fifty-five percent of total program funds is allocated to rural projects in the five funding
districts. R ural projects, based on structural density in the benefited area, are further subdivided
into rural developed and rural undeveloped categories. District funds are divided between the two
rural categories and projects compete within their designated category.
McConnell/Davison/Daigre 259
In the first year of the program (fiscal year 1983-84), the legislature allocated $25 million
dollars which allowed for funding of the 16 top-priority flood control projects. Because it is still
in the early stage of i m ple m entation, the success of the progra m cannot yet be evaluated. It may
take several years for benefits to beco m e readily apparent.
However, interest expressed by local governments can be measured. To date 188
applications have been submitted and of this number 66 have been recom mended by the Evaluation
Com mittee. Of Louisiana's 64 parishes 27 now have recom mended projects. If all of these
projects were to be funded, over $100 million dollars would be required.
A lthough Louisiana has experienced a reprieve fro m flooding since 1983, major precipitation
events and increasing runoff from rural and urban development will assuredly occur in the future.
In the past, these two factors co m bined with a politically based allocation of flood control monies
has led to significant flood dam ages. However, with a statewide program that reduces further
development in flood prone areas and reduces flooding in existing problem areas through
objective, cost-effective, and prioritized funding, Louisiana should eventually be able to view
flooding as a solvable problem, not as a way of life.
With the current trend toward reduction, and in some cases elimination, of federal funding
for flood control, this financial responsibility will increasingly be borne by state govern m ents.
Across the nation, this will make prioritized, apolitical, statewide approaches im perative in years
to come. The approach established in Louisiana with the Statewide Flood Control Program can be
used as a model for other states in their efforts to combat flooding.
Reference
Federal Emergency Manage m ent Agency. Quarterly Report, 3/3/85, Report I. D.: PC A 05005.

"BACKING UP THE LOCALS" THE STATE FLOODWAY PERMIT PROGRAM IN ILLINOIS
David R. Boyce Karen C. Kabbes
Illinois Department of Transportation Division of Water Resources
The State of Illinois has been in the water permit business since the early 1900s. Seeing the flood damage that development in and along rivers
caused, the state legislature approved the Rivers, Lakes, and Streams Act in
1911. This law required permits from the state for construction within and
along rivers, lakes, and streams. The law emphasized the state's responsibility to preserve the stream's carrying capacity in time of floods and under normal
conditions. The Rivers, Lakes, and Streams Commission was then formed to oversee implementation of the act.
The Commission recognized and stated in its 1915 annual report that
"repeated damaging floods make the question of flood prevention one of the most
important matters for the consideration of the Commission." It also recognized
the need for local cooperation in this task. In lhdL same year, 1915, the
Commission sent a letter to all the county clerks asking for their assistance
in notifying it of any proposals to do work affecting stream drainage or flo~d
flow, and requesting the county courts to withhold permission until the Commis
sion could investigate and make recommendations on the acceptability of the
plans.
The early history of the program is dotted with permit denials for build
ing construction that would obstruct flood water. The program included an
engineering staff, which made determinations of the impact of work on flooding.
After this start, however, there were changes. The Commission was incorporated in the new State Department of Public Works and Buildings, Waterway Division.
Emphasis was switched to construction activities from regulation concerns.
World War II brought a significant reduction in the permit staff. The Division
redefined its permit responsibility to include only a limited number of rivers and lakes and their adjacent banks, and levee work.
This narrow redefinition of the Illinois Statutes continued until the
Boyce/Kabbes 261
1970s. In 1971, the Illinois legislature authorized the Department of Public
Works and Buildings to implement floodplain regulations, much like Federal Emergency Management Agency's regulations, along streams where the Department
proposed flood control projects. The goal of Illinois floodplain regulations
was to protect new construction from increasing expected flood heights or from
being subjected to flood damage itself. This legislation was adopted in order to get federal financing for flood control projects.
In cooperation with the Soil Conservation Service of the U.S. Department
of Agriculture, we were able to develop floodplain mapping for five watersheds
in the Chicago metropolitan area and to implement state floodplain regulations
in these watersheds starting in 1975.
To implement our program, we held hearings and met with officials from
every community or county affected. Since the floodplain regulations accompa
nied a locally supported flood control project, most local officials were eager
to help us. The building officials were given a copy of our floodplain maps,
which consisted of orthophoto topographic maps with two-foot contour lines at a
scale of 1"=400'. The maps also indicated the approximate location of the 100-
year floodplain boundary, floodway, and cross-section locations used in the
computation of the flood profile. Since Illinois is such a flat state, any
increase in flood stage can significantly increase flood damages; so we chose
.1 foot as the floodway standard for Illinois. A 1"=400' accompanying flood
plain profile map allowed users to determine the floodplain elevation at any
location in the floodplain. Though the state law did not require local ordi
nance to adopt and enforce state floodplain regulations, the local officials
were generally willing to use our maps and to refer anyone building in those
areas to us for a state floodplain permit. The floodplain regulation program was expanded and covered two additional
watersheds, one entirely state funded project area in the Chicago area and a
second project area funded partly by the Corps in the Rock Island-Moline area.
We had ambitious plans to expand state floodplain regulations throughout the
state when the Federal Emergency Management Agency's program caught up with us.
Much of the state was being mapped for the National Flood Insurance Program.
Dusting off our original legislative mandate (dating back to 1915) to "preserve
the carrying capacity" of the state's streams in times of flood, we resumed
regulating all floodways in the state. Using the floodplain data generated by
the National Flood Insurance Program, we started requiring permits for work

262 NATIONAL AND STATE ISSUES
within the Federal Emergency Management Agency's defined floodways.
This new regulatory effort was publicized by the Division's Local
Assistance Program. Since that Program's personnel coordinates the National
Flood Insurance Program, they were an obvious choice to assist in getting local
governments to send us floodway permit applicants. French Wetmore, our Local
Assistance Program Chief, developed a nice "carrot and stick approach" to
solicit local cooperation. He proposed a simplified model ordinance for local
government. The ordinance required that a state permit or waiver of state
permit be obtained before a local permit for floodway work could be issued.
Having the tough judgment calls on floodway work made by the state, seems to
make an easier ordinance for local government to administer. It also ties local
officials to having state input before issuing floodway permits. The broadened
regulatory effort really changed our role with many local governments. To start
with, communities in which we already had state floodplain regulations found it
much easier to adopt local floodplain ordinances, since their floodplain construction was already being regulated by us.
In most cases, we make the local building official's job easier. My staff
consists of registered professional engineers, specialized in hydrologic and hydraulic analyses. We have found that many building officials do not feel
comfortable deciding when a floodway obstruction is significant. Even if the
community has a staff engineer, we have found that many of them do not have the
technical background necessary to do a good job calculating flood impacts of
obstructions. It took a lot of education on our part and our state coordina
tor's part to bring many of the municipal and consulting engineers up to date
on current methods of hydraulic and hydrologic analyses. Many consulting engin
eers have had inadequate formal training in the intricate hydrologic and hy
draulic analyses commonly used today in floodplain studies.
We also make the local's job easier because we are insulated from local
politics. Even when the mayor knows a project doesn't make good floodplain
management sense, it's a lot easier to say "go ask the state" than just "no." And even when the major is tempted to say "yes" he knows he is not doing his
friend any favor if we come along later and stop the project. To date, the
Federal Emergency Management Agency has accepted the state permit as meeting
federal floodway requirements. Obtaining our permit is an easy way for the locals to show that they have met Federal Emergency Management Agency floodway concerns.
Boyce/Kabbes 263
We find that having a state floodway permit program is a good check on how
well locals are administering their ordinances. If state permit violations are
found, the first party we turn to for assistance is the local building offi
cials. Though many local officials are sincerely trying to do a good job, the
complexity of the program overcomes them, or they process so few floodplain
permits they forget established procedures. Our staff coordinates with local officials on all floodway permits and violations. If the local official seems
to have some detail confused, we pass their name along to the state coordinator
and the Federal Emergency Management Agency for a friendly visit or follow-up.
We also make sure that the cumulative or regional effects of the project
are reviewed. Too often, local officials tend to think that the flood problems
stop at their corporate limit. What advantage does the close coordination with
local officials have for us? We don't have the staff necessary to handle all
the floodplain questions or to police floodway construction. We felt able to
comfortably expand our jurisdiction to all floodways of the state, only because
we knew we would be working with the local officials as a first line of con
tact.
As we became confident in the local officials' expertise, we carefully
delegated those parts of our authority that are duplicated or adequately
handled by the local officials. For example, we no longer require flood fringe
permits in the special state project floodplains if a community in the National
Flood Insurance Program Regular Program issues its floodplain permit. Ridding
ourselves of that duplication was applauded by everyone.
We are also continuing our efforts to educate our fellow engineers. We
hope soon to have a manual prepared to help them better prepare calculations
and permit applications. The manual should help them recognize when it is best
to subcontract that analysis to an engineer specializing in hydraulics, rather
than to struggle through it themselves.
It's been an interesting experience to administer Illinois' floodplain
program through its evolution to its current status. The key to the program's
success has been, and will continue to be, close coordination with local gov
ernment.

STRATEGY FOR FLOODPLAIN MANAGEMENT FOR THE U.S. VIRGIN ISLANDS
Roy Adams Virgin Islands Planning Office
O.K. Buros CH2M HILL Southeast, Inc.
Pamela Johnston Virgin Islands Disaster Programs Office
Background
The U.S. Virgin Islands is an unincorporated Territory of the United States located about 1,200 miles southeast of Miami, Florida. The Territory consists of three major islands plus about 50 smaller islands and cays. The islands have a total area of about 135 square miles and a population of approximately 100,000. The steep slopes, clayey soils, and intense rainstorms in the islands tend to create runoff with very high but short duration peak flows. Before major development occurred on the islands, these flows created few problems, since the runoff generally occurred in the cane fields, furests, or bush areas. Additionally, the towns and villages were heavily guttered or located on higher areas.
From 1960 to 1980, the Territory's population tripled. This population growth was accompanied by an era of extensive construction. Unfortunately, much of this construction occurred during droughty conditions in the 1960s, a time when runoff events were minimal and few regulations were in effect to control construction in the historic flood plains. Since about 1970, a number of major rainfall events have occurred in the Virgin Islands, causing flooding that has resulted in millions of dollars of damage to structures built in flood plains. In response, the Territorial Government instituted a long-term stormwater management and flood damage mitigation strategy that keys upon planning, regulation, construction, and education. This multi-phase approach to stormwater management should significantly reduce future flood damage.
Adams/Buros/Johnston 265
Planning
Much of the initial direction for flood plain management came from the local
office of the U.S. Soil Conservation Service (SCS) which established a strong Soil and Water Conservation District. The District encouraged: (1) the construction of dams; (2) the establishment of an earth change permit system; (3) the production of topographic maps; and (4) an engineering survey of the islands' major culverts.
In 1979, the Virgin Islands Disaster Programs Office (DPO) financed the
production of a flood damage mitigation plan for the islands. This plan identified problems and solutions to the situation in the Territory, evaluated existing drainage problems, and provided guidance to avoid creating new ones. The plan outlined steps to be taken in the future, such as organization, construction,
regulation, data collection, education, coordination, and budgeting. Since 1979, many of these steps have been taken by various governmental agencies.
Regulation
During the early 1960s, there were essentially no regulations that effectively regulated flood plain development. In 1971, an earth change permit system was instituted in the Territory. This required a special permit for any non-agricultural alterations to the land, including clearing, grading, and building. Some of
the guidelines in the permit requirements concerned channel alteration and stabilization, detention storage, and land use in flood plain areas. The local SCS office was the major technical group in the enforcement of the rules, although the
Virgin Islands Department of Public Works (DPW) was given authority.
In 1978, a coastal zone management act was passed to discourage further growth and development in flood-prone areas and assure that development in these areas is
so designed as to minimize risks to life and property. The act re-emphasized and
used many aspects of the earth change permit program. Its enforcement was divided between the DPW and the V.I. Department of Conservation and Cultural Affairs (DCCA).
In 1975, the Territory enacted legislation requiring demonstration that a

266 NATIONAL AND STATE ISSUES
proposed structure was reasonably safe from flooding, before a building permit could be issued. The DPW and the V.I. Planning Office (PO) were given the responsibility to enforce this, using the 100-year flood elevation as a reference point. In addition to the above regulations, the PO continually updated draft subdivision regulations, which included provisions for regulating the construction of structures relative to the flood plain. Although not law, developers who were applying for subdivision permits were encouraged to fulfill the provisions.
The Territory has been involved with the national flood insurance program since 1975. In 1977, flood hazard boundary maps were issued to provide guidance for issuing flood insurance and for enforcing the flood hazard provisions of the building permit regulations. In 1980 the building code was modified to include and address standards necessary to permit the Flood Insurance Rate Maps (FIRM's) to go into effect. The initial studies were completed and the initial FIRM's were issued for the Territory. At the request of the V.I. Government, these were later modified to include topographic contours to facilitate their use.
Thus, in the past 10 years, the' Territory has promulgated regulations necessary to manage flood plain development. However, the regulations have assigned responsibilities to a variety of agencies, and funding has been insufficient for thorough review and enforcement of the regulations. Moreover, the regulations ar~ worded so that they unduly impose such rigorous engineering requirements on all applicants that they are often unenforceable.
Construction
The 1976 survey of 200 major culverts in the Territory indicated that many of the conveyance structures in the flood plains were not appropriate for the flows that were occurring. The Government embarked on a long-term construction program to alleviate some of the problems. In 1979, and again in 1982, selected drainage basins were studied to produce a series of drainage master plans to provide guidance in upgrading the structures within specific basins. This allowed the Government to upgrade individual structures anywhere within a basin, as monies were available, in a manner harmonious with the overall plan for the basin. This ongoing construction
Adams/Buros/Johnston 267
program has helped to mitigate flood damage.
Educational Program
The educational program of the Territory's flood damage mitigation strategy
is concerned with public awareness and technical education. As a part of public awareness program the DPO wrote and published annual editions of "Surviving the Storm" for the past five years. This brochure outlines specific steps the public can take to prevent and recover from flood damage due to tropical storms and hurricanes.
The technical education program focuses on three areas for flood damage
mitigation: design, regulation, and construction. Two types of design considerations are important in the program: the design of structures that are meant to convey flood flows, and the location of structures relative to the historic flood plains. The key element of the technical educational program for the design phase is a technical procedures manual entitled, Drainage and Flood Plain Management Technical Procedures for the U.S. Virgin Islands. This manual identifies basic data on the rainfall, land use, soil types, and topography that should be used in making
the calculations for design and presents available procedures that could be used for performing re1evanL hydrologic and hydraulic calculations. These procedures cover such items as hydrographs; runoff rates; channel routing; and designs for culverts,
channels, gutters, and storage basins.
The manual is intended for use by the local design professionals as a tool in locating and designing stormwater-related structures and that the government regulatory personnel use the manual to review the procedures involved in design. Sample
problems and solutions based on local examples and data are included in the text. A series of workshops was held for Government engineering and regulatory personnel to review the material. This proved to be useful, since most of the regulatory personnel reviewing permits do not have a background in engineering or hydrology.
Regulatory functions relating to flood plain management are fragmented throughout the local Government due to the manner in which the regulations were
passed and inserted in the statutes. Thus, various aspects of flood plain

268 NATIONAL AND STATE ISSUES
management are often handled by different agencies without full awareness of the overall action that should be taken. To mitigate this problem, an educational program was initiated, which consisted of producing a regulatory handbook and holding a series of training workshops. The handbook, entitled, Regulatory Handbook for Flood Damage Mitigation in the U.S. Virgin Islands is a compilation of most of the applicable regulations. In addition, it discusses the problems and objectives of flood plain management in the Territory and explains the legal liability of Government personnel in reviewing and approving permits.
A continuing series of workshops have been undertaken to: (1) review the existing regulations; (2) explore ways in which they could be implemented and/or strengthened and (3) improve the technical skills of regulatory personnel. These workshops brought together, for the first time, all the personnel who review permit applications throughout the Territory. This helped to clear up some misunderstandings of jurisdictional responsibilities and technical interpretation.
A number of structures that convey stormwater in the Territory have suffered considerable flood damage. Many of these, especially culverts, are built in the field by DPW road crews. These crews are often furnished with only the basic materials at the site and very little in the way of formal plans. They tend to use techniques and concepts that they have used in the past. some of which are better than others. However, with some minor modifications in the "field design," these structures could transport flood waters more efficiently, at little or no additional cost, and reduce damage to both the structures and surrounding property.
To this end, a booklet was written for the road crews, which illustrates some hydrologic and hydraulic principles that could assist them in their work. The booklet, entitled, "Culverts Count," was made in the form of a cartooned story illustrating the essential points in a graphical fashion that could be quickly read. The story is about local people and illustrates island situations and problems.
Summary and Conclusions
The Territory's flood damage mitigation strategy, although meant to be a

Adams/Buros/Johnston 269
long-term program, is already having positive effects. A major emphasis of the program has been to focus on upgrading the awareness and technical skills of the regulatory personnel who review the plans and building permits for compliance with
stormwater management regulations. As their confidence in their own understanding of the regulations and technical procedures has increased, their reviews have become more efficient and effective. This in turn is encouraging the local design professionals, other Government personnel, and developers to become better
acquainted with the applicable regulations and procedures. This is beginning to result in designs and plans that are more appropriate for construction in and near the historic flood plains.
In general, the plan to attack the problem on multiple levels of regulation, construction, and education has been very effective in carrying out the Territory's overall flood damage mitigation strategy.
References
Black, Crow & Eidsness, 1976. "Prel iminary Engineering Design of Cross Road Culverts." A report for the V.I. Department of Conservation and Cultural Affairs.
CH2M HILL, 1979. "A Flood Damage Mitigation Plan for the U.S. Virgin Islands." A report for the V.I. Disaster Programs Office.
CH2M HILL, 1983. Regulatory Handbook for Flood Damage Mitigation in the U.S. Virgin Islands. A handbook prepared for the V.T. ~isaster Programs Office.
CH2M HILL, 1983. Drainage and Flood Plain Management Technical Procedures fur the U.S. Virgin Islands. A technlcal manual prepared for the V.I. Dlsaster Programs offi ceo
CH2M HILL, 1982. "Planned Drainage Basin Studies for the Protection of Roads from ~ood Damage in the U.S. Virgin Islands." A report for the V.I. Department of Public Works.
Buros, O.K. and Smith-Palmer, L., 1983. "Culverts Count." A booklet prepared for V.I. Disaster Programs Office. Published by CH2M HILL, Gainesville, Florida.

This page
. IS
intentionally blank
PART FOUR
ON LOCATION

This page
. IS
intentionally blank
DEVELOPMENT MANAGEMENT TO REDUCE COASTAL STORM HAZARDS
David J. Brower Associate Director
Jane Hegenbarth Research Associate
The Center for Urban and Regional Studies University of North Carolina at Chapel Hill
We have been doing research on the use of development management programs
and policies to reduce life loss and damages in hurricanes and severe coastal
storms. Little systematic data were found on how coastal localities address
the hurricane and storm threat. To gain a greater understanding of the pro
grams and policies in place in coastal localities, we surveyed high-hazard
coastal communities in the Atlantic and Gulf Coast states.
The questionnaire we used addressed these issues:
1) What are the major characteristics of coastal development, and what
factors influence these patterns?
2) What types of programs and measures (including development manage
ment) are coastal localities using to reduce hurricane and storm hazards?
3) How effective are these programs and measures at reducing storm
hazards?
4) What are the major factors which affect the political feasibility and acceptability of hazard mitigation measures, particularly development
management?
5) What are the factors which influence the effectiveness of mitigation
programs and measures, particularly development management?
Coastal communities were surveyed if they had a population of 1000 or greater,
and contained V-zones, or velocity zones, as designed under the National Flood
Insurance Program (NFIP). Surveys were sent to over 600 localities in 18
states (Alabama, Connecticut, Delaware, Florida, Georgia, Louisiana, Maine,
Maryland, Massachusets, Mississippi, New Hampshire, New Jersey, New York, North
274 ON LOCATION
Carolina, Rhode Island, South Carolina, Texas, and Virginia), with a 66%
response rate. The findings of the survey will be discussed with respect to what coastal
localities are now using to mitigate the storm threat and to manage future
development (for a more in-depth discussion see Beatley et al., 1985).
Obstacles and arguments against the enactment of development management
measures, and problems resulting from existing development management programs
will be summarized and discussed with regard to the implications these have for
planners, policy makers, and others concerned with the use of development
management to mitigate severe coastal damages.
Survey Results
In aggregate, the surveyed communities displayed some general land use
trends. Existing flood plain development within the hurricane-prone communi
ties is predominantly single-family detached residential, while recent develop
ment in the coastal floodplains has shown increasing degrees of multi-family
and commercial development (which includes recreational and motel/hotel). Many
areas are significantly built out: in over one-third of the surveyed communi
ties, hazard-free development sites--those outside of the lOO-year floodplain-were considered scarce or very scarce.
The majority of survey respondents were at least somewhat familiar with
state programs assisting localities in storm hazard management. Most had
received some type of state assistance in the past five years, most frequently information on the NFIP and floodplain maps. One-half of the respondents
indicated that their community had received assistance with disaster prepared
ness plans. In over one-half of the communities, a regional agency had been
involved in storm hazard mitigation, most often in the preparation of a
regional evacuation plan.
In addition, approximately 72% of the survey respondents indicated that
their jurisdiction's governing body considered the threat of severe coastal
storms to be at least a medium priority in the community, while almost half
(46%) said that it was either a high or very high priority.
Technigues in Use The survey asked about storm hazard reduction strategies and the use of
programs to alter the coastal environment structurally, to strengthen buildings
and facilities, and to manage development. The questions asked about the effectiveness of specific techniques or approaches in the respondent's locality

Brower/Hegenbarth 275
in reducing coastal storm hazards. Hazard-reducing programs were broken into
three main categories: those that structurally alter the environment, those
that strengthen buildings and facilities, and those that manage development.
Programs that alter the coastal environment include shoreline protection and
flood control works, and sand moving or trapping programs. These programs have
widespread use, as shown in Table 1. Shoreline protection works, such as
bulkheads and seawalls, were being used in more than two-thirds of the locali
ties.
TABLE 1: Programs to Structurally Alter the Environment
Method
1. Shoreline Protection Works (bulkheads, seawalls, revetments)
2. Flood Control Works (dikes, channels, retaining ponds)
3. Sand Trapping Structures (groins, jetties)
4. Sand Moving Programs (beach nourishment, beach scraping)
Number of communities using technique (percentage of total)
289 (68.8%)
142 (33.8%)
141 (33.6%)
129 (30.7%)
Average Effectiveness Rating
(on a 5 point scale)
3.20
3.47
2.72
2.77
Table 2 shows the use of programs to strengthen buildings and facilities.
Almost all localities had adopted the minimum elevation and floodproofing
required under the NFIP (93.8%), and most had adopted a building code (90%).
Almost half of the localities (46%) were using additional storm-resistant
standards for coastal construction. While more extensive elevation and flood
proofing requirements were only used by approximately 15% of the localities,
they had the highest effectiveness rating of the listed policies.

276 ml LOCATION
TABLE 2: Programs to Strengthen Buildings and Facilities
Number of communities using technique
Method (percentage of total)
1. Minimum elevation and flood- 394 (93.8%) proofing required under the NFIP
2. Building Code 378 (90.0)
3. Special Storm-Resistent Building 198 (47.1) Standards
4. F100dproofing of Public Facilities 161 (40.2) and Structures (sewer and water, roads, utilities)
5. More extensive elevation and floodproofing than required by the NFIP
62 (14.8%)
Average Effectiveness Rating
(on a 5 point scale)
3.86
3.6
3.82
3.47
3.94
The survey asked a number of questions regarding the use of development
management in these jurisdictions. "Development Management" was defined to
include programs or policies which control or influence the location, density,
timing, and type of development in a jurisdiction. (See Brower et al., 1984 for a general discussion of development management; and Mr.Elyea, Brower, and
Godschalk, 1982 for an application of these techniques to hazard mitigation.)
Twenty-one different development management programs or policies were listed
for communities to identify as in use in their localities. Most local govern
ments are using a number of development management techniques: 29% indicated
that between one and five techniques were being used, almost 55% were using six
to ten measures, 15% had more than 11 development management measures in use.
Table 3 lists the 21 development management measures by their frequency of
use by the surveyed localities, and indicates their average perceived effect
iveness at reducing storm hazards. Over 80% of the localities had zoning ordi
nances, subdivision ordinances, and land use plans; however, these three tech
niques were not rated as particularly effective in reducing coastal storm
hazards. Special hazard area ordinances, while only in use in 26% of the localities, received the highest overall effectiveness ranking of 3.85 (on a

TABLE 3: Development Management Measures by Order of Frequency Used
Rank Order Type of Measure
Number of communities using technique (percentage of total)
1. Zoning ordinance 368 (86.6%)
2. Subdivision Ordinance 359 (85.5%)
3. Comprehensive/Land Use Plan 352 (83.8%)
4. Evacuation Plan 278 (66.2%)
5. Shoreline setback regulation 225 (53.6%)
6. Capital improvements program 222 (52.1%)
7. Location of public structures and 193 (46.0%) buildings to reduce storm risks
8. Dune Protection regulations 159 (37.9%)
9. Location of capital facilities to 131 (31.2%) reduce or discourage development in high hazard areas
10. Acquisition of undeveloped land in 121 (28.8%) hazardous areas
11. Special hazard area ordinance 109 (26.0)
12. Hazard di R" 1 OgurE' requirements in 107 (25.5%) real estate transactions
13. Transfer of development potential from 89 (21.2%) hazardous to non-hazardous sites
14. Recovery/reconstruction plan or 88 (21.0%) policies
15. Hurricane/storm component of 81 (19.3%) comprehensive plan
16. Construction practice seminars 65 (15.5%)
17. Acquisition of development rights 58 (13.8%) or scenic easements
18. Reduced or below market taxation 45 (10.7%)
19. Acquisition of damaged buildings 14 (3.3%) in hazardous areas
20. Building relocation program 9 (2.1%)
21. Impact taxes or special assessments 8 (1.9%)
Average Effectiveness Rating
(on a 5 point scale)
3.15
3.06
2.94
3.54
3.59
2.55
3.66
3.68
3.41
3.61
3.85
2.92
3.44
2.99
3.34
3.22
2.88
3.02
3.3
3.33
3.75

278 ON LOCATION
scale of 1 to 5). Impact taxes or special assessments were also considered
highly effective in reducing coastal storm hazards (a 3.75 effectiveness ranking), yet less than 2% of the localities have such programs. Dune protec
tion regulations were considered the third most effective measure, and 38% of
the localities have such regulations. The survey also attempted to obtain insights into factors which influence
the political feasibility of development management. Respondents identified
what they perceived as obstacles in their community to the enactment of devel
opment management. These are listed in Table 4 by order of frequency.
TABLE 4: Obstacles to the Enactment of Development Management
Number of Communities with Attitude
Attitude (percentage of total)
1. General conservative attitude toward 327 (87.7%) government control of private property rights.
2. General feeling that the community can "weather the storm"
3. Lack of adequate financial resources to implement mitigation programs
4. More pressing local problems and concerns
5. Lack of trained personnel to develop mitigation programs
6. Lack of incentives or requirements from higher levels of government
7. Opposition of real estate and development interests
8. Opposition of homeowners
9. Opposition of business interests
10. Absence of politically-active individuals and groups advocating hurricane/storm mitigation
11. Inadequate or inaccurate federal flood insurance maps
317 (85.4)
304 (84.4%)
300 (82.2%)
287 (80.2%)
286 (79.9%)
294 (79.7%)
260 (73.9%)
248 (70.7%)
248 (70.7%)
221 (62.3%)
Importance Rating (on a 5 point scale)
3.35
3.07
3.41
3.26
2.91
3.00
3.03
2.63
2.59
2.82
2.48
Brower/Hegenbarth 279
The four obstacles cited by more than 80% of the responding localities were
considered the top four in importance or severity: 1) the general conservative
attitude toward government control of private property rights, 2) a general
feeling that the community can "weather the storm," 3) lack of adequate finan
cial resources to implement mitigation programs, and 4) more pressing local
concerns.
Respondents also indicated the existence and importance in their locali
ties of several popular arguments against development management. Almost 85%
of the responding communities indicated that an important argument used in
their community against the enactment of development management was that such
measures lead to increased development costs. Other arguments cited by commun
ities as important were: decisions about risks from coastal storms are best
left to the individual (71%), development management measures will dampen the
local economy (68.5%), and particular development management measures are illegal or unconstitutional (66%).
Regarding development management programs already in place, almost half
(49%) of the respondents indicated that they had encountered implementation or
enforcement problems. The most frequently cited problem was insufficient
funds, mentioned by 60% of the responding localities. In addition, 46% noted
problems due to public opposition, 43% cited a lack of support by public offi
cials, and 41% noted that lack of qualified personnel was a problem. Other
problems less frequently cited were an insufficient data base, opposition from
developers, and public apathy. In addition, approximately one-third of the
respondents perceived that their localities had experienced negative consequen
ces as a result of development management programs. The great majority of
these affected communities cited an increase in construction costs (84%), while
much smaller percentages indicated that they had experienced slowed economic
growth and development (20%), reduced tax revenues (15%), or reduced land
values (11%). Implications for Planning
Some important trends and relationships have emerged from these prelimi
nary survey results which can provide insights for those concerned with hazard
mitigation and the reduction of coastal flood hazards. Lack of adequate finan
cial resources is cited as the greatest obstacle to development management-
both in enacting measures, and in enforcing and implementing existing measures. Coastal communities frequently have limited administrative and financial capac-

280 ON LOCATION
ities, and may not be able to afford expensive land use or management studies.
Historically, funds have been accessible for structural flood control studies
and projects, while difficult to procure for non-structural hazard mitigation
measures (Kusler, 1982, p. 71; David, 1984, p. 32). Structural measures have become increasingly cost-prohibitive to construct, expensive to maintain over
time, and are often ineffective in reducing long-term coastal hazards. More permanent and cost-effective hazard mitigation solutions may be achieved at the
local level through development management, but this will likely require finan
cial support from state or federal sources.
Because of their financial limitations, many coastal communities cannot
afford full-time planning staff, and where staffs exist, they may have limited
technical capabilities. Further analyses of the survey data showed that the
adoption of explicit hazard reduction strategies and development management
measures were positively linked with both the community's population size, and
number of planning personnel. Not surprisingly, communities with explicit
hazard mitigation policies were linked with regional agencies active in storm
hazard mitigation, and effectiveness of a community's development management
program increased with the respondent's increasing knowledge of sources of
state assistance. These illustrate the important role that state and regional
agencies can play in assisting local communities with adopting hazard mitiga
tion and development management measures. Outside technical assistance and
expertise will also help local decision makers Lo consider hazard miLigation and development management measures with which they may be unfamiliar or inex
perienced. Political opposition, lack of interest, and more pressing local problems
also appeared to created substantial impediments to enacting development man
agement measures. State and federal regulations that require communities to
address coastal storm threats through development management and other non
structural mitigation techniques help deflect public opposition away from local
officials. In addition, it is widely perceived that development management
measures may dampen the local economy and increase development costs; communi
ties may be hesitant to enact measures because they perceive that they may
become economically less competitive with other communities. ReqUirements from
the state or federal level for such measures would eliminate this, while ensur
ing that all communities address at least a minimum of nonstructural hazard mitigation efforts. For instance, the North Carolina coastal management pro-
Brower/Hegenbarth 281
gram requires local land use plans for all coastal communities, and has recent
ly passed a requirement that all communities address hazard mitigation and postdisaster reconstruction planning.
Strengthening state and federal support for development management will
help to overcome obstacles and implementation problems, but to achieve success
ful and effective local programs, planners and policy makers need to address
and diffuse the popular arguments and attitudes against development management.
Some of these arguments may be based more on perceptions than experience-- over
300 surveyed communities indicated that an argument against development manage
ment in their community was that increased developmental costs resulted from
development management, but only one-third of this number had seen any such
increase. Similarly, while "development management measures dampen the local
economy" was an attitude existing in a great number of surveyed communities,
very few actually perceived that their community had experienced slowed econo
mic growth and development as a result of such measures.
Where measures have led to an increase in development costs, these can
usually be explained as a shift of the additional costs required by coastal
development from the community and public at large onto those who directly benefit from such development--the private developers and individual purchasers
of hazardous development. Supporters of positions that advocate the rights of
individual decisions regarding coastal development and risk-taking will have
trouble justifying the use of public expenditures to help pay for the addition
al costs imposed by such development.
Advocates of development management need to emphasize other public issues
affected by coastal development. The quality of public beach fronts can be
deleteriously affected by unwise coastal development. Because of the public
safety issues posed by hurricanes and severe coastal storms, the ultimate land
use pattern and intensity of an area should not be created solely by private
decisions regarding individual risks. The need for an adequate evacuation
capacity, and the damage potential to neighboring properties created by storm
swept debris from hazardous construction highlight two of the unique public
safety issues that are present in coastal development. Planners and policy makers need to emphasize such public safety issues to help overcome conserva
tive attitudes toward private property regulation. Finally, it is important for proponents of development management to fit
hazard mitigation objectives into existing community goals and policies. The

282 ON LOCATION
survey results indicated a relatively high degree of local concern over the
hurricane and severe coastal storm threat, but were less conclusive on the
effectiveness of localities' attempts to address this concern through develop
ment management techniques. In many areas, local pol icy makers may simply be
unfamiliar with the concept of reducing hurricane hazards through development
management measures, addressing the threat by relying instead on strengthening
and reinforcing the built environment, or by increasing evacuation capacity. In many coastal localities, other more pressing concerns appear to create
obstacles to the enactment of specific programs or policies for hazard mitiga
tion. In these cases, effectiveness in enacting mitigation programs may be
increased by combining hazard reduction policies with other community objec
tives. Case studies conducted of hurricane-prone communities indicated that
hazard-reducing development management policies which were locally initiated
were supported for a number of community goals. Related local issues that may
garner broader support include desire for open space, public beach access,
concern over aesthetics, and worry over water quality and other environmental
impacts of development. Emphasizing the multiple community benefits that
result from prudent hazard-reducing development management measures will help
to overcome the existing obstacles to development management that still persist
in many communities.
Beatley, 1985
References Timothy, et a 1. Storm Hazard Reduction Through Development Management: Results of a Survey of Hurricane-prone Localities in Nineteen Coastal States. Chapel Hill, NC: University of North Carolina, Center for Urban and Regional Studies.
Brower, David, et al. 1984 Managing Development in Small Towns. Chicago: APA Planners Press.
David, E., and J. Mayer 1984 "Comparing Costs of Alternative Flood Hazard Mitigation Plans."
Kusler, 1982
McElyea, 1982
Journal of the American Planning Association 50 (winter): 22-35.
J. A. Regulation of Flood Hazard Areas to Reduce Flood Losses: Volume 3. Boulder: Natural Hazards Research and Applications Information -Center.
w., D. Brower, and D. Godschalk Before the Storm: Managing Development to Reduce Hurricane Damages. Chapel Alll, NC: Onlverslty of North Carollna, Center for Urban and Regional Studies.
FLOODPLAIN MANAGEMENT IN SOUTHERN CALIFORNIA'S ANTELOPE VALLEY
James L. Easton
Los Angeles County Department of Public Works
Introduction
The Antelope Valley is located in the southwestern portion of the Mojave
Desert in northernmost Los Angeles County. It has a population of over 100,000
people and is one of the fastest growing areas in Southern California. It's
an area that has long been known for its agri culture, but in recent years two
cities (Lancaster and Palmdale) have incorporated and are part of a rapidly expanding
urbanized area. The Valley is also a center for several activities important
to national defense; e.g., the construction of the B-1B a~d Steal th Bombers and
the Air Force's experimental flight test and space shuttle activities at Edwards
Air Force Base.
The Valley has rather unique and severe drainage problems that are not
a great threat to agricultural interests but which are a substantial hazard to
and are exacerbated by the rapid urbanization in and around the cities. If growth
in the Valley is sustained and in order to protect its current residents, the
cities and the Los Angeles County Department of Public Works are formulating
and intend to implement plans for nearly $1 billion of flood control and water
conservation infrastructure that will require the cooperation and participation
of many governmental agencies, the public, and private land developers. It will
use a combination of structural improvements and nonstructural flood plain management.
Physical Characteristics of the Valley
Climate
The Valley floor is desert with an annual normal rainfall of nine inches
in the foothills to five inches at Edwards Air Force Base. In the adjacent San Gabriel
and Techachapi Mountains however, rainfall is much greater and often more intense.
Summer thunderstorms, although infrequent, can produce very high-intensity, flash
flood-producing rainfall in the sUlTl1ler and fall.
284 ON LOCATION
Geography and Drainage
The Los Angeles County portion of the Valley has seven major drainage areas.
Each begins in the mountains that bound the Valley on the west and south. Storm
run-off from the mounta i n canyons has formed 1 arge all uvi a 1 fans across whi ch
it meanders in ill-defined and often-changing paths.
The Valley is a drainage basin with no natural outlet. The flow that does
not percolate into the ground in the upper watersheds finds its way into Rosamond
or Rogers Dry Lakes (Edwards Air Force Base) where there is practically no percolation.
During rainy years, the lake beds may be flooded for several months.
Population
Much of the Antelope Valley is unimproved desert land. For many years,
where water has been available, agriculture has and continues to flourish. The
continued agricultural activities in the Valley plus a rapidly expanding population
have caused serious overdrafting of the Valley's groundwater resources.
Several factors are causing population growth:
1. The aerospace i ndu stry is growi ng. The B-IB Bomber is bei ng con structed .
there, and a new plant to build the Stealth Bomber is under construction.
The Air Force Flight Test Program at Edwards Air Force Base emplo'ys
approximately 2,000 people.
2. The on-again, off-again plans for the Palmdale Intercontinental Airport
(a proposed supplement to Los Angeles International Airport) may ultimately
lead to a substantial increase in commercial activity in the Valley,
with attendant population growth.
3. Housing is reasonably priced, which is attracting people' who work in
the Santa Clarita and San Fernando Valleys, both of which are accessible
within minutes via the Antelope Valley Freeway.
The new North County Element of the Los Angeles County General Plan provides
for population in the Valley of approximately 218,000 in the year 2000.
Flood Plain Management Crisis
The urbanization of the Valley that has taken place in the past has not

Easton 285
adequately recogni zed the fl Dod hazard from waters that 1 eave the mountai n canyon
mouths and traverse the broad all uvial fans and ultimately flow into the dry
lakes. Past residential development has been required to provide facil ities only
for the storm drainage from the site itself. This resulted in construction of
storm drains outletting into on-site retention and detention basins. These facilities
are not connected to any regional drainage facil ities because none currently exist,
with the exception of an improved open channel that serves the agricultural community
of Littlerock and Amargosa Creek, an earthen channel through the City of Lancaster.
The severe flooding in the Valley that occurred during the storms of 1978,
1980, and 1983 focused the attention of the residents of the Valley and governmental
officials on the fact that present and future development could not be adequately
protected unless a plan were formulated and implemented to provide regional drainage
facil ities. A need to maximize conservation of storm runoff to replenish badly
overdrafted groundwater supplies is also recognized.
The situation is complicated by the fact that no single public agency is
currently responsible for flood control and water conservation in the Los Angeles
County portion of the Valley. The Los Angeles County Flood Control District's
northernmost boundary line is along the southern portion of the Valley and has
prevented the District from extending its service to most of the Valley.
The Evolution of a Master Plan for Storm Drainage and Water Conservation
In late 1984 and early 1985, several things combined contributed to the
formation of a master plan for storm drainage and water conservation in the Valley.
The Los Angeles County Regional Planning Commission threatened a building moratorium
in unincorporated territory unless such a plan were formulated. In the fall
of 1984, the Los Angeles County Board of Supervisors consolidated the Flood Control
District, County Road Department, and County Engineer into a single Public Works
Department. Since the County Engineer is responsible for insuring that land
development in the unincorporated area of the Antelope Valley proceeds in a safe
manner, the new Department of Public Works was able to utilize the expertise
of the Flood Control District in formulating a master plan for storm drainage
and water conservati on. Thi s move was greeted with enthusi asm and cooperati on
from the two incorporated cities, the Air Force Base, the City of Los Angeles

286 ON LOCATION
Department of Airports, and the development interests. A plan is being developed
for each of the seven major drainage areas within the Valley. As of April 1,
plans for four of the areas are complete. The other three wi 11 be completed
by June 30, 1985. In canyon areas, nonstructural solutions such as flood plain
management techniques will be used to insure that future development is free
of flood hazard. In areas which are or will become urbanized, the plans provide
for retention or detention basins near the mouths of canyons and at other locations
whi ch wi 11 store peak runoff and maximi ze water conservati on. Flows wi 11 be
safely carried across the Valley floor in channels. Most of these will be earthen
channels to maximize water conservation. In areas where flow velocities are
slow enough, grassy swales may be util ized. In the two easternmost watersheds,
Littlerock and Big Rock Creeks, more traditional methods of flood plain management
will be used. A 4,000-foot-wide watercourse with lined levees is being considered
for Littlerock Creek. Flood plain mapping and traditional flood plain management
methods will probably be used for Big Rock Creek which is sparsely populated
and is not used extensively for agriculture.
Funding the Plan
Total cost of producing the master plan for the seven drainage areas will
be approximately $300,000. Funds have been contributed by the Cities of Palmdale
and Lancaster, the Los Angeles County Flood Control District, and the County of
Los Angeles. Allocation of some Federal block grant funds through the County
is expected. Funding contributions are al so being sought from the Air Force
and the City of Los Angeles Department of Airports.
Funding the Improvements
In late 1984, the Department of Public Works convinced the Los Angeles
County Regional Planning Commission to exact development fees for all tract improvements
and lot splits in the Antelope Valley. The fees are $2,000 per single-family
residence and $1,000 per multiple-family unit in tract developments and $10,000
per cOTll11ercial-industrial acre. These fees are being required by the Regional
Planning COTll11ission as a condition of approval of tentative tract maps or lot
splits. Currently, drainage fees are not required for development on previously

Easton 287
subdivided lands.
The developers are putting up bonds or callable letters of credit that
will be held by the Department of Public Works until sufficient funds have been
accumulated to begin work on specific high-priority elements of the master plan.
This approach has been accepted by the development conmunity and the Regional
Planning Commission after some spirited discussions with the Department of Publ ic
Works.
Federal funding is also being sought. The United States Army Corps of
Engineers has been studying the Antelope Valley streams for a number of years.
$140,000 is budgeted for Fiscal Year 1985. An identical amount is recommended
for Fiscal Year 1986. At that funding level, it is anticipated that the study
will be completed in approximately 1990.
The Corps' efforts are being focused on quantifying benefits to the Federal
Government attributable to the proposed drainage and water conservation improvements.
It is believed that the most significant of these benefits will accrue to Edwards
Air Force Base. The lake beds that receive storm runoff from the Valley are
a vitally important feature of the Base. The Fl ight Test Program, the Space
Shuttle Recovery Program, and the landing of damaged or disabled aircraft all
require dry lake beds. However, during wet years, the lake beds may be flooded
for several months. The beneri l of having a system of flood control and water
conservation facilities that will maximize the utility of the lake beds is very
high. For example, the Air Force estimates that it has saved $8 bill ion worth
of ai rcraft and a substanti al number of 1 ives over the past 25 years by bei ng
able to divert disabled aircraft to land on the dry lakes. The softer surface
of the lake bed, the minimized danger of fire, and the absence of obstructions
regardless of the path taken by landing aircraft have minimized damage and loss
of 1 ife.
The Air Force needs some water in the lakes in order to smooth the ruts
generated by wind and landing aircraft. It is believed that the flood control
and water conservation system can be designed to provide an optimum amount of
water to the 1 akes even though it wi 11 have to be done wi th some sacrifi ce of
water conservation since water delivered to the lakes will evaporate rather than
percolate.
The Department of Public Works will make available to the Corps its master
288 ON LOCATION
drainage plans and all of the supporting data as soon as they are complete.
It is hoped that this information will be adopted by the Corps and expedite the
conclusion of its study. Cooperation of the Air Force is also being sought for
possible utilization of military funds for the construction of specific off-base
improvements that will provide demonstrable benefits to the Base.
Federal block grant money is being considered for the construction of high
priority regional drainage facilities by both the cities and the County.
The City of Lancaster has also recently enacted development fees similar
to those enacted by the County and will use those funds for regional and local
drainage facilities within or near the city.
Getting From Here to There--The Interim Program
Because of the unique geography of the area, water will not follow the
paths delineated in the master plans until the facilities themselves are built.
For this reason, interim measures are being taken to protect future development.
Developers will be required to construct streets that will be located so as to
serve as temporary watercourses to conduct regional drainage safely through the
tract. Lot pads will be elevated sufficiently to prevent flooding of adjacent
homes. Facil ities will have to be constructed at the upstream side of the tract
to safely channel ize flow into the streets and at the downstream side of the
tract to safely dissipate the energy of water flowing in the street. There will
be times when travel is disrupted by reason of the streets being used as occasional
watercourses.
Developers are being encouraged to build portions of the regional system.
They will receive credit for that construction against the drainage fees being
exacted. They are required to dedicate the right of way necessary for the future
facilities whether or not they choose to construct the facilities. Again, credit
is given for the value of the rights of way.
Legislative action has been introduced to create a new Antelope Valley Flood
Control District which, if enacted, will provide a single agency that will be
responsible for the implementation of the regional drainage plan. It will also
provide a local agency to act as partners with the Federal Government in cooperative
local Federal construction.
Easton 289
Summary and Conclusions
Antelope Valley presents some unique challenges because of its climate,
geography, and demography. Normal flood plain management approaches are not applicable
in most parts of the Antelope Valley (i.e., the Valley floor).
The cooperative action now being taken by a number of governmental agencies
and private developers will allow development to continue and provide funds for
the construction of the most-needed elements of a regional drainage system. The
system will utilize a wide variety of flood plain management techniques ranging
from concrete-lined channels to grassy swales. It will protect a large urbanized
area, maximize water conservation, and provide more utility of the dry lakes
at Edwards Air Force Base.
South of the mountains in the Los Angeles Basin, the flood control and
water conservation system was constructed largely after development had take,l
place. The Antelope Valley provides an opportunity to construct this important
infrastructure as development takes place but will require the continued close
cooperati on of developers, government, and the publ i c. The Department of Publ i c
Works intends to meet that challenge.
FLOOD ORDINANCES: NATIONAL MODELS VS. LOCAL PROBLEMS
Maggy Hurchalla Martin County, Florida
We are here today from mountains and beaches and swamps and big rivers.
We have two things in common back home: 1) It floods.
2) We're growing.
I say the second with some confidence since where water is, people generally
want to be. With some mosquito control, air conditioning, and affluence, every
one wants a puddle of their own. In the fast-growing counties of Florida, our population doubles every ten
years. If we figure out what to do right this year, we'll have only half the
problem in ten years. If we don't figure it out, we will have three times the problem in 20 years. In figuring out what to do, many of us have been through the process of adopting a FEMA model "under the gun." Given a time deadline and the unthinkable penalty of loss of mortgage money, the process is stilted at best. With time, and the local will to do something, purely local solutions can be hung on the federal model ordinance for the best of both worlds.
While the federal model pays obeisance to the language and thoughts of Congress, it is mostly a hardware solution directed at the specific numbers of
a specific study. And what's wrong with that? Surely it is better to base laws on engineering statistics than on undefinable whim. The problem is that the
"engineering facts" are hard numbers, but not necessarily facts. There is
simply not enough money, historical understanding, or scientific knowledge to
do what FEMA tried to do for every square foot of America. For example, consi
der the following instances:
1) They left out the waves. Until last year the 100- year flood
elevations in coastal areas reflected only still-water
elevations. Storms don't so limit themselves.
Hurchalla 291
2) They left out erosion. There are areas now in the ocean that were
in Band C zones a few years ago.
3) They left out the creeks. Only major rivers were mapped.
4) They left out the swamps except in special cases.
In spite of all these "left outs," I would like to urge on you the conclu
sion that what is needed is not more money and more studies and more numbers.
What is needed is a community perspective. Use the federal club and the FEMA
model, but add local knowledge and local values. Community perspective allows
you to be concerned with issues that voters and just folks understand. It
deals only with the specific circumstances of the community, so mountain towns
don't have to deal with beaches and vice versa. It deals with pieces of local
geography and history that people know.
Local government is cheaper, faster, and closer than any other. Strange as
it may seem, local government, if it chooses to be, is stronger when it comes to regulation than any other level. We tell people what they can do with
property on a regular basis through building and zoning permits.
Given all those advantages, how can they best be used? I would suggest
that the greatest failure of the federal direction is an unwillingness to use
and enforce software solutions. The legislation, the rules, and the model
ordinances deal with protection of dunes and mangrove, but not effectively.
The whole program is built around water, but it does not deal very well with
wetlands. Anyone who has managed flood plains over time knows that dunes and
mangrove and wetlands are far more important than numbers. The ground truths of
where the water is and where it goes will always be more accurate than computer
models. Software solutions are the integration of land use and environmental
regulation with flood plain management. They are based on obvious biological or
planning principles instead of computer print-outs.
Let me mention one of the drawbacks of purely local action: lack of
money. If a community perspective is to work, it must be cheap perspective.
That limitation by itself assures that local solutions must look to regulatory
standards that are more easily measured. Let's consider some examples.
By now everyone knows that sand dunes are important to prevent coastal flooding. The federal law says so, as well, yet I know of no case in Florida in
which FEMA has exercised enforcement against local governments that allow
damage to dunes. Except in the cleverer states and localities, almost everyone does some damage to the dunes. Florida is supposed to have a model setback

292 ON LOCATION
line, but some of the markers for that line are now out on the beach because of
erosion. Florida no longer allows building on the beach itself, but there are
still plenty of damaged dunes. Without federal and state funds and vast and expensive studies, how can
local government protect the dunes? It's easier than you think--simply set
lines. As long as the choice is rational, it is defensible. A good example
would be requiring that all major structures be landward of the landward toe of
the dune. There is plenty of information available and plenty of expert testi
mony that this is a rational choice in terms of flood protection, both for the
individual structure and the health of the dune itself.
One of the ironies of the regulations would be that the FEMA V zone would
no longer be buildable at all. It is important to remember that the line defi
ning that zone on the official flood maps may be meaningless and even silly.
Even with the waves added, our V zone elevation is only 12 feet for the one in
100-year storm. Every other year, however, waves come over the dune at 15 feet
in fall northeasters. That being the case, it is rational to set back off the
dune and to use a higher elevation. In the wizardry of computers and engineer
ing "proof," we need to remember that the court's standard for upholding legislative decisions is "fairly debatable" not "incomprehensible."
The beauty of using a topographic feature instead of a number is that it's
free. The ordinance can set the standard. The developer can be required to do a topographic survey as part of site plan approval in order to set the exact
location. The same idea can be used to expand the mangrove protection section
of the FEMA model. We set a line that protects all shoreline mangrove plus a
50-foot transition zone. The 50 feet did not come out of a computer, but was
rational and defensible from an environmental standpoint as well as for flood protection.
Perhaps the best example of hardware versus software is in wetland protec
tion. The FEMA model takes a purely mechanistic view of floodways that has to
do with width and height and cubic feet per second. Anyone with the slightest
local knowledge or biological training knows that the best way to stay dry is
to stay out of swamps. Soils, vegetation, and other software indicators are
good, cheap signs of wetness. Rather than measuring how wet it is, it makes
good sense to stay out of wetlands completely.
Besides the environmental benefits, there are indirect benefits for flood
control. Wetlands are more than a hydraulic chute for flood-carrying. The peat

Hurchalla 293
soils that hold and store water are part of the natural flood prevention system. The "isolated" wetlands are often important parts of river headwaters that hold and slow peak flows.
If you are in one of those places where a new and growing populace is
dashing, lemming-like, towards the wet places, you need to move now. You
haven't the time or the money to use the FEMA approach on a detailed local scale. You can use the FEMA framework and FEMA purpose. You can take the
federal club and make it into a sharp instrument for dOing what you want to
locally.

THE SAN DIEGO COUNTY FLOODPLAIN MANAGEt1ENT PROGRAM
Joseph C. Hi 11 San Diego County, California
A. Jean Brown State of California
Introduction
San Diego is one of the most rapidly growing areas in the United States. With
virtually all the major rivers and streams in a natural (unchannelized) condition,
a good flood plain management system is essential to prevent extensive construction of houses and other structures in floodway areas. The need for flood plain management was recognized more than 20 years ago. The California Department of Water
Resources (DWR) provided the initial basis for flood plain management through their publication "San Diego County Flood Hazard Investigation, Bulletin 112, 1964" and related flood plain maps.
Several major private projects used Bulletin 112 as a basis for constructing
golf courses in flood plains adjoi ni ng club houses, homes and other structures elevated above the 100-year flood level. Examples include: Carleton Hills Country Club on the San Diego River, Whisperi ng Palms Country Club in the San Dieguito River and Pauma Valley Country Club in the San Luis Rey River.
San Diego County Flood Plain Program
In 1970, the Cou nty Board of Supervi sors i ni ti ated a Flood Pl ai n Mappi ng and Management Program which now includes the following elements.
Hill/Brown 295
Detailed Flood Plain/Flooding Maps
Some of the first flood plain floodway maps were developed by the State of
California DWR for the Upper San Diego River. This is the most critical reach of
river in terms of existing flood problems and regulation of development. The maps
were published as part of the Upper San Diego River Flood Control Investigation,
Bulletin 182, February 1976. This publication recommender! Flood Plain r·lanagement
as the most effective flood control option for the river. Part of the flood plain
ma nageme nt program i ncl udes emergency procedures duri ng flood peri ods. The D\iR
publication, "Stage-Discharge Relationships and Areas of Potential Inundation for Upper San Diego River (including a portion of San Vicente Creek) and Lower San
Dieguito River, April 1976," provided detailed information to aid in emergency
flood operations. The basis came from flood plain mapping material.
Criteria used in San Diego flood plain studies is given below:
• Orthophoto base maps (200 feet/inch scale). These maps have a picture quality which helps locate flood plain and floodway lines.
• Digitized cross sections. The accuracy of digitized points is better than
one foot. Up to 99 can be used per cross section to provide a sufficient
basis for development regulation.
• Floodways have specific boundaries. The fl oodway ca n be ti ed to the California coordinate system and property lines.
Examples of flood plain maps and plotted cross sections are given in Figures I
and I1.
Even with flood plain studies, which have much better quality than the F01A studies, considerable opposition from property owners was experienced in the imple
mentation of flood plain maps for zoning land development purpose.
County flood plain mapping and planning program began prior to implementation
of the National Flood Insurance Program (NFIP). As Federal funds became available,
the two programs were coordinated so that criteria and flood plain studies are
compatible. The programs were also coordinated with the cities.
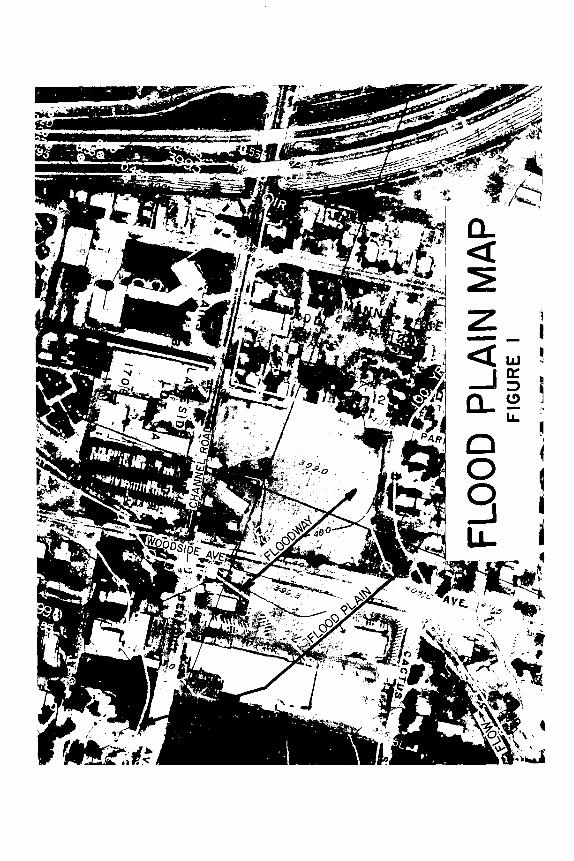
'. ~ '" ..... . . . - .... ~-
.' " ~ " , " ... .. "
a.. « ~
"
,.>;~I
~l . ,
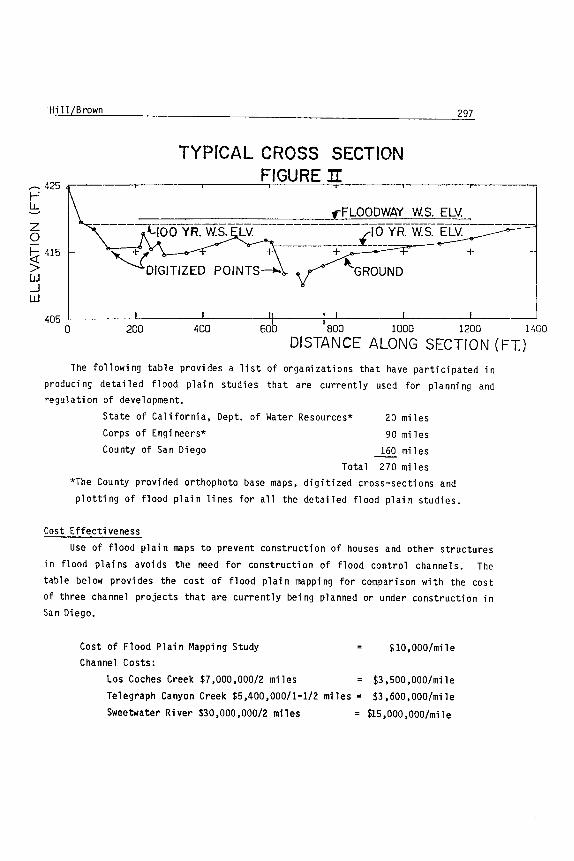
'Hi 11 /Brown 297
TYPICAL CROSS SECTION FIGURE JI
~425 ~-------r------~------~~~~~~~------r-------.-------~ r: LL ........
z o
,-FLOODWAY W.S. ELV.
ti 415
>
LV. .£10 YR. W.S. ELV. ~ +1' + -----------~--- ---- +
~DIGITIZED POINTS- ~GROUND W ..J W
405 o 200 400 600 800 1000 1200 1400
DISTANCE ALONG SECTION (FT)
The following table provides a list of organizations that have participated in
produci ng detailed flood plai n studies that are currently used for planni ng and regulation of development.
State of California, Dept. of Water Resources* 20 miles
Corps of Engineers* 90 miles
Cou nty of Sa n Di ego 160 mil es
Total 270 miles *The County provided orthophoto base maps, digitized cross-sections and
plotting of flood plain lines for all the detailed flood plain studies.
Cost Effectiveness
Use of flood plain maps to prevent construction of houses and other structures
in flood plains avoids the need for construction of flood control channels. The
table below provides the cost of flood plain mapping for comparison with the cost of three channel projects that are currently being planned or under construction in Sa n Di ego.
Cost of Flood Plain Mapping Study Channel Costs:
$10, OOO/mil e
Los Coches Creek $7,000,000/2 miles = $3,500,000/mile
Telegraph Canyon Creek $5,400,000/1-1/2 miles = $3,600,000/mile
Sweetwater River $30,000,000/2 miles = $15,000,000/mile
298 ON LOCATION
The cost of constructing channels is 350 to 1,500 times more than flood plain management in these examples. The three creeks and rivers listed above have flood
plain/floodway maps which are used to prevent additional construction that would be
damaged by a lOa-year flood. However, so many houses and other structures are in
the identified flood plain that channel construction is the only option available.
Basis for Flood Control Design Proposed development in flood plains is aided by a flood plain study. Most of
the information needed for design of bridges, channels and other structures is
available, and the extent of potential flooding is defined. It is standard
practice in San Diego County to use flood plain studies as a basis for design.
The most common type of development in flood plains is construction in the
fringe area. This can be accomplished easily with practically no additional flood
control engineering.
National Flood Insurance Program The County of San Diego (un; ncorporated area) entered the Emergency Phase of
the National Flood Insurance Program (NFIP) in 1971. Ordinances have been adjusted
so they are in conformance wi th NFl P criteri a. The Cou nty (u ni ncorpora ted area)
entered the Regular Phase of the NFIP in 1984.
Planning
The flood plain maps provide a basis for future planning and have been incorporated into the County General and Community Plan maps. They are also used in the
zoning process by the County. Community plans can specify special conditions relative to flood plains to
reflect the desires of the citizens. Some communities elect to leave flood plains natural. Others use the flood plai n maps, cross-sections, etc., as a basis for
channel design.
Environmental Considerations The County General Plan recommends that floodways be left in a natural condi
tion unless existing structures are present, making channels desirable for safety

Hill/Brown 299
reasons. This approach is similar to that expressed by the Federal Government
through Executive Orders 11988 and 11990.
Erosion and Sedimentation Considerations
In some locations, river beds are subject to extreme change during flood con
ditions. Lateral erosion during flooding can move a river several hundred feet
outside the bank of a floodplain that has been defined with clearwater analytical
methods. Sedimentation can raise a river bed--and the floodplain level--many feet
above and beyond the clearwater floodplain. River lengths affected by major
erosion and/or sedimentation is 10% to 20% in San Diego. While the percentage of
river lengths is not great, the effect on property is. There are documented cases
in which floods of la-year and 50-year recurrence intervals have damaged structures
and property outside existing floodplain boundaries.
A publication by the State of California, DWR has been helpful in evaluation
problems. "Erosion and Sedimentation in San Diego County Watersheds" provided a
basi s for determi ni ng sediment yiel ds from watersheds quantifyi ng the increase in
flood flows resulting from urbanization of a watershed and anticipating erosion and
sedimentation in the San Diego River. This report predicted that major floods
would put the 1,000 foot long Highway 67 bridge over the San Diego River in danger
of failure. The 1978 and 1980 floods eroded the riverbed to the extent that the
State replaced the entire bridge with a new structure.
Howard Chang, professor at San Diego State University and consultant, has
developed procedures for evaluation of erosion and sedimentation in rivers. Sever
al papers have been published in the American Society of Civil Engineers, Hydraul
icsJournal.
Summary and Conclusion
Rapid growth in an area with natural flood plains, such as San Diego, requires
a comprehensive flood plain management program. Otherwise, houses and other struc
tures will be constructed in unidentified flood plains, with danger to life and
damage to structures as the i nevi tab 1 e floods occur in the area. Structural pro
tection of houses and other buildings that are built in flood plains can be
300 ON LOCATION
expected to be 300 to 1,500 times more expensi ve than the cost of managi ng the
flood plain. Over 250 miles of flood plains have been mapped and are used for regulation of
development in San Diego. The flood plain areas are identified in community planning maps. Environmental aspects of natural flood plains are incorporated in planning activities. The San Diego Program received an Outstanding Civil Engineering
Achievement Award from the San Diego Section of the American Society of Civil Engi
neers i n 1982. The State of California, DWR was instrumental in initially identifying and
providing the basis for directing development away from major flood plains. A
coordinated effort between the State, federal and local government has provided an essential flood plain management program for San Diego.
References
State of California, Department of Water Resources
1964 San Diego County Flood Hazard Investigation, Bulletin No. 112
1976 Upper San Diego River Flood Control Investigation, Bulletin No. 182
1976 Stage-Discharge Relationships and Areas of Potential Inundation for Upper San Diego River (Including a Portion of San Vicente Creek) and Lower San Dieguito River in San Diego County
1977 Erosion and Sedimentation in San Diego County Watersheds
CHANNEL CHANGE IN SOUTHERN ARIZONA-IMPLICATIONS FOR FLOODPLAIN MANAGEMENT
Marie S. Pearthree Pima County Department of Transportation
and Flood Control District
Frequent changes in morphology and position of alluvial channels of
ephemeral streams create uncertainties for floodplain management in the semi
arid southwestern United States. Federal floodplain management regulations,
which form the basis for local floodplain management, are primarily concerned
with overbank flooding. In the Southwest, however, channel bank erosion and
lateral channel migration often present hazards of equal or greater magnitude
than overbank flooding, yet they are not adequately addressed in the federal
regulations nor often brought to the attention of communities enacting flood
plain management programs. Frequent channel changes also lead to erroneous
flood hazard delineation, when it is based on standard engineering procedures
that utilize rigid channel boundary models. Instability of channel configur
ations leads to variability in the areal extent of inundation during the 100-
year and lesser floods.
This study documents channel change along an alluvial stream system and presents steps taken by one community to regulate urban development adjacent to
such stream systems. The Rillito Creek system of Pima County, Arizona, consis
ting of Rillito Creek and major tributaries Pantano Wash and Tanque Verde
Creek, was chosen for study because of severe channel bank erosion in recent
years within the rapidly expanding Tucson metropolitan area. Encroachment of urban development onto the floodplains of this stream system has resulted in
widespread erosional damage to public facilities, commercial/ industrial
structures, and private residences. The Rillito Creek system drains approximately 934 square miles (2419
square kilometers) of southeastern Arizona (see Figure 1). The watershed
consists of large lowland areas surrounded by mountains, with elevations
ranging from 2200 feet (690 m) to 9450 feet (2880 m). Vegetal cover varies
from the Sonoran Desert communities of creosote bush, desert saltbush, and
cacti in the lower-lying basin and foothill areas, to evergreen forest at the
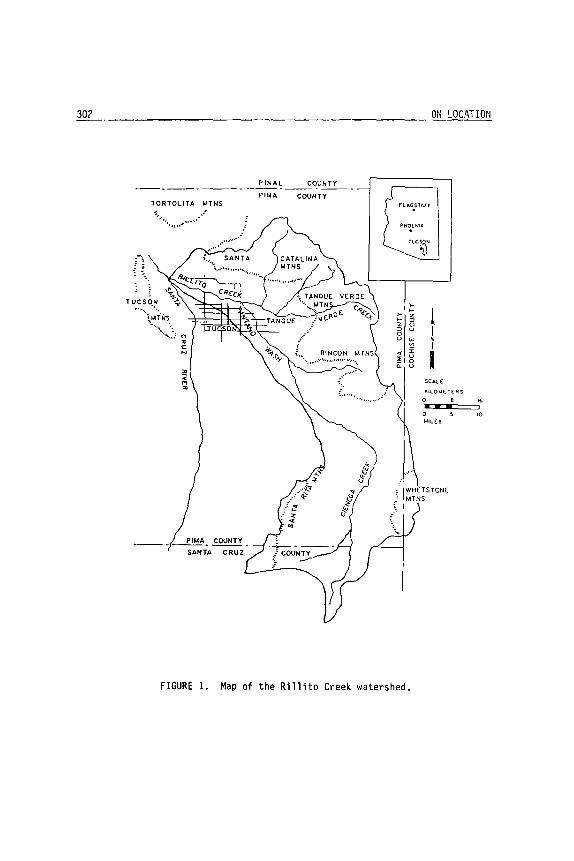
302 ON I OC,lI.TIOtl
PINAL COUNTY
PIMA COUNTY TORTOLITA MTNS
"::, ~" "
·'.1 ....... ••• PHOENIX
,>-
1 >-I-Z
I- ::> z 0 ::> u I 0 u N
I
I SCALE
, KllOt.AET[RS .. 0 , , . • . .
'0 MH .. (S
----~-~. SANTA CRUZ
FIGURE 1. Map of the Rillito Creek watershed.

Pearthree 303
highest elevations (Schwalen, 1942; Turner, 1974). Mean annual precipitation
increases with elevation, ranging from approximately 10.5 inches (267 mm) to 37.5 inches (953 mm) (Grove, 1962).
There is usually rainfall during two distinct seasons, summer and winter,
separated by dry periods. Summer storms typically consist of thunderstorms of
limited areal extent that result from surges of moist tropical air from the
Gulf of Mexico and the Pacific Ocean (Durrenberger and Wood, 1979; Sellers and
Hill, 1974). Winter rainfall, which tends to cover larger areas and be of
longer duration, originates from low-pressure systems and cyclonic storms from
the Pacific Ocean. Remnants of tropical storms also drift northward into
Arizona in August, September, and early October, and occasionally produce large
amounts of precipitation and sizable floods (Durrenberger and Wood, 1979).
Streamflow Characteristics
As in all semiarid regions, streamflow in the Rillito Creek system is
extremely variable, due primarily to differences in watershed topography and to
the temporal and spatial distribution of rainfall. Annual peak flow records
are generally dominated by low flows with a few years of high flows (see Figure 2) •
At least two distinct flow regimes are present in the Rillito Creek sys
tem. Summer flows are characterized by high peak discharges and short dura
tions. Winter flows are usually of lower peak discharge but longer duration.
Pantano Wash flow5 primarily in response to intense local summer thunderstorms
and carries sediment loads consisting mainly of fine grain sizes from the large
sedimentary basin areas that it drains (Saarinen et al., 1984). In contrast,
Tanque Verde Creek conveys more winter flow that includes snowmelt runoff and
coarser sediment sizes from the predominantly mountainous areas of its water
shed. The more equitable distribution of summer and winter flow and coarse
sand load of Rillito Creek are the result of the combined contributions of the Pantano Wash and Tanque Verde Creek drainages. Extreme flow events resulting
from summer tropical storms or extended periods of heavy winter precipitation,
typified by high peak discharges, prolonged durations, and high sediment loads,
may constitute a third flow regime (Keith, 1981).
Historical Channel Change
Channel change within the Rillito Creek system since 1941 has been charac
terized by prolonged periods of channel narrowing interrupted by abrupt epi
sodes of locally severe channel bank erosion and general channel widening
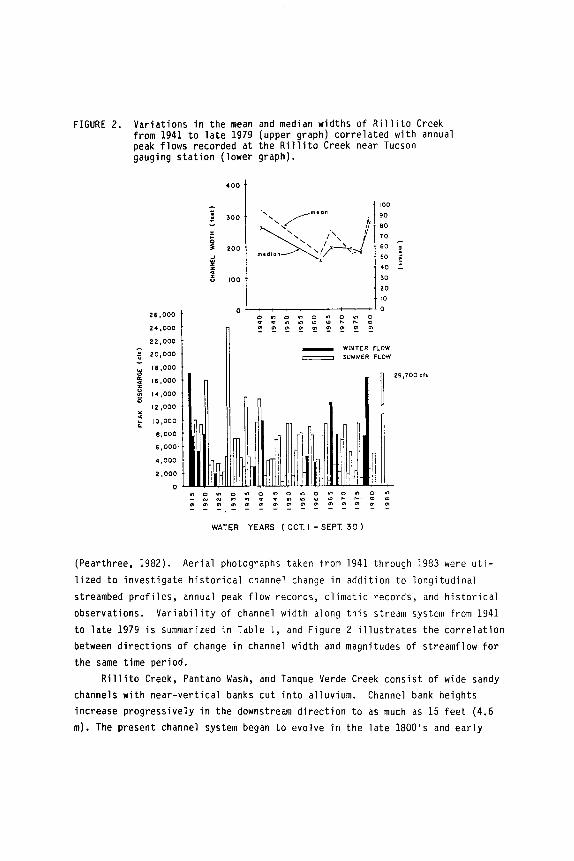
FIGURE 2. Variations in the mean and median widths of Rillito Creek from 1941 to late 1979 (upper graph) correlated with annual peak flows recorded at the Rillito Creek near Tucson gauging station (lower graph).
400
", .....---m.an .1 ~ooo '/ /I BO ',...... /', j 70
'- /1 ~ 60 ~;._ median-------- '.i .:::--:i 50_
40
300
200
100 30
20
10
26 ,000 o
0 on 0 on 0 on ~ on 0
" " on '" '" '" ... ., 24,000 co co co ~ co ~ ~ ~ co
22,000 - WINTER FLOW 20,000 = SU"-CMER FLOW
18,000
16,000
14,000
12,000 ~ 29,700 r;;f,
" ~ J 0,000 .. B,OOO
6,000
",,000
2,000
0
~ ~1 ~M I ~ ~~
n
I~~i 'I
~~i~ '[ " I "
on 0 on 0 on 0 on 0 on 0 '" 0 on 0 on - N N ~ ~ " " on on '" '" ... ... ., ., !: co co co co co co co co co co co co co co - - -
WATER YEARS ( OCT. 1 - SEPT. 30)
(Pearthree, 1982). Aerial photographs taken from 1941 through 1983 were uti
lized to investigate historical channel change in addition to longitudinal
streambed profiles, annual peak flow records, climatic records, and historical
observations. Variability of channel width along this stream system from 1941
to late 1979 is summarized in Table 1, and Figure 2 illustrates the correlation between directions of change in channel width and magnitudes of streamflow for the same time period.
Rillito Creek, Pantano Wash, and Tanque Verde Creek consist of wide sandy channels with near-vertical banks cut into alluvium. Channel bank heights increase progressively in the downstream direction to as much as 15 feet (4.6 m). The present channel system began to evolve in the late 1800's and early

Pearthree 305
Table l. Variations in mean and median channel width and standard deviation. from 1941 to 1979, of Tanque Verde Creek (ai, Rillito Creek (bl, and Pantano Wasn (c). Channel ... i dth .... as ~asured It 22 cross-section locations along Tanque Verde Creek., 3S along Rillito Creek.. and 31 along Pantano Wash.
(al
fo'Ean Channel Mealan Channel Standard iirne Percent and Dire.:~'o:'l of Year .i dth Wi dth Deviation Per~ od CtHn~e in Charne1 'II'IC:I'I
( ftl (ml ( ftl (ml (ftl (ml mean medi an
1941 231 70 211 64 76 23 1941-1963 -26 -36
1963 171 52 136 42 92 28 1963-1967 +36 +40
1967 233 71 191 58 98 30 1967 -1974 -19 -22
1974 189 58 149 45 81 25 1974-1978 +14 +29
1978 215 66 192 59 80 24 1978-1979 +24 +34
1979 266 81 258 79 104 32
(bl
1941 321 98 262 80 179 55 1941-1963 -45 -40
1963 178 54 158 48 91 28 1963-1967 +41 +25
1967 250 76 197 60 167 51 1967 -1974 -29 - 3
1974 180 55 190 58 99 JO 1974-1978 + 7 - 3
1978 192 58 184 56 97 30 1978-1979 +49 +46
1979 285 87 269 82 126 J8
(c I
1941 569 173 558 170 226 69 1941-1963 -22 -16
1963 446 136 467 142 184 56 1963-1967 -16 -29
1967 377 115 330 101 157 48 1967-1974 -13 -10
1974 327 100 298 91 126 J8 1974-1979 -14 - 9
1979 280 85 Z71 83 106 32

1900's when arroyo-cutting prevalent throughout the Southwest initiated channel entrenchment (Cooke and Reeves, 1976). Prior to 1941, the Rillito Creek system
exhibited braided channel patterns resulting from extended periods of drought
followed by one or more wet years (see Figure 3). Between 1941 and the early
1960's, single channel patterns developed in response to low-magnitude summer
flows. In the early 1960's, the behavior of Pantano Wash began to diverge from
that of Rillito Creek and Tanque Verde Creek. From 1963 to late 1979, Pantano
Wash steadily incised as the channel narrowed and the streambed degraded. Mean
channel width decreased from approximately 570 feet (173 m) to 280 feet (85 m),
and the streambed dropped locally as much as 12 feet (3.7 m). However, severe
local channel bank erosion ranging up to 375 feet (114 m), produced by occa
sional meandering low and by significant flow events in 1958, 1970, and 1971,
accompanied this narrowing trend.
In contrast, Tanque Verde Creek and Rillito Creek have widened and
narrowed in cyclical fashion (Figure 3). In December, 1965, the fourth storm
in a series of five consecutive winter storms produced a flow event with an
estimated recurrence interval of 27 years in Tanque Verde Creek and 16 years in
Rillito Creek (Aldridge, 1970). Runoff was augmented by snowmelt from the
higher elevations of the watershed. Extreme channel bank erosion ranging up to
680 feet (107 m) occurred along both stream channels in conjunction with gen
eral channel widening (Figures 3 and 4), resulting in 1.25 million dollars in
damages (Arizona Daily Star, 1965). The largest increases in channel wirlth
were produced by erosion of the concave banks of channel bends, which migrated
in the downstream direction. Following this event, many of the eroded areas recovered naturally through sediment deposition and growth of vegetation or
were reconstructed artificially with fill material and bank stabilization
measures such as rock riprap and wire fence revetments.
In December of 1978, Rillito Creek and Tanque Verde Creek once again
widened extensively (see both Figure 2 and Table 1). As in 1965, a winter
storm over the Tanque Verde Creek watershed produced streamflow that included
snowmelt. Little sediment was readily available for transport within the
channels, having been removed by previous flow in March, 1978 (T. Maddock, Jr.,
University of Arizona, written communication, 1980). As a result, this flow
eroded up to 190 feet (57 m) of the channel banks, and the streambed of Rillito
Creek aggraded locally as much as 7.5 feet (2.3 m). The recurrence interval of
this event was estimated at 22 to 24 years in Tanque Verde Creek and 20 years
in Rillito Creek (B.A. Aldridge, U.S. Geological Survey, verbal communication,
1981). Channel recovery and reconstruction also followed this event.
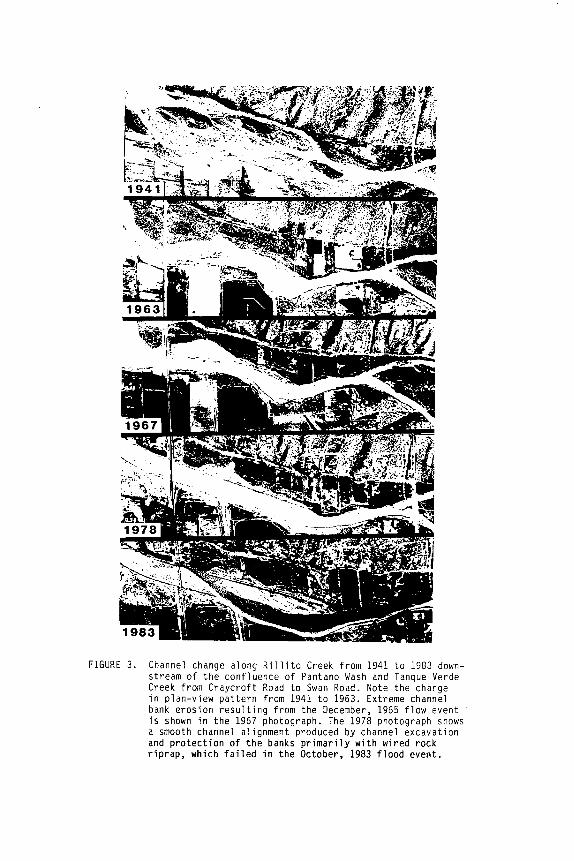
FIGURE 3. Channel change along Rillito Creek from 1941 to 1983 downstream of the confluence of Pantano Wash and Tanque Verde Creek from Craycraft Road to Swan Road. Note the change in plan-view pattern from 1941 to 1963. Extreme channel bank erosion resulting from the December, 1965 flow event is shown in the 1967 photograph. The 1978 photograph shows a smooth channel alignment produced by channel excavation and protection of the banks primarily with wired rock riprap, which failed in the October, 1983 flood event.
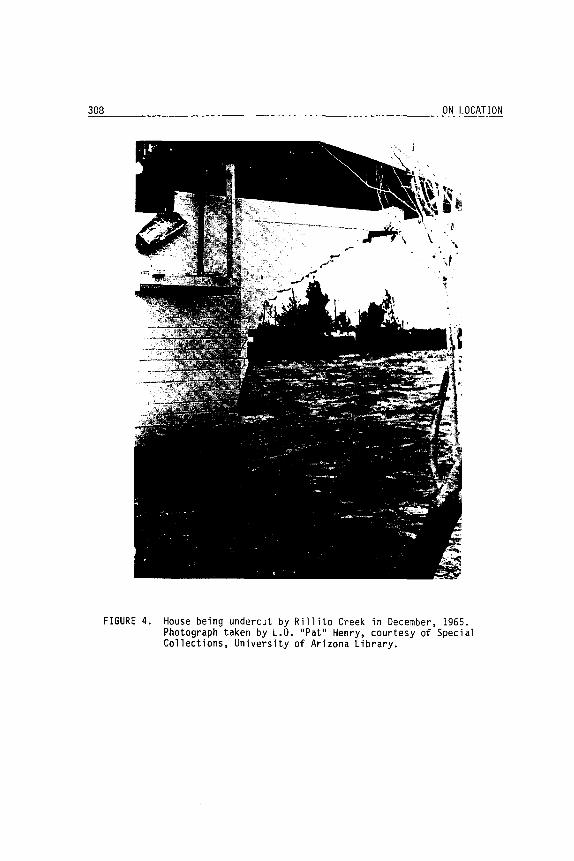
303 ON LOCATION
FIGURE 4. House being undercut by Rillito Creek in December, 1965. Photograph taken by L.O. "Pat" Henry, courtesy of Special Collections, University of Arizona Library.

Pearthree 309 On October 1 and 2, 1983, the most severe channel bank erosion and lateral
channel migration seen to date along the Rillito Creek system was produced by a
flow event provisionally estimated to have a recurrence interval between 50 and 100 years in Rillito Creek, 10 to 25 years in Pantano Wash, and 10 to 50 years
in Tanque Verde Creek (Hjalmar Hjalmarson, U.S. Geological Survey, verbal
communication, 1985). Between September 28 and October 2, southeastern Arizona
received 6.7 to 10.5 inches (170 to 267 mm) of rainfall produced by a surge of
tropical moisture that traveled northeastward from the Pacific Ocean off the
coast of Baja, California (Saarinen et al., 1984). Bank erosion was the most
severe hazard produced along the more incised stream channel reaches (see
Figure 3), although some overbank inundation also occurred. As described by
Baker (1984), the Rillito Creek system displayed channel bank erosion that
followed existing meander patterns and alternated between stream banks, as
allowed by bank protection (Figures 5 and 6). Severe bank erosion also
occurred at the downstream terminus of protected channel banks along Rillito
Creek, implying that non-continous bank stabilization measures locally concen
trate bank erosion as well as protect channel banks and adjacent structures.
Many of the effects of the October, 1983 flood repeated the experiences of the 1965 and 1978 events. In eastern Pima County, approximately 28 bridges,
nine flood control projects, and numerous residential, commercial, and indust
rial developments were damaged by channel bank erosion (Pima County Department
of Transportation and Flood Control District, 1985). Power lines were damaged
when their support pads were undermined by channel bank erosion or streambed
scour, and major utilities were washed out (Saarinen et al., 1984). Erosional
damage also occurred at several active and abandoned sanitary landfill sites
and at wastewater treatment facilities. The total cost of the flood repair and
flood hazard mitigation program prepared by the Pima County Department of
Transportation and Flood Control District following this event has been
estimated at $105.8 million.
Channel changes observed along the Rillito Creek system are consistent
with long-term characteristics of southwestern stream systems (Saarinen et al.,
1984). The greatest amounts of bank erosion documented in this study have
occurred on the concave banks of channel bends, along unprotected banks where
flow has been concentrated by upstream bank stabilization, and at locations
where the silt-clay content of the banks and density of riparian vegetation have been minimal (Pearthree, 1982). Lowering of the groundwater table in this
century has virtually eliminated riparian vegetation along the middle and lower

FIGURE 5. Damage to the northern (left) abutment of the Dodge Road bridge across Rillito Creek caused by channel bank erosion and lateral channel migration in October, 1983. Note the threat to the electric utility station on the opposite bank downstream. Photograph by Peter Kresan.
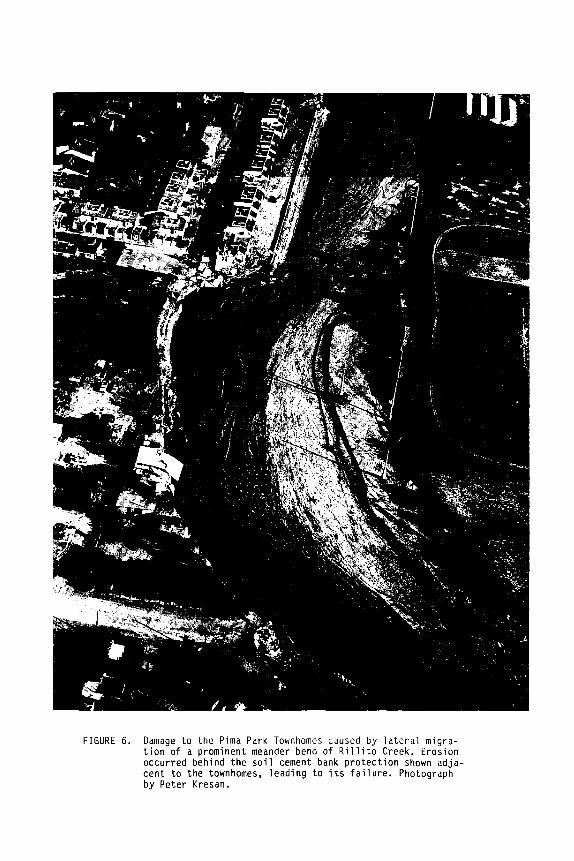
FIGURE 6. Damage to the Pima Park Townhomes caused by lateral migration of a prominent meander bend of Rillito Creek. Erosion occurred behind the soil cement bank protection shown adjacent to the townhomes, leading to its failure. Photograph by Peter Kresan.
312 ON LOCATION
reaches of Rillito Creek, rendering the channel banks less resistant to erosion. Local sand and gravel operations have also been linked to channel
changes by initiating 1) channel bed degradation upstream of excavations, 2) bank sloughing in conjunction with head-cutting upstream of in-channel and
overbank operations and from upstream sediment trapping, and 3) bank erosion
caused by diversionary structures related to the operations. Floodplain Management
In compliance with federal regulations under the National Flood Insurance
Program, management of floodplains in Pima County has focused on areas poten
tially subject to inundation by the 100-year flood, defined as having a 1%
chance of occurring in any given year. The geomorphic complexity of alluvial
stream systems in the Southwest, as illustrated in this study, creates diffi
culties in administration of federal regulations that are based primarily on flooding. Abrupt channel change, including fluctuations in cross-sectional
channel shapes, plan-view patterns, and channel positions, has generally con
stituted a greater hazard to Pima County than has overbank flooding.
Recognition of the threat to the public safety and welfare posed by such
channel change has led Pima County to establish building setback requirements
for structures from unstabilized channel banks and to begin delineating erosion
hazard zones along major watercourses for regulatory purposes.
Much of the damage in Pima County caused by channel bank erosion has been
to public and private facilities constructed prior to the establishment of
building setback distances. Since 1974, when the first Pima County floodplain
management ordinance was adopted by the community, building s~tback distances along the major watercourses have evolved from 100 feet (30 m) for commercial/
industrial structures and residential structures for rent and 300 feet (91 m)
for owner-occupied residences, to 500 feet (152 m) for all structures. The
latter distance was adopted following the October, 1983 flood.
At this time, the minimum building setback distance of 500 feet (152 m) is
required along the Rillito Creek system and other major watercourses in Pima
County where no unusual conditions exist. Where unusual conditions do exist,
including historical meandering of the watercourse, presence of sand and gravel
operations, poorly defined or unconsolidated channel banks, or local changes in
directions, quantities or velocities of flow, building setback limits are to be
Pearthree 313
established on a case-by-case basis by the County Engineer. Setback distances
ranging from 50 to 250 feet (15 to 76 m) have also been established along
smaller watercourses based on the magnitude of the estimated 100-year peak discharge.
Along the Santa Cruz River, to which Rillito Creek is tributary (Figure 1), preliminary erosion hazard boundary maps have been compiled based
on qualitative and quantitative analyses of channel bank erosion and lateral
channel migration (see Figure 7). These analyses have included investigations
of historical channel positions and erosional sites seen on aerial photographs,
and have considered present channel patterns, locations of sand and gravel
operations, landfill sites, and existing and planned bank stabilization
measures. When adopted by the Pima County Floodplain Management Board, these
maps will be used to restrain urban development within zones determined to have
a high potential short-term and long-term channel bank erosion and lateral
channel migration. Where erosion hazard limits exceed mapped floodway and 100-
year floodplain limits, the erosion hazard limits will form the basis for
regulating development adjacent to the stream channels, as these represent
estimated worst possible flooding and erosional conditions.
Conclusions Floodplain management practices that account for the geomorphic complexity
of alluvial channels of ephemeral streams will continue to evolve in the
Southwest as it is increasingly recognized that semiarid stream systems do not
lend themselves to flood hazard regulatory procedures established at the
national level. These procedures are incomplete when they fail to account for
channel change. Nonstructural floodplain management approache~ are recommended
to regulate urban development adjacent to these stream channels. The high cost
of bank stabilization measures capable of withstanding local streamflow
erosional conditions, such as soil cement at approximately one million dollars
per mile, discourages implementation of structural flood and erosional control
measures on a large scale. Nonstructural floodplain management approaches can
save the cost of channel bank stabilization as well as decrease the potential
for erosional and flood damages. Through geomorphic research, the complex
behavior of alluvial stream systems in the Southwest can be documented, thus
providing the data necessary to locally augment federal floodplain management
regulations and policies to suit the Southwest.
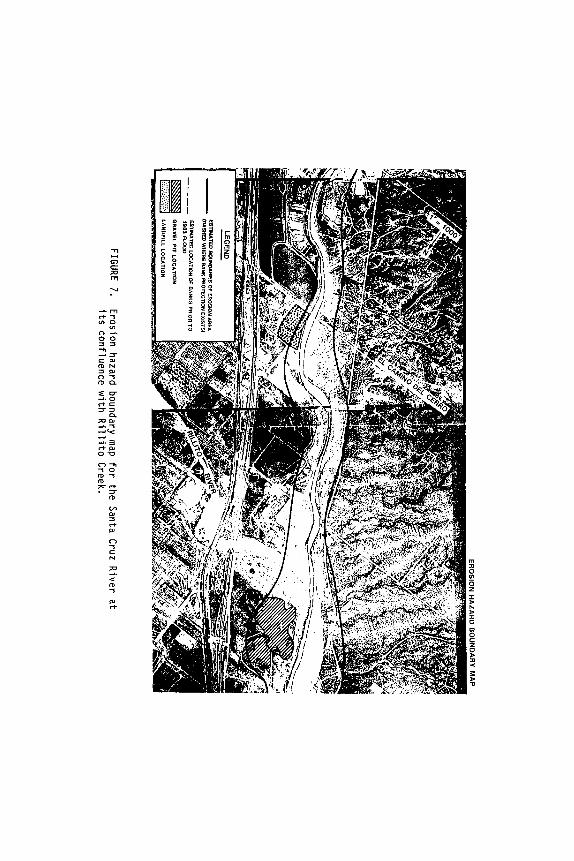
ES
TIM
AT
ED
BO
IJNO
AR
ES
OF E
RO
SIO
N A
RE
A
(DA
SH
ED
WH
ER
E B
AN
K P
RO
TE
Cn
oN
EX
IST
S)
ES
TlMA
TED
LOC
ATIO
N O
f' flAN
KS
PR
IOR
TO
1
98
3 F
LO
OD
~
GR
AV
EL
PIT
LO
CA
TIO
N
k·::::):::·~·::r:::J L
AN
DF
ILL
LO
CA
TIO
N
FIGURE 7.
Erosion hazard
boundary map
for the Santa Cruz R
iver at
its confluence with
Rillito
Creek.

Pearthree
Aldridge, B.A. 1970
Arizona Daily Star ------rg65
Baker, V.R. 1984
315 References
Floods of November 1965 to January 1966 in the Gila River Basin, Arizona and New Mexico, and Adjacenlf-Basins-i-n---Arizona. Washington DC: U.S. Geological Survey WaterSupply Paper 1850-C.
"Flood Peril Continues as Sewers Wash Out; State Assistance Sought." December 24.
"Questions Raised by the Tucson Flood of 1983." Pages 211-219 in Proceedings of the 1984 Meetings of the Arizona Section - American Water Resources Association and the Hyd~~it-~n - Arizona-Nevada Academy of Science: Hydrol~ and Water Resources in-Arlzona and the ~est:--Tucson, Arlzona. -
Cooke, R.U. and R.W. Reeves 1976 Arroyos and Environmental Change in the American
Southwest. Oxford: Clarendon Press.
Durrenberger, R.W. 1979
Grove, G. T. 1962
Keith, S.J.S. 1981
Pearthree, M.S. 1982
and R. Wood Climate an~ Ener~y in the Tucson Region (preliminary version). Tempe: Arlzona State University, Office of the State Climatologist.
Rillito Creek Floodplain Study. Tucson, Arizona: City"County Planning Department.
Stream Channel Recharge in the Tucson Basin ann Its Implications for Groundwater Ma~agement. Tucson: University of Arizona, Master's of Science Thesis.
Channel Change in the Rillito Creek System--Southeastern Arizona. Tucson: Unlversity of Arlzona, prepublication manuscript.
Pima County Department of Transportation and Flood Control District 1985 Flood Damage Report, Final Documentation, October, 1983.
Pima County Department of Transportation and Flood Control District 1985 Santa Cruz River Management Plan Study, Technical Report.
Prepared by Simons, Li & Associates, Inc.
Sellers, W.D. and R.H. Hill 1974 Arizona Climate 1931-1972. Tucson: University of Arizona
Press.
Turner, R.M. 1974 "Map Showing Vegetation in the Tucson Area, Arizona." U.S.
Geological Survey Miscellaneous Investigation Series Map 1-844-H.
WATER LEVEL FREQUENCY ANALYSIS IN COLD CLIMATES
George R. Alger Michigan Technological University
Henry S. Santeford Michigan Technological University
Introduction
Typically when one thinks in terms of problems/damages due to high water levels along a river reach the association is to a set of flood flow rates which caused such water levels. Recognizing that flood flows are of a variable size from time to time,
a statistical analysis is performed on historic data in an attempt to associate expectancy or probabi 1 i ty of occurrence wi th differi ng flood size (i. e., the 100 -yea r flood is 10,000 cfs). These flows are then converted to associated river levels to
explore potential damages and the effects and economies of various mitigations measures.
There are, however, other factors which may exist which have an effect on river level as well as the size of the flow rnt~. Cprtninly engineering works and
encroachments on the flood plain may have a local hydraulic influence which alters previously existing relationships between flood size and associated river level. Such hydraulic influence may also exist on reaches of rivers which experience an ice cover and this paper addresses one aspect of this possibility.
River Levels and Ice
There are a number of situations which can develop from time to time and place to place on any given river system which effect river stage. Probably the most commonly referred to is the so called "Ice Jam". ~/hile this condition has been researched to a limited extent and several papers published there is still much that
is unknown or uncertain. For the time being we will leave this area to others and concentrate our discussion on river level responses that may occur during the period associated with river freeze up and a later period which we will call the period of "stable ice control".

Alger/Santeford 317
When a river reach begins to develop an ice cover an additional boundary is
created (the ice cover) which increases the resistance to flow. This increased resistance causes the flow to be retarded and the depth to increase. The river level
will also increase further due to buoyant effects as the ice cover thickens. There
is also an additional hydraulic effect which takes place during freeze up due to the
unsteady nature of the flow.
The analytics and mechanics of the items mentioned above may be found in papers
by the authors. (See list of references).
Given the right set of circumstances the analytics suggest that river depth
could increase with an ice cover by over thirty percent due to the ice resistance
alone. Many reaches of northern rivers form an ice cover in parts of the reach in the
early winter and not in others. This allows for the production of frazil ice (fine
spicule, plate or discoid ice crystals in super cooled turbulent waters) in the open
water sections. Frazil ice tends to collect in the slower moving sections under
existing downstream ice cover. These deposits can become quite large and act as an
encroachment into the river cross section. This in turn can cause a "backwater"
effect upstream of this "ice control" which increases the opportunity to form
additional ice cover as the backwater deepens and slows the upstrea~ flow. This, of
course, also decreases the surface area available for the formation of additional
frazil ice. Thus, in this type of situation, there is a progressive development ot
the ice cover in an upstream direction from the slower moving sections toward the
faster zones. This is the freeze up period and once complete is followed by the
period of stable ice control until such time as breakup occurs. The freeze up period
generally lasts several days and the period of stable ice control may last for
months. The combination of this backwater effect with the added resistance to flow
and attendant buoyant displacement can cause rather large river level increases which
can last for long periods of time.
Some Examples
In the course of pursuing a research effort dealing with the hydraulics of ice
covered rivers in cooperation with the U.S. Geological Survey and U.S. Army Cold
Regions Research and Engineering Laboratory the authors have had the opportunity to

318 ON LOCATION
review published and unpublished data of the U.S. Geological Survey. This has
uncovered numerous examples of the situations described above. One such case is the U.S. Geological Survey gage located on the Brule River near
Florence, WI. The gage has been in place for over 40 years and the flood of record
is 4700 cfs. A log pearson type III analysis indicates this flood would be approxi
mately the 100 year flood. Unpublished data for this gage indicates that almost
every winter during the freeze up period river levels exceed that corresponding to
the flood of record even though flow rates are relatively small. Further, during the
period of stable ice control (about four months), water levels are such as to be
indicative of 25 year flood levels (about 3000 cfs) even though the actual under ice
flow is only 300 to 400 cfs. The conventional type of flood analysis applied to this
gage history would in effect be working on a problem that doesn't exist.
Another example is the Lookingglass River near Eagle, Michigan. The flood of
record is 2,860 cfs with a gage height of 7.70 ft. This would correspond to about
the 100 year flood. The gage height corresponding to bank full stage is approxi
mately 6 ft. Certainly this flood did cause some overbank flooding. A closer look
at the record for this station indicates water levels are often over the 6 ft. gage
height due to backwater from ice. In fact in 1956 gage height was 9.9 ft. from ice
backwater which would correspond to something like the 10,000 year flood.
There are numerous other examples that one could site which are not so
spectacular. These might be summed up by stating that it is not uncommon to find
river levels with an ice cover which are indicative of the 10 to 20 year flood levels
even though actual flow rates are relatively small. There were also several streams
where backwater from ice caused the maximum water level in any given year.
Where Are We?
The previous section indicates that there is recorded evidence of ice related
effects relative to abnormally high water levels. One should keep in mind that these
exist only because the U.S. Geological Survey happened to have a gage at the right
place to have recorded such effects. Certainly many more locations must exist on
these river systems; there simply is no "formal" record.
A report to the National Science Foundation by the Illinois State Water Survey
discusses a number of critical research needs relative to flood mitigation. In the
section dealing with Hydrology and Hydraulics nine recommendations were listed for
Alger/Santeford 319
critical research. Four of the nine involve reliable predictions of water levels with appropriate related probability. These would include topics such as probability
at ungaged locations, appropriate probability distributions, predicting stages from
given flow rates and defining flood plain boundaries for various levels of
probability. There has been little research activity in these areas, relative to the effects
of an ice cover, and much that does exist is very recent. We do feel at this time
that there is reasonable evidence to suggest that the magnitude of the ice/water level effect is site (reach) specific and that collection and analysis of certain
summer and winter data in the reach can be used to define coefficients for the reach
which can be used in a predictive model. Such research is presently under way on
three Michigan rivers with the present goal of establishing a predictive model for at
least the period of stable ice control.
Summary and Conclusions
It should be evident that on certain reaches of ice covered rivers flood
analysis should include statistical analysis of water levels caused by ice,
especially for the more frequent events (say 10 to 20 years). This area should also
be addressed from a design and planning point of view. For example, the design of a
road/stream crossing (culvert) requires use of "water levels" with various expectancy
(not necessarily flows with certain expectancy). Another example might be in
assessing the effects of engineering works along the river and flood plain as they
may effect future locations of "ice controls" and "frazil ice generators". These
locations and the length of time a "frazil ice generator" are operative will dictate
expected ice related river levels.
There is still much to do and to learn concerning the hydraulics of ice covered
rivers. It is expected that research at Michigan Technological University will
continue to address these problems in the future and that better analytical
techniques and predictive capability will be developed.
320 ON LOCATION
References
Alger, G. R., and H. S. Santeford 1984 A Procedure for Calculatin River Flow Rate Under
Proceedings IAHR Ice Symposium, Hamburg, Germany,
Bent, P. C. 1970 A Proposed Streamflow Data Program for Michigan. U.S. Geological
Survey Open File Report, Lanslng, Michigan.
Changnon, S. A., R. J. Schicht, and R. G. Semonin 1983 A Plan for Research on Floods and Their Mitigations in the United
States. Report to the National Science Foundation by Illinois State Water Survey.
Santeford, H. S., and G. R. Alger 1984 Hydraulics of Freeze-Up. Proceedings of the Conference Water for
Resource Development, ASCE, Coeurld AILene, Idaho, (August).
Santeford, H. S., and G. R. Alger 1984 Predicting Flowrates in an Ice Covered Streams. Proceedings Third
ISC Conference on Cold Regions Engineering, Edmonton, Alberta, (April).
Santeford, H. S., and G. R. Alger 1983 Effects of an Ice Cover - A Conceptual Model. Proceedings of the
Conference on Frontiers in Hydraulic Engineering, ASCE, MIT, Cambridge, MA, (August).
Wiitala, S. W. 1965 Magnitude and Frequency of Floods in the United States. U.S.
Geological Survey Water Supply Paper 1677.
MANAGEMENT OF FLOODPLAIN SAND AND GRAVEL MINING
Joann Mossa
Louisiana Geological Survey
Introduction
Conflicting interests and issues surround the practice of floodplain sand and
gravel mining. Because existing federal and state regulations fail to recognize
several problems that are peculiar to floodplain operations, management I'ilich recog
nizes both environmental and industrial needs should be developed. In Louisiana,
consequences from the lack of such policy are manifest and continue to intensify.
Early assessment of the concerns expressed by the various users of floodplain
resources is the first step toward balancing these diverse interests through manage
ment.
Regul at ions Affecting Sand and Gravel Mining
Several complex issues and problems pertaining to floodplain mining operations
are often not addressed by federal, state, and local regulations. An overview of
current regulations is required to understand the needs and concerns represented by
diverse public interests. Gaps in representation can then be addressed by modifying
existing legislation or by drafting new legislation if none exists.
No federal law directly regulates the sand and gravel mining industry (Banks
and others, 1981). Some federal laws, however, may indirectly affect mining prac
tices (Table 1). For example, in-stream mining could be affected by Section 404 of
the Federal Water Pollution Control Act, I'ilich regulates the dredging and filling of
navigable waters.
Most of the responsibil ity and authority for regulating sand and gravel mining
is left to state and local government. About 30 states currently have laws affect
ing sand and gravel mining operations or reclamation (Fig. 1). Reclamation refers
to the procedures, such as backfilling, landscaping, and revegetation, undertaken to
achieve the land use desired after mining. Such requirements may vary considerably
from place to place. Some states allow local jurisdiction to take precedence in

322 ON LOCATION
Table 1. Federal laws indirectly affecting surface mining (from Banks and others, 1981).
Clean Air Act Federal Land Policy and Management Act Federal Water Pollution Control Act Fish and Wildlife Coordination Act
Wil d and Scen ic Rivers Act Fish and Wildlife Act National Environmental Policy Act Rivers and Harbors Act
Surface Mining Control and Reclamation Act (coal onl y)
Mine Safety and Health Act
STATES WITH LAWS CONTROLLING SAND AND GRAVEL MINING
Banks and others, 1981
o State and local laws exist
o State laws exist • State laws under consideration
• No existing state laws
o 50 Mlies
o 100 Kilometers
Figure 1. States with laws affecting sand and gravel mining operations or recl am at ion.
Mossa ______________________________________________________ ~3~2~3
regulating operations whereas other states maintain the right to approve final
mining permits (Banks and others, 1981). In addition, sand and gravel operations
may be governed by local zoning ordinances, permits, plans, and variances.
Because the governing regulations cover a wide range of mineral extraction
techniques, geographic settings, and commodities, floodplain sand and gravel mining
practices are not often addressed in legislation. Issues other than operation and
recl amat ion, such as industri al and environmental concerns, are often di sregarded.
States which lack mining policy, as exemplified by Louisiana, are more likely to
experience greater environmental damage.
Issues of Floodplain Sand and Gravel Mining
Sand and gravel are vital commodities for urban growth and infrastructure,
especially where hard rock aggregate is scarce. Public interests are best served if
these minerals can be extracted at minimum cost with minimal environmental damage.
Mineral conservation for the future and benefits to the local economy are also
important considerations in planning. Management should attempt to balance the pro
duction and conservation of minerals while minimizing environmental, social, and
other negative impacts associated with mining.
Environmental impacts associated with sand and gravel mining are probably the
least significant compared to those associated with other types of surface mining,
yet several problems may still develop. Channel instability and impacts on flood
rates and patterns are two potential problems associ ated with mining operations in
floodplains. Increased bank erosion and changing channel position and gradient may
affect property and structures, causing legal problems regarding ownership, engi
neering liability, mining, and water rights. Stream aggradation resulting from the
overloading of detritus, which increases flood stages and the CIIlount of land being
inundated, was described in early studies (Gilbert, 1917). Conversely, degradation
attributable to several possible causes has also been observed (Scott, 1973; Bull
and Scott, 1974; Graf, 1979; Lagasse and others, 1981; Storm, 1982). Gravel mini ng
activities may also disturb water quality and floodplain habitat, thus affecting
water resources, fisheries, and wildlife. Consequently, several problems unique to
floodplain mining need to be incorporated into management plans in addition to
reclamation.
324 ON LOCATION
Concerns in Louisiana
Because of economic considerations and limited construction materials, most
gravel mining in Louisiana is confined to the valleys of rivers that transport
coarse material. This presents problems regarding both economics and environment.
For example, inundation of resources by dam construction must be considered an eco
nomic loss for local expanding urban areas. In addition, mining practices should
attempt to minimize environmental impacts to the channel and floodplain. Several
problems that are manifest in Louisiana reflect the failure to consider the dynamic
nature of rivers, particularly when floodplain vegetation and character is dis
turbed.
Changes in channel morphology have been observed since the initiation of flood
plain gravel mining in the Amite River in southeastern Louisiana (Fig. 2). Some
changes are due to i nd i rect effect s of gr ave 1 mi n i ng, after floodwaters have
reworked the alluvial valley. Removal of riparian vegetation and mining of point
bars reduce the resistance of river banks to erosion during floods (Fig. 3). Also,
during high stages, breaching and channel diversion into adjacent gravel pits may
occur, especially where banks are not stabilized by vegetation. This results in a
local change in base level, which infl uences aggradation and degradation patterns.
Through these processes, ch anne 1 pattern and meander geometry have been altered s ig
nificantly after major floods (Mossa, 1983).
Direct environmental damages may also result from increases in sediment flux
and channel dredging associated with in-stream mining. Concomitant hydrologic
changes occur as the channel is shortened, widened, and altered in gradient; these
changes may have aggravated local flooding on the Amite River in recent years
(Mossa, 1983).
Although recognition of the adverse effects of floodplain mining is still in
the early stages, practices causing the most severe environmental damage should be
minimized. Removal of riparian vegetation and the mining of point bars and channel
bottoms should be avoided, and buffer zones next to the channel should be estab-
1 i shed. Other gui de 1 i nes developed for mi n i ng gr ave 1 in fl oodp 1 a ins in arct ic and
subarctic regions (Joyce and others, 1980) may be applicable to rivers in Louisiana
and elsewhere.
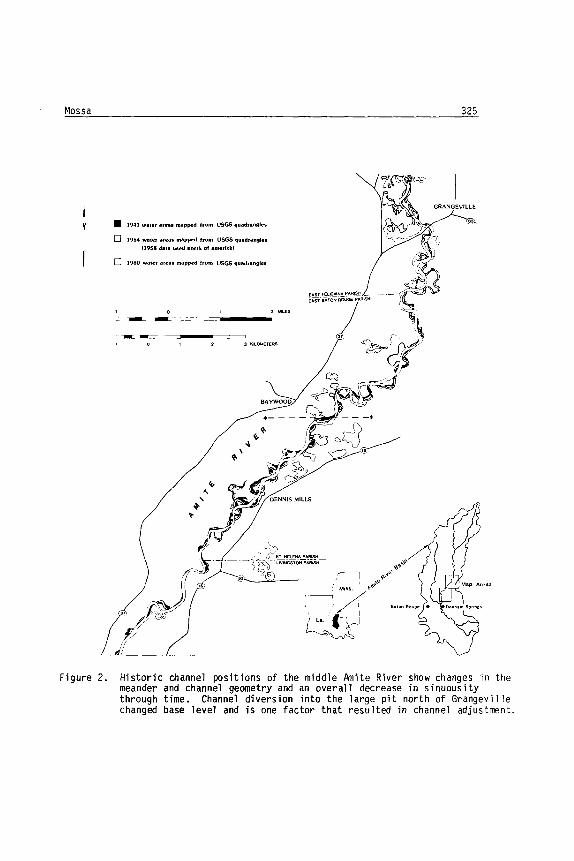
Mossa 325
• 1941 waler areas mapped hom USGS quadrangles
o 1954 water "reas mapped from USGS quadrangles
fl958 data used north of a5lerlsk)
C 1980 water areas mapped from USGS quadrangles
-- -~~=.~~ ____ ~===o
3 KLOMETERS
Figure 2. Historic channel positions of the middle Amite River show changes in the meander and channel geometry and an overall decrease in sinuousity through time. Channel diversion into the large pit north of Grangeville changed base level and is one factor that resulted in channel adjustment.

326 ON LOCATI ON
Figure 3. Removal of riparian vegetation and mining of the point bars and floodplains reduce the resistance of the banks during floods. Changes, including increased width, meander cutoffs, abandoned point bars, and an increased number of midchannel bars, have developed since the initiation of mining near Dennis Mills on the Amite River.
Minimal environmental damage and additional land use benefits are achieved with reclamation, which is particularly important near river channels where sediments and talus piles may be reworked in subsequent floods. These efforts are most successful if they are integrated into the total mining operation from the beginning and directed toward a desired post-mining land use (Dunn, 1982). Although this has not
been the case in Louisiana, remaining landscapes can be left in a stabilized, nonhazardous, and useful condition if some planning measures are taken. Such plans
should be developed promptly in states with severe flooding problems but no reclamation regulations, such as Louisiana.
Once a river has changed its pattern and form, the problem becomes much more
difficult to resolve. Whether reclamation should go beyond sculpturing and revegetating the floodplain and attempt to restore the previous channel character is a
question that requires consideration. Although time will probably allow the river
Mossa 327
to restore itself, rivers are dynamic and little is known about how rapid or effective these modifications will be. Aggravated flood conditions could persist for
years and intensify if unregulated mining continues. Establishing management guide
lines prior to intensive mining is the better approach to minimizing environmental
impacts.
Management should al so encourage the sand and gravel industry to provide pl an
ning input to balance various local and regional, short- and long-term goals.
Information regarding resource distribution should be provided to concentrate mining
in preferable locations. Guidance and recommendations to facilitate reclamation
should be given at the local and state level. The continued availability of
resources depends upon the cooperation of the industry, whose input in decision
making and issues is important to bal ancing diverse economic and environmental
interests.
Conclusions
Mitigation of impacts and restoration of mined landscapes in floodplains may entail either management or engineering measures or some combination of the two.
Although some measures will result in a direct and noticeable improvement of the
environment, others may take several years to produce visible results, and in some
cases, time may be the only solution to recovery. The recommendations stated here
and the guidelines developed for mining in other floodplains should be considered
prior to mining because environmental problems become much more compl icated and
harder to resolve after mining operations have begun. Floodplain managers can help
to balance diverse interests by considering input from various sectors early in the
decision-making process. In states without legislation, such as Louisiana, flood
plain management may be the most immediate solution to addressing environmental and
industrial interests.
References
Banks, P.T., R.E. Nickel and D.A. Blome 1981 Reclamation and Pollution Control: Planning Guide for Small Sand and
Gravel Mines. Washington, D.C.: Department of the Interior, Bureau of Mines.
328 ON LOCATION
Bull, W.B. and K.M. Scott 1974 "Impact of Mining Gravel from the Urban Stream Beds in the Southwestern
United States." Geology 4: 171-174.
Dunn, J. 1982 "COSMAR (Committee on Surface Mining and Reclamation)." Pages 9-12 in
P.Y. Amimoto, Ed. Proceedings of Mined Land Reclamation Workshop. Davis, California, June 11-12, 1980. Sacramento: State of Californla, Department of Conservation, Division of Mines and Geology, Special Publication 59.
Gilbert, G.K. 1917 "Hydraulic-Mining Debris in the Sierra Nevada." U.S. Geological Survey
Professional Paper 105. Washington, D.C.: Department of the Interior.
Graf, W. F. 1979 "Mining and Channel Response." Annals of the Association of American
Geographers 59: 252-275.
Joyce, M.R., L.A. Rundquist, and L.L. Moulton 1980 Gravel Removal Guidelines Manual for Arctic and Subarctic Floodplains.
Report No. FWS/OBS 80/09. Washington, D.C.: U.S. Department of Interior, Fish and Wildlife Service.
Lagasse, P.F., B.R. Winkley and D.B. Simons 1981 "Impact of gravel mining on river systems stability." American Society
of Civil Engineers. Journal of the Waterway, Port, Coastal and Ocean Division: 389-404.
Mossa, J. 1983 "Morphologic Changes in a Segment of the Amite River, Louisiana."
Scott, K.M.
Abstracts with Programs, Geolog iedl Society of America, 95th Annual Meet-2.J:l.9. 15: 548.
1973 "Scour and Fill in Tujunga Wash--A Fanhead Valley in Urban Southern California, 1959." U.S. Geological Survey Professional Paper 732-B. Washington, D.C.: Department of the Interior.
Storm, D. 1982 "In-stream Mining." Pages 73-75 in P.Y. Amimoto, Ed. Proceedings of
Mined Land Reclamation Workshop. Davis, California, June 11-12, 1980. Sacramento: State of Cal Horn i a, Department of Conserv at ion, Div is ion of Mines and Geology, Special Publication 59.
LOCAL FLOOD WARNING SYSTEMS -- WHERE ARE WE?
Curtis B. Barrett
National Weather Service
Common sense suggest that people vulnerable to floods ought to be warned so
that response can be taken to protect lives and property. The National Weather
Service is responsible for warning individuals of approaching floods. Generally,
for rivers which crest greater that 18 hours after rainfall occurs, the conventional
flood forecast operations of the National Weather Service provide timely and
accurate flood forecast service for threatened communities. In rivers which crest
less than 18 hours after rainfall occurs, time is short, data is scarce, and
development of timely, accurate and specific flood predictions is difficult, if not
impossible. One solution to this short-fused flood problem is the development of an
integrated local flood warning and response system for a community vulnerable to
floods.
Recently, the Federal Interagency Work Group on Local Flood Warning Systems has
produced a report titled, "Guidelines on Local Flood Warning and Response Systems
for Communities." This document defines a local flood warning system to consist of
four steps. These four steps include: 1) Data Collection; 2) Data Transmission;
3) Flood Forecast; and 4) Inform Local Officials. These four basic steps offer
the threatened community recognition of the magnitude and extent of the flood
threat. However, providing a timely and accurate warning will not reduce flood
losses unless an effective response system is in place. A flood warning is useless
unless people know what actions to taken when they receive the warning. The
response system consists of three steps: first, warn local residents who will be
affected by the flood; second, threatened residents should be evacuated; and the
last step is re-rentry, or return of residents into the flood plain.
Local flood warning systems are flood recognition or forecast systems that
determine the magnitude and extent of flooding. These systems are categorized as
manual or automatic. Manual systems primarily consist of volunteer observers who
read plastic rain gages, a volunteer community flash flood coordinator, and a simple
flood forecast procedure provided by the National Weather Service. Most local flood
warning systems are manual systems and are quite effective in providing basic flood

330 ON LOCATION
recognition. Automated systems consist of a volunteer community flash flood
coordinator, automatic self-reporting hydrologic sensors, radio transmission and
receiving equipment, a continuously operating microprocessor, river and rainfall
data analysis software, and a hydrologic simulation model. The National Weather
Service and or private hydrologic consulting companies provide hydrologic expertise
in providing automated local flood warning systems to communities.
There are basically three types of automated local flood warning systems in
operation. These systems vary in functional capability and cost. The flash flood
alarm gage, the most basic type, consists of water level sensors connected to an
alarm or light located at a community agency which operates 24 hours a day. River
stages exceeding a pre-set level trigger the alarm. The distance the alarm is
located upstream from the community determines the amount of warning time
available. There are approximately 65 flash flood alarm gages in operation around
the country. The flash flood alarm gage provides the least capability of all the
automated systems and is also the least expensive.
The Automated Local Evaluation in Real Time (ALERT) system is an automated
local flood warning system developed by hydrologists at the NWS California/Nevada
River Forecast Center. The ALERT system has rapidly gained popularity in the United
States with about 50 communities now operating or installing these systems. ALERT
consists of automatic reporting river and rainfall gages, a radio communications
system and a base station consisting of radio receiving equipment and a
microprocessor. Various types of software are available for the ALERT system from
data analysis software to hydrologic forecast model. Basic software is available
from the NWS, while more special-needs software is available through private firms. In a 6-state region of Appalachia, the Integrated Flood Observing and Warning
System (IFLOWS) is implementing an automated prototype networked local flood warning
system that links the county emergency operations center (EOC) to the state EOC and
to the NWS forecast office. Over 100 counties will be operating nearly 600
automatic reporting rain gages to 100 county-based stations (radio communication,
receiving equipment, DEC microcomputers which collect, display and relay rainfall
data and flood warning information). The IFLOWS program uniquely distributes flood
related information to Federal, State, and local offices.
Barrett 331
Local Flood Warning System Standards
The NWS Technical Working Group on Local Flood Warning Systems (LFWS) has
developed standards for automated local flood warning systems. These standards are
currently under review by the NWS and will then be sent to all interested Federal
agencies for review. The Hydrology Subcommittee of the Interagency Advisory
Committee on Water Data is investigating the need for a standing committee on local flood warning systems to address LFWS problems and issues ann to continue
modification of LFWS standards as technology continues to advance. The purpose of establishing LFWS standards are:
1) To ensure that basic flood forecast capability is made available to
communities ranging from poor and technically unsophisticated, to wealthy
and professionally talented.
2) To ensure that LFWS data can be made available to all NWS Offices
responsible for flood warnings. This assures coordination which is vitol
to warning the population of a flood event.
3) To promote competition between private sector firms who wish to develop
"enhanced" LFWS software.
We anticipate LFWS standards will be available in late summer for distribution to
communities.
Where are We Going?
As the proliferation of LFWS continues, various issues begin to surface
concerning the type and distribution of data and forecasts. As more and more
communities continue to install automated systems, a high volume data base will be created. If an upstream community develops an automated flood warning system, who
is responsible to warn the next downstream community-based, or the upstream
community system operation? What Federal, State, and local agencies require LFWS
data? What specific data?

332 ON LOCATION
FLASH
The NWS is developing a project known as FLASH (Flood Local Analysis System for
Hydrometeorology) which will provide the Weather Service Forecast Office (WSFO) with two basic capabilities. The first capability is to establish a hydrometeorology data base which will contain up-to-date river and precipitation data (including
automated LFWS data), and secondly, simplified hydrologic models to provide site
specific forecasts for flash-flood-prone communities.
UTILIZATION OF THE SEA, LAKE AND OVERLAND SURGES FROM HURRICANES (SLOSH) MODEL
IN HURRICANE EVACUATION STUDIES
John K. Graham Mobile District
U. S. Army Corps of Engineers
Introduction
The coastal population of the United States has increased sharply over the past twenty years and in many locations the rate of growth has accelerated. This tremendous growth and development has presented emergency management officials with the difficult task of developing hurricane evacuation plans which can reasonably assure safe and effective hurricane evacuations for the vulnerable population. The critical data necessary for the development of these plans often require comprehensive and specialized analyses. In an effort to assist state and local governments develop the needed technical information, the U. S. Army Corps of Engineers, rederal Elllergency Management Agency and the National Oceanic and Atmospheric Administration have joined state and local emergency management agencies in conducting hurricane evacuation studies for certain Gulf and Atlantic coastal basins. These studies consist of several related analyses to develop technical data concerning hurricane hazards, vulnerability, public
response, timing of evacuations and sheltering needs for various hurricane threat s ituati ons.
The hazards analysis quantifies the still-water surge heights, waves and windspeeds for various categories, tracks, directions and forward speeds of hurricanes considered to have a reasonable probability of striking a particular
coastal basin. Potential freshwater flooding from rainfall accompanying hurricanes is also considered; however, due to the wide variation in amounts and times of occurrence from one hurricane to another, rainfall can only be addressed in general
terms. The purpose of this manuscript is to describe the utilization of the Sea,

334 ON LOCATION
Lake and Overland Surges from Hurricanes (SLOSH) Model in the hazards analysis of hurricane evacuation studies.
Hazards Analysis
The Sea, Lake and Overland Surges from Hurricanes (SLOSH) numerical model, developed by the National Weather Service, is commonly utilized in the hazards analysis of hurricane evacuation studies to determine the still-water surge heights and windspeeds associated with various simulated hurricanes modeled for a study. Developed for selected Gulf and Atlantic coastal basins, the SLOSH model incorporates a curvalinear polar coordinate grid scheme (a fan-shaped grid) in which a basin's bathymetry, topography and natural and man-made barriers are mathematically represented. The grid configuration of the model has a resolution of approximately one-half square mile for inland areas at the focus to 1 1/2 square miles at the coastline. The grid squares become progressively larger as the grids extend outward from the coastline where storm effects are of secondary interest.
Other computer models have reliably calculated surge heights for the open coastline; however, the SLOSH model has the added capability to simulate the routing of storm surge into bays, estuaries, coastal rivers and overland. Significant natural and man-made barriers such as dunes, roadbeds or levees are also represented in the model and their effects considered in the calculations of surge heights for a location. This capability results in more accurate and realistic simulations of the impacts an area can expect from potential hurricanes. Simple time-dependent input parameters for the desired hurricanes to be modeled are supplied by the user and from which calculations of surge heights and windspeeds are made. These parameters, entered at six-hour intervals for a simulated 72-hour hurricane track, are storm position by latitude and longitude, central barometric pressure in millibars and the radius of maximum winds.
Simulated hurricanes varying in intensity, direction of movement, forward speed and landfall location are modeled for a study. For example, in the Tri-State Hurricane Evacuation Study for the central Gulf Coast, a total of 964 simulated storms were modeled for the study area. These simulated hurricanes represented the five categories of hurricane intensity as described by the Saffir-Simpson Hurricane

Graham 335
Scale, five directions of storm movement for 1andfa11ing and paralleling hurricanes
(N, NW, NE, W, E), two forward speeds of 5 and 15 miles per hour and numerous landfall or nearest approach locations spaced approximately 20 miles apart along the coastline. The characteristics of the simulated hurricanes modeled for a study are
predicated upon the meteorological history of the basin; therefore, variation in selected storm parameters between study areas is likely to occur.
The model output for each simulated storm run consists of a surface envelope of water which represents the maximum surge values calculated for each grid point
irrespective of the time during the simulation that the maximum hei~ht occurred.
These values are displayed on printouts on which the grid points are referenced by
a system of coordinates. The coordinates, through the use of grid overlays, allow
the surge heights to be transferred onto transverse ~ercator maps of any desired
scale. Time-history tabulations for sixty (60) pre-selected grid points are also furnished with each run.
Prior to modeling the desired hurricanes, a maximum of sixty (60) model grid
points are selected for which time-histories of surge heights, windspeeds and wind
directions are tabulated for at least a 30-hour segment of a simulated storm track.
The selected grid points normally represent the locations of critical roads and bridges of low elevation, potentially vulnerable population centers or areas adjacent
to significant natural or man-made barriers. The time-history information for each
selected grid point lists values at ten-minute intervals for still-water surge
heights in feet above National Geodetic Vertical Datum (NGVD), windspeeds in miles
per hour and wind directions as azimuths from which the \'Iind is blowing. The time
history information is utilized to determine the pre-landfall hazards times expected
in advance of an approaching hurricane. The arrival time of gale-force winds
(sustained 40 miles per hour) and/or the time that critical roads or bridges needed
for evacuation may be inundated by rising storm surge are commonly the thresholds
used to determine the pre-landfall hazards times. The pre-landfall hazards times
represent the time period, in advance of expected hurricane landfall, that evacuees
will likely be exposed to hazardous wind or storm surge conditions. The time
history data allow emergency management officials to more accurately judge the time
at which evacuees may be exposed to storm hazards and permit the timing of evacua
tions to avoid those hazards.

336 ON LOCATION
Due to the large number of simulated storm runs required for a study, the
results of the individual simulations are combined into Maximum Envelopes of Water
(MEOW), which display the maximum surge value for each grid point in the model for
any storm parameter or combination of parameters desired. Variations in category,
forward speed, direction of movement and landfall location, individually or
collectively, result in differing surge heights calculated for a location. Normally,
che t~EOWs are prepared by category of storm and combine all other storm parameters
to determine the maximum surge heights possible for a location. The MEOWs are
utilized in order to simplify the data and because present technology cannot assure
precise forecasting of hurricane landfall location to permit confident use of
individual storm runs in emergency management planning. The average radii of fore
cast error for hurricanes with an expected landfall time of 24 hours are 105 miles
for the Gulf of Mexico and 125 miles for the Atlantic Ocean. Considering the
average radii of forecast error and the clearance times required to evacuate the
threatened population of many coastal locations, each jurisdiction under a hurricane
threat must prepare for the I'lOrst probable effects from approaching storms. The
MEOWs allow this data to be generated and presented in an efficient and uncomplicated
manner.
The SLOSH model does not provide data concerning the additional heights of waves generated on top of the still-water storm surge. Generally, waves do not add
to the areal coverage of the storm surge in a basin and can usually be iqnored
except for locations immediately along the open coastline or the shorelines of very large bays where significant fetch lengths and I'!ater depths are possible. Due to
the presence of structures, dunes or vegetation, the I'/aves break and their energy
dissipates within a few hundred yards of the coastline.
The data developed from the hazards analysis and other related analyses
conducted for a hurricane evacuation study are presented in a technical data report. Local implementation guides are normally prepared for each county within a study
area and include the technical data and operational information pertinent to a
particular jurisdiction. The technical data allow emergency management agencies
to more accurately determine the vulnerable areas and to estimate the time required
to safely evacuate the threatened population for a wide range of potential hurricane
threats.

PUBLICATIONS OF INTEREST
from
Natural Hazards Research and Applications Information Center Institute of Behavioral Science #6
Campus Box 482 University of Colorado
Boulder, Colorado 80309 (303) 492-6818
SPECIAL PUBLICATIONS
#2. Regulation of Flood Hazard Areas to Reduce Flood Losses, Volume 3. Jon Kusler. 1982. 300 pp. $8.00
#3. to Volume
#4. Innovation in Local Floodplain Management, Appendix B to Volume 3 (SP #2). Jon Kusler. 1982. 262 pp. $8.00
#5. Floodplain Regulations and the Courts 1970-1981. Jon Kusler. 1982. 51 pp. $5.00.
#7. Preventing Coastal Flood Disasters: The Role of the States and Federal Response. Proceedings of a National Symposium, Ocean City, Maryland, May 23-25, 1983. 1983. 386 pp. $10.00.
#9. Improving the Effectiveness of Floodplain Management in Western Sate High-Risk Areas: Alluvial Fans, Mudflows, Mud Floods. Proceedings of a Workshop, Palm Springs, California, February 15-16, 1984. 1985. 97 pp. $7.00
#10. Evaluating the Effectiveness of Floodplain Management Techniques and Community Prorrams. Proceedings of a Seminar, Washington, DC, Aprll 3D-May , 1984. 1985. 143 pp. 58.00.
#11 Managing High Risk Flood Areas: 1985 and Beyond. Proceedings of the Eighth Annual Conference of the Association of State Floodplain Managers. 1985. 326 pp. $8.00.
MONOGRAPHS
#29. The Flood Breakers: Citizens Band Radio Use During the 1978 Flood in the Grand Forks Region. Thomas E. Drabek et al. 1979. 101 pp. $8.00.
#39 Terminal Disasters: The Use of Computer Simulation in Emergency Management. Sallie A. Marston, editor. 1985. 320 pp. $10.00.
#41 Community Recovery from a Major Disaster. Claire B. Rubin, et al. 1985. 295 pp. $10.00.
WORKING PAPERS Subscription Rate: $3.00/paper Regular Rate: $4.50/paper Outside North America: $1.00 more
#4. A Selected Bibliography of Coastal Erosion, Protection and Related Human Activity in North America and the British Isles. J.K. Mitchell. 1968. 70 pp.
#12. Technical Services for the Urban Floodplain Property Manager: Organi zat i on of the Des i gn Prob_' em. Kenneth ~ .. ~r~ and George Peterson. 1969. 25 pp.
#29. Flood Insurance and Community Pl anning. N. Baumann, R, Emmer. 1976. 83 pp.
#31. Warning for Flash Floods in Boulder, Colorado. T.E. Downing. 1977. 80 pp.
#32 What People Did During the Big Thompson Flood. E.C. Gruntfest. 1977. 62 pp.
#35 Hazard Mitigation Behavior of Urban Floodplain Residents. M. Waterstone. 1978. 60pp.
#47 Disseminating Disaster-Related Information to Public and Private Users. Claire B. Rubin. 1982. 32 pp.
#52 The Effects of Flood Hazard Information Disclosure by Realtors: The Case of the Lower FlorTaaKeYS: -John -A. Cross. 1985. 85 pp.
#53 Local Reaction to Acquisition: An Australian Study. John W. Handmer. 1985. 88 pp.
ANNUAL BIBLIOGRAPHIES
A Selected, Partially Annotated Bibliography of Recent (1983-1984) Natural Hazards Publications. David Morton. 1985. 140 pp. $6.50
TOPICAL BIBLIOGRAPHIES
#02. Bibliography on Flood Proofing. Anita Cochran. 1977. 9 pp. $1.00
#03. Flash Flood Warnings Bibliography. Kathleen Torres and Anita Cochran. 1977. 22 pp. $1.00
#11 Natural Hazards and Land Use Planning: An Annotated Bibliography. Ann R. FitzSimmons. 1984. 107 pp. $5.50.