Embed Size (px)
Citation preview

Flow regime patterns and their controlling factors in the Ebro basin (Spain) M Dolores Bejarano3 Miguel Marchaacutemalo13 Diego Garciacutea de Jaloacuten3 Marta Gonzaacutelez del Taacutenago
a Departamento de Ingenieriacutea Forestal Unidad Docente de Hidrologiacutea Universidad Politeacutecnica de Madrid E-28040 Madrid Spain b Departamento de Ingenieriacutea y Morfologiacutea del Terreno Universidad Politeacutecnica de Madrid E-28040 Madrid Spain
S U M M A R Y
Keywords Flow regime Reference conditions Hydrologic alteration Flow classification Prediction Fluvial restoration
Natural intra-annual flow fluctuations vary between rivers being a determining factor for aquatic insects fish and riparian communities which are adapted to the habitat conditions and different flows throughshyout the seasons Moreover restoration of seasonal flow patterns plays an important role in achieving good ecological status of rivers through the preservation andor recovery of components and processes of natural river ecosystems In this work we (a) classify fluvial segments in the Ebro basin (North-Eastern Spain) according to the intra-annual variability of flows under natural conditions using statistical cluster analysis of monthly mean flow data (b) characterise the resulting flow typologies according to several ecologically important hydrological variables (c) analyse the relationships between flow regimes of flushyvial segments and physical variables from their catchments and finally (d) predict the most probable natural flow regime using logistic models based on the most determinant physical characteristics Fifteen natural flow typologies were described in the Ebro basin which were characterised in terms of flow flucshytuation through the year as well as timing flow ratio and duration of the maximum and minimum flows Precipitation biogeography and geology of catchments showed the highest correlations with flow regimes Basin size mean elevation and slope were also correlated The logistic model we developed had a prediction success of 72 in the Ebro basin The definition of the natural hydrological conditions (to which the biological communities are tailored) even when flow data are not available is an important support in the management of river ecosystems It is especially suitable for setting goals in aquatic ecoshysystem conservation or restoration projects
Introduction
At present few river flows remain unaltered Dams are a major cause of hydrologic alteration There are over 45000 large dams around the world (greater than 15 m in height) retaining 15 of the total annual global runoff (Nilsson et al 2005) The hydrologshyical regime plays a major role in the preservation and restoration of the components and processes of the river ecosystems Both dishyrectly and indirectly through its effect on the physical characterisshytics that underlie the biological communities the hydrological regime affects the distribution of species their adaptive capacity as well as survival dispersal and reproduction and ultimately the biodiversity production and sustainability of river ecosystems (Poff et al 1997 Bunn and Arthington 2002 Arthington et al 2006) Not only changes in the magnitude of the flows but also of the frequency duration timing andor risefall rates which are characteristic for a given river and constitute its natural flow reshygime (Poff et al 1997) profoundly affect its flora and fauna (Ward and Stanford 1979 Petts 1984)
Corresponding author Tel +34 91 336 6394 E-mail address mariadoloresbejaranoupmes (MD Bejarano)
The essential ecological role of the intra-annual flow fluctuation has been highlighted by several authors Life-history adaptations of many fish aquatic insects and riparian plants typically involve the synchronisation of life cycles-events in relation to the occurrence of annual flow regime events (Poff and Ward 1989 Richter et al 1996 Poff et al 1997 Lytle and Poff 2004) For example natural timing of high or low stream flows provide environmental cues for initiation of life cycle transitions in fish such as spawning egg hatching rearing and movement onto the floodplain for feedshying or reproduction or migration upstream or downstream (Poff and Allan 1995 Marchetti and Moyle 2001 Freeman et al 2001 Humphries 2002) The seasonal sequence of flowering seed dispersal germination and seedling growth of many riparian plants are also adapted to seasonal timing components of natural flow regimes (Rood and Mahoney 1990 Mahoney and Rood 1998 Nilsson and Berggren 2000) The emergence into an aerial adult stage and the diapauses of aquatic insects are related to seashysonal floods and droughts (Hynes 1970 Hancock and Bunn 1997)
Many works have linked intra-annual flow patterns of rivers to climatic conditions (Wilby 1993 Hannah 1998 Harris et al 2000) and some have also shown the importance of geology topography vegetative cover and river size (Poff et al 1997 Baeza et al 2005a) But to what extent do the physical characteristics of
the catchment determine certain seasonal flow behaviours in their fluvial segments Is that physical information sufficient to characshyterise aquatic ecosystems
In this paper we classify flow regimes in terms of their intra-an-nual seasonal fluctuation (what Harris et al 2000 call shape) for river reaches defined between tributaries in the Ebro river basin (Northern Spain) and we hydrologically characterise the resulting flow typologies An analysis and discussion of associations beshytween defined flow regimes and physical characteristics from catchments is also presented so that the relationships we found can be used to predict the most probable hydrological seasonal patterns for ungauged reaches or where no appropriate natural flow information exists
Testing area
The Ebro river basin is the largest catchment in Spain It extends over 85530 km2 (173 of Spanish territory) It forms a broadly trishyangular morphological unit bounded on the North by the Pyrenees and Basque-Cantabrian Mountains to the East by the Catalan Coastal Chain and from North-West to South-East by the Iberian Massif From WNW to ESE until it reaches the Mediterranean Sea it is drained by the 910 km long Ebro river The drainage netshywork has a total length of 12000 km and it is much denser in mountainous areas (Fig 1) Its location between the Eurosiberian and Mediterranean biogeographical templates makes it a heterogeshyneous basin Its terrain includes rugged regions at the edges and flatter ground in the interior Temperature variations are smoothed by the ocean in the Western half of the mountainous Northern borshy
der while continental climate dominates the depression Average annual rainfall is 656 mm although it ranges from 300-500 mm annually in the centre to the 1500-2000 mm a year in the highest elevations of the catchment (http wwwchebroes Bejarano et al 2007)
The annual yield of the Ebro River is 182 km3year on average (maximum of 297 km3year and maximum of 84 km3year) Around 5-7 km3 are underground resources (for the period 1940-86 according to the Hydrological Plan for the Ebro river Conshyfederacioacuten Hidrograacutefica del Ebro 1999) mainly located in the Ibeshyrian Massif
The basin is subjected to an intense exploitation of water reshysources There are 216 large dams (Spanish Ministry of Environshyment 2006) (Fig 1) most intended mainly for hydropower production and for irrigation Forty four percentage of the water bodies in the basin are impounded The middle and lower stretches of the Ebro River are the most affected
Testing dataset and classification methodology
As a characterisation and classification unit the fluvial segment bounded by river confluences and its surrounding drainage area was selected using the hydrographic network from topographic maps at a 150000 scale A total of 658 fluvial segments have been described in the Ebro basin (Bejarano et al 2007) each one idenshytified by a code following Verdin and Verdin (1999) (Fig 2)
In order to classify the natural flow regime based on fluctuashytions along the year a statistical cluster analysis in stages was conshyducted For each fluvial segment in the basin we considered 12
Basque-Cantabrian Mountains
Fig 1 Location map showing relief river network and large reservoirs in the Ebro river basin in Northern Spain
Rivers
Selectednon selected fluvial segmentswatersheds 25 50 100 150 200
Fig 2 Fluvial segments and respective catchments in the Ebro basin Coloured catchments represent those selected for analyses of the relationships between physical and hydrological variables (For interpretation of the references to colour in this figure legend the reader is referred to the web version of this article)
variables corresponding to the mean monthly flow standardised through the ratio between the average annual flow at the end of each fluvial segment generated by SIMPA application for the pershyiod 194041-198586 Standardisation was used to eliminate the influence of the magnitude and allow comparisons SIMPA is the Spanish acronym meaning Integrated System for Rainfall-Runoff Modelling (Sistema Integrado de Modelizacioacuten de Precipitacioacuten-Aportacioacuten) It is an application which includes several hydrologishycal tools and models (see Teacutemez 1977 Estrela and Quintas 1996 and Ruiz 1998) developed in the Centre for Hydrographic Studies (CEDEX Ministry of Environment and Public Works Spain) It was designed to analyze spatial and temporal hydrological variables and to simulate hydrological processes based on them Models cope with water resources flood events or quality assessment Among others SIMPA has been used in Spain for water resources assessment for the National Water Master Plan in 2000 This inforshymation was provided by the Ebro Water Authority (Confederacioacuten Hidrograacutefica del Ebro http wwwchebroes) and the National Water Research Centre (CEDEX httpwwwcedexes) We meashysured the similarity between river segments represented in a 12 dimensions space (one per variable) using the Euclidean distance squared The aggregation method used was the farthest neighbour A cut-off distance between 123 and 264 was selected This threshshyold for the identification of different seasonal flow patterns was set manually in the cluster dendrogram under the following premises (a) to obtain a minimal number of types according to the aim of the classification (b) but representing the heterogeneity of the basin including the full spectrum of flow fluctuations
Subsequently we characterised the resulting flow regimes To do this we selected 287 fluvial segments evenly distributed in the basin ensuring representation of all resulting flow types (Fig 2) and calculated a series of ecologically significant hydrologshyical variables for each selected fluvial segment using the available mean monthly modelled flow data The average of these variables for river typologies was obtained Those variables analysed were
1 Timing of absolute maximum flow (MaxAT) month in which the mean natural flow reaches the highest value (identifying
months with numbers from 1 (October) to 12 (September) according to the hydrological year in Spain) If two or more conshysecutive months had the same maximum value this correshysponded to the average If two or more non-consecutive months had the same value this corresponded to the earlier month
2 Timing of absolute minimum flow (MinAT) month in which the mean natural flow reaches the lowest value (identifying months with numbers from 1 (October) to 12 (September) according to the hydrological year in Spain) If two or more consecutive months had the same maximum value this corresponded to the average If two or more non-consecutive months had the same value this corresponded to the earlier month
3 Timing of secondary maximum flow (MaxST) in bimodal flow types (when the hydrograph shows two peaks of maximum flow) this is the month in which the mean natural flow equals the absolute maximum flow or it is up to 25 lower than this having a period of lower flow of one to several months between both absolute and relative maximum flows (identifying months with numbers from 1 (October) to 12 (September) according to the hydrological year in Spain)
4 Duration of period of maximum flow (MaxD) number of conshysecutive months around the absolute maximum flow which have mean natural monthly flow values equal or up to 25 lower than absolute maximum flow
5 Duration of period of minimum flow (MinD) number of consecshyutive months around the absolute minimum flow which have mean natural monthly flow values equal or up to 25 more than absolute minimum flow
6 Number of reversals calculated using monthly flow data (RN) number of rises and falls of the mean natural monthly flow throughout the year
7 Ratio of the absolute maximum flow (MaxAR) how much higher the mean natural absolute maximum monthly flow was compared with the annual average flow
8 Ratio of the minimum flow (MinAM) how much lower the mean natural absolute minimum monthly flow was compared with the average annual flow
Finally a physical characterisation of catchments in the Ebro basin was carried out using available variables which can influence flow regime (Gonzaacutelez del Taacutenago and Garciacutea de Jaloacuten 2004) They were as follows
1 Ecoregion according to the Spanish Subprovince divisions (Rivas Martiacutenez et al 2002) which take into account mainly clishymatic and geological characteristics
2 Precipitation regime Characteristic annual patterns of precipishytation in the Ebro basin were analysed in a previous work by Bejarano et al (2007) They found six patterns using a statistical cluster analysis with standardised mean monthly rainfall records from all meteorological stations in the basin for the same period as the flow data presented here Their main charshyacteristics are summarised in Table 1
3 Basin size following that proposed in the Water Framework Directive (European Commission 2000)
4 Geology according to categories described for Spain by Gutshyieacuterrez Elorza (1994) and suggested by the Water Framework Directive (European Commission 2000) which imply distinct influence on runoff variability (Gustard 1992 Sanz 1996 Bae-za and Marchaacutemalo 2002) as well as different solubility of rocks (related to water mineralization) and cohesion of the materials (related to grain size)
5 Mean elevation of the basin 6 Slope of the fluvial segment
Relationships between physical and hydrological variables in the 287 selected fluvial segments were analysed The frequencies of fluvial segments for the categorical variables both hydrological and physical for each described flow type were analysed and organised in contingency tables A Chi-square test was also carried out and the contingency coefficients were computed in order to understand the possible relationships between these variables and flow types Statistical significance of median values for hydro-logical and physical numerical variables among the found flow typologies were tested using non parametric Kruskal-Wallis analshyysis and by calculating the H Kruskal-Wallis statistics Afterwards a multiple Comparisons of mean ranks was carried out for all groups to reveal which of the flow types were significantly differshyent To determine which relevant hydrological and physical varishyables were most related to seasonal flow behaviours and in order to reveal patterns in the data Principal Component Analysis (PCA) was carried out on the most significant hydrological varishyables which characterise the fluvial segments and on the most relshyevant physical variables of catchments As most of physical variables were categorical the frequencies of fluvial segments for each flow type in each category for each physical variable were
Table 1 Precipitation regimes in the Ebro basin (from Bejarano et al 2007)
Precipitation regime
Eastern Pyrenees
Western Pyrenees
Centre of Ebro basin
Cantabrian Mountains
Northwestern Iberian Massif
Southeastern Iberian Massif
Rainy season
Late summer Spring
Autumn Spring
Early autumn Spring
Autumn-winter Spring
Late autumn Spring
Autumn Spring
Duration of (number of
2 2
3 2
3 1
4 2
2 2
2 1
rainy season months)
Dry season
Winter
Summer
Summer
Summer
Summer
Winter Summer
Duration of (number of
2
2
3
2
2
2 2
dry season months)
Total annual precipitation (mm)
1000
900
350
1100
650
500
used for the physical PCA analysis Once relationships between flow types and physical variables were established in selected flushyvial segments we modelled the probability of each flow type occurring on the remaining 371 fluvial segments in the basin in relation to physical variables measured for their respective catchshyments using a Backwards Multiple Logistic Regression We obshytained a logistic model for each flow type estimating the likelihood of pertinence to the given type The expected flow type for each fluvial segment was the one which showed the highest probability of occurrence The model was validated by comparing the resulting prediction with observed flow type from the previous cluster analysis on the flow data for the whole basin
Statistical tests were performed with SPSS10 Statgraphics plus51 and Statistica7 software
Results of classification in testing area
Flow regime classification
Statistical cluster analysis provided a dendrogram (Fig 3) which showed 15 types of natural intra-annual flow patterns for the Ebro
PLUVIAL NIVAL
I
I I I I Slightly fluctuating Highly fluctuating Pluvio-Nival Nivo-Pluvial
Stable Seasonal
i i Winter Spring
Hi 1 2 3 4 5 6 7 8 9 10 11 12 13 14 15
Fig 3 Dendrogram from statistical Cluster analysis X axis contains the resulting flow types Vaxis represents Euclidean distance square Nival and Pluvial flow types are discriminated at the first level of the dendrogram linked mainly to snowmelt or rainfall influence respectively At the second level of the dendrogram on the Nival branch rainfall progressively gains importance in Pluvio-Nival types and on the Pluvial branch highly and slightly fluctuating types are discriminated by the degree of intra-annual fluctuation Slightly fluctuating flow types are divided into seasonal (winter or spring flow types) and stable typologies on the third and fourth levels of the dendrogram according to whether the period of maximum flow occurs at a certain season or during a prolonged period in which the season is not very marked respectively
FLOW TYPE 2
Oct Nov Dec Jan Feb Mar Apr May Jun Jul Aug Sep
S 3
1
amp 3
I-
Oct Nov Dec Jan Feb Mar Apr May Jin Jul Aug Sep
FLOW TYPE 7
Oct Nov Dec Jan Feb Mar Apr May Jun Jul Aug Sep
FLOW TYPE 10
Oct Nov Dec Jan Feb Mar Apr May Jun Jul Aug
FLOW TYPE 13
FLOW TYPE 3
I
Oct Nov Dec Jan Feb Mar Apr May Jun Jul Aug Sep
35
f 3
bullfi 25
u
|5 i w 05
^5=5==^ bullyS^
FLOW TYPE 5
^ ^
V _ ^ j r _ j -
Oct Nov Dec Jan Feb Mar Apr May Jin Ji i Aug Sep
FLOW TYPE 8
Oct Nov Dec Jan Feb Mar Apr May Jun Jul Aug Sep
FLOW TYPE 11
Oct Nov Dec Jan Feb Mar Apr May Jun Jul Aug Sep
FLOW TYPE 14
Oct Nov Dec Jan Feb Mar Apr May Jin Ji i Aug Sep
FLOW TYPE 9
Oct Nov Dec Jan Feb Mar Apr May Jun Jul Aug Sep
35
i 3 bullg 25
1-i i pound 05
FLOW TYPE 12
^ L
^ = - ^ ^ C S I S S ^ ^ ^ e
Oct Nov DBC Jan Feb Mar Apr May Jun Jul Aug
FLOW TYPE 15
Oct Nov Dec Jan Feb Mar Apr May Jun Jul Aug Sep Oct Nov Dec Jan Feb Mar Apr May Jun Jul Aug Sep Oct Nov Dec Jan Feb Mar Apr May Jun JUuml Aug
Fig 4 Average annual pattern in mean monthly standardised discharge for each flow type in the Ebro basin
basin (Fig 4) A prior inspection of the graphs for discharge regime showed shape differences among typologies Differences in timing duration and flow ratios of high and low flows presence or absence of secondary high flows number of reversals (calculated using monthly flow data) and the sharpness or gentleness of a curve could be distinguished This was reflected in the analysed hydro-logical variables for each fluvial segment and flow types (Table 2)
Nival and pluvial typologies were discriminated at the first level of the dendrogram (Fig 3) Nival types were characterised by late spring or even summer maximum flow much higher than mean annual flow but occurring during short periods On the other hand pluvial types presented not as marked maximum flows but over longer periods and they usually showed up bimodal hydrographs with winter and spring absolute and secondary maximum flows In terms of minimum flows nival types usually presented longer low flow periods but not as marked as those for pluvial types Timshying was also a distinctive feature in general minimum flows ocshycurred during winter in nival typologies while they were during summer in pluvial ones (Table 2 and Fig 4)
The second level of the dendrogram divided nival and pluvial types into different groups On the nival branch flow type 15 which represents nivo-pluvial segments was soon differentiated
from pluvio-nival typologies (Fig 3) Nivo-pluvial segments showed the highest values for maximum flow ratio and one of the shortest maximum flow period They also showed the longest minimum flow period Although snowmelt influence is important in both groups it is particularly significant in nivo-pluvial types while rainfall progressively gains importance in pluvio-nival ones from flow type 14 to flow type 12 It was reflected as a decrease in maximum flow ratios and rise in duration of maximum flow perishyod Shorter minimum flow periods were also found as thawing lost significance (Table 2 and Fig 4)
On the pluvial branch of the dendrogram two main groups were distinguished mainly by the degree of intra-annual fluctuashytion (Fig 3) Highly fluctuating types which showed multipeak hydrographs presented the highest number of rises and falls (calshyculated using monthly flow data) evenly distributed throughout the year Duration of maximum flow period in fluctuating typoloshygies was shorter compared with less fluctuating ones however most of them also showed very short minimum flow periods Minshyimum flow ratio was also relatively higher in fluctuating types Among the most fluctuating typologies differences in absolute and secondary high flow timing allowed a clear separation of highly fluctuating flow type 9 from highly fluctuating flow types
Table 2 Hydrological variables for flow types Timing shows the months in which the maximum or minimum flows are achieved in more than 65 of the cases The rest of the variables show the mean values and standard deviations for each flow type MaxAT and MinAT represent timing of absolute maximum and minimum flows MaxST represents timing of secondary maximum flow MaxAR and MinAR represent absolute maximum and minimum flows ratios to the annual average flow MaxD and MinD represent duration of maximum and minimum flows period RN represents number of raises and falls (reversals) throughout the year calculated using monthly flow data
Flow type
Pluvial stable
Pluvial winter
Pluvial spring
Pluvial highly fluctuating
Pluvio-Nival
Nivo-Pluvial
1 2 3
4
5 6 7 8 9
10
11 12 13 14 15
MaxAT (month)
Jan Jan Mar-Feb-Jan Jan
Mar May May May May
May-Dec-Jan Dec Jun May May Jun
MaxAR (times annual average)
157 plusmn0089 1987 plusmn0176 1791 plusmn0136
1814 plusmn007
1712 plusmn0049 1629 plusmn0102 1737 plusmn0095 1798 plusmn0278 1577 plusmn0136
1606 plusmn0158
2289 plusmn 0299 1754 plusmn0244 2014 plusmn0161 2445 plusmn 0257 3162 plusmn0351
MaxST (month)
May-Apr May
May-Mar-Apr
Mar Mar
Dec
May-Mar
May Nov
MaxD (number months)
605 plusmn11 382 plusmn116 463 plusmn 097
413 plusmn089
41 plusmn 057 453 plusmn141 392 plusmn 079
3 plusmn 158 237 plusmn 161
246 plusmn 088
1 plusmn 0 271 plusmn 186
2 plusmn 0 195 plusmn021 157 plusmn051
MinAT (month)
Aug Sep-Aug Sep
Aug
Aug Aug Sep Aug Aug
Aug
Aug Aug Feb-Aug Feb Feb
MinAR (times annual average)
0233 plusmn 0045 0175 plusmn0051 0266 plusmn 007
0149 plusmn 0046
0301 plusmn 0042 0394 plusmn 0055 0403 plusmn 0048 0525 plusmn 0084 0606 plusmn 0085
0375 plusmn011
031 plusmn 0049 0347 plusmn 006 0691 plusmn0119 0477 plusmn 0091
029 plusmn0105
MinD (number months)
195 plusmn049 179 plusmn065 249 plusmn 055
188 plusmn072
18 plusmn042 193 plusmn07 283 plusmn 058 271 plusmn 090 258 plusmn 102
192 plusmn064
186 plusmn07 186 plusmn036 307 plusmn 17 314 plusmn 089 343 plusmn 051
RN (number of raises and falls)
2571 plusmn0926 2152 plusmn0508 3073 plusmn133
2875 plusmn 0342
3 plusmn 0 3933 plusmn1223 2167 plusmn0577 2762 plusmn 0944 7158 plusmn0765
5615 plusmn1609
8 plusmn 0 5357 plusmn 0929 5393 plusmn1031 4591 plusmn 0666 3214 plusmn0579
10 and 11 While absolute maximum flow occurred in spring and secondary flow in winter for flow type 9 it was the other way around for the other two (Table 2 and Fig 4)
Slightly fluctuating flow types were divided into seasonal and stable typologies on the third level of the dendrogram (Fig 3) Stashyble typologies (flow types 1 and 2) showed very low values for maximum and minimum flow ratios and also for number of revershysals of mean monthly flow values They were both characterised by long periods of maximum flow between winter and spring A grashydient of values for these variables from stable flow type 1 to stable flow type 2 could be distinguished being the first one the most stashyble flow type in the Ebro basin Maximum flow timing was the main difference between seasonal flow types The fourth level of dendrogram basically differentiated typologies whose high flow occurred in winter from those of spring high flow Stable flow type 2 could be in transition from the stable to seasonal winter flow type Spring typologies also showed higher minimum flow ratios than winter typologies Within each group decreased gradient of duration of maximum flow period from winter flow types 3-5 and spring flow types 6-8 were observed (Table 2 and Fig 4)
The Chi-square test confirmed a correspondence between cateshygorical hydrological variables and the flow types described The strength of this relationship was reflected in the high contingency coefficients and P-values smaller than 005 in all cases (Table 3) Multiple analyses of mean ranks revealed that except for the durashytion of period of minimum flows hydrological variables showed significant different values for most of flow types (Table 2 and Fig 5) It was also corroborated by high values of the H statistic from Kruskal-Wallis tests for numerical hydrological variables for flow types in all cases except for duration of minimum flows period (Table 3) Seasonal winter flow type 5 shared most of its hydrological characteristics with others being the weakest defined flow type On the other hand stable flow type 1 and nivo-pluvial flow type 15 were the most strongly defined with most of their hydrological characteristics significantly different from the other flow types (Table 2)
PCA analysis discriminated between hydrological characterisshytics in flow types (Fig 6) The principal component of PCA of hydro-logical characteristics explained up to 43 of the variance Together the first and second components accounted for 75 of
Table 3 Results for contingency coefficients and Kruskal-Wallis H statistics and respective P-values for studied hydrological and physical variables from catchments MaxAT and MinAT represent timing of absolute maximum and minimum flows MaxST represents timing of secondary maximum flow MaxAR and MinAR represent absolute maximum and minimum flows ratios to the annual average flow MaxD and MinD represent duration of maximum and minimum flows period RN represents number of raises and falls (reversals) throughout the year calculated using monthly flow data
Variables
Hydrological MaxAT MaxAR MaxST MaxD MinAT MinAR MinD RN
Physical Precipitation regime Ecoregion Geology Basin size Elevation Slope
Contingency
086
084
081
085 081 068 063 063 062
coefficient Contingency
0
78 )
0
0 0 0 0 0 0
lt10 -10
coefficient P-value H Kruskal-
20202
18321
23821 9666
19899
9424 7965 6733
-Wallis Kruskal-Wallis P-value
0
0
0 0 0
0 33 x 1 0 - 59 x 10-9
35
I i
i 00
(a)
B Eacute
bull Median U 25-75 I Min-Max
1 2 3 4 5 6 7 8 9 10 11 12 13 14 15 Flow type
laquoiexcl 6
o
15 bullR 4
( Q l bull Median
[ r
1
1 bull
I Min-Max
1 2 3 4 5 6 7 8 9 10 11 12 13 14 15 Flow type
0)
T=
3 3 Sf s 1 e i i bullg 0) + -
s o Vi
ltlt
10
09
08
07
06
05
04
03
02
01
00
(c)
1 bull
T
0 Median bull 2 5 - 7 5
1 Min-Max
1 2 3 4 5 6 7 8 9 10 11 12 13 14 15 Flow type
o
(d) bull Median D 2 5 - 7 5
~X Y
X Min-Max
1 2 3 4 5 6 7 8 9 10 11 12 13 14 15 Flow type
18
S 12
I 10
I i-laquo 02
00
(e)
n Median D 2 5 - 7 5 X Min-Max
1 2 3 4 5 6 7 8 9 10 11 12 13 14 15
Flow type
-(f)
i
[ ]
1=1 Median
I Min-Max
1 2 3 4 5 6 7 8 9 10 11 12 13 14 15 Flow types
Fig 5 Box and whisker plots of the annual median standardised absolute maximum flow (a) duration of period of maximum flow (b) standardised absolute minimum flow (c) duration of period of minimum flow (d) standardised relative maximum flow (e) and number of raises and falls (reversals) throughout the year calculated using monthly flow data (f) within each of the 15 flow types
the total variance While the first component represented timing and duration of maximum and minimum flows the second identishyfied flow ratios and number of reversals
Physical characterisation
The pattern of spatial distribution of flow types described for the selected fluvial segments in the Ebro basin can be seen in Fig 7 Frequency analyses showed that certain types of flow correshysponded more closely to certain physical characteristics (Table 4)
At the highest and broadest level of the flow regime classificashytion flow typologies located in the Eurosiberian region were clearly separated from those flow types located in the Mediterrashynean region (Rivas-Martiacutenez et al 2002) This first division matched the nival and pluvial flow divisions respectively Within Mediterranean region particular climatic characteristics separated those flow types with the highest fluctuations from the others They were located in the South-East of the Ebro basin (Catalana-Valenciana Subprovince) and were characterised by fairly low total annual precipitation and prolonged dry season Basin size allowed
45
25
S o mdash u_
-15
-35
mdash -
l 2
1 MaxAR
Mvo Pluvial 14
Pluvio Nival 5 -bdquo 3 M111AD13 Seasooal winter __mdashmdash
Most stabje MiquestD
M Iacute I L J J - -
4 J -^-fe=^_ iacuteHfiwuriacuteMngiexcli2~~ mdash-mdash__MBXAT
Hi(thhfluctirraquotiDa
-33 -1J 0 F1
Fig 6 PCA biplot of most significant hydrological variables absolute maximum flow ratio (MaxAR) absolute maximum flow timing (MaxAT) duration of period of maximum flow (MaxD) absolute minimum flow ratio (MinAR) absolute minimum flow timing (MinAT) duration of period of minimum flow (MinD) and number of raises and falls (reversals) throughout the year calculated using monthly flow data (RN) Weight for hydrological variables and the dispersion of flow types are represented to first and second components (Fl and F2) Fl explains 43 of the total variance and F2 explains 32 of the total variance Maximum and minimum flows timing have been turned into numerical variables from 1 (January) to 12 (December) in order to represent them on the graph
differentiation of flow types in highly fluctuating branch Among remaining pluvial flow typologies spring seasonal ones were mainly distributed along the South-East side of the Iberian Massif (Oro-Ibeacuterica Subprovince) where precipitation regime follows a gradient along the ridge from the inside edge to the Mediterranean Sea A combination of basin size elevation and slope enabled disshytinction between these three flow typologies On the other hand stable seasonal winter flow typologies were mainly located in North-West and centre of the Ebro basin The most stable flow type (flow type 1) belonged to middle and lower catchments of Ebro river running through the centre of the basin (Bajo-Aragonesa Sub-province) and comprised as was shown by Kruskal-Wallis test the largest flattest and lowest basins Upstream contributions mean that this flow type does not reflect the driest zone in the basin Sometimes underground contributions could also explain flow stashy
bility Seasonal winter flow types except for flow type 5 located in the centre were found in the in the Northern part of Iberian Massif and along the Basque-Cantabrian Mountains (Oro-Ibeacuterica and Cantabro-Atlaacutentica Subprovinces) In general they represented catchments which were not very steep nor high sided most of them calcareous They could be distinguished by the characterisshytics of eco region and precipitation regime as they follow a gradient from North-West to South-East (Table 4)
Within Eurosiberian region a gradient between flow types could be distinguished On one side nival types 14 and 15 were loshycated in the Pyrenees Mountains (Pirenaica Subprovince (Rivas-Martiacutenez et al 2002)) This area is characterised by a snowy winshyter very rainy spring and rainy late summer and autumn Nevershytheless nivo-pluvial flow type 15 was soon distinguished as shown by the Kruskal-Wallis test as the smallest steepest and highest catchments On the other side the remaining pluvio-nival flow types (12 and 13) were situated in the Pre-Pyrenees (among Pirenaica and Bajo-Aragonesa Subprovinces) This is a transition area where snowy winters progressively give way to rain and summer is a dry season Both presented mixed geology basins larshyger than flow type 14 Slight differences in elevation and slope alshylowed their differentiation (Table 4)
Chi-square analysis showed the relationship between the deshyscribed flow types and some of the physical variables Ecoregions and precipitation regime showed the highest values for the continshygency coefficient among the analysed physical variables with an average of 08 They were closely followed by geological charactershyistics of the catchments with 07 Finally values around 06 were shown for catchment size elevation and slope (Table 3) Kruskal-Wallis H values for numerical physical variables and P-values lowshyer than 005 suggested that there were some significantly different flow types (Table 3) Nevertheless Multiple analysis of mean ranks showed that only the most stable flow type within the pluvial branch (flow type 1) and most of the nival types (flow types 13-15) presented significantly different basin size elevation and slope (Fig 8)
PCA allowed differences between physical characteristics to be highlighted among fluvial segments of each flow type The first
200 bull Km
Fig 7 Location in the Ebro basin of flow types of selected catchments for the analysis of relationships between hydrological and physical variables Blank catchments represent the ones used for validation of the flow prediction model
Table 4 Physical description of flow types according to the frequency study The most common characteristics which occurred in more than 65 of the catchments of each flow type are described Basin size small (lt99 km2) medium (100-999 km2) large (1000-9999 km2) and very large (gt10000 km2) (WFD 2000) Elevation very low (lt399 m) low (400-649 m) medium (650-849 m) high (85-1049 m) and very high (gt1050 m) Slope very flat (lt019 ) flat (02-084) medium (085-249) steep (25-449) very steep (gt45)
Ecoregion and precipitation regime
Mediterranean ecoregion Middle and lower Ebro river
Basque-Cantabrian Mountains
Northern Iberian Massif
Centre of Ebro basin
Southern Iberian Massif
Eurosiberian ecoregion Pre-Pyrenee and centre of Ebro basin
Pyrenees Mountains
Bajo-Aragonesa Subprov Centre of Ebro basin precipitation regime
Cantabro-Atlaacutentica Subprov Cantabrian precipitation regime
Oro-Ibeacuterica to Cantabro-Atlaacutentica Subprov Northwestern Iberian Massif precipitation regime
Bajo-Aragonesa Subprov Centre of Ebro basin precipitation regime
Oro-Ibeacuterica Subprov Centre of Ebro basin precipitation regime
Catalana-Valenciana Subprov Southeastern Iberian Massif precipitation
Pirenaica to Bajo-Aragonesa Subprov Western Pyrenee and centre of Ebro basin regimes
Pirenaica Subprov Eastern Pyrenee precipitation regime
Geology
Mixed
Calcareous
Mixed and Calcareous
Mixed
Mixed amp Calcareous
Calcareous amp Mixed
Calcareous
Mixed
Siliceous and mixed
Siliceous
Basin size elevation and slope
Very large very low very flat
Large-medium size medium elevation flat
Medium size medium elevation-high medium slope-steep
Medium size medium elevation flat
Large-medium size low elevation flat
Medium size elevation and slope Spring waters Small medium elevation-high medium slope-steep Spring waters Large high medium slope Spring waters
Large medium elevation flat Spring waters
Medium size medium elevation-low steep Small medium elevation-high steep
Large high medium slope
Large medium elevation medium slope-flat
Medium sizevery high and steep
Small very high very steep
Flow type
Flow type 1
Flow type 2
Flow type 3
Flow type 4
Flow type 5
Flow type 6
Flow type 7
Flow type 8
Flow type 9
Flow type 10
Flow type 11
Flow type 12
Flow type 13
Flow type 14
Flow type 15
component explained 28 of the total variance of the data and identified ecoregions precipitation regime and geology The secshyond component identified basin size slope and elevation and exshyplained 23 of the total variance (Fig 9) Up to 10 components were necessary to explain the remaining 49 of variance in flow types by physical characteristics
Flow type prediction
Taking into account the observed relationships between hydro-logical regimes and the studied physical variables in selected catchments we predicted the natural flow regime of the remaining catchments in the Ebro basin using their physical characteristics The backwards stepwise factor selection procedure within the Multiple Logistic Regression allowed us to select the most relevant physical variables for each flow type model Precipitation regime patterns were selected in most of the models while ecoregions were never selected for nival flow type modelling Both physical variables were the most influential in the generated models Geolshyogy basin size and elevation were selected as predictors in one third of the cases (Table 5) The highest values for the logistic anashylogue of r2 (rf) appeared at both ends of the dendrogram in the most stable flow types (1 2) and in the nivo-pluvial flow type 15 with an average value of 60 (Table 5) This indicated that 60 of the uncertainty in assigning these flow types to each fluvial segment could be explained by a combination of the most relevant selected physical variables Worst values for r appeared for the
seasonal spring flow type models The comparison of predicted flow types with observed flow types for each of 371 fluvial segshyments showed an error of 28 in the flow type prediction Nival flow typologies presented the highest prediction errors in the Ebro basin
Discussion and conclusions
Statistical cluster analysis is a very useful tool for the distinction of different patterns in a dataset In this study it allowed us to classhysify the natural annual standardised hydrographs present in the Ebro basin into homogeneous groups using only readily available mean monthly flow records This method was first successfully apshyplied to climatological classifications (Kalkstein et al 1987) It has since been used for the identification of distinct fish assemblages in Europe (Melcher et al 2007) In a flow regime context this methshyodology was the main tool for classification of flow patterns used by Harris et al (2000) and Hannah et al (2000) Both authors anashylysed shape and magnitude of flow As we work with standardshyised flow magnitude is not taken into account in our study and we focus on a deeper analysis of the shape of hydrographs and their relationships with several physical variables from catchments On the other hand while Hannah et al (2000) used daily scale flow reshycords Harris et al (2000) used as we do here monthly scale flow records Since the research is focused on the intra-annual fluctuashytion of flow and its final goal is to be able to predict using physical variables this seasonality (throughout the year) simplicity was
90OO0
IacuteOOOO
oooo
60OO0
~S 50OO0
I 40OO0
= J 30OO0
oooo
10OO0
o
-10OO0
2800 Iacute Uuml
-iv
22M
__ 1800
i 1600
I 1400
I 1200
1000
so 600
400
200
o
(a) deg Median D 25degltgt-7iacute I Min-Mas
Cb ltamp ltTP o bull5= IacuteIacute-
1 2 3 4 5 6 7 3 9 10 II 12 13 14 15
Flow type
(b) D Median
I Min-Mas
TV 3 4 5 6 7 8 9 10 II 12 13 14 15
Flow type
IacuteQ) deg Median D I5-75degi
X Min-Mai
i i U iacute iacute iacute eacute B a IB 3 4 6 7 S 9 10 11 12 15 14 15
Floraquo type
Fig 8 Box and whisker plots of catchment size (a) mean elevation (b) and slope (c) within each of the 15 flow types
required Monthly flow series were thought to be accessible easy to work with and good representatives of the seasonality of flow fitting the requirements of the work Actually the hydrological parameters calculated in this paper confirm that monthly data conshytain significant information to distinguish different intra-annual flow behaviours
The definition of a relative high number of flow regimes for the Ebro basin (Fig 4) could be the result of the temporal and spatial variability which characterise the Mediterranean environment The study basin has great physical heterogeneity which has been
shown to be a deciding factor in the annual seasonality of flow The post-cluster hydrological characterisation of resulting flow types (Table 2) showed that key hydrological variables on which fluvial ecological processes depend were significantly different supporting the choice of the cut-off distance in the dendrogram and thus the 15 obtained typologies (Fig 3)
The critical role of hydrological variability in sustaining aquatic ecosystems has been shown in several studies (Poff et al 1997 Richter et al 1996) In order to provide information on ecologically significant features of intra-annual flow regimes influencing aquashytic wetland and riparian ecosystems we selected eight variables for the characterisation of the shape of the hydrographs from the different flow typologies (Table 2) supported by studies of relevant hydrological variables (see for example Richter et al 1996 Olden and Poff 2003 Baeza and Garciacutea de Jaloacuten 2005b) Summer droughts are common in Mediterranean catchments and only those located on the Eurosiberian side of the Ebro basin differ from this pattern Hence timing and duration of low flows allows differshyentiation between nival and pluvial flow typologies however they are not significant variables within Mediterranean environments The same is true for secondary maximum flow which only appears in pluvial Mediterranean typologies So it is useful in distinguishshying between Eurosiberian and Mediterranean flow types but it is not so useful for Mediterranean ones On the other hand variables related to high flow and fluctuation degree vary significantly from one type to another High and low flow ratios are also defining variables allowing separation of the more stable flows which reshymain around the average for much of the time from those whose maximum or minimum flows deviate considerably from the anshynual average (Fig 6)
The important influence of several physical characteristics of the catchments on flow regimes is demonstrated in this paper (Tashyble 5) We also show that there is a hierarchy in the importance of such physical factors and that each one may be mainly responsible for the response of certain hydrological parameters Rainfall patshyterns and biogeographical characteristics explain at the first levels differences among flow typologies But more precise flow regime classification is only possible if beyond these other physical factors such as geological nature of catchments size elevation and slope are also taken into account (Table 4 Figs 6 and 9)
The first level of the flow regime classification in the Ebro basin which separates Eurosiberian nival from Mediterranean pluvial flow types is clearly linked to biogeography of the catchments (Fig 3) Duration and timing of low flows are the most important hydrological variables at this level having opposite responses in the two groups Snowfall and thawing are the main factors responshysible for the typical hydrograph shape of Eurosiberian catchments characterised by prolonged low flow during winter and short but marked increases of flow in late spring Nevertheless summer droughts characterise Mediterranean types of flow (Tables 2 and 4) Biogeography and rainfall patterns are the determining factors at the second level of classification (Fig 3) and their influence is revealed in some of the studied hydrological variables highlighting the number of reversals throughout the year (calculated using monthly flow data) and timing of maximum flows Within nival types a gradient is observed from nivo-pluvial to pluvio-nival flow typologies The former are located in the Pyrenees themselves while the latter are found in catchments in the foothills of the Pyrenees and centre of the basin where consequences of snowmelt are less important and flow regime shapes the change from nival to seasonal patterns presenting longer but less pronounced high flows and not only dry winters but also dry summers Within plushyvial types clear differences can be recognised between Southeastshyern Mediterranean flow regimes and Northern and Northwestern flow regimes Multipeak flow regimes characterised the former presenting the highest number of reversals (from monthly flow
56
36
16
04
24
44
2
11
7
8
4
1
3
10
9 6
5
1
13
12
14
i
mdash 15
_
-
bull l bull3
Mediterranean +
Calcareous bullbull
3 Fl
Basin s j z e Slope Elevation
Eurosiberian
Siliceous
Fig 9 PCA biplot of significant physical variables Weight for physical variables have been simplified for better understanding The dispersion of flow types according to first and second components is also represented (Fl and F2) Fl explains 28 of the total variance of the data and F2 explains 23 of the total variance
Table 5 Values for the logistic correlation coefficient and weight for the physical variables used in each logistic model for flow type prediction Ecoregions Pirenaica (PI) Bajo-Aragonesa (BA) Cantabro-Atlaacutentica (CA) Castellana (C) Oro-Cantaacutebrica (OC) and Oro-Ibeacuterica (01) Precipitation regime Eastern Pyrenees (EP) Western Pyrenees (WP) Centre of Ebro basin (CB) Cantabrian Mountains (CM) and Northwestern Iberian Massif (NWIM)
Flow type
1 2 3 4 5 6 7 8 9
10 11 12 13 14 15
ltf
06 07 05 04 03 03 01 02 03 04 05 04 03 04 06
Ecoregion
PI
287
-11
-166 00
176
BA
268
141 01
-18 163
186
CA
245
136 173
-166 -01
174
C
136
155 -04
25 166
-01
OC
90
-2 6 165
-166 01
167
OI
241
153 -15
-14 165
170
Precipitation regime
EP
-89 09 -104 01 17
-201 -210 13 -191 03 170 187
WP
-88 17 -112 -09 14
-199 -209 -155 -194 188 189 171
CB
63 145 12 -14 179
03 -2 3 -12 -171 158 168 148
CM
108 212 24 -16 -01
-179 -177 -168 -192 -02 02
NWIM
108 174 36 173 00
-3 6 -181 -000 -192 01 01
Geology
Mixed
-38
160
-09
-182
Clay
-0 6
155
-17
-185
Calcareous
-22
-06
08
-185
Elevation
-00041
-00036
00030 00029 -00070
-00023
Basin
00003
-00004
-00007
-00010
-00017 -00069
Slope
07349
-04839
03319
data) along the year It is often found that temporary fluvial segshyments belong to these flow types Less fluctuating seasonal flow patterns characterised the latter which usually present absolute and secondary maximum flows synchronised with rainy seasons and lower number of reversals (Tables 2 and 4)
At a lower level in the classification flow regimes basically reshyflect the influence of the geological nature of catchments and their size (Fig 3) Maximum and minimum flow ratios and duration of high flow periods are the most significant hydrological variables at this level In general the most stable typologies whose monthly mean flows are maintained around the annual average most of the year coincide with largest mixed catchments On the other hand stable types with slightly gradual rises of flow from autumn through to May are also linked to calcareous catchments most of them with underlying aquifers in which rainfall only contributes effectively to increased flow rates when they become saturated (Gustard 1992 Sanz 1996 Baeza and Marchaacutemalo 2002) Both of them present low values for flow ratios and long maximum flow periods (Tables 2 and 4) Finally incorporating other physical varishyables from catchments such as elevation and slope at the lowest levels of the classification allows to us to exclusively characterise the different flow regimes making flow classification more accurate
Based on the hierarchical relationships between physical and hydrological characteristics shown in this paper predictive models of the most likely flow regime in a given fluvial segment can be developed Nevertheless although precipitation regime biogeog-raphy or even geology of catchments strongly influence the flow regime (Table 5) correlation between physical factors and flow reshygimes becomes weaker as we descend the classification tree when other physical variables are taken into account (Fig 3 and Table 3) This may be the reason why in the Ebro basin certain flow regime types were difficult to distinguish from one another (mainly beshytween nival flow types) although these errors only occurred at the lowest level of the classification tree On the other hand it has been shown that flow regimes are not simply the consequence of a few factors but are the result of a combination of several (Fig 9) Losing accuracy in prediction of flow typologies at the lowshyest levels of classification may lead to errors in predicting some ecologically relevant hydrological variables For this reason when flow data is available it would be advisable to incorporate them into the classification Those classification systems that only use physical variables such as System A in the Water Framework Directive (European Commission 2000) run the risk of missing some important ecological features of the hydrological regime But when natural flow series are not available characteristics of
the natural flow regime of a fluvial segment could be defined using physical information from its catchment Therefore the underlying hierarchical physical characterisation of the basin is an important tool for river flow classification Although particularities are taken into account it is important to be mindful that any classification system remains a systematic reduction of reality and that rivers are continua of flow matter and energy (Vannote et al 1980) In order to avoid an excessive number of flow typologies and a very complicated predictive model driven by the use of many categories for the physical variables taken into account we used a simple catshyegorization for each variable based on previous characterisation and classification works which using similar categories (Garcia de Jaloacuten et al 2006) have resulted in ecologically meaningful river types
Nowadays many rivers have their seasonal flow patterns alshytered because of the influence of upstream dams As the ecology of permanent hydrosystems are very dependent on the intra-an-nual flow pattern the presented analysis of its most important controlling factors and the final proposal of flow regime classificashytion methodology are ecologically relevant since they are able to define the characteristic shape of the natural annual hydrograph in river reaches thereby setting their hydrological reference condishytions This work is intended for use in the assessment of river ecoshysystems status planning river management strategies and setting and measuring progress toward conservation or restoration goals
Environmental flow designs at the regional scale can specially rely on the results of this classification If flow alteration-ecologishycal response relationships hold true for each member of a distincshytive hydrological class and each type of flow alteration then environmental flow guidelines or rules could be developed and applied to all rivers of that class (Poff et al 2010) thereby avoiding the need to develop such relationships and standards for each indishyvidual river within the class However reference conditions on seashysonal flow fluctuation are only a part of the definition of ecological flows Flow fluctuates in time not only throughout the year but also throughout a month or throughout a day Therefore daily orand hourly flow series are recommended for the complete understanding of natural flow variations and trends This more precise flow information is also needed when rise and fall rates want to be taken into account (especially downstream of hydro-power production dams) Flow magnitude is another important hydrological feature which should be added when defining ecologshyical flows It has been related to basin size in other works but this influence is missed in our study since we use standardised flows Nevertheless the influence of basin size on flow stability is emphashysised in this paper The definition and implementation of the envishyronmental flows in rivers are key to restore andor preserve the biophysical components and ecological processes involved in aquatic ecosystems (Arthington and Pusey 2003) Hence this method results in a useful tool for river restoration and river manshyagement in general Water planning for major water bodies is takshying place in Spain for which this methodology will be useful It is also applicable for use in other countries EU member states for example under the guidelines of the European Water Framework Directive (European Commission 2000) must ensure the improveshyment of ecological status of their water bodies by 2016
Acknowledgements
The study has been possible thanks to the Maria Dolores Bejar-ano FPU Contract (AP2005-2680) for the training of university staff from the Spanish Ministry of Science and Innovation and to the funds from the POTECOL Project (CGL2007-66412) financed by the Spanish Ministry of Science and Innovation We also would like to thank Carlos Alonso and Joaquiacuten Solana for their support with
the statistical analyses and Benedict Gove for his help with lanshyguage corrections
References
Arthington AH Bunn SE Poff NL Naiman RJ 2006 The challenge of providing environmental flow rules to sustain river ecosystems Ecol Appl 16 1311-1318
Arthington AH Pusey BJ 2003 Flow restoration and protection in Australian rivers River Res Appl 19 (5-6) 377-395
Baeza D Marchaacutemalo M 2002 Una nueva metodologiacutea para calcular caudales ecoloacutegicos en la cuenca del Tajo Equipamiento y Servicio Municipales 2002 Ene-Feb Antildeol9(99) Madrid Espantildea pp 65-71
Baeza D Garciacutea de Jaloacuten D Gutieacuterrez B Vizcaiacuteno P 2005 Basin influence on natural variability of rivers in semi-arid environments J River Basin Manage 3 (2) 1-13
Baeza D Garciacutea de Jaloacuten D 2005 Characterisation of streamflow regimes in central Spain based on relevant hydrobiological parameters J Hydrol 310 266-279
Bejarano MD Garciacutea de Jaloacuten D Marchaacutemalo M 2007 Hierarchical characterization and classification of the Ebro river basin Unpublished DEA from PhD Thesis Polytechnic University of Madrid Spain
Bunn SE Arthington AH 2002 Principles and ecological consequences of altered flow regimes for aquatic biodiversity Environ Manage 30 492-507
Confederacioacuten Hidrograacutefica del Ebro 1999 Hydrological Plan for the Ebro river basin BOE 222 September the 16th pp 33386-33452
Estrela T Quintas L 1996 El sistema integrado de modelizacioacuten precipitacioacuten-aportacioacuten SIMPA Revista de Ingenieriacutea Civil CEDEX (Ministerio de Fomento) 104 43-52
European Commission 2000 Directive 200060EC of the European Parliament and of the Council of October the 23rd Establishing a Framework for Community Action in the Field of Water Policy OJEC (Official Journal of the European Communities) p 72
Freeman MC Bowen ZH Bovee KD Irwin ER 2001 Flow and habitat effects on juvenile fish abundance in natural and altered flow regimes Ecol Appl 11 179-190
Garciacutea de Jaloacuten D Gonzaacutelez del Taacutenago M Marchaacutemalo M Alonso C Baeza D 2006 Typology and reference conditions a proposal for the Navarras rivers network In Proceedings of the III International Symposium on Transboundary Waters Management Ciudad Real Spain 30 May-2 June 2006
Gonzaacutelez del Taacutenago M Garciacutea de Jaloacuten D 2004 Hierarchical classification of rivers a proposal for eco-geomorphic characterization of Spanish rivers within European Water Frame Directive In Garciacutea de Jaloacuten D Vizcaino P (Eds) Proceedings of the 5th International Symposium on Ecohydraulics Aquatic Habitats Analysis and Restoration vol 1 pp 205-212
Gustard A 1992 Analysis of river regimes In Calow P Petts G (Eds) The Rivers Handbook vol 1 Blackwell Scientific Publications London UK pp 29-47
Gutieacuterrez Elorza M 1994 Introduccioacuten a la geomorfologiacutea Espantildeola In Geomorfologiacutea de Espantildea Rueda Madrid pp 1-24
Hancock MA Bunn SE 1997 Population dynamics and life history of Paratya australiensis Kemp 1917 (Decapoda Atyidae) in upland rainforest streams South-Eastern Queensland Australia Mar Freshwater Res 48 361-369
Hannah DM 1998 Meltwater Generation and Drainage within a Small Glacierized Basin in the French Pyrenees Unpublished PhD Thesis University of Birmingham
Hannah DM Smith BPG Gurnell AM McGregor GR 2000 An approach to hydrograph classification Hydrol Process 14 317-338
Harris NM Gurnell AM Hannah DM Petts GE 2000 Classification of river regimes a context for hydroecology Hydrol Process 14 2831-2848
Humphries P 2002 River regulation and fish larvae variation through space and time Freshwater Biol 471307-1331
Hynes HBN 1970 The ecology of stream insects Ann Rev Entomol 15 25-42 Kalkstein LS Tan G Skindlov JA 1987 An evaluation of three clustering
procedures for use in synoptic climatological classifications J Climate Appl Meteorol 26 717-730
Lytle DA Poff LN 2004 Adaptation no natural flow regime Trends Ecol Evol 19 (2) 94-100
Mahoney JM Rood SB 1998 Streamflow requirements for Cottonwood seedling recruitment - an interactive model Wetlands 18 634-645
Marchetti MP Moyle PB 2001 Effects of flow regime on fish assemblages in a regulated California stream Ecol Appl 11 530-539
Melcher A Schmutz S Haidvogl G 2007 Spatially based methods to assess the ecological status of European fish assemblage types Fish Manage Ecol 14453-463
Nilsson C Berggren K 2000 Alterations of riparian ecosystems caused by river regulation Bioscience 50 (9) 783-792
Nilsson C Reidy CA Dynesius M Revenga C 2005 Fragmentation and flow regulation of the worlds large river systems Science 308405-408
Olden JD Poff NL 2003 Redundancy and the choice of hydrologic indices for characterizing streamflow regimes River Res Appl 19101-121
Petts GE 1984 Impounded rivers Perspectives for Ecological Management John Wiley amp Sons Chichester UK p 326
Poff NL Allan JD 1995 Functional organization of stream fish assemblages in relation to hydrological variability Ecology 76 (2) 606-627
Poff NL Ward JV 1989 Implications of streamflow variability and predictability for biotic community structure a regional analysis of streamflow patterns Can J Fish Aquat Sci 46 1805-1818
Poff NL Allan JD Bain MB KarrJR Prestegaard KL Richter BD Sparks RE Stromberg JC 1997 The natural flow regime Bioscience 47 (11) 769-784
Poff NL Richter BD Arthington AH Bunn SE Naiman RJ Kendy E Acreman M Apse C Bledsoe BP Freeman MC Henriksen J Jacobson RB Kennen JG Merrit DM OacuteKeeffe JH Olden JD Rogers K Tharme RE Warner A 2010 The ecological limits of hydrologic alteration (ELOHA) a new framework for developing regional environmental flow standards Freshwater Biol 55147-170
Richter BD Baumgartner JV Powell J Braun DP 1996 A method for assessing hydrologic alteration within ecosystems Conserv Biol 101163-1174
Rivas Martiacutenez S Diacuteaz TE Fernaacutendez-Gonzaacutelez F Izco J Loidi J Lousa M Penas A 2002 Vascular plant communities of Spain and Portugal Itinera Geobotaacutenica 15 1-2
Ruiz JM 1998 Desarrollo de un modelo hidroloacutegico conceptual distribuido de simulacioacuten continua integrado con un SIG Tesis doctoral Universidad Politeacutecnica de Valencia
Sanz E 1996 Springs in Spain classification according to their flows and lithologies and their hydraulic contributions Ground Water 34 (6) 1033-1041
Spanish Ministry of Environment 2006 Inventario de Presas Espantildeolas Ministerio de Medio Ambiente Madrid Espantildea
Teacutemez JR 1977 Modelo matemaacutetico de transferencia de precipitacioacuten-aportacioacuten Asimel
Rood SB Mahoney JM 1990 Collapse of riparian poplar forests downstream from dams in western prairies probable causes and prospects for mitigation Environ Manage 14 451-454
Vannote RL Minshall GW Cummis KW Sedell JR Cushing CE 1980 The river continuum concept Can J Fish Aquat Sci 37130-137
Verdin JL Verdin JP 1999 A topological system for delineation and codification of the Earths river basins J Hydrol 2181-12
Ward JV Stanford JA 1979 The Ecology of Regulated Streams Plenum Press New York EEUU p 1979
Wilby RL 1993 The influence of variable weather patterns on river water quantity and quality Int J Climatol 13 447-459
lthttpwwwcedexesgt Centro de Estudios y Experimentacioacuten de Obras Puacuteblicas (Centro de Estudios Hidrograacuteficos) Ministerio de Medio Ambiente y Medio Rural y Marino y Ministerio de Fomento
lthttpwwwchebroesgt Confederacioacuten Hidrograacutefica del Ebro Ministerio de Medio Ambiente y Medio Rural y Marino
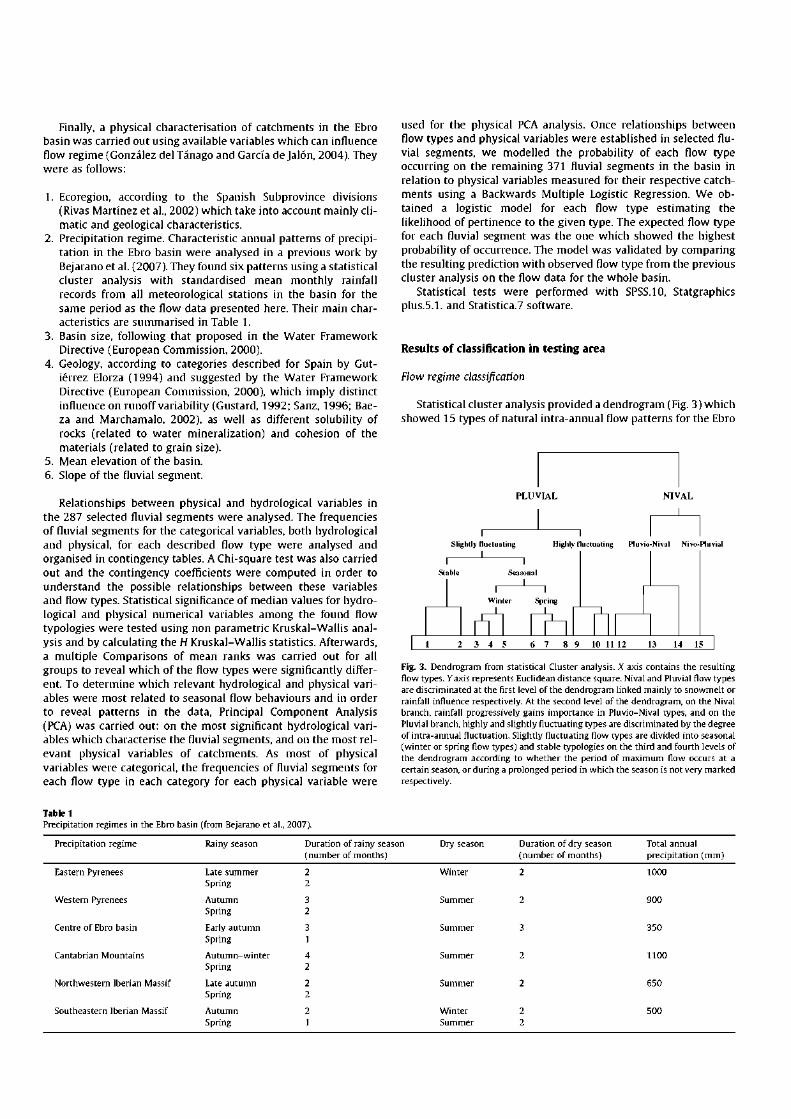
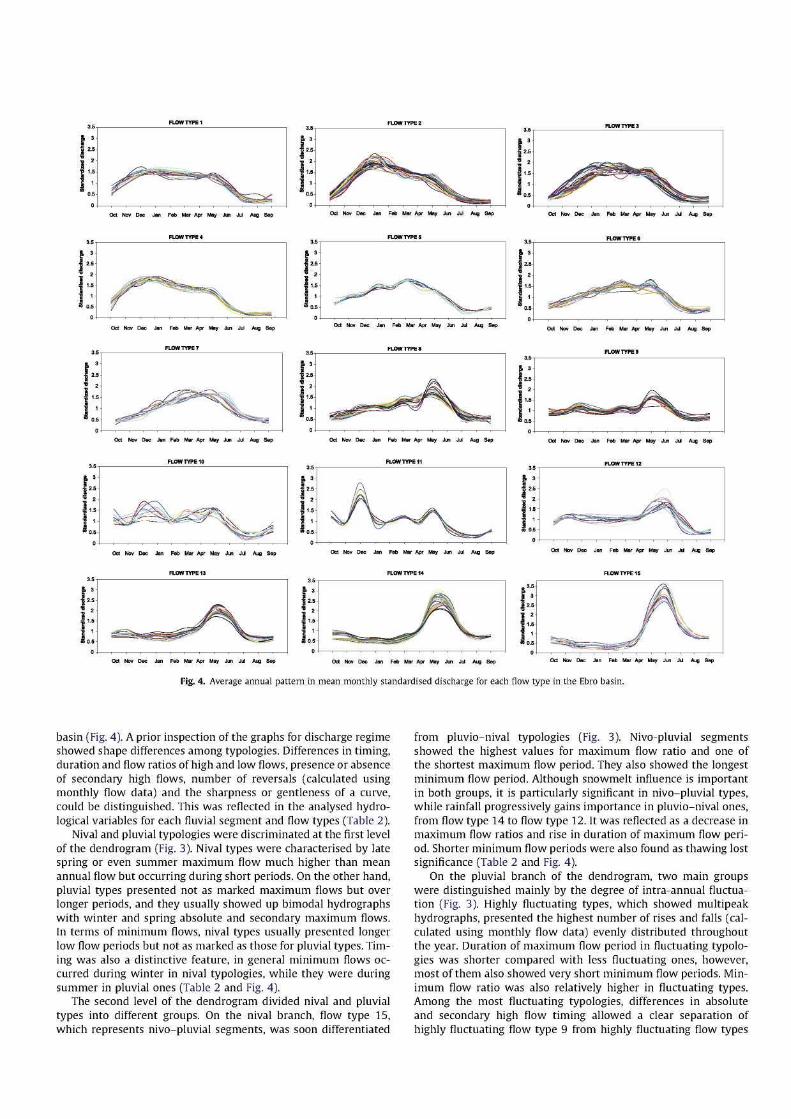