Embed Size (px)
Citation preview
Journal of Geography and Geology; Vol. 8, No. 3; 2016 ISSN 1916-9779 E-ISSN 1916-9787
Published by Canadian Center of Science and Education
1
Patterns and Implications of Hydrologic Regime Change in Chongwe River, Zambia
Moses Ngongo Chisola1 & Michal Kuráž2 1 Department of Geography and Environmental Studies, University of Zambia, Lusaka, Zambia 2 Department of Water Resources and Environmental Modeling, Czech University of Life Sciences Prague, Czech Republic Correspondence: Moses Ngongo Chisola, University of Zambia, Department of Geography and Environmental Studies, P.0 Box 32379, Lusaka. Tel: 2609-7990-4414. E-mail: [email protected]
Received: June 12, 2016 Accepted: June 23, 2016 Online Published: July 28, 2016 doi:10.5539/jgg.v8n3p1 URL: http://dx.doi.org/10.5539/jgg.v8n3p1 Abstract Conflicts regarding water use have emerged in some small irrigation dominated peri-urban catchments in Zambia; Chongwe being one such catchment. Despite these conflicts suggesting a change in hydrologic regime, the nature of the changes and their drivers has not been adequately investigated. The Mann Kendall trend test and Flow Duration Curves were used to investigate changes in hydro-climatic time series data in Chongwe upper catchment for the period 1955-2006. Although the results reviewed a significant upward trend in temperature at 0.05 significance level, there is no significant trend in rainfall. Annual and seasonal runoff at the upstream located Ngwerere weir reviewed significant upward trends at 0.05 significance level. This increased runoff which is attributed to sewer water discharge and increased imperviousness is abstracted for agricultural activities upstream. In this regard, results reviewed no significant trend in runoff at the outlet gauging station (Chongwe 5025). However, analysis of the Flow Duration Curves at this outlet gauging station indicated an increase in wet season flows and a reduction in dry season flows for the 1990-2006 period. These results suggest that human activities in the upstream parts of the catchments could be the major contributing factors to the changes in flow regime, hence the ensuing upstream vs downstream water use conflicts. However, there is still excess runoff in the wet season that could be harvested by downstream water users in order to offset the deficit in downstream dry season flows. Keywords: Chongwe catchment, dry season flow, Ngwerere, hydro-climatic, hydrologic regime 1. Introduction Monitoring trends in hydro-climatic data is often times overlooked. Changes in hydro-climatic variables only become of concern in times of drought or when people’s property is damaged by floods and when upstream vs downstream water use conflicts persist. Understanding the temporal and spatial patterns of river flow is essential to managing water use conflicts in semi-arid areas. Hence, scholars in other parts of the world have directed their research towards understanding the changes in flow regime (e.g. Magillan & Nislow, 2005; Love et al., 2010; Kashaigili & Majaliwa, 2013; Mitof & Pravale, 2014; Santos et al., 2015). This study contributes to these efforts in the Zambian context. In Zambia, conflicts are prominent in many catchments such as Chongwe, Chalimbana, Lunsemfwa, and Kaleya among others, suggesting that the flow regime of these rivers have been altered. These conflicts have arisen mainly due to climate change or variability, increased water resource developments, and indiscriminate cutting of trees in river basins. In the case of Chongwe, there has been rampant deforestation in forest reserves and customary lands in the catchment headwaters due to charcoal burning and agriculture especially in recent years due to poor forest management practices. Thus, Chidumayo (2009) has identified three periods of forest management in Zambia: (i) good forest management practices (before 1980), (ii) deterioration in good forest management practices (1980 to 1989) and (iii) a period of ‘no forest management’ (1990 to date). In addition, the Chongwe District Council (CDC, 2006) have pointed out that increased water demand for irrigation and domestic use, cultivation along the river banks, and sand mining also pose a threat to the flow regime in Chongwe river. It is therefore not surprising that conflicts over water use have persisted in Chongwe catchment especially among the commercial farming community upstream and the villagers downstream since the 1990s (Mucheleng'anga et al., 2002; Chongwe District Council, 2006). So far, a few studies conducted in the upper part of the catchment have focused mainly on social aspects such as the assessment of adaptive capacities among communities in the area (Mucheleng'anga et al., 2002). However,
jgg.ccsenet.org Journal of Geography and Geology Vol. 8, No. 3; 2016
2
changes in the annual and seasonal runoff patterns of Chongwe River and trends in climatic variables are poorly understood. Hence this study asks a question; what is the nature of the changes in hydrologic regime in Chongwe upper catchment? Understanding the nature of hydrologic change could help inform efforts directed at resolving water use conflicts in the area. 2. Method 2.1 Description of the Study Area The Chongwe River mainly lies in Chongwe District of Lusaka Province in Zambia. However, its source is in Chisamba district of Central province, while its Ngwerere tributary originates from Lusaka City. The study focused on the Chongwe upper catchment (above the confluence with Chalimbana tributary) within 14o 45’ 00’’ – 15o 30’ 00 South and 28o 10’ 00’’ – 28o 50’ 00’’ East. The location map of the study area is given in Figure 1. The upper Chongwe catchment covers an area of 2006.6 km2. The major tributaries of Chongwe River in the selected upper catchment are Ngwerere and Kanakantapa. Due to its downstream location, Chongwe 5025 gauging station was taken as the outlet of the selected study area. The main human activities in the catchment include urbanization mainly around the Ngwerere tributary, impoundments, deforestation, irrigated and rain fed agriculture. There are many dams upstream the chosen outlet station of Chongwe 5025, the Ray’s dam being the largest (about 8 km2). These dams are used for irrigated agriculture. 2.2 Research Design In order to better understand and interpret the changes that have occurred to the flow regime in Chongwe, analysis of both climatic and hydrological data was conducted at annual and seasonal time steps. The seasonal time steps used were the DJF – December, January, February season, MAM – March, April, May season, JJA – June, July, August season, SON – September, October, November season. The first two seasons of DJF and MAM fall in the rain season while JJA and SON fall in the dry season. The SON is the driest and hottest season in Zambia as rains begin around the second to the third week of November and end around April the following year. The JJA season is the coldest and comes just after the rainy season. Changes in the seasonal flow patterns were analyzed based on the split data sets for two windows representing different levels of human impact on the flow regime. Since the flow record at the outlet gauging station begins from 1968, the selected windows were; 1968-1976, and the 1990-2006 period. The two windows were derived from literature and complimented by change point detection results of the Standard Normal Homogeneity Test (SNHT). Some selected features of these windows are summarized in Table 1. Table 1. Selected features of the identified windows Window Major features Remark 1968- 1976 Less human impacts on the flow regime. Baseline period
Good forest management. Relatively less human population in the catchment.
1977-1989 Declining Forest Management. Transition period Hydrological extremes of floods and droughts.
1990- 2006 Population more than 4 times higher. Changed period
Increased human pressure on the flow regime through damming, irrigation, sand mining and other land uses.
Poor forest management mainly due to inadequate funding to the forest sector and insufficient staff in the Forest Department.
Hydrological extremes exacerbate in this period. Late onset and early withdrawal of the rainy season. Pronounced water use conflicts in the catchment. Source: Authors based on data from (Chidumayo et al., 2001; Mucheleng'anga et al., 2002; Mulenga, 2003; CSO, 2004; Chongwe District Council, 2006; Kasali, 2008, Chidumayo, 2009; Global Environmental Facility, 2009) complimented by the results of the Standard Normal Homogeneity Test (SNHT) 2.3 Data Collection Climatic data comprising of rainfall and temperature was collected from the Zambia Meteorological Department. This data spanned from 1959–2013 and 1968–2013 for Lusaka city and Kenneth Kaunda (KK) meteorological stations respectively. Discharge data spanning from 1956-2006 and 1968-2006 for Ngwerere and Chongwe 5025 gauging stations respectively was collected from the Department of Water Affairs in Lusaka, Zambia.

jgg.ccsenet.org Journal of Geography and Geology Vol. 8, No. 3; 2016
3
2.4 Analysis of Climatic and Hydrological data 2.4.1 Statistical Analysis Long term trends in annual and seasonal rainfall, temperature and discharge were analyzed using the Mann Kendall trend test. The Mann–Kendall (Mann, 1945; Kendall, 1975) trend test is one of the commonly used non-parametric tests for detecting monotonic trends in climatic and hydrological time series (e.g. Dinpashoh et al., 2011; Gao et al., 2012; Miao et al., 2012; Zhang et al., 2012; Mondall et al., 2012). This test was adopted in this study because most hydrological data are not normally distributed. Hence, non-parametric tests like this one are widely used in hydrological studies due to their fewer assumptions (Li et al., 2007; Zhang et al., 2012). This test is less affected by outliers and does not assume any distribution form for the data yet its power is comparable to its parametric competitors (Zhang et al., 2005). As such, the Mann Kendall method is recommended for use by the World Meteorological Organization (Mitchell et al., 1966). However, the test is designed for serially independent series (Bayazit & Önöz, 2007). In this regard, the presence of autocorrelations or serial correlations in the data series may impede the Mann Kendall tests from identifying true trends. Hence prior to applying the Mann Kendall trend test, the time series data may need to be prewhitened. However, in certain cases, pre-whitening is not necessary as it reduces the power of the Mann Kendall test (Bayazit & Önöz 2007). Several scholars agree that prewhitening is not needed when; the trend exists, and the sample size and magnitude of the slopes of the trend are large. The disagreement seems to be on the definition of what “large” means in this case. For instance, Yue and Wang (2002) explain that serial correlation (autocorrelation) does not significantly affect the test statistics of the Mann Kendall test if the sample size is large (n > 70) and the magnitude of the trend are large (>0.005). Similarly, Bayazit & Önöz (2007) have stated that the prewhitening procedure is not necessary for large samples (n ≥ 50) and high slopes of trend (b ≥ 0.01), because the Mann Kendall test would lose its power if prewhitening is applied in such cases. Although trends exist with large slopes (b ≥ 0.01) for some parameters considered in this study, most of the datasets have samples sizes less than 50. In this regard, autocorrelation was removed using the prewhitening technique of Yue and Wang (2002). The Mann-Kendall test is defined by:
= ∑ ∑ (1) Where n is the number of data elements, are data values in the series with j being greater than i. Sgn is given as:
− = +1 ; >0 ; =−1 ; < (2)
With a large sample (n≥ 8) and the nonexistence of similar consecutive values in the data series, the statistic S follows a normal distribution with a mean of zero: ( ) = 0 (3) And the variance is given by: ( ) = ( )( ) (4)
But in cases where you have ties (same values) in the data (x) values (Wang et al, 2005), the variance becomes; ( ) = ( )( ) ∑ ( )( )( ) (5)
Where m is the number of tied groups and is the number of values in the ith tied group. The significance of the statistic S is tested by:
( ) = ( ) , > 00 , = 0( ) , < 0 (6)
A positive value indicates an increasing trend in the time series data, while negative values indicate a decreasing
jgg.ccsenet.org Journal of Geography and Geology Vol. 8, No. 3; 2016
4
trend. In this regard, the larger the magnitude of the test (S), the stronger the trend. To test the significance of the monotone trend, a significance level of α = 0.05 (two-tailed) was used in this study. The null hypothesis (H0) of no significant trend was accepted when -1.96<Z(t)<1.96, with 1.96 being the critical value. 2.4.2 Runoff Coefficients Annual hydrological year Runoff Coefficients were computed from 1955 to 2006. Zhang et al. (2007) have observed that Runoff coefficients are an important index that reflects the runoff yield. A Runoff coefficient is a dimensionless ratio of the volume of runoff in a given time period to the volume of precipitation over the watershed in the same time period. They can be computed at different time steps such as event, day, monthly or annual provided flow data and the corresponding precipitation data are available. Theoretically, Runoff coefficients range from 0 to 1.0 and are influenced by geology, topography, soils, rainfall intensities and land use; mainly perviousness and vegetation cover (Vandegrift & Stefan, 2010). Runoff Coefficients can thus reflect how the runoff potential has changed following a change in land use. Consequently, they have been used by several researchers (including Rose & Peters, 2001; Zhang et al., 2007; Lenhart et al., 2011) to study the effects of changes in land use on streamflow. In this study, annual runoff coefficients were only computed for the Ngwerere weir due to its upstream location and thus it is less affected by abstractions. Most of the water abstractions occur downstream the Ngwerere weir (Shamboko-Mbale et al., 2012). In this regard, Runoff coefficients could not be computed for the outlet station of Chongwe 5025 because this station is affected by pronounced water withdrawals upstream. 2.4.3 Analysis of Seasonal Flow Patterns Mean monthly flow regimes and Flow Duration Curves (FDCs) were constructed to analyze the changes on the seasonal flow patterns. Flow Duration Curves give a simple but comprehensive graphical view of the overall historical variability of streamflow (Vogel & Fennessey, 1994). The shape of the flow duration curve is determined by the rainfall pattern, catchment size, and physiographic characteristics of the catchment, water resources development and land-use type (Smakhtin, 1999; Zhang et al., 2012). The FDC approach is useful for describing various streamflow regimes and can be used to compare different streamflow time series (Smakhtin, 2001; Zhang et al., 2012). Flow duration curves can be constructed at various times steps for example daily, weekly, or even on monthly streamflow. In this study, FDCs were constructed on daily streamflow for two windows (1968-1976 and 1990-2006). This was done by ranking the daily streamflow data for each period from the largest to the smallest. Then each discharge value was assigned a rank (M), with the largest discharge value getting a rank of 1. Then Exceedance probability (P) was calculated as: = 100 (7)
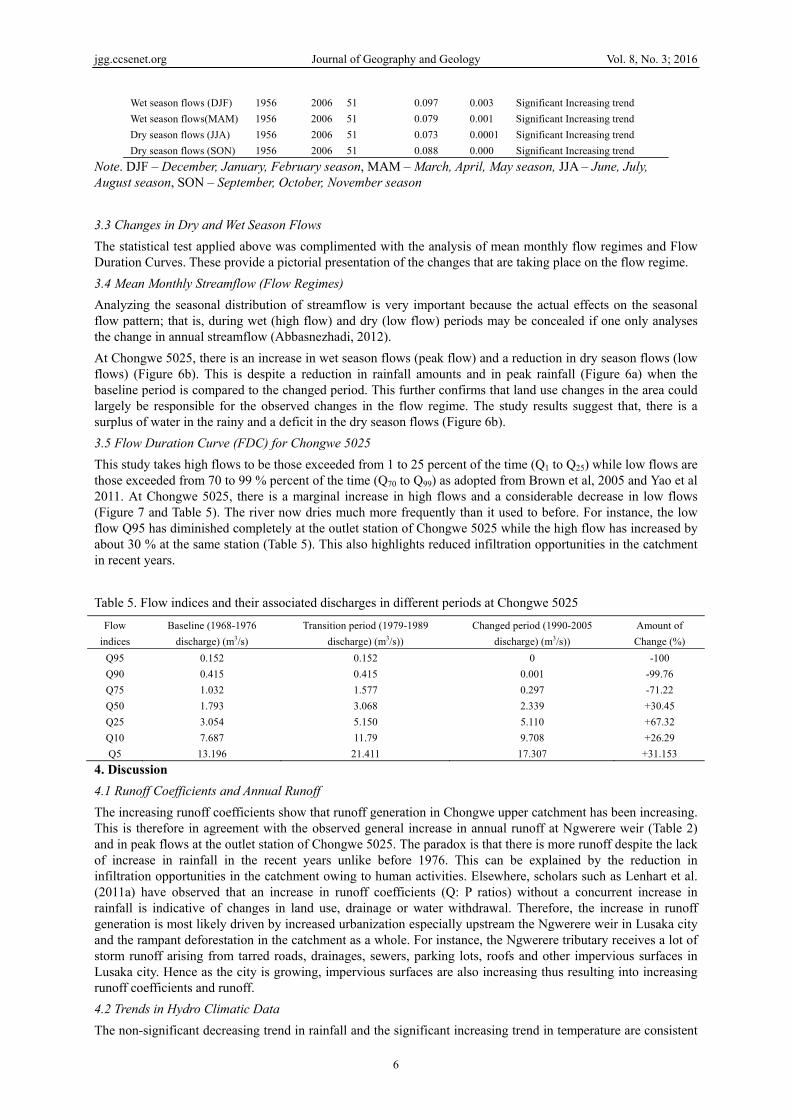
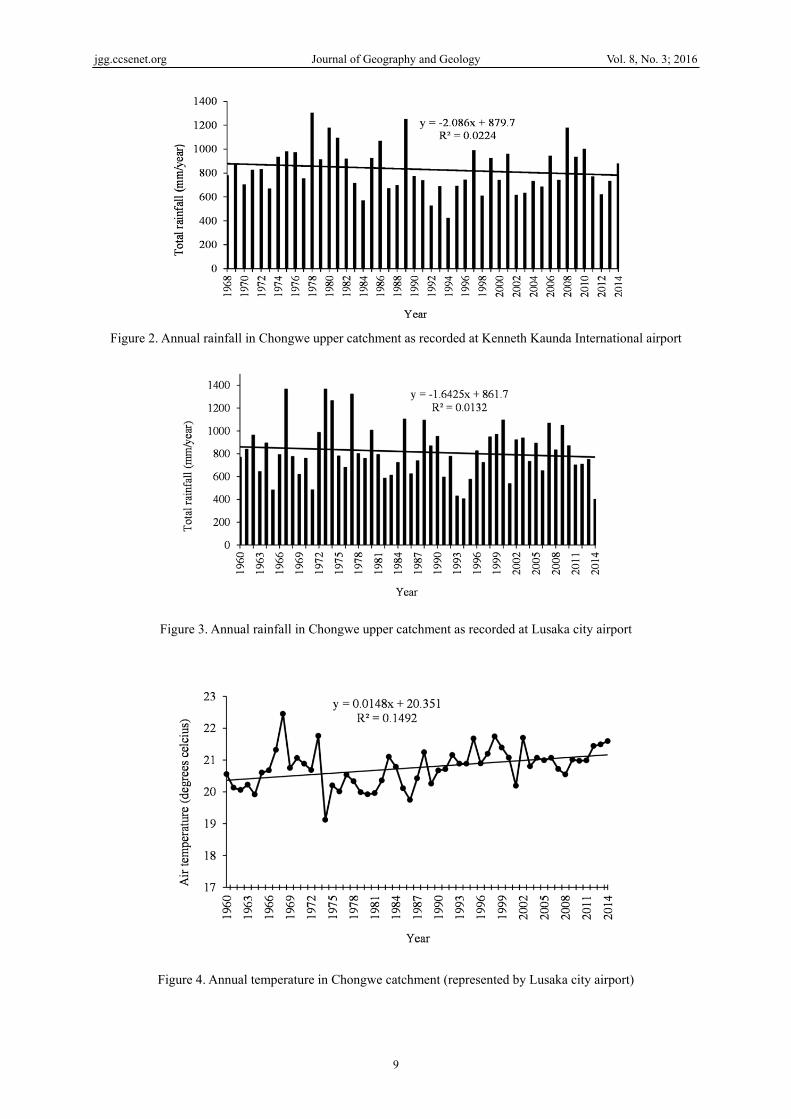
Where P is the probability of given flow being equaled or exceeded. M is the rank of a given daily streamflow value and n is the number of daily streamflow values in the period of record. The FDC graph was then obtained by plotting each flow against the percentage of time it is equaled or exceeded. 3. Results 3.1 Rainfall and Temperature Time Series The long term annual rainfall for stations in Chongwe upper catchment is presented in Figure 2 and Figure 3. Figure 4 presents the long term annual temperature in the catchment. The graphs show that rainfall over Chongwe catchment is decreasing while temperature is increasing. 3.2 Annual Runoff and Runoff Coefficients There is an increasing trend in both annual flows and runoff coefficients at the upstream located Ngwerere weir (Figure 5a and Figure 5b respectively). This could be attributed to sewer water discharge and storm runoff from impervious surfaces in the built-up area of Lusaka city upstream the Ngwerere weir. Due to abstractions downstream the weir, the river flows at the outlet station of Chongwe 5025 do not show any trend at the annual time scale (Figure 5c). In contrast, dry season flows (September to November) for the same station indicate a decreasing trend (Figure 5d). 3.2 Statistical Trends in Rainfall and Runoff The results of the Mann Kendall trend test on annual and seasonal rainfall for stations in the Chongwe upper catchment are given in Table 2. Table 3 presents the results on annual temperature. The results of the trend
jgg.ccsenet.org Journal of Geography and Geology Vol. 8, No. 3; 2016
5
analysis on annual and seasonal flows over Chongwe upper catchment are given in Table 4. The results show that the apparent decreasing trend in rainfall over Chongwe catchment is not significant at 0.05 significance level (Table 2). Examining the seasonal patterns of rainfall also reviews no significant increasing or decreasing trend at 0.05 significance level (Table 2) over Chongwe upper catchment. In contrast to rainfall, the results in Table 3 show that there is a significant increasing trend in temperature over Chongwe upper catchment at 0.05 significance level. Table 2. Statistical trends in annual and seasonal rainfall over Chongwe upper catchment
Parameter Start End No. of Years Sen slope p-value Remarks KK International Airport Annual rainfall 1968 2013 47 -1.415 0.575 Not a significant decreasing trend Wet season Rainfall (DJF) 1968 2013 47 -1.135 0.642 Not a significant decreasing trend Wet season Rainfall (MAM) 1968 2013 47 0.044 0.990 Not a significant increasing trend Dry season Rainfall (JJA) 1968 2013 47 0 0.280 No significant Change Dry season Rainfall (SON) 1968 2013 47 -0.352 0.572 Not a significant decreasing trend Lusaka City Airport Annual rainfall 1959 2013 55 -1.265 0.656 Not a significant decreasing trend Wet season Rainfall (DJF) 1959 2013 55 -0.193 0.948 Not a significant decreasing trend Wet season Rainfall (MAM) 1959 2013 55 -0.327 0.696 Not a significant decreasing trend Dry season Rainfall (JJA) 1959 2013 55 0 0.435 No significant change Dry season Rainfall (SON) 1959 2013 55 -0.515 0.504 Not a significant decreasing trend Note. DJF – December, January, February season, MAM – March, April, May season, JJA – June, July, August season, SON – September, October, November season
Table 3. Statistical trends in temperature for stations in Chongwe catchment
Parameter Start End No. of Years Sen slope p-value Remarks KK International Airport Annual Temperature 1984 2014 31 0.029 0.001 Significant increasing trend Lusaka City Airport Annual temperature 1960 2014 55 0.017 0.026 Significant increasing trend
The results in Table 4 indicate that at the upstream gauging station of Ngwerere weir (5016), there is a significant increasing trend in the annual flows and across all the seasonal flows at 0.05 significance level. This largely reflects the impact of human activities (heavy urbanization in Lusaka city area) upstream the weir. The increased runoff generation at this station is due to urban storm runoff and the continuous discharge of the treated waste water (which is basically imported water since domestic water for Lusaka city comes from Kafue River and groundwater from boreholes across the city). There is however, a lot of water abstraction taking place downstream the gauging station (Ngwerere weir). Arising from the foregoing, it not surprising that the results do not show a significant increasing or decreasing trend in annual flows at Chongwe 5025 (outlet station of Chongwe upper catchment) at 0.05 significance level (Table 4). Analysis of the seasonal flows also indicate that although there is a reduction in dry season runoff especially for September, October, November (SON season) at the downstream station (Chongwe 5025) (as shown in Figure 5d), this decrease is not significant at 0.05 significance level (Table 4). Table 4. Statistical trends in annual and seasonal flows in Chongwe catchment
Parameter Start End No. of Years Sen slope p-value Remarks Chongwe 5025 Annual river flows 1968 2006 38 0.145 0.868 Not a significant increasing trend Wet season flows (DJF) 1968 2006 38 -0.008 0.987 Not a significant decreasing trendWet season flows (MAM) 1968 2006 38 0.041 0.596 Not a significant increasing trend Dry season flows (JJA) 1968 2006 38 -0.021 0.603 Not a significant decreasing trendDry season flows (SON) 1968 2006 38 -0.028 0.099 Not a Significant decreasing trendNgwerere weir (5016) Annual river flows 1956 2006 51 0.089 0.000 Significant Increasing trend
jgg.ccsenet.org Journal of Geography and Geology Vol. 8, No. 3; 2016
6
Wet season flows (DJF) 1956 2006 51 0.097 0.003 Significant Increasing trend Wet season flows(MAM) 1956 2006 51 0.079 0.001 Significant Increasing trend Dry season flows (JJA) 1956 2006 51 0.073 0.0001 Significant Increasing trend Dry season flows (SON) 1956 2006 51 0.088 0.000 Significant Increasing trend
Note. DJF – December, January, February season, MAM – March, April, May season, JJA – June, July, August season, SON – September, October, November season 3.3 Changes in Dry and Wet Season Flows The statistical test applied above was complimented with the analysis of mean monthly flow regimes and Flow Duration Curves. These provide a pictorial presentation of the changes that are taking place on the flow regime. 3.4 Mean Monthly Streamflow (Flow Regimes) Analyzing the seasonal distribution of streamflow is very important because the actual effects on the seasonal flow pattern; that is, during wet (high flow) and dry (low flow) periods may be concealed if one only analyses the change in annual streamflow (Abbasnezhadi, 2012). At Chongwe 5025, there is an increase in wet season flows (peak flow) and a reduction in dry season flows (low flows) (Figure 6b). This is despite a reduction in rainfall amounts and in peak rainfall (Figure 6a) when the baseline period is compared to the changed period. This further confirms that land use changes in the area could largely be responsible for the observed changes in the flow regime. The study results suggest that, there is a surplus of water in the rainy and a deficit in the dry season flows (Figure 6b). 3.5 Flow Duration Curve (FDC) for Chongwe 5025 This study takes high flows to be those exceeded from 1 to 25 percent of the time (Q1 to Q25) while low flows are those exceeded from 70 to 99 % percent of the time (Q70 to Q99) as adopted from Brown et al, 2005 and Yao et al 2011. At Chongwe 5025, there is a marginal increase in high flows and a considerable decrease in low flows (Figure 7 and Table 5). The river now dries much more frequently than it used to before. For instance, the low flow Q95 has diminished completely at the outlet station of Chongwe 5025 while the high flow has increased by about 30 % at the same station (Table 5). This also highlights reduced infiltration opportunities in the catchment in recent years. Table 5. Flow indices and their associated discharges in different periods at Chongwe 5025
Flow indices
Baseline (1968-1976 discharge) (m3/s)
Transition period (1979-1989 discharge) (m3/s))
Changed period (1990-2005 discharge) (m3/s))
Amount of Change (%)
Q95 0.152 0.152 0 -100 Q90 0.415 0.415 0.001 -99.76 Q75 1.032 1.577 0.297 -71.22 Q50 1.793 3.068 2.339 +30.45 Q25 3.054 5.150 5.110 +67.32 Q10 7.687 11.79 9.708 +26.29 Q5 13.196 21.411 17.307 +31.153
4. Discussion 4.1 Runoff Coefficients and Annual Runoff The increasing runoff coefficients show that runoff generation in Chongwe upper catchment has been increasing. This is therefore in agreement with the observed general increase in annual runoff at Ngwerere weir (Table 2) and in peak flows at the outlet station of Chongwe 5025. The paradox is that there is more runoff despite the lack of increase in rainfall in the recent years unlike before 1976. This can be explained by the reduction in infiltration opportunities in the catchment owing to human activities. Elsewhere, scholars such as Lenhart et al. (2011a) have observed that an increase in runoff coefficients (Q: P ratios) without a concurrent increase in rainfall is indicative of changes in land use, drainage or water withdrawal. Therefore, the increase in runoff generation is most likely driven by increased urbanization especially upstream the Ngwerere weir in Lusaka city and the rampant deforestation in the catchment as a whole. For instance, the Ngwerere tributary receives a lot of storm runoff arising from tarred roads, drainages, sewers, parking lots, roofs and other impervious surfaces in Lusaka city. Hence as the city is growing, impervious surfaces are also increasing thus resulting into increasing runoff coefficients and runoff. 4.2 Trends in Hydro Climatic Data The non-significant decreasing trend in rainfall and the significant increasing trend in temperature are consistent

jgg.ccsenet.org Journal of Geography and Geology Vol. 8, No. 3; 2016
7
with results obtained by other scholars (Mubanga & Umar, 2014) from other metrological stations in Zambia. These trends in climatic data are already having negative implications on water availability across the country especially in the dry season. In the rainy season, a lot of runoff is generated owing to storm runoff arising from urbanized as well as from deforested landscapes. Hence, the significant trends in both annual and seasonal runoff observed especially at Ngwerere weir. The results do not show a significant increasing or decreasing trend in annual flows at Chongwe 5025 (outlet station of Chongwe upper catchment) at 0.05 significance level (Table 4) partly due to water abstractions upstream the station. 4.3 Changes in Wet and Dry Season Flows (Peak Vs Low Flows) The study has reviewed an increase in flows across all seasons at the Ngwerere weir. This increase in streamflow can be explained by the discharge of sewer water in to the Ngwerere River (Shamboko-Mbale et al., 2012) in addition to storm runoff contribution from the urban area in the rainy season. The nutrient rich water is abstracted for irrigation downstream the weir and thus does not reach the outlet station (Chongwe 5025) especially in the dry season. For instance, the total surface water abstraction in the upper catchment (upstream Chongwe 5025 station, but downstream Ngwerere weir) in the GReSP project was estimated at 22.684 Mm3/year for irrigation only, while groundwater abstraction was over 30.9 Mm3/year (Shamboko-Mbale et al., 2012). This explains why both annual and seasonal flows show significant increasing trends upstream at Ngwerere weir, but there is no significant trend for the same flows downstream at Chongwe 5025. In fact, the flow duration curves show that the river on its downstream part is now drying more frequently in recent years. Apart from water abstractions activities upstream Chongwe 5025 station, increased evaporative water losses from dams could also be contributing to the deteriorating dry season flows given the significant increasing trends observed for temperature. Capacity loss due to sedimentation (Sichingabula, 1997) could also be negatively affecting the hydrological regime in the area. Therefore, the results reflect the impact of land use activities in Chongwe upper catchment, although climatic impacts cannot be ignored. The decrease in dry season flows and the lack of a clear increasing or decreasing trend in annual runoff and in rainfall observed at the outlet station of Chongwe 5025 is consistent with other catchments in the region. For example, Kashaigili, 2008; Kashaigili & Majaliwa, 2013 in Tanzania, Zambia’s neighbors reported similar results. In case of Chongwe 5025, many dams now exist upstream the station, most of which have been built in the recent period. Where they are properly designed, dams can reduce peak flows, but increase dry season flows through environmental flow releases. The increase in dry season flows due to flow releases from dams is unlikely in Chongwe especially that Mucheleng'anga et al. (2002) laments about the poor design of dams in the area; which does not permit any flow releases in the dry season. There is also a genuine argument by some stakeholders that environment flows from dams should not be released in the dry season because the river is now becoming seasonal owing to climatic factors. However, it is also true that uncontrolled land use activities in the catchment have altered the river’s ability to retain water even under favorable climatic conditions. Deforestation is among the activities that have altered the catchment’s ability to retain water. It is worth noting that the impacts of deforestation on dry season flow vary from region to region. Elsewhere, scholars such as Molina et al. (2012) observed an increase in dry season flows after deforestation, while at Chongwe 5025 in this study, these flows have decreased significantly in the period with high deforestation. Molina et al. (2012) attributed the increase in dry season flows to the increase in base flow after deforestation. They pointed out that base flow increase was due to reduced evapotranspiration losses following the removal of native forest, and their (native forest) subsequent replacement by grass and crops. Therefore the findings of this study are not in agreement with those of Molina et al. (2012). This is an example regarding the conflicting evidence on the impact of forest cover change on dry season flows. Bruijnzeel (1990) has clarified the conflicting evidence when he explains that it all depends on the net effect of changes in infiltration opportunities (including water storage capacity of the soil) and evapotranspiration of the respective land use types. In this regard, Bruijnzeel (1990) explains that if infiltration opportunities after deforestation fall to the point that the increase in volumes of storm flow surpass the increase in base flow associated with reduced evapotranspiration, then dry season flow will decrease and vice versa. 4.4 Implications for Management The results suggest that human activities in the upstream parts of the catchments could be the major driving factors for the water use conflicts in the catchment, through changes in the hydrologic regime. The study concludes that although annual runoff has increased in Chongwe upper catchment, not all aspects of the flow regime have increased. The surplus runoff is mainly in the wet season flows. There is a reduction in the dry season river flows. In spite of the decrease in dry season flows not being statistically significant, it has

jgg.ccsenet.org Journal of Geography and Geology Vol. 8, No. 3; 2016
8
negative consequences on the downstream water users. This is already reflected by the ongoing conflicts among the upstream and downstream water users in the catchment. The results suggest that there is a reasonable justification to harvest excess runoff in the wet season through dams and other means. Despite the current abstraction upstream the catchment, the study has shown that more runoff is generated from the catchment in the wet season and flows out of the catchment. Therefore downstream water users could harvest this excess runoff in the wet season to offset the deficit during the dry season (in downstream dry season flows). Further, the communities need to be sensitized on the importance of forming water user associations as provided for by the Water Resources Management Act of 2011 as amended. Going forward, there is need for stakeholders to consider a river and catchment restoration programme and integrated management of the catchment is encouraged. In order to generate consensus with regard to the implementation of environmental flow releases, stakeholder engagement and a follow up study on the water balance of existing dams is required.
Figure 1. Location of Chongwe upper catchment in Zambia
jgg.ccsenet.org Journal of Geography and Geology Vol. 8, No. 3; 2016
9
Figure 2. Annual rainfall in Chongwe upper catchment as recorded at Kenneth Kaunda International airport
Figure 3. Annual rainfall in Chongwe upper catchment as recorded at Lusaka city airport
Figure 4. Annual temperature in Chongwe catchment (represented by Lusaka city airport)

jgg.ccsenet.org Journal of Geography and Geology Vol. 8, No. 3; 2016
10
Figure 5. (a) Annual Runoff at Ngwerere weir, (b) Dimensionless annual Runoff coefficients at Ngwerere weir, (c) Annual Runoff at Chongwe 5025 station and (d) Dry season (September to November) runoff at Chongwe
5025 station in Chongwe upper catchment
Figure 6. (a) Mean Monthly rainfall and (b) mean monthly runoff in different windows at Chongwe 5025

jgg.ccsenet.org Journal of Geography and Geology Vol. 8, No. 3; 2016
11
Figure 7. Changes in FDCs in the three windows at Chongwe 5025
Acknowledgments Part of this work is from my MSc study that was funded by the government of Czech Republic and the Government Republic of Zambia. References Bayazit, M., & Önöz, B. (2007). To prewhiten or not to prewhiten in trend analysis? Hydrological Sciences
Journal, 52(4), 611-624. http://dx.doi.org/10.1623/hysj.52.4.611 Brown, A. E., Zhang, L., McMahon, T. A., Western, A. W., & Vertessy, R. A. (2005). A review of paired
catchment studies for determining changes in water yield resulting from alterations in vegetation. Journal of Hydrology, 310(2005), 28–61. http://dx.doi.org/10.1016/j.jhydrol.2004.12.010
Bruijnzeel, L. A. (1990). Hydrology of moist tropical forests and effects of conversion: a state of knowledge review. UNESCO. International Hydrological Programme. Paris/Vrije Universiteit, Amsterdam, 224.
Central Statistics Office-CSO. (2004). 2000 Census of Population and Housing. Lusaka Province Analytical Report, 5. CSO, Lusaka, Zambia.
Chidumayo, E. N. (2009). Determining the non-renewable portion of biomass utilized in charcoal production for Lusaka. CDM Document. UNFCCC. Copenhagen, Denmark.
Chidumayo, E. N., Masaileti I., Ntalasha H., & Kalumiana O. S. (2001). Charcoal potential in southern Africa (CHAPOSA) – report for Zambia. Stockholm Environment Institute, Stockholm.
Chongwe District Council–CDC. (2006). Report on base line data for water consumption and and utilization, Prepared for d-washe. Report accessed from: http://s3.amazonaws.com/zanran_storage/www.iclei.org/
Cloud, K. C. (2007). Changes and trends in stream flow during floods and droughts in urbanizing Christina River Basin (unpublished), Master’s thesis published by Water Resources Agency, Institute for Public Administration, College of Human services, Education & Public Policy; U. of Delaware. Retreived from http://www.wr.udel.edu
Gao, P., Mu, X. M., Wang, F., & Li, L. (2011). Changes in streamflow and sediment discharge and the response to human activities in the middle reaches of the Yellow River. Hydrol. Earth Syst. Sci., 15, 1–10. http://dx.doi.org/10.5194/hess-15-1-2011
Global Environmental Facility. (2009). Adaptation to the effects of Drought and Climate change in Agro-Ecological Zones 1 and 2 in Zambia, Global Environmental Facility. Washington DC 20433, USA.
Kasali, G. (2008). Climate change and health in Zambia. Lusaka, Zambia: CLACC Working Paper 2. The RING alliance of policy research organizations.
Kashaigili, J. J. (2008). Impacts of land-use and land-cover changes on flow regimes of the Usangu wetland and the Great Ruaha River, Tanzania. Journal of Physics and Chemistry of the Earth, 33, 640-647. http://dx.doi.org/10.1016/j.pce.2008.06.014

jgg.ccsenet.org Journal of Geography and Geology Vol. 8, No. 3; 2016
12
Kashaigili, J. J., & Majaliwa, A. M. (2013). Implications of Land Use and Land Cover Changes on Hydrological Regimes of the Malagarasi River, Tanzania. Journal of Agricultural Science and Applications, 45-50. http://dx.doi.org/10.14511/jasa.2013.020107
Lenhart, C., Peterson, H., & Nieber, J. (2011) Increased Streamflow in Agricultural Watersheds of the Midwest: Implications for Management. Watershed Science Bulletin, 2(1), 25-31, CWP, Ellicott City, MD.
Love, D., Uhlenbrook, S., Twomlow, S., & Zaag, P. V. (2010). Changing Hydroclimatic and discharge patterns in the northern Limpopo basin, Zimbabwe. Water SA., 36.
Magilligana, F. J., & Nislowb, T. K. H. (2005). Changes in hydrologic regime by dams. Geomorphology, 71, 61–78. http://dx.doi.org/10.1016/j.geomorph.2004.08.017
Miao, L., Jun, X., & Dejuan, M. (2012). Long-term Trend Analysis of Seasonal Precipitation for Beijing, China. J. Resour. Ecol., 3(1), 064-072. http://dx.doi.org/10.5814/j.issn.1674-764x.2012.01.010
Mitchell, J. M., Dzerdzeevskii, B., Flohn, H., Hofmeyr, W. L., Lamb, H. H., Rao, K. N., & Walle´n, C. C. (1966). Climate change. WMO Technical Note No. 79. World Meteorological Organization, 79.
Mitof, I., & Pravalie, R. (2014). Temporal trends of Hydroclimatic variability in the lower buzau catchment. Geographia Technica, 9(1), 87-100.
Molina, A., Vanacker, V., Balthazar, V., Mora, D., & Govers, G. (2012). Complex land cover change, water and sediment yield in a degraded Andean environment. Journal of Hydrology, 472–473, 25–35. http://dx.doi.org/10.1016/j.jhydrol.2012.09.012
Mubanga, K. H., & Umar, B. B. (2014). Climate Variability and Change in Southern Zambia: 1910 to 2009. 2014 International Conference on Intelligent Agriculture IPCBEE, 63, IACSIT Press, Singapore. http://dx.doi.org/10.7763/ipcbee
Mucheleng'anga, C. G., Turton, A. R., Mbawo, E., Ng’oma, M., Mukubesa, L. L., & Musonda, W. C. (2002). Water Demand Management, Natural Resource Reconstruction and Social Adaptive Capacity: A Case Study From Chongwe-Chalimbana Area of Zambia, Water Research Commission (WRC), Paper presented at the Biennial Conference of the Water Institute of Southern Africa (WISA), 19–23 May 2002, Durban, South Africa, ISBN Number: 1-86845-844-X.
Mulenga, C. L. (2003). Urban Slums Reports: The case of Lusaka, Zambia. Retrived from http://www.ucl.ac.uk/dpu-projects/Global_Report/pdfs/Lusaka.pdf. Accessed on 14/03/2014
Rose, S., & Peters, N. E. (2001). Effects of urbanization on streamflow in the Atlanta area (Georgia, USA): a comparative hydrological approach. Hydrol. Process, 15, 1441–1457. http://dx.doi.org/10.1002/hyp.218
Santos, C. A. G., Silva, R. M., Moreira, M., Real, J. C., & Mangueira, L. R. (2015), Detecting hydro-climatic change using spatiotemporal analysis of rainfall time series in the Cobres River basin, Portugal. Hydrological Siences and Water Security: Past, Present and Future (Proceedings of the 11th Kovacs Colloqium, Paris, France, June, 2014). IAHS Pibl., 366. http://dx.doi.org/10.5194/piahs-366-125-2015
Shamboko-Mbale, B., Siwale, C., Bäumle, R., & Krekeler, T. (2012). Development of a Groundwater Information & Management Program for the Lusaka Groundwater Systems, Report No. 7 Water Balance Estimates for Sub-catchments of the Chongwe and Mwembeshi Rivers in the Lusaka region, Lusaka.
Sichingabula, M. H. (1997). Problems of sedimentation in small dams in Zambia. Human Impact on Erosion and Sedimentation (Proceedings of the Rabat Symposium, April 1997). IAHS Publ., 245, 251-259
Smakhtin, V. Y. (1999). Generation of natural daily flow time-series in regulatedrivers using a non-linear spatial interpolation technique. Regul. Rivers: Res. Mgmt., 15, 311–323. http://dx.doi.org/10.1002/(SICI)1099-1646(199907/08)15:4<311::AID-RRR544>3.3.CO;2-N
Smakhtin, V. Y. (2001). Low flow hydrology: a review. J. Hydrol., 240,147–186. http://dx.doi.org/10.1016/S0022-1694(00)00340-1
Uhlendahl, T., Salianb P., Casarottoc, C., & Doetschd, J. (2011). Good water governance and IWRM in Zambia: challenges and chances, Water Policy, 13, 845–862. IWA publishing, 2011. http://dx.doi.org/10.2166/wp.2011.155
Vandegrift, T. R., & Stefan, H. G. (2010). Annual Stream Runoff and Climate in Minnesota’s River Basins. University of Minnesota, St. Anthony falls laboratory Engineering, Environmental and Geophysical Fluid Dynamics. Project Report, 543.
Vogel, R. M., & Fennessey, N. M. (1994). Flow duration curves I: A new interpretation and confidence intervals, ASCE. J. Water Resour. Plann. Management, 120(4), 485–504. http://dx.doi.org/10.1061/(ASCE)0733-9496(1994)120:4(485)

jgg.ccsenet.org Journal of Geography and Geology Vol. 8, No. 3; 2016
13
Wang, W., Van Gelder, P. H. A. J. M. & Vrijling, J. K. (2005). Trend and stationarity analysis for streamflow processes of rivers in Western Europe in the 20th century. IWA International Conference on Water Economics, Statistics, and Finance Rethymno, Greece, 8-10.
Yao, Y., Cai, T., Wei, X., Zhang, M. & Ju, C. (2011). Effect of forest recovery on summer streamflow in small forested watersheds, Northeastern China. Hydrological Processes, 26(8), 1208-1214.
Yue, S., & Wang, C. Y. (2002). Applicability of prewhitening to eliminate the influence of serial correlation on the Mann–Kendall test. Water Resour. Res., 38(6), 1068. http://dx.doi.org/10.1029/2001WR000861
Zhang, L., Zhao, F. F., & Brown, A. E. (2012). Predicting effects of plantation expansion on streamflow regime for catchments in Australia. Hydrol. Earth Syst. Sci., 16, 2109–2121. http://dx.doi.org/10.5194/hess-16-2109-2012
Zhang, Q., Liu, C. L., Xu, C. Y., & Jiang, T. (2005). Observed trends of annual maximum water level and streamflow during past 130 years in the Yangtze River basin, China. Journal of Hydrology, 324, 255–265. http://dx.doi.org/10.1016/j.jhydrol.2005.09.023
Zhang, X., Yu, X., Wu, S., Zhang, M., & Li, J. (2007). Response of land use/coverage change to hydrological dynamics at watershed scale in the Loess Plateau of China. Acta Ecologica Sinica, 27(2), 414−423. http://dx.doi.org/10.1016/s1872-2032(07)60013-4
Copyrights Copyright for this article is retained by the author(s), with first publication rights granted to the journal. This is an open-access article distributed under the terms and conditions of the Creative Commons Attribution license (http://creativecommons.org/licenses/by/4.0/).