Embed Size (px)
Citation preview

Flowchart and Data Flow Diagrams
Supplemental A

Purpose and Description Flowchart are used to describe an entire
information system or some portion of it. System flowcharts are used to illustrate the entire information system
The different types of flowcharts are as followsSystems flowcharts chow the entire system
configuration, including the documents data flows, and processes of a system.
Document/procedure flowcharts show the creation, flow and destination of documents within a system and the procedures performed on them.
Hardware flowcharts show the hardware configuration of a system.
Program flowcharts show the logic and processing steps of a computer program.

The Basic Elements of Systems/Document FlowchartsDocument flowcharts consists of three
simple graphical elements that can be combined to represent various types of information flows and processes:SymbolsFlow linesAreas of responsibility
Flowcharting symbols and methods can vary widely across professions and organizations. There is no one set of generally accepted flowcharting principles and symbols.

subsidiary ledger
Prepare
Sales invoice
3
2
Source 1Documents
N
Employee Involved In the Transaction
Record transaction journal
entry
Record 3Document
Investors/creditors
Transaction journal
General Ledger
Post Journal entries
to ledgers
Financial statement
s
Trial balance
Accounting Department
N = Numeric
N
Adjust and
CloseLedger
Prepare Financia
l Stateme
nt
Customer
Customer
EXHIBIT A-1 Document Flow in a Manual Accounting System

Flowcharting element 1 : symbols A variety of symbols are used to represesnt the physical aspects of the document/data flows and processes of an information system.
Input and output: documents The documents symbol is used for all types of paper source documents that are processes by the system.

3
2
Start
Prepare
Sales invoice
Check Customer
Credit
3
2
Sales 1invoice
Customer N
Sales Clerk
From Customer
Payment
Endorse check and prepare
remittance advice
Remittance advice
N
2
Customer
1
Payment Payment
Record transaction and update ledger
2
N
Transaction journal
Accounts receivable
ledger
N
Cash Receipts Clerk
Account Receivable Clerk
N = Numeric
EXHIBIT A-2 Sales/Collection Document Flowchart

43
Invoice Invoice
2
Shipping 1receipt
Sales Invoice
4
Invoice
Sales 3 Invoice 2
(A)Single
Document
(B)Non processed
Documents
(C)Overlapping symbols
Same documents
(D)Two overlapping
Symbols, same documents
(E)Two overlapping Symbols,
Different documents
EXHIBIT A-3 Flowchart Symbols: Documents

(A)Online Manual
Device
(B)Terminal Display
(C)I/O
(Input/Output)
(D)Manual process
(E)Online
Computer process
A
N
Permanent File
Temporary file
(F)Offline or
Non computer process
(G)Offline Paper File
(H)Online data
storage
(I)Disk
storage
(J)Magnetic
tape storage
EXHIBIT A-4 Flowchart Symbols
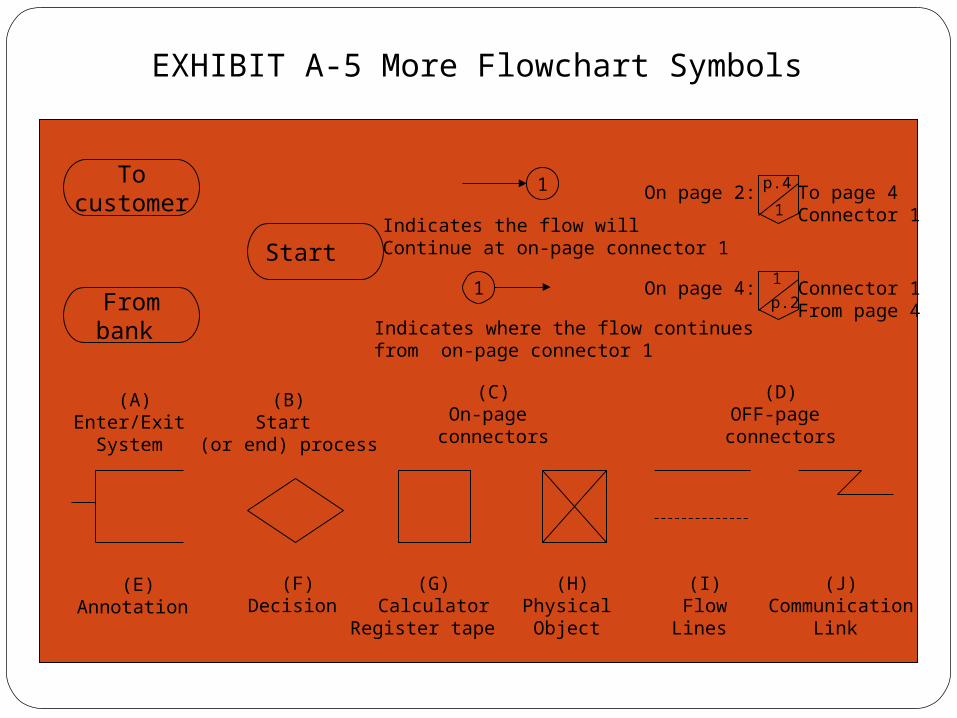
EXHIBIT A-5 More Flowchart Symbols
Frombank
Tocustomer
Start
1
Indicates the flow will Continue at on-page connector 1
1
Indicates where the flow continues from on-page connector 1
(C)On-page
connectors
(A)Enter/Exit
System
(B)Start
(or end) process
(E)Annotation
(F)Decision
(G)Calculator
Register tape
(H)Physical Object
(I)FlowLines
(J)Communication
Link
p.4
1On page 2: To page 4
Connector 1
On page 4: 1
p.2Connector 1From page 4
(D)OFF-page connectors

Summary The flowchart is one of the easier types of
documentation for information customers and management to understand. Often auditors use system, document and procedure flowcharts to understand business and system controls in an environment.
The primary weakness of the flowchart is that it is tied to physical information flows and system characteristic that hide the procedural essence of the system.
Data flow diagrams are a useful tool for documenting the conceptual aspects of an information system.

DATA FLOW DIAGRAMS (DFD)A second documentation tool is the data flow
diagram (DFD). Data Flow Diagramming symbols are used for a variety of system analysis purposes, including graphically displaying the logical flows of data through a process. Unlike flowcharts, which represent the physical components of an information system, data flow diagrams can provide a more conceptual, nonphysical display to the movement of a data through a system. Data flow diagrams disregard such things as organizational units, the computer on which the data are processed, and the media on which the data are stored.

Data Flow Diagram Symbols Data Flow diagrams include four symbols :
process, data inflow sources and outflow sinks (destinations), data stores and data flow lines. Like flowcharting, there are variations on some of the symbols.

(A)Proces
s
(B)Sources/
Sinks
(C)Data Store
(D)Data Flow
LinesDeMarco and Yourdan
symbols
(A)Process
(B)Sources/
Sinks
(C)Data Store
(D)Data Flow
LinesGane and Sarson symbols
EXHIBIT A-6 Data Flow Diagram Symbol

Rule Number
4
5
7
8
9
13
11
14
15
16
Incorrect Correct
A
C
BA
AA
A
A
AA
A
B
B
A
EXHIBIT A-7 Data Flow Diagramming Rules
J. Hoffner, J. George, and J. Valacich, Modern System Analysis and Design (Reading, MA: Benjamin/Cummings, 1996), p. 31

Customers 0
Sales/Collection System
Decision Makers
Order
Bill
Payments
Desired Information
EXHIBIT A-8 Context Diagram Example
Levels of Data Flow Diagrams
The highest level of data flow diagrams is the context diagram

Customers
2.0Process
shipments to
customers
Decision Makers
Order
Bill
Payments
Desired Information
1.0Process
customers orders
3.0Process
Payments from
customers
Desire
d
Info
rmat
ion Payments
Due data
Desired
Information
EXHIBIT A-9Level Zero DFD Example
Subsequent level DVDs The process identified in the context diagram is divided into the more detailed processes performed within the system

EXHIBIT A-10Level –One DFD Example
1.1Approve and
record customer order data
1.2Generate
information about orders
Customer order data
Order
Shipping Request data
Approved order
Order data
Desired Information

1.1.4 Record
order data
1.1.2Check
customer status
Customer data
Order
Approved order
order
Inventory availability
1.1.1 Receive
order data from
customer
1.1.3 Check
inventory availability
Customer credit status
Inventory data Customer
order data
Approved order
EXHIBIT A-11Level –Two DFD Example

EXHIBIT A-12Comparative Example-Version 1
N
2
Example Data Flow Diagram
Review time cards
Time 1 Cards
Example Flowchart
A = Alphabetic
A
N
2
Time 1 Cards
Record
Wages
EmployeeEarning Records
Factory Supervisor
Review Time Cards
Review Time Cards
Employee earnings records
Time card file (alpha)
Factory supervisor
Accounting payroll clerk
Time cards
Reviewed Time cards

EXHIBIT A-12 Comparative Example-Version 2
N
2
Example Data Flow Diagram
Review
time cards
Time 1 Cards
Example Flowchart
A = Alphabetic
N
2
Time 1 Cards
Factory Supervisor
Review Time Cards
Review Time Cards
Employee earnings records
Time card file (alpha)
Factory supervisor
Accounting payroll clerk
Time cards
Reviewed Time cards
Key in time cards
Record wages
A
Earning master file

EXHIBIT A-14 Comparative Example-Version 3
N
2
Example Data Flow Diagram
Review time cards
Time 1 Cards
Example Flowchart
A = Alphabetic
N
2
Time 1 Cards
Factory Supervisor
Review Time Cards
Review Time Cards
Employee earnings records
Time card file (alpha)
Factory supervisor
Accounting payroll clerk
Time cards
Reviewed Time cards
Key in time cards
Record wages
A EmployeeEarning
master file