Embed Size (px)
Citation preview

CHLOROPHYLLS, CHLOROPHYLLIDES, PHEOPHYTINS, AND PHEOPHORBIDES
Fluorometric Estimation of Chlorophylls, Chlorophyllides,
Pheophytins, and Pheophorbides in Mixtures
Raymond C . White, Ivan D. Jones,* Eleanor Gibbs, a n d Lillian S. Butler
Procedures have been described for the estimation of any one or more of the eight component groups of pigments comprised of chlorophylls a and b, chlorophyllides a and b, pheophytins a and b, and pheophorbides a and b in solution in diethyl ether or in 80% acetone. Estimation is based on calcula- tions derived from readings made with three primary and one or two secondary filters. Depending upon the filter systems used, the identity and concentra- tion may be determined over the concentration
range from 0.001 to 0.3 pmol per liter for all pig- ments excepting pheophytin a and pheophorbide a, which must be present at concentrations three times larger. Fluorometric estimation may be ac- curately and rapidly made at pigment concentrations of 1 X lop2 to 1 X of those required for spectro- photometric procedures. The instruments required are relatively compact, sturdy, and inexpensive in comparison with spectrophotometric equipment.
t has been established that chlorophylls a and b fluoresce independently of one another in mixtures and that the I concentration of these components in acetone mixtures
of pure chlorophylls a and b could be determined from the fluoresence of such mixtures when irradiated with blue and violet light (436 and 405 nm) (Goodwin, 1947). A study of the accuracy of the fluorometric method for the estimation of chlorophyll in phytoplankton using a Turner fluorometer equipped with a blue lamp for increased sensitivity has been made. The chlorophyll of phytoplankton was found to be mainly chlorophyll a and fluorometric estimation was based on readings taken before and after acidification with oxalic acid to convert the chlorophyll to pheophytin (Yentsch and Menzel, 1963). Studies have been made of the continuous measurement of in uico chlorophyll concentration of phyto- plankton based on observations with a Turner model 111 fluorometer in which the standard photomultiplier (RCA 931 A) had been replaced with the somewhat more red-sensitive one (R136) (Lorenzen, 1966).
Spectrophotometric procedures for the estimation of the components of mixtures of chlorophylls a and b and deriva- tives have been described (Vernon, 1960; White et al., 1963). This report is an investigation of the substitution of fluoro- metric for spectrophotometric techniques in the estimation of multicomponent mixtures of pigments similar to those of White et al. (1963).
EXPERIMENTAL
Pure samples of the a and b forms of chlorophyll, pheo- phytin, and pheophorbide were prepared as described by Jones et al. (1968). The chlorophyllides were prepared by enzymatic hydrolysis of highly purified chlorphyll a and chlorophyll b (Jones et al., 1972). Formation of chloro- phyllide was followed by thin-layer chromatography (Jones etal . , 1972).
In preliminary studies adsorption on glass surfaces occurred with the chlorophyllides and pheophorbides during dilution and aliquot measurement and was responsible for large errors. Adsorptive losses could be prevented by the addition of oxalic acid at a concentration of 0.001 z for diethyl ether and of 0.00005 % for 80 z acetone solution. Higher oxalic
Departments of Chemistry and Food Science, North Carolina State University, Raleigh, North Carolina 27607.
acid concentrations caused error with the chlorophyllides through conversion to the pheophorbides. I t was found to be necessary to make up the acidified solvents daily as used to avoid undesirable changes resulting from acidification. In clean-up operations all vessels used in handling and storage of chlorophyllides and pheophorbides were given a prelimi- nary rinse with acetone acidified with a few drops of 6 N hydrochloric acid.
The concentration of suitably diluted aliquots of the various pigments in diethyl ether was established by means of a Beck- man DK-2A Spectrophotometer based on the molar ab- sorbance coefficients of White et al. (1963). Pure aqueous acetone solutions (SO%, v/v) of the pigments were obtained by removal of the diethyl ether through vacuumization of ali- quots of pigment solutions diluted with pure acetone followed by adjustment with appropriate volumes of pure acetone and water. The molar absorbance coefficient of each pigment in 80% acetone was determined from its absorbance in each solvent and the coefficient in diethyl ether. The coefficients for the chlorophylls and pheophytins agreed closely with those determined by Vernon (1960). Molar absorbance coeffi- cients for the chlorophyllides and pheophorbides in 80 % acetone was nearly identical to those for corresponding chloro- phylls and pheophytins, a similarity previously reported for these pigments in diethyl ether (White et al., 1963).
A Turner model 111 fluorometer equipped with a blue fluorescent lamp (F4T5) and a high sensitivity door was used. Samples in diethyl ether or 80% acetone were read in round Pyrex cuvettes fitted with polypropylene stoppers. Primary and secondary filters were selected following determination of the excitation and emission spectra of the various pigments by means of the Aminco-Bowman Spectrophotofluorometer. Observations on the Turner fluorometer were made using combinations of series of glass filters by Corning or of inter- ference filters by Bausch & Lomb covering the following approximate ranges-for the excitation filter, 350-460 nm, and for the emission filter, 620-680 nm.
Limited observations were made initially with the fluorom- eter equipped with the standard photomultiplier tube. The primary filters were narrow band-pass filters with the follow- ing approximate wavelength for maximum transmission : CS #5-62, 405 nm; CS #5-74, 430-436 nm; CS #5-75, 460 nm. The secondary filter was a sharp cut filter, CS $2-60.
The major portion of this study was conducted with the fluorometer equipped with the more red-sensitive R136 photo-
J. AGR. FOOD CHEM., VOL. 20, NO. 4, 1972 773

WHITE et al.
Table I. Filter Identification and Characterization Filter type and reference no. Filter position Control data
interference" Nominal Actual transmittance Half width Narrow band-pass Peak wavelength Peak
405 Primary 440 Primary 460 Primary 680 Secondary 650 Secondary
Sharp cut glassb CS #2-60
a Bausch and Lomb, 2nd order interference. b Corning.
405 nm 402 nm 46 z 11 nm 440 nm 442 nm 45 z 11 nm 460 nm 465 nm 49 z 11 nm 680 nm 680 nm 40 z 10 nm 650 nm 653 nm 47 z 10 nm
Wavelength at which transmission was
619 nm 599 nm Greater than 37 % Less than 0.5
are a t a concentration of 1.00 pmol per liter. Regression equations were determined from replicated observations. Table 11. Fluorescence Maxima (nm) of Pigments
Pigment Chlorophyll a Chlorophyll b Pheophytin a Pheovhvtin b
dxcitation max Diethyl 80% ether acetone 420 432 454 466 400 398 416 437
Emission max Diethyl 80% ether acetone 668 674 649 659 673 676 661 662
Y intercept values were established for each pigment. Such values were not significantly different from a Y intercept value of 0. The regression lines were linear, indicating that error caused by reabsorption of fluorescence due to thickness of solution layer or to solution concentration was negligible.
Mixtures of known quantities of the purified pigments, . _ chlorophylls a and b andpheophytins a and b, were-made up
Table 111. Relative Fluorescence Intensity Valuesd Filter systems, as designated
405" 4 4 0 b 46w Pigment Ether Acetone Ether Acetone Ether Acetone
Chlorophyll a (C,) 1390 1150 763 405 625 361 Chlorophyll b (Cb) 139 114 1230 508 3490 1793 Pheophytin a (Pys) 1460 1190 81.2 83.5 102 101 Pheophytin b (Pyb) 417 346 1250 1134 1190 1210
a Primary, 405; secondary, 680 + (12-60); aperture 1OX. Primary, 440; secondary, 650 + (82-60); aperture 3 X . Primary, 460; secondary, Expressed as calculated dial readings for pigments at concentration of 1.0 #mol per 1. Pigment in diethyl ether or 650 + (#2-60); aperture 1OX.
in acetone (80 %) as indicated.
multiplier tube. The filters used are listed and characterized in Table I. In some experiments the secondary filter CS #2-60 was used alone, the narrow band-pass interference filter being omitted. The omission of the interference secondary increased the sensitivity about ten times but decreased the selectivity. Observations were made of replicated serial dilutions of pure pigments to provide estimates of the relative fluorescence intensity of solutions with filter combinations listed in Table I. The concentrations were adjusted to permit fluorometer readings between 10 and 90, when the range selector regulating the amount of exciting light was set at the 3X or the 1OX position. The selection of filters was based on the excitation and fluorescence maxima of the pigments in diethyl ether and 80% aqueous acetone (Table 11). The emission peaks agree closely with those reported by French et al. (1956).
RESULTS AND DISCUSSION
Presented in Table 111 are relative fluorescence intensity values for the chlorophylls and pheophytins in diethyl ether and 80 % acetone solutions, respectively. The intensity values are expressed as calculated dial readings on the Turner 11 1 fluorometer fitted with indicated filter systems when pigments
774 J. AGR. FOOD CHEM., VOL. 20, NO. 4, 1972
Solution #1 Chlorophylls (C, and c b )
Pheophytins (Py, and Pyb) Read, filter systems 440, 460, 405
1 1 Add HCl or oxalic acid 1
1 Solution #2
Pheophytins (Pya? and Pybt) ~ Read, filter systems 440, 460, 405
Figure 1. ether or acetone (80 %)
Scheme for estimation of pigments in mixtures in diethyl
in diethyl ether and also in 80 % aqueous acetone. The ratio of the a to b components was approximately 2 : 1, respectively. Estimation of the pigments from the mixture was accom- plished according to the scheme, as shown in Figure 1 . Pig- ment solution #l was read with filter systems designated as 440, 460, and 405 (Table 11). Pigment solution #2 was formed by acidification of solution #1 but the acid used was

CHLOROPHYLLS, CHLOROPHYLLIDES, PHEOPHYTINS, AND PHEOPHORBIDES
Ether Solution #1 Chlorophylls (C, and Cb), Chlorophyllides (Cd, and Cdb), Pheophytins (Py, and Pyb), Pheophorbides (Po, and Pob)
Read, filter systems 440, 460, 405
Extract with 0.01 KOH
I
Ether Solution #2 Pheophytins (Py,f and Pybf)
Pheophorbides (PoJ and PObt)
Ether Solution #3 Chlorophylls (C, and c b )
Pheophytins (Pya and Pyb)
Ether Solution #4 Pheophytins (Py,t and Pybt)
Read, filter systems 440, 460, 405
Aqueous Solution #1 Chlorophyllides (Cd. and Cdb) Pheophorbides (Po, and Pob)
Discard
~
Figure 2. Scheme for estimation of pigments in mixtures in diethyl ether
different, depending upon the solvent. Diethyl ether solu- tions were acidified by the addition of 0.1 ml of concentrated hydrochloric acid to 50 ml of solution and permitted to stand for 2 hr before reading. When 80% acetone was the solvent the procedure was as follows. To 10 ml of the pigment solu- tion was added 1 ml of 0.5 oxalic acid in 80% acetone. The solution was permitted to stand 2 hr and was then diluted to 25 ml with 80% acetone for reading. Pigment solution #2, whether the solvent was diethyl ether or 80% acetone, was read with each of the filter systems designated as 440, 460, and 405.
Derivation of Equations for Pigment Estimation. Reference to the pigments will be by means of the symbols indicated in Table I11 and Figures 1 and 2. The symbol F has been used to indicate fluorescence (dial readings) of a sample, with ap- propriate superscripts and subscripts attached to designate, respectively, the specific filter system used and the specific pigment or pigment mixture in the solution. Filter systems are as characterized in Table 111. The symbols C,, c b , Pya, and Pyb represent the pigments chlorophyll a , chlorophyll b, pheophytin a, and pheophytin b, respectively, or their re- spective concentrations in micromoles per liter. If the pig- ment solution has been acidified to form pheophytins from chlorophylls, then the letter A is also added as a subscript.
When a solution containing the four pigments chlorophyll a, chlorophyll b, pheophytin a, and pheophytin b, the equa- tions required to estimate each component are developed according to the examples which follow. Chlorophylls a and b are estimated by the changes in fluorescence with filter systems designated as 440 and 460 from readings taken before and after acidification of the pigment solutions. Such fluo- rescence change is indicated by A F which is equal to F - FA. Pheophytin a and b are estimated from fluorescence readings of acidified solutions read with filter systems designated as 440 and 405.
In this study involving solutions of four pigments there has been a verification of an earlier observation (Goodwin, 1947) to the effect that pigments in mixtures fluoresce independently. Accordingly, total fluorescence (dial reading) of a pigment
mixture is the sum total of the fluorescence of each component in the mixture. This may be expressed as
F 4 4 0 = Fc 440 + F C b 4 4 0 + F P ~ ~ ~ ~ ~ + F ~ y b ~ ~ ~ (1)
By substituting the appropriate relative fluorescence intensity values listed in Table I11 into eq 1, eq 2 is obtained, which for pigments in diethyl ether, is:
F440 = 763 C, + 1230 Cb + 81.2 Pya + 1250 Pyb (2) Equation 2 indicates the relative contribution of each pigment toward the total fluorescence under the conditions of these observations (specific filter systems, specific instrument, di- ethyl ether as solvent, etc.). Upon acidification of the solu- tion as specified above, conversion of the chlorophylls may be indicated by eq 3 :
FA^^^ = Fpyat440 + F P ~ ~ ~ ~ ~ ~ (3)
where symbol t indicates total pheophytin a and pheophytin b. Because Pyat and Pybt are, respectively, the sums of the Py, and the C , and of the Pyb and c b initially present, eq 3 may be rewritten as eq 4 for solutions of pigments in diethyl ether :
Fa4'' = 81.2 Py,t + 1250 Pybt =
81.2 (ca + pya) + 1250 (cb + PYb) (4) which may also be expressed as
= 81.2 ca + 1250 c b + 81.2 Pya + 1250 PYI, (5)
Subtracting eq 5 from eq 2 we have AF440 = F440 - Fa4'' = 682 Ca - 20 c b
where the symbol A represents the change in fluorescence readings for a given filter system following acidification. By similar calculation
(7)
(6)
AF460 = 523 C , + 2300 Cb
Solving for each component by simultaneous equations
C, = (1.46 AF440 + 0.0127 AF460) X pmol/l. (8)
Cb = (0.432 AF460 - 0.331 AF440) x pmol/l. (9) and
J. AGR. FOOD CHEM., VOL. 20, NO. 4, 1972 775

WHITE et al.
Table IV. Comparison of Relative Fluorescence Intensity Values of Phytylated and Corresponding Nonphytylated Pigmentsd Filter system Pigment RFI value Pigment RFI value I test % C.V.
460~ Chlorophyll a 614 Chlorophyllide a 609 N.S. 1 440b Chlorophyll a 704 Chlorophyllide a 668 ** 405c Chlorophyll a 1012 Chlorophyllide a 1005 N.S. 1
460a Chlorophyll b 3143 Chlorophyllide b 2915 ** 440b Chlorophyll b 989 Chlorophyllide b 1033 N.S. 3 405c Chlorophyll b 91.6 Chlor ophyllide b 111 ** 460a Pheophytin a 86.5 Pheophorbide a 90.9 **
405c Pheophytin a 1099 Pheophorbide a 1084 N.S. 3
460a Pheophytin b 1146 Pheophorbide b 1081 ** 440b Pheophytin b 1091 Pheophorbide b 1023 * x ;
405c Pheophytin b 28 5 Pheophorbide b 298 N.S. 5
1
2
2
3 * 440b Pheophytin a 69.8 Pheophorbide a 13.7 0.42
3 3
a Filter system: primary, interference 460; secondary, interference 650 + CS r2-60. Filter system: primary, interference 440; secondary, d Expressed as calculated dial interference 650 + CS f2-60. c Filter system:
readings for pigments at concentration of 1.0 pmol per 1. primary interference 405; secondary, interference 680 + CS $2-60.
Pigments in diethyl ether.
Table V. Recovery Data from Two Component Mixture of Pure Pigments
Statistics for regression of amount of recovery upon amount added. Photomultiplier tube, R-136. Filter system: primary, interference 460, 440, and 405; secondary, interference
650 or 680 + CS #2-60 Concentration b a
Solvent Pigment range" (slope) (intercept) C.V. Diethyl C , 0.037-0.044 1.009 +0.0011 1%
Diethyl Cb 0.011-0.019 0.973 +0.0005 1 % ether
ether
acetone
acetone
80 % Ca 0.055-0.065 0.682 +0.0184 2%
80 72 c b 0.031-0.043 0.863 + o . m 9 1 %
a Concentration expressed as prnoles per liter.
Substituting values from Table I11 and solving simultaneously
Py,t = (0.698 FA^^^ - 0.233 FA^^) x pmol/l. (10)
and
Pybf = (0.815 FA^^^ - 0.0453 X loF3 pmol/l. (11)
Since Pyat or Pybf is actually the sum of Pya and c, or Pyb and c b initially present
Pya = Py,t - c, (12)
Pyb = Pybt - c b (1 3)
In similar manner, equations may be developed for estimation of chlorophylls a and b and pheophytins a and b separately or in mixtures in solution of aqueous acetone (SOZ), pro- viding appropriate relative fluorescence intensity values are introduced. The relative fluorescence intensity values which pertained to this study are presented in Table 111.
If the original solution (solution # l , Figure 1) contains chlorophylls a and b only, the concentration of each pigment can be calculated from the dial readings with the 405 and 460 filter systems. For a solution of these pigments in di- ethyt ether the equations are:
C, = (0.733 F405 - 0.0292 F460) x pmol/l. (14)
c b = (0.292 F460 - 0.131 F405) X lop3 pmol/l. (15)
and
776 J. AGR. FOOD CHEM., VOL. 20, NO. 4, 1972
Equations 14 and 15 were derived from data in Table 111. Similar equations were developed for estimation of chloro- phylls a and b only in an 80% acetone solution.
The chlorophyllides and/or pheophorbides may be en- countered especially in extracts of processed green plant tissue (vegetables preserved by brining, freezing, or canning). Studies to determine the relative fluorescence intensity values of the chlorophyllides and pheophorbides in diethyl ether and 80% acetone were made by the same procedure used for establishing these values for the chlorophylls and pheophytins. The relative fluorescence intensity values for the nonphytyl- ated pigments in diethyl ether were found to be very similar to their phytylated counterparts, as is shown in Table IV. Because of this similarity they have been considered to be the same. Accordingly, the chlorophyllides and/or pheophor- bides, if present with chlorophylls and/or pheophytins in Solution #1 (Figure 1), would be estimated as chlorophylls and/or pheophytins by eq 1-15. The chlorophyllides and/or pheophorbides could be estimated, however, in solutions in diethyl ether but not in 80% acetone by a modification of the scheme in Figure 1, as shown in Figure 2. This scheme in Figure 2 was used for the spectrophotometric estimation of the eight components by White et al. (1963).
The authors would make it very clear that the specific rela- tive fluorescence intensity values presented in Table I11 are peculiar to the conditions of this investigation. Any change of the instrument or of any component of the specific filter systems used would cause the relative intensity fluorescence values to be different than those reported above. It is im- perative that each investigator establish relative fluorescence intensity values peculiar to his instrument and filter systems using purified pigments as standards.
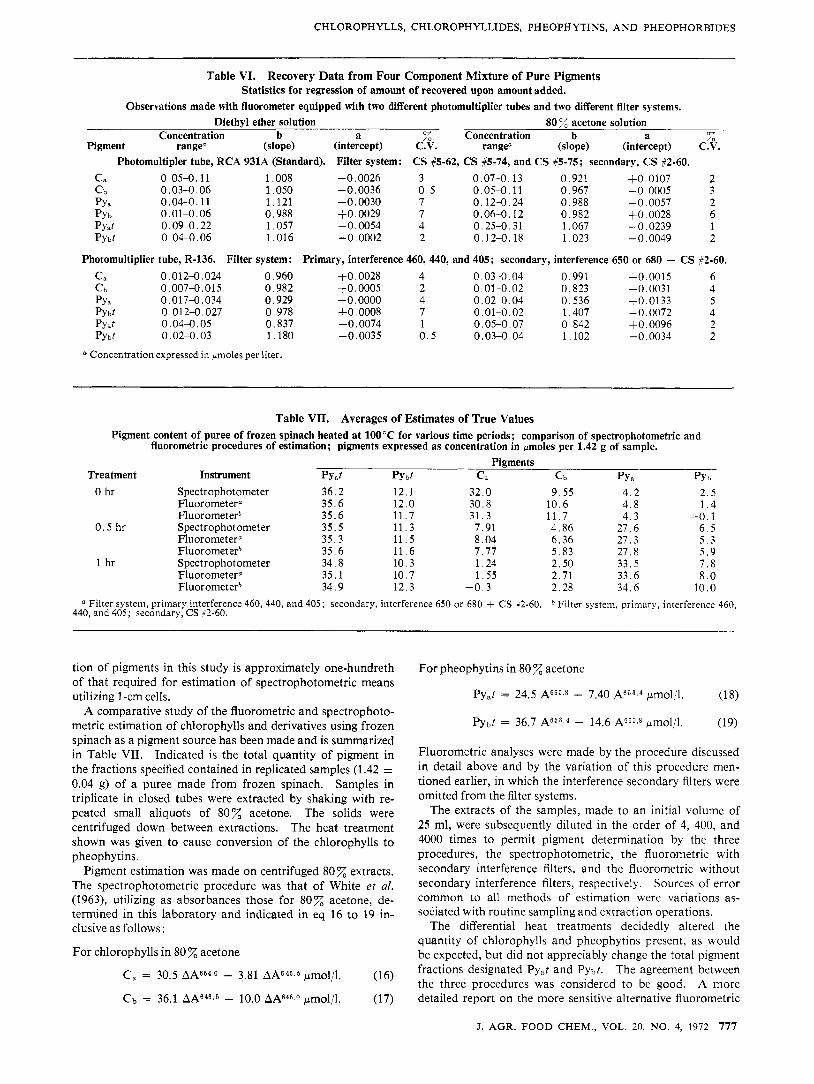
Pigment Estimation from Mixtures. Indicated in Tables V and VI are examples of recovery of the various pure pig- ments when present either in diethyl ether or 80% acetone in two and four pigment component systems, respectively. The concentration ranges to which reference is made are those for the determinations reported in the tables and do not indicate the limits of the ranges over which estimations may be made with a high degree of accuracy. For the observations made in Table VI with the system consisting of the standard photo- multiplier tube and the narrow band-pass primary filters neither the relative fluorescence intensity values determined nor the equations required for calculations of the correspond- ing results have been included in this report. The concentra-
CHLOROPHYLLS, CHLOROPHYLLIDES, PHEOPHYTINS, AND PHEOPHORBIDES
Table VI. Recovery Data from Four Component Mixture of Pure Pigments Statistics for regression of amount of recovered upon amount added.
Observations made with fluorometer equipped with two different photomultiplier tubes and two different filter systems. Diethyl ether solution 80 % acetone solution
Concentration b a Concentration b a z Pigment range" (slope) (intercept) C.V. range" (slope) (intercept) C.V.
C, 0.05-0.11 1.008 -0.0026 3 0.07-0.13 0.921 +0.0107 2 c b 0.03-0.06 1.050 -0.0036 0 . 5 0.05-0.11 0,967 -0,0005 3 PY, 0.04-0.11 1.121 -0.0030 7 0.12-0.24 0.988 -0.0057 2 PYb 0.0 1-0.06 0.988 + O , 0029 7 0.06-0.12 0.982 + O . 0028 6 PYJ 0.09-0.22 1.057 -0.0054 4 0.25-0.31 1.067 -0.0239 1 Pybt 0,04-0.06 1.016 -0.0002 2 0.12-0.18 1.023 -0.0049 2
Photomultipler tube, RCA 931A (Standard). Filter system: CS #5-62, CS #5-74, and CS #5-75; secondary, CS 52-60.
Photomultiplier tube, R-136. Filter system: Primary, interference 460, 440, and 405; secondary, interference 650 or 680 + CS 32-60. C, 0.012-0.024 0.960 f O ,0028 4 0,03-0,04 0.991 + O , 0015 6 c b 0.007-0.015 0.982 + O , 0005 2 0,01-0.02 0.823 + O , 0031 4 PYCi 0.017-0.034 0.929 +o. 0000 4 0.02-0,04 0.536 t0 .0133 5 PYbf 0.012-0.027 0.978 $0,0008 7 0.01-0.02 1.407 -0,0072 4 PYJ 0.04Cl. 05 0.837 +O ,0074 1 0.05-0.07 0,842 +O ,0096 2 Pybt 0.02-0.03 1.180 -0,0035 0 . 5 0.03-0, 04 1.102 -0,0034 2
a Concentration expressed in pmoles per liter.
Table VII. Averages of Estimates of True Values Pigment content of puree of frozen spinach heated at 100°C for various time periods; comparison of spectrophotometric and
fluorometric procedures of estimation; pigments expressed as concentration in pmoles per 1.42 g of sample. Pigments -
Treatment Instrument PY,t P Y b t C, c b PY a PY h
0 hr Spectrophotometer 36.2 12.1 32.0 9.55 4 .2 2.5 Fluorometer" 35.6 12.0 30.8 10.6 4.8 1 .4 Fluorometer* 35.6 11.7 31.3 11.7 4.3 -0.1
0 . 5 hr Spectrophotometer 35.5 11.3 7.91 4.86 27.6 6 . 5 Fluorometera 35.3 11.5 8.04 6.36 27.3 5 . 3 Fluorometer* 35.6 11.6 7.77 5.83 27.8 5.9
1 hr Spectrophotometer 34.8 10.3 1,24 2.50 33.5 7 .8 Fluorometer 35.1 10.7 1.55 2.71 33.6 8 .0 Fluorometerb 34.9 12.3 -0.3 2.28 34.6 10.0
Filter system, primary interference 460, 440, and 405; secondary, interference 650 or 680 + CS $2-60. * Filter system, primary, interference 460, 440, and 405; secondary, CS 112-60.
tion of pigments in this study is approximately one-hundreth of that required for estimation of spectrophotometric means utilizing 1-cm cells.
A comparative study of the fluorometric and spectrophoto- metric estimation of chlorophylls and derivatives using frozen spinach as a pigment source has been made and is summarized in Table VII. Indicated is the total quantity of pigment in the fractions specified contained in replicated samples (1.42 i 0.04 g) of a puree made from frozen spinach. Samples in triplicate in closed tubes were extracted by shaking with re- peated small aliquots of 80% acetone. The solids were centrifuged down between extractions. The heat treatment shown was given to cause conversion of the chlorophylls to pheophytins.
Pigment estimation was made on centrifuged 80% extracts. The spectrophotometric procedure was that of White et al. (1963), utilizing as absorbances those for 80% acetone, de- termined in this laboratory and indicated in eq 16 to 19 in- clusive as follows :
For chlorophylls in 80% acetone
C, = 30.5 AA6640 - 3.81 AA646.6 pmol/l. (16)
Cb = 36.1 AA648 - 10.0 AA646 O pmol/l. (17)
For pheophytins in 80 % acetone
Py,t = 24.5 A6S5.8 - 7.40 A6j3.4 pmol/l. (1 8)
Pybf = 36.7 A 6 5 3 . 4 - 14.6 A665j8 pmol!]. (19)
Fluorometric analyses were made by the procedure discussed in detail above and by the variation of this procedure men- tioned earlier, in which the interference secondary filters were omitted from the filter systems.
The extracts of the samples, made to an initial volume of 25 ml, were subsequently diluted in the order of 4, 400, and 4000 times to permit pigment determination by the three procedures, the spectrophotometric, the fluorometric with secondary interference filters, and the fluorometric without secondary interference filters, respectively. Sources of error common to all methods of estimation were variations as- sociated with routine sampling and extraction operations.
The differential heat treatments decidedly altered the quantity of chlorophylls and pheophytins present, as would be expected, but did not appreciably change the total pigment fractions designated Py,t and Pybf. The agreement between the three procedures was considered to be good. A more detailed report on the more sensitive alternative fluorometric
J. AGR. FOOD CHEM., VOL. 20, NO. 4, 1972 777

ROY
technique is to be published later. It is observed that the naturally occurring carotenoids were not a source of appre- ciable error in the fluorometric methods.
ACKNOWLEDGMENT
The authors thank L. Nelson, Department of Experimental Statistics, N.C. State University, for consultation and assis- tance in data presentation.
LITERATURE CITED
French, C . S. , Smith, J. H. C., Virgin, H. I., Airth, R. I., Plant
Goodwin, R. H., Anal. Chem. 19,789 (1947). Physiol. 31,369(1956).
Jones, I. D., White, R. C., Gibbs, E., Denard, C . D., J. AGR. FOOD Jones, I. D., Butler, L. S., Gibbs, E., White R. C., J. Chromarogr.
Lorenzen, C. J., Deep Sea Res. 13,223 (1966). Vernon, L. P., Anal. Chem. 32,1144 (1960). White, R. C., Jones, I. D., Gibbs, E.,J. FoodSci. 28,431 (1963). Yentsch, C. S., Menzel, D. W., Deep Sea Res. 10,221 (1963).
Receiaed for reciew Nocember 15, 1971. Accepted February 22, 1972. Paper No. 3619 of the Journal Series of the North Carolina State Unicersity Agricultural Experiment Station, Raleigh, North Carolina 27607. The use of trade names in this publication does not imply endorsement by the North Carolina Agricultural Experi- ment Station of rhe products named, nor criticism of similar ones not mentioned. Study supported in part by the Food and Drug Adminis- tration, Department of Health, Education, and Welfare, research grant FD-0078.
CHEM. 16,80(1968).
80, 87 (1972).
Further Purification, Fractionation, and Properties of Trypsin
Inhibitor Isolated from Lathyrus sativus
Dwijendra N. Roy
The trypsin inhibitor isolated from Lathyrus saticus was further purified and fractionated by DEAE cellu- lose column into five proteins with high trypsin in- hibitory activity and a sixth protein with negligible activity. The first five proteins could be eluted in electrophoresis. one block at pH 7.0, while the sixth was eluted at
pH 3.6. The five-protein fraction IV(A) on dialysis and lyophilization resulted in a yield of 26.2 mg per 100 g of original seed. This fraction, IV(A), showed five distinct protein bands by disc acrylamide gel
solation and partial purification of a specific trypsin in- hibitor from Lathyrus satious (L.S.) and some of its I properties were reported by Roy and Rao (1971). The
partially purified trypsin inhibitor showed a growth depressing activity in rats (Roy, 1972).
The present report describes further purification and proper- ties of this inhibitor.
EXPERIMENTAL
Preparation of Material. The trypsin inhibitor was isolated and partially purified by the method reported earlier (Roy and Rao, 1971) and was designated as Fraction 111.
DEAE-Cellulose Chromatography. Columns of 75.5 X 1.5 cm were prepared with DEAE-cellulose (Whatman col- umn chromedia, De 11, medium fibrous powder, normal ca- pacity 1.0 mequiv/g), washed with distilled water before use. The column was first equilibrated for 48 hr with 0.05 M phosphate buffer, pH 7.0, at 25°C; 32.6 mg of partially puri- fied inhibitor (Fraction 111) dissolved in 5 ml of phosphate buffer, pH 7.0, was loaded on the column, eluted first with 0.05 M phosphate buffer of pH 7.0, and then subsequently with phosphate-citrate buffer of pH 3.6. The flow rate was maintained at 45.5 ml/hr and 6.2-ml fractions were collected. Fractionation on the DEAE-cellulose column was repeated at a higher load (62.4 mg) of the inhibitor and the reproducibility of the pattern of elution was confirmed.
Disc Gel Electrophoretic Studies. Disc gel electrophoresis was conducted at pH 8.3 using 7.5% acrylamide system as described by Davis (1964). The effect of urea on the prep- aration was studied by using 4.6 M and 8.0 M urea in all the
National Institute of Nutrition, Indian Council of Medical Research, Jamai-Osmania, Hyderabad-7 (A.P.), India.
778 J. AGR. FOOD CHEM., VOL. 20, NO. 4, 1972
solutions and buffers of pH 8.3. Electrophoresis was carried out by applying 165-200 pg of protein sample, at 5 mA per tube for 1.5 hr, using Bromophenol blue as the indicator for the moving front, After each run, the gels were stained with 1 Amido Black in 10% acetic acid, subsequently destained by repeated washings with 10% acetic acid until the clear pro- tein bands were visible.
Protein Determination. Protein was determined by the method of Lowry et al. (1951) using bovine serum albumin as the standard.
Test for Carbohydrates. The purified fraction was sub- jected to hydrolysis by the method of Miyata et a/. (1970). A 30-mg sample was hydrolyzed with 3 ml of 2 N H2S04 by refluxing for 24 hr. The hydrolysate was neutralized with Ba(OH)2 and then centrifuged. The clear supernatant was evaporated to a minimum volume. The presence of carbo- hydrates in this solution was examined by the Molisch test (Vogel, 1957).
Assay for Enzyme Activity. The inhibitory activity of the fractions was determined by the method described earlier (Kakade et al., 1969; Roy and Rao, 1971). A 2% casein solution in phosphate buffer (0.1 M , pH 7.6) was used as substrate, while the enzyme used was trypsin (E. Merck, about 20,000 Fuld-Gross units per gram) ( 5 mgiml). The incubation mixture consisted of 0.5 ml of trypsin solution, 2 ml of 2 % casein, 1.0 ml of phosphate buffer (pH 7.6, 0.1 M ) , 0.3 ml of HCl(O.001 M ) solution and 0.2 ml test solution. The total volume was 4 ml in each case. Incubation was carried out at 37°C for 20 min, after which 6.0 ml of 5x TCA solution was added to stop the reaction. Corresponding blanks were run concurrently. In all these experiments, one trypsin unit (TU) was arbitrarily defined as an increase of 0.01 absorbance unit at 280 mp in 20 min for 10 ml of reaction