Embed Size (px)
Citation preview
REVIEW OF SCIENTIFIC INSTRUMENTS VOLUME 74, NUMBER 5 MAY 2003
Foamability and foam stability at high pressures and temperatures.I. Instrument validation
Eric Tyrode, Aldo Pizzino, and Orlando J. Rojasa)
Escuela de Ingenierı´a Quı́mica, Lab. FIRP, Universidad de Los Andes, Me´rida 5101, Venezuela
~Received 22 October 2002; accepted 4 February 2003!
An instrument was designed and assembled with the aim of measuring macroscopic properties offoams~such as foamability and stability! under high pressures and moderate temperatures~up to 105bar and 425 K, respectively!. The device makes use of infrared sensors to detect the foam forefrontposition as it is generated by gas sparging in the foaming solution. The measurement makes use ofa modified dynamic Bikerman protocol to estimate the foamability and stability of the studiedsolution. Traditional direct observation used in foam experiments at ambient conditions is thereforecircumvented and the instrument can be set up in an appropriate place and monitored remotely soas to reduce the risks involved in high-pressure, high-temperature operations. Data from the infraredsystem allows not only following the dynamics of foam phenomena but also the relative foamquality along the column, and the presence of air pockets in the case of unstable or pulsating foams.A series of fluorosurfactants~cationic, anionic, and nonionic! were used to validate the instrumentand the effect of temperature on foamability, foam stability and foam quality is discussed. Finally,synergistic effects were observed with respect to the foam behavior of different mixtures of thestudied surfactants. ©2003 American Institute of Physics.@DOI: 10.1063/1.1569403#
eno
lst tfngriedt
cery
sut
i-ll
one
thitan
er
n
isof
a-mes
ac-bi-
there-
igh
re-isticus
by
mcon-
lowsr-
cance it. Itingm.ods
ma
I. INTRODUCTION
Use of foams in gas and petroleum industries represone of the most significant and promising applicationsthese complex fluids in application such as drilling weldeveloping oil pools and foam-enhanced oil recovery, jusmention a few. Bond and Holbrook1 suggested the ability ofoams to improve oil recovery. In their application a foamicompound was used to increase the efficiency of a gas dused for the recovery of residual oil from a partly depletsubterranean reservoir. The foaming agent is placed inreservoir adjacent to the injection well and the gas is forthrough the reservoir from an injection well to a recovewell.
Recent studies have shown that when foams are uinstead of the usual flushing fluids or when they substitconventional clay suspensions, the drilling rates increaseto four times,2 while enhancing the well exploitation condtions, increasing the drilling equipment working life and weproductivity.
A fundamental requirement for the successful utilizatiof foams in the oil exploitation area is their stability at thextreme conditions encountered in the well. The foam, incase, interacts with both solid particles and oil drops andsupposed to tolerate mechanical compression and stressparticularly, it is required to withstand high temperatures apressures~as typically found in underground formations!.
Perhaps the most extended methods used to charactfoam behavior are the Bikerman3 and Ross–Miles4 proto-cols. In these cases cylindrical columns are employed aoptionally, a fluid circulating externally regulates the tem
a!Author to whom correspondence should be addressed; [email protected]
2920034-6748/2003/74(5)/2925/8/$20.00
Downloaded 04 May 2003 to 130.237.11.17. Redistribution subject to A
tsf,o
ve
hed
edeup
isisnd,d
ize
d,-
perature. In both methods the foam height or volumemonitored by direct observation and therefore the usetransparent materials~e.g., glass! is a prerequisite. When thecolumn is used at temperatures above;60 °C ~at atmo-spheric pressure! some difficulties may arise, e.g., evaportion takes place and manipulation of hot surfaces becotroublesome.
At present, there are a few systems for determining mroscopical foaming properties of aqueous solutions at ament temperature and pressure conditions~see, for example,the Foamscan Analyzer5–7!. Evaluation of foam propertiesfor nonaqueous systems is less common. Furthermore,effect of pressure on foam properties is a topic that hasceived little attention. In most cases foam behavior at hpressures has been studied by using porous media~packedbeds!8–10 and correlations with apparent viscosity measuments are often used to estimate foam characterparameters.8,10To our knowledge the only reported apparatfor studies on foams at high pressures in void columns~asopposed to porous media! is that of Maini and Ma.11 In thisinstrument the monitoring of the foam evolution is madedirect observation through a glass window.
In order to comply with the necessity of studies on foaproperties at high pressures and temperatures, we havestructed an instrument based on infrared sensors that almonitoring foam forefront position remotely as it is geneated in a robust, metal-made column. The instrumentoperate with both aqueous and nonaqueous solutions sinis not based on measurements of electrolytic conductivityincludes a generation unit that bubbles gas into the foamsolution at controlled flow rates in order to produce the foaAfter the foam is generated a protocol based on the methil:
5 © 2003 American Institute of Physics
IP license or copyright, see http://ojps.aip.org/rsio/rsicr.jsp
s
io
itenn
crtioide
0pr
asen
elyte
aan
ob
ed
tioequth
beao
plne
ne
mt a
der-ftru-igham
htsasfact
on-nged inher
res-
medin-a-
pe-eed
te atlatedrsn.ther-
g
2926 Rev. Sci. Instrum., Vol. 74, No. 5, May 2003 Tyrode, Pizzino, and Rojas
proposed by Bikerman3 and Ross–Miles4 is used as a meanto characterize the foam.
II. FOAMING AGENTS
In order to illustrate the operation of the instruments~tobe described in the following sections! various foaming so-lutions were employed. These consisted of aqueous solutof flurorosurfactants of the Zonyl® series~DuPont™!. Thereason for choosing this type of surfactant is not only forexcellent foaming properties but also for its inertness tovironments such as those encountered in steam flood cotions and also for their chemical compatibility.
Cationic, nonionic and anionic forms of the fluorosurfatants were studied and described as follows. Cationic fluosurfactant Zonyl® FSD was used as an aqueous solucontaining 30% of the active ingredient; 3% sodium chlorand 10% hexylen glycol~water as the remainder!. The cmcand molecular weight are reported to be 0.085 g/dl of 6g/mol, respectively. The structure of the surfactant is proetary.
Nonionic fluorosurfactant Zonyl® FSN was usedan aqueous solution containing 40% of the active ingredi30% isopropyl alcohol and 3% sodium chloride~wateras the remainder!. The cmc and molecular weight arreported to be 0.02 g/dl and 950 g/mol, respectiveThe structure of the active ingredient can be represenby RfCH2H2O(CH2CH2O)xH, where Rf5F(CF2CF2)y ,x50 – 25 andy51 – 9.
Anionic fluorosurfactant Zonyl® FS-62 was used asaqueous solution containing 25% of the active ingredient2% acetic acid~water as the remainder!. The cmc and mo-lecular weight are reported to be 0.02 g/dl and 435 g/mrespectively. The structure of the active ingredient canrepresented by CF3 (CF2)5 CH2 CH2 SO3X, where X5H orNH4. Double-distilled water (831024 mS/cm! and nitrogengas~industrial grade! were also employed.
III. INSTRUMENT OPERATION PRINCIPLE
In the modified Bikerman dynamic method employherein, foam is generated by bubbling nitrogen gas~or anyother gas! at a constant pressure through a surfactant soluplaced in a glass or metal column. Bubbling is continuuntil the foam reaches a constant height where dynamic elibrium between the rate of formation at the bottom andrate of collapse of bubbles at the top is attained~dynamictest!. The equilibrium height or foam volume can thenused to calculate foamability indices such as the Bikermindex, which relates the measured foam volume and the flrate of gas injected under equilibrium conditions.
After equilibrium conditions are reached the gas supis terminated and the foam is allowed to collapse without adisturbance. The variation of the foam’s height with timgives account of its stability~static test!. The experimentaldata in this case can be analyzed by assuming some kimodel of foam decay~e.g., first-order kinetics11,12 or foamdecay rate inversely proportional to the age of the foam13!.
Two different devices were constructed using the sainfrared detection system. One is intended to operate a
Downloaded 04 May 2003 to 130.237.11.17. Redistribution subject to A
ns
s-
di-
-o-n
0i-
t,
.d
nd
l,e
ndi-
e
nw
yy
tic
et-
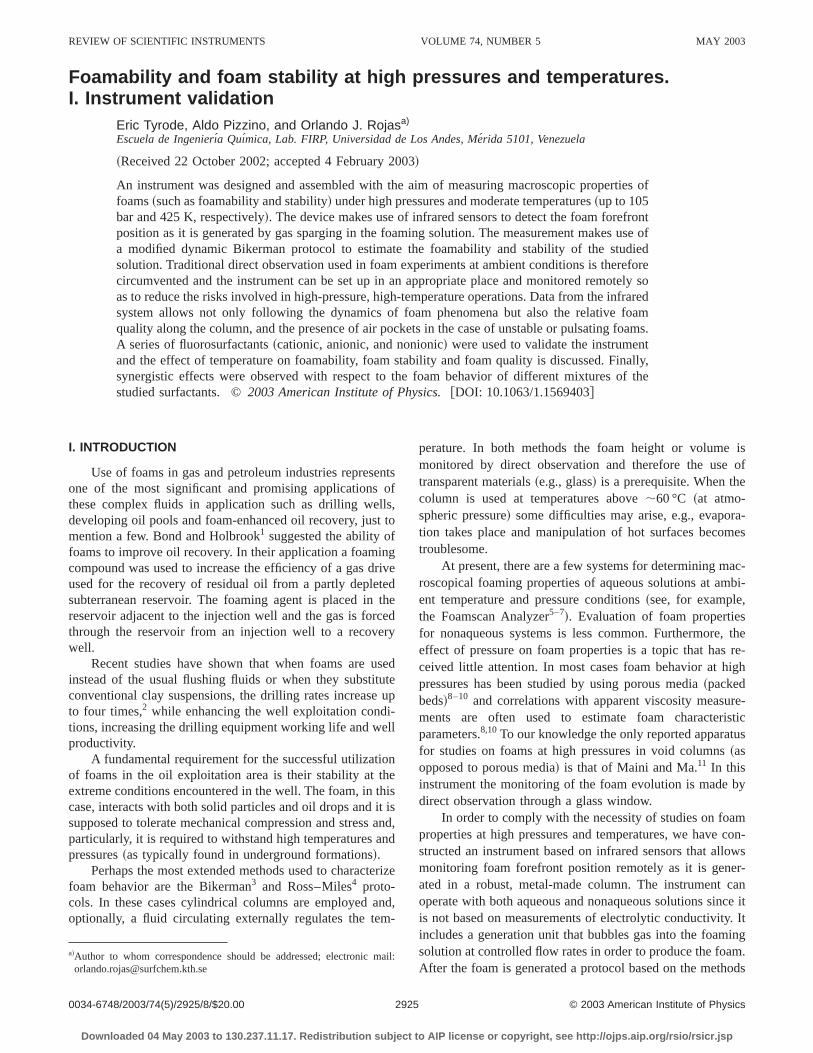
mospheric pressure while the other was built to work unpressures up to 105 bars~in both cases the maximum temperature allowed was 425 K!. A schematic representation othe first instrument can be seen in Fig. 1. Here neither insmentation nor special materials are needed to maintain hpressures and therefore the layout is very simple. The focolumn in our case is made of glass~alternatively any othertemperature-resistant material can be used!.
Infrared sensors placed externally at known heigalong the column allow tracking the height of the foamtime elapses. The principle of operation is based on thethat the foam disrupts the infrared beam path~from source toreceptor! hereby reducing the voltage in a resistance cnected in series to the infrared detector. The voltage chais registered by a data acquisition system and interpreteterms of foam dynamics. The data are also stored for furtanalysis.
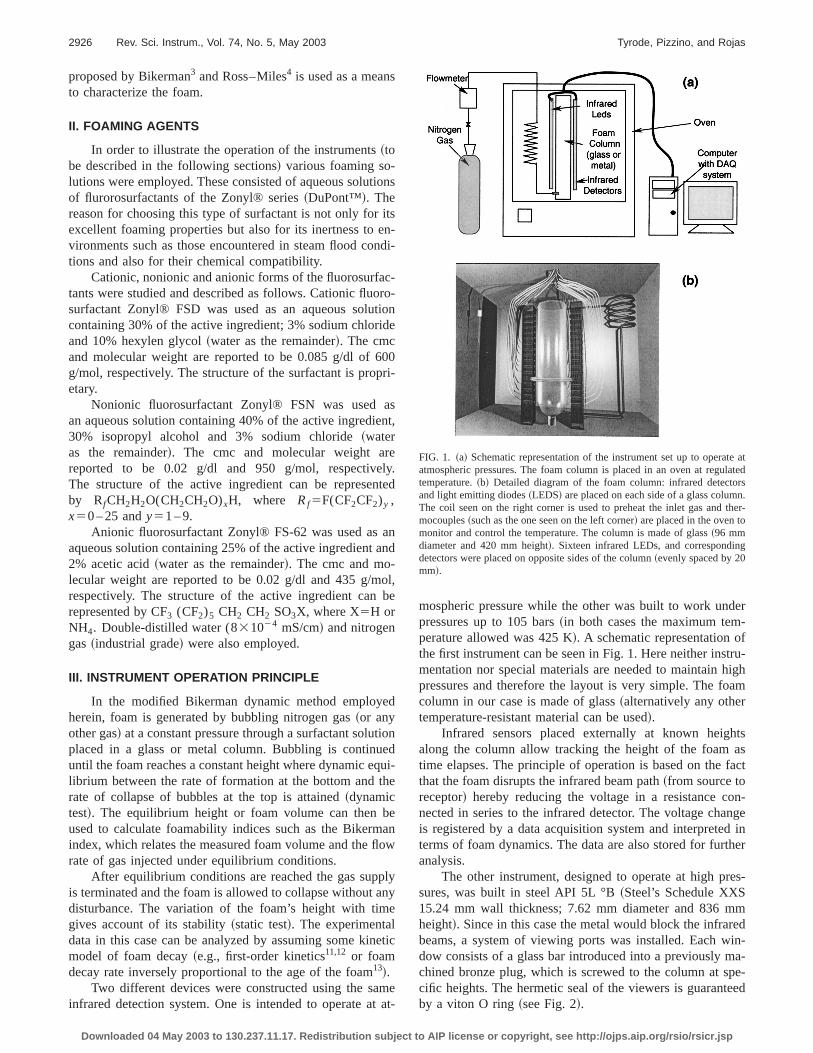
The other instrument, designed to operate at high psures, was built in steel API 5L °B~Steel’s Schedule XXS15.24 mm wall thickness; 7.62 mm diameter and 836 mheight!. Since in this case the metal would block the infrarbeams, a system of viewing ports was installed. Each wdow consists of a glass bar introduced into a previously mchined bronze plug, which is screwed to the column at scific heights. The hermetic seal of the viewers is guarantby a viton O ring~see Fig. 2!.
FIG. 1. ~a! Schematic representation of the instrument set up to operaatmospheric pressures. The foam column is placed in an oven at regutemperature.~b! Detailed diagram of the foam column: infrared detectoand light emitting diodes~LEDS! are placed on each side of a glass columThe coil seen on the right corner is used to preheat the inlet gas andmocouples~such as the one seen on the left corner! are placed in the oven tomonitor and control the temperature. The column is made of glass~96 mmdiameter and 420 mm height!. Sixteen infrared LEDs, and correspondindetectors were placed on opposite sides of the column~evenly spaced by 20mm!.
IP license or copyright, see http://ojps.aip.org/rsio/rsicr.jsp
ees
icthteis
mle
, re-m-g atrol
mit
e of
e-o-ntirtheini-
fluc-
sof
IR
allyede
htsachthehe
at
ur
a.toe
ithdqui-
al-wastheot-that
case
2927Rev. Sci. Instrum., Vol. 74, No. 5, May 2003 Foam behavior at high P and T
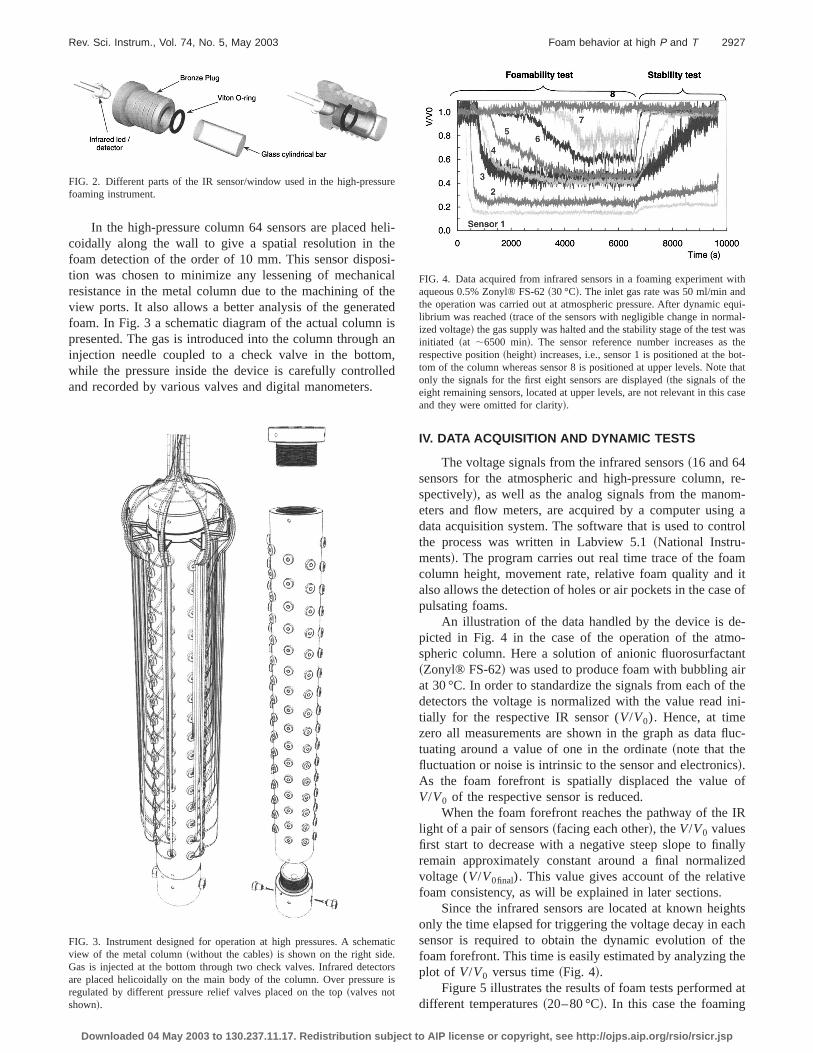
In the high-pressure column 64 sensors are placed hcoidally along the wall to give a spatial resolution in thfoam detection of the order of 10 mm. This sensor dispotion was chosen to minimize any lessening of mechanresistance in the metal column due to the machining ofview ports. It also allows a better analysis of the generafoam. In Fig. 3 a schematic diagram of the actual columnpresented. The gas is introduced into the column throughinjection needle coupled to a check valve in the bottowhile the pressure inside the device is carefully controland recorded by various valves and digital manometers.
FIG. 2. Different parts of the IR sensor/window used in the high-pressfoaming instrument.
FIG. 3. Instrument designed for operation at high pressures. A schemview of the metal column~without the cables! is shown on the right sideGas is injected at the bottom through two check valves. Infrared detecare placed helicoidally on the main body of the column. Over pressurregulated by different pressure relief valves placed on the top~valves notshown!.
Downloaded 04 May 2003 to 130.237.11.17. Redistribution subject to A
li-
i-aled
an,d
IV. DATA ACQUISITION AND DYNAMIC TESTS
The voltage signals from the infrared sensors~16 and 64sensors for the atmospheric and high-pressure columnspectively!, as well as the analog signals from the manoeters and flow meters, are acquired by a computer usindata acquisition system. The software that is used to conthe process was written in Labview 5.1~National Instru-ments!. The program carries out real time trace of the foacolumn height, movement rate, relative foam quality andalso allows the detection of holes or air pockets in the caspulsating foams.
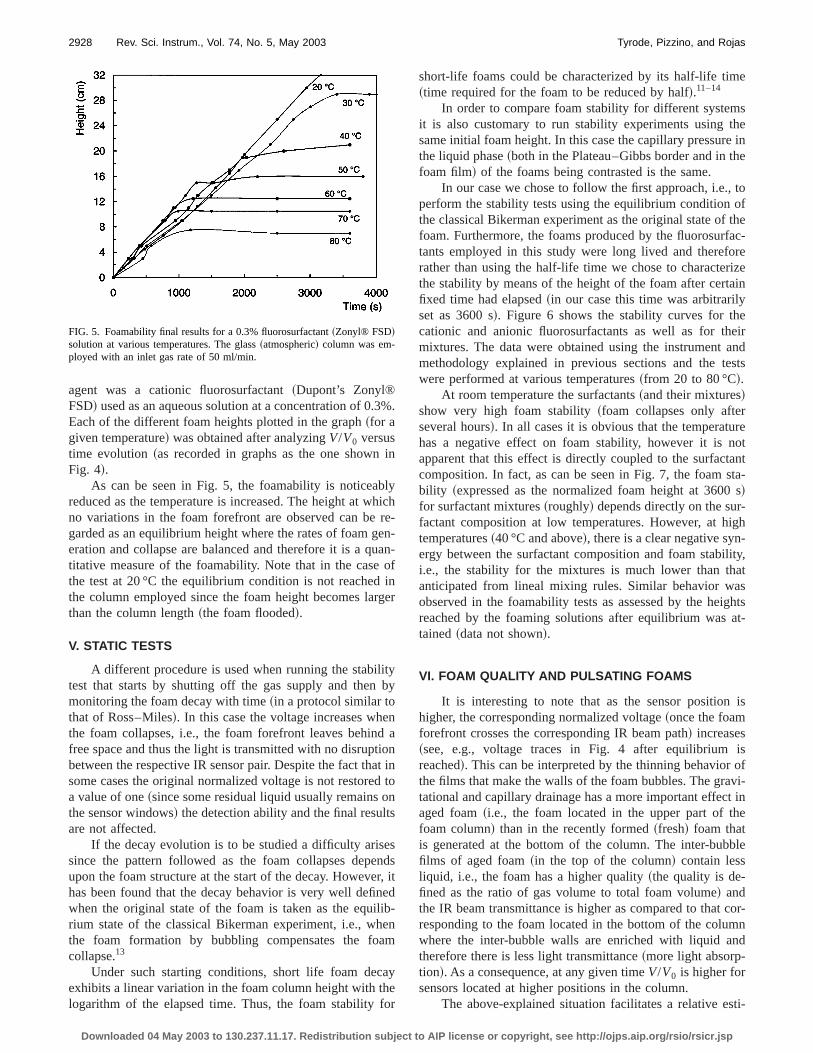
An illustration of the data handled by the device is dpicted in Fig. 4 in the case of the operation of the atmspheric column. Here a solution of anionic fluorosurfacta~Zonyl® FS-62! was used to produce foam with bubbling aat 30 °C. In order to standardize the signals from each ofdetectors the voltage is normalized with the value readtially for the respective IR sensor (V/V0). Hence, at timezero all measurements are shown in the graph as datatuating around a value of one in the ordinate~note that thefluctuation or noise is intrinsic to the sensor and electronic!.As the foam forefront is spatially displaced the valueV/V0 of the respective sensor is reduced.
When the foam forefront reaches the pathway of thelight of a pair of sensors~facing each other!, theV/V0 valuesfirst start to decrease with a negative steep slope to finremain approximately constant around a final normalizvoltage (V/V0final). This value gives account of the relativfoam consistency, as will be explained in later sections.
Since the infrared sensors are located at known heigonly the time elapsed for triggering the voltage decay in esensor is required to obtain the dynamic evolution offoam forefront. This time is easily estimated by analyzing tplot of V/V0 versus time~Fig. 4!.
Figure 5 illustrates the results of foam tests performeddifferent temperatures~20–80 °C!. In this case the foaming
e
tic
rsis
FIG. 4. Data acquired from infrared sensors in a foaming experiment waqueous 0.5% Zonyl® FS-62~30 °C!. The inlet gas rate was 50 ml/min anthe operation was carried out at atmospheric pressure. After dynamic elibrium was reached~trace of the sensors with negligible change in normized voltage! the gas supply was halted and the stability stage of the testinitiated ~at ;6500 min!. The sensor reference number increases asrespective position~height! increases, i.e., sensor 1 is positioned at the btom of the column whereas sensor 8 is positioned at upper levels. Noteonly the signals for the first eight sensors are displayed~the signals of theeight remaining sensors, located at upper levels, are not relevant in thisand they were omitted for clarity!.
IP license or copyright, see http://ojps.aip.org/rsio/rsicr.jsp
.3
i
lyhreeuaoi
rg
lityb
end
tioatdonts
esnr,nelibe
am
ahefo
e
shee inhe
, toofthe
fac-orerizeainyeeirandsts
rreotantsta-
s-igh-lity,ats
ightsat-
is
isofvi-t ine
ble
cor-mnnd
sti-
2928 Rev. Sci. Instrum., Vol. 74, No. 5, May 2003 Tyrode, Pizzino, and Rojas
agent was a cationic fluorosurfactant~Dupont’s Zonyl®FSD! used as an aqueous solution at a concentration of 0Each of the different foam heights plotted in the graph~for agiven temperature! was obtained after analyzingV/V0 versustime evolution~as recorded in graphs as the one shownFig. 4!.
As can be seen in Fig. 5, the foamability is noticeabreduced as the temperature is increased. The height at wno variations in the foam forefront are observed can begarded as an equilibrium height where the rates of foam geration and collapse are balanced and therefore it is a qtitative measure of the foamability. Note that in the casethe test at 20 °C the equilibrium condition is not reachedthe column employed since the foam height becomes lathan the column length~the foam flooded!.
V. STATIC TESTS
A different procedure is used when running the stabitest that starts by shutting off the gas supply and thenmonitoring the foam decay with time~in a protocol similar tothat of Ross–Miles!. In this case the voltage increases whthe foam collapses, i.e., the foam forefront leaves behinfree space and thus the light is transmitted with no disrupbetween the respective IR sensor pair. Despite the fact thsome cases the original normalized voltage is not restorea value of one~since some residual liquid usually remainsthe sensor windows! the detection ability and the final resulare not affected.
If the decay evolution is to be studied a difficulty arissince the pattern followed as the foam collapses depeupon the foam structure at the start of the decay. Howevehas been found that the decay behavior is very well defiwhen the original state of the foam is taken as the equirium state of the classical Bikerman experiment, i.e., whthe foam formation by bubbling compensates the focollapse.13
Under such starting conditions, short life foam decexhibits a linear variation in the foam column height with tlogarithm of the elapsed time. Thus, the foam stability
FIG. 5. Foamability final results for a 0.3% fluorosurfactant~Zonyl® FSD!solution at various temperatures. The glass~atmospheric! column was em-ployed with an inlet gas rate of 50 ml/min.
Downloaded 04 May 2003 to 130.237.11.17. Redistribution subject to A
%.
n
ich-
n-n-f
ner
y
aninto
dsitd-n
y
r
short-life foams could be characterized by its half-life tim~time required for the foam to be reduced by half!.11–14
In order to compare foam stability for different systemit is also customary to run stability experiments using tsame initial foam height. In this case the capillary pressurthe liquid phase~both in the Plateau–Gibbs border and in tfoam film! of the foams being contrasted is the same.
In our case we chose to follow the first approach, i.e.perform the stability tests using the equilibrium conditionthe classical Bikerman experiment as the original state offoam. Furthermore, the foams produced by the fluorosurtants employed in this study were long lived and therefrather than using the half-life time we chose to charactethe stability by means of the height of the foam after certfixed time had elapsed~in our case this time was arbitrarilset as 3600 s!. Figure 6 shows the stability curves for thcationic and anionic fluorosurfactants as well as for thmixtures. The data were obtained using the instrumentmethodology explained in previous sections and the tewere performed at various temperatures~from 20 to 80 °C!.
At room temperature the surfactants~and their mixtures!show very high foam stability~foam collapses only afteseveral hours!. In all cases it is obvious that the temperatuhas a negative effect on foam stability, however it is napparent that this effect is directly coupled to the surfactcomposition. In fact, as can be seen in Fig. 7, the foambility ~expressed as the normalized foam height at 3600!for surfactant mixtures~roughly! depends directly on the surfactant composition at low temperatures. However, at htemperatures~40 °C and above!, there is a clear negative synergy between the surfactant composition and foam stabii.e., the stability for the mixtures is much lower than thanticipated from lineal mixing rules. Similar behavior waobserved in the foamability tests as assessed by the hereached by the foaming solutions after equilibrium wastained~data not shown!.
VI. FOAM QUALITY AND PULSATING FOAMS
It is interesting to note that as the sensor positionhigher, the corresponding normalized voltage~once the foamforefront crosses the corresponding IR beam path! increases~see, e.g., voltage traces in Fig. 4 after equilibriumreached!. This can be interpreted by the thinning behaviorthe films that make the walls of the foam bubbles. The gratational and capillary drainage has a more important effecaged foam~i.e., the foam located in the upper part of thfoam column! than in the recently formed~fresh! foam thatis generated at the bottom of the column. The inter-bubfilms of aged foam~in the top of the column! contain lessliquid, i.e., the foam has a higher quality~the quality is de-fined as the ratio of gas volume to total foam volume! andthe IR beam transmittance is higher as compared to thatresponding to the foam located in the bottom of the coluwhere the inter-bubble walls are enriched with liquid atherefore there is less light transmittance~more light absorp-tion!. As a consequence, at any given timeV/V0 is higher forsensors located at higher positions in the column.
The above-explained situation facilitates a relative e
IP license or copyright, see http://ojps.aip.org/rsio/rsicr.jsp

.er.
2929Rev. Sci. Instrum., Vol. 74, No. 5, May 2003 Foam behavior at high P and T
FIG. 6. Foam decay curves~foamheight vs time! at various temperaturesfor different fluorosurfactant mixturesThe height recorded was started aftequilibrium conditions were attained~a! 0.3% ~w/v! solution of Zonyl®FSD ~100%!; ~b! 0.3% ~w/v! solutionof a mixture of Zonyl®FSD-Zonyl®FSN ~75:25!; ~c! 0.3% ~w/v! solutionof a mixture of Zonyl® FSD-Zonyl®FSN ~50:50!; ~d! 0.3% ~w/v! solutionof a mixture of Zonyl® FSD-Zonyl®FSN ~25:75! and,~e! 0.3% ~w/v! solu-tion of Zonyl® FSN~100%!.
mtho
a-ene
lt-ion
eeex
tear
ns-
o
nt
nt
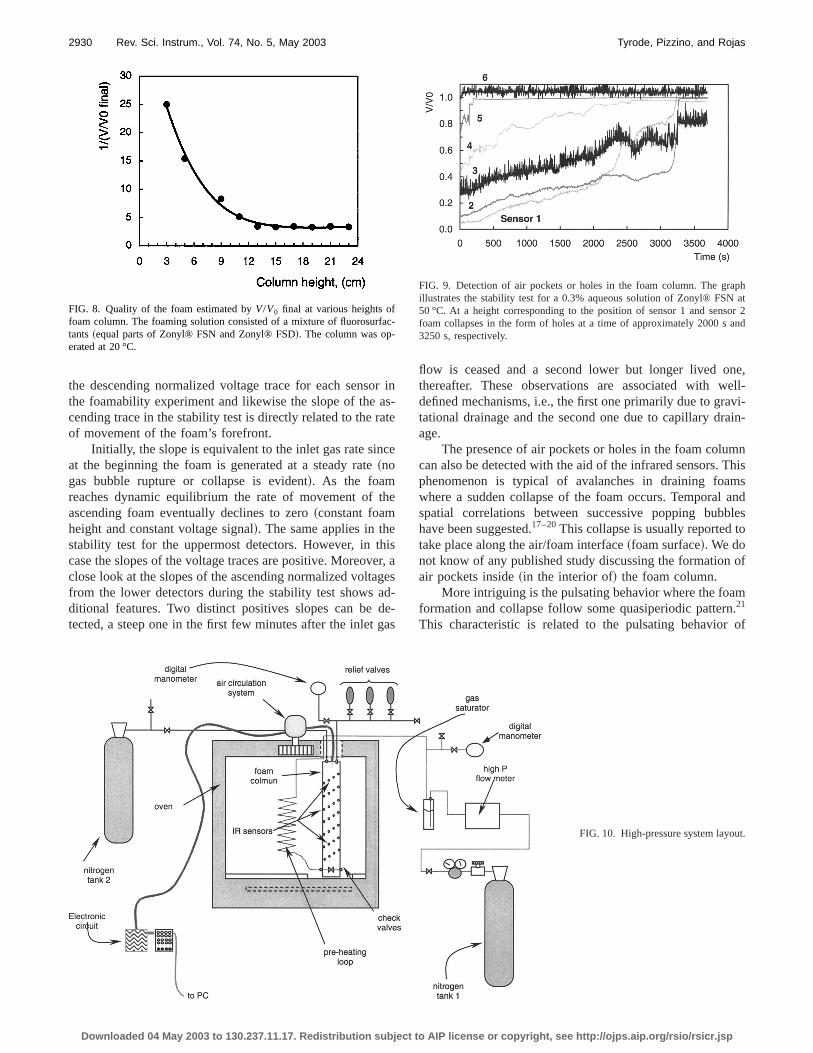
mation of the foam quality. In reservoir conditions foaquality plays an important role since it has been shownfoam mobility and foam resistance factors depend directlyfoam quality.15 Foam quality is usually estimated by evalution of the water content change calculated by measuremof its specific conductivity.16 It is therefore possible to takthe numerical values ofV/V0 as another way to report foamquality. In fact, since the electrolytic conductivity and voage are inversely related an obvious choice of this relatship is 1/V, or better, 1/(V/V0). As such, Fig. 8 shows thevariation of the inverse of the normalized voltage with rspect to the column height. From this figure it can be sthat foam quality decays rapidly and it becomes appromately constant, in this particular system, at a height of;13cm and above. If other variables, such as column diamebubble size, refractive index and infrared wavelengthconsidered, absolute values could be calculated.
Raw data as those depicted in Fig. 4 can be further alyzed in order to obtain additional information. As an illutration let us consider the graphs in this figure. The slope
Downloaded 04 May 2003 to 130.237.11.17. Redistribution subject to A
atn
ts
-
-ni-
r,e
a-
f
FIG. 7. Stability three-dimensional curves for different fluorosurfactamixtures ~foam stability-temperature-surfactant composition!. The stabilitywas estimated from the normalized foam height~with respect to the initialequilibrium height! at 3600 s. The graph shows the stability for differetemperatures and different surfactant compositions~Zonyl® FSD and Zo-nyl® FSN mixed in different ratios in solutions of 0.3%~w/v! total concen-tration!.
IP license or copyright, see http://ojps.aip.org/rsio/rsicr.jsp
rasat
c
th
ehieg
addeg
ne,ell-vi-
ain-
mnThismsandbleso
of
m.of
phat
or 2andac
2930 Rev. Sci. Instrum., Vol. 74, No. 5, May 2003 Tyrode, Pizzino, and Rojas
the descending normalized voltage trace for each sensothe foamability experiment and likewise the slope of thecending trace in the stability test is directly related to the rof movement of the foam’s forefront.
Initially, the slope is equivalent to the inlet gas rate sinat the beginning the foam is generated at a steady rate~nogas bubble rupture or collapse is evident!. As the foamreaches dynamic equilibrium the rate of movement ofascending foam eventually declines to zero~constant foamheight and constant voltage signal!. The same applies in thstability test for the uppermost detectors. However, in tcase the slopes of the voltage traces are positive. Moreovclose look at the slopes of the ascending normalized voltafrom the lower detectors during the stability test showsditional features. Two distinct positives slopes can betected, a steep one in the first few minutes after the inlet
FIG. 8. Quality of the foam estimated byV/V0 final at various heights offoam column. The foaming solution consisted of a mixture of fluorosurftants~equal parts of Zonyl® FSN and Zonyl® FSD!. The column was op-erated at 20 °C.
Downloaded 04 May 2003 to 130.237.11.17. Redistribution subject to A
in-e
e
e
sr, aes--
as
flow is ceased and a second lower but longer lived othereafter. These observations are associated with wdefined mechanisms, i.e., the first one primarily due to gratational drainage and the second one due to capillary drage.
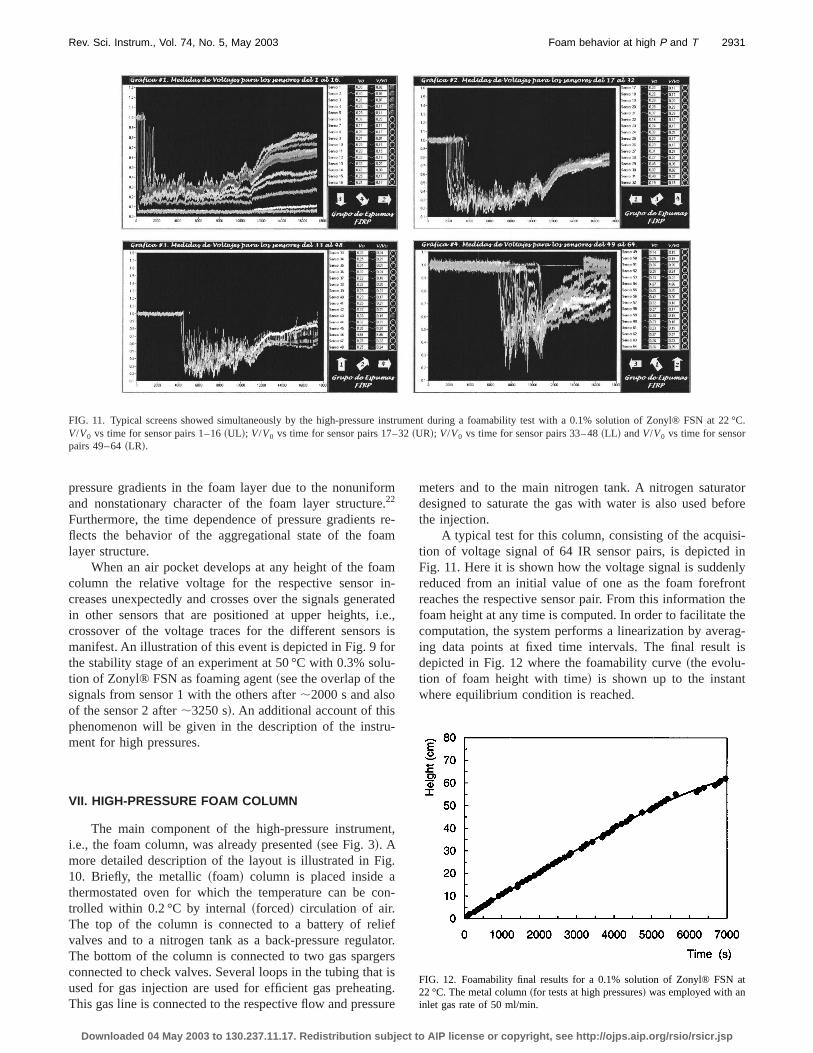
The presence of air pockets or holes in the foam colucan also be detected with the aid of the infrared sensors.phenomenon is typical of avalanches in draining foawhere a sudden collapse of the foam occurs. Temporalspatial correlations between successive popping bubhave been suggested.17–20This collapse is usually reported ttake place along the air/foam interface~foam surface!. We donot know of any published study discussing the formationair pockets inside~in the interior of! the foam column.
More intriguing is the pulsating behavior where the foaformation and collapse follow some quasiperiodic pattern21
This characteristic is related to the pulsating behavior
FIG. 9. Detection of air pockets or holes in the foam column. The graillustrates the stability test for a 0.3% aqueous solution of Zonyl® FSN50 °C. At a height corresponding to the position of sensor 1 and sensfoam collapses in the form of holes at a time of approximately 2000 s3250 s, respectively.
-
t.
FIG. 10. High-pressure system layouIP license or copyright, see http://ojps.aip.org/rsio/rsicr.jsp
at 22 °C.
2931Rev. Sci. Instrum., Vol. 74, No. 5, May 2003 Foam behavior at high P and T
FIG. 11. Typical screens showed simultaneously by the high-pressure instrument during a foamability test with a 0.1% solution of Zonyl® FSNV/V0 vs time for sensor pairs 1–16~UL!; V/V0 vs time for sensor pairs 17–32~UR!; V/V0 vs time for sensor pairs 33–48~LL ! andV/V0 vs time for sensorpairs 49–64~LR!.
ore.sa
aminrai.sorlu
ru
n
ig
o
lieate
atinsu
torfore
i-in
nlyntthe
heag-is
t
at
pressure gradients in the foam layer due to the nonunifand nonstationary character of the foam layer structur22
Furthermore, the time dependence of pressure gradientflects the behavior of the aggregational state of the folayer structure.
When an air pocket develops at any height of the focolumn the relative voltage for the respective sensorcreases unexpectedly and crosses over the signals genein other sensors that are positioned at upper heights,crossover of the voltage traces for the different sensormanifest. An illustration of this event is depicted in Fig. 9 fthe stability stage of an experiment at 50 °C with 0.3% sotion of Zonyl® FSN as foaming agent~see the overlap of thesignals from sensor 1 with the others after;2000 s and alsoof the sensor 2 after;3250 s!. An additional account of thisphenomenon will be given in the description of the instment for high pressures.
VII. HIGH-PRESSURE FOAM COLUMN
The main component of the high-pressure instrumei.e., the foam column, was already presented~see Fig. 3!. Amore detailed description of the layout is illustrated in F10. Briefly, the metallic~foam! column is placed inside athermostated oven for which the temperature can be ctrolled within 0.2 °C by internal~forced! circulation of air.The top of the column is connected to a battery of revalves and to a nitrogen tank as a back-pressure regulThe bottom of the column is connected to two gas spargconnected to check valves. Several loops in the tubing thused for gas injection are used for efficient gas preheatThis gas line is connected to the respective flow and pres
Downloaded 04 May 2003 to 130.237.11.17. Redistribution subject to A
m
re-m
-ted
e.,is
-
-
t,
.
n-
for.rsisg.re
meters and to the main nitrogen tank. A nitrogen saturadesigned to saturate the gas with water is also used bethe injection.
A typical test for this column, consisting of the acquistion of voltage signal of 64 IR sensor pairs, is depictedFig. 11. Here it is shown how the voltage signal is suddereduced from an initial value of one as the foam forefroreaches the respective sensor pair. From this informationfoam height at any time is computed. In order to facilitate tcomputation, the system performs a linearization by avering data points at fixed time intervals. The final resultdepicted in Fig. 12 where the foamability curve~the evolu-tion of foam height with time! is shown up to the instanwhere equilibrium condition is reached.
FIG. 12. Foamability final results for a 0.1% solution of Zonyl® FSN22 °C. The metal column~for tests at high pressures! was employed with aninlet gas rate of 50 ml/min.
IP license or copyright, see http://ojps.aip.org/rsio/rsicr.jsp

nt
taa
tu
n
r-andheon
o-Phorsdthe
-
of
ud.
P.
oon,
ym-3.
., A
ho-
ett.
hys.
kl.
tio
oet t
2932 Rev. Sci. Instrum., Vol. 74, No. 5, May 2003 Tyrode, Pizzino, and Rojas
Figure 13 shows the condition of the column at the eof the stability test for 0.1% solution of Zonyl® FSN a22 °C. As it becomes clear, during its collapse this surfacsolution exhibits an uneven foam collapse, i.e., regions ofpockets are produced amid the rest of the foam. This si
FIG. 13. State of the column at the end of the stability test for 0.1% soluof Zonyl® FSN at 22 °C. This state was reached after;5500 s of stoppingthe gas injection at the end of the foamability test~when equilibrium con-ditions were reached!. The white segments represent the regions of the cumn where no foam is present~air pockets!. The labels on the sides of thcolumn represent the sensor number identification: 1 for the IR sensor abottom and S64 for the sensor pair at the top of the column.
Downloaded 04 May 2003 to 130.237.11.17. Redistribution subject to A
d
ntira-
tion was reached after;5500 s of stopping the gas injectioat the end of the foamability test~when equilibrium condi-tions were reached!.
The results from the operation of the column for diffeent surfactants under extreme conditions of pressuretemperature will be reported in a following article where tdiscussion will be focused on the effect of these variablesthe foam behavior.
ACKNOWLEDGMENTS
The authors wish to thank the ‘‘CONICIT-Agenda Petrleo’’ Program and the CDCHT-ULA for sponsoring the FIRlaboratory research program in surface science. The autalso wish to thank the CITEC-ULA for their valuable anconstant support in the design and building stages ofcolumn for high pressures.
1D. C. Bond and O. C. Holbrook, U.S. Patent No. 2,866,507~30 December1958!.
2D. Exerowa and P. Kruglyakov,Foam and Foam Films: Theory, Experiments and Application~Elsevier, Amsterdam, 1998!.
3J. J. Bikerman, Trans. Faraday Soc.34, 634 ~1938!.4ASTM D 1173-53~2001! Standard Test Method for Foaming PropertiesSurface-Active Agents, 2001.
5C. Guillerme, W. Loisel, D. Bertrand, and Y. Popineau, J. Texture St24, 287 ~1993!.
6H. Razafindralambo, M. Paquot, A. Baniel, Y. Popineau, C. Hbid,Jacques, and P. Thonart, Food Hydrocolloids11, 59 ~1997!.
7A. Fains, D. Bertrand, A. Baniel, and Y. Popineau, Food Hydrocolloids11,63 ~1997!.
8S. S. Marsden, Soc. Pet. Eng. J.6, 17 ~1966!.9P. Persoff, C. J. Radke, K. Pruess, S. M. Benson, and P. A. WitherspSPE Reservoir Eng.6, 365 ~1991!.
10T. Holt, F. Vassenden, and I. Svorstol, Proceedingws SPE/DOE 11th Sposium on Improved Oil Recovery, Tulsa, OK, 21–24 April 1996, p. 54
11B. B. Maini and V. J. Ma, J. Can. Pet. Technol.25, 65 ~1986!.12L. Du, A. Prokop, and R. D. Tanner, J. Colloid Interface Sci.248, 487
~2002!.13E. Iglesias, J. Anderez, A. Forgiarini, and J. L. Salager, Colloids Surf
98, 167 ~1995!.14H. Razafindralambo, Y. Popineau, M. Deleu, C. Hbid, P. Jacques, P. T
nart, and M. Paquot, Langmuir13, 6026~1997!.15S.-H. Chang and R. B. Grigg, SPE Reservoir Eng.2, 248 ~1999!.16K. Khristov, P. Kruglyakov, and D. Ekherova, Colloid Polym. Sci.257,
506 ~1979!.17N. Vandewalle and J. F. Lentz, Phys. Rev. E64, 0215071~2001!.18N. Vandewalle, J. F. Lentz, S. Dorbolo, and F. Brisbois, Phys. Rev. L
86, 179 ~2000!.19W. Muller and J.-M. Di Meglio, J. Phys.: Condens. Matter11, L209
~1999!.20Y. Jiang, P. J. Swart, A. Saxena, M. Asipauskas, and J. A. Glazier, P
Rev. E59, 5819~1999!.21C. Rodrı́guez, M.S. thesis, Universidad de Los Andes, 1998.22I. P. Mukhlenov, E. Y. Tarat, S. N. Engibaryan, and A. T. Bartov, Zh. Pri
Khim. ~St.-Petersburg! 48, 1010~1975!.
n
l-
he
IP license or copyright, see http://ojps.aip.org/rsio/rsicr.jsp