Embed Size (px)
Citation preview
FOCUS ON EUROPEAN ECONOMIC INTEGRATION Q3/20 7
A sleeping beauty or a dead duck? The state of capital market development in CESEE EU Member States
Thomas Reininger, Zoltan Walko1
For quite some while, there have been high expectations that stronger capital markets could generate a broader range of financing sources and reduce the buildup of vulnerabilities for the corporate sector in European Union Member States in Central, Eastern and Southeastern Europe (CESEE). These expectations prompted various supportive measures by international institutions, national authorities and market participants over the past 10 to 15 years. However, despite these efforts, capital market developments in the region have been far from dynamic over the past decade. Capital markets continue to be substantially less developed than in the euro area and the U.S.A., judging from the balances of debt securities, listed shares and invest-ment fund shares outstanding both in relation to GDP and as a share of total financial liabilities. Even taken together, these three types of securities account for a smaller portion of total f inancial liabilities than loans, with loan penetration levels (loans as a percentage of GDP) already approaching euro area and U.S. levels. Data on financial flows show narrower gaps with the euro area for funding via debt securities, but issuance is dominated by government entities. Analyzing the financial liabilities of nonfinancial corporations, we find some relevance for listed shares only in Poland and Croatia (but less of a relevance than in the euro area) and a negligible role for debt securities (with the euro being the dominant issuing currency in most non-euro area CESEE EU Member States). The predominantly bank-based nature of the finan-cial systems of the CESEE EU Member States is also confirmed by the fact that the total assets of nonbank financial institutions are well below the level of domestic bank credit to the private sector, thus playing a relatively smaller role in financial intermediation than in the euro area and the U.S.A. In view of this evidence, we review the key factors which have so far pre-vented a more dynamic development, describe major efforts undertaken to overcome these detrimental factors and synthesize proposals by various institutions for future action to deepen local capital markets in the region, including in the context of the European Union’s capital markets union.
JEL classification: D14, D18, D31, D63, E44, G21, G28, H81Keywords: CESEE, capital markets, financial intermediation, European Union, capital markets union
Calls and hopes for developing local capital markets have accompanied EU Member States in Central and Eastern Europe since the early phase of transition to market economies. This is not surprising, given the extensive literature about the favorable impact of capital markets on economic development via better access to finance for the corporate sector, especially for small and medium-sized enterprises (SMEs). In CESEE, expectations soon emerged that local capital market funding could become an alternative to credit provided by the predominantly foreign-owned local banking sectors, thus making the countries less vulnerable to decisions taken at headquar-ters abroad. Amid substantial deleveraging by foreign banks operating in CESEE in the years following the most intense phase of the Great Financial Crisis, the rele-vance of more diversified financing forms may have risen further. Add to this the
1 Oesterreichische Nationalbank (OeNB), Foreign Research Division, [email protected], [email protected]. Opinions expressed in this paper do not necessarily reflect the official viewpoint of the OeNB or of the Eurosystem. We are thankful to an anonymous referee who helped improve an earlier version of this paper and to our colleagues at the OeNB for their useful comments.
A sleeping beauty or a dead duck? The state of capital market development in CESEE EU Member States
8 OESTERREICHISCHE NATIONALBANK
change in the banking model in the region over the past few years away from for-eign-financed to domestically financed credit growth, the tightening of bank reg-ulation and supervision, and more risk awareness on the side of banks. Thus, the volume of available credit in the region over the medium term may have become more constrained, potentially leading to (increasing) credit demand-supply gaps. Against this background, it has been estimated that “deeper capital markets in Central and Eastern Europe could unlock more than EUR 200 bn in long-term capital, deliver more than EUR 40 bn a year of extra funding for companies, and help restore rapid economic growth across the region.”2
This descriptive study gives a comparative overview of the status quo of key segments of the local capital markets in CESEE EU Member States and of major developments since 2010. To complete the picture, we often distinguish between euro area members and nonmembers, and we provide comparisons with euro area and U.S. totals. We draw on a variety of data sources, such as quarterly financial balance sheets, securities statistics and securities exchange-trading statistics published by the ECB, the World Bank’s Global Financial Development database, the IMF’s Financial Development Index and market statistics provided by – among others – the World Federation of Exchanges and the Federation of European Secu-rities Exchanges. Note that we did not intend to analyze in detail, e.g. economet-rically, the determinants of capital market development.
In what follows, section 1 provides the big picture view using the IMF’s Financial Development Index. Section 2 adds insights from financial sector accounts data into the role of securities as a financing instrument in CESEE, for the national economies as a whole and for individual sectors. Section 3 cross-checks this infor-mation with World Bank data on the role of the nonbank financial sector in financial intermediation. Section 4 discusses structural issues of capital market development in CESEE EU Member States, covering impediments to development and efforts made so far, and highlighting potential ways forward. Section 5 provides a conclud-ing overview.
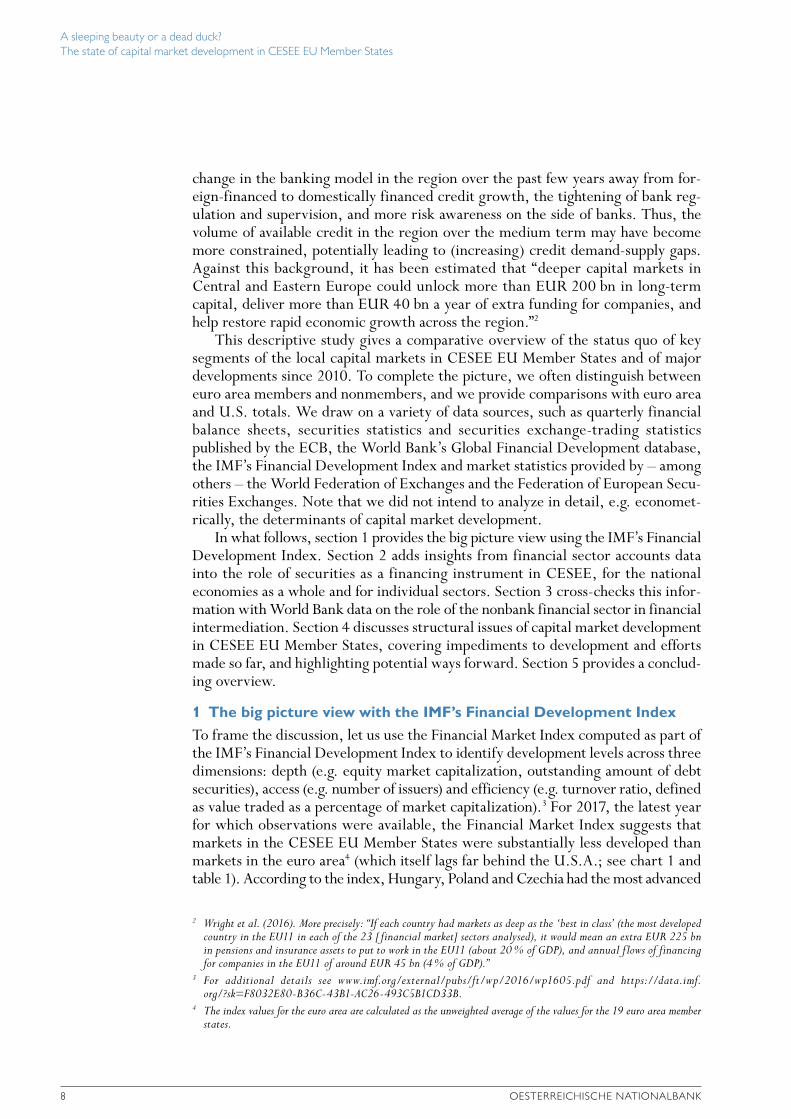
1 The big picture view with the IMF’s Financial Development IndexTo frame the discussion, let us use the Financial Market Index computed as part of the IMF’s Financial Development Index to identify development levels across three dimensions: depth (e.g. equity market capitalization, outstanding amount of debt securities), access (e.g. number of issuers) and efficiency (e.g. turnover ratio, defined as value traded as a percentage of market capitalization).3 For 2017, the latest year for which observations were available, the Financial Market Index suggests that markets in the CESEE EU Member States were substantially less developed than markets in the euro area4 (which itself lags far behind the U.S.A.; see chart 1 and table 1). According to the index, Hungary, Poland and Czechia had the most advanced
2 Wright et al. (2016). More precisely: “If each country had markets as deep as the ‘best in class’ (the most developed country in the EU11 in each of the 23 [ financial market] sectors analysed), it would mean an extra EUR 225 bn in pensions and insurance assets to put to work in the EU11 (about 20 % of GDP), and annual flows of financing for companies in the EU11 of around EUR 45 bn (4 % of GDP).”
3 For additional details see www.imf.org/external/pubs/ft/wp/2016/wp1605.pdf and https://data.imf.org/?sk=F8032E80-B36C-43B1-AC26-493C5B1CD33B.
4 The index values for the euro area are calculated as the unweighted average of the values for the 19 euro area member states.
A sleeping beauty or a dead duck? The state of capital market development in CESEE EU Member States
FOCUS ON EUROPEAN ECONOMIC INTEGRATION Q3/20 9
financial markets in the region in 2017.5 Between 2010 and 2017, development levels decreased in the vast majority of CESEE countries and dropped markedly in Hungary and Slovenia, despite efforts by local authorities, international financial institutions and the financial industry itself. The gaps vis-à-vis the euro area narrowed modestly in this period (with the exception of Hungary and Slovenia) due to a simul-taneous decline in the euro area. Progress has been mixed across countries and uneven across time, even when we go back further than 2010 (i.e. to 1995).
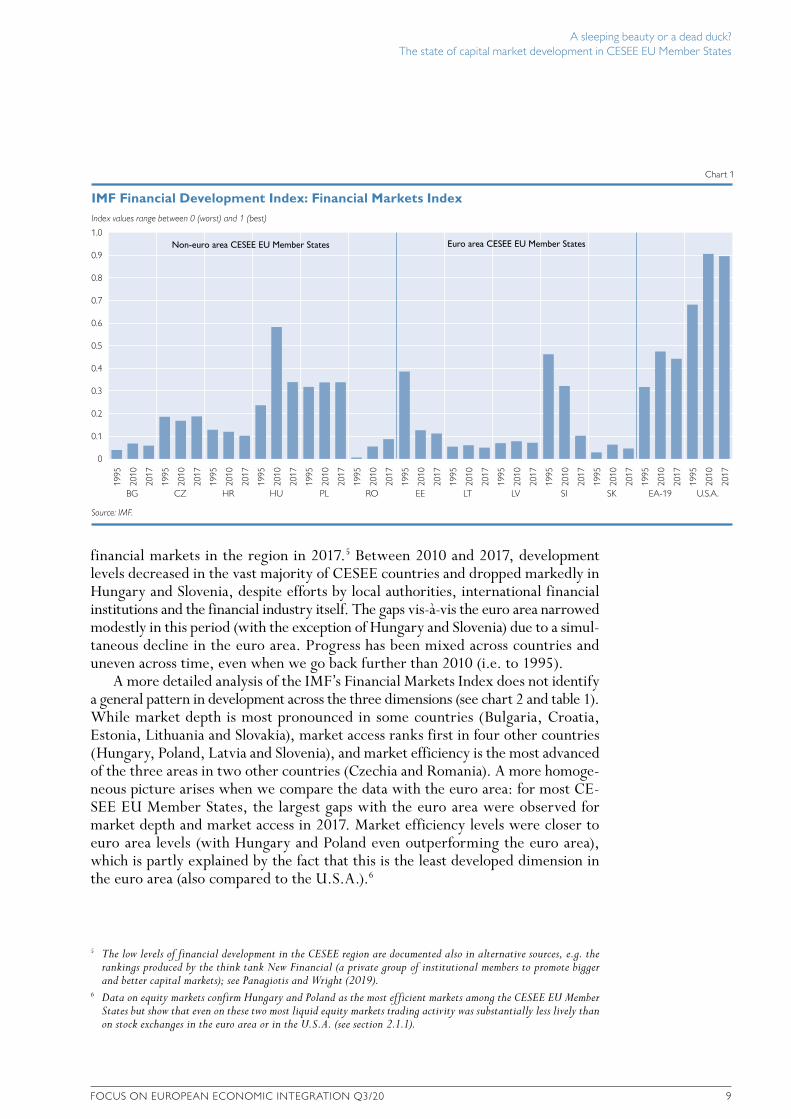
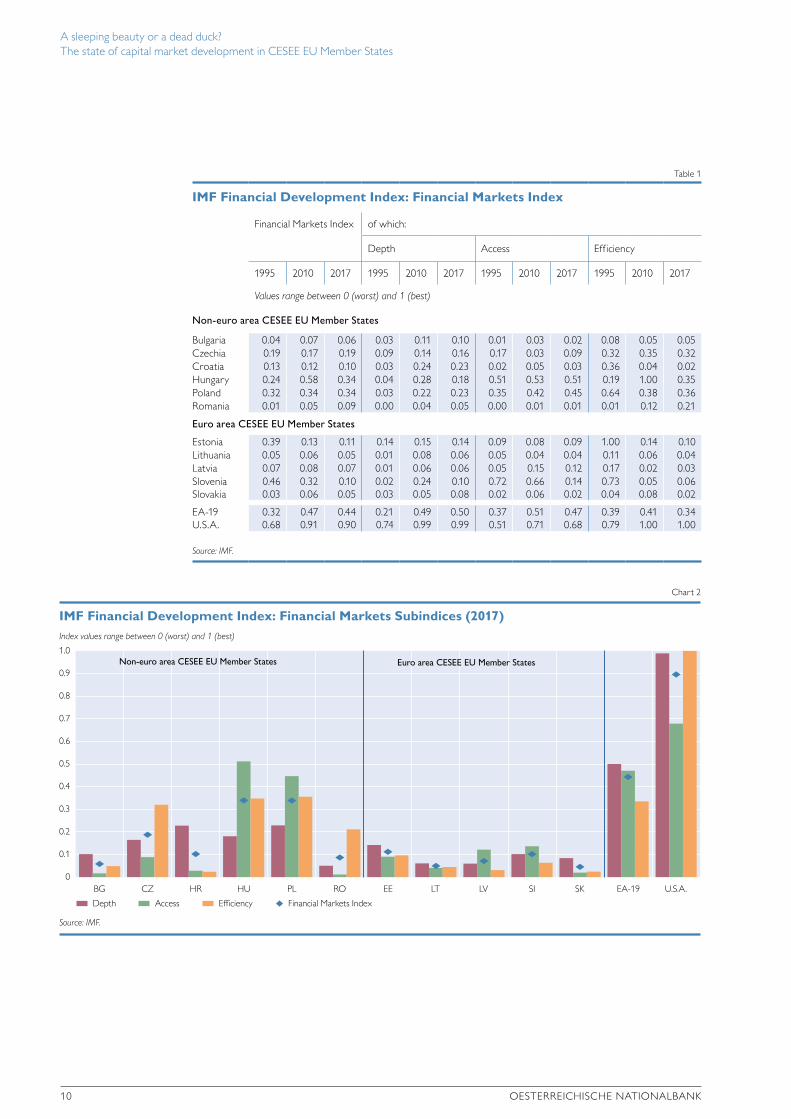
A more detailed analysis of the IMF’s Financial Markets Index does not identify a general pattern in development across the three dimensions (see chart 2 and table 1). While market depth is most pronounced in some countries (Bulgaria, Croatia, Estonia, Lithuania and Slovakia), market access ranks first in four other countries (Hungary, Poland, Latvia and Slovenia), and market efficiency is the most advanced of the three areas in two other countries (Czechia and Romania). A more homoge-neous picture arises when we compare the data with the euro area: for most CE-SEE EU Member States, the largest gaps with the euro area were observed for market depth and market access in 2017. Market efficiency levels were closer to euro area levels (with Hungary and Poland even outperforming the euro area), which is partly explained by the fact that this is the least developed dimension in the euro area (also compared to the U.S.A.).6
5 The low levels of financial development in the CESEE region are documented also in alternative sources, e.g. the rankings produced by the think tank New Financial (a private group of institutional members to promote bigger and better capital markets); see Panagiotis and Wright (2019).
6 Data on equity markets confirm Hungary and Poland as the most efficient markets among the CESEE EU Member States but show that even on these two most liquid equity markets trading activity was substantially less lively than on stock exchanges in the euro area or in the U.S.A. (see section 2.1.1).
Index values range between 0 (worst) and 1 (best)
1.0
0.9
0.8
0.7
0.6
0.5
0.4
0.3
0.2
0.1
0
IMF Financial Development Index: Financial Markets Index
Chart 1
Source: IMF.
1995
2010
2017
1995
2010
2017
1995
2010
2017
1995
2010
2017
1995
2010
2017
1995
2010
2017
1995
2010
2017
1995
2010
2017
1995
2010
2017
1995
2010
2017
1995
2010
2017
1995
2010
2017
1995
2010
2017
BG CZ HR HU PL RO EE LT LV SI SK EA-19 U.S.A.
Non-euro area CESEE EU Member States Euro area CESEE EU Member States
A sleeping beauty or a dead duck? The state of capital market development in CESEE EU Member States
10 OESTERREICHISCHE NATIONALBANK
2 Digging into balance sheet data: the role of securities as a financing instrument
2.1 The role of securities in financing the economy as a whole
For a detailed analysis, we first look at financial sector accounts data for the CESEE EU Member States, i.e. financial balance sheet information about the economies’ liability structures. The financial sector accounts capture annual capital flows into the various types of financing instruments and the resulting stocks for each econ-omy as a whole and for its individual sectors. The following discussion concentrates on the three types of securities which are mostly tradable, i.e. debt securities, listed shares and investment fund shares. Unfortunately, these statistics – as of to-day – do not contain information about the creditors/holders of securities (e.g. data indicating to which sector they belong or whether they are residents or non-residents) or about the currency of denomination, nor do they reflect whether the securities were issued on the domestic capital market or abroad.
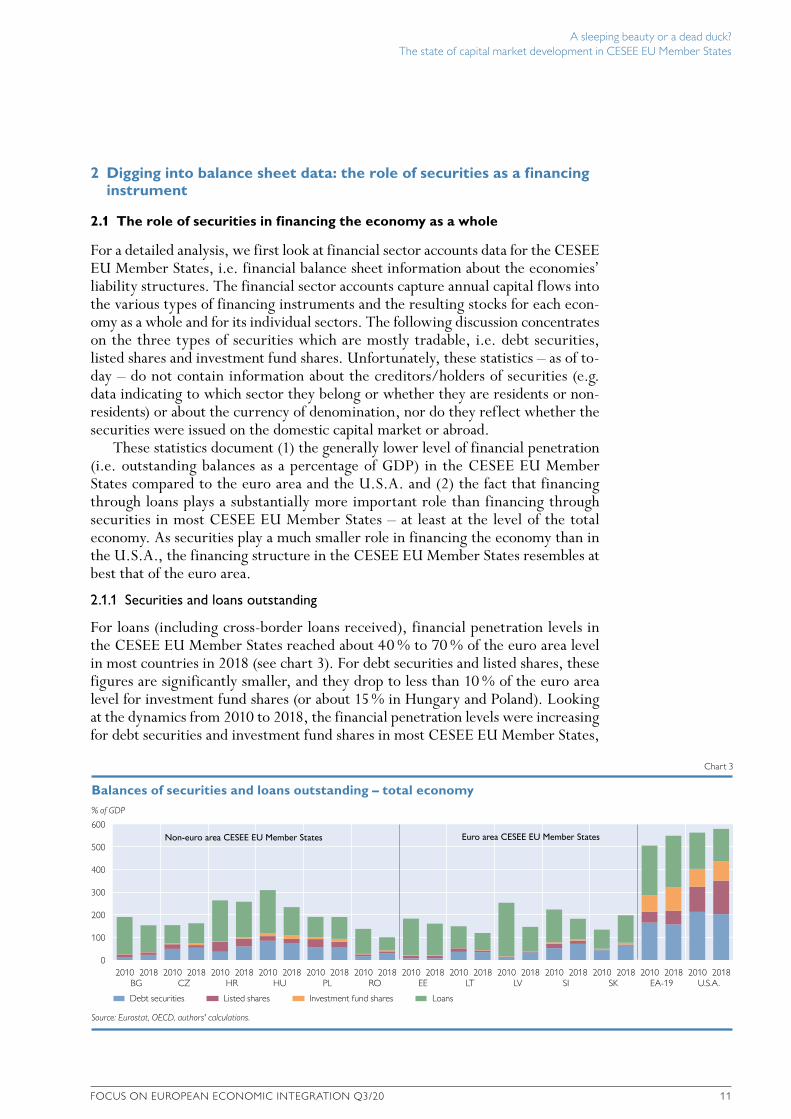
These statistics document (1) the generally lower level of financial penetration (i.e. outstanding balances as a percentage of GDP) in the CESEE EU Member States compared to the euro area and the U.S.A. and (2) the fact that financing through loans plays a substantially more important role than financing through securities in most CESEE EU Member States – at least at the level of the total economy. As securities play a much smaller role in financing the economy than in the U.S.A., the financing structure in the CESEE EU Member States resembles at best that of the euro area.
2.1.1 Securities and loans outstanding
For loans (including cross-border loans received), financial penetration levels in the CESEE EU Member States reached about 40 % to 70 % of the euro area level in most countries in 2018 (see chart 3). For debt securities and listed shares, these figures are significantly smaller, and they drop to less than 10 % of the euro area level for investment fund shares (or about 15 % in Hungary and Poland). Looking at the dynamics from 2010 to 2018, the financial penetration levels were increasing for debt securities and investment fund shares in most CESEE EU Member States,
Index values range between 0 (worst) and 1 (best)
1.0
0.9
0.8
0.7
0.6
0.5
0.4
0.3
0.2
0.1
0
IMF Financial Development Index: Financial Markets Subindices (2017)
Chart 2
Source: IMF.
Depth Access Efficiency Financial Markets Index
BG CZ HR HU PL RO EE LT LV SI SK EA-19 U.S.A.
Non-euro area CESEE EU Member States Euro area CESEE EU Member States
Table 1
IMF Financial Development Index: Financial Markets Index
Financial Markets Index of which:
Depth Access Efficiency
1995 2010 2017 1995 2010 2017 1995 2010 2017 1995 2010 2017
Values range between 0 (worst) and 1 (best)
Non-euro area CESEE EU Member States
Bulgaria 0.04 0.07 0.06 0.03 0.11 0.10 0.01 0.03 0.02 0.08 0.05 0.05 Czechia 0.19 0.17 0.19 0.09 0.14 0.16 0.17 0.03 0.09 0.32 0.35 0.32 Croatia 0.13 0.12 0.10 0.03 0.24 0.23 0.02 0.05 0.03 0.36 0.04 0.02 Hungary 0.24 0.58 0.34 0.04 0.28 0.18 0.51 0.53 0.51 0.19 1.00 0.35 Poland 0.32 0.34 0.34 0.03 0.22 0.23 0.35 0.42 0.45 0.64 0.38 0.36 Romania 0.01 0.05 0.09 0.00 0.04 0.05 0.00 0.01 0.01 0.01 0.12 0.21
Euro area CESEE EU Member States
Estonia 0.39 0.13 0.11 0.14 0.15 0.14 0.09 0.08 0.09 1.00 0.14 0.10 Lithuania 0.05 0.06 0.05 0.01 0.08 0.06 0.05 0.04 0.04 0.11 0.06 0.04 Latvia 0.07 0.08 0.07 0.01 0.06 0.06 0.05 0.15 0.12 0.17 0.02 0.03 Slovenia 0.46 0.32 0.10 0.02 0.24 0.10 0.72 0.66 0.14 0.73 0.05 0.06 Slovakia 0.03 0.06 0.05 0.03 0.05 0.08 0.02 0.06 0.02 0.04 0.08 0.02
EA-19 0.32 0.47 0.44 0.21 0.49 0.50 0.37 0.51 0.47 0.39 0.41 0.34 U.S.A. 0.68 0.91 0.90 0.74 0.99 0.99 0.51 0.71 0.68 0.79 1.00 1.00
Source: IMF.
% of GDP
600
500
400
300
200
100
0
Balances of securities and loans outstanding – total economy
Chart 3
Source: Eurostat, OECD, authors' calculations.
Debt securities Listed shares Investment fund shares Loans
Non-euro area CESEE EU Member States Euro area CESEE EU Member States
2010 2018 2010 2018 2010 2018 2010 2018 2010 2018 2010 2018 2010 2018 2010 2018 2010 2018 2010 2018 2010 2018 2010 2018 2010 2018BG CZ HR HU PL RO EE LT LV SI SK EA-19 U.S.A.
Non-euro area CESEE EU Member States Euro area CESEE EU Member States
A sleeping beauty or a dead duck? The state of capital market development in CESEE EU Member States
FOCUS ON EUROPEAN ECONOMIC INTEGRATION Q3/20 11
2 Digging into balance sheet data: the role of securities as a financing instrument
2.1 The role of securities in financing the economy as a whole
For a detailed analysis, we first look at financial sector accounts data for the CESEE EU Member States, i.e. financial balance sheet information about the economies’ liability structures. The financial sector accounts capture annual capital flows into the various types of financing instruments and the resulting stocks for each econ-omy as a whole and for its individual sectors. The following discussion concentrates on the three types of securities which are mostly tradable, i.e. debt securities, listed shares and investment fund shares. Unfortunately, these statistics – as of to-day – do not contain information about the creditors/holders of securities (e.g. data indicating to which sector they belong or whether they are residents or non-residents) or about the currency of denomination, nor do they reflect whether the securities were issued on the domestic capital market or abroad.
These statistics document (1) the generally lower level of financial penetration (i.e. outstanding balances as a percentage of GDP) in the CESEE EU Member States compared to the euro area and the U.S.A. and (2) the fact that financing through loans plays a substantially more important role than financing through securities in most CESEE EU Member States – at least at the level of the total economy. As securities play a much smaller role in financing the economy than in the U.S.A., the financing structure in the CESEE EU Member States resembles at best that of the euro area.
2.1.1 Securities and loans outstanding
For loans (including cross-border loans received), financial penetration levels in the CESEE EU Member States reached about 40 % to 70 % of the euro area level in most countries in 2018 (see chart 3). For debt securities and listed shares, these figures are significantly smaller, and they drop to less than 10 % of the euro area level for investment fund shares (or about 15 % in Hungary and Poland). Looking at the dynamics from 2010 to 2018, the financial penetration levels were increasing for debt securities and investment fund shares in most CESEE EU Member States,
Index values range between 0 (worst) and 1 (best)
1.0
0.9
0.8
0.7
0.6
0.5
0.4
0.3
0.2
0.1
0
IMF Financial Development Index: Financial Markets Subindices (2017)
Chart 2
Source: IMF.
Depth Access Efficiency Financial Markets Index
BG CZ HR HU PL RO EE LT LV SI SK EA-19 U.S.A.
Non-euro area CESEE EU Member States Euro area CESEE EU Member States
Table 1
IMF Financial Development Index: Financial Markets Index
Financial Markets Index of which:
Depth Access Efficiency
1995 2010 2017 1995 2010 2017 1995 2010 2017 1995 2010 2017
Values range between 0 (worst) and 1 (best)
Non-euro area CESEE EU Member States
Bulgaria 0.04 0.07 0.06 0.03 0.11 0.10 0.01 0.03 0.02 0.08 0.05 0.05 Czechia 0.19 0.17 0.19 0.09 0.14 0.16 0.17 0.03 0.09 0.32 0.35 0.32 Croatia 0.13 0.12 0.10 0.03 0.24 0.23 0.02 0.05 0.03 0.36 0.04 0.02 Hungary 0.24 0.58 0.34 0.04 0.28 0.18 0.51 0.53 0.51 0.19 1.00 0.35 Poland 0.32 0.34 0.34 0.03 0.22 0.23 0.35 0.42 0.45 0.64 0.38 0.36 Romania 0.01 0.05 0.09 0.00 0.04 0.05 0.00 0.01 0.01 0.01 0.12 0.21
Euro area CESEE EU Member States
Estonia 0.39 0.13 0.11 0.14 0.15 0.14 0.09 0.08 0.09 1.00 0.14 0.10 Lithuania 0.05 0.06 0.05 0.01 0.08 0.06 0.05 0.04 0.04 0.11 0.06 0.04 Latvia 0.07 0.08 0.07 0.01 0.06 0.06 0.05 0.15 0.12 0.17 0.02 0.03 Slovenia 0.46 0.32 0.10 0.02 0.24 0.10 0.72 0.66 0.14 0.73 0.05 0.06 Slovakia 0.03 0.06 0.05 0.03 0.05 0.08 0.02 0.06 0.02 0.04 0.08 0.02
EA-19 0.32 0.47 0.44 0.21 0.49 0.50 0.37 0.51 0.47 0.39 0.41 0.34 U.S.A. 0.68 0.91 0.90 0.74 0.99 0.99 0.51 0.71 0.68 0.79 1.00 1.00
Source: IMF.
% of GDP
600
500
400
300
200
100
0
Balances of securities and loans outstanding – total economy
Chart 3
Source: Eurostat, OECD, authors' calculations.
Debt securities Listed shares Investment fund shares Loans
Non-euro area CESEE EU Member States Euro area CESEE EU Member States
2010 2018 2010 2018 2010 2018 2010 2018 2010 2018 2010 2018 2010 2018 2010 2018 2010 2018 2010 2018 2010 2018 2010 2018 2010 2018BG CZ HR HU PL RO EE LT LV SI SK EA-19 U.S.A.
Non-euro area CESEE EU Member States Euro area CESEE EU Member States
A sleeping beauty or a dead duck? The state of capital market development in CESEE EU Member States
12 OESTERREICHISCHE NATIONALBANK
while decreasing for listed shares (in part due to adverse stock price movements) and – with the exception of Czechia, Poland and Slovakia – for loans (including cross-border loans received). A similar pattern emerges for the relative levels com-pared to the euro area, subject to smaller increases for debt securities and invest-ment fund shares.
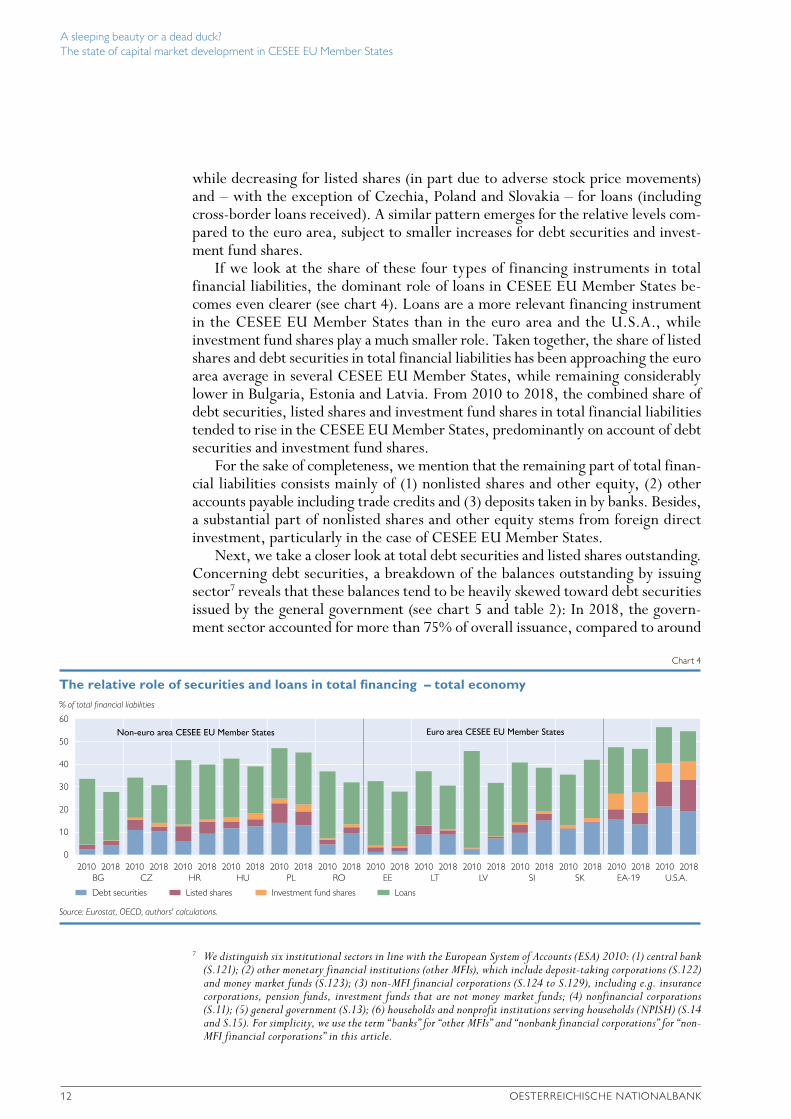
If we look at the share of these four types of financing instruments in total financial liabilities, the dominant role of loans in CESEE EU Member States be-comes even clearer (see chart 4). Loans are a more relevant financing instrument in the CESEE EU Member States than in the euro area and the U.S.A., while investment fund shares play a much smaller role. Taken together, the share of listed shares and debt securities in total financial liabilities has been approaching the euro area average in several CESEE EU Member States, while remaining considerably lower in Bulgaria, Estonia and Latvia. From 2010 to 2018, the combined share of debt securities, listed shares and investment fund shares in total financial liabilities tended to rise in the CESEE EU Member States, predominantly on account of debt securities and investment fund shares.
For the sake of completeness, we mention that the remaining part of total finan-cial liabilities consists mainly of (1) nonlisted shares and other equity, (2) other accounts payable including trade credits and (3) deposits taken in by banks. Besides, a substantial part of nonlisted shares and other equity stems from foreign direct investment, particularly in the case of CESEE EU Member States.
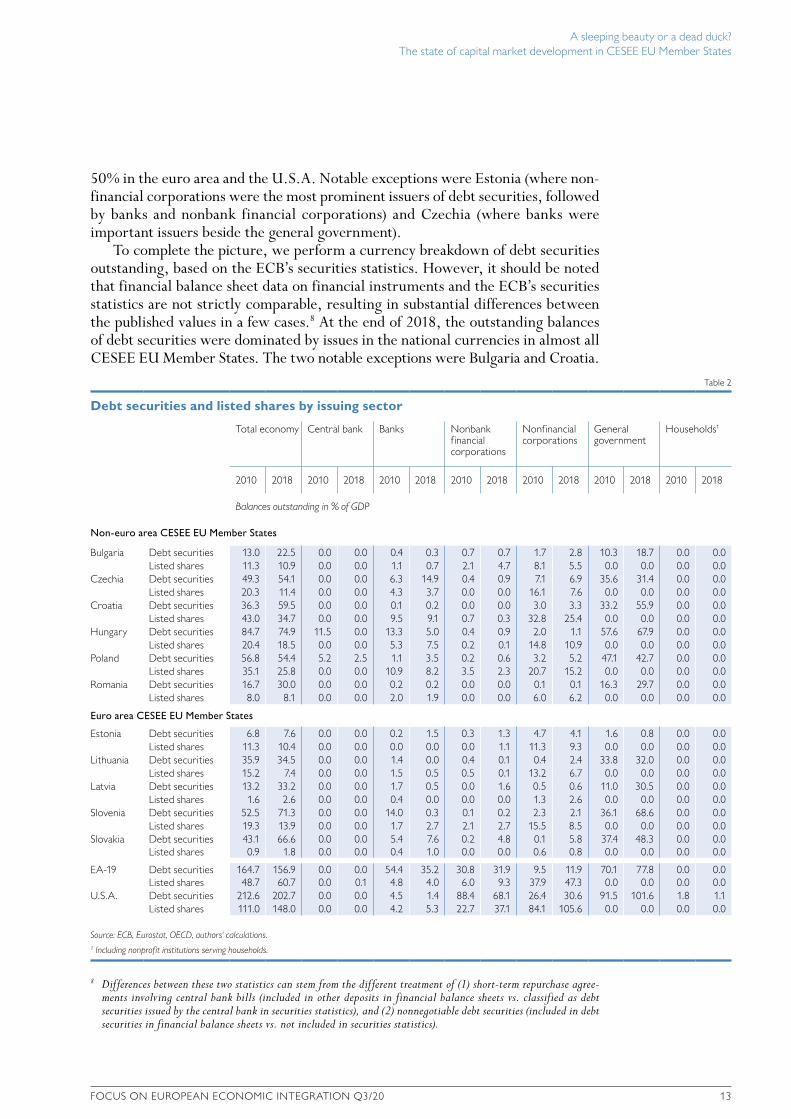
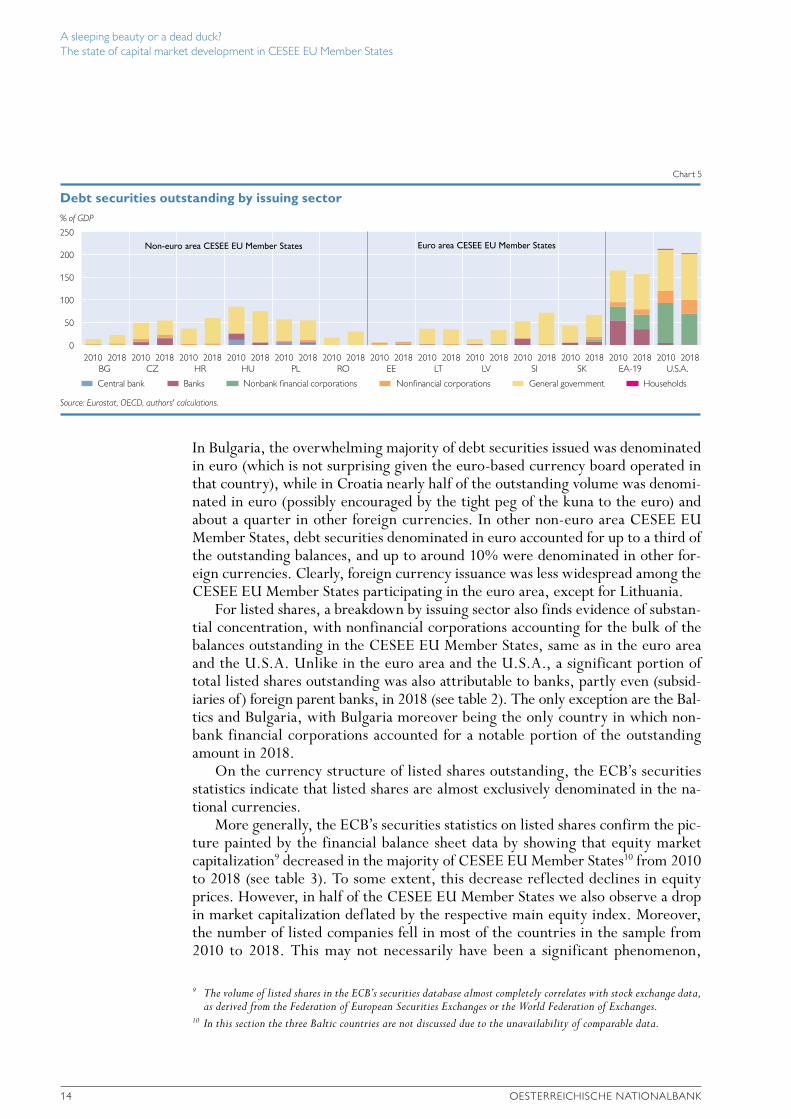
Next, we take a closer look at total debt securities and listed shares outstanding. Concerning debt securities, a breakdown of the balances outstanding by issuing sector7 reveals that these balances tend to be heavily skewed toward debt securities issued by the general government (see chart 5 and table 2): In 2018, the govern-ment sector accounted for more than 75% of overall issuance, compared to around
7 We distinguish six institutional sectors in line with the European System of Accounts (ESA) 2010: (1) central bank (S.121); (2) other monetary financial institutions (other MFIs), which include deposit-taking corporations (S.122) and money market funds (S.123); (3) non-MFI financial corporations (S.124 to S.129), including e.g. insurance corporations, pension funds, investment funds that are not money market funds; (4) nonfinancial corporations (S.11); (5) general government (S.13); (6) households and nonprofit institutions serving households (NPISH) (S.14 and S.15). For simplicity, we use the term “ banks” for “other MFIs” and “nonbank financial corporations” for “non-MFI financial corporations” in this article.
% of total financial liabilities
60
50
40
30
20
10
0
The relative role of securities and loans in total financing – total economy
Chart 4
Source: Eurostat, OECD, authors' calculations.
Debt securities Listed shares Investment fund shares Loans
2010 2018 2010 2018 2010 2018 2010 2018 2010 2018 2010 2018 2010 2018 2010 2018 2010 2018 2010 2018 2010 2018 2010 2018 2010 2018BG CZ HR HU PL RO EE LT LV SI SK EA-19 U.S.A.
Non-euro area CESEE EU Member States Euro area CESEE EU Member States
A sleeping beauty or a dead duck? The state of capital market development in CESEE EU Member States
FOCUS ON EUROPEAN ECONOMIC INTEGRATION Q3/20 13
50% in the euro area and the U.S.A. Notable exceptions were Estonia (where non-financial corporations were the most prominent issuers of debt securities, followed by banks and nonbank financial corporations) and Czechia (where banks were important issuers beside the general government).
To complete the picture, we perform a currency breakdown of debt securities outstanding, based on the ECB’s securities statistics. However, it should be noted that financial balance sheet data on financial instruments and the ECB’s securities statistics are not strictly comparable, resulting in substantial differences between the published values in a few cases.8 At the end of 2018, the outstanding balances of debt securities were dominated by issues in the national currencies in almost all CESEE EU Member States. The two notable exceptions were Bulgaria and Croatia.
8 Differences between these two statistics can stem from the different treatment of (1) short-term repurchase agree-ments involving central bank bills (included in other deposits in financial balance sheets vs. classified as debt securities issued by the central bank in securities statistics), and (2) nonnegotiable debt securities (included in debt securities in financial balance sheets vs. not included in securities statistics).
Table 2
Debt securities and listed shares by issuing sector
Total economy Central bank Banks Nonbank financial corporations
Nonfinancial corporations
General government
Households1
2010 2018 2010 2018 2010 2018 2010 2018 2010 2018 2010 2018 2010 2018
Balances outstanding in % of GDP
Non-euro area CESEE EU Member States
Bulgaria Debt securities 13.0 22.5 0.0 0.0 0.4 0.3 0.7 0.7 1.7 2.8 10.3 18.7 0.0 0.0 Listed shares 11.3 10.9 0.0 0.0 1.1 0.7 2.1 4.7 8.1 5.5 0.0 0.0 0.0 0.0
Czechia Debt securities 49.3 54.1 0.0 0.0 6.3 14.9 0.4 0.9 7.1 6.9 35.6 31.4 0.0 0.0 Listed shares 20.3 11.4 0.0 0.0 4.3 3.7 0.0 0.0 16.1 7.6 0.0 0.0 0.0 0.0
Croatia Debt securities 36.3 59.5 0.0 0.0 0.1 0.2 0.0 0.0 3.0 3.3 33.2 55.9 0.0 0.0 Listed shares 43.0 34.7 0.0 0.0 9.5 9.1 0.7 0.3 32.8 25.4 0.0 0.0 0.0 0.0
Hungary Debt securities 84.7 74.9 11.5 0.0 13.3 5.0 0.4 0.9 2.0 1.1 57.6 67.9 0.0 0.0 Listed shares 20.4 18.5 0.0 0.0 5.3 7.5 0.2 0.1 14.8 10.9 0.0 0.0 0.0 0.0
Poland Debt securities 56.8 54.4 5.2 2.5 1.1 3.5 0.2 0.6 3.2 5.2 47.1 42.7 0.0 0.0 Listed shares 35.1 25.8 0.0 0.0 10.9 8.2 3.5 2.3 20.7 15.2 0.0 0.0 0.0 0.0
Romania Debt securities 16.7 30.0 0.0 0.0 0.2 0.2 0.0 0.0 0.1 0.1 16.3 29.7 0.0 0.0 Listed shares 8.0 8.1 0.0 0.0 2.0 1.9 0.0 0.0 6.0 6.2 0.0 0.0 0.0 0.0
Euro area CESEE EU Member States
Estonia Debt securities 6.8 7.6 0.0 0.0 0.2 1.5 0.3 1.3 4.7 4.1 1.6 0.8 0.0 0.0 Listed shares 11.3 10.4 0.0 0.0 0.0 0.0 0.0 1.1 11.3 9.3 0.0 0.0 0.0 0.0
Lithuania Debt securities 35.9 34.5 0.0 0.0 1.4 0.0 0.4 0.1 0.4 2.4 33.8 32.0 0.0 0.0 Listed shares 15.2 7.4 0.0 0.0 1.5 0.5 0.5 0.1 13.2 6.7 0.0 0.0 0.0 0.0
Latvia Debt securities 13.2 33.2 0.0 0.0 1.7 0.5 0.0 1.6 0.5 0.6 11.0 30.5 0.0 0.0 Listed shares 1.6 2.6 0.0 0.0 0.4 0.0 0.0 0.0 1.3 2.6 0.0 0.0 0.0 0.0
Slovenia Debt securities 52.5 71.3 0.0 0.0 14.0 0.3 0.1 0.2 2.3 2.1 36.1 68.6 0.0 0.0 Listed shares 19.3 13.9 0.0 0.0 1.7 2.7 2.1 2.7 15.5 8.5 0.0 0.0 0.0 0.0
Slovakia Debt securities 43.1 66.6 0.0 0.0 5.4 7.6 0.2 4.8 0.1 5.8 37.4 48.3 0.0 0.0 Listed shares 0.9 1.8 0.0 0.0 0.4 1.0 0.0 0.0 0.6 0.8 0.0 0.0 0.0 0.0
EA-19 Debt securities 164.7 156.9 0.0 0.0 54.4 35.2 30.8 31.9 9.5 11.9 70.1 77.8 0.0 0.0 Listed shares 48.7 60.7 0.0 0.1 4.8 4.0 6.0 9.3 37.9 47.3 0.0 0.0 0.0 0.0
U.S.A. Debt securities 212.6 202.7 0.0 0.0 4.5 1.4 88.4 68.1 26.4 30.6 91.5 101.6 1.8 1.1 Listed shares 111.0 148.0 0.0 0.0 4.2 5.3 22.7 37.1 84.1 105.6 0.0 0.0 0.0 0.0
Source: ECB, Eurostat, OECD, authors‘ calculations.1 Including nonprofit institutions serving households.
A sleeping beauty or a dead duck? The state of capital market development in CESEE EU Member States
14 OESTERREICHISCHE NATIONALBANK
In Bulgaria, the overwhelming majority of debt securities issued was denominated in euro (which is not surprising given the euro-based currency board operated in that country), while in Croatia nearly half of the outstanding volume was denomi-nated in euro (possibly encouraged by the tight peg of the kuna to the euro) and about a quarter in other foreign currencies. In other non-euro area CESEE EU Member States, debt securities denominated in euro accounted for up to a third of the outstanding balances, and up to around 10% were denominated in other for-eign currencies. Clearly, foreign currency issuance was less widespread among the CESEE EU Member States participating in the euro area, except for Lithuania.
For listed shares, a breakdown by issuing sector also finds evidence of substan-tial concentration, with nonfinancial corporations accounting for the bulk of the balances outstanding in the CESEE EU Member States, same as in the euro area and the U.S.A. Unlike in the euro area and the U.S.A., a significant portion of total listed shares outstanding was also attributable to banks, partly even (subsid-iaries of) foreign parent banks, in 2018 (see table 2). The only exception are the Bal-tics and Bulgaria, with Bulgaria moreover being the only country in which non-bank financial corporations accounted for a notable portion of the outstanding amount in 2018.
On the currency structure of listed shares outstanding, the ECB’s securities statistics indicate that listed shares are almost exclusively denominated in the na-tional currencies.
More generally, the ECB’s securities statistics on listed shares confirm the pic-ture painted by the financial balance sheet data by showing that equity market capitalization9 decreased in the majority of CESEE EU Member States10 from 2010 to 2018 (see table 3). To some extent, this decrease reflected declines in equity prices. However, in half of the CESEE EU Member States we also observe a drop in market capitalization deflated by the respective main equity index. Moreover, the number of listed companies fell in most of the countries in the sample from 2010 to 2018. This may not necessarily have been a significant phenomenon,
9 The volume of listed shares in the ECB’s securities database almost completely correlates with stock exchange data, as derived from the Federation of European Securities Exchanges or the World Federation of Exchanges.
10 In this section the three Baltic countries are not discussed due to the unavailability of comparable data.
% of GDP
250
200
150
100
50
0
Debt securities outstanding by issuing sector
Chart 5
Source: Eurostat, OECD, authors' calculations.
Central bank Banks Nonbank financial corporations Nonfinancial corporations General government Households
2010 2018 2010 2018 2010 2018 2010 2018 2010 2018 2010 2018 2010 2018 2010 2018 2010 2018 2010 2018 2010 2018 2010 2018 2010 2018BG CZ HR HU PL RO EE LT LV SI SK EA-19 U.S.A.
Non-euro area CESEE EU Member States Euro area CESEE EU Member States
A sleeping beauty or a dead duck? The state of capital market development in CESEE EU Member States
FOCUS ON EUROPEAN ECONOMIC INTEGRATION Q3/20 15
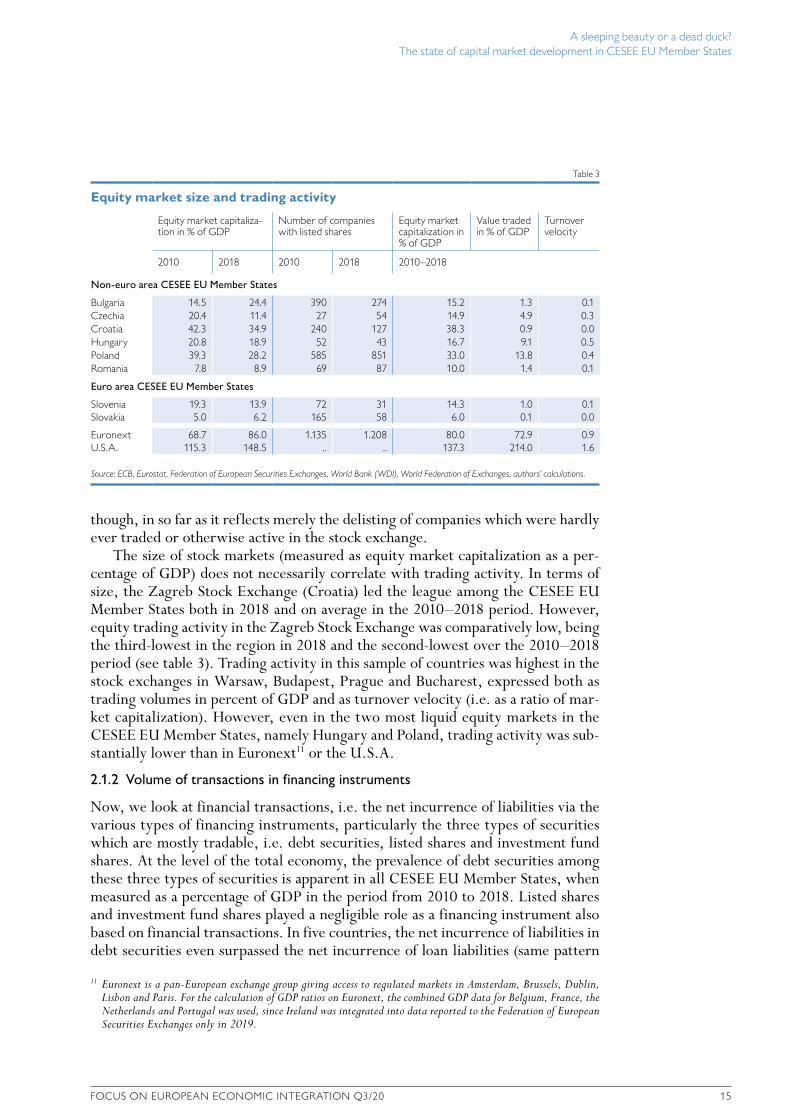
though, in so far as it reflects merely the delisting of companies which were hardly ever traded or otherwise active in the stock exchange.
The size of stock markets (measured as equity market capitalization as a per-centage of GDP) does not necessarily correlate with trading activity. In terms of size, the Zagreb Stock Exchange (Croatia) led the league among the CESEE EU Member States both in 2018 and on average in the 2010–2018 period. However, equity trading activity in the Zagreb Stock Exchange was comparatively low, being the third-lowest in the region in 2018 and the second-lowest over the 2010–2018 period (see table 3). Trading activity in this sample of countries was highest in the stock exchanges in Warsaw, Budapest, Prague and Bucharest, expressed both as trading volumes in percent of GDP and as turnover velocity (i.e. as a ratio of mar-ket capitalization). However, even in the two most liquid equity markets in the CESEE EU Member States, namely Hungary and Poland, trading activity was sub-stantially lower than in Euronext11 or the U.S.A.
2.1.2 Volume of transactions in financing instruments
Now, we look at financial transactions, i.e. the net incurrence of liabilities via the various types of financing instruments, particularly the three types of securities which are mostly tradable, i.e. debt securities, listed shares and investment fund shares. At the level of the total economy, the prevalence of debt securities among these three types of securities is apparent in all CESEE EU Member States, when measured as a percentage of GDP in the period from 2010 to 2018. Listed shares and investment fund shares played a negligible role as a financing instrument also based on financial transactions. In five countries, the net incurrence of liabilities in debt securities even surpassed the net incurrence of loan liabilities (same pattern
11 Euronext is a pan-European exchange group giving access to regulated markets in Amsterdam, Brussels, Dublin, Lisbon and Paris. For the calculation of GDP ratios on Euronext, the combined GDP data for Belgium, France, the Netherlands and Portugal was used, since Ireland was integrated into data reported to the Federation of European Securities Exchanges only in 2019.
Table 3
Equity market size and trading activity
Equity market capitaliza-tion in % of GDP
Number of companies with listed shares
Equity market capitalization in % of GDP
Value traded in % of GDP
Turnover velocity
2010 2018 2010 2018 2010–2018
Non-euro area CESEE EU Member States
Bulgaria 14.5 24.4 390 274 15.2 1.3 0.1 Czechia 20.4 11.4 27 54 14.9 4.9 0.3 Croatia 42.3 34.9 240 127 38.3 0.9 0.0 Hungary 20.8 18.9 52 43 16.7 9.1 0.5 Poland 39.3 28.2 585 851 33.0 13.8 0.4 Romania 7.8 8.9 69 87 10.0 1.4 0.1
Euro area CESEE EU Member States
Slovenia 19.3 13.9 72 31 14.3 1.0 0.1 Slovakia 5.0 6.2 165 58 6.0 0.1 0.0
Euronext 68.7 86.0 1.135 1.208 80.0 72.9 0.9 U.S.A. 115.3 148.5 .. .. 137.3 214.0 1.6
Source: ECB, Eurostat, Federation of European Securities Exchanges, World Bank (WDI), World Federation of Exchanges, authors‘ calculations.
A sleeping beauty or a dead duck? The state of capital market development in CESEE EU Member States
16 OESTERREICHISCHE NATIONALBANK
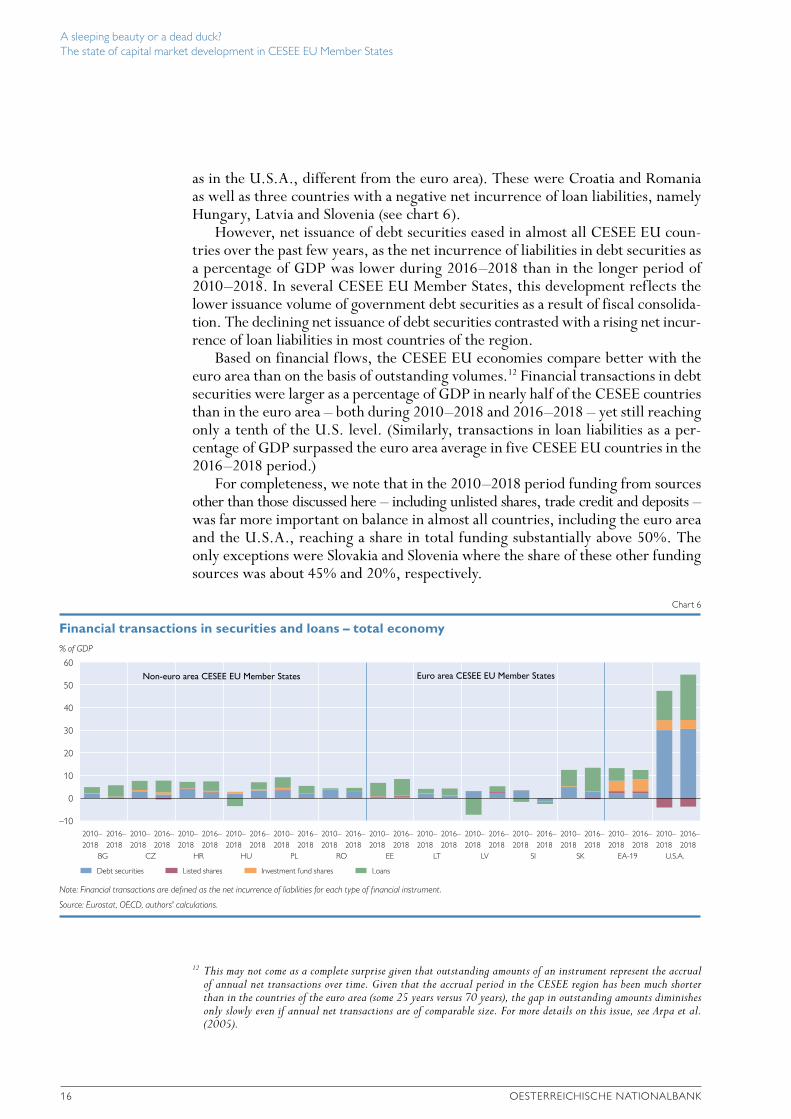
as in the U.S.A., different from the euro area). These were Croatia and Romania as well as three countries with a negative net incurrence of loan liabilities, namely Hungary, Latvia and Slovenia (see chart 6).
However, net issuance of debt securities eased in almost all CESEE EU coun-tries over the past few years, as the net incurrence of liabilities in debt securities as a percentage of GDP was lower during 2016–2018 than in the longer period of 2010–2018. In several CESEE EU Member States, this development reflects the lower issuance volume of government debt securities as a result of fiscal consolida-tion. The declining net issuance of debt securities contrasted with a rising net incur-rence of loan liabilities in most countries of the region.
Based on financial flows, the CESEE EU economies compare better with the euro area than on the basis of outstanding volumes.12 Financial transactions in debt securities were larger as a percentage of GDP in nearly half of the CESEE countries than in the euro area – both during 2010–2018 and 2016–2018 – yet still reaching only a tenth of the U.S. level. (Similarly, transactions in loan liabilities as a per-centage of GDP surpassed the euro area average in five CESEE EU countries in the 2016–2018 period.)
For completeness, we note that in the 2010–2018 period funding from sources other than those discussed here – including unlisted shares, trade credit and deposits – was far more important on balance in almost all countries, including the euro area and the U.S.A., reaching a share in total funding substantially above 50%. The only exceptions were Slovakia and Slovenia where the share of these other funding sources was about 45% and 20%, respectively.
12 This may not come as a complete surprise given that outstanding amounts of an instrument represent the accrual of annual net transactions over time. Given that the accrual period in the CESEE region has been much shorter than in the countries of the euro area (some 25 years versus 70 years), the gap in outstanding amounts diminishes only slowly even if annual net transactions are of comparable size. For more details on this issue, see Arpa et al. (2005).
% of GDP
60
50
40
30
20
10
0
–10
Financial transactions in securities and loans – total economy
Chart 6
Note: Financial transactions are defined as the net incurrence of liabilities for each type of financial instrument.
Source: Eurostat, OECD, authors' calculations.
Debt securities Listed shares Investment fund shares Loans
2010–2018
2016–2018
2010–2018
2016–2018
2010–2018
2016–2018
2010–2018
2016–2018
2010–2018
2016–2018
2010–2018
2016–2018
2010–2018
2016–2018
2010–2018
2016–2018
2010–2018
2016–2018
2010–2018
2016–2018
2010–2018
2016–2018
2010–2018
2016–2018
2010–2018
2016–2018
BG CZ HR HU PL RO EE LT LV SI SK EA-19 U.S.A.
Non-euro area CESEE EU Member States Euro area CESEE EU Member States
A sleeping beauty or a dead duck? The state of capital market development in CESEE EU Member States
FOCUS ON EUROPEAN ECONOMIC INTEGRATION Q3/20 17
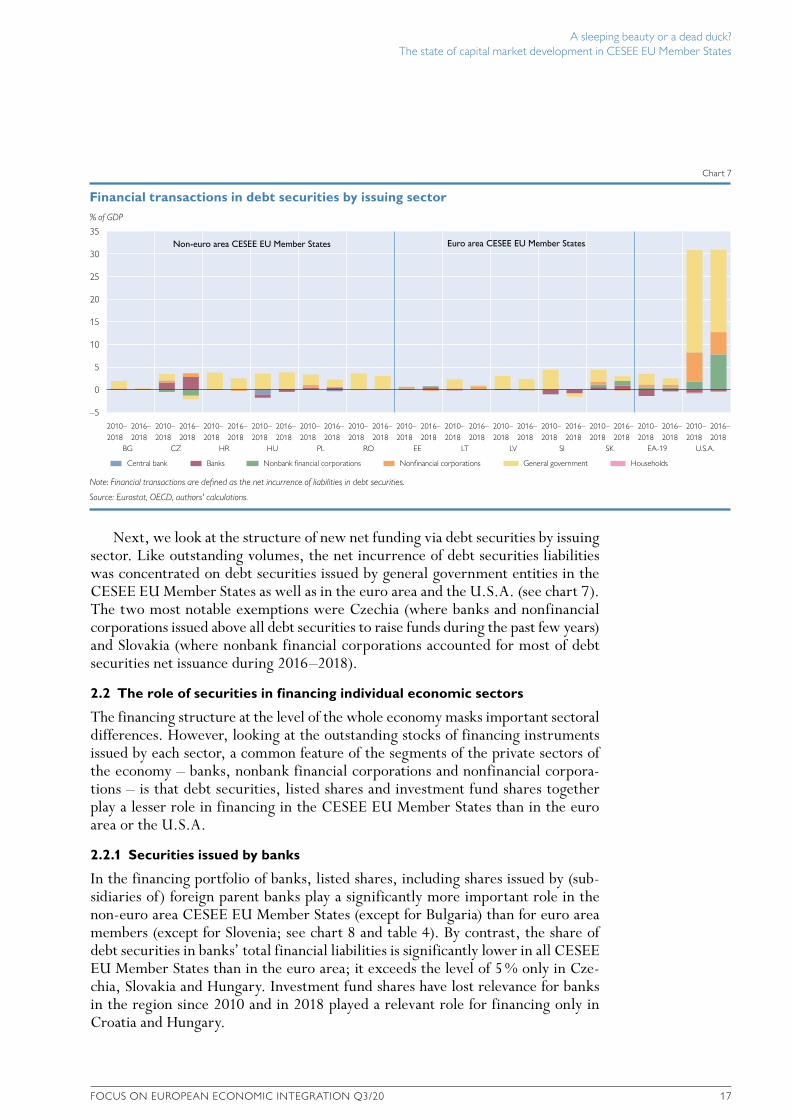
Next, we look at the structure of new net funding via debt securities by issuing sector. Like outstanding volumes, the net incurrence of debt securities liabilities was concentrated on debt securities issued by general government entities in the CESEE EU Member States as well as in the euro area and the U.S.A. (see chart 7). The two most notable exemptions were Czechia (where banks and nonfinancial corporations issued above all debt securities to raise funds during the past few years) and Slovakia (where nonbank financial corporations accounted for most of debt securities net issuance during 2016–2018).
2.2 The role of securities in financing individual economic sectors
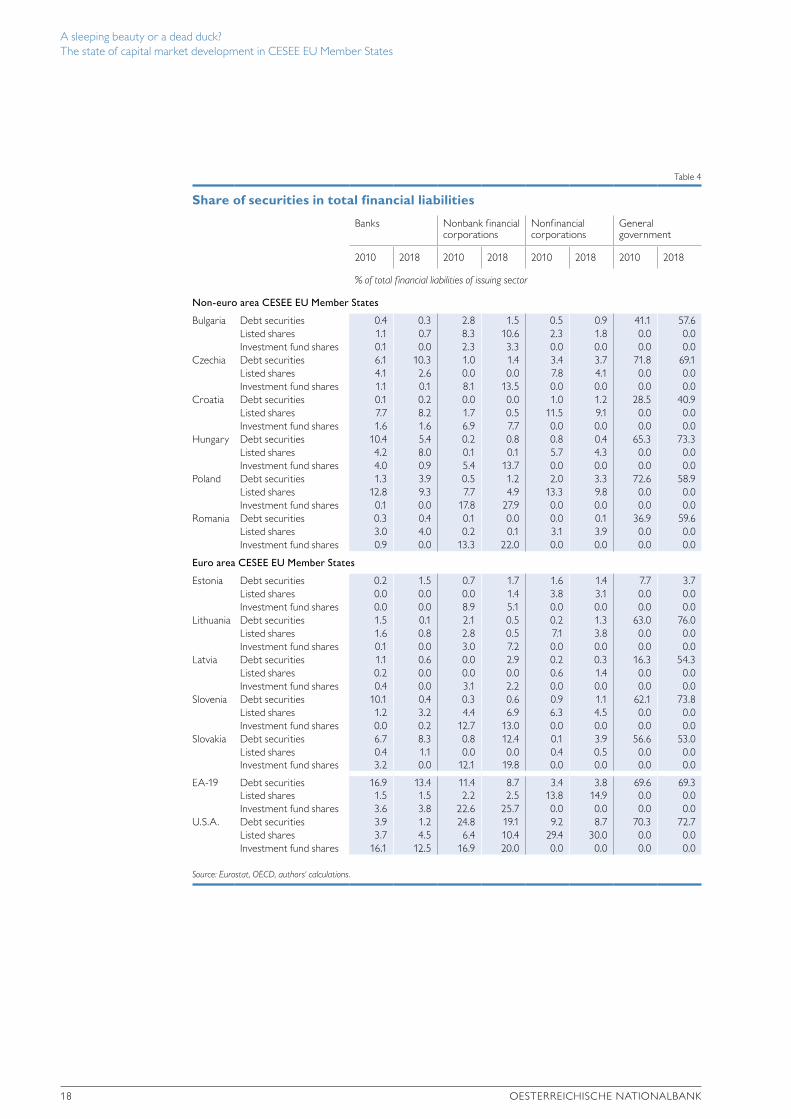
The financing structure at the level of the whole economy masks important sectoral differences. However, looking at the outstanding stocks of financing instruments issued by each sector, a common feature of the segments of the private sectors of the economy – banks, nonbank financial corporations and nonfinancial corpora-tions – is that debt securities, listed shares and investment fund shares together play a lesser role in financing in the CESEE EU Member States than in the euro area or the U.S.A.
2.2.1 Securities issued by banks
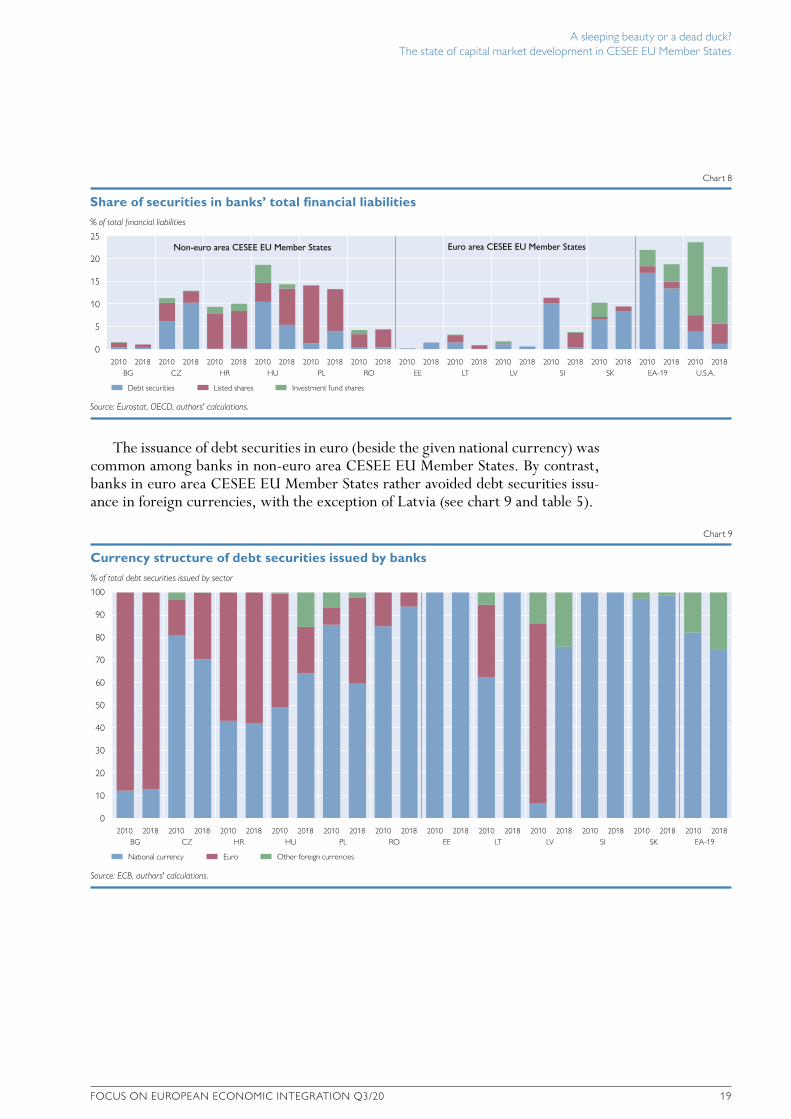
In the financing portfolio of banks, listed shares, including shares issued by (sub-sidiaries of) foreign parent banks play a significantly more important role in the non-euro area CESEE EU Member States (except for Bulgaria) than for euro area members (except for Slovenia; see chart 8 and table 4). By contrast, the share of debt securities in banks’ total financial liabilities is significantly lower in all CESEE EU Member States than in the euro area; it exceeds the level of 5 % only in Cze-chia, Slovakia and Hungary. Investment fund shares have lost relevance for banks in the region since 2010 and in 2018 played a relevant role for financing only in Croatia and Hungary.
% of GDP
35
30
25
20
15
10
5
0
–5
Financial transactions in debt securities by issuing sector
Chart 7
Note: Financial transactions are defined as the net incurrence of liabilities in debt securities.
Source: Eurostat, OECD, authors' calculations.
Central bank Banks Nonbank financial corporations Nonfinancial corporations General government Households
2010–2018
2016–2018
2010–2018
2016–2018
2010–2018
2016–2018
2010–2018
2016–2018
2010–2018
2016–2018
2010–2018
2016–2018
2010–2018
2016–2018
2010–2018
2016–2018
2010–2018
2016–2018
2010–2018
2016–2018
2010–2018
2016–2018
2010–2018
2016–2018
2010–2018
2016–2018
BG CZ HR HU PL RO EE LT LV SI SK EA-19 U.S.A.
Non-euro area CESEE EU Member States Euro area CESEE EU Member States
A sleeping beauty or a dead duck? The state of capital market development in CESEE EU Member States
18 OESTERREICHISCHE NATIONALBANK
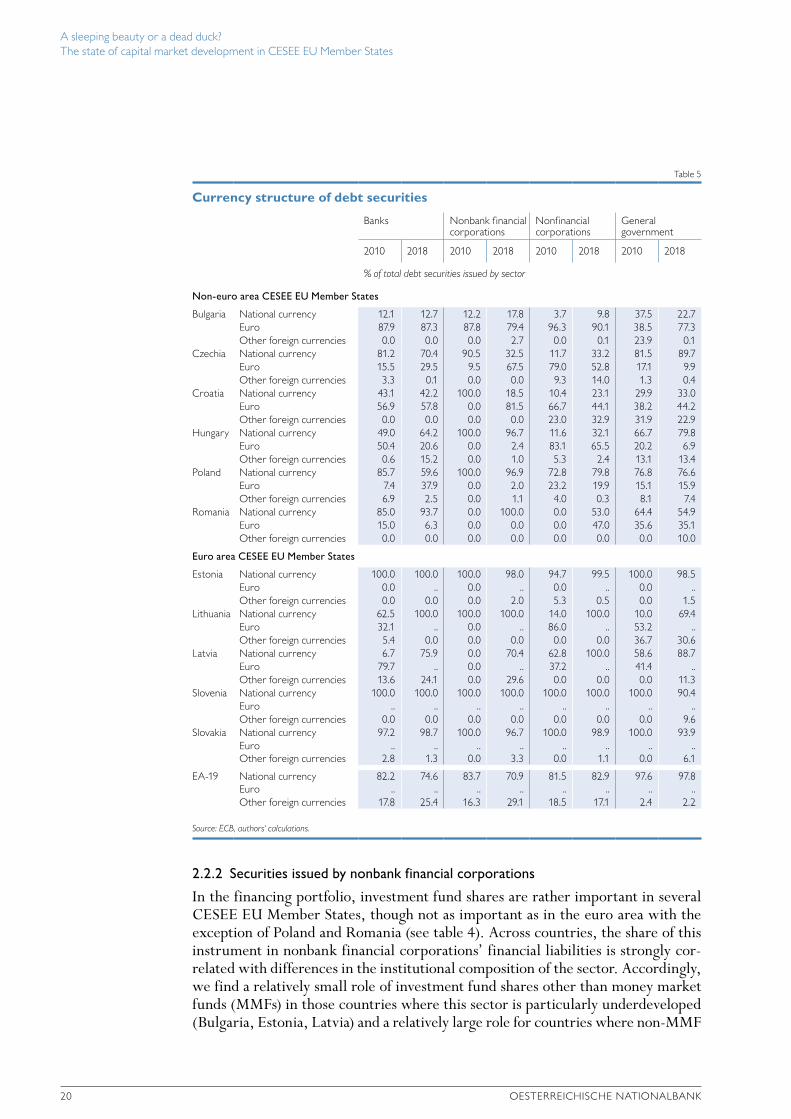
The issuance of debt securities in euro (beside the given national currency) was common among banks in non-euro area CESEE EU Member States. By contrast, banks in euro area CESEE EU Member States rather avoided debt securities issu-ance in foreign currencies, with the exception of Latvia (see chart 9 and table 5).
Table 4
Share of securities in total financial liabilities
Banks Nonbank financial corporations
Nonfinancial corporations
General government
2010 2018 2010 2018 2010 2018 2010 2018
% of total financial liabilities of issuing sector
Non-euro area CESEE EU Member States
Bulgaria Debt securities 0.4 0.3 2.8 1.5 0.5 0.9 41.1 57.6 Listed shares 1.1 0.7 8.3 10.6 2.3 1.8 0.0 0.0 Investment fund shares 0.1 0.0 2.3 3.3 0.0 0.0 0.0 0.0
Czechia Debt securities 6.1 10.3 1.0 1.4 3.4 3.7 71.8 69.1 Listed shares 4.1 2.6 0.0 0.0 7.8 4.1 0.0 0.0 Investment fund shares 1.1 0.1 8.1 13.5 0.0 0.0 0.0 0.0
Croatia Debt securities 0.1 0.2 0.0 0.0 1.0 1.2 28.5 40.9 Listed shares 7.7 8.2 1.7 0.5 11.5 9.1 0.0 0.0 Investment fund shares 1.6 1.6 6.9 7.7 0.0 0.0 0.0 0.0
Hungary Debt securities 10.4 5.4 0.2 0.8 0.8 0.4 65.3 73.3 Listed shares 4.2 8.0 0.1 0.1 5.7 4.3 0.0 0.0 Investment fund shares 4.0 0.9 5.4 13.7 0.0 0.0 0.0 0.0
Poland Debt securities 1.3 3.9 0.5 1.2 2.0 3.3 72.6 58.9 Listed shares 12.8 9.3 7.7 4.9 13.3 9.8 0.0 0.0 Investment fund shares 0.1 0.0 17.8 27.9 0.0 0.0 0.0 0.0
Romania Debt securities 0.3 0.4 0.1 0.0 0.0 0.1 36.9 59.6 Listed shares 3.0 4.0 0.2 0.1 3.1 3.9 0.0 0.0 Investment fund shares 0.9 0.0 13.3 22.0 0.0 0.0 0.0 0.0
Euro area CESEE EU Member States
Estonia Debt securities 0.2 1.5 0.7 1.7 1.6 1.4 7.7 3.7 Listed shares 0.0 0.0 0.0 1.4 3.8 3.1 0.0 0.0 Investment fund shares 0.0 0.0 8.9 5.1 0.0 0.0 0.0 0.0
Lithuania Debt securities 1.5 0.1 2.1 0.5 0.2 1.3 63.0 76.0 Listed shares 1.6 0.8 2.8 0.5 7.1 3.8 0.0 0.0 Investment fund shares 0.1 0.0 3.0 7.2 0.0 0.0 0.0 0.0
Latvia Debt securities 1.1 0.6 0.0 2.9 0.2 0.3 16.3 54.3 Listed shares 0.2 0.0 0.0 0.0 0.6 1.4 0.0 0.0 Investment fund shares 0.4 0.0 3.1 2.2 0.0 0.0 0.0 0.0
Slovenia Debt securities 10.1 0.4 0.3 0.6 0.9 1.1 62.1 73.8 Listed shares 1.2 3.2 4.4 6.9 6.3 4.5 0.0 0.0 Investment fund shares 0.0 0.2 12.7 13.0 0.0 0.0 0.0 0.0
Slovakia Debt securities 6.7 8.3 0.8 12.4 0.1 3.9 56.6 53.0 Listed shares 0.4 1.1 0.0 0.0 0.4 0.5 0.0 0.0 Investment fund shares 3.2 0.0 12.1 19.8 0.0 0.0 0.0 0.0
EA-19 Debt securities 16.9 13.4 11.4 8.7 3.4 3.8 69.6 69.3 Listed shares 1.5 1.5 2.2 2.5 13.8 14.9 0.0 0.0 Investment fund shares 3.6 3.8 22.6 25.7 0.0 0.0 0.0 0.0
U.S.A. Debt securities 3.9 1.2 24.8 19.1 9.2 8.7 70.3 72.7 Listed shares 3.7 4.5 6.4 10.4 29.4 30.0 0.0 0.0 Investment fund shares 16.1 12.5 16.9 20.0 0.0 0.0 0.0 0.0
Source: Eurostat, OECD, authors‘ calculations.
% of total financial liabilities
25
20
15
10
5
0
Share of securities in banks’ total financial liabilities
Chart 8
Source: Eurostat, OECD, authors' calculations.
Debt securities Listed shares Investment fund shares
BG CZ HR HU PL RO EE LT LV SI SK EA-19 U.S.A.2010 2018 2010 2018 2010 2018 2010 2018 2010 2018 2010 2018 2010 2018 2010 2018 2010 2018 2010 2018 2010 2018 2010 2018 2010 2018
Non-euro area CESEE EU Member States Euro area CESEE EU Member States
% of total debt securities issued by sector
100
90
80
70
60
50
40
30
20
10
0
Currency structure of debt securities issued by banks
Chart 9
Source: ECB, authors' calculations.
National currency Euro Other foreign currencies
BG CZ HR HU PL RO EE LT LV SI SK EA-192010 2018 2010 2018 2010 2018 2010 2018 2010 2018 2010 2018 2010 2018 2010 2018 2010 2018 2010 2018 2010 2018 2010 2018
A sleeping beauty or a dead duck? The state of capital market development in CESEE EU Member States
FOCUS ON EUROPEAN ECONOMIC INTEGRATION Q3/20 19
The issuance of debt securities in euro (beside the given national currency) was common among banks in non-euro area CESEE EU Member States. By contrast, banks in euro area CESEE EU Member States rather avoided debt securities issu-ance in foreign currencies, with the exception of Latvia (see chart 9 and table 5).
Table 4
Share of securities in total financial liabilities
Banks Nonbank financial corporations
Nonfinancial corporations
General government
2010 2018 2010 2018 2010 2018 2010 2018
% of total financial liabilities of issuing sector
Non-euro area CESEE EU Member States
Bulgaria Debt securities 0.4 0.3 2.8 1.5 0.5 0.9 41.1 57.6 Listed shares 1.1 0.7 8.3 10.6 2.3 1.8 0.0 0.0 Investment fund shares 0.1 0.0 2.3 3.3 0.0 0.0 0.0 0.0
Czechia Debt securities 6.1 10.3 1.0 1.4 3.4 3.7 71.8 69.1 Listed shares 4.1 2.6 0.0 0.0 7.8 4.1 0.0 0.0 Investment fund shares 1.1 0.1 8.1 13.5 0.0 0.0 0.0 0.0
Croatia Debt securities 0.1 0.2 0.0 0.0 1.0 1.2 28.5 40.9 Listed shares 7.7 8.2 1.7 0.5 11.5 9.1 0.0 0.0 Investment fund shares 1.6 1.6 6.9 7.7 0.0 0.0 0.0 0.0
Hungary Debt securities 10.4 5.4 0.2 0.8 0.8 0.4 65.3 73.3 Listed shares 4.2 8.0 0.1 0.1 5.7 4.3 0.0 0.0 Investment fund shares 4.0 0.9 5.4 13.7 0.0 0.0 0.0 0.0
Poland Debt securities 1.3 3.9 0.5 1.2 2.0 3.3 72.6 58.9 Listed shares 12.8 9.3 7.7 4.9 13.3 9.8 0.0 0.0 Investment fund shares 0.1 0.0 17.8 27.9 0.0 0.0 0.0 0.0
Romania Debt securities 0.3 0.4 0.1 0.0 0.0 0.1 36.9 59.6 Listed shares 3.0 4.0 0.2 0.1 3.1 3.9 0.0 0.0 Investment fund shares 0.9 0.0 13.3 22.0 0.0 0.0 0.0 0.0
Euro area CESEE EU Member States
Estonia Debt securities 0.2 1.5 0.7 1.7 1.6 1.4 7.7 3.7 Listed shares 0.0 0.0 0.0 1.4 3.8 3.1 0.0 0.0 Investment fund shares 0.0 0.0 8.9 5.1 0.0 0.0 0.0 0.0
Lithuania Debt securities 1.5 0.1 2.1 0.5 0.2 1.3 63.0 76.0 Listed shares 1.6 0.8 2.8 0.5 7.1 3.8 0.0 0.0 Investment fund shares 0.1 0.0 3.0 7.2 0.0 0.0 0.0 0.0
Latvia Debt securities 1.1 0.6 0.0 2.9 0.2 0.3 16.3 54.3 Listed shares 0.2 0.0 0.0 0.0 0.6 1.4 0.0 0.0 Investment fund shares 0.4 0.0 3.1 2.2 0.0 0.0 0.0 0.0
Slovenia Debt securities 10.1 0.4 0.3 0.6 0.9 1.1 62.1 73.8 Listed shares 1.2 3.2 4.4 6.9 6.3 4.5 0.0 0.0 Investment fund shares 0.0 0.2 12.7 13.0 0.0 0.0 0.0 0.0
Slovakia Debt securities 6.7 8.3 0.8 12.4 0.1 3.9 56.6 53.0 Listed shares 0.4 1.1 0.0 0.0 0.4 0.5 0.0 0.0 Investment fund shares 3.2 0.0 12.1 19.8 0.0 0.0 0.0 0.0
EA-19 Debt securities 16.9 13.4 11.4 8.7 3.4 3.8 69.6 69.3 Listed shares 1.5 1.5 2.2 2.5 13.8 14.9 0.0 0.0 Investment fund shares 3.6 3.8 22.6 25.7 0.0 0.0 0.0 0.0
U.S.A. Debt securities 3.9 1.2 24.8 19.1 9.2 8.7 70.3 72.7 Listed shares 3.7 4.5 6.4 10.4 29.4 30.0 0.0 0.0 Investment fund shares 16.1 12.5 16.9 20.0 0.0 0.0 0.0 0.0
Source: Eurostat, OECD, authors‘ calculations.
% of total financial liabilities
25
20
15
10
5
0
Share of securities in banks’ total financial liabilities
Chart 8
Source: Eurostat, OECD, authors' calculations.
Debt securities Listed shares Investment fund shares
BG CZ HR HU PL RO EE LT LV SI SK EA-19 U.S.A.2010 2018 2010 2018 2010 2018 2010 2018 2010 2018 2010 2018 2010 2018 2010 2018 2010 2018 2010 2018 2010 2018 2010 2018 2010 2018
Non-euro area CESEE EU Member States Euro area CESEE EU Member States
% of total debt securities issued by sector
100
90
80
70
60
50
40
30
20
10
0
Currency structure of debt securities issued by banks
Chart 9
Source: ECB, authors' calculations.
National currency Euro Other foreign currencies
BG CZ HR HU PL RO EE LT LV SI SK EA-192010 2018 2010 2018 2010 2018 2010 2018 2010 2018 2010 2018 2010 2018 2010 2018 2010 2018 2010 2018 2010 2018 2010 2018
A sleeping beauty or a dead duck? The state of capital market development in CESEE EU Member States
20 OESTERREICHISCHE NATIONALBANK
2.2.2 Securities issued by nonbank financial corporations
In the financing portfolio, investment fund shares are rather important in several CESEE EU Member States, though not as important as in the euro area with the exception of Poland and Romania (see table 4). Across countries, the share of this instrument in nonbank financial corporations’ financial liabilities is strongly cor-related with differences in the institutional composition of the sector. Accordingly, we find a relatively small role of investment fund shares other than money market funds (MMFs) in those countries where this sector is particularly underdeveloped (Bulgaria, Estonia, Latvia) and a relatively large role for countries where non-MMF
Table 5
Currency structure of debt securities
Banks Nonbank financial corporations
Nonfinancial corporations
General government
2010 2018 2010 2018 2010 2018 2010 2018
% of total debt securities issued by sector
Non-euro area CESEE EU Member States
Bulgaria National currency 12.1 12.7 12.2 17.8 3.7 9.8 37.5 22.7 Euro 87.9 87.3 87.8 79.4 96.3 90.1 38.5 77.3 Other foreign currencies 0.0 0.0 0.0 2.7 0.0 0.1 23.9 0.1
Czechia National currency 81.2 70.4 90.5 32.5 11.7 33.2 81.5 89.7 Euro 15.5 29.5 9.5 67.5 79.0 52.8 17.1 9.9 Other foreign currencies 3.3 0.1 0.0 0.0 9.3 14.0 1.3 0.4
Croatia National currency 43.1 42.2 100.0 18.5 10.4 23.1 29.9 33.0 Euro 56.9 57.8 0.0 81.5 66.7 44.1 38.2 44.2 Other foreign currencies 0.0 0.0 0.0 0.0 23.0 32.9 31.9 22.9
Hungary National currency 49.0 64.2 100.0 96.7 11.6 32.1 66.7 79.8 Euro 50.4 20.6 0.0 2.4 83.1 65.5 20.2 6.9 Other foreign currencies 0.6 15.2 0.0 1.0 5.3 2.4 13.1 13.4
Poland National currency 85.7 59.6 100.0 96.9 72.8 79.8 76.8 76.6 Euro 7.4 37.9 0.0 2.0 23.2 19.9 15.1 15.9 Other foreign currencies 6.9 2.5 0.0 1.1 4.0 0.3 8.1 7.4
Romania National currency 85.0 93.7 0.0 100.0 0.0 53.0 64.4 54.9 Euro 15.0 6.3 0.0 0.0 0.0 47.0 35.6 35.1 Other foreign currencies 0.0 0.0 0.0 0.0 0.0 0.0 0.0 10.0
Euro area CESEE EU Member States
Estonia National currency 100.0 100.0 100.0 98.0 94.7 99.5 100.0 98.5 Euro 0.0 .. 0.0 .. 0.0 .. 0.0 .. Other foreign currencies 0.0 0.0 0.0 2.0 5.3 0.5 0.0 1.5
Lithuania National currency 62.5 100.0 100.0 100.0 14.0 100.0 10.0 69.4 Euro 32.1 .. 0.0 .. 86.0 .. 53.2 ..Other foreign currencies 5.4 0.0 0.0 0.0 0.0 0.0 36.7 30.6
Latvia National currency 6.7 75.9 0.0 70.4 62.8 100.0 58.6 88.7 Euro 79.7 .. 0.0 .. 37.2 .. 41.4 ..Other foreign currencies 13.6 24.1 0.0 29.6 0.0 0.0 0.0 11.3
Slovenia National currency 100.0 100.0 100.0 100.0 100.0 100.0 100.0 90.4 Euro .. .. .. .. .. .. .. .. Other foreign currencies 0.0 0.0 0.0 0.0 0.0 0.0 0.0 9.6
Slovakia National currency 97.2 98.7 100.0 96.7 100.0 98.9 100.0 93.9 Euro .. .. .. .. .. .. .. .. Other foreign currencies 2.8 1.3 0.0 3.3 0.0 1.1 0.0 6.1
EA-19 National currency 82.2 74.6 83.7 70.9 81.5 82.9 97.6 97.8 Euro .. .. .. .. .. .. .. .. Other foreign currencies 17.8 25.4 16.3 29.1 18.5 17.1 2.4 2.2
Source: ECB, authors‘ calculations.
A sleeping beauty or a dead duck? The state of capital market development in CESEE EU Member States
FOCUS ON EUROPEAN ECONOMIC INTEGRATION Q3/20 21
investment funds were more prevalent (Poland, Romania and Slovakia). The role of debt securities for nonbank financial corporations is negligible across the region apart from Slovakia, while financing through listed shares was notable (and even larger than in the euro area) in Bulgaria, Poland and Slovenia in 2018. Remarkably, Poland’s combined share of these three types of securities in total financial liabili-ties of nonbank financial corporations almost reached the euro area level in 2018.
Debt securities issuance in euro (beside the national currency) was very com-mon among nonbank financial corporations in some non-euro area CESEE EU Member States (Bulgaria, Czechia and Croatia) but negligible in others (Hungary, Poland and Romania; see table 5). Like in the case of banks, nonbank financial cor-porations in euro area CESEE EU Member States rather avoided issuance in foreign currencies, again except for Latvia.
2.2.3 Securities issued by nonfinancial corporations
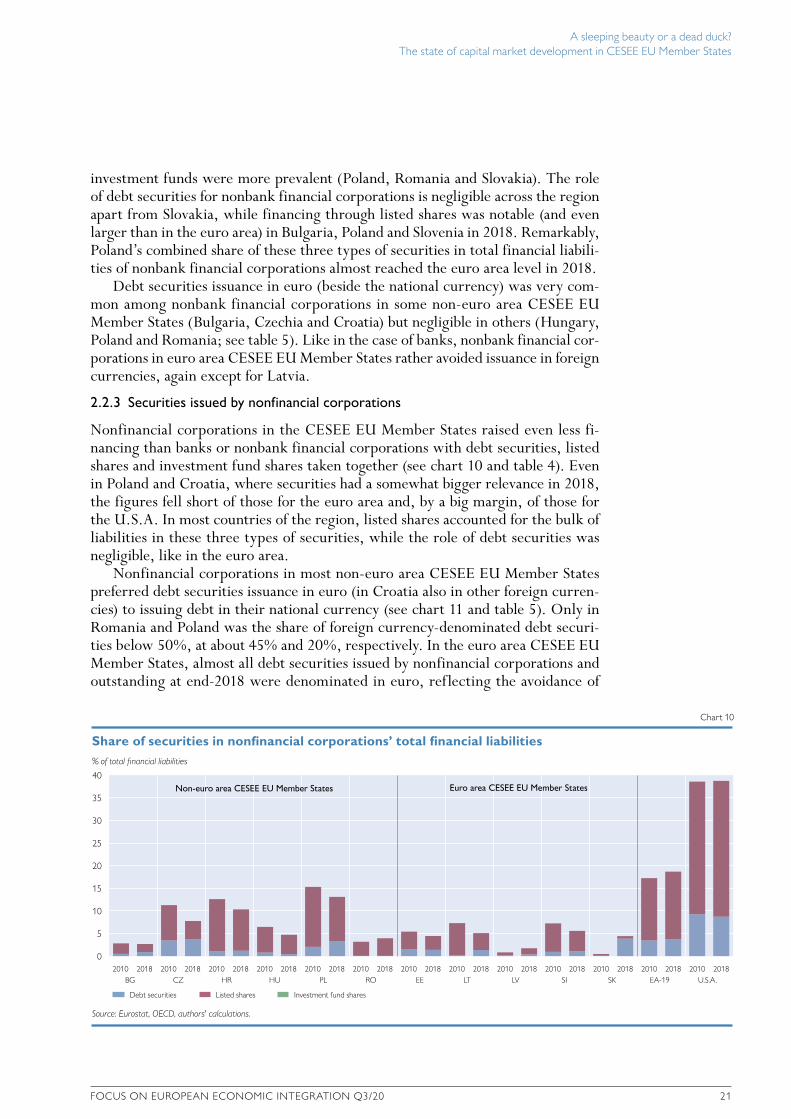
Nonfinancial corporations in the CESEE EU Member States raised even less fi-nancing than banks or nonbank financial corporations with debt securities, listed shares and investment fund shares taken together (see chart 10 and table 4). Even in Poland and Croatia, where securities had a somewhat bigger relevance in 2018, the figures fell short of those for the euro area and, by a big margin, of those for the U.S.A. In most countries of the region, listed shares accounted for the bulk of liabilities in these three types of securities, while the role of debt securities was negligible, like in the euro area.
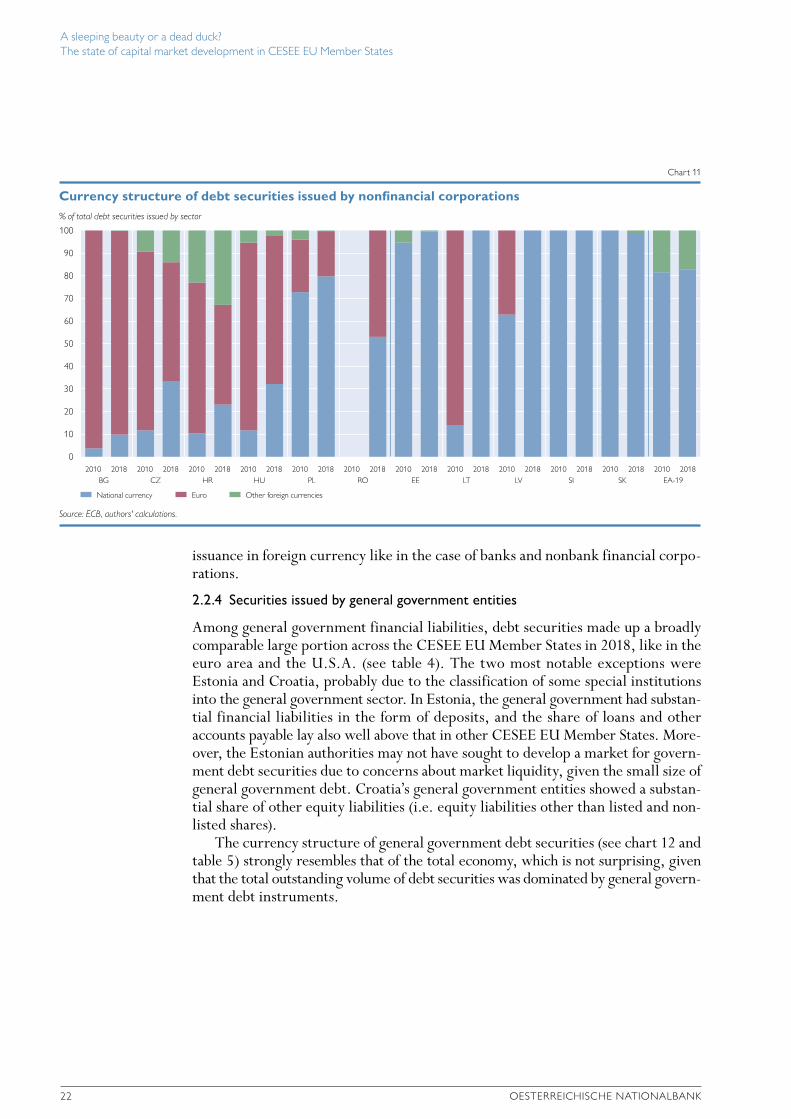
Nonfinancial corporations in most non-euro area CESEE EU Member States preferred debt securities issuance in euro (in Croatia also in other foreign curren-cies) to issuing debt in their national currency (see chart 11 and table 5). Only in Romania and Poland was the share of foreign currency-denominated debt securi-ties below 50%, at about 45% and 20%, respectively. In the euro area CESEE EU Member States, almost all debt securities issued by nonfinancial corporations and outstanding at end-2018 were denominated in euro, reflecting the avoidance of
% of total financial liabilities
40
35
30
25
20
15
10
5
0
Share of securities in nonfinancial corporations’ total financial liabilities
Chart 10
Source: Eurostat, OECD, authors' calculations.
Debt securities Listed shares Investment fund shares
BG CZ HR HU PL RO EE LT LV SI SK EA-19 U.S.A.2010 2018 2010 2018 2010 2018 2010 2018 2010 2018 2010 2018 2010 2018 2010 2018 2010 2018 2010 2018 2010 2018 2010 2018 2010 2018
Non-euro area CESEE EU Member States Euro area CESEE EU Member States
A sleeping beauty or a dead duck? The state of capital market development in CESEE EU Member States
22 OESTERREICHISCHE NATIONALBANK
issuance in foreign currency like in the case of banks and nonbank financial corpo-rations.
2.2.4 Securities issued by general government entities
Among general government financial liabilities, debt securities made up a broadly comparable large portion across the CESEE EU Member States in 2018, like in the euro area and the U.S.A. (see table 4). The two most notable exceptions were Estonia and Croatia, probably due to the classification of some special institutions into the general government sector. In Estonia, the general government had substan-tial financial liabilities in the form of deposits, and the share of loans and other accounts payable lay also well above that in other CESEE EU Member States. More-over, the Estonian authorities may not have sought to develop a market for govern-ment debt securities due to concerns about market liquidity, given the small size of general government debt. Croatia’s general government entities showed a substan-tial share of other equity liabilities (i.e. equity liabilities other than listed and non-listed shares).
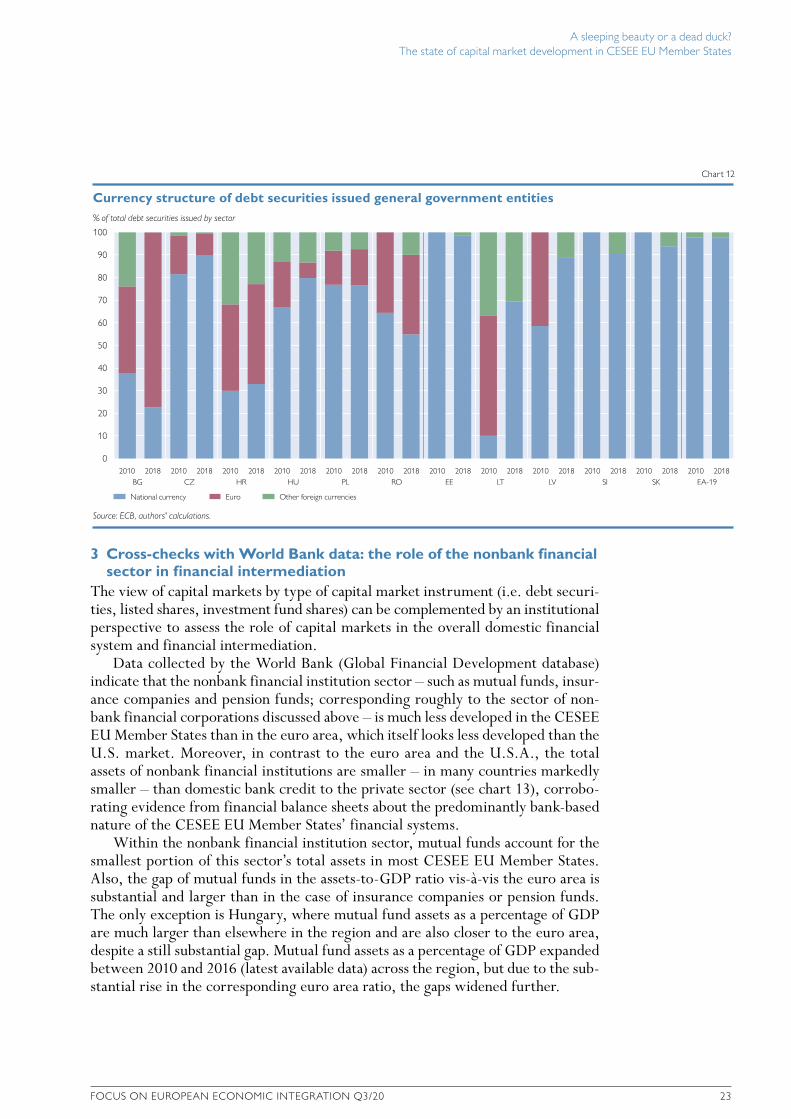
The currency structure of general government debt securities (see chart 12 and table 5) strongly resembles that of the total economy, which is not surprising, given that the total outstanding volume of debt securities was dominated by general govern-ment debt instruments.
% of total debt securities issued by sector
100
90
80
70
60
50
40
30
20
10
0
Currency structure of debt securities issued by nonfinancial corporations
Chart 11
Source: ECB, authors' calculations.
National currency Euro Other foreign currencies
BG CZ HR HU PL RO EE LT LV SI SK EA-192010 2018 2010 2018 2010 2018 2010 2018 2010 2018 2010 2018 2010 2018 2010 2018 2010 2018 2010 2018 2010 2018 2010 2018
% of total debt securities issued by sector
100
90
80
70
60
50
40
30
20
10
0
Currency structure of debt securities issued general government entities
Chart 12
Source: ECB, authors' calculations.
National currency Euro Other foreign currencies
BG CZ HR HU PL RO EE LT LV SI SK EA-192010 2018 2010 2018 2010 2018 2010 2018 2010 2018 2010 2018 2010 2018 2010 2018 2010 2018 2010 2018 2010 2018 2010 2018
A sleeping beauty or a dead duck? The state of capital market development in CESEE EU Member States
FOCUS ON EUROPEAN ECONOMIC INTEGRATION Q3/20 23
3 Cross-checks with World Bank data: the role of the nonbank financial sector in financial intermediation
The view of capital markets by type of capital market instrument (i.e. debt securi-ties, listed shares, investment fund shares) can be complemented by an institutional perspective to assess the role of capital markets in the overall domestic financial system and financial intermediation.
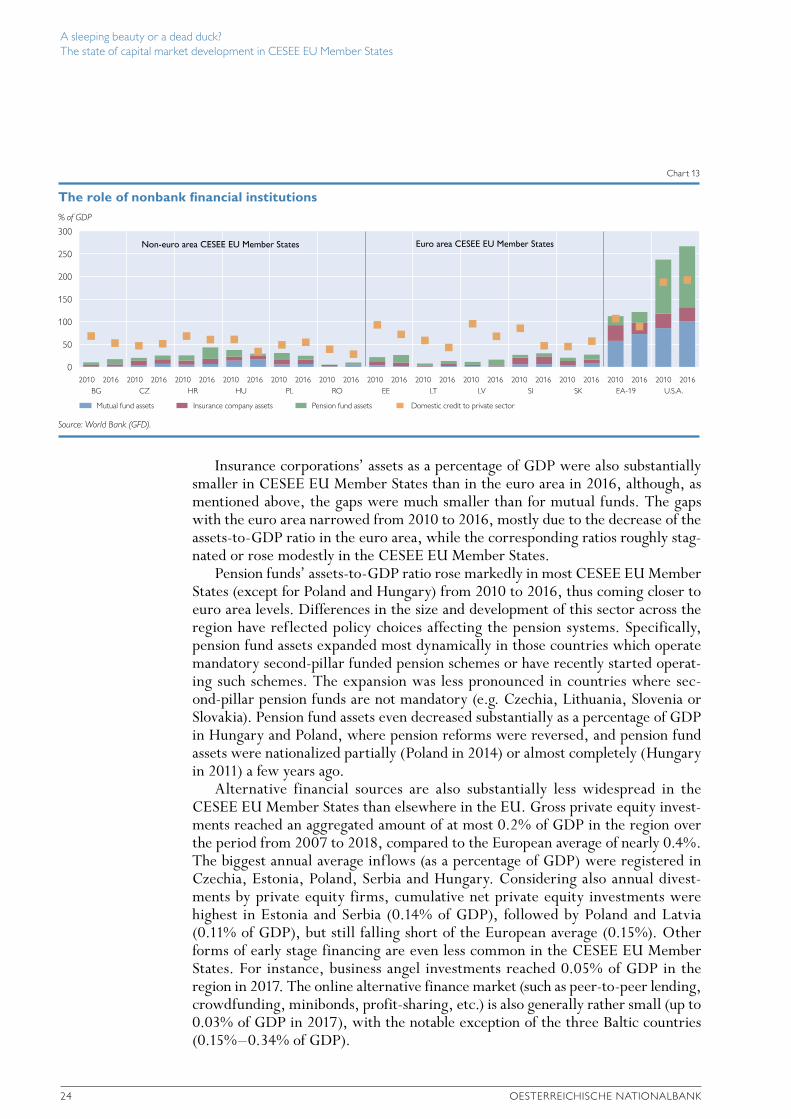
Data collected by the World Bank (Global Financial Development database) indicate that the nonbank financial institution sector – such as mutual funds, insur-ance companies and pension funds; corresponding roughly to the sector of non-bank financial corporations discussed above – is much less developed in the CESEE EU Member States than in the euro area, which itself looks less developed than the U.S. market. Moreover, in contrast to the euro area and the U.S.A., the total assets of nonbank financial institutions are smaller – in many countries markedly smaller – than domestic bank credit to the private sector (see chart 13), corrobo-rating evidence from financial balance sheets about the predominantly bank-based nature of the CESEE EU Member States’ financial systems.
Within the nonbank financial institution sector, mutual funds account for the smallest portion of this sector’s total assets in most CESEE EU Member States. Also, the gap of mutual funds in the assets-to-GDP ratio vis-à-vis the euro area is substantial and larger than in the case of insurance companies or pension funds. The only exception is Hungary, where mutual fund assets as a percentage of GDP are much larger than elsewhere in the region and are also closer to the euro area, despite a still substantial gap. Mutual fund assets as a percentage of GDP expanded between 2010 and 2016 (latest available data) across the region, but due to the sub-stantial rise in the corresponding euro area ratio, the gaps widened further.
issuance in foreign currency like in the case of banks and nonbank financial corpo-rations.
2.2.4 Securities issued by general government entities
Among general government financial liabilities, debt securities made up a broadly comparable large portion across the CESEE EU Member States in 2018, like in the euro area and the U.S.A. (see table 4). The two most notable exceptions were Estonia and Croatia, probably due to the classification of some special institutions into the general government sector. In Estonia, the general government had substan-tial financial liabilities in the form of deposits, and the share of loans and other accounts payable lay also well above that in other CESEE EU Member States. More-over, the Estonian authorities may not have sought to develop a market for govern-ment debt securities due to concerns about market liquidity, given the small size of general government debt. Croatia’s general government entities showed a substan-tial share of other equity liabilities (i.e. equity liabilities other than listed and non-listed shares).
The currency structure of general government debt securities (see chart 12 and table 5) strongly resembles that of the total economy, which is not surprising, given that the total outstanding volume of debt securities was dominated by general govern-ment debt instruments.
% of total debt securities issued by sector
100
90
80
70
60
50
40
30
20
10
0
Currency structure of debt securities issued by nonfinancial corporations
Chart 11
Source: ECB, authors' calculations.
National currency Euro Other foreign currencies
BG CZ HR HU PL RO EE LT LV SI SK EA-192010 2018 2010 2018 2010 2018 2010 2018 2010 2018 2010 2018 2010 2018 2010 2018 2010 2018 2010 2018 2010 2018 2010 2018
% of total debt securities issued by sector
100
90
80
70
60
50
40
30
20
10
0
Currency structure of debt securities issued general government entities
Chart 12
Source: ECB, authors' calculations.
National currency Euro Other foreign currencies
BG CZ HR HU PL RO EE LT LV SI SK EA-192010 2018 2010 2018 2010 2018 2010 2018 2010 2018 2010 2018 2010 2018 2010 2018 2010 2018 2010 2018 2010 2018 2010 2018
A sleeping beauty or a dead duck? The state of capital market development in CESEE EU Member States
24 OESTERREICHISCHE NATIONALBANK
Insurance corporations’ assets as a percentage of GDP were also substantially smaller in CESEE EU Member States than in the euro area in 2016, although, as mentioned above, the gaps were much smaller than for mutual funds. The gaps with the euro area narrowed from 2010 to 2016, mostly due to the decrease of the assets-to-GDP ratio in the euro area, while the corresponding ratios roughly stag-nated or rose modestly in the CESEE EU Member States.
Pension funds’ assets-to-GDP ratio rose markedly in most CESEE EU Member States (except for Poland and Hungary) from 2010 to 2016, thus coming closer to euro area levels. Differences in the size and development of this sector across the region have reflected policy choices affecting the pension systems. Specifically, pension fund assets expanded most dynamically in those countries which operate mandatory second-pillar funded pension schemes or have recently started operat-ing such schemes. The expansion was less pronounced in countries where sec-ond-pillar pension funds are not mandatory (e.g. Czechia, Lithuania, Slovenia or Slovakia). Pension fund assets even decreased substantially as a percentage of GDP in Hungary and Poland, where pension reforms were reversed, and pension fund assets were nationalized partially (Poland in 2014) or almost completely (Hungary in 2011) a few years ago.
Alternative financial sources are also substantially less widespread in the CESEE EU Member States than elsewhere in the EU. Gross private equity invest-ments reached an aggregated amount of at most 0.2% of GDP in the region over the period from 2007 to 2018, compared to the European average of nearly 0.4%. The biggest annual average inflows (as a percentage of GDP) were registered in Czechia, Estonia, Poland, Serbia and Hungary. Considering also annual divest-ments by private equity firms, cumulative net private equity investments were highest in Estonia and Serbia (0.14% of GDP), followed by Poland and Latvia (0.11% of GDP), but still falling short of the European average (0.15%). Other forms of early stage financing are even less common in the CESEE EU Member States. For instance, business angel investments reached 0.05% of GDP in the region in 2017. The online alternative finance market (such as peer-to-peer lending, crowdfunding, minibonds, profit-sharing, etc.) is also generally rather small (up to 0.03% of GDP in 2017), with the notable exception of the three Baltic countries (0.15%–0.34% of GDP).
% of GDP
300
250
200
150
100
50
0
The role of nonbank financial institutions
Chart 13
Source: World Bank (GFD).
Mutual fund assets Insurance company assets Pension fund assets Domestic credit to private sector
BG CZ HR HU PL RO EE LT LV SI SK EA-19 U.S.A.2010 2016 2010 2016 2010 2016 2010 2016 2010 2016 2010 2016 2010 2016 2010 2016 2010 2016 2010 2016 2010 2016 2010 2016 2010 2016
Non-euro area CESEE EU Member States Euro area CESEE EU Member States
A sleeping beauty or a dead duck? The state of capital market development in CESEE EU Member States
FOCUS ON EUROPEAN ECONOMIC INTEGRATION Q3/20 25
4 Structural issues of capital market development in CESEE EU Member States
4.1 Impediments to capital market development
Following mixed developments over the past two decades, capital markets in the CESEE EU Member States are still below their presumed potential. Various factors can be held responsible for this, with the list below being neither exhaustive nor applying equally to all countries or all times.
First, there are historical reasons and legacy issues.13 The first issue in this con-text has its roots in the period of socialism, when nonfinancial companies that were state-owned and administratively linked to the government had a compara-tively strong debtor position, while banks were formed for their benefit and partly even by them. Thus, loan decisions were not the result of banks’ assessment of creditworthiness. Rather, they reflected the arrangement of companies and govern-ment authorities using financing entities. These practices contributed to the legacy of a culture of informality and lack of transparency and openness in society with respect to financing decisions. Companies have thus been hesitant to expose them-selves to constant disclosure requirements and investor control following a stock exchange listing. Hence, for instance, in some countries, firms were listed initially in line with legal requirements but then delisted as soon as legal requirements al-lowed it. However, one might argue that this legacy would not inhibit the emer-gence of stronger private equity markets.
Hence, it is important to recall the following second legacy issue that stems from the final stage of the centrally planned system and the years of transforma-tion: a low level of trust, particularly on the side of investors. People’s financial confidence was eroded by very high inflation coupled with (initially suppressed) currency crises and then banking crises. Add to this disappointing experiences with problematic forms of (coupon) privatizations and financial fraud like e.g. pyramidal schemes in the early 1990s. In the banking sector, the entrance of for-eign-owned banks decisively contributed to stabilization and the stepwise build up of confidence in many countries, luring “mattress money” in foreign currency into foreign currency deposits and, finally, local currency deposits. Following partly clearly excessive and imprudent foreign currency lending before the Great Finan-cial Crisis, the avoidance of a severe banking crisis, thanks to public support in parent banks’ home countries and ample liquidity provision by the ECB, strength-ened public confidence further, implying a large increase of domestic local cur-rency deposits. By contrast, following the problems in the 1990s, there was no comprehensive “quick fix” for the capital markets like that for the banking sector in most countries. However, in some countries, capital markets got some boost from the establishment of pension funds in the context of systemic pension re-forms. Then, during the Great Financial Crisis, stock market investors, mostly foreign and domestic institutional investors, but also some domestic retail inves-tors, were badly hit. Moreover, in some countries, systemic pension reforms were reversed, mostly due to fiscal policy considerations considering the European Union’s fiscal framework, which supported funded pension schemes only partially and temporarily. These reversals implied a substantial downsizing of pension funds
13 We are thankful to an anonymous referee who highlighted some of these issues to us.
A sleeping beauty or a dead duck? The state of capital market development in CESEE EU Member States
26 OESTERREICHISCHE NATIONALBANK
and a weakening of capital market liquidity. Above all, it did not encourage trust in capital market investments in the private sector as an alternative to bank depos-its.
Second, building capital markets takes time. It is now only around 20–25 years that CESEE countries started to implement the legal framework for effective capital markets. Despite substantial progress, for example, in the area of insolvency regu-lation, key indicators such as the length of insolvency procedures or recovery rates still lag behind the EU average in the majority of CESEE EU Member States. In the same vein, the protection of minority investors and corporate transparency are comparably worse in some countries than in the EU on average. The same applies to the regulation of securities exchanges, at least according to data from 2017 when the World Economic Forum last included this indicator in its Global Com-petitiveness database.
Third, levels of capital market development correlate positively with levels of economic development. On the demand side, more advanced economies tend to have more companies that reach the critical size or have sufficiently large growth potential in order to be interesting candidates for local stock markets or bond issu-ance. On the supply side, higher levels of disposable income allow bigger capacities to save and accumulate a larger proportion of those savings in the form of more sophisticated financial assets. Moreover, in the early phase of transition, which was characterized by high inflation and high exchange rate volatility or episodes of sud-den large devaluation/depreciation, economic agents in CESEE countries suffered from the “original sin,” i.e. the lacking opportunity to borrow abroad in their domestic currency, or from the unavailability of long-term borrowing, even domestically. This was detrimental for the development of capital markets and caused delays and setbacks.
Fourth, size matters. Small economies and small populations reduce econo-mies-of-scale effects, meaning higher relative costs for establishing capital market infrastructure and related regulatory and legal system development. Moreover, with euro adoption being a strategic economic policy target for most CESEE EU Member States,14 the prospective future participation in the common capital mar-kets of the euro area may have discouraged a proactive development of local markets for only a “transitional period.”
Small markets also tend to suffer from the lack of liquidity (as suggested by the comparably low stock market turnover velocity rates), which remains a significant disincentive both for potential issuers and investors in the CESEE region. There is a vicious circle in that insufficient liquidity levels prevent investors from entering the market, which in turn prevents liquidity from rising. Insufficient liquidity and the lack of a sufficiently large local investor base may drive companies to foreign capital markets, although there is a substantial domestic bias in equity and debt issuance (owing to e.g. language barriers, documentation requirements), or more often to bank loans.
Fifth, the demand for capital has been driven by specific characteristics. Thus, the involvement of foreign companies has been crucial in the transformation of the
14 EU Member States are – with the exception of Denmark – obliged to introduce the euro at some point in time, pro-vided they fulfil the criteria for euro adoption.
A sleeping beauty or a dead duck? The state of capital market development in CESEE EU Member States
FOCUS ON EUROPEAN ECONOMIC INTEGRATION Q3/20 27
economies in the CESEE region into market economies. Consequently, FDI-related capital plays an important role as a form of financing of (especially larger) non-financial corporations in the region. Financing needs can often be met with FDI equity or intercompany lending from foreign parent companies. Moreover, in for-eign-owned companies financing decisions are often taken and implemented at the group level by the foreign headquarters, thus making local financing unnecessary. In addition, as pointed out above, the local banking sectors in CESEE are predom-inantly foreign-owned, so that banks can rely on parent bank financing (both in form of capital injections and parent bank credit) to complement the local deposit base.
By contrast, SMEs, which account for a substantial portion of value added and employment in the CESEE EU Member States (generally a bigger portion than in the EU as a whole), rather shy away from capital markets due to the complexity of information and cost requirements, covering their external financing needs pre-dominantly by bank loans. Obviously, for individual companies, listing equities on stock exchanges or publicly issuing bonds and complying with related legal re-quirements, involve substantial costs. These costs may be prohibitive especially for smaller companies, keeping them away from capital markets altogether. Corre-spondingly, according to a great majority of SMEs in the CESEE region, the costs and regulatory constraints of being listed outweigh potential benefits, particularly in an environment where domestic bank loans are available in abundance.
In recent years, the environment of high liquidity and low interest rates may have fueled search-for-yield attitudes among capital investors willing to supply capital, but it provided also rather easy access to bank financing for nonfinancial corporations and hence reduced their incentive to venture into the corporate bond market to gain some interest advantage. However, this may change in the wake of the COVID-19 crisis in as far as banks could tighten their lending standards in view of the uncertainties, the economic recession and probably rising provisions for nonperforming loans.
Sixth, capital market development has also been impeded by specific sup-ply-side characteristics. Thus, investor preferences may also play a role in the rela-tively slow development of capital markets in the CESEE EU Member States. Insti-tutional investors in several countries in the region have a preference for domestic sovereign bond holdings while households hold a larger share of their financial as-sets in cash and bank deposits than in the EU as a whole. This issue may be in part related to the fact that financial literacy levels tend to be lower in the CESEE EU Member States than in more advanced EU Member States with deeper capital mar-kets. In addition, given higher owner-occupancy rates in the CESEE EU Member States than in the EU average, presumably a bigger part of households’ overall wealth is locked up in real estate (rather than in financial assets) in the CESEE EU Member States than elsewhere in the EU. Finally, foreign portfolio investors may prefer the shares of a foreign parent company to the domestically listed shares of a subsidiary.
To sum it up, let us quote from a member survey conducted by the CFA Insti-tute, an independent global association for investment management professionals, in early 2018 among 263 investment professionals (portfolio managers, risk man-
A sleeping beauty or a dead duck? The state of capital market development in CESEE EU Member States
28 OESTERREICHISCHE NATIONALBANK
agers, consultants, analysts, senior executives) from eight CESEE countries.15 The survey sought to identify the main factors preventing growth of capital markets and identify possible solutions to foster deeper and more integrated markets in the region. Above all, the respondents shone a light on the scarce supply of listed shares and debt securities, low retail investor demand and administrative burdens that discourage companies from seeking public listings. Further down the list ranked low institutional investor demand, the low level of investor protection and uncer-tainty about the impact of certain EU regulations and directives. Low levels of investor confidence were another factor considered to restrain financial market development in CESEE, with only 38% of respondents having trust in their local market. Nevertheless, respondents did note an improvement in investor protection standards and transparency in their local capital markets compared to the situation five years earlier.
4.2 Efforts already taken to alleviate hindrances
To overcome or at least weaken these impediments, national authorities, interna-tional institutions and the financial industry itself have taken various measures to promote capital markets, as set out for instance in the report released by the Vi-enna Initiative in March 2018 and as summarized in the non-exhaustive list below:
4.2.1 EBRD activities
Among international financial institutions, the European Bank for Reconstruction and Development (EBRD) has been at the vanguard of attempts to boost local capital markets in the CESEE region, developed particularly in the context of the Vienna Initiative. Its so-called Local Currency (LC) and Local Capital Markets (LCM) Initiative, in short LC2 Initiative, launched in 2010, set the following pri-ority issues: improving the legal and regulatory framework, developing financial market infrastructure, supporting institutional investors, promoting better trans-action efficiency and expanding the product range.
According to an internal assessment of the initiative prepared in 2017, the EBRD has indeed dedicated considerable effort and skill to delivering specific transactions and technical cooperation projects, resulting in discrete accomplish-ments in numerous cases. For example, the EBRD contributed to legislative and regulatory improvements through policy dialogue and technical assistance, helped develop benchmark indices, invested in corporate bonds, listed equities and stock exchanges in the region, issued bonds denominated in local currencies on local and international markets and sponsored SEE Link, a regional infrastructure platform for trading securities listed on stock exchanges in six CESEE countries.16 At the same time, the assessment came to the rather critical conclusion that there “appears to be a significant disconnect between, on the one hand, the Bank’s high but unde-fined strategic ambitions for the complex task of transforming LCMs and, on the other, its limited actual capacity to accomplish this given choices it has made about resourcing, prioritization, organization and collaboration with other institutions.”
Therefore, drawing on these lessons, in late 2018 the EBRD’s Board of Direc-tors approved an adapted LC2 Strategy for 2019–2024, setting out in detail how
15 Bulgaria, Cyprus, Czechia, Greece, Hungary, Poland, Romania and Slovenia.16 Bulgaria, Bosnia and Herzegovina, Croatia, North Macedonia, Serbia and Slovenia.
A sleeping beauty or a dead duck? The state of capital market development in CESEE EU Member States
FOCUS ON EUROPEAN ECONOMIC INTEGRATION Q3/20 29
the EBRD would support local currency and capital markets development in its countries of operation. It has been envisaged that LC2 will, for one, facilitate the transition from policy dialogue to investments by the EBRD to support the local currency and capital market development process. Furthermore, efforts will be concentrated on increasing the share of EBRD investments in local currencies and on identifying and supporting sequenced reforms in local capital markets based on four defined priority areas (upgrading the capital markets policy framework, en-hancing the legal and regulatory environment, improving capital market infra-structure, and expanding the product range and the investor base).
4.2.2 National authorities’ strategies
Several countries in the region (e.g. Bulgaria, Czechia, Hungary, Lithuania, Poland) have already adopted national capital market strategies, and others are expected to follow suit. These strategies provide general policy directions, identify challenges to be addressed and define priority actions (e.g. legislative, institutional) to be taken within a certain time period in order to foster local capital market developments. The strategies are mostly agreed on at a governmental level, but also incorporate the views of public authorities and private players.
National governments – alone or in cooperation with stock exchanges – have also been developing financial and investor education programs to raise awareness of the potential benefits of capital markets and increase financial literacy (e.g. in Latvia, Lithuania, Hungary, Croatia, Czechia, Slovakia). Most CESEE countries have also embarked on pension reforms, introducing second and third pillar-funded pension systems with often mandatory participation (at least in the second pillar). Reforms of the insolvency regimes to reduce complexity and time to resolve insol-vencies and raise recovery rates have likewise been beneficial to capital market developments. Also, some countries (e.g. Poland, Hungary) have started public schemes to offer financial support for SMEs in preparing their initial public offerings. Some CESEE countries have introduced public support and a favorable regulatory regime to improve the availability of venture capital, which is especially important for financing start-ups and innovative companies. In some cases, tax legislation has been modified to create incentives for issuers and investors. In Hungary, the central bank bought a majority stake in the Budapest stock exchange (BSE) in 2015, with the explicit aim of implementing a variety of strategic innovations and providing issuers and investors proper incentives.
However, beyond the generally supportive activities for capital market develop-ment over the past two decades, national authorities have taken also measures that have weakened or may weaken capital market development. In Poland and Hungary, the reversal of previous systemic pension reforms, leading to the partial (Poland) or almost complete (Hungary) nationalization of the assets of mandatory sec-ond-pillar pension funds, has weakened the institutional investor base. Also, delib-erate measures to make government securities more attractive for retail investors (e.g. by preferential above-market interest rates, tax exemption for interest in-come, broad marketing channels – like in Hungary since mid-2019) may create undue competition for other, “nonprivileged” forms of investment (like corporate bonds, equity or investment fund shares).
A sleeping beauty or a dead duck? The state of capital market development in CESEE EU Member States
30 OESTERREICHISCHE NATIONALBANK
4.2.3 Market participants’ initiatives
Several stock exchanges in the CESEE EU Member States have undertaken efforts to overcome the issues arising from the small market size. For more than a decade, the Vienna Stock Exchange bundled ownership stakes acquired in various stock exchanges in Eastern Europe (Budapest, Ljubljana, Prague) in a regional holding company (CEESEG AG), which was responsible for the strategic and financial run-ning of the subsidiaries. However, in 2015 CEESEG AG sold its stakes in the Budapest and Ljubljana stock exchanges to the Hungarian central bank and the Zagreb Stock Exchange, respectively. Instead, it has since then focused on regional cooperation in the areas of data vending, index licensing and IT services (via a shared trading system) with around a dozen stock exchanges in Central and Eastern Europe. Sim-ilarly, regional cooperation has taken place in the Baltic countries, with Nasdaq Baltic operating a single trading, clearing and settlement system with harmonized trading rules, market practices and indices, offering investors access to all listed financial instruments in Estonia, Latvia and Lithuania through any of the member exchanges. In Southeastern Europe, SEE Link represents the integration of seven stock exchanges in six countries to create a regional infrastructure to facilitate easier trading of securities on the participating exchanges. Other markets in the region (e.g. Warsaw, Budapest, Bratislava and Bucharest) are not part of any regional alliance but have entered cooperation arrangements with other exchanges (e.g. for trading, clearing, regional equity index).
Furthermore, in order to improve the supply of tradable instruments for inves-tors and to ease access to the capital market for smaller companies, stock exchanges in several countries of the CESEE region have launched dedicated stock market segments for SMEs and bond markets for smaller issuers. These offer lighter listing requirements and lower compliance costs and listing fees, to improve the access of smaller companies to capital markets.
4.3 Potential ways forward
Despite the efforts undertaken so far, it is evident that more remains to be done if one wants to increase the contribution of capital markets to financing domestic investment in the CESEE region. Over the past few years, several institutions have evaluated capital market developments in the region and have come up with pro-posals for their deepening. This section synthetizes the most common proposals, with out implying the endorsement of any specific policy measure.17
• Continue to develop national capital market strategies.• Foster a friendly business environment, e.g. stable legal and judiciary system and
efficient administration. Ensure the rule of law for all market participants. Con-tinue to improve insolvency frameworks to give viable companies a second chance to restructure and offer investors more certainty.
• Establish a sound and harmonized regulatory and supervisory environment for financial markets with strong institutions (eventually through the establishment of a common EU regulatory body). The introduction of common standards would reduce investment costs, boost cross-border investments, improve the level of transparency and enhance investor protection. Common rules across markets would also help narrowing differences in market liquidity.
17 See for example Wright et al. (2016), Silvestri (2019), European Commission (2018a), Vienna Initiative (2018).
A sleeping beauty or a dead duck? The state of capital market development in CESEE EU Member States
FOCUS ON EUROPEAN ECONOMIC INTEGRATION Q3/20 31
• Support the implementation of EU-wide regulatory requirements. In view of ongoing regulatory changes affecting the banking sector (e.g. modified mini-mum requirements for own funds and eligible liabilities (MREL)), there are con-cerns that local bond markets in several CESEE EU Member States are not sufficiently deep and liquid to allow for the smooth absorption of required issu-ance volumes. Moreover, there are concerns that increased bond issuance by banks established in the CESEE region to raise bail-in-able funds may counteract efforts to develop local bond markets for nonfinancial corporations by crowding out nonfinancial corporations’ bond issuance in so far as investor demand does not strengthen sufficiently. As a result, support by international financial insti-tutions in the placement of such bank bonds has been called for. In this vein, the EBRD actively participated in the placement of such bank bonds in Romania in December 2019, by acting as an investor itself and by mobilizing other investors.
• Ease investment regulations of local institutional investors to allow them to invest in a wider range of asset classes (e.g. venture capital, unlisted securities, real estate funds, etc.).
• Strengthen financial literacy among investors, particularly retail investors, so that they better understand capital markets and become aware of potential benefits as well as risks involved by diversifying away from bank deposits and loans. Enhance financial literacy also among (potential) issuers, particularly in the SME segment.
• Develop a local base of issuers. Encourage state-owned enterprises to raise funds through the local capital market by issuing bonds or listing equity. Privatize state-owned enterprises through the local stock exchange.
• Offer targeted assistance to SMEs in their access and participation in the capital market to compensate for excessive costs to prepare initial public offerings and comply with capital market-related administrative and legal requirements (e.g. prospectus, regular public financial reporting, analytical research reports).
• Promote alternative financing for SMEs via instruments like venture capital, private equity, private placements, minibonds or equity crowdfunding.
• Start-ups and high-tech companies, which are essential for economic develop-ment beyond the “middle-income trap,” are said to have rather low asset turn-over (due to, for instance, long research and development phases) and have quite often had difficulties getting bank loans. Fostering private equity funds and venture capital would support these companies and thus strengthen economic develop-ment. During the recovery after the corona crisis, the low interest rate environ-ment will probably prevail for longer and policymakers should make use of the tide from safe-haven flows toward a renewed search for yields, thus benefiting these alternative forms of investment as well.
• Meet the growing demand for green finance. In the coming years, policymakers could use the increased demand for green finance to channel funds into ecolog-ically advanced companies through programs that incentivize, screen and rate such companies.
• Adopt supportive tax measures. Simplify the tax system, including with respect to capital gains and withholding tax. Consider tax incentives for investors in order to attract savings to capital markets, and for certain capital market vehicles for funding to SMEs (e.g. venture capital, private equity). Implement favorable tax treatment and easier tax procedures for companies going public to offset high
A sleeping beauty or a dead duck? The state of capital market development in CESEE EU Member States
32 OESTERREICHISCHE NATIONALBANK
costs that listed companies and to-be-listed companies must incur in relation to higher transparency and regulatory requirements.
• Increase economies of scale by enhanced regional cooperation among govern-ments, market participants and market infrastructure providers, e.g. by expanding existing geographical alliances to non-allied markets and deepening their integration. Create new stock market segments dedicated to listing and trading foreign equities in order to broaden the scope of instruments available to local investors. Facilitate listing on other EU markets for local issuers. Develop cross-border cooperations of national central security depositories to support cross-border trading by simplified clearing and settlement procedures.
• Tackle the impact of COVID-19 on banks’ balance sheets rather sooner than later. The corona-induced recession will probably leave banks with higher volumes of nonperforming loans (NPLs). In the years of NPL work-out following the Great Financial Crisis, capital investors specialized in NPL investments have already penetrated the CESEE region. Often, these are foreign-based, e.g. London-based, investors that focus on specific industries across countries. In cooperation with these investors, NPL trading platforms could be used as a loan price determina-tion tool that should be more efficient than outright sales to single investors.
Several of these proposals in recent years were formulated in the context of the European Union’s project to build a capital markets union, a key priority of the European Commission under President Juncker (Nov. 2014 to Nov. 2019). The capital markets union is seen as necessary to complement the banking union, to strengthen the Economic and Monetary Union and to enhance the international role of the euro and the EU’s global attractiveness as a destination for foreign investments. As a Single Market project, it aims at increasing the access of firms (as issuers) and citizens (as investors) to capital markets, especially in smaller countries and irrespective of where one is physically located in the Single Market. A more level playing field and better use of economies of scale may be considered as further aspects of this project. According to the European Commission, boosting local capital markets is a major goal of the capital markets union, as these markets par-ticularly benefit medium-sized companies that are large enough to tap local capital markets, but too small to look for capital across borders. Geographical proximity is seen as lowering transaction costs and helping investors understand the businesses that they are financially supporting, thus increasing the scope for productively us-ing local savings. In its Communication on the capital markets union of March 2019, the European Commission (2019) assesses that it has already delivered the legislative and nonlegislative measures it committed to in order to put in place the building blocks of the capital markets union. At the same time, it stresses, first, the importance that the co-legislators remain committed to ensuring that all pending legislation is adopted as soon as possible, and second, that in any case it will take some time for the full impact to be felt on the ground.
5 ConclusionsThis note reviews the state of capital markets in CESEE EU Member States and their development over the past decade. It also touches upon the most important factors which have so far prevented a more dynamic development, describes major efforts undertaken by international institutions, national authorities and market players to overcome these detrimental factors and synthesizes proposals made by
A sleeping beauty or a dead duck? The state of capital market development in CESEE EU Member States
FOCUS ON EUROPEAN ECONOMIC INTEGRATION Q3/20 33
various institutions for future action to deepen local capital markets in the region, including in the context of the European Union’s efforts toward a capital markets union.
Three decades after the start of economic transition, capital markets in the CESEE EU Member States continue to be substantially less developed than in the euro area and the U.S.A., judging from the balances of debt securities, listed shares and investment fund shares outstanding. In the case of listed shares outstanding, the volume-to-GDP ratio even declined in most countries of the region over the past few years. Progress has been just as mixed across countries and uneven across time using a longer horizon of 25 years. However, based on financial flows, fund-ing via debt securities in the CESEE EU Member States compares considerably better with the euro area than based on stock data. Nevertheless, this result stems almost exclusively from the issuance of government debt securities.
Looking at the financial liabilities of the total economy as a percentage of GDP, the comparably limited role of debt securities and even more so of listed shares and investment fund shares is apparent. By contrast, loan penetration levels already come closer to the euro area and the U.S.A. Concerning the structure of liabili-ties, the dominant role of loans in CESEE EU Member States becomes even clearer: loans in the CESEE EU Member States account for a larger portion of total finan-cial liabilities than debt securities, listed shares and investment fund shares taken together, while in the euro area (and even more so in the U.S.A.) loans play a less important role than these securities together. In sharp contrast to the euro area and the U.S.A., debt securities outstanding in the CESEE EU Member States are dominated by general government papers. Concerning listed shares, nonfinancial corporations account for the bulk of issuance in all three regions. Listed shares issued by financial corporations are dominated by banks, often subsidiaries of for-eign parent banks, in the CESEE EU Member States and by nonbank financial in-stitutions in the euro area and the U.S.A. With respect to listed shares, CESEE EU Member States lag behind more developed countries not only in terms of market depth but also market efficiency and liquidity, as suggested by substantially lower turnover velocity.
Looking at the financial liabilities of nonfinancial corporations only, listed shares had some relevance in this sector’s funding structure only in Poland and Croatia, but still falling short of their role in the euro area. The role of debt secu-rities issued by nonfinancial corporations was negligible (like in the euro area), with the euro being the currency of denomination of choice in most non-euro area CESEE EU Member States.
Finally, development gaps are also substantial with respect to the role of non-bank financial institutions, such as mutual funds, insurance companies and pension funds in financial intermediation, while the market size of alternative financing sources (e.g. private equity, business angels, online alternative financing) is negli-gible. Moreover, in contrast to the euro area and the U.S.A., the total assets of nonbank financial institutions are smaller – in many countries substantially smaller – than domestic bank credit to the private sector, confirming the predominantly bank-based nature of the CESEE EU Member States’ financial systems.
Further to the overall finding of gaps between the CESEE countries and the euro area, we also found substantial heterogeneity across the CESEE region with respect to the overall development of capital markets, the role of securities in the
A sleeping beauty or a dead duck? The state of capital market development in CESEE EU Member States
34 OESTERREICHISCHE NATIONALBANK
financing of both the total economy and individual institutional sectors and the currency structure of debt securities.
Expecting that the development of capital markets could generate substantial additional financing opportunities for the corporate sector, international institu-tions, national authorities and market participants have taken various supportive measures over the past 10 to 15 years. These have included the launch of national capital market strategies, measures to promote financial literacy, support for SMEs in going public, new market segments on stock exchanges with lighter regulatory requirements designed specifically for smaller companies, regional cooperation of stock exchanges, etc. We discussed several historical and structural reasons why capital markets in CESEE continue to play a rather marginal role in financing the private sector. Among these figure inter alia the legacy of informality, the disappoint-ment with certain privatization procedures, the small size of most CESEE econ-omies, the dominance of FDI, higher owner-occupancy rates locking a larger part of household wealth in real estate, the stock market bust during the Great Finan-cial Crisis discouraging retail equity investors and also national measures that weakened capital markets development, such as for example the dismantling or partial dismantling of private pension funds in Hungary and Poland in line with new fiscal rules and policy considerations. Assessing or estimating the effects of the various measures to promote capital markets in the individual CESEE countries and gauging to what extent this might explain the heterogeneity within the region would go beyond the scope of this overview and remains a challenge for other authors.
The still fairly limited state of development of CESEE capital markets suggests that more remains to be done if one wants to increase the contribution of capital markets to financing domestic investment. In recent years, various institutions have suggested a wide range of measures to prop up capital markets in the region. These proposals include the launch of additional national capital market strategies, improvements in the business environment (e.g. judiciary, government administra-tion, rule of law), enhancements to the regulatory and supervisory frameworks (including at the regional level) and support for the implementation of EU-wide regulatory requirements (e.g. related to MREL). Moreover, the strengthening of financial literacy among (retail) investors, and also among potential (SME) issuers, the development of the local investor and issuer base, including by tax incentives and targeted assistance especially for SMEs, start-ups and high-tech companies, as well as the regional cooperation of national governments and stock exchanges to increase economies of scale rank prominently among the suggestions. Taking the opportunities of green finance proactively and tackling the impact of COVID-19 on banks’ balance sheets via NPL trading platforms linked to specialized capital investors remain current challenges. Such measures, if decided and implemented, could possibly prevent the sleeping beauty from turning into a dead duck.
References:Arpa M., T. Reininger and Z. Walko. 2005. Can Banking Intermediation in the Central and
Eastern European Countries Ever Catch up with the Euro Area? In: Focus on European Economic Integration Q2/05. OeNB. 110–133.
Cambridge Centre for Alternative Finance. 2016. Sustaining Momentum: The 2nd European Alternative Finance Industry Report.
A sleeping beauty or a dead duck? The state of capital market development in CESEE EU Member States
FOCUS ON EUROPEAN ECONOMIC INTEGRATION Q3/20 35
Cambridge Centre for Alternative Finance. 2018. Expanding Horizons: The 3rd European Alternative Finance Industry Report.
Cambridge Centre for Alternative Finance. 2019. Shifting Paradigms: The 4th European Alternative Finance Benchmarking Report.
EBAN – European Trade Association for Business Angels, Seed Funds and Early Stage Market Players. 2016 and 2017. Statistics Compendium: European Early Stage Market Statistics.
EBRD. 2017. EBRD Support for the Development of Local Capital Markets. EBRD Evaluation Department Special Study. July. www.ebrd.com/evaluation
EBRD. 2018. LC2 Strategy 2019–2024. November.European Commission. 2018a. European Financial Stability and Integration Review 2018.European Commission. 2018b. The 2018 Pension Adequacy Report: Current and Future
Income Adequacy in Old Age in the EU. Volume II. Country profiles.European Commission. 2019. Capital Markets Union. Communication (2019) 136 final. Invest Europe. 2012 to 2018. Central and Eastern Europe Statistics. Annual private equity statistics.Invest Europe. 2019. European Private Equity Activity 2018. Statistics on Fundraising, Invest-
ments and Divestments. May.Klapper L., A. Lusardi and P. van Oudheusden. 2015. Financial Literacy Around the World:
Insights from the Standard & Poor’s Ratings Services Global Financial Literacy Survey. November. https://gflec.org/wp-content/uploads/2015/11/3313-Finlit_Report_FINAL–5.11.16.pdf
OECD. 2016. OECD/INFE International Survey of Adult Financial Literacy Competencies. www.oecd.org/finance/OECD-INFE-International-Survey-of-Adult-Financial-Literacy-Competencies.pdf
Panagiotis A. and W. Wright. 2019. Unlocking the Growth Potential in European Capital Markets. June. www.newfinancial.org
Silvestri R. 2019. Unlocking the Potential of Capital Markets in Central and Eastern European Countries. January. https://blogs.cfainstitute.org/marketintegrity/2019/01/29/unlocking-the-po/-tential-of-capital-markets-in-central-and-eastern-european-countries/
Vienna Initiative. 2018. Report by the Working Group on Capital Markets Union. March. http://vienna-initiative.com/resources/themes/vienna/wp-content/uploads/2018/03/VI-CMU-Working-Group-Final-Report-March-2018.pdf
Whitehouse E. 2011. Reversals of Systemic Pension Reforms in Central and Eastern Europe: Implications. OECD Social Policy Division.
Wright W., J. Suarez, P. McGhee and L. Bax. 2016. The Benefits of Capital Markets to High Potential EU Economies. November. www.newfinancial.org, www.afme.eu.