Embed Size (px)
Citation preview

F O C U S E D O N T H E F U T U R E2 01 5 A N N UA L R E P O RT
INFRASTRUCTURE GROUP
06 Astec and Dillman Equipment 08 Roadtec 10 Carlson Paving Products 12 Astec Australia 14 Astec Mobile Machinery
AGGREGATE & MINING GROUP
16 Telsmith 18 Osborn Engineered Products 20 Breaker Technology 22 Astec do Brasil 24 Kolberg-Pioneer 26 Johnson Crushers
International 28 Astec Mobile Screens 30 Telestack
ENERGY GROUP
32 Heatec 34 CEI Enterprises 36 Peterson Pacific Corp. 38 GEFCO
CORPORATE INFORMATION 40 Corporate Executive Officers
(in thousands, except as noted*) 2015 2014 2013 2012 2011
OPERATING RESULTS
�Net sales $983,157 $ 975,595 $ 932,998 $ 936,273 $ 908,641
�Net income attributable to controlling interest 32,797 34,458 39,042 40,828 40,563
FINANCIAL POSITION
�Total assets $777,353 $ 802,265 $ 749,291 $ 728,783 $ 719,481
�Working capital 399,785 388,862 385,680 355,336 330,519
�Equity 609,858 596,152 577,311 547,534 528,098
PER COMMON SHARE*
Net income attributable to controlling interest
�Basic $ 1.43 $ 1.51 $ 1.72 $ 1.80 $ 1.80
�Diluted 1.42 1.49 1.69 1.77 1.76
�Book value per common share at year end 26.30 25.62 24.85 23.68 22.95
OTHER DATA Weighted average number of common
shares outstanding
��Basic 22,934 22,819 22,749 22,680 22,589
��Diluted 23,120 23,105 23,081 23,051 22,984
Associates* 3,740 3,952 3,708 3,860 3,885
CONTENTS
01 Our Industry Leading Footprint 02 Letter to Shareholders 04 New Products and Technologies
FINANCIAL OVERVIEW
I N F R A S T R U C T U R E G R O U P
1 Astec
2 Dillman Equipment
3 Roadtec
4 Carlson Paving Products
5 Astec Australia
6 Astec Mobile Machinery
A G G R E G A T E & M I N I N G G R O U P
7 Telsmith
8 Osborn Engineered Products
9 Breaker Technology
10 Astec do Brasil
11 Kolberg-Pioneer
12 Johnson Crushers International
13 Astec Mobile Screens
14 Telestack
E N E R G Y G R O U P
15 Heatec
16 CEI Enterprises
17 Peterson Pacific Corp.
18 GEFCO 8
10
5
14
6
INDUSTRY LEADING FOOTPRINT
15
7
16
17
18
2
111
11
3
12
4
13
9
THE COMPANIES OF ASTEC INDUSTRIES, INC. MANUFACTURE MORE THAN 220 PRODUCTS
FOR A GLOBAL CUSTOMER BASE OPERATING IN THE SECTORS OF INFRASTRUCTURE,
AGGREGATES, MINING, AND ENERGY.
EUROPE
AUSTRALIA
NORTH AMERICA
SOUTH AMERICA
AFRICA
ASTEC INDUSTRIES, INC. 1 2015 ANNUAL REPORT
Our corporate management team and subsidiary presidents took some time in September and together developed a five-year strategic plan. We came away from that meeting with a renewed focus on our goal to grow our company deliberately and strategically through new product releases and market share gains; while adding new subsidiaries through acquisitions in the industries we serve.
We faced many challenges during 2015 but gained market share in some areas and improved our operations. First, we were challenged by a strong United States dollar, which impeded our ability to sell equipment for export by making it more expensive for our international customers. Second, the low cost of oil essentially ceased the purchasing of equipment by our customers in the oil industry. Third was the slowdown of global mining activity, which greatly impacted the mining industry's purchasing ability of equipment. Finally, there was no long-term federal highway bill in the United States, which kept infrastructure customers cautious and conservative with regard to major capital expenditures for equipment.
Our team did well, offsetting the obstacles through market share gains in the United States,
lean manufacturing efforts, and strategic purchasing from our partner vendors. The market share gains were a result of sales efforts and new product development across our subsidiaries. Our lean manufacturing effort at each subsidiary has resulted in improvement in their operations. Finally, our purchasing departments worked with our vendors to ensure the best price levels available while not sacrificing quality.
The result of these company-wide efforts was sustained margins and slightly increased volume despite the global environment. We are proud of our team effort and excited for what is in front of us.
For the first time in over a decade, the United States has a long-term highway bill in place. We are already experiencing the impact of the bill with increased sales activity from infrastructure group customers. We are encouraged about our prospects during the first 3 to 4 years of this bill.
In addition to the highway bill, our wood pellet production plants are gaining momentum. We were excited to announce in 2015 a $30 million order, and the outlook is good for these plants. There is great potential in this industry over the next five years.
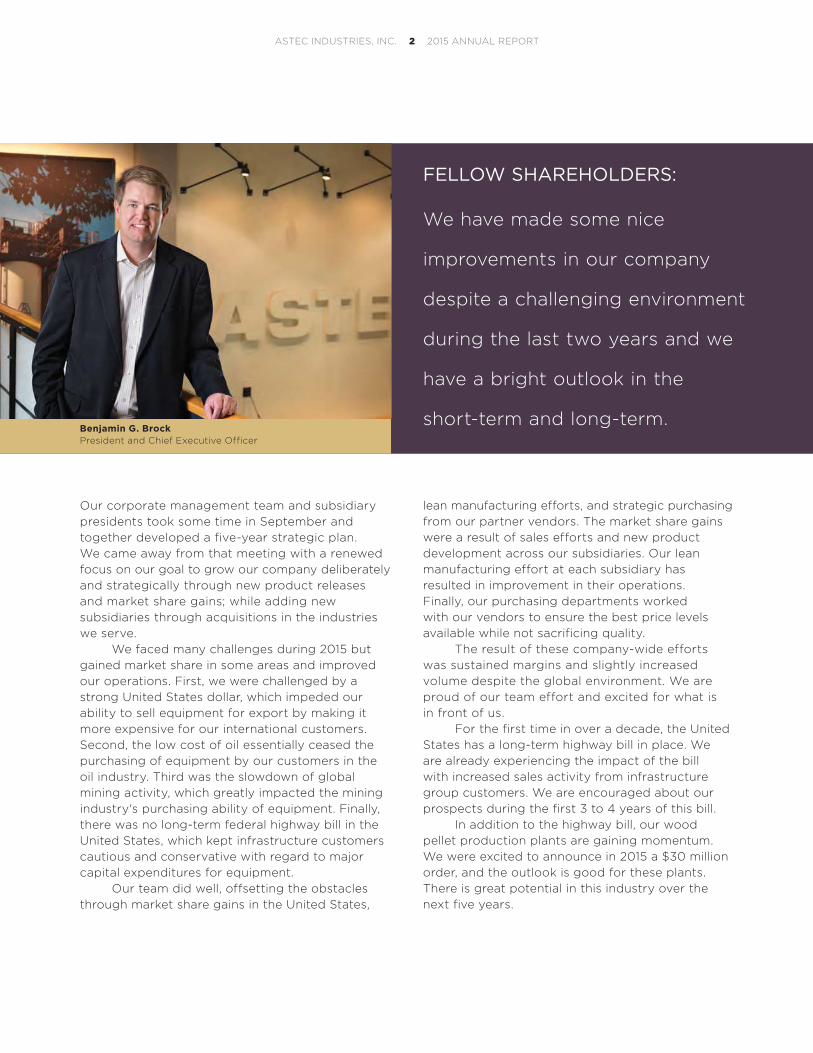
Benjamin G. BrockPresident and Chief Executive Officer
FELLOW SHAREHOLDERS:
We have made some nice
improvements in our company
despite a challenging environment
during the last two years and we
have a bright outlook in the
short-term and long-term.
ASTEC INDUSTRIES, INC. 2 2015 ANNUAL REPORT
The 2015 challenges of a strong United States dollar, low oil prices, and the global mining slowdown look to be ongoing in 2016. Our work to offset these lies in new products that will help our customers be more successful. We will also work to fill our manufacturing plants that are affected by the low oil prices and mining slowdown with new products and products from divisions with strong order activity, and we will work to grow our parts and service sales globally.
Our effort to add new subsidiaries to our family of companies is on-going and we have a goal for one or two acquisitions during 2016. However, we will only acquire companies if thereis a strategic fit with our business and a cultural fit with our core values.
We will continue to focus on sales and gross margin improvement in 2016. We continue to benchmark between subsidiaries in more formal ways, push our R&D efforts across the board, and we are maintaining our international sales and service structure so that we are ready whenever the United States dollar weakens again.
Changing subjects, many of you know that our company’s founder, and my father, J. Don Brock passed away on March 10, 2015. It is no secret how much our company meant to him and how much he meant to our company. We miss him. Many people have commented to me that I have big shoes to fill. My reply was that there are no size “Don” shoes, and that we are going to fill his shoes together as a team going ahead.
I am pleased to report that we, the team, are filling his shoes in a way that we think would make him proud. We are moving ahead with a focus on the future. The future is bright.
Thank you for taking the time to read this letter and thank you for your support.
Sincerely,
Benjamin G. BrockPresident and Chief Executive Officer Astec Industries, Inc.
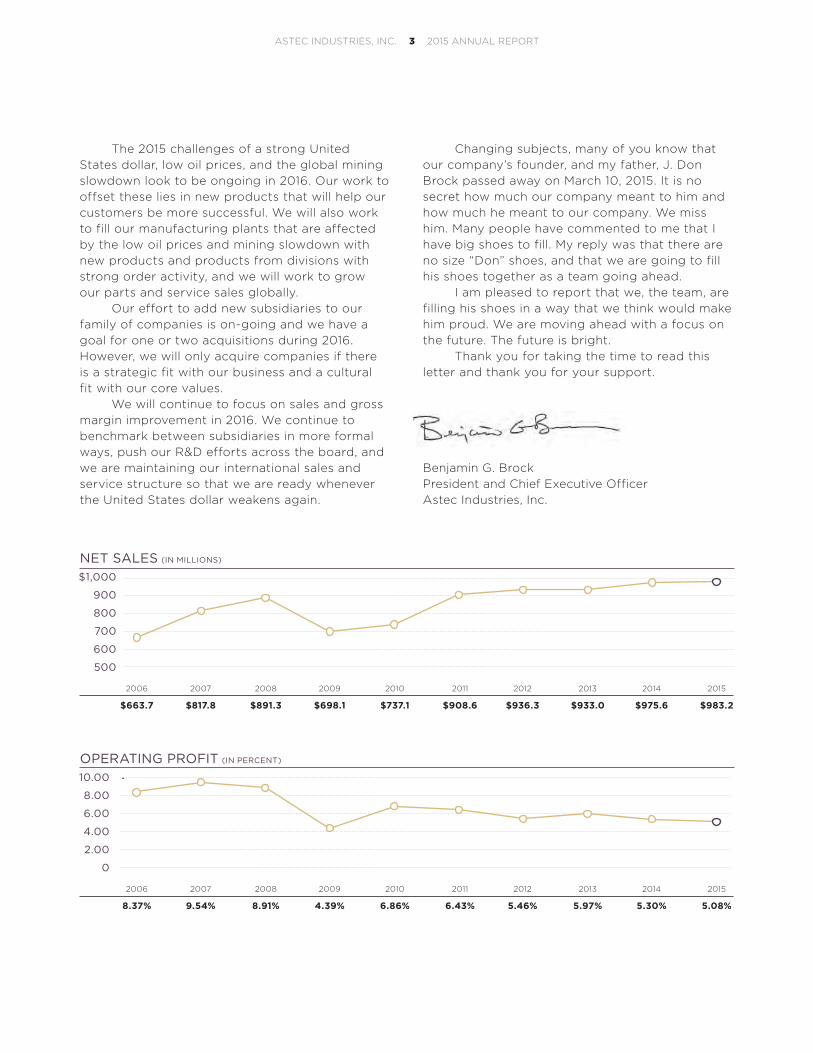
OPERATING PROFIT (IN PERCENT)
10.00
8.00
6.00
4.00
2.00
0
NET SALES (IN MILLIONS)
$1,000
900
800
700
600
500
2006 2007 2008 2009 2010 2011 2012 2013 2014 2015
$663.7 $817.8 $891.3 $698.1 $737.1 $908.6 $936.3 $933.0 $975.6 $983.2
2006 2007 2008 2009 2010 2011 2012 2013 2014 2015
8.37% 9.54% 8.91% 4.39% 6.86% 6.43% 5.46% 5.97% 5.30% 5.08%
ASTEC INDUSTRIES, INC. 3 2015 ANNUAL REPORT
H YBRID P ROCESS R E ADY M IX P L ANT
INVESTING IN NEW PRODUCTS, TECHNOLOGIES AND MARKETS
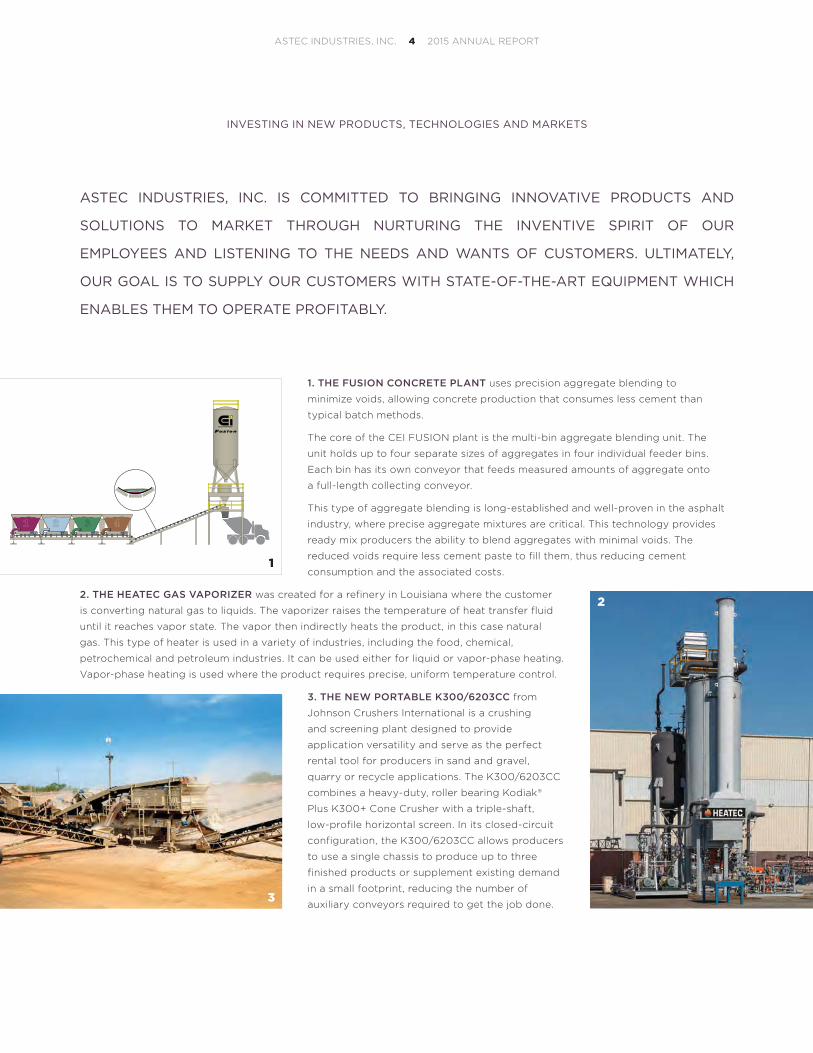
1. THE FUSION CONCRETE PLANT uses precision aggregate blending to
minimize voids, allowing concrete production that consumes less cement than
typical batch methods.
The core of the CEI FUSION plant is the multi-bin aggregate blending unit. The
unit holds up to four separate sizes of aggregates in four individual feeder bins.
Each bin has its own conveyor that feeds measured amounts of aggregate onto
a full-length collecting conveyor.
This type of aggregate blending is long-established and well-proven in the asphalt
industry, where precise aggregate mixtures are critical. This technology provides
ready mix producers the ability to blend aggregates with minimal voids. The
reduced voids require less cement paste to fill them, thus reducing cement
consumption and the associated costs.
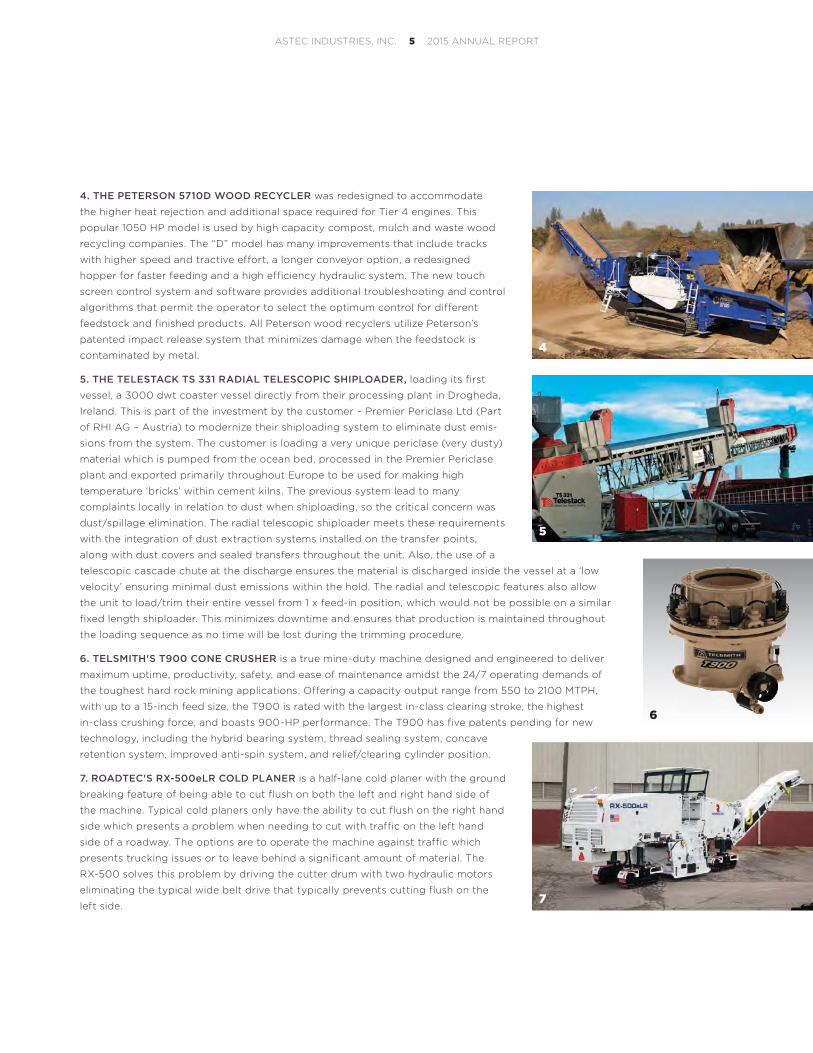
2. THE HEATEC GAS VAPORIZER was created for a refinery in Louisiana where the customer
is converting natural gas to liquids. The vaporizer raises the temperature of heat transfer fluid
until it reaches vapor state. The vapor then indirectly heats the product, in this case natural
gas. This type of heater is used in a variety of industries, including the food, chemical,
petrochemical and petroleum industries. It can be used either for liquid or vapor-phase heating.
Vapor-phase heating is used where the product requires precise, uniform temperature control.
3. THE NEW PORTABLE K300/6203CC from
Johnson Crushers International is a crushing
and screening plant designed to provide
application versatility and serve as the perfect
rental tool for producers in sand and gravel,
quarry or recycle applications. The K300/6203CC
combines a heavy-duty, roller bearing Kodiak®
Plus K300+ Cone Crusher with a triple-shaft,
low-profile horizontal screen. In its closed-circuit
configuration, the K300/6203CC allows producers
to use a single chassis to produce up to three
finished products or supplement existing demand
in a small footprint, reducing the number of
auxiliary conveyors required to get the job done.
ASTEC INDUSTRIES, INC. IS COMMITTED TO BRINGING INNOVATIVE PRODUCTS AND
SOLUTIONS TO MARKET THROUGH NURTURING THE INVENTIVE SPIRIT OF OUR
EMPLOYEES AND LISTENING TO THE NEEDS AND WANTS OF CUSTOMERS. ULTIMATELY,
OUR GOAL IS TO SUPPLY OUR CUSTOMERS WITH STATE-OF-THE-ART EQUIPMENT WHICH
ENABLES THEM TO OPERATE PROFITABLY.
2
1
3
ASTEC INDUSTRIES, INC. 4 2015 ANNUAL REPORT
4. THE PETERSON 5710D WOOD RECYCLER was redesigned to accommodate
the higher heat rejection and additional space required for Tier 4 engines. This
popular 1050 HP model is used by high capacity compost, mulch and waste wood
recycling companies. The “D” model has many improvements that include tracks
with higher speed and tractive effort, a longer conveyor option, a redesigned
hopper for faster feeding and a high efficiency hydraulic system. The new touch
screen control system and software provides additional troubleshooting and control
algorithms that permit the operator to select the optimum control for different
feedstock and finished products. All Peterson wood recyclers utilize Peterson’s
patented impact release system that minimizes damage when the feedstock is
contaminated by metal.
5. THE TELESTACK TS 331 RADIAL TELESCOPIC SHIPLOADER, loading its first
vessel, a 3000 dwt coaster vessel directly from their processing plant in Drogheda,
Ireland. This is part of the investment by the customer – Premier Periclase Ltd (Part
of RHI AG – Austria) to modernize their shiploading system to eliminate dust emis-
sions from the system. The customer is loading a very unique periclase (very dusty)
material which is pumped from the ocean bed, processed in the Premier Periclase
plant and exported primarily throughout Europe to be used for making high
temperature ‘bricks’ within cement kilns. The previous system lead to many
complaints locally in relation to dust when shiploading, so the critical concern was
dust/spillage elimination. The radial telescopic shiploader meets these requirements
with the integration of dust extraction systems installed on the transfer points,
along with dust covers and sealed transfers throughout the unit. Also, the use of a
telescopic cascade chute at the discharge ensures the material is discharged inside the vessel at a ‘low
velocity’ ensuring minimal dust emissions within the hold. The radial and telescopic features also allow
the unit to load/trim their entire vessel from 1 x feed-in position, which would not be possible on a similar
fixed length shiploader. This minimizes downtime and ensures that production is maintained throughout
the loading sequence as no time will be lost during the trimming procedure.
6. TELSMITH'S T900 CONE CRUSHER is a true mine-duty machine designed and engineered to deliver
maximum uptime, productivity, safety, and ease of maintenance amidst the 24/7 operating demands of
the toughest hard rock mining applications. Offering a capacity output range from 550 to 2100 MTPH,
with up to a 15-inch feed size, the T900 is rated with the largest in-class clearing stroke, the highest
in-class crushing force, and boasts 900-HP performance. The T900 has five patents pending for new
technology, including the hybrid bearing system, thread sealing system, concave
retention system, improved anti-spin system, and relief/clearing cylinder position.
7. ROADTEC'S RX-500eLR COLD PLANER is a half-lane cold planer with the ground
breaking feature of being able to cut flush on both the left and right hand side of
the machine. Typical cold planers only have the ability to cut flush on the right hand
side which presents a problem when needing to cut with traffic on the left hand
side of a roadway. The options are to operate the machine against traffic which
presents trucking issues or to leave behind a significant amount of material. The
RX-500 solves this problem by driving the cutter drum with two hydraulic motors
eliminating the typical wide belt drive that typically prevents cutting flush on the
left side.
4
7
5
6
ASTEC INDUSTRIES, INC. 5 2015 ANNUAL REPORT
Astec offers a complete line
of portable, relocatable and
stationary asphalt plant
equipment produced under the
Astec and the Dillman brands.
In addition, Astec manufactures
soil remediation equipment and
wood pellet processing plants.
At the close of 2015, Astec saw its
pellet plant business grow with
the sale of a pellet production line
for a new facility in Arkansas.
Astec maintains a leadership
position in the North American
asphalt mixing plant market
through its status as an innovator
offering the most complete line
of mixing systems including the
counter-flow Unidrum™ and the
Double Barrel® drum lineup.
In addition, the V-pack™ stack
temperature control system
continues to garner praise for
allowing asphalt mixing plants to
operate in the most efficient way
possible through an innovative
automated control system.
With the passage of a long-term
federal highway bill in the United
States at the close of 2015,
Astec is optimistic about future
prospects and plans to continue
to position itself to take full
advantage of all opportunities.
ASTEC AND DILLMAN EQUIPMENT LOCATIONS: CHATTANOOGA, TENNESSEE, USA AND
PRAIRIE DU CHIEN, WISCONSIN, USA
REPORTING GROUP: INFRASTRUCTURE
INDUSTRIES SERVED:
PRODUCTS AND SERVICES: Portable Asphalt Plants Soil Remediation Equipment
Relocatable Asphalt Plants Wood Pellet Processing Plants
Stationary Asphalt Plants Control Systems
Astec continues to be a world leader in
Hot and Warm Mix Asphalt equipment
technology.
INFRASTRUCTURE ENERGY
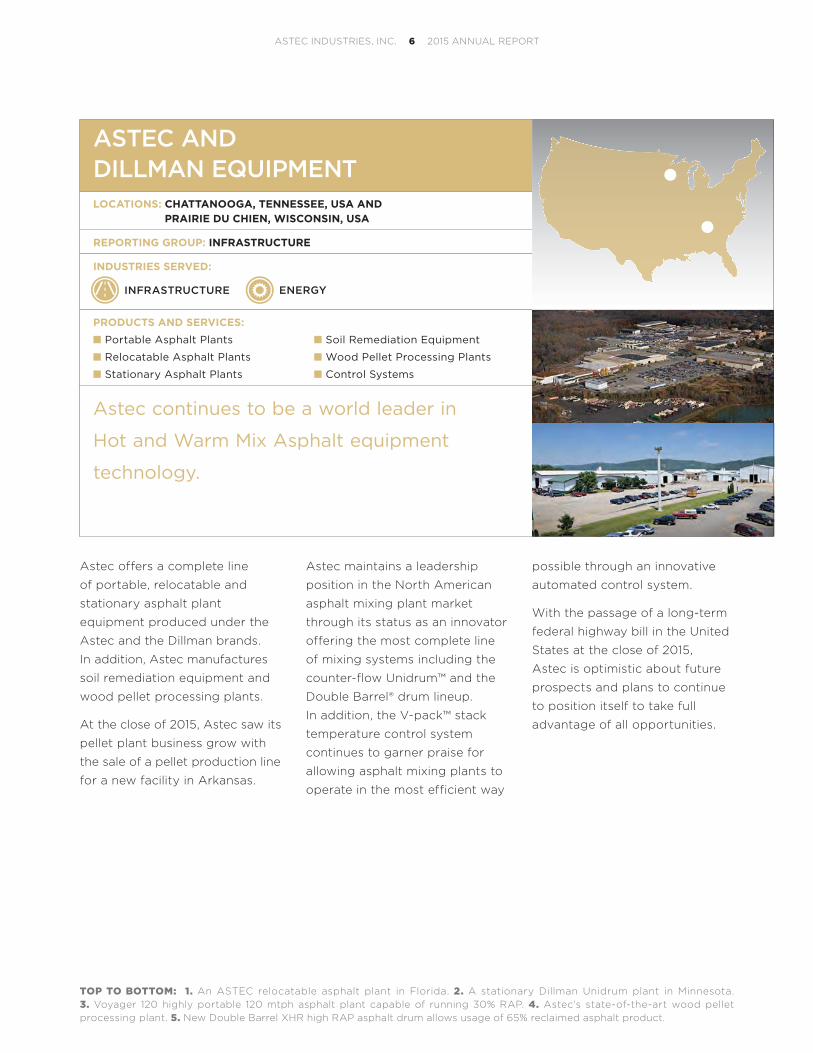
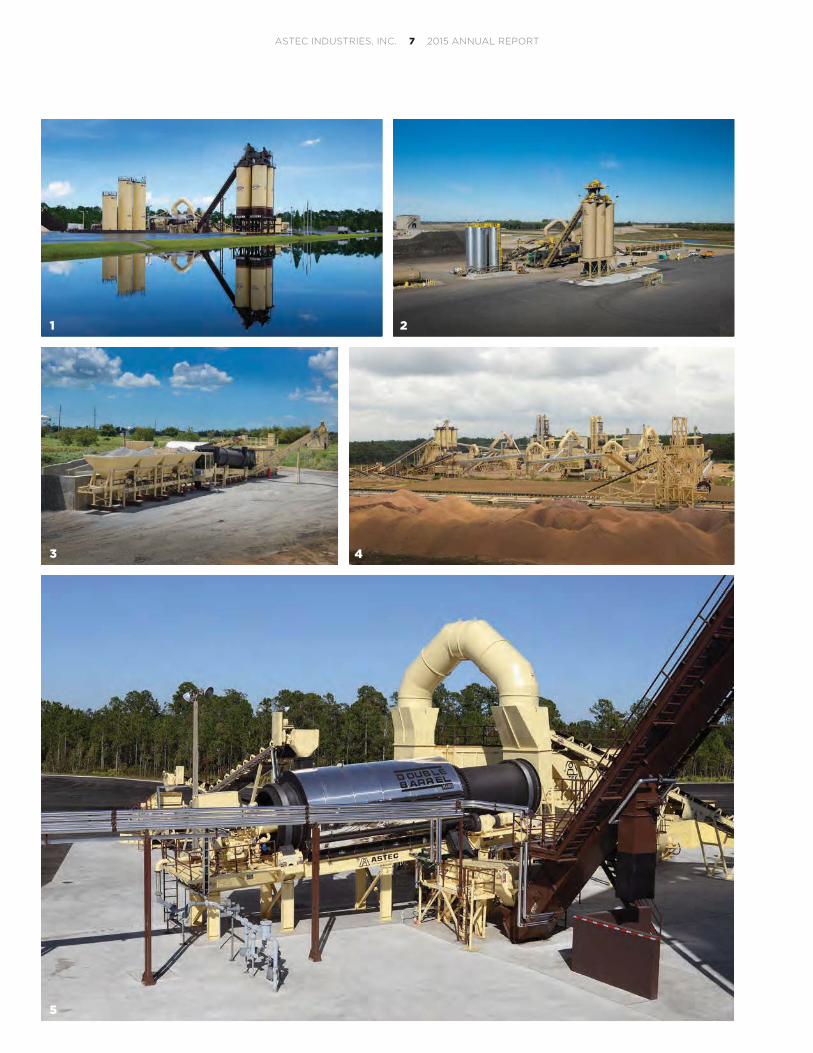
TOP TO BOTTOM: 1. An ASTEC relocatable asphalt plant in Florida. 2. A stationary Dillman Unidrum plant in Minnesota.3. Voyager 120 highly portable 120 mtph asphalt plant capable of running 30% RAP. 4. Astec’s state-of-the-art wood pellet processing plant. 5. New Double Barrel XHR high RAP asphalt drum allows usage of 65% reclaimed asphalt product.
ASTEC INDUSTRIES, INC. 6 2015 ANNUAL REPORT
1 2
5
3 4
ASTEC INDUSTRIES, INC. 7 2015 ANNUAL REPORT
INFRASTRUCTURE
ROADTECLOCATION: CHATTANOOGA, TENNESSEE, USA
REPORTING GROUP: INFRASTRUCTURE
INDUSTRIES SERVED:
PRODUCTS AND SERVICES: Milling Machines Highway Class Asphalt Pavers
Cold In Place Asphalt Recyclers Material Transfer Vehicles
Commercial Class Asphalt Pavers Self-Propelled Brooms
Founded in 1981, Roadtec, began as a
manufacturer of asphalt pavers. Roadtec offers
an extensive product line, including cold
planers, cold in place recyclers, soil stabilizers,
brooms and material transfer vehicles.
In 2015, Roadtec continued to
update and refine its existing
products with the latest Tier 4
Final emissions standards and
operational features as well
as continuously improving its
already industry leading
customer service. Further
development and promotion of
the company’s ground breaking
Guardian telematics system
allows Roadtec to remotely
diagnose issues and see the
operation of a machine in real
time. This combined with two-way
communication with the machine
allows Roadtec to always be
there for their customers even
when they are far away.
Roadtec greatly expanded its line
of competitive wear parts for
other makes and models of
asphalt paving and cold planing
equipment and is aggressively
promoting these new parts.
This is an area of business that
is rapidly growing and allows
Roadtec to expose customers
of the competition to its world-
renowned customer service.
Roadtec will carry its expanded
product line and excellent
service reputation into 2016
with optimism and continued
focus on customer support
and satisfaction.
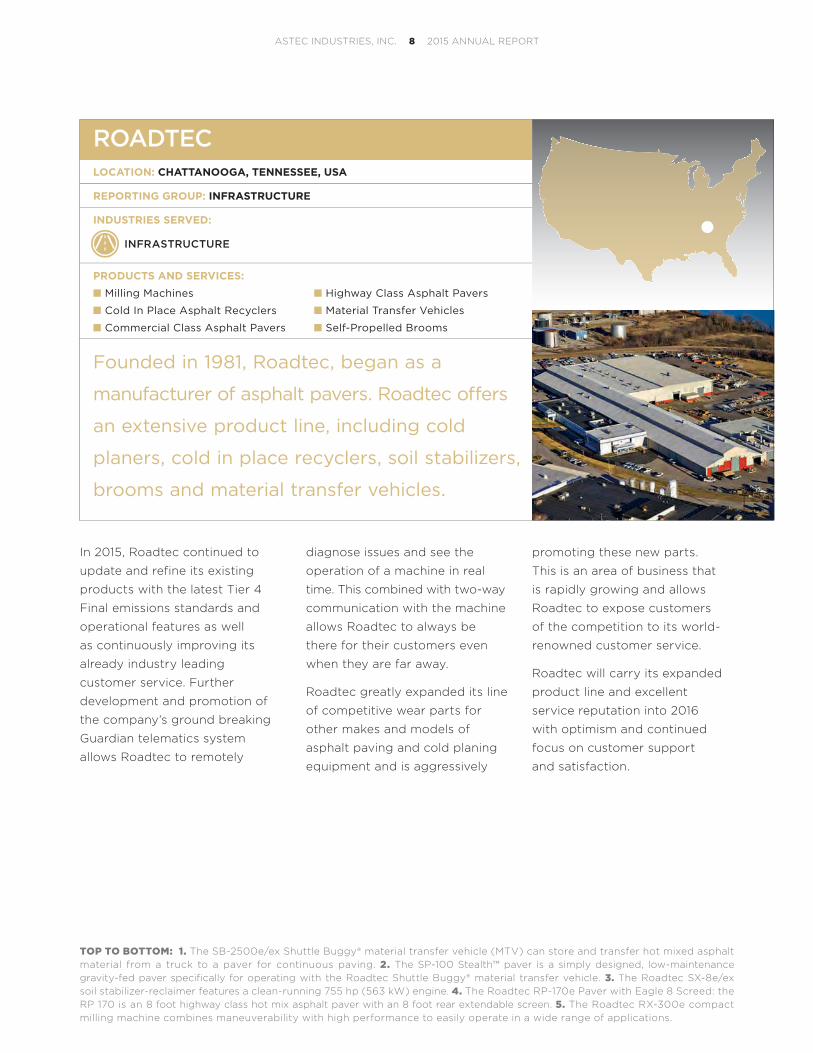
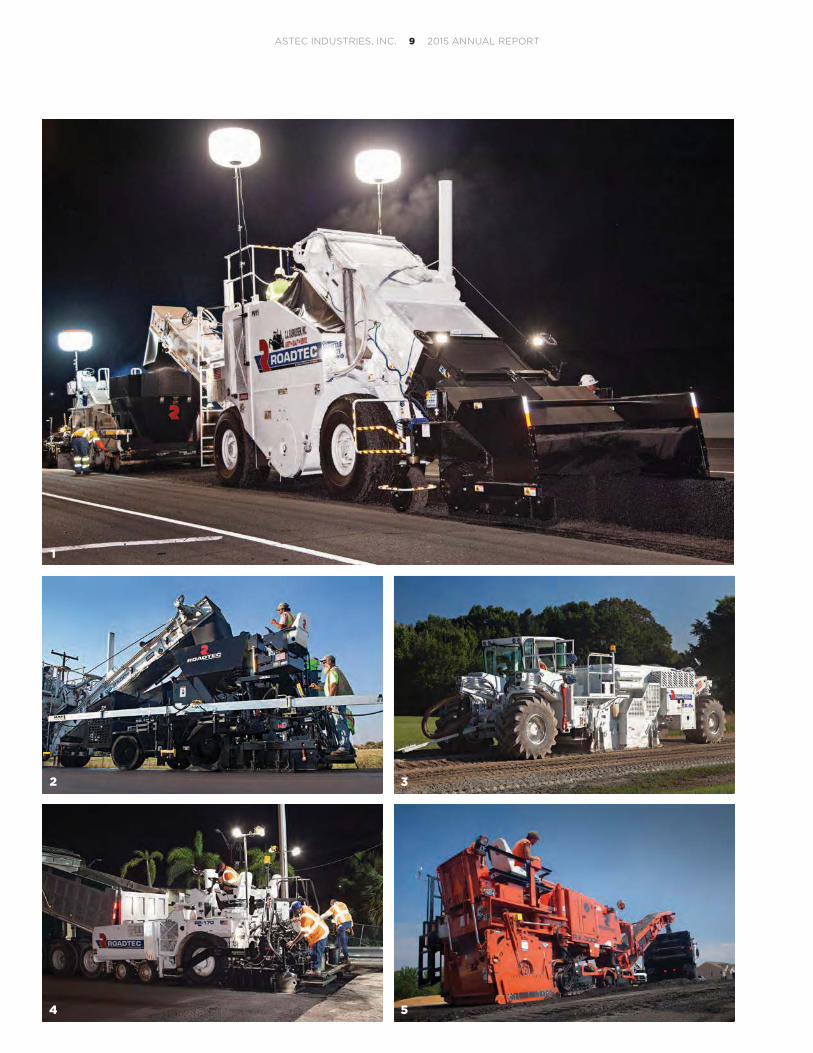
TOP TO BOTTOM: 1. The SB-2500e/ex Shuttle Buggy® material transfer vehicle (MTV) can store and transfer hot mixed asphalt material from a truck to a paver for continuous paving. 2. The SP-100 Stealth™ paver is a simply designed, low-maintenance gravity-fed paver specifically for operating with the Roadtec Shuttle Buggy® material transfer vehicle. 3. The Roadtec SX-8e/ex soil stabilizer-reclaimer features a clean-running 755 hp (563 kW) engine. 4. The Roadtec RP-170e Paver with Eagle 8 Screed: the RP 170 is an 8 foot highway class hot mix asphalt paver with an 8 foot rear extendable screen. 5. The Roadtec RX-300e compact milling machine combines maneuverability with high performance to easily operate in a wide range of applications.
ASTEC INDUSTRIES, INC. 8 2015 ANNUAL REPORT
4
2 3
5
1
ASTEC INDUSTRIES, INC. 9 2015 ANNUAL REPORT
CARLSON PAVING PRODUCTSLOCATION: TACOMA, WASHINGTON, USA
REPORTING GROUP: INFRASTRUCTURE
INDUSTRIES SERVED:
PRODUCTS AND SERVICES: Asphalt Paving Screeds Asphalt Screed Attachments
Commercial Class Asphalt Pavers Mobile Equipment Lighting
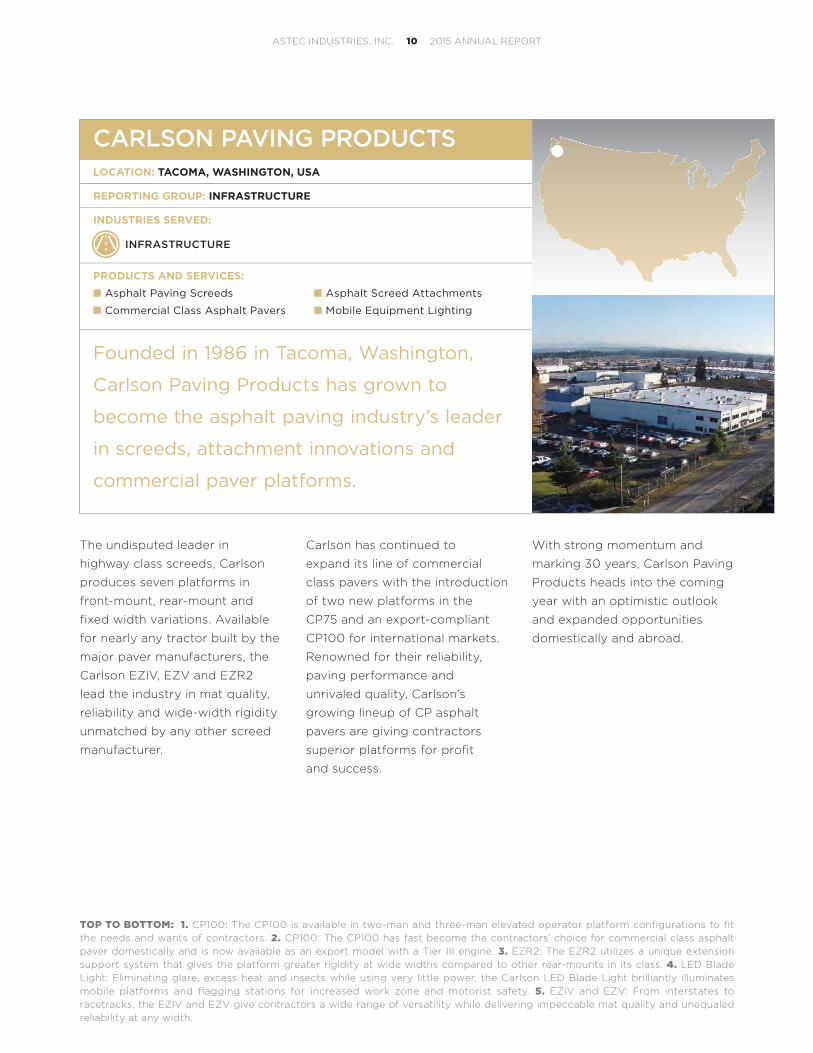
Founded in 1986 in Tacoma, Washington,
Carlson Paving Products has grown to
become the asphalt paving industry’s leader
in screeds, attachment innovations and
commercial paver platforms.
INFRASTRUCTURE
The undisputed leader in
highway class screeds, Carlson
produces seven platforms in
front-mount, rear-mount and
fixed width variations. Available
for nearly any tractor built by the
major paver manufacturers, the
Carlson EZIV, EZV and EZR2
lead the industry in mat quality,
reliability and wide-width rigidity
unmatched by any other screed
manufacturer.
Carlson has continued to
expand its line of commercial
class pavers with the introduction
of two new platforms in the
CP75 and an export-compliant
CP100 for international markets.
Renowned for their reliability,
paving performance and
unrivaled quality, Carlson’s
growing lineup of CP asphalt
pavers are giving contractors
superior platforms for profit
and success.
With strong momentum and
marking 30 years, Carlson Paving
Products heads into the coming
year with an optimistic outlook
and expanded opportunities
domestically and abroad.
TOP TO BOTTOM: 1. CP100: The CP100 is available in two-man and three-man elevated operator platform configurations to fit the needs and wants of contractors. 2. CP100: The CP100 has fast become the contractors’ choice for commercial class asphalt paver domestically and is now available as an export model with a Tier III engine. 3. EZR2: The EZR2 utilizes a unique extension support system that gives the platform greater rigidity at wide widths compared to other rear-mounts in its class. 4. LED Blade Light: Eliminating glare, excess heat and insects while using very little power, the Carlson LED Blade Light brilliantly illuminates mobile platforms and flagging stations for increased work zone and motorist safety. 5. EZIV and EZV: From interstates to racetracks, the EZIV and EZV give contractors a wide range of versatility while delivering impeccable mat quality and unequaled reliability at any width.
ASTEC INDUSTRIES, INC. 10 2015 ANNUAL REPORT

1 2
5
3 4
ASTEC INDUSTRIES, INC. 11 2015 ANNUAL REPORT
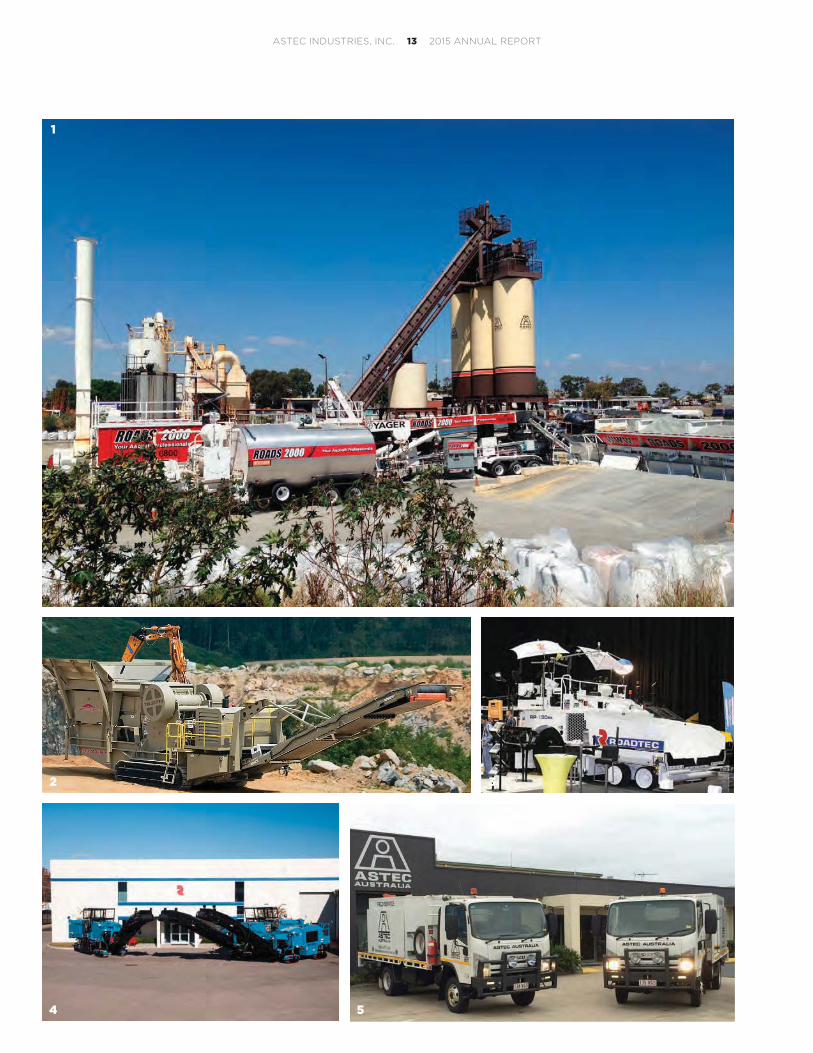
TOP TO BOTTOM: 1. Astec asphalt plant. 2. A Telsmith mobile crushing plant. 3. A Roadtec RP-190ex paver. 4. Roadtec RX300ex and RX600ex milling machines. 5. Field service vehicles.
ASTEC AUSTRALIA LOCATION: ACACIA RIDGE, QUEENSLAND, AUSTRALIA
REPORTING GROUP: INFRASTRUCTURE
INDUSTRIES SERVED:
PRODUCTS AND SERVICES: Milling Machines Highway Class Asphalt Pavers
Cold In Place Asphalt Recyclers Material Transfer Vehicles
Commercial Class Asphalt Pavers Aggregate and Mining Equipment
Asphalt Plants
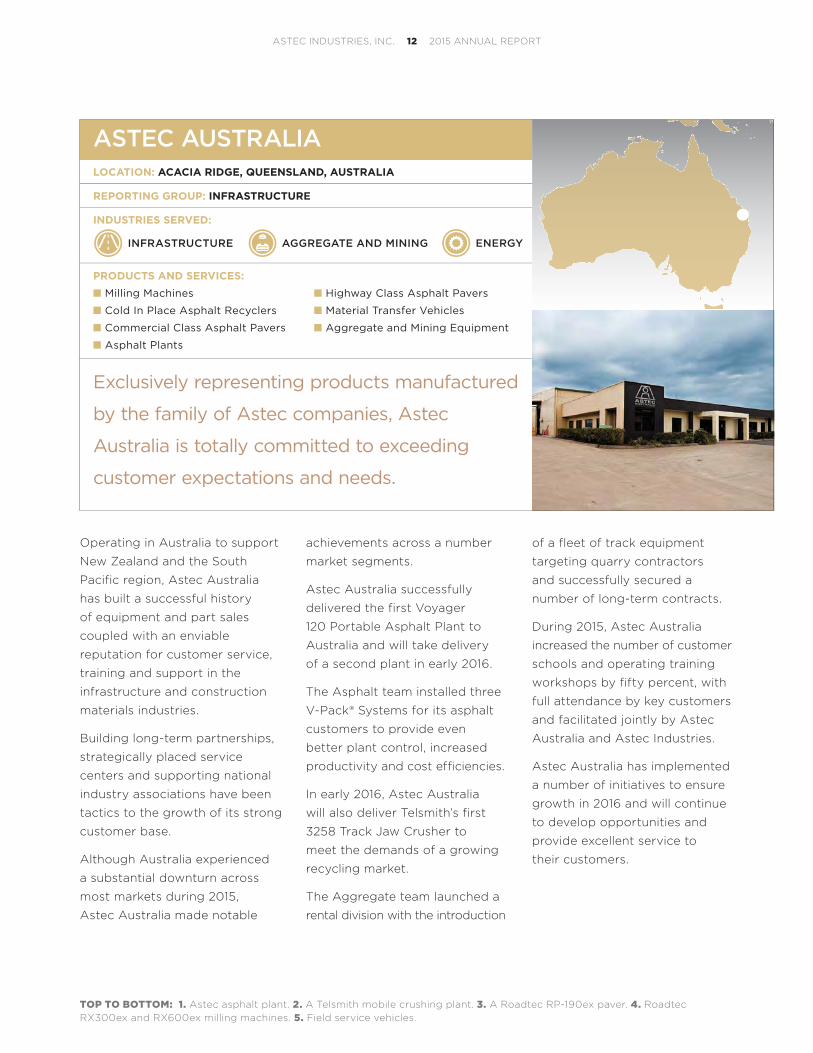
Exclusively representing products manufactured
by the family of Astec companies, Astec
Australia is totally committed to exceeding
customer expectations and needs.
AGGREGATE AND MININGINFRASTRUCTURE ENERGY
Operating in Australia to support
New Zealand and the South
Pacific region, Astec Australia
has built a successful history
of equipment and part sales
coupled with an enviable
reputation for customer service,
training and support in the
infrastructure and construction
materials industries.
Building long-term partnerships,
strategically placed service
centers and supporting national
industry associations have been
tactics to the growth of its strong
customer base.
Although Australia experienced
a substantial downturn across
most markets during 2015,
Astec Australia made notable
achievements across a number
market segments.
Astec Australia successfully
delivered the first Voyager
120 Portable Asphalt Plant to
Australia and will take delivery
of a second plant in early 2016.
The Asphalt team installed three
V-Pack® Systems for its asphalt
customers to provide even
better plant control, increased
productivity and cost efficiencies.
In early 2016, Astec Australia
will also deliver Telsmith’s first
3258 Track Jaw Crusher to
meet the demands of a growing
recycling market.
The Aggregate team launched a
rental division with the introduction
of a fleet of track equipment
targeting quarry contractors
and successfully secured a
number of long-term contracts.
During 2015, Astec Australia
increased the number of customer
schools and operating training
workshops by fifty percent, with
full attendance by key customers
and facilitated jointly by Astec
Australia and Astec Industries.
Astec Australia has implemented
a number of initiatives to ensure
growth in 2016 and will continue
to develop opportunities and
provide excellent service to
their customers.
ASTEC INDUSTRIES, INC. 12 2015 ANNUAL REPORT
1
5
3
4
2
ASTEC INDUSTRIES, INC. 13 2015 ANNUAL REPORT
INFRASTRUCTURE
ASTEC MOBILE MACHINERYLOCATION: HAMELN, GERMANY
REPORTING GROUP: INFRASTRUCTURE
INDUSTRIES SERVED:
PRODUCTS AND SERVICES: Material Transfer Vehicles F ront Mounted Brooms
Asphalt Pavers—Asphalt Screeds Road Wideners
Milling Machines Wood Processing Equipment
Cold in Place Recylers
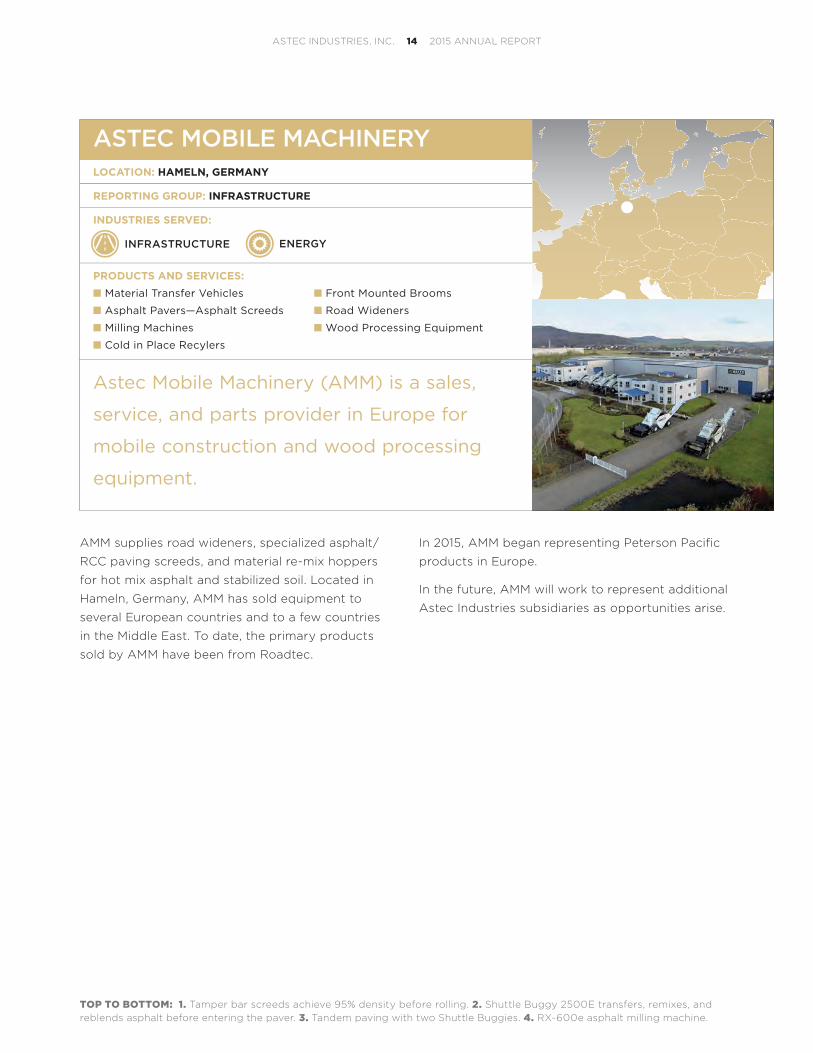
Astec Mobile Machinery (AMM) is a sales,
service, and parts provider in Europe for
mobile construction and wood processing
equipment.
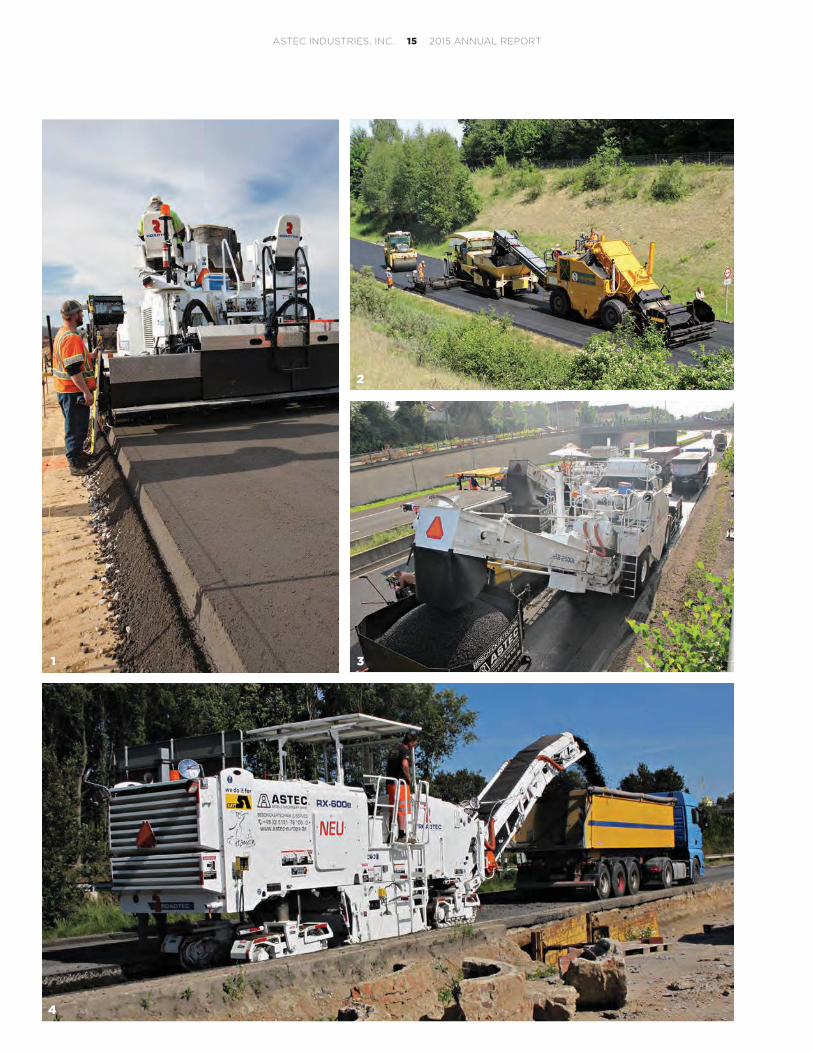
TOP TO BOTTOM: 1. Tamper bar screeds achieve 95% density before rolling. 2. Shuttle Buggy 2500E transfers, remixes, and reblends asphalt before entering the paver. 3. Tandem paving with two Shuttle Buggies. 4. RX-600e asphalt milling machine.
ENERGY
AMM supplies road wideners, specialized asphalt/
RCC paving screeds, and material re-mix hoppers
for hot mix asphalt and stabilized soil. Located in
Hameln, Germany, AMM has sold equipment to
several European countries and to a few countries
in the Middle East. To date, the primary products
sold by AMM have been from Roadtec.
In 2015, AMM began representing Peterson Pacific
products in Europe.
In the future, AMM will work to represent additional
Astec Industries subsidiaries as opportunities arise.
ASTEC INDUSTRIES, INC. 14 2015 ANNUAL REPORT
1
2
3
4
ASTEC INDUSTRIES, INC. 15 2015 ANNUAL REPORT
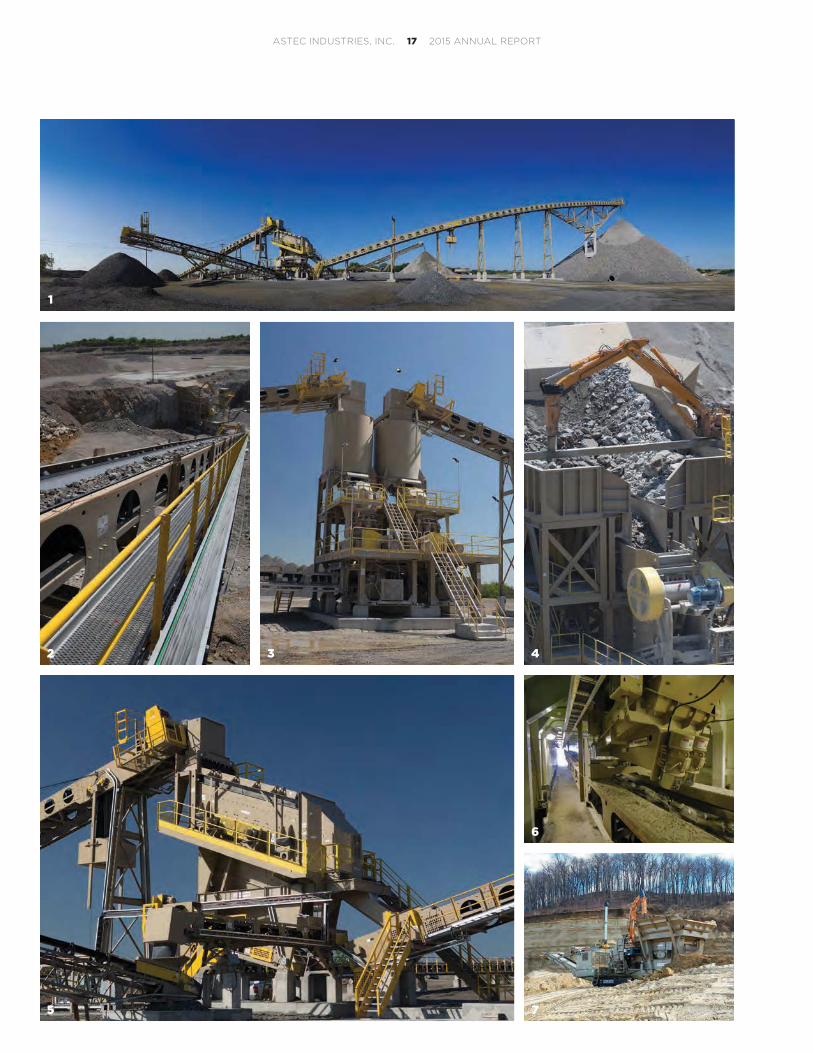
TOP TO BOTTOM: 1. Telsmith screens and conveyors within a modular application. 2. A Telsmith conveyor moving material between a primary station and screening plant. 3. Telsmith SBS cone crushers within a modular plant application. 4. Telsmith Jaw Crusher and BTI breaker within a modular application. 5. Telsmith screen tower within a modular application. 6. In 2015, Telsmith launched a line-up of vibrating pan feeders. 7. Telsmith 6060 Track Impactor Plant.
TELSMITHLOCATION: MEQUON, WISCONSIN, USA
REPORTING GROUP: AGGREGATE AND MINING
INDUSTRIES SERVED:
PRODUCTS AND SERVICES: Cone, Jaw and Impactor Crushers Feeders
Horizontal and Vertical Screens Track and Wheeled Portable Plants
Conveyors Modular Plants
Every member of Team Telsmith is focused
on utilizing advances in technology and
adhering to stringent quality standards to
provide integrated processing solutions
to customers throughout the world.
AGGREGATE AND MINING INFRASTRUCTURE
From a campus in Mequon,
Wisconsin, Telsmith provides a
full range of integrated processing
equipment to the aggregate,
mining, industrial, and recycling
industries with cone crushers, jaw
crushers, vibrating equipment,
portable plants, and track plants,
as well as full scale modular
processing facilities.
Telsmith consistently demon-
strates a commitment to
customer needs throughout
the product life cycle, from
experienced applications
engineers designing a solution
that enables customers to meet
business goals, craftsmen
utilizing the latest advances in
manufacturing technology,
on-site factory start-up teams,
on through to parts and service
to keep equipment running for
decades. Telsmith continues to
meet the growing demand for
mineral processing equipment
around the world with safe,
efficient and profitable solutions.
ASTEC INDUSTRIES, INC. 16 2015 ANNUAL REPORT
1
5
3 4
6
7
2
ASTEC INDUSTRIES, INC. 17 2015 ANNUAL REPORT
OSBORN ENGINEERED PRODUCTSLOCATION: JOHANNESBURG, SOUTH AFRICA
REPORTING GROUP: AGGREGATE AND MINING
INDUSTRIES SERVED:
PRODUCTS AND SERVICES: Jaw and Cone Crushers Vibrating Screens
Modular Crushing Plants Aggregate Feeders and Conveyors
Coal Crushers Rotary Scrubbers
Osborn Engineered Products is a
97 year old, South African company
based in Johannesburg, proudly supporting
the mining industry worldwide.
AGGREGATE AND MINING INFRASTRUCTURE
A full-service company with
design and manufacturing
capabilities, Osborn machines
are robust and reliable to with-
stand the harshest operating
conditions. With a vast installed
machine base across all ore
bodies, Osborn is able to demon-
strate to prospective customers
its machines working the ores
they intend to process, with the
major mining houses providing
the testimonial to Osborn's
service and support.
Having taken on the African
distribution of the American
Astec companies’ products five
years ago, Osborn is seeing
growing acceptance and demand
for the imported machines,
supported by a local parts and
service network.
Osborn continues to add to its
machine offering, with a 400Kw
650 x 2.5m mineral-sizer, and a
metric 5260 HSI, engineered and
built locally during the past year.
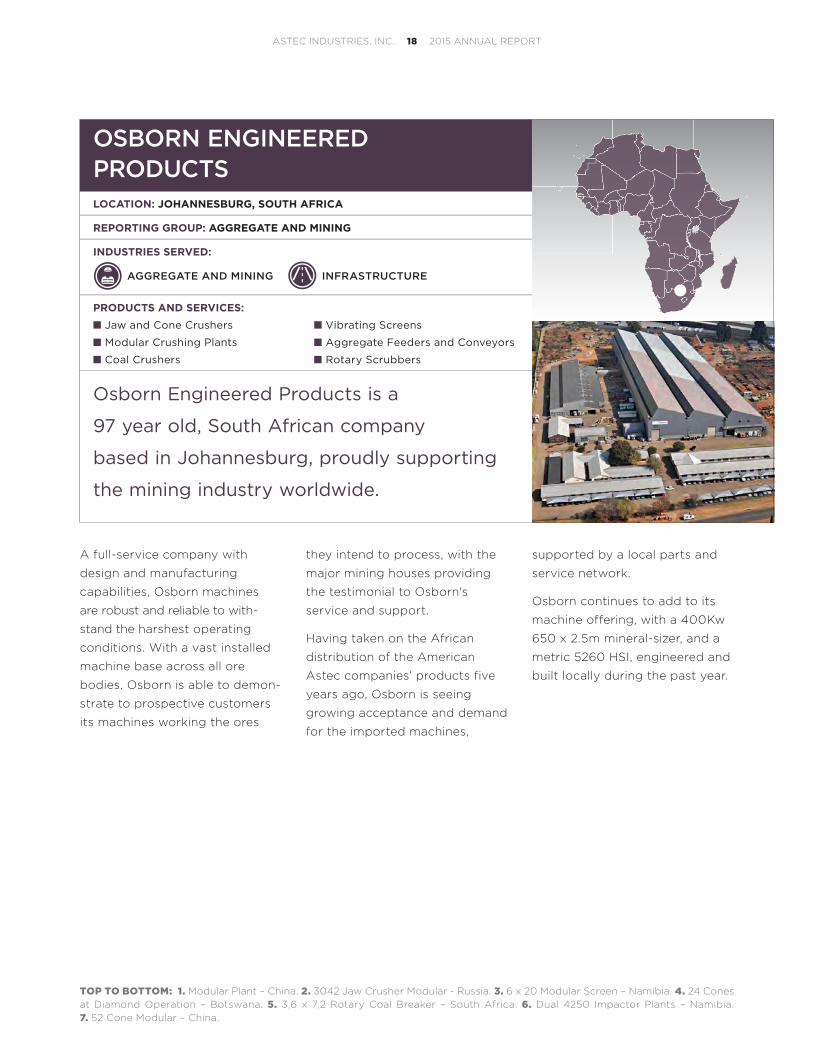
TOP TO BOTTOM: 1. Modular Plant – China. 2. 3042 Jaw Crusher Modular - Russia. 3. 6 x 20 Modular Screen – Namibia. 4. 24 Cones at Diamond Operation – Botswana. 5. 3,6 x 7,2 Rotary Coal Breaker – South Africa. 6. Dual 4250 Impactor Plants – Namibia. 7. 52 Cone Modular – China.
ASTEC INDUSTRIES, INC. 18 2015 ANNUAL REPORT
2
3
4
6 7
1
5
ASTEC INDUSTRIES, INC. 19 2015 ANNUAL REPORT
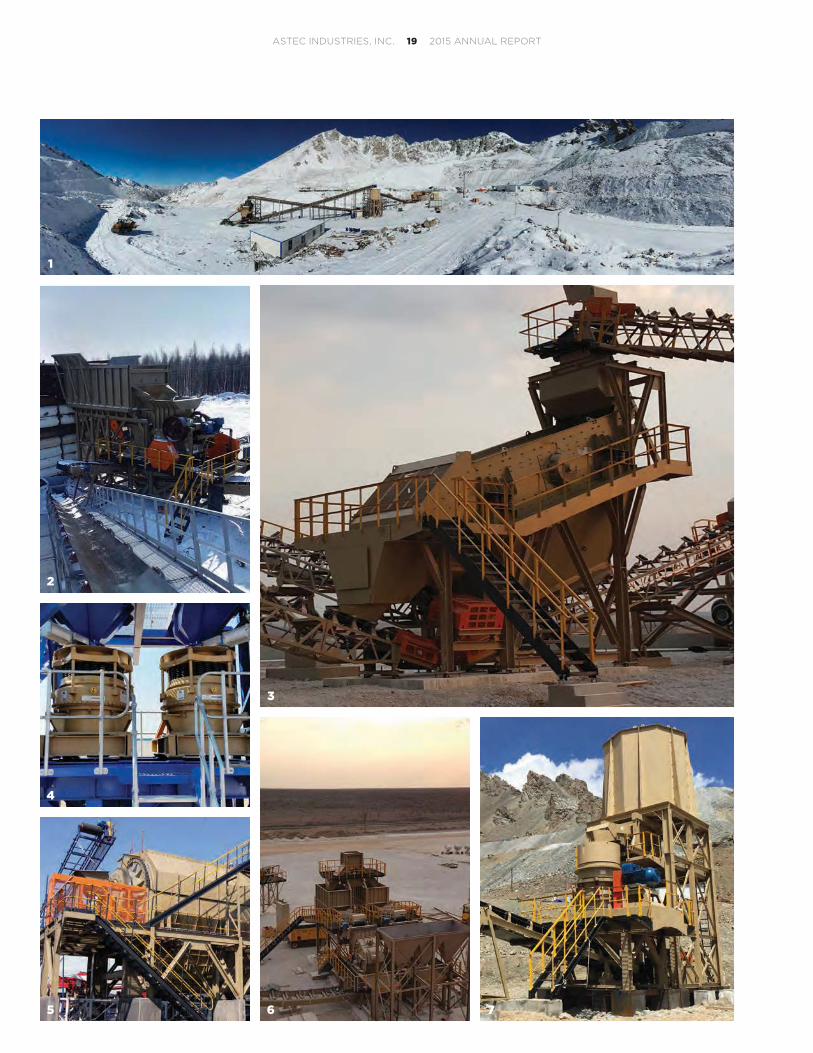
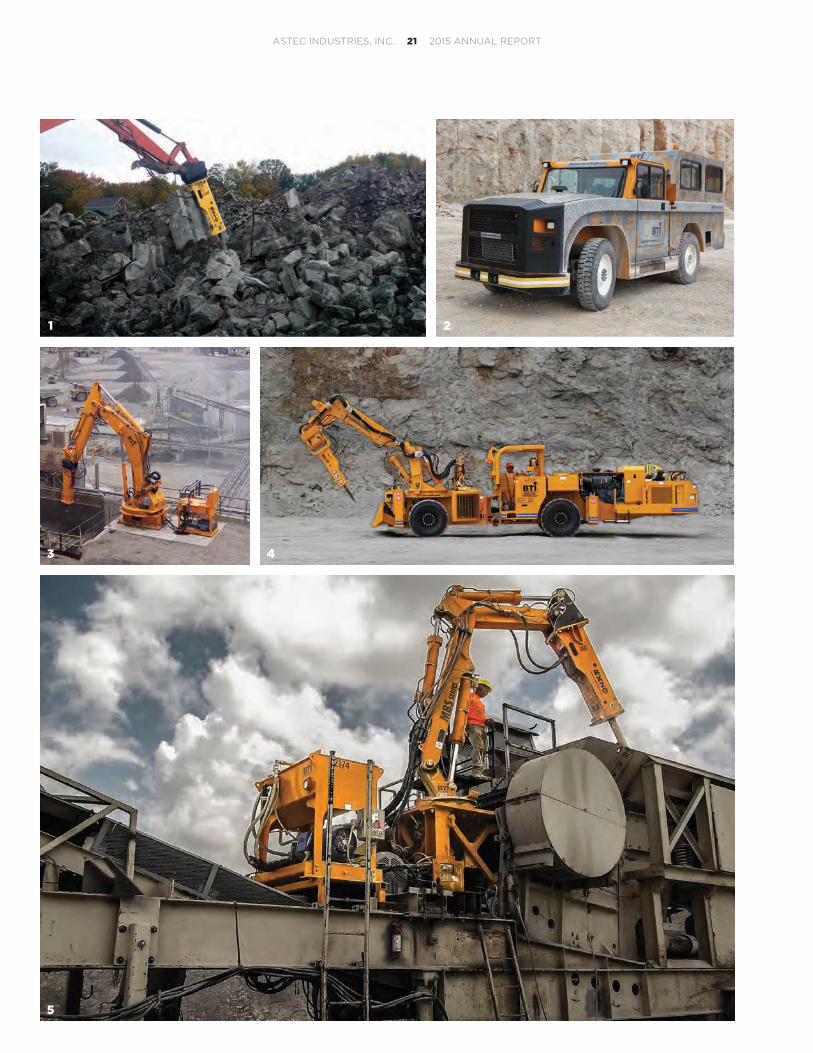
TOP TO BOTTOM: 1. BTI’s small line of breakers easily mounts to skid steers and other mobile booms for demolition. 2. Mine Runner All Purpose Vehicle powers future-focused mining operations aimed at increased productivity, lower emissions and safety. 3. One of BTI’s larger Rockbreaker Systems, the TTX is the primary choice for heavy grizzly and standard gyratory applications. 4. RMS18 Scaler is equipped to withstand harsh, continuous duty rock breaking applications with exceptional efficiency. 5. MBS12 Rockbreaker System with a BX20 Rockbreaker on a mobile jaw crushing plant. The MBS Rockbreaker Series improves productivity on mobile crushing plants.
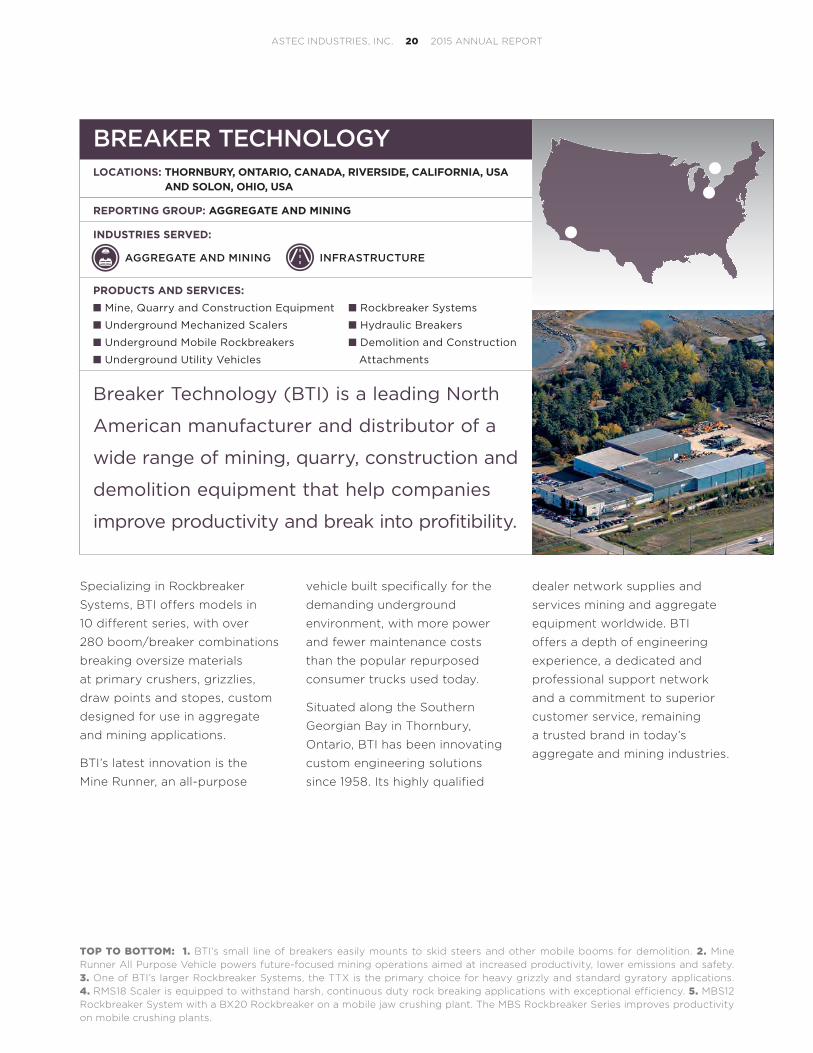
BREAKER TECHNOLOGYLOCATIONS: THORNBURY, ONTARIO, CANADA, RIVERSIDE, CALIFORNIA, USA
AND SOLON, OHIO, USA
REPORTING GROUP: AGGREGATE AND MINING
INDUSTRIES SERVED:
PRODUCTS AND SERVICES: Mine, Quarry and Construction Equipment Rockbreaker Systems
Underground Mechanized Scalers Hydraulic Breakers
Underground Mobile Rockbreakers Demolition and Construction
Underground Utility Vehicles Attachments
Breaker Technology (BTI) is a leading North
American manufacturer and distributor of a
wide range of mining, quarry, construction and
demolition equipment that help companies
improve productivity and break into profitibility.
AGGREGATE AND MINING INFRASTRUCTURE
Specializing in Rockbreaker
Systems, BTI offers models in
10 different series, with over
280 boom/breaker combinations
breaking oversize materials
at primary crushers, grizzlies,
draw points and stopes, custom
designed for use in aggregate
and mining applications.
BTI’s latest innovation is the
Mine Runner, an all-purpose
vehicle built specifically for the
demanding underground
environment, with more power
and fewer maintenance costs
than the popular repurposed
consumer trucks used today.
Situated along the Southern
Georgian Bay in Thornbury,
Ontario, BTI has been innovating
custom engineering solutions
since 1958. Its highly qualified
dealer network supplies and
services mining and aggregate
equipment worldwide. BTI
offers a depth of engineering
experience, a dedicated and
professional support network
and a commitment to superior
customer service, remaining
a trusted brand in today’s
aggregate and mining industries.
ASTEC INDUSTRIES, INC. 20 2015 ANNUAL REPORT
1 2
5
3 4
ASTEC INDUSTRIES, INC. 21 2015 ANNUAL REPORT
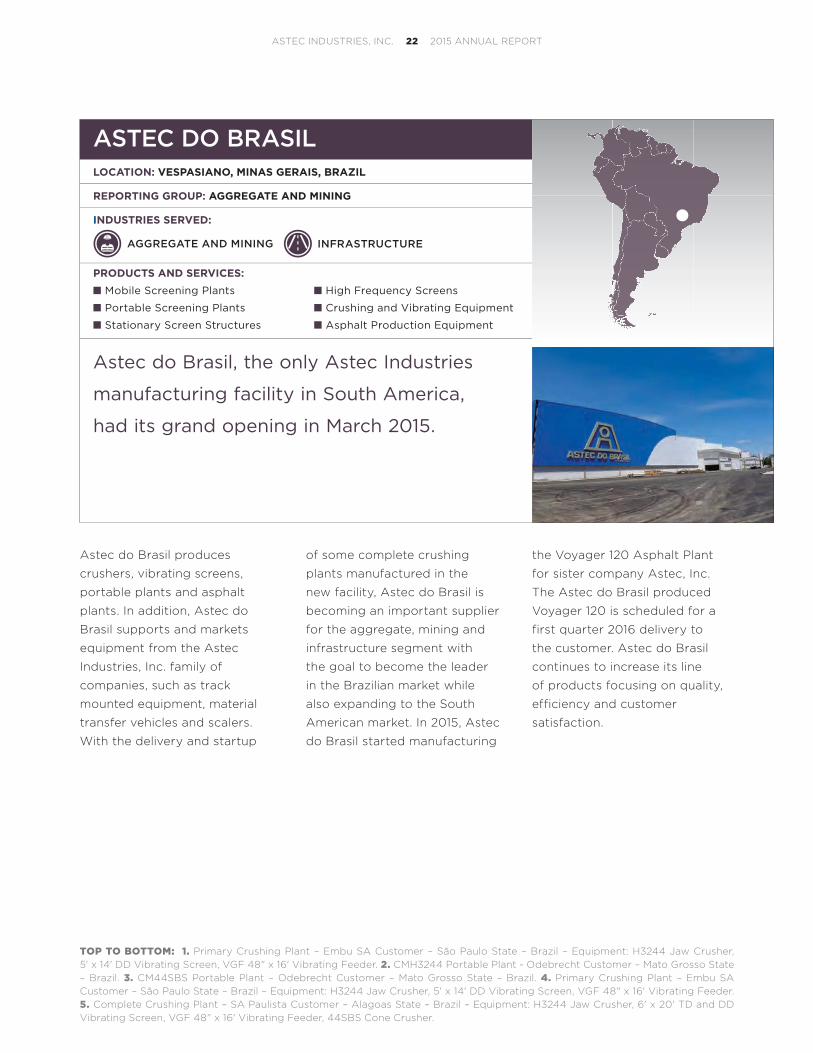
ASTEC DO BRASILLOCATION: VESPASIANO, MINAS GERAIS, BRAZIL
REPORTING GROUP: AGGREGATE AND MINING
INDUSTRIES SERVED:
PRODUCTS AND SERVICES: Mobile Screening Plants High Frequency Screens
Portable Screening Plants Crushing and Vibrating Equipment
Stationary Screen Structures Asphalt Production Equipment
Astec do Brasil, the only Astec Industries
manufacturing facility in South America,
had its grand opening in March 2015.
AGGREGATE AND MINING INFRASTRUCTURE
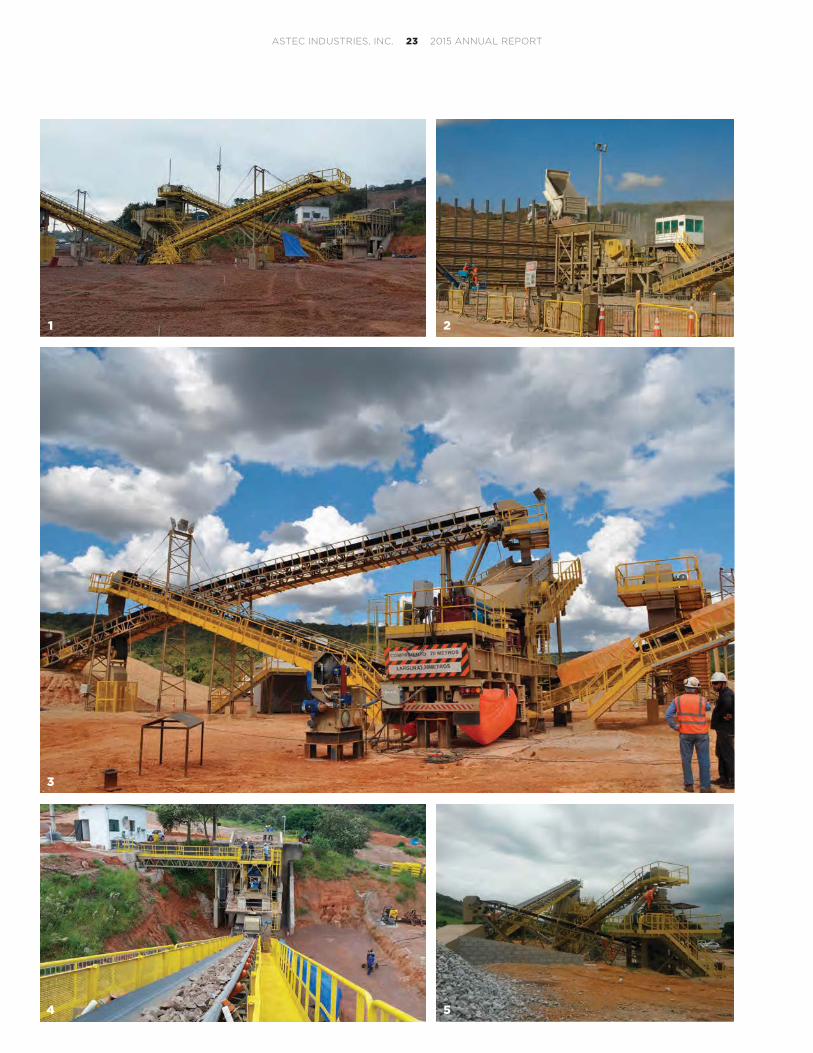
TOP TO BOTTOM: 1. Primary Crushing Plant – Embu SA Customer – São Paulo State – Brazil – Equipment: H3244 Jaw Crusher, 5' x 14' DD Vibrating Screen, VGF 48" x 16' Vibrating Feeder. 2. CMH3244 Portable Plant - Odebrecht Customer – Mato Grosso State – Brazil. 3. CM44SBS Portable Plant – Odebrecht Customer – Mato Grosso State – Brazil. 4. Primary Crushing Plant – Embu SA Customer – São Paulo State – Brazil – Equipment: H3244 Jaw Crusher, 5' x 14' DD Vibrating Screen, VGF 48" x 16' Vibrating Feeder. 5. Complete Crushing Plant – SA Paulista Customer – Alagoas State – Brazil – Equipment: H3244 Jaw Crusher, 6' x 20' TD and DD Vibrating Screen, VGF 48" x 16' Vibrating Feeder, 44SBS Cone Crusher.
Astec do Brasil produces
crushers, vibrating screens,
portable plants and asphalt
plants. In addition, Astec do
Brasil supports and markets
equipment from the Astec
Industries, Inc. family of
companies, such as track
mounted equipment, material
transfer vehicles and scalers.
With the delivery and startup
of some complete crushing
plants manufactured in the
new facility, Astec do Brasil is
becoming an important supplier
for the aggregate, mining and
infrastructure segment with
the goal to become the leader
in the Brazilian market while
also expanding to the South
American market. In 2015, Astec
do Brasil started manufacturing
the Voyager 120 Asphalt Plant
for sister company Astec, Inc.
The Astec do Brasil produced
Voyager 120 is scheduled for a
first quarter 2016 delivery to
the customer. Astec do Brasil
continues to increase its line
of products focusing on quality,
efficiency and customer
satisfaction.
ASTEC INDUSTRIES, INC. 22 2015 ANNUAL REPORT
1 2
3
4 5
ASTEC INDUSTRIES, INC. 23 2015 ANNUAL REPORT
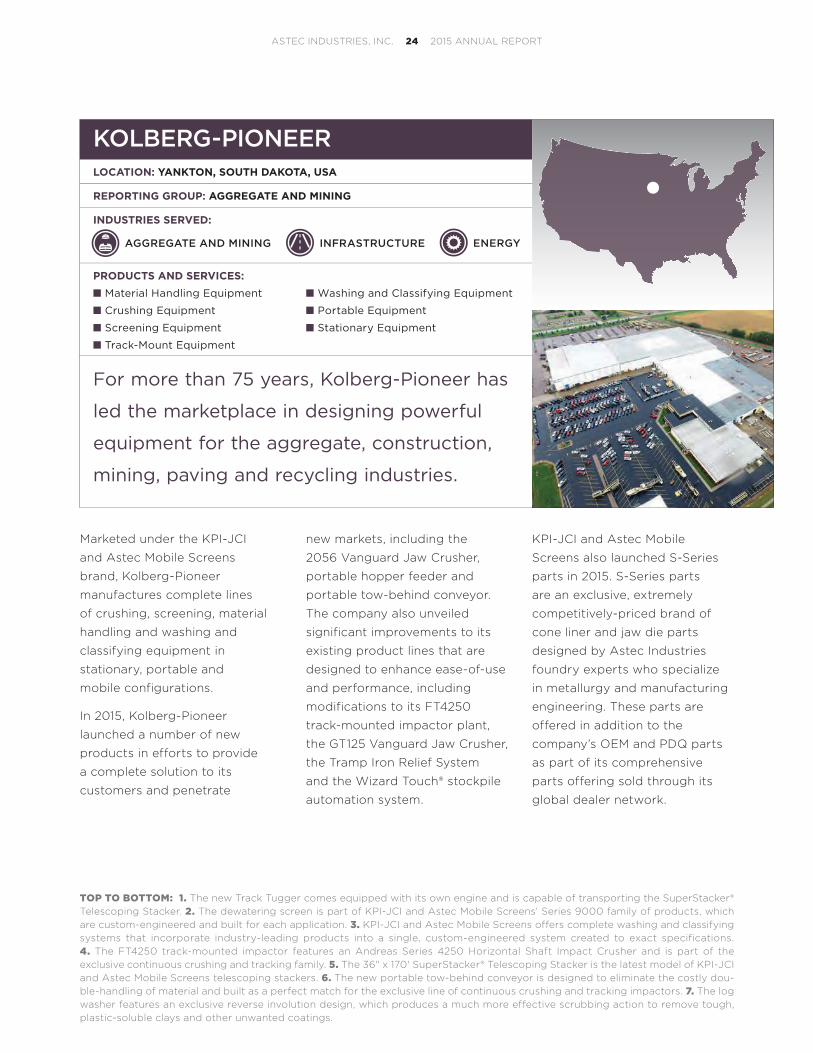
KOLBERG-PIONEERLOCATION: YANKTON, SOUTH DAKOTA, USA
REPORTING GROUP: AGGREGATE AND MINING
INDUSTRIES SERVED:
PRODUCTS AND SERVICES: Material Handling Equipment Washing and Classifying Equipment
Crushing Equipment Portable Equipment
Screening Equipment Stationary Equipment
Track-Mount Equipment
For more than 75 years, Kolberg-Pioneer has
led the marketplace in designing powerful
equipment for the aggregate, construction,
mining, paving and recycling industries.
AGGREGATE AND MINING INFRASTRUCTURE ENERGY
Marketed under the KPI-JCI
and Astec Mobile Screens
brand, Kolberg-Pioneer
manufactures complete lines
of crushing, screening, material
handling and washing and
classifying equipment in
stationary, portable and
mobile configurations.
In 2015, Kolberg-Pioneer
launched a number of new
products in efforts to provide
a complete solution to its
customers and penetrate
new markets, including the
2056 Vanguard Jaw Crusher,
portable hopper feeder and
portable tow-behind conveyor.
The company also unveiled
significant improvements to its
existing product lines that are
designed to enhance ease-of-use
and performance, including
modifications to its FT4250
track-mounted impactor plant,
the GT125 Vanguard Jaw Crusher,
the Tramp Iron Relief System
and the Wizard Touch® stockpile
automation system.
KPI-JCI and Astec Mobile
Screens also launched S-Series
parts in 2015. S-Series parts
are an exclusive, extremely
competitively-priced brand of
cone liner and jaw die parts
designed by Astec Industries
foundry experts who specialize
in metallurgy and manufacturing
engineering. These parts are
offered in addition to the
company’s OEM and PDQ parts
as part of its comprehensive
parts offering sold through its
global dealer network.
TOP TO BOTTOM: 1. The new Track Tugger comes equipped with its own engine and is capable of transporting the SuperStacker® Telescoping Stacker. 2. The dewatering screen is part of KPI-JCI and Astec Mobile Screens’ Series 9000 family of products, which are custom-engineered and built for each application. 3. KPI-JCI and Astec Mobile Screens offers complete washing and classifying systems that incorporate industry-leading products into a single, custom-engineered system created to exact specifications. 4. The FT4250 track-mounted impactor features an Andreas Series 4250 Horizontal Shaft Impact Crusher and is part of the exclusive continuous crushing and tracking family. 5. The 36" x 170' SuperStacker® Telescoping Stacker is the latest model of KPI-JCI and Astec Mobile Screens telescoping stackers. 6. The new portable tow-behind conveyor is designed to eliminate the costly dou-ble-handling of material and built as a perfect match for the exclusive line of continuous crushing and tracking impactors. 7. The log washer features an exclusive reverse involution design, which produces a much more effective scrubbing action to remove tough, plastic-soluble clays and other unwanted coatings.
ASTEC INDUSTRIES, INC. 24 2015 ANNUAL REPORT
2
4
6
1
3
5
7
ASTEC INDUSTRIES, INC. 25 2015 ANNUAL REPORT
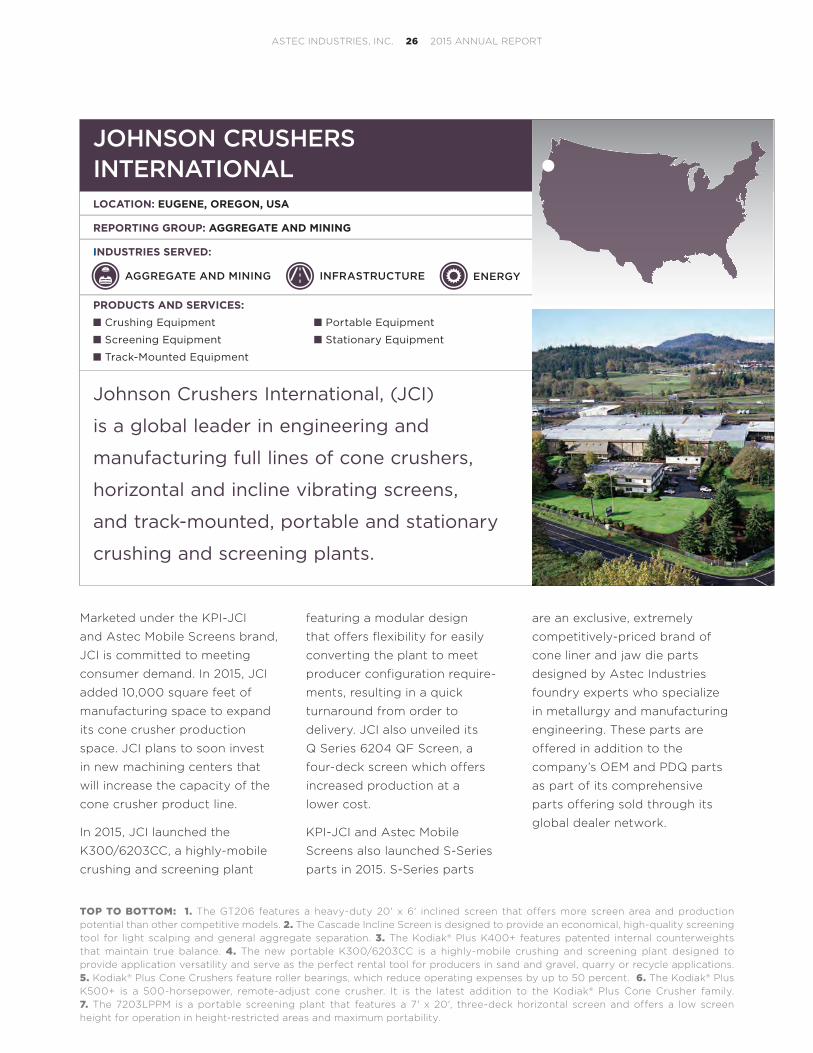
JOHNSON CRUSHERS INTERNATIONALLOCATION: EUGENE, OREGON, USA
REPORTING GROUP: AGGREGATE AND MINING
INDUSTRIES SERVED:
PRODUCTS AND SERVICES: Crushing Equipment Portable Equipment
Screening Equipment Stationary Equipment
Track-Mounted Equipment
Johnson Crushers International, (JCI)
is a global leader in engineering and
manufacturing full lines of cone crushers,
horizontal and incline vibrating screens,
and track-mounted, portable and stationary
crushing and screening plants.
AGGREGATE AND MINING INFRASTRUCTURE ENERGY
Marketed under the KPI-JCI
and Astec Mobile Screens brand,
JCI is committed to meeting
consumer demand. In 2015, JCI
added 10,000 square feet of
manufacturing space to expand
its cone crusher production
space. JCI plans to soon invest
in new machining centers that
will increase the capacity of the
cone crusher product line.
In 2015, JCI launched the
K300/6203CC, a highly-mobile
crushing and screening plant
featuring a modular design
that offers flexibility for easily
converting the plant to meet
producer configuration require-
ments, resulting in a quick
turnaround from order to
delivery. JCI also unveiled its
Q Series 6204 QF Screen, a
four-deck screen which offers
increased production at a
lower cost.
KPI-JCI and Astec Mobile
Screens also launched S-Series
parts in 2015. S-Series parts
are an exclusive, extremely
competitively-priced brand of
cone liner and jaw die parts
designed by Astec Industries
foundry experts who specialize
in metallurgy and manufacturing
engineering. These parts are
offered in addition to the
company’s OEM and PDQ parts
as part of its comprehensive
parts offering sold through its
global dealer network.
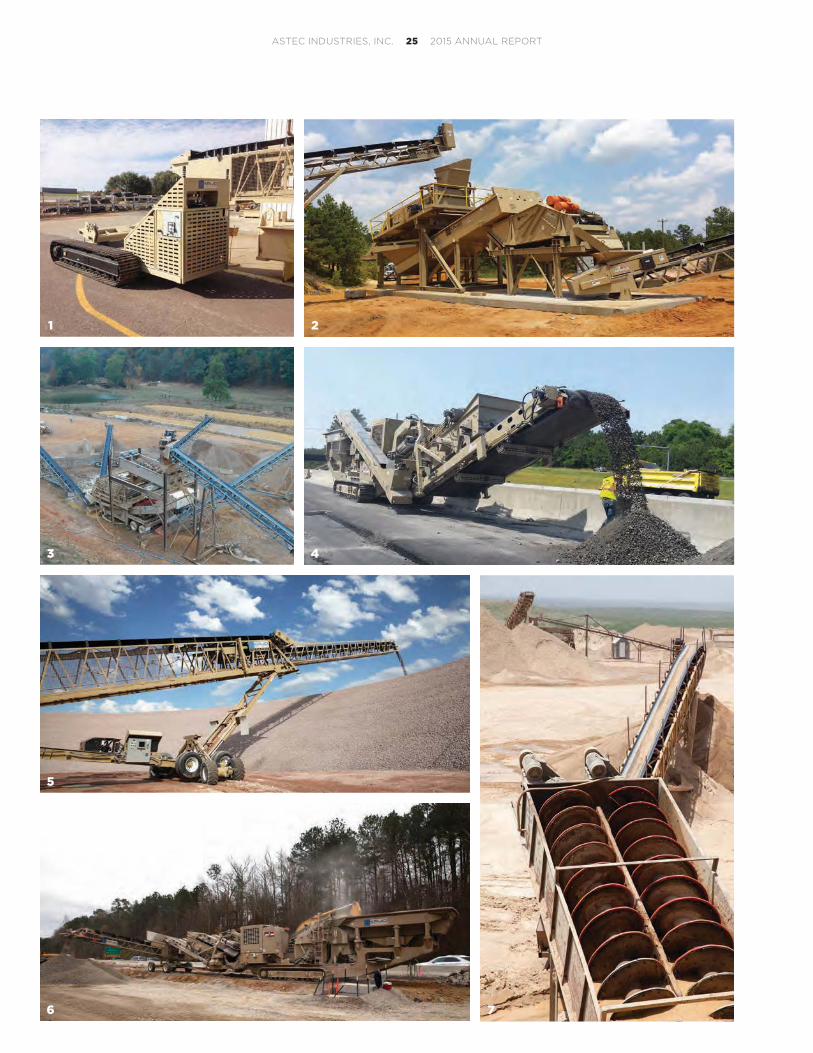
TOP TO BOTTOM: 1. The GT206 features a heavy-duty 20' x 6' inclined screen that offers more screen area and production potential than other competitive models. 2. The Cascade Incline Screen is designed to provide an economical, high-quality screening tool for light scalping and general aggregate separation. 3. The Kodiak® Plus K400+ features patented internal counterweights that maintain true balance. 4. The new portable K300/6203CC is a highly-mobile crushing and screening plant designed to provide application versatility and serve as the perfect rental tool for producers in sand and gravel, quarry or recycle applications. 5. Kodiak® Plus Cone Crushers feature roller bearings, which reduce operating expenses by up to 50 percent. 6. The Kodiak® Plus K500+ is a 500-horsepower, remote-adjust cone crusher. It is the latest addition to the Kodiak® Plus Cone Crusher family. 7. The 7203LPPM is a portable screening plant that features a 7' x 20', three-deck horizontal screen and offers a low screen height for operation in height-restricted areas and maximum portability.
ASTEC INDUSTRIES, INC. 26 2015 ANNUAL REPORT
1 2
3
4
2
6
1
3
4 5
7
ASTEC INDUSTRIES, INC. 27 2015 ANNUAL REPORT
ASTEC MOBILE SCREENSLOCATION: STERLING, ILLINOIS, USA
REPORTING GROUP: AGGREGATE AND MINING
INDUSTRIES SERVED:
PRODUCTS AND SERVICES: Track-Mounted Screening Plants Stationary Screen Structures
Portable Screening Plants High Frequency Screens
Marketed under the KPI-JCI and Astec
Mobile Screens brand, Astec Mobile Screens
is recognized as a global leader in
screening solutions.
AGGREGATE AND MINING INFRASTRUCTURE ENERGY
Astec Mobile Screens
products include mobile
screening plants, portable and
stationary screen structures
and high frequency screens
for the quarry, recycle, sand
and gravel, industrial and other
material processing industries.
Astec Mobile Screens launched
its new GT104 screening plant
in 2015. The GT104 leads
the market with the highest
stockpile capacity, quickest
set-up time and largest feed
hopper in its class. In 2015,
Astec Mobile Screens also
committed to a restructuring
of its lean manufacturing
program, resulting in saved
time, money and a more price-
competitive product.
Astec Mobile Screens also
expanded its PDQ parts line
in 2015. KPI-JCI and Astec
Mobile Screens offers its
exclusive collection of PDQ
parts for customers seeking
high-performance, after-market
parts at competitive prices.
PDQ parts are supported the
same as the company’s OEM
product line with 24/7 service
for minimal downtime.
With the passage of the highway
bill, Astec Mobile Screens has
strengthened its focus on RAP
(reclaimed asphalt pavement)
and FRAP (fractionated
reclaimed asphalt pavement)
using high frequency screening
technology as a way to increase
production and reduce costs.
As the leading manufacturer
in the portable and stationary
RAP market, Astec Mobile
Screens remains dedicated
to growing alongside the
ever-increasing RAP market.
By fractionating RAP millings
with a portable or stationary
Vari-Vibe® High Frequency screen,
producers can increase RAP
utilization and operation savings.
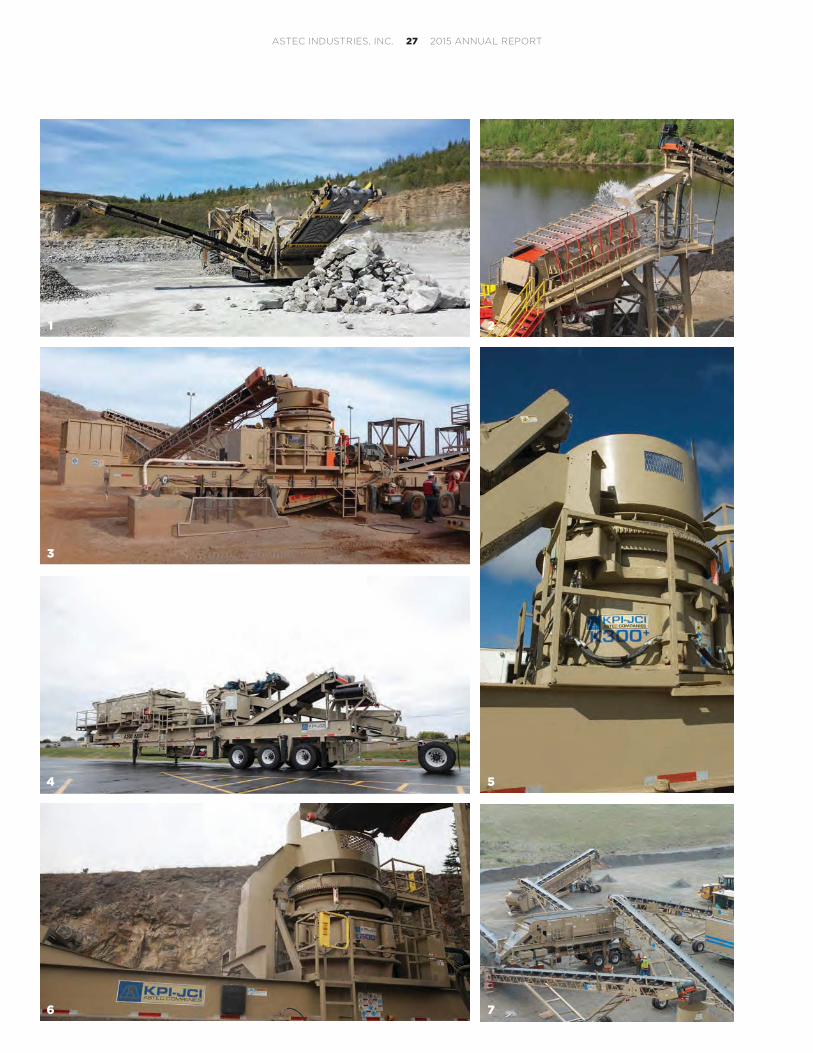
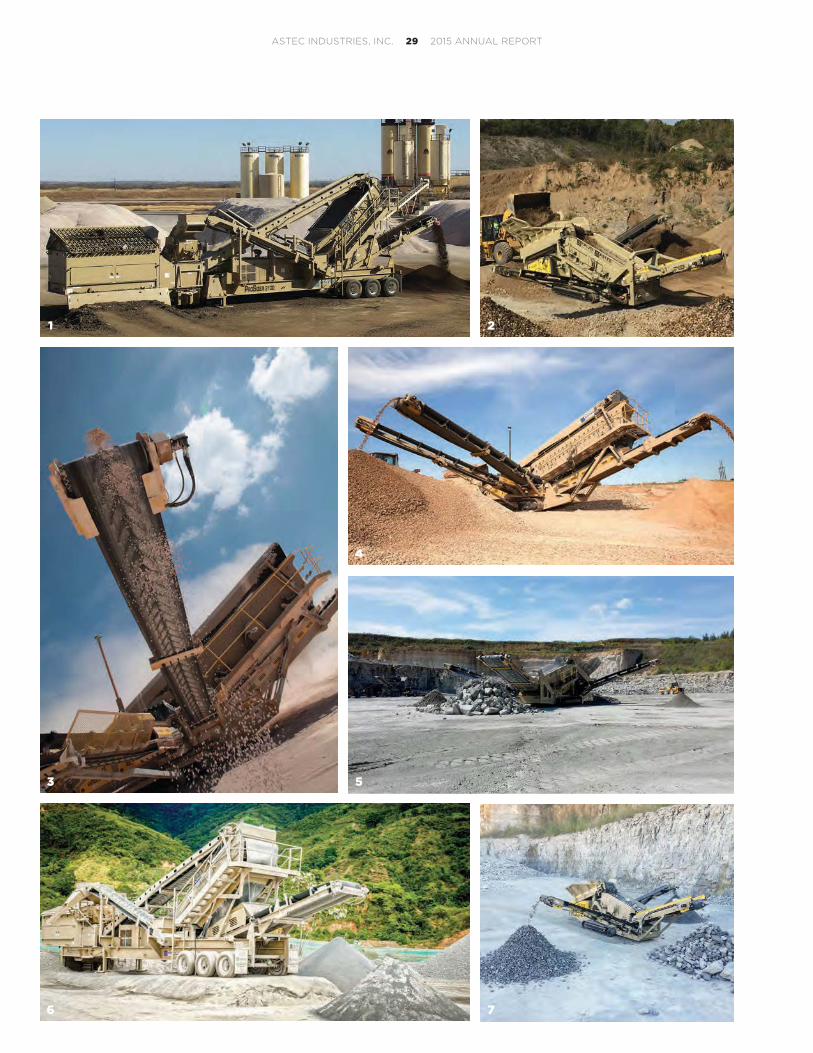
TOP TO BOTTOM: 1. Astec Mobile Screens' ProSizer® RAP (recycled asphalt pavement) processing plant. 2. The GT165DF is designed to provide contractors and producers with a versatile screening plant that can handle high volumes of material in both scalping and sizing applications. 3. The GT205S is a mobile track screening plant featuring a double- or triple-deck screen for processing sand and gravel, top soil, slag, crushed stone and recycled materials. 4. The GT205S is a track-mounted screening plant from the Global Track product line. 5. The GT165DF is part of the Global Track family, a user-friendly, affordable line of products perfect for contractors around the world seeking quarry-duty components with a strong, simple track design. 6. The ProSizer® 3100 portable high frequency screening plant is engineered to provide higher production capacities and more efficient sizing compared to competitive screens. 7. In 2015, Astec Mobile Screens launched the GT104, a track-mounted screening plant capable of screening a wide array of material, from aggregates to recycled materials to organics.
ASTEC INDUSTRIES, INC. 28 2015 ANNUAL REPORT
3
4
2
6
1
3
4
5
7
ASTEC INDUSTRIES, INC. 29 2015 ANNUAL REPORT
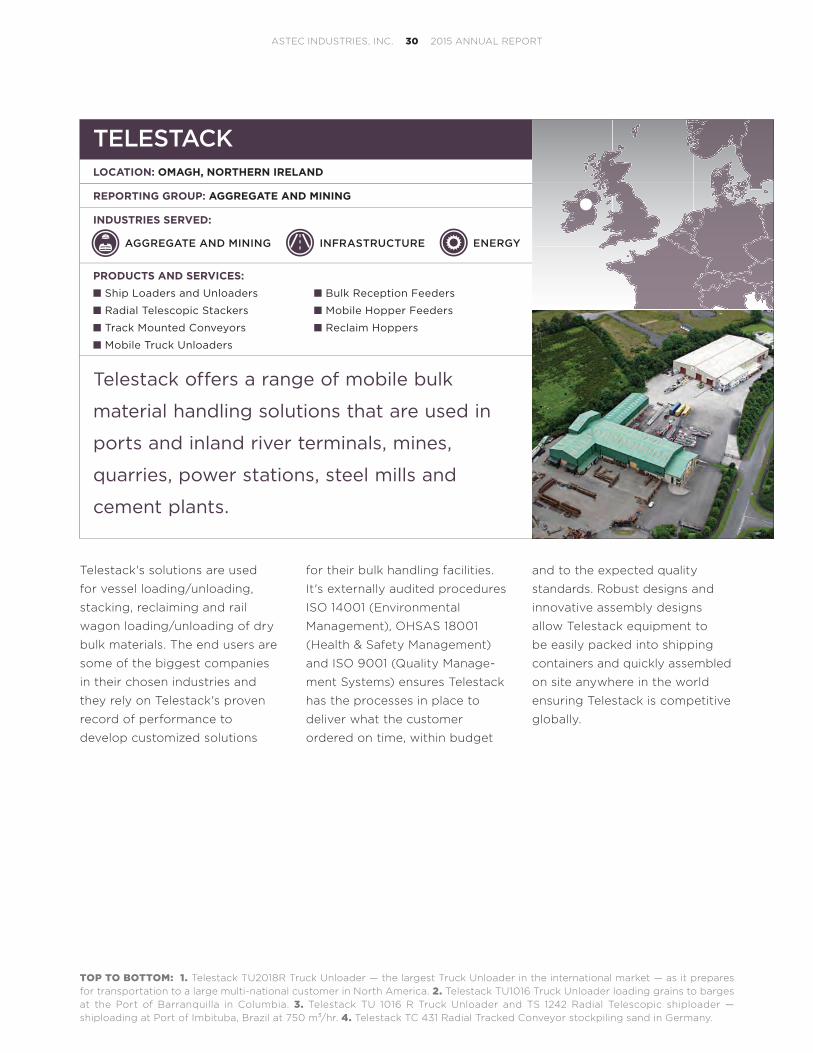
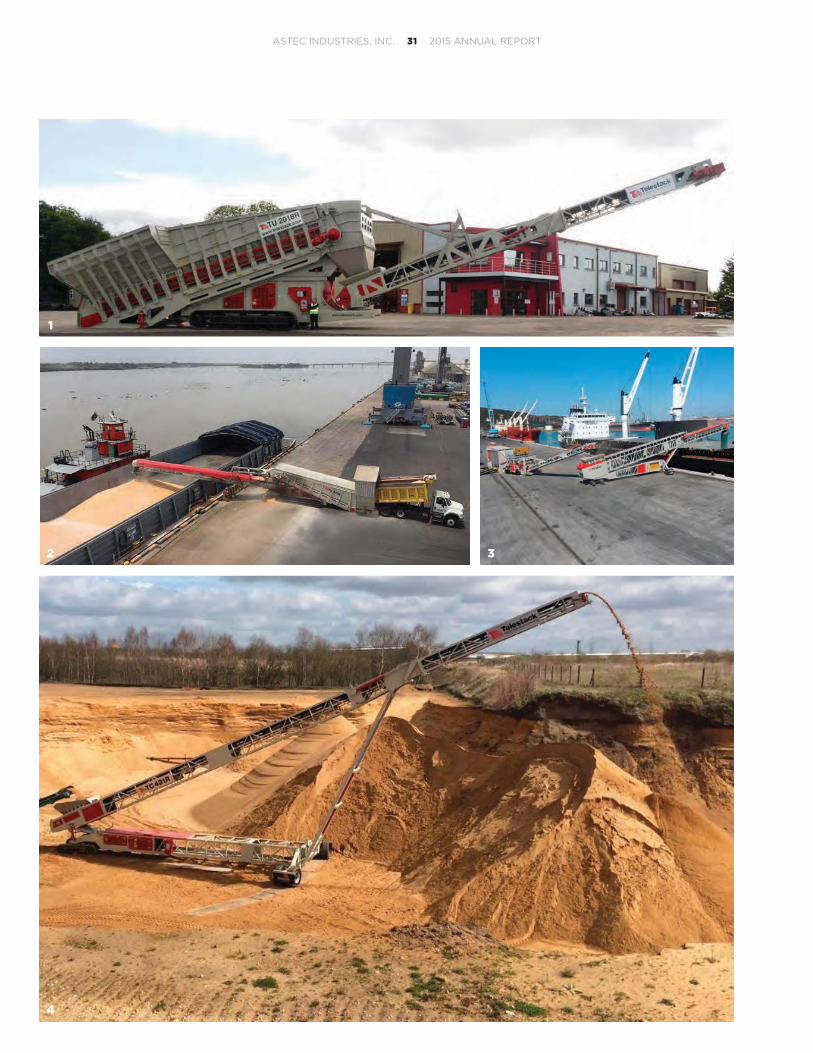
TOP TO BOTTOM: 1. Telestack TU2018R Truck Unloader — the largest Truck Unloader in the international market — as it prepares for transportation to a large multi-national customer in North America. 2. Telestack TU1016 Truck Unloader loading grains to barges at the Port of Barranquilla in Columbia. 3. Telestack TU 1016 R Truck Unloader and TS 1242 Radial Telescopic shiploader — shiploading at Port of Imbituba, Brazil at 750 m3/hr. 4. Telestack TC 431 Radial Tracked Conveyor stockpiling sand in Germany.
TELESTACKLOCATION: OMAGH, NORTHERN IRELAND
REPORTING GROUP: AGGREGATE AND MINING
INDUSTRIES SERVED:
PRODUCTS AND SERVICES: Ship Loaders and Unloaders Bulk Reception Feeders
Radial Telescopic Stackers Mobile Hopper Feeders
Track Mounted Conveyors Reclaim Hoppers
Mobile Truck Unloaders
Telestack offers a range of mobile bulk
material handling solutions that are used in
ports and inland river terminals, mines,
quarries, power stations, steel mills and
cement plants.
AGGREGATE AND MINING INFRASTRUCTURE
Telestack's solutions are used
for vessel loading/unloading,
stacking, reclaiming and rail
wagon loading/unloading of dry
bulk materials. The end users are
some of the biggest companies
in their chosen industries and
they rely on Telestack's proven
record of performance to
develop customized solutions
for their bulk handling facilities.
It's externally audited procedures
ISO 14001 (Environmental
Management), OHSAS 18001
(Health & Safety Management)
and ISO 9001 (Quality Manage-
ment Systems) ensures Telestack
has the processes in place to
deliver what the customer
ordered on time, within budget
and to the expected quality
standards. Robust designs and
innovative assembly designs
allow Telestack equipment to
be easily packed into shipping
containers and quickly assembled
on site anywhere in the world
ensuring Telestack is competitive
globally.
ENERGY
ASTEC INDUSTRIES, INC. 30 2015 ANNUAL REPORT
1
2 3
4
ASTEC INDUSTRIES, INC. 31 2015 ANNUAL REPORT
HEATECLOCATION: CHATTANOOGA, TENNESSEE, USA
REPORTING GROUP: ENERGY
INDUSTRIES SERVED:
PRODUCTS AND SERVICES: Thermal Fluid Heaters Fuel Preheaters
Process Heaters Controls
Pump Skids and Expansion Tanks Tanks
Heat Exchangers Polymer Blending Systems
Water Heaters
Engineering Services for Asphalt Terminals and Emulsion Plants
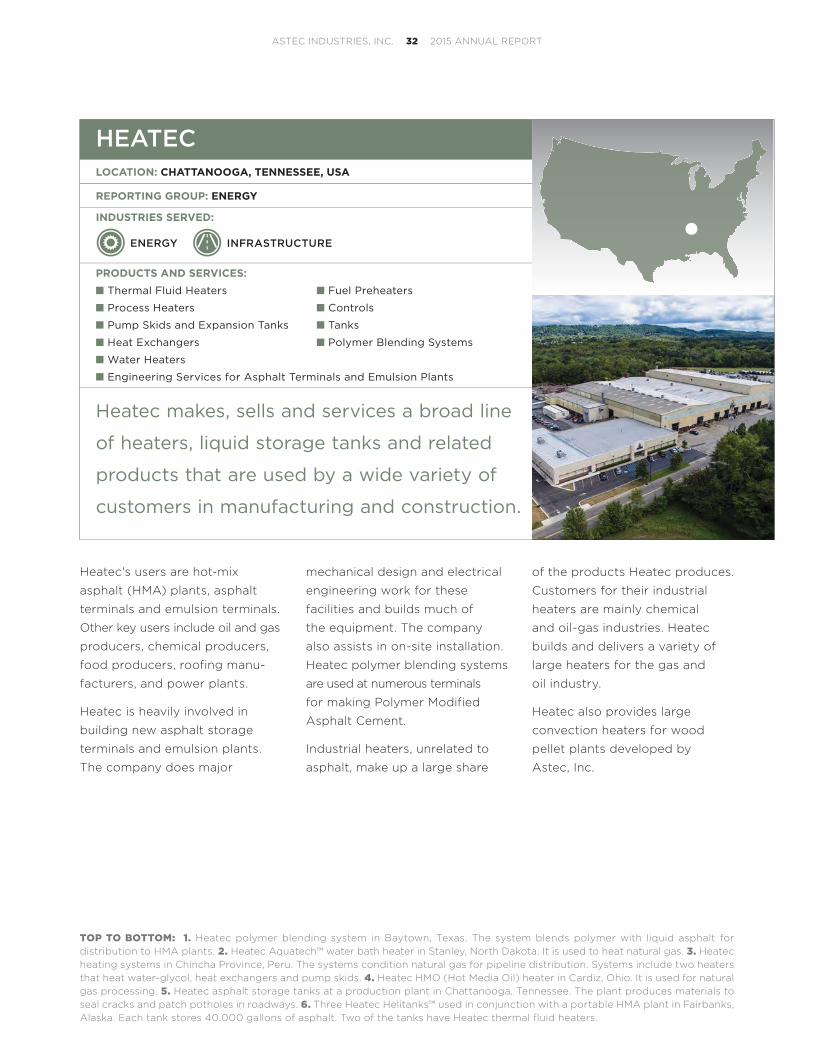
Heatec makes, sells and services a broad line
of heaters, liquid storage tanks and related
products that are used by a wide variety of
customers in manufacturing and construction.
Heatec's users are hot-mix
asphalt (HMA) plants, asphalt
terminals and emulsion terminals.
Other key users include oil and gas
producers, chemical producers,
food producers, roofing manu-
facturers, and power plants.
Heatec is heavily involved in
building new asphalt storage
terminals and emulsion plants.
The company does major
mechanical design and electrical
engineering work for these
facilities and builds much of
the equipment. The company
also assists in on-site installation.
Heatec polymer blending systems
are used at numerous terminals
for making Polymer Modified
Asphalt Cement.
Industrial heaters, unrelated to
asphalt, make up a large share
of the products Heatec produces.
Customers for their industrial
heaters are mainly chemical
and oil-gas industries. Heatec
builds and delivers a variety of
large heaters for the gas and
oil industry.
Heatec also provides large
convection heaters for wood
pellet plants developed by
Astec, Inc.
INFRASTRUCTUREENERGY
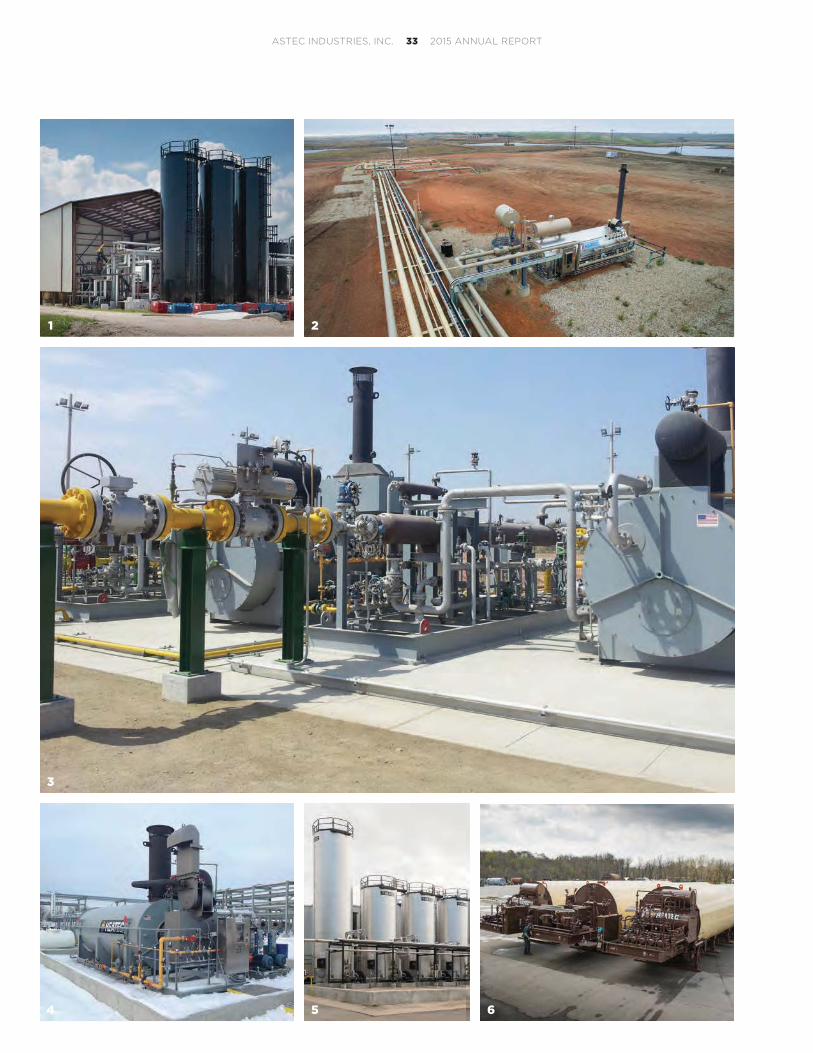
TOP TO BOTTOM: 1. Heatec polymer blending system in Baytown, Texas. The system blends polymer with liquid asphalt for distribution to HMA plants. 2. Heatec Aquatech™ water bath heater in Stanley, North Dakota. It is used to heat natural gas. 3. Heatec heating systems in Chincha Province, Peru. The systems condition natural gas for pipeline distribution. Systems include two heaters that heat water-glycol, heat exchangers and pump skids. 4. Heatec HMO (Hot Media Oil) heater in Cardiz, Ohio. It is used for natural gas processing. 5. Heatec asphalt storage tanks at a production plant in Chattanooga, Tennessee. The plant produces materials to seal cracks and patch potholes in roadways. 6. Three Heatec Helitanks™ used in conjunction with a portable HMA plant in Fairbanks, Alaska. Each tank stores 40,000 gallons of asphalt. Two of the tanks have Heatec thermal fluid heaters.
ASTEC INDUSTRIES, INC. 32 2015 ANNUAL REPORT
1 2
5 5
3
4 6
ASTEC INDUSTRIES, INC. 33 2015 ANNUAL REPORT
CEI ENTERPRISESLOCATION: ALBUQUERQUE, NEW MEXICO, USA
REPORTING GROUP: ENERGY
INDUSTRIES SERVED:
PRODUCTS AND SERVICES: Asphalt Rubber Blending Systems Emission Control Equipment
Hot Oil Heaters Liquid Additive Systems
Asphalt Storage Tanks Concrete Plants
Heavy Fuel Preheaters
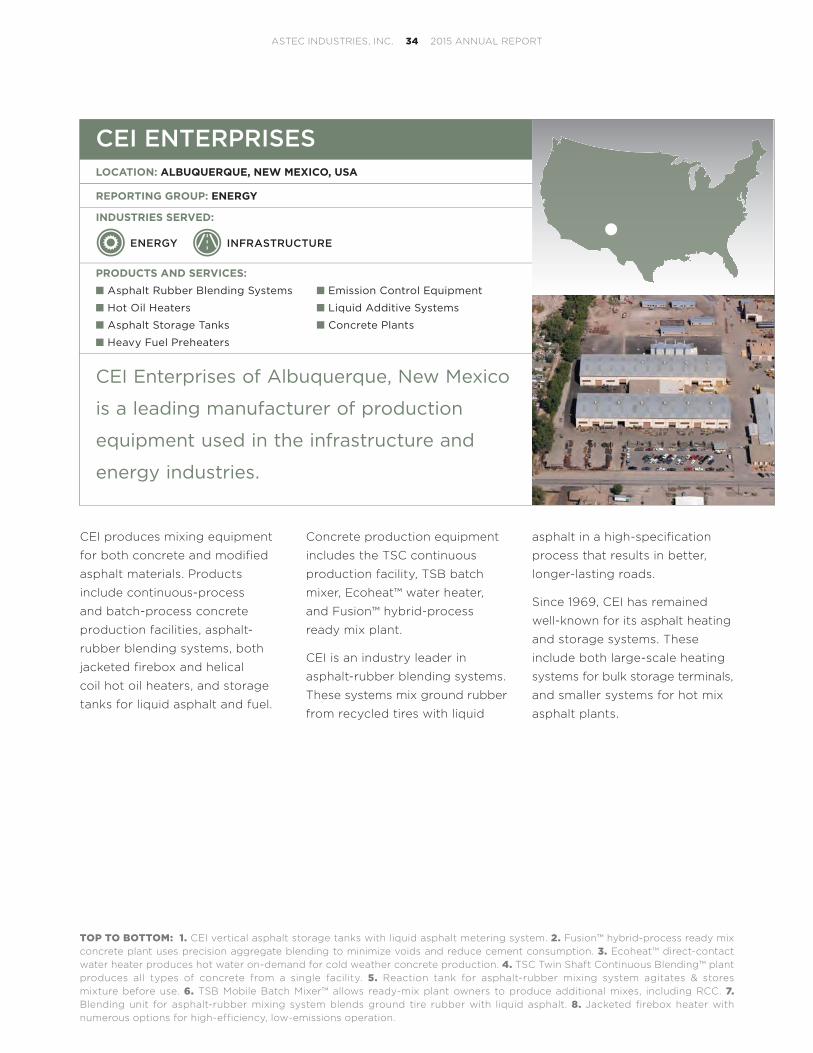
CEI Enterprises of Albuquerque, New Mexico
is a leading manufacturer of production
equipment used in the infrastructure and
energy industries.
CEI produces mixing equipment
for both concrete and modified
asphalt materials. Products
include continuous-process
and batch-process concrete
production facilities, asphalt-
rubber blending systems, both
jacketed firebox and helical
coil hot oil heaters, and storage
tanks for liquid asphalt and fuel.
Concrete production equipment
includes the TSC continuous
production facility, TSB batch
mixer, Ecoheat™ water heater,
and Fusion™ hybrid-process
ready mix plant.
CEI is an industry leader in
asphalt-rubber blending systems.
These systems mix ground rubber
from recycled tires with liquid
asphalt in a high-specification
process that results in better,
longer-lasting roads.
Since 1969, CEI has remained
well-known for its asphalt heating
and storage systems. These
include both large-scale heating
systems for bulk storage terminals,
and smaller systems for hot mix
asphalt plants.
INFRASTRUCTUREENERGY
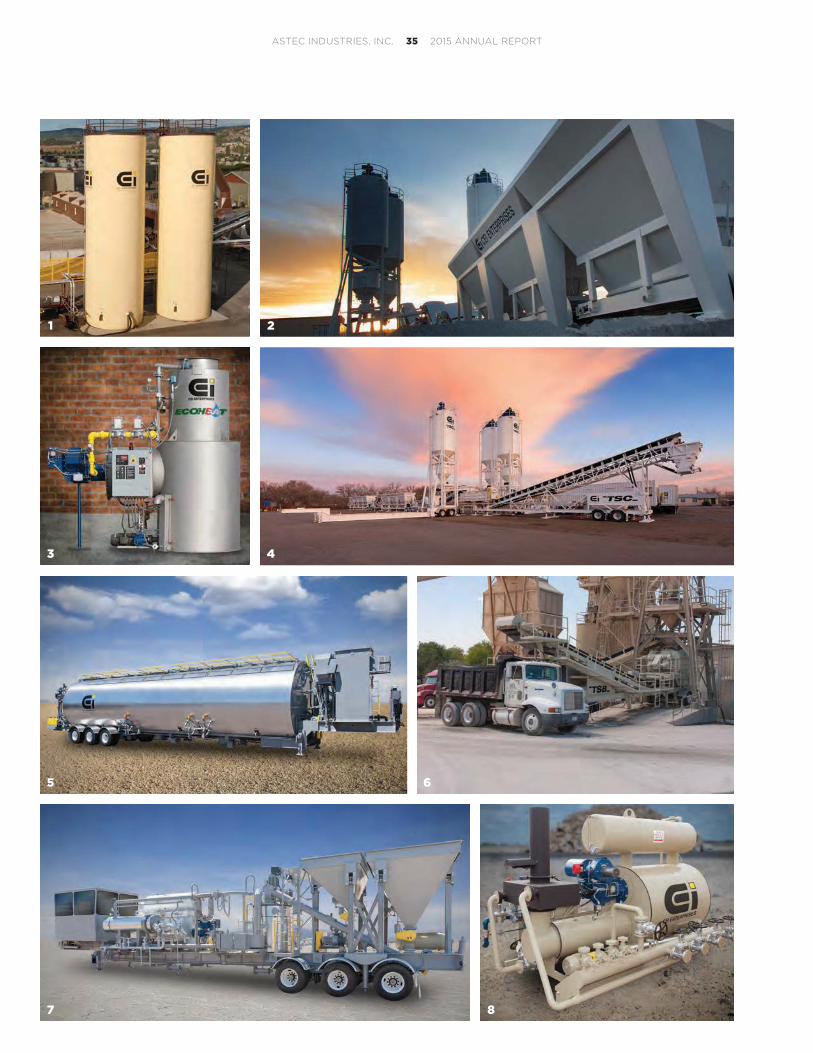
TOP TO BOTTOM: 1. CEI vertical asphalt storage tanks with liquid asphalt metering system. 2. Fusion™ hybrid-process ready mix concrete plant uses precision aggregate blending to minimize voids and reduce cement consumption. 3. Ecoheat™ direct-contact water heater produces hot water on-demand for cold weather concrete production. 4. TSC Twin Shaft Continuous Blending™ plant produces all types of concrete from a single facility. 5. Reaction tank for asphalt-rubber mixing system agitates & stores mixture before use. 6. TSB Mobile Batch Mixer™ allows ready-mix plant owners to produce additional mixes, including RCC. 7. Blending unit for asphalt-rubber mixing system blends ground tire rubber with liquid asphalt. 8. Jacketed firebox heater with numerous options for high-efficiency, low-emissions operation.
ASTEC INDUSTRIES, INC. 34 2015 ANNUAL REPORT
2
4
6
8
1
3
5
7
ASTEC INDUSTRIES, INC. 35 2015 ANNUAL REPORT
PETERSON PACIFIC CORP.LOCATION: EUGENE, OREGON, USA
REPORTING GROUP: ENERGY
INDUSTRIES SERVED:
PRODUCTS AND SERVICES: Whole Tree Chippers Blower Trucks and Trailers
Whole Tree Debarkers Screening Equipment
Horizontal Grinders Asphalt Shingle Shredders
Peterson Pacific Corp. is a Eugene, Oregon
based manufacturer of grinders, chippers,
debarkers, screens and blower trucks that
serve a wide variety of markets.
The company has 110,000 square
feet of modern manufacturing
space with a capable and
innovative engineering group.
Peterson machines are sold and
supported through a worldwide
network of distributors and direct
sales and service representatives.
Peterson Horizontal Grinders
reduce wood, low value logs
and other organic materials; the
reduced material is used in the
compost, mulch and biomass
energy markets. Peterson grinders
can also reduce certain construc-
tion and demolition materials
such as asphalt shingles that
can then be recycled and used in
hot mix asphalt paving. Peterson
drum and disc chippers and
debarkers are used to produce
wood chips for pulp and paper
production as well as biomass
energy markets. Peterson blower
trucks and trailers are used to
broadcast compost and mulch
for landscaping and erosion
control. Peterson deck screens
are used for classifying materials
to maximize the value of each
product. Many Peterson machines
are available in either electric or
diesel power depending on the
application. For increased mobility
at a job site, both tracked and
wheeled versions of many of
their products are available.
Since 1981, Peterson has
specialized in producing machines
that turn low-grade organic
materials into high value products.
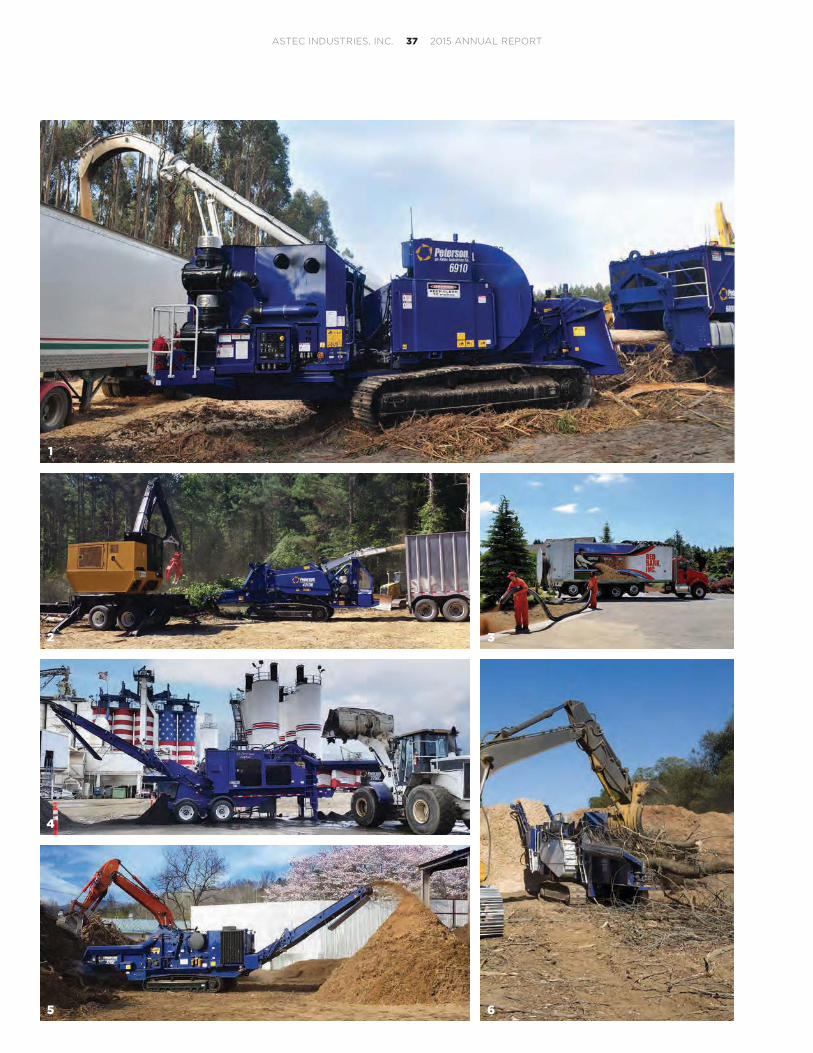
TOP TO BOTTOM: 1. The all-new Peterson 6910D tracked disc chipper is used in tandem with a Peterson 6800 flail and is designed for high-volume, mobile, clean chipping operations. 2. The highly mobile Peterson 4310B Drum Chipper is popular with biomass chipping operations. 3. Peterson’s Blower Trucks and Trailers are an ideal tool for erosion control and landscape materials delivery. 4. An all-electric Peterson 2750C Horizontal Grinder reduces asphalt shingle tiles in California. 5. Peterson’s popular 5710D horizontal grinder packs a winning combination of size and power, making it the market leader in the 1000hp category. 6. A Peterson 2710C Horizontal Grinder makes biomass for energy production in Korea.
INFRASTRUCTUREENERGY
ASTEC INDUSTRIES, INC. 36 2015 ANNUAL REPORT
1
2 3
65
4
ASTEC INDUSTRIES, INC. 37 2015 ANNUAL REPORT
GEFCOLOCATION: ENID, OKLAHOMA, USA
REPORTING GROUP: ENERGY
INDUSTRIES SERVED:
PRODUCTS AND SERVICES: Fluid Pump Trailers Water Well Drills
Drills for Oil and Gas Drills for Mining Core Samples
For more than 85 years, GEFCO has provided
rugged and dependable equipment that has
been delivered to over 100 countries.
ENERGY
Designing world class drilling
rigs and related equipment is
a passion that is meticulously
performed with the utmost
scrutiny and perfection at
GEFCO. A world leader in the
design and manufacture of
portable drilling rigs and related
equipment for the water well,
environmental, groundwater
monitoring, construction,
mining and oil & gas exploration
and production industries.
GEFCO employs over 120
professionals with years of
field experience and product
knowledge, which allows them
to remain competitive in the
industries that they serve.
Engineers focus on incorporating
state-of-the-art equipment and
technology to manufacture the
most suitable drilling rigs and
related equipment for today’s
environmental demands. GEFCO
headquarters are located in Enid,
Oklahoma and operates from a
240,000 square feet facility.
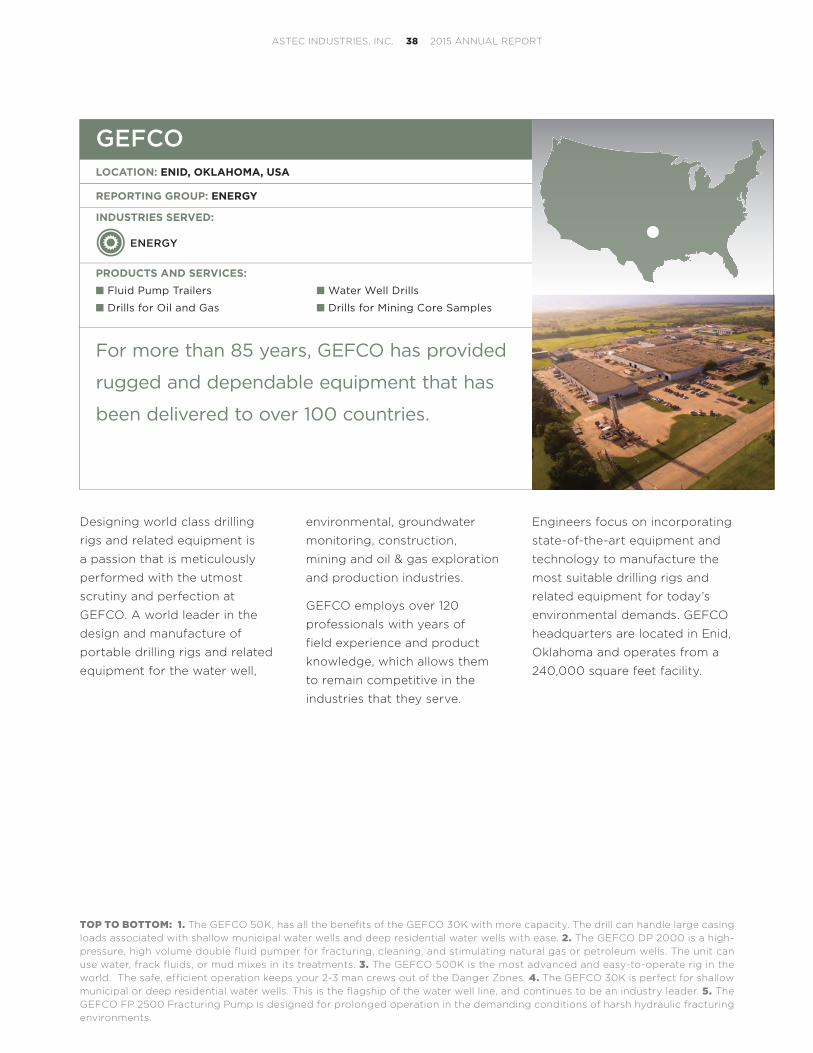
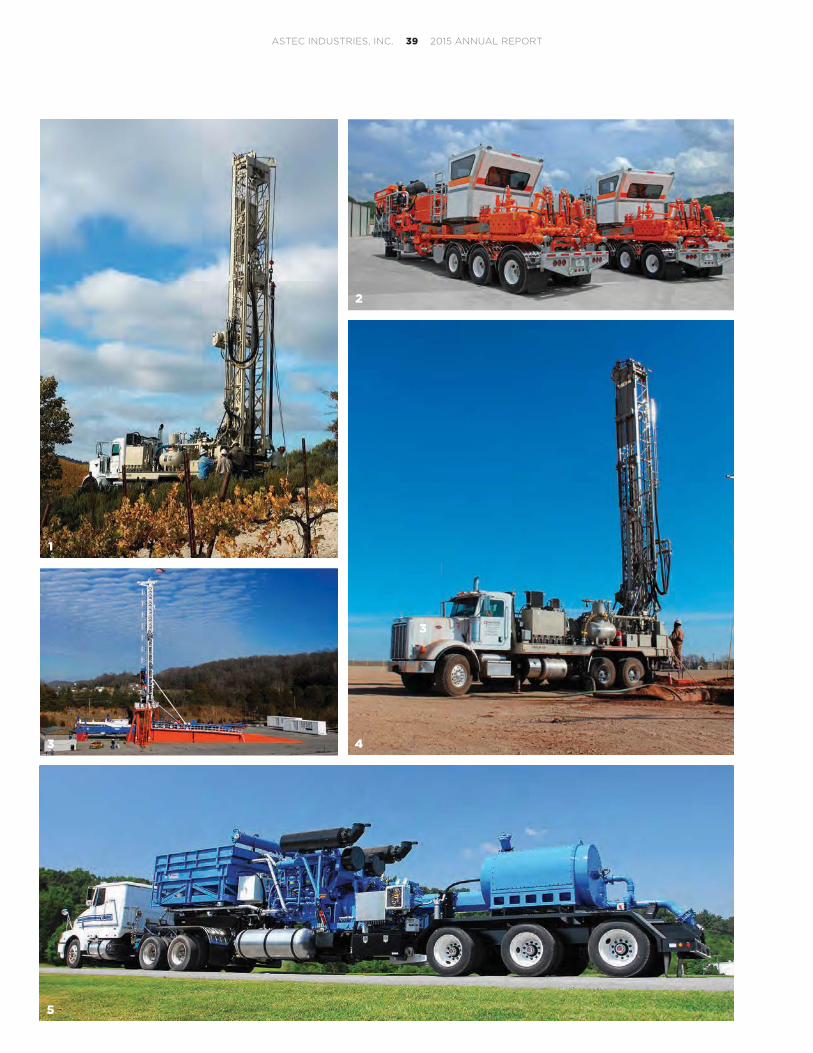
TOP TO BOTTOM: 1. The GEFCO 50K, has all the benefits of the GEFCO 30K with more capacity. The drill can handle large casing loads associated with shallow municipal water wells and deep residential water wells with ease. 2. The GEFCO DP 2000 is a high-pressure, high volume double fluid pumper for fracturing, cleaning, and stimulating natural gas or petroleum wells. The unit can use water, frack fluids, or mud mixes in its treatments. 3. The GEFCO 500K is the most advanced and easy-to-operate rig in the world. The safe, efficient operation keeps your 2-3 man crews out of the Danger Zones. 4. The GEFCO 30K is perfect for shallow municipal or deep residential water wells. This is the flagship of the water well line, and continues to be an industry leader. 5. The GEFCO FP 2500 Fracturing Pump is designed for prolonged operation in the demanding conditions of harsh hydraulic fracturing environments.
ASTEC INDUSTRIES, INC. 38 2015 ANNUAL REPORT
1
3 4
2
3
5
ASTEC INDUSTRIES, INC. 39 2015 ANNUAL REPORT

BOARD OF DIRECTORS
ASTEC INDUSTRIES' CORPORATE EXECUTIVE OFFICERS
Glen E. TellockFormer Chairman of the Board, President and Chief Executive Officer of The Manitowoc Company, Inc.Member—Audit CommitteeMember—Nominating and Corporate Governance Committee
Benjamin G. BrockPresident and Chief Executive Officer of Astec Industries, Inc.Chairman—Executive Committee
William D. GehlChairman of the Board of IBD Southeastern WisconsinChairman of the Board of FreightCar AmericaMember—Compensation CommitteeMember—Audit Committee
James B. BakerManaging Partner of River Associates Investments, LLCChairman—Audit CommitteeMember—Compensation Committee
W. Norman SmithVice Chairman of Astec Industries, Inc.Vice Chairman of the BoardMember—Executive Committee
William G. DoreyFormer Chief Executive Officer and President of Granite Construction, Inc.Chairman—Compensation Committee Member—Audit CommitteeMember—Nominating and Corporate Governance Committee
William B. SansomChairman of the Board and Chief Executive Officer of The H.T. Hackney CompanyMember—Audit CommitteeMember—Nominating and Corporate Governance CommitteeLead Independent Director
Daniel K. FriersonChairman of the Board and Chief Executive Officer of the Dixie Group, Inc.Chairman—Nominating and Corporate Governance CommitteeMember—Audit CommitteeMember—Executive Committee
Charles F. Potts Chairman of the Board of Heritage Construction and MaterialsMember—Audit Committee Member—Compensation Committee
PICTURED, FROM LEFT TO RIGHT, TOP TO BOTTOM:
Benjamin G. BrockPresident and Chief Executive Officer
Richard J. DorrisExecutive Vice President and Chief Operating Officer
W. Norman SmithVice Chairman
Steve ClaudeGroup President Infrastructure
Richard A. PatekGroup President Aggregate and Mining Group
Jeffrey J. ElliottGroup Vice President Aggregate and Mining Group
David C. SilviousVice President, Chief Financial Officer and Treasurer
Stephen C. AndersonVice President of Administration, Corporate Secretary and Director of Investor Relations
Robin A. LeffewCorporate Controller
PICTURED, FROM LEFT TO RIGHT:
ASTEC INDUSTRIES, INC. 40 2015 ANNUAL REPORT

FINANCIAL INFORMATION
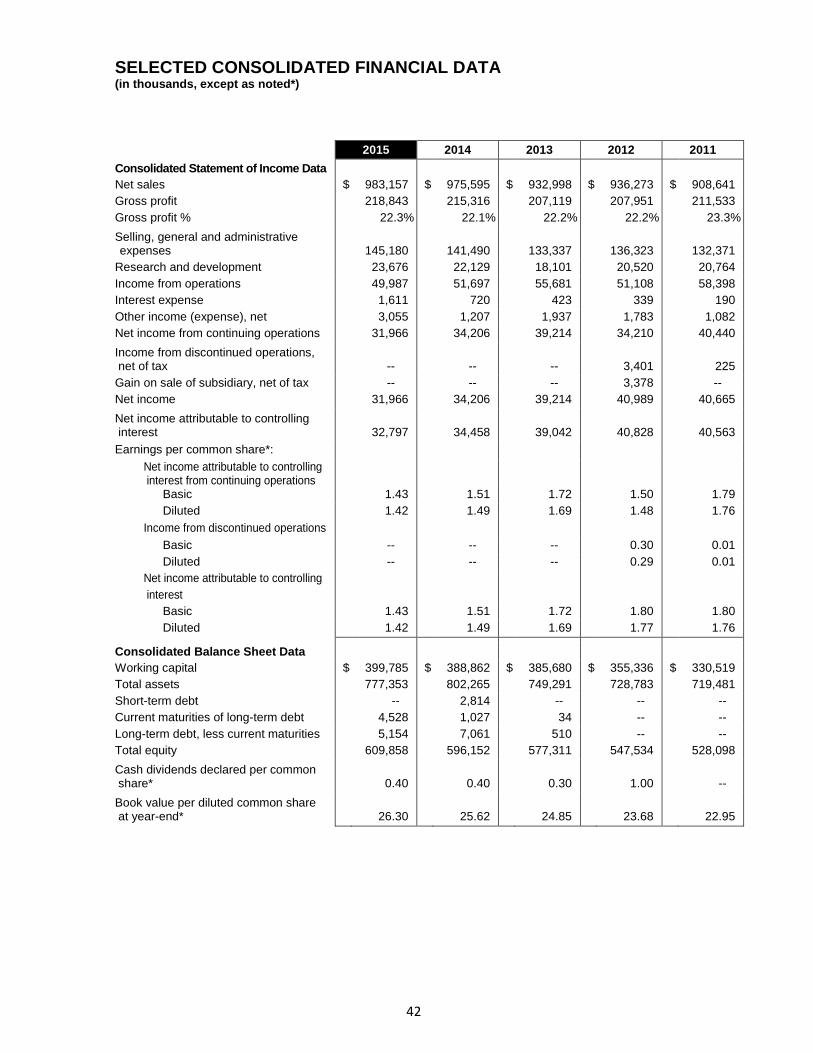
SELECTED CONSOLIDATED FINANCIAL DATA (in thousands, except as noted*)
42
2015 2014 2013 2012 2011 Consolidated Statement of Income Data Net sales $ 983,157 $ 975,595 $ 932,998 $ 936,273 $ 908,641 Gross profit 218,843 215,316 207,119 207,951 211,533 Gross profit % 22.3% 22.1% 22.2% 22.2% 23.3% Selling, general and administrative expenses
145,180
141,490
133,337
136,323
132,371 Research and development 23,676 22,129 18,101 20,520 20,764 Income from operations 49,987 51,697 55,681 51,108 58,398 Interest expense 1,611 720 423 339 190 Other income (expense), net 3,055 1,207 1,937 1,783 1,082 Net income from continuing operations 31,966 34,206 39,214 34,210 40,440 Income from discontinued operations, net of tax
--
--
--
3,401
225 Gain on sale of subsidiary, net of tax -- -- -- 3,378 -- Net income 31,966 34,206 39,214 40,989 40,665 Net income attributable to controlling interest
32,797
34,458
39,042
40,828
40,563 Earnings per common share*:
Net income attributable to controlling interest from continuing operations
Basic 1.43 1.51 1.72 1.50 1.79 Diluted 1.42 1.49 1.69 1.48 1.76
Income from discontinued operations Basic -- -- -- 0.30 0.01 Diluted -- -- -- 0.29 0.01
Net income attributable to controlling interest
Basic 1.43 1.51 1.72 1.80 1.80 Diluted 1.42 1.49 1.69 1.77 1.76
Consolidated Balance Sheet Data Working capital $ 399,785 $ 388,862 $ 385,680 $ 355,336 $ 330,519 Total assets 777,353 802,265 749,291 728,783 719,481 Short-term debt -- 2,814 -- -- -- Current maturities of long-term debt 4,528 1,027 34 -- -- Long-term debt, less current maturities 5,154 7,061 510 -- -- Total equity 609,858 596,152 577,311 547,534 528,098 Cash dividends declared per common share*
0.40
0.40
0.30
1.00
--
Book value per diluted common share at year-end*
26.30
25.62
24.85
23.68
22.95
SUPPLEMENTARY FINANCIAL DATA (in thousands, except as noted*)
43
Quarterly Financial Highlights (Unaudited)
First Quarter
Second Quarter
Third Quarter
Fourth Quarter
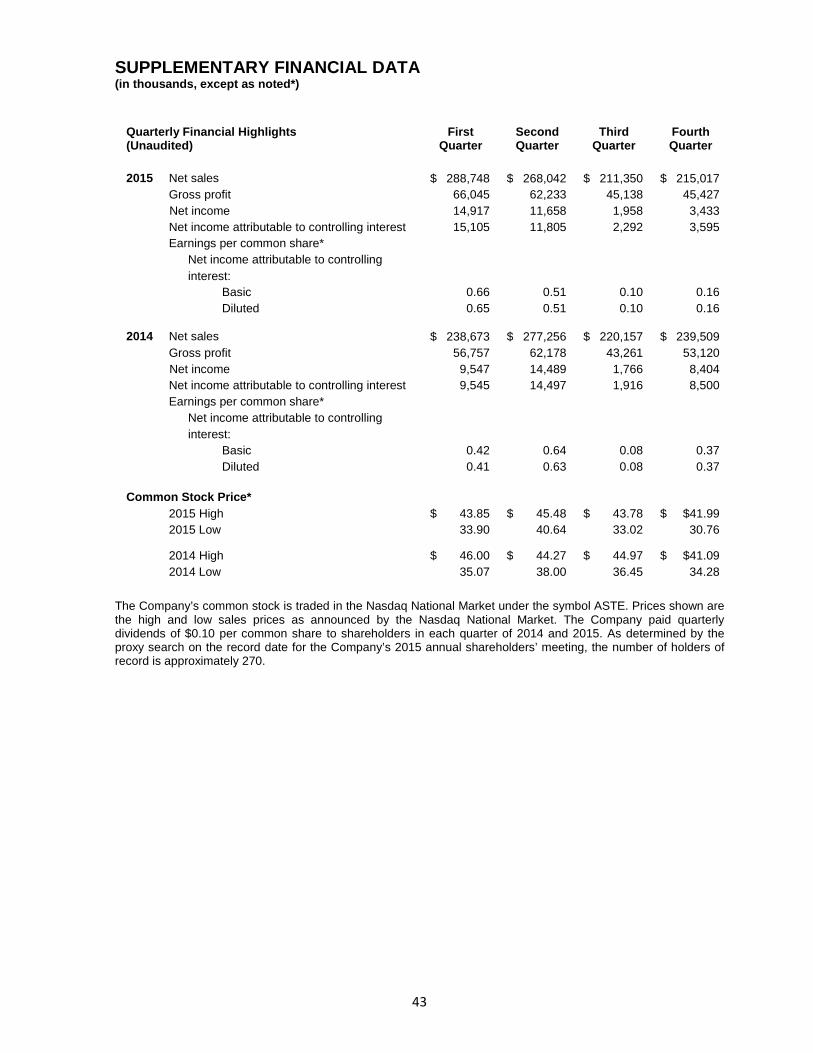
2015 Net sales $ 288,748 $ 268,042 $ 211,350 $ 215,017 Gross profit 66,045 62,233 45,138 45,427
Net income 14,917 11,658 1,958 3,433 Net income attributable to controlling interest 15,105 11,805 2,292 3,595 Earnings per common share*
Net income attributable to controlling interest:
Basic 0.66 0.51 0.10 0.16 Diluted 0.65 0.51 0.10 0.16
2014 Net sales $ 238,673 $ 277,256 $ 220,157 $ 239,509 Gross profit 56,757 62,178 43,261 53,120
Net income 9,547 14,489 1,766 8,404 Net income attributable to controlling interest 9,545 14,497 1,916 8,500 Earnings per common share*
Net income attributable to controlling interest:
Basic 0.42 0.64 0.08 0.37 Diluted 0.41 0.63 0.08 0.37
Common Stock Price* 2015 High $ 43.85 $ 45.48 $ 43.78 $ $41.99 2015 Low 33.90 40.64 33.02 30.76 2014 High $ 46.00 $ 44.27 $ 44.97 $ $41.09 2014 Low 35.07 38.00 36.45 34.28
The Company’s common stock is traded in the Nasdaq National Market under the symbol ASTE. Prices shown are the high and low sales prices as announced by the Nasdaq National Market. The Company paid quarterly dividends of $0.10 per common share to shareholders in each quarter of 2014 and 2015. As determined by the proxy search on the record date for the Company’s 2015 annual shareholders’ meeting, the number of holders of record is approximately 270.
MANAGEMENT’S DISCUSSION AND ANALYSIS OF FINANCIAL CONDITION AND RESULTS OF OPERATIONS (Dollar and share amounts in thousands, except per share amounts, unless otherwise specified)
44
The following discussion contains forward-looking statements that involve inherent risks and uncertainties. Actual results may differ materially from those contained in these forward-looking statements. For additional information regarding forward-looking statements, see “Forward-looking Statements” on page 57.
Overview Astec Industries, Inc. (the “Company”) is a leading manufacturer and seller of equipment for the road building, aggregate processing, geothermal, water, oil and gas, and wood processing industries. The Company’s businesses:
• design, engineer, manufacture and market equipment used in each phase of road building, including quarrying and crushing the aggregate, mobile bulk and material handling solutions, producing asphalt or concrete, recycling old asphalt or concrete and applying the asphalt;
• design, engineer, manufacture and market additional equipment and components, including equipment
for geothermal drilling, oil and natural gas drilling, industrial heat transfer, wood chipping and grinding, and wood pellet processing; and
• manufacture and sell replacement parts for equipment in each of its product lines.
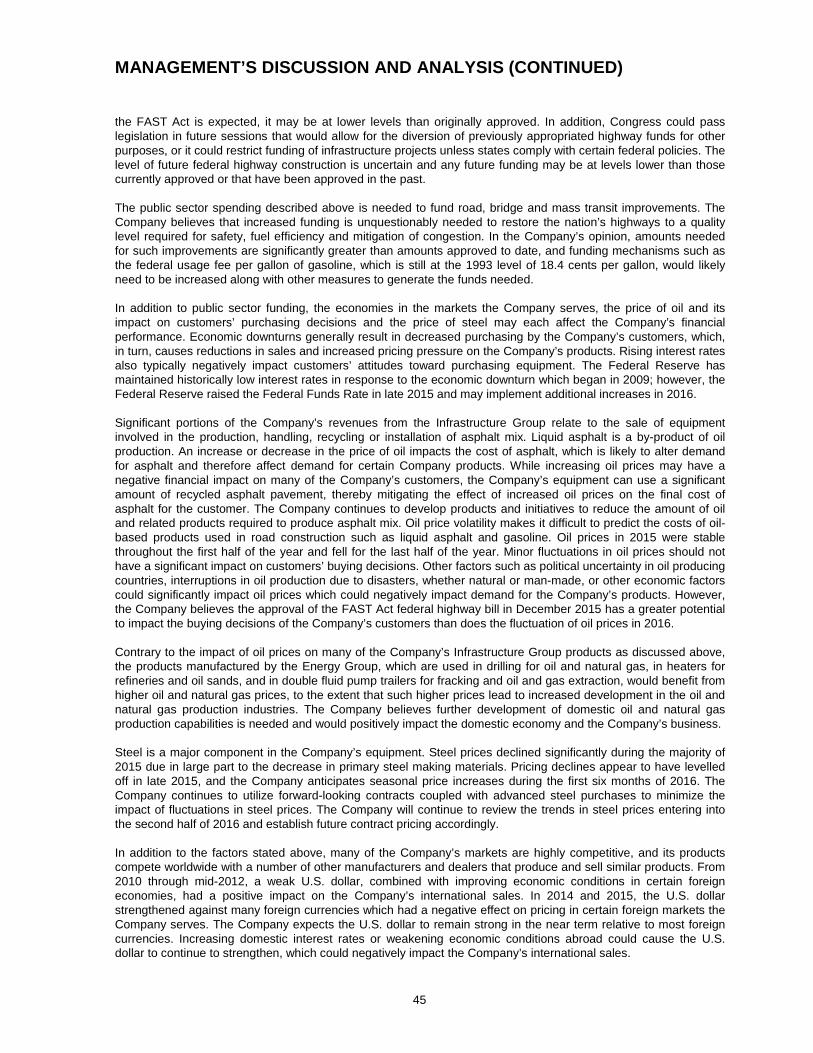
Astec Industries, Inc. consists of 19 companies: 15 manufacturing companies, 2 companies that operate as dealers for the manufacturing companies, a captive insurance company and the parent company. The companies fall within three reportable operating segments: the Infrastructure Group, the Aggregate and Mining Group and the Energy Group. The Infrastructure Group is made up of five business units, three of which design, engineer, manufacture and market a complete line of asphalt plants, asphalt pavers, wood pellet plants and related components and ancillary equipment. The two remaining companies in the Infrastructure Group primarily sell, service and install equipment produced by the manufacturing subsidiaries of the Company with the majority of sales to the infrastructure industry. The Aggregate and Mining Group consists of eight business units that design, manufacture and market heavy equipment and parts in the aggregate, metallic mining, quarrying, recycling, ports and bulk handling industries. The Energy Group consists of four business units that design, manufacture and market heaters, drilling rigs, concrete plants, wood chippers and grinders, pump trailers, storage equipment and related parts to the oil and gas, construction, and water well industries. The Company also has one other category, Corporate, that contains the business units that do not meet the requirements for separate disclosure as a separate operating segment or inclusion in one of the other reporting segments. The business units in the Corporate category are Astec Insurance Company (“Astec Insurance” or “the captive”) and Astec Industries, Inc., the parent company. These two companies provide support and corporate oversight for all the companies that fall within the reportable operating segments. The Company’s financial performance is affected by a number of factors, including the cyclical nature and varying conditions of the markets it serves. Demand in these markets fluctuates in response to overall economic conditions and is particularly sensitive to the amount of public sector spending on infrastructure development, privately funded infrastructure development, changes in the price of crude oil, which affects the cost of fuel and liquid asphalt, and changes in the price of steel. The Company believes that federal highway funding influences the purchasing decisions of the Company’s customers, who are typically more comfortable making capital equipment purchases with long-term federal legislation in place. Federal funding provides for approximately 25% of all highway, street, roadway and parking construction in the United States. In July 2012, the “Moving Ahead for Progress in the 21st Century Act” (“Map-21”) was approved by the U.S. federal government, which authorized $105 billion of federal spending on highway and public transportation programs through fiscal year 2014. In August 2014, the U.S. government approved short-term funding of $10.8 billion through May 2015. Federal transportation funding operated on short-term appropriations until December 4, 2015 when the Fixing America’s Surface Transportation Act (“FAST Act”) was signed into law. The $305 billion FAST Act approved funding for highways of approximately $205 billion and transit projects of approximately $48 billion for the five-year period ending September 30, 2020. The Company believes a multi-year highway program (such as the FAST Act) will have the greatest positive impact on the road construction industry and allow its customers to plan and execute longer-term projects, but given the inherent uncertainty in the political process, the level of governmental funding for federal highway projects will similarly continue to be uncertain. Governmental funding that is committed or earmarked for federal highway projects is always subject to repeal or reduction. Although continued funding under
MANAGEMENT’S DISCUSSION AND ANALYSIS (CONTINUED)
45
the FAST Act is expected, it may be at lower levels than originally approved. In addition, Congress could pass legislation in future sessions that would allow for the diversion of previously appropriated highway funds for other purposes, or it could restrict funding of infrastructure projects unless states comply with certain federal policies. The level of future federal highway construction is uncertain and any future funding may be at levels lower than those currently approved or that have been approved in the past. The public sector spending described above is needed to fund road, bridge and mass transit improvements. The Company believes that increased funding is unquestionably needed to restore the nation’s highways to a quality level required for safety, fuel efficiency and mitigation of congestion. In the Company’s opinion, amounts needed for such improvements are significantly greater than amounts approved to date, and funding mechanisms such as the federal usage fee per gallon of gasoline, which is still at the 1993 level of 18.4 cents per gallon, would likely need to be increased along with other measures to generate the funds needed.
In addition to public sector funding, the economies in the markets the Company serves, the price of oil and its impact on customers’ purchasing decisions and the price of steel may each affect the Company’s financial performance. Economic downturns generally result in decreased purchasing by the Company’s customers, which, in turn, causes reductions in sales and increased pricing pressure on the Company’s products. Rising interest rates also typically negatively impact customers’ attitudes toward purchasing equipment. The Federal Reserve has maintained historically low interest rates in response to the economic downturn which began in 2009; however, the Federal Reserve raised the Federal Funds Rate in late 2015 and may implement additional increases in 2016. Significant portions of the Company’s revenues from the Infrastructure Group relate to the sale of equipment involved in the production, handling, recycling or installation of asphalt mix. Liquid asphalt is a by-product of oil production. An increase or decrease in the price of oil impacts the cost of asphalt, which is likely to alter demand for asphalt and therefore affect demand for certain Company products. While increasing oil prices may have a negative financial impact on many of the Company’s customers, the Company’s equipment can use a significant amount of recycled asphalt pavement, thereby mitigating the effect of increased oil prices on the final cost of asphalt for the customer. The Company continues to develop products and initiatives to reduce the amount of oil and related products required to produce asphalt mix. Oil price volatility makes it difficult to predict the costs of oil-based products used in road construction such as liquid asphalt and gasoline. Oil prices in 2015 were stable throughout the first half of the year and fell for the last half of the year. Minor fluctuations in oil prices should not have a significant impact on customers’ buying decisions. Other factors such as political uncertainty in oil producing countries, interruptions in oil production due to disasters, whether natural or man-made, or other economic factors could significantly impact oil prices which could negatively impact demand for the Company’s products. However, the Company believes the approval of the FAST Act federal highway bill in December 2015 has a greater potential to impact the buying decisions of the Company’s customers than does the fluctuation of oil prices in 2016. Contrary to the impact of oil prices on many of the Company’s Infrastructure Group products as discussed above, the products manufactured by the Energy Group, which are used in drilling for oil and natural gas, in heaters for refineries and oil sands, and in double fluid pump trailers for fracking and oil and gas extraction, would benefit from higher oil and natural gas prices, to the extent that such higher prices lead to increased development in the oil and natural gas production industries. The Company believes further development of domestic oil and natural gas production capabilities is needed and would positively impact the domestic economy and the Company’s business.
Steel is a major component in the Company’s equipment. Steel prices declined significantly during the majority of 2015 due in large part to the decrease in primary steel making materials. Pricing declines appear to have levelled off in late 2015, and the Company anticipates seasonal price increases during the first six months of 2016. The Company continues to utilize forward-looking contracts coupled with advanced steel purchases to minimize the impact of fluctuations in steel prices. The Company will continue to review the trends in steel prices entering into the second half of 2016 and establish future contract pricing accordingly. In addition to the factors stated above, many of the Company’s markets are highly competitive, and its products compete worldwide with a number of other manufacturers and dealers that produce and sell similar products. From 2010 through mid-2012, a weak U.S. dollar, combined with improving economic conditions in certain foreign economies, had a positive impact on the Company’s international sales. In 2014 and 2015, the U.S. dollar strengthened against many foreign currencies which had a negative effect on pricing in certain foreign markets the Company serves. The Company expects the U.S. dollar to remain strong in the near term relative to most foreign currencies. Increasing domestic interest rates or weakening economic conditions abroad could cause the U.S. dollar to continue to strengthen, which could negatively impact the Company’s international sales.
MANAGEMENT’S DISCUSSION AND ANALYSIS (CONTINUED)
46
In the United States and internationally, the Company’s equipment is marketed directly to customers as well as through dealers. During 2015, approximately 75% to 80% of equipment sold by the Company was sold directly to the end user. The Company expects this ratio to remain relatively consistent through 2016. The Company is operated on a decentralized basis with a complete management team for each operating subsidiary. Finance, insurance, legal, shareholder relations, corporate accounting and other corporate matters are primarily handled at the corporate level (i.e., Astec Industries, Inc., the parent company). The engineering, design, sales, manufacturing and basic accounting functions are handled at each individual subsidiary. Standard accounting procedures are prescribed and followed in all reporting.
The non-union employees of each subsidiary have the opportunity to earn profit-sharing incentives in the aggregate of up to 10% of each subsidiary’s after-tax profit if the subsidiary meets established goals. For 2015, these goals are based on the subsidiary’s return on capital employed, cash flow on capital employed and safety. The profit-sharing incentives for subsidiary presidents and corporate officers are normally paid from a separate formula-driven pool based on the same key performance indicators used in the employee incentive plan. The profit-sharing key performance indicators for 2016 and thereafter for the non-union employees of each subsidiary, as well as subsidiary presidents and corporate officers, will be based on return on capital employed, EBITDA margin and safety. Results of Operations: 2015 vs. 2014
Net Sales Net sales increased $7,562 or 0.8% to $983,157 in 2015 from $975,595 in 2014. Sales are generated primarily from new equipment purchases made by customers for use in construction of privately funded infrastructure, public sector spending on infrastructure and sales of equipment for the aggregate, mining, quarrying and recycling markets and for oil and gas and geothermal industries. Domestic sales for 2015 were $722,287 or 73.5% of net sales compared to $654,231 or 67.1% of net sales for 2014, an increase of $68,056 or 10.4%. The overall increase in domestic sales for 2015 compared to 2014 reflects the strengthening economic conditions for the Company’s products in the domestic market. International sales for 2015 were $260,870 or 26.5% of net sales compared to $321,364 or 32.9% of net sales for 2014, a decrease of $60,494 or 18.8%. The Company experienced a challenging market for its products internationally in 2015 compared to 2014 caused by competitive pressures due to the strengthening of the U.S. dollar as we compete with local manufacturers that do not price their products based on the U.S. dollar, the decline in oil prices and the slowdown in the global mining industry. Sales reported by the Company would have been $17,536 higher had 2015 foreign exchange rates been the same as 2014 rates. The Company continues its efforts to grow its international business by increasing its presence in the markets it serves. Parts sales as a percentage of net sales increased 90 basis points to 27.0% in 2015 from 26.1% in 2014. In U.S. dollars, parts sales increased 4.1% to $265,092 in 2015 from $254,747 in 2014. Gross Profit Gross profit as a percentage of sales remained relatively flat at 22.3% in 2015 as compared to 22.1% in 2014. In U.S. dollars, gross profit increased 1.6% to $218,843 in 2015 from $215,316 in 2014. Selling, General and Administrative Expense Selling, general and administrative expense for 2015 was $145,180 or 14.8% of net sales compared to $141,490 or 14.5% of net sales for 2014, an increase of $3,690 or 2.6%. The increase in selling, general and administrative expense over 2014 was due to an increase in payroll and related expense of $2,148, an increase of $2,873 in repairs and maintenance, primarily for repairs on Company airplanes, and an increase in computer expense of $2,087, offset by a reduction in ConExpo expense of $3,162. Research and Development Research and development expenses increased $1,547 or 7.0% to $23,676 in 2015 from $22,129 in 2014. During 2015, the Company continued its focus on research and development spending for new products as well as improvements to existing product lines and adaptation of those products to other markets.
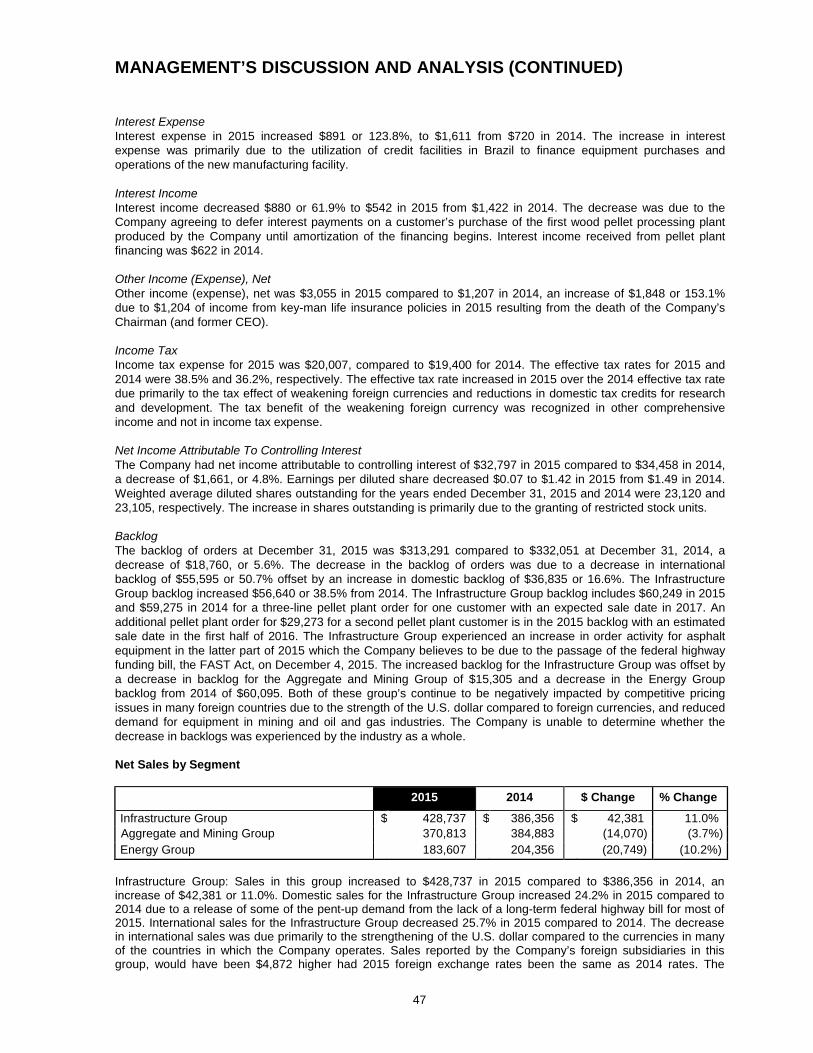
MANAGEMENT’S DISCUSSION AND ANALYSIS (CONTINUED)
47
Interest Expense Interest expense in 2015 increased $891 or 123.8%, to $1,611 from $720 in 2014. The increase in interest expense was primarily due to the utilization of credit facilities in Brazil to finance equipment purchases and operations of the new manufacturing facility. Interest Income Interest income decreased $880 or 61.9% to $542 in 2015 from $1,422 in 2014. The decrease was due to the Company agreeing to defer interest payments on a customer’s purchase of the first wood pellet processing plant produced by the Company until amortization of the financing begins. Interest income received from pellet plant financing was $622 in 2014. Other Income (Expense), Net Other income (expense), net was $3,055 in 2015 compared to $1,207 in 2014, an increase of $1,848 or 153.1% due to $1,204 of income from key-man life insurance policies in 2015 resulting from the death of the Company’s Chairman (and former CEO). Income Tax Income tax expense for 2015 was $20,007, compared to $19,400 for 2014. The effective tax rates for 2015 and 2014 were 38.5% and 36.2%, respectively. The effective tax rate increased in 2015 over the 2014 effective tax rate due primarily to the tax effect of weakening foreign currencies and reductions in domestic tax credits for research and development. The tax benefit of the weakening foreign currency was recognized in other comprehensive income and not in income tax expense. Net Income Attributable To Controlling Interest The Company had net income attributable to controlling interest of $32,797 in 2015 compared to $34,458 in 2014, a decrease of $1,661, or 4.8%. Earnings per diluted share decreased $0.07 to $1.42 in 2015 from $1.49 in 2014. Weighted average diluted shares outstanding for the years ended December 31, 2015 and 2014 were 23,120 and 23,105, respectively. The increase in shares outstanding is primarily due to the granting of restricted stock units. Backlog The backlog of orders at December 31, 2015 was $313,291 compared to $332,051 at December 31, 2014, a decrease of $18,760, or 5.6%. The decrease in the backlog of orders was due to a decrease in international backlog of $55,595 or 50.7% offset by an increase in domestic backlog of $36,835 or 16.6%. The Infrastructure Group backlog increased $56,640 or 38.5% from 2014. The Infrastructure Group backlog includes $60,249 in 2015 and $59,275 in 2014 for a three-line pellet plant order for one customer with an expected sale date in 2017. An additional pellet plant order for $29,273 for a second pellet plant customer is in the 2015 backlog with an estimated sale date in the first half of 2016. The Infrastructure Group experienced an increase in order activity for asphalt equipment in the latter part of 2015 which the Company believes to be due to the passage of the federal highway funding bill, the FAST Act, on December 4, 2015. The increased backlog for the Infrastructure Group was offset by a decrease in backlog for the Aggregate and Mining Group of $15,305 and a decrease in the Energy Group backlog from 2014 of $60,095. Both of these group’s continue to be negatively impacted by competitive pricing issues in many foreign countries due to the strength of the U.S. dollar compared to foreign currencies, and reduced demand for equipment in mining and oil and gas industries. The Company is unable to determine whether the decrease in backlogs was experienced by the industry as a whole. Net Sales by Segment 2015 2014 $ Change % Change
Infrastructure Group $ 428,737 $ 386,356 $ 42,381 11.0% Aggregate and Mining Group 370,813 384,883 (14,070) (3.7%) Energy Group 183,607 204,356 (20,749) (10.2%)
Infrastructure Group: Sales in this group increased to $428,737 in 2015 compared to $386,356 in 2014, an increase of $42,381 or 11.0%. Domestic sales for the Infrastructure Group increased 24.2% in 2015 compared to 2014 due to a release of some of the pent-up demand from the lack of a long-term federal highway bill for most of 2015. International sales for the Infrastructure Group decreased 25.7% in 2015 compared to 2014. The decrease in international sales was due primarily to the strengthening of the U.S. dollar compared to the currencies in many of the countries in which the Company operates. Sales reported by the Company’s foreign subsidiaries in this group, would have been $4,872 higher had 2015 foreign exchange rates been the same as 2014 rates. The
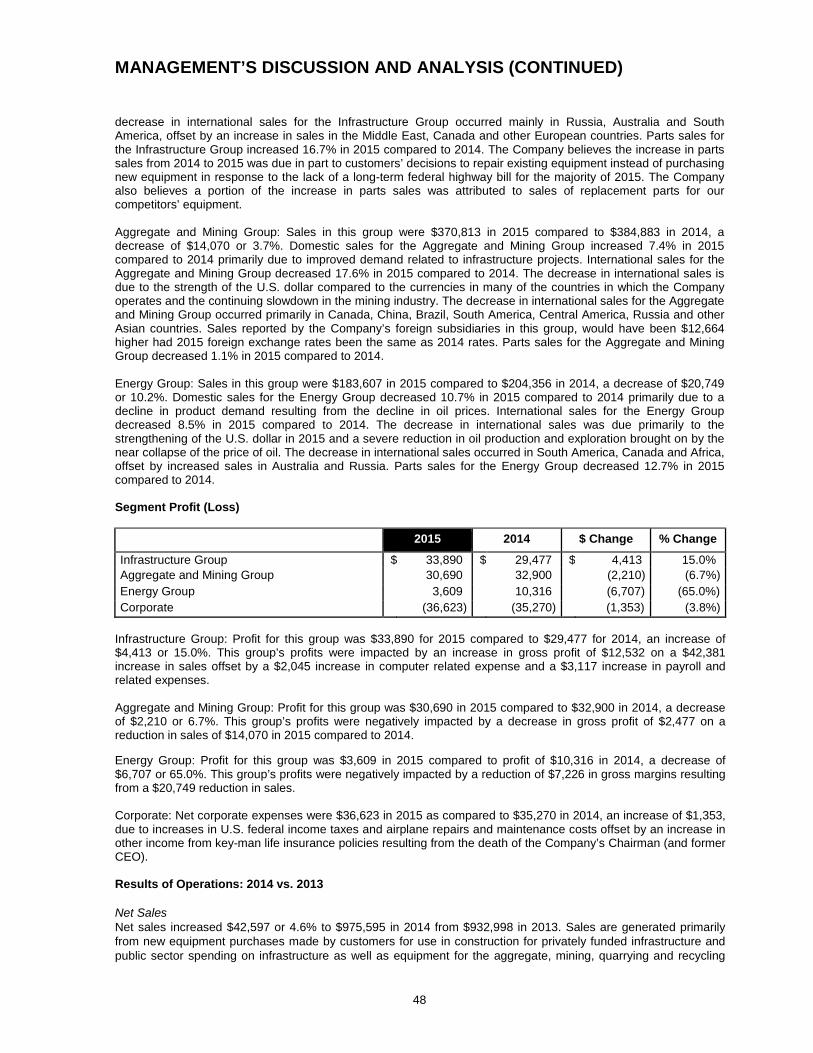
MANAGEMENT’S DISCUSSION AND ANALYSIS (CONTINUED)
48
decrease in international sales for the Infrastructure Group occurred mainly in Russia, Australia and South America, offset by an increase in sales in the Middle East, Canada and other European countries. Parts sales for the Infrastructure Group increased 16.7% in 2015 compared to 2014. The Company believes the increase in parts sales from 2014 to 2015 was due in part to customers’ decisions to repair existing equipment instead of purchasing new equipment in response to the lack of a long-term federal highway bill for the majority of 2015. The Company also believes a portion of the increase in parts sales was attributed to sales of replacement parts for our competitors’ equipment. Aggregate and Mining Group: Sales in this group were $370,813 in 2015 compared to $384,883 in 2014, a decrease of $14,070 or 3.7%. Domestic sales for the Aggregate and Mining Group increased 7.4% in 2015 compared to 2014 primarily due to improved demand related to infrastructure projects. International sales for the Aggregate and Mining Group decreased 17.6% in 2015 compared to 2014. The decrease in international sales is due to the strength of the U.S. dollar compared to the currencies in many of the countries in which the Company operates and the continuing slowdown in the mining industry. The decrease in international sales for the Aggregate and Mining Group occurred primarily in Canada, China, Brazil, South America, Central America, Russia and other Asian countries. Sales reported by the Company’s foreign subsidiaries in this group, would have been $12,664 higher had 2015 foreign exchange rates been the same as 2014 rates. Parts sales for the Aggregate and Mining Group decreased 1.1% in 2015 compared to 2014. Energy Group: Sales in this group were $183,607 in 2015 compared to $204,356 in 2014, a decrease of $20,749 or 10.2%. Domestic sales for the Energy Group decreased 10.7% in 2015 compared to 2014 primarily due to a decline in product demand resulting from the decline in oil prices. International sales for the Energy Group decreased 8.5% in 2015 compared to 2014. The decrease in international sales was due primarily to the strengthening of the U.S. dollar in 2015 and a severe reduction in oil production and exploration brought on by the near collapse of the price of oil. The decrease in international sales occurred in South America, Canada and Africa, offset by increased sales in Australia and Russia. Parts sales for the Energy Group decreased 12.7% in 2015 compared to 2014. Segment Profit (Loss) 2015 2014 $ Change % Change
Infrastructure Group $ 33,890 $ 29,477 $
4,413 15.0% Aggregate and Mining Group 30,690 32,900 (2,210) (6.7%) Energy Group 3,609 10,316 (6,707) (65.0%) Corporate (36,623) (35,270) (1,353) (3.8%)
Infrastructure Group: Profit for this group was $33,890 for 2015 compared to $29,477 for 2014, an increase of $4,413 or 15.0%. This group’s profits were impacted by an increase in gross profit of $12,532 on a $42,381 increase in sales offset by a $2,045 increase in computer related expense and a $3,117 increase in payroll and related expenses. Aggregate and Mining Group: Profit for this group was $30,690 in 2015 compared to $32,900 in 2014, a decrease of $2,210 or 6.7%. This group’s profits were negatively impacted by a decrease in gross profit of $2,477 on a reduction in sales of $14,070 in 2015 compared to 2014. Energy Group: Profit for this group was $3,609 in 2015 compared to profit of $10,316 in 2014, a decrease of $6,707 or 65.0%. This group’s profits were negatively impacted by a reduction of $7,226 in gross margins resulting from a $20,749 reduction in sales. Corporate: Net corporate expenses were $36,623 in 2015 as compared to $35,270 in 2014, an increase of $1,353, due to increases in U.S. federal income taxes and airplane repairs and maintenance costs offset by an increase in other income from key-man life insurance policies resulting from the death of the Company’s Chairman (and former CEO). Results of Operations: 2014 vs. 2013
Net Sales Net sales increased $42,597 or 4.6% to $975,595 in 2014 from $932,998 in 2013. Sales are generated primarily from new equipment purchases made by customers for use in construction for privately funded infrastructure and public sector spending on infrastructure as well as equipment for the aggregate, mining, quarrying and recycling
MANAGEMENT’S DISCUSSION AND ANALYSIS (CONTINUED)
49
markets and for the oil and gas and geothermal industries. 2014 sales include $23,781 sales of Telestack Limited, located in Northern Ireland, which was acquired in April 2014. Domestic sales for 2014 were $654,231 or 67.1% of net sales compared to $599,054 or 64.2% of net sales for 2013, an increase of $55,180 or 9.2%. The overall increase in domestic sales for 2014 compared to 2013 reflects the strengthening economic conditions for the Company’s products in the domestic market. International sales for 2014 were $321,364 or 32.9% of net sales compared to $333,944 or 35.8% of net sales for 2013, a decrease of $12,580 or 3.8%. International sales decreased due to the economic uncertainties and political unrest in several countries in which the Company markets its products as well as a strengthening U.S. dollar against many foreign currencies. The Company continues its efforts to grow its international business by increasing its presence in the markets it serves. Parts sales as a percentage of net sales decreased 40 basis points to 26.1% in 2014 from 26.5% in 2013. In U.S. dollars, parts sales increased 3.2% to $254,747 in 2014 from $246,905 in 2013. Gross Profit Gross profit as a percentage of sales remained relatively flat at 22.1% in 2014 vs. 22.2% in 2013. In U.S. dollars, gross profit increased 4.0% to $215,316 in 2014 from $207,119 in 2013.
Selling, General and Administrative Expense Selling, general and administrative expenses for 2014 were $141,490 or 14.5% of net sales compared to $133,337 or 14.3% of net sales for 2013, an increase of $8,153 or 6.1%. The increase in selling, general and administrative expense was due to an increase in expense related to the ConExpo Show of $3,451 and an increase in payroll and related expense of $3,974 from 2013. Research and Development Research and development expenses increased $4,029 or 22.3% to $22,129 in 2014 from $18,100 in 2013. During 2014, the Company increased research and development spending for new products as well as improvements to existing product lines and adaptation of those products to other markets. Interest Expense Interest expense in 2014 increased $297 or 70.2%, to $720 from $423 in 2013. The increase in interest expense in 2014 compared to 2013 was primarily related to utilization of credit facilities in Brazil to finance operations of a new manufacturing facility and purchase of related equipment. Interest Income Interest income increased $375 or 35.7% to $1,422 in 2014 from $1,047 in 2013. The increase was primarily due to interest received related to the Company’s financing of a customer’s purchase of the first wood pellet processing plant produced by the Company. Other Income (Expense), Net Other income (expense), net was $1,207 in 2014 compared to $1,937 in 2013, a decrease of $730 or 37.7% due to a decrease in investment income as a result of the Company using its short-term investments to fund the acquisition of Telestack Limited in April 2014. Income Tax Income tax expense for 2014 was $19,400, compared to $19,028 for 2013. The effective tax rates for 2014 and 2013 were 36.2% and 32.7%, respectively. The effective tax rate increase for 2014 over the effective rate in 2013 was due to an increase in state income tax as well as an increase in valuation allowances, other permanent differences and a decrease in research and development tax credits. Net Income Attributable To Controlling Interest The Company had net income attributable to controlling interest of $34,458 in 2014 compared to $39,042 in 2013, a decrease of $4,584, or 11.7%. Earnings per diluted share decreased $0.20 to $1.49 in 2014 from $1.69 in 2013. Weighted average diluted shares outstanding for the years ended December 31, 2014 and 2013 were 23,105 and 23,081, respectively. The increase in shares outstanding is primarily due to the granting of restricted stock units.
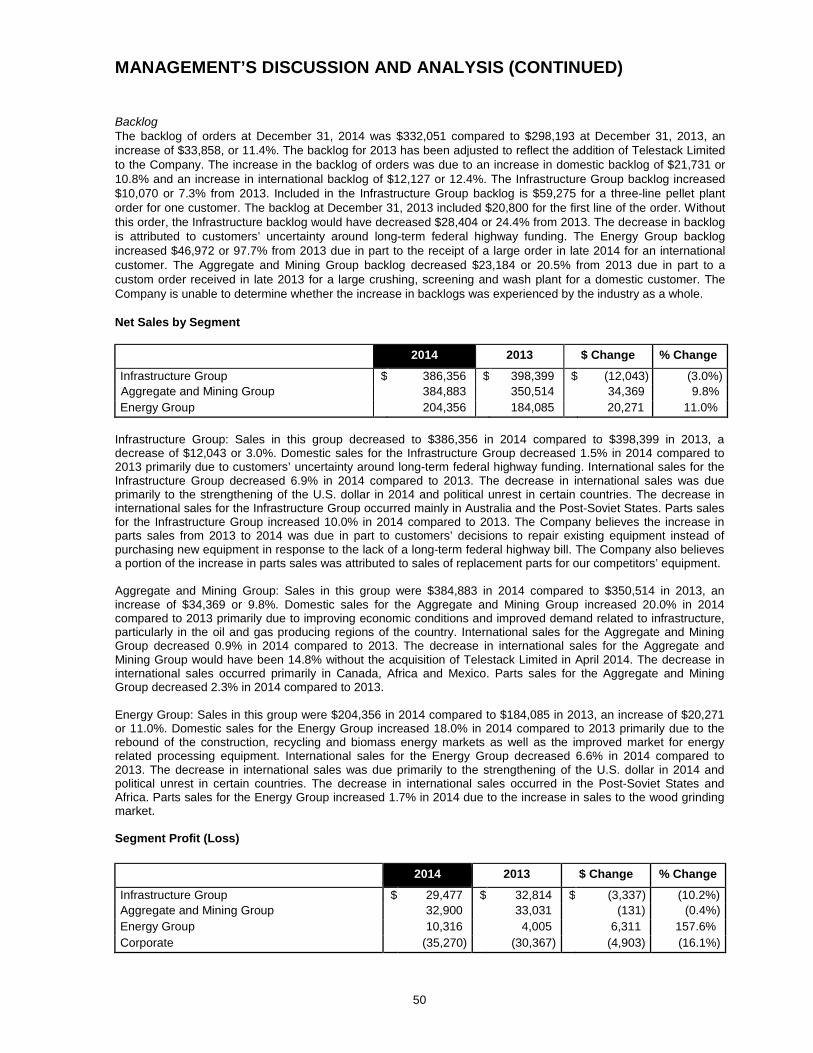
MANAGEMENT’S DISCUSSION AND ANALYSIS (CONTINUED)
50
Backlog The backlog of orders at December 31, 2014 was $332,051 compared to $298,193 at December 31, 2013, an increase of $33,858, or 11.4%. The backlog for 2013 has been adjusted to reflect the addition of Telestack Limited to the Company. The increase in the backlog of orders was due to an increase in domestic backlog of $21,731 or 10.8% and an increase in international backlog of $12,127 or 12.4%. The Infrastructure Group backlog increased $10,070 or 7.3% from 2013. Included in the Infrastructure Group backlog is $59,275 for a three-line pellet plant order for one customer. The backlog at December 31, 2013 included $20,800 for the first line of the order. Without this order, the Infrastructure backlog would have decreased $28,404 or 24.4% from 2013. The decrease in backlog is attributed to customers’ uncertainty around long-term federal highway funding. The Energy Group backlog increased $46,972 or 97.7% from 2013 due in part to the receipt of a large order in late 2014 for an international customer. The Aggregate and Mining Group backlog decreased $23,184 or 20.5% from 2013 due in part to a custom order received in late 2013 for a large crushing, screening and wash plant for a domestic customer. The Company is unable to determine whether the increase in backlogs was experienced by the industry as a whole. Net Sales by Segment 2014 2013 $ Change % Change
Infrastructure Group $ 386,356 $ 398,399 $ (12,043) (3.0%) Aggregate and Mining Group 384,883 350,514 34,369 9.8% Energy Group 204,356 184,085 20,271 11.0%
Infrastructure Group: Sales in this group decreased to $386,356 in 2014 compared to $398,399 in 2013, a decrease of $12,043 or 3.0%. Domestic sales for the Infrastructure Group decreased 1.5% in 2014 compared to 2013 primarily due to customers’ uncertainty around long-term federal highway funding. International sales for the Infrastructure Group decreased 6.9% in 2014 compared to 2013. The decrease in international sales was due primarily to the strengthening of the U.S. dollar in 2014 and political unrest in certain countries. The decrease in international sales for the Infrastructure Group occurred mainly in Australia and the Post-Soviet States. Parts sales for the Infrastructure Group increased 10.0% in 2014 compared to 2013. The Company believes the increase in parts sales from 2013 to 2014 was due in part to customers’ decisions to repair existing equipment instead of purchasing new equipment in response to the lack of a long-term federal highway bill. The Company also believes a portion of the increase in parts sales was attributed to sales of replacement parts for our competitors’ equipment. Aggregate and Mining Group: Sales in this group were $384,883 in 2014 compared to $350,514 in 2013, an increase of $34,369 or 9.8%. Domestic sales for the Aggregate and Mining Group increased 20.0% in 2014 compared to 2013 primarily due to improving economic conditions and improved demand related to infrastructure, particularly in the oil and gas producing regions of the country. International sales for the Aggregate and Mining Group decreased 0.9% in 2014 compared to 2013. The decrease in international sales for the Aggregate and Mining Group would have been 14.8% without the acquisition of Telestack Limited in April 2014. The decrease in international sales occurred primarily in Canada, Africa and Mexico. Parts sales for the Aggregate and Mining Group decreased 2.3% in 2014 compared to 2013. Energy Group: Sales in this group were $204,356 in 2014 compared to $184,085 in 2013, an increase of $20,271 or 11.0%. Domestic sales for the Energy Group increased 18.0% in 2014 compared to 2013 primarily due to the rebound of the construction, recycling and biomass energy markets as well as the improved market for energy related processing equipment. International sales for the Energy Group decreased 6.6% in 2014 compared to 2013. The decrease in international sales was due primarily to the strengthening of the U.S. dollar in 2014 and political unrest in certain countries. The decrease in international sales occurred in the Post-Soviet States and Africa. Parts sales for the Energy Group increased 1.7% in 2014 due to the increase in sales to the wood grinding market. Segment Profit (Loss) 2014 2013 $ Change % Change
Infrastructure Group $ 29,477 $ 32,814 $
(3,337) (10.2%) Aggregate and Mining Group 32,900 33,031 (131) (0.4%) Energy Group 10,316 4,005 6,311 157.6% Corporate (35,270) (30,367) (4,903) (16.1%)
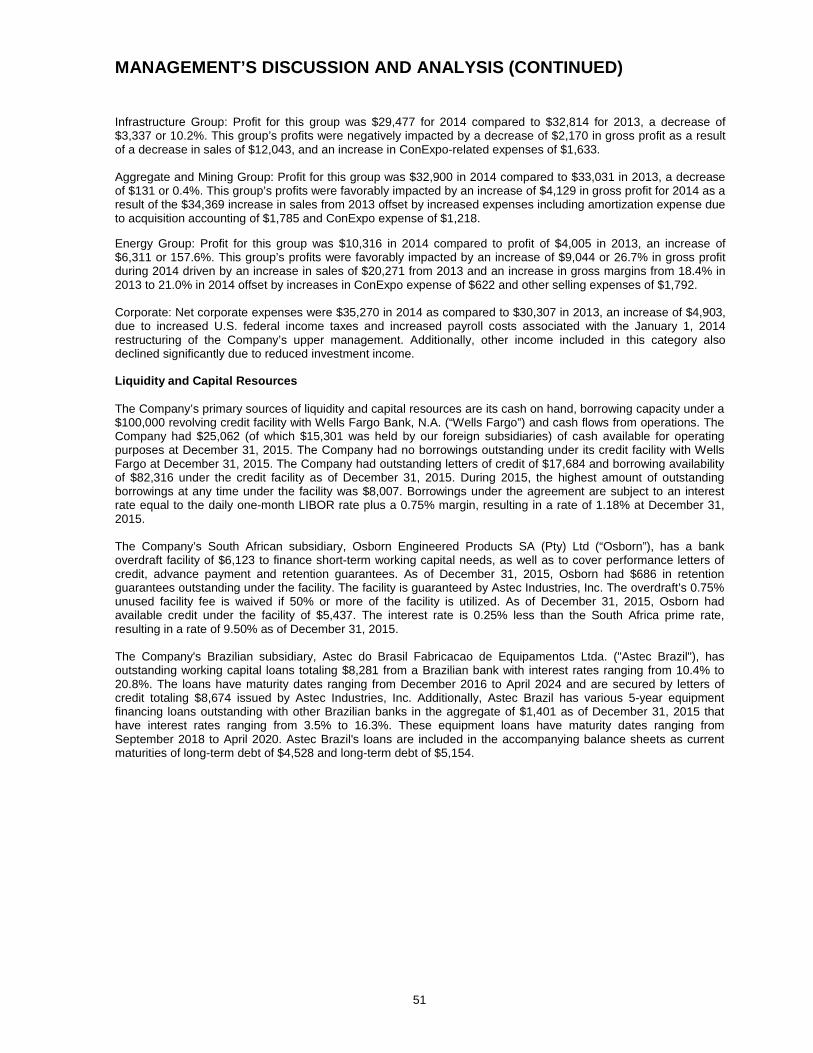
MANAGEMENT’S DISCUSSION AND ANALYSIS (CONTINUED)
51
Infrastructure Group: Profit for this group was $29,477 for 2014 compared to $32,814 for 2013, a decrease of $3,337 or 10.2%. This group’s profits were negatively impacted by a decrease of $2,170 in gross profit as a result of a decrease in sales of $12,043, and an increase in ConExpo-related expenses of $1,633. Aggregate and Mining Group: Profit for this group was $32,900 in 2014 compared to $33,031 in 2013, a decrease of $131 or 0.4%. This group’s profits were favorably impacted by an increase of $4,129 in gross profit for 2014 as a result of the $34,369 increase in sales from 2013 offset by increased expenses including amortization expense due to acquisition accounting of $1,785 and ConExpo expense of $1,218. Energy Group: Profit for this group was $10,316 in 2014 compared to profit of $4,005 in 2013, an increase of $6,311 or 157.6%. This group’s profits were favorably impacted by an increase of $9,044 or 26.7% in gross profit during 2014 driven by an increase in sales of $20,271 from 2013 and an increase in gross margins from 18.4% in 2013 to 21.0% in 2014 offset by increases in ConExpo expense of $622 and other selling expenses of $1,792. Corporate: Net corporate expenses were $35,270 in 2014 as compared to $30,307 in 2013, an increase of $4,903, due to increased U.S. federal income taxes and increased payroll costs associated with the January 1, 2014 restructuring of the Company’s upper management. Additionally, other income included in this category also declined significantly due to reduced investment income. Liquidity and Capital Resources
The Company’s primary sources of liquidity and capital resources are its cash on hand, borrowing capacity under a $100,000 revolving credit facility with Wells Fargo Bank, N.A. (“Wells Fargo”) and cash flows from operations. The Company had $25,062 (of which $15,301 was held by our foreign subsidiaries) of cash available for operating purposes at December 31, 2015. The Company had no borrowings outstanding under its credit facility with Wells Fargo at December 31, 2015. The Company had outstanding letters of credit of $17,684 and borrowing availability of $82,316 under the credit facility as of December 31, 2015. During 2015, the highest amount of outstanding borrowings at any time under the facility was $8,007. Borrowings under the agreement are subject to an interest rate equal to the daily one-month LIBOR rate plus a 0.75% margin, resulting in a rate of 1.18% at December 31, 2015. The Company’s South African subsidiary, Osborn Engineered Products SA (Pty) Ltd (“Osborn”), has a bank overdraft facility of $6,123 to finance short-term working capital needs, as well as to cover performance letters of credit, advance payment and retention guarantees. As of December 31, 2015, Osborn had $686 in retention guarantees outstanding under the facility. The facility is guaranteed by Astec Industries, Inc. The overdraft’s 0.75% unused facility fee is waived if 50% or more of the facility is utilized. As of December 31, 2015, Osborn had available credit under the facility of $5,437. The interest rate is 0.25% less than the South Africa prime rate, resulting in a rate of 9.50% as of December 31, 2015. The Company's Brazilian subsidiary, Astec do Brasil Fabricacao de Equipamentos Ltda. ("Astec Brazil"), has outstanding working capital loans totaling $8,281 from a Brazilian bank with interest rates ranging from 10.4% to 20.8%. The loans have maturity dates ranging from December 2016 to April 2024 and are secured by letters of credit totaling $8,674 issued by Astec Industries, Inc. Additionally, Astec Brazil has various 5-year equipment financing loans outstanding with other Brazilian banks in the aggregate of $1,401 as of December 31, 2015 that have interest rates ranging from 3.5% to 16.3%. These equipment loans have maturity dates ranging from September 2018 to April 2020. Astec Brazil's loans are included in the accompanying balance sheets as current maturities of long-term debt of $4,528 and long-term debt of $5,154.
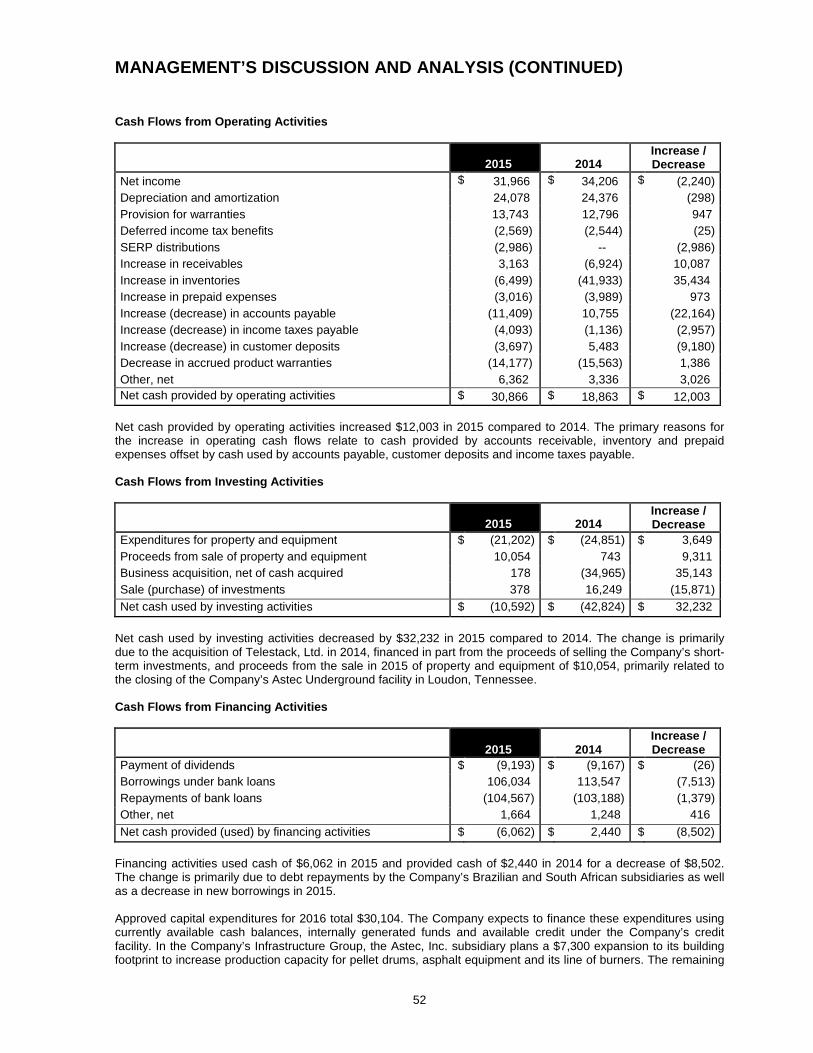
MANAGEMENT’S DISCUSSION AND ANALYSIS (CONTINUED)
52
Cash Flows from Operating Activities
2015
2014
Increase / Decrease
Net income $ 31,966 $ 34,206 $ (2,240) Depreciation and amortization 24,078 24,376 (298) Provision for warranties 13,743 12,796 947 Deferred income tax benefits (2,569) (2,544) (25) SERP distributions (2,986) -- (2,986) Increase in receivables 3,163 (6,924) 10,087 Increase in inventories (6,499) (41,933) 35,434 Increase in prepaid expenses (3,016) (3,989) 973 Increase (decrease) in accounts payable (11,409) 10,755 (22,164) Increase (decrease) in income taxes payable (4,093) (1,136) (2,957) Increase (decrease) in customer deposits (3,697) 5,483 (9,180) Decrease in accrued product warranties (14,177) (15,563) 1,386 Other, net 6,362 3,336 3,026 Net cash provided by operating activities $ 30,866 $ 18,863 $ 12,003
Net cash provided by operating activities increased $12,003 in 2015 compared to 2014. The primary reasons for the increase in operating cash flows relate to cash provided by accounts receivable, inventory and prepaid expenses offset by cash used by accounts payable, customer deposits and income taxes payable. Cash Flows from Investing Activities
2015
2014
Increase / Decrease
Expenditures for property and equipment $ (21,202) $ (24,851) $ 3,649 Proceeds from sale of property and equipment 10,054 743 9,311 Business acquisition, net of cash acquired 178 (34,965) 35,143 Sale (purchase) of investments 378 16,249 (15,871) Net cash used by investing activities $ (10,592) $ (42,824) $ 32,232
Net cash used by investing activities decreased by $32,232 in 2015 compared to 2014. The change is primarily due to the acquisition of Telestack, Ltd. in 2014, financed in part from the proceeds of selling the Company’s short-term investments, and proceeds from the sale in 2015 of property and equipment of $10,054, primarily related to the closing of the Company’s Astec Underground facility in Loudon, Tennessee.
Cash Flows from Financing Activities
2015
2014
Increase / Decrease
Payment of dividends $ (9,193) $ (9,167) $ (26) Borrowings under bank loans 106,034 113,547 (7,513) Repayments of bank loans (104,567) (103,188) (1,379) Other, net 1,664 1,248 416 Net cash provided (used) by financing activities $ (6,062) $ 2,440 $ (8,502)
Financing activities used cash of $6,062 in 2015 and provided cash of $2,440 in 2014 for a decrease of $8,502. The change is primarily due to debt repayments by the Company’s Brazilian and South African subsidiaries as well as a decrease in new borrowings in 2015. Approved capital expenditures for 2016 total $30,104. The Company expects to finance these expenditures using currently available cash balances, internally generated funds and available credit under the Company’s credit facility. In the Company’s Infrastructure Group, the Astec, Inc. subsidiary plans a $7,300 expansion to its building footprint to increase production capacity for pellet drums, asphalt equipment and its line of burners. The remaining
MANAGEMENT’S DISCUSSION AND ANALYSIS (CONTINUED)
53
budgeted capital expenditures are for various purchases of machinery and equipment, automobiles, and technology-related spending to meet the needs across all Company subsidiaries. Financial Condition The Company’s current assets decreased to $541,797 at December 31, 2015 from $549,991 at December 31, 2014, a decrease of $8,194. The reduction is due to decreases in accounts receivable of $6,878, inventory of $3,059 and short-term deferred income tax assets of $14,817, offset by an increase in cash of $12,039. The decrease in accounts receivable is due in part to the decline in sales in the Energy Group and the Aggregate and Mining Group as compared to 2014 levels. Days outstanding in accounts receivable for both groups were relatively flat from 2014 to 2015. Both the Energy and Aggregate and Mining groups experienced a challenging market internationally in 2015 compared to 2014 due to the strengthening of the U.S. dollar against foreign currencies. The Aggregate and Mining Group was also negatively impacted by the decline in the global mining industry. The domestic market was also slow for the products produced by the Energy Group in 2015 due to the decline in oil prices. Short-term deferred income tax assets decreased from 2014 to 2015 due to a change in presentation from 2014 to 2015 related to the Company’s adoption of the Financial Accounting Standards Board (“FASB”) Accounting Standards Update (“ASU”) 2015-17 “Balance Sheet Classification of Deferred Taxes”. The standard requires all companies to classify deferred tax assets and liabilities as noncurrent on the balance sheet instead of separating deferred taxes into current and noncurrent amounts as in prior years. The Company adopted the standard prospectively for the period ended December 31, 2015 as allowed by the standard. Current deferred tax assets were $14,817 at December 31, 2014. The Company’s current liabilities decreased to $142,012 at December 31, 2015 from $161,129 at December 31, 2014, a decrease of $19,117. The decrease is primarily attributable to decreases in accounts payable of $12,602 and customer deposits of $5,004. The decrease in accounts payable is across all Groups. Market Risk and Risk Management Policies The Company is exposed to changes in interest rates, primarily from its revolving credit agreements. A hypothetical 100 basis point adverse move (increase) in interest rates would not have materially affected interest expense for the years ended December 31, 2015 and 2014, due to minimal borrowings during the periods. The Company does not hedge variable interest. The Company is subject to foreign exchange risk at its foreign operations. Foreign operations represent 17.1% and 19.3% of total assets at December 31, 2015 and 2014, respectively, and 10.4% and 12.4% of total revenue for the years ended December 31, 2015 and 2014, respectively. Each period the balance sheets and related results of operations of the Company’s foreign subsidiaries are translated from their functional foreign currency into U.S. dollars for reporting purposes. As the U.S. dollar strengthens against those foreign currencies, the foreign denominated net assets and operating results become less valuable in the Company’s reporting currency. When the U.S. dollar weakens against those currencies, the foreign denominated net assets and operating results become more valuable in the Company’s reporting currency. At each reporting date, the fluctuation in the value of the net assets and operating results due to foreign exchange rate changes is recorded as an adjustment to other comprehensive income in equity. The Company views its investments in foreign subsidiaries as long-term and does not hedge the net investments in foreign subsidiaries. From time to time the Company’s foreign subsidiaries enter into transactions not denominated in their functional currency. In these situations, the Company evaluates the need to hedge those transactions against foreign currency rate fluctuations. When the Company determines a need to hedge a transaction, the subsidiary enters into a foreign currency exchange contract. The Company does not apply hedge accounting to these contracts and, therefore, recognizes the fair value of these contracts in the consolidated balance sheets and the change in the fair value of the contracts in current earnings. Due to the limited exposure to foreign exchange rate risk, a 10% fluctuation in the foreign exchange rates at December 31, 2015 or 2014 would not have a material impact on the Company’s consolidated financial statements.
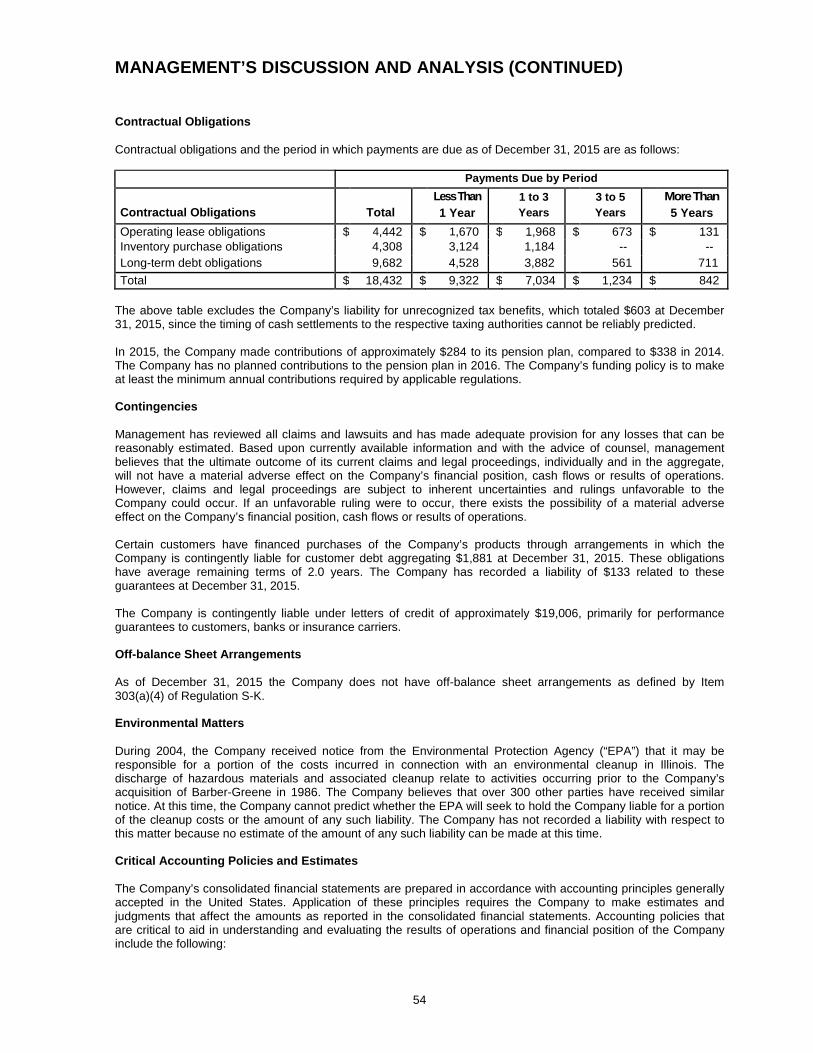
MANAGEMENT’S DISCUSSION AND ANALYSIS (CONTINUED)
54
Contractual Obligations Contractual obligations and the period in which payments are due as of December 31, 2015 are as follows: Payments Due by Period Contractual Obligations
Total
Less Than 1 Year
1 to 3 Years
3 to 5 Years
More Than 5 Years
Operating lease obligations $ 4,442 $ 1,670 $ 1,968 $ 673 $ 131 Inventory purchase obligations 4,308 3,124 1,184 -- -- Long-term debt obligations 9,682 4,528 3,882 561 711 Total $ 18,432 $ 9,322 $ 7,034 $ 1,234 $ 842
The above table excludes the Company’s liability for unrecognized tax benefits, which totaled $603 at December 31, 2015, since the timing of cash settlements to the respective taxing authorities cannot be reliably predicted. In 2015, the Company made contributions of approximately $284 to its pension plan, compared to $338 in 2014. The Company has no planned contributions to the pension plan in 2016. The Company’s funding policy is to make at least the minimum annual contributions required by applicable regulations. Contingencies Management has reviewed all claims and lawsuits and has made adequate provision for any losses that can be reasonably estimated. Based upon currently available information and with the advice of counsel, management believes that the ultimate outcome of its current claims and legal proceedings, individually and in the aggregate, will not have a material adverse effect on the Company’s financial position, cash flows or results of operations. However, claims and legal proceedings are subject to inherent uncertainties and rulings unfavorable to the Company could occur. If an unfavorable ruling were to occur, there exists the possibility of a material adverse effect on the Company’s financial position, cash flows or results of operations. Certain customers have financed purchases of the Company’s products through arrangements in which the Company is contingently liable for customer debt aggregating $1,881 at December 31, 2015. These obligations have average remaining terms of 2.0 years. The Company has recorded a liability of $133 related to these guarantees at December 31, 2015. The Company is contingently liable under letters of credit of approximately $19,006, primarily for performance guarantees to customers, banks or insurance carriers. Off-balance Sheet Arrangements
As of December 31, 2015 the Company does not have off-balance sheet arrangements as defined by Item 303(a)(4) of Regulation S-K. Environmental Matters During 2004, the Company received notice from the Environmental Protection Agency (“EPA”) that it may be responsible for a portion of the costs incurred in connection with an environmental cleanup in Illinois. The discharge of hazardous materials and associated cleanup relate to activities occurring prior to the Company’s acquisition of Barber-Greene in 1986. The Company believes that over 300 other parties have received similar notice. At this time, the Company cannot predict whether the EPA will seek to hold the Company liable for a portion of the cleanup costs or the amount of any such liability. The Company has not recorded a liability with respect to this matter because no estimate of the amount of any such liability can be made at this time. Critical Accounting Policies and Estimates The Company’s consolidated financial statements are prepared in accordance with accounting principles generally accepted in the United States. Application of these principles requires the Company to make estimates and judgments that affect the amounts as reported in the consolidated financial statements. Accounting policies that are critical to aid in understanding and evaluating the results of operations and financial position of the Company include the following:
MANAGEMENT’S DISCUSSION AND ANALYSIS (CONTINUED)
55
Inventory Valuation: Inventories are valued at the lower of first-in first-out cost or market. The most significant component of the Company’s inventories is steel. Open market prices, which are subject to volatility, determine the cost of steel for the Company. During periods when open market prices decline, the Company may need to reduce the carrying value of the inventory. In addition, certain items in inventory become obsolete over time, and the Company reduces the carrying value of these items to their net realizable value. These reductions are determined by the Company based on estimates, assumptions and judgments made from the information available at that time. See Note 1, Summary of Significant Accounting Policies, for a description of the process used by the Company to value inventories at the lower of first-in first-out cost or market. The Company does not believe it is reasonably likely that the inventory values will materially change in the near future. Product Warranty Reserve: The Company accrues for the estimated cost of product warranties at the time revenue is recognized. Warranty obligations by product line or model are evaluated based on historical warranty claims experience. For machines, the Company’s standard product warranty terms generally include post-sales support and repairs of products at no additional charge for periods ranging from three months to two years or up to a specified number of hours of operation. For parts from component suppliers, the Company relies on the original manufacturer’s warranty that accompanies those parts. Generally, fabricated parts are not covered by specific warranty terms. Although failure of fabricated parts due to material or workmanship is rare, if it occurs, the Company’s policy is to replace fabricated parts at no additional charge. The Company engages in extensive product quality programs and processes, including actively monitoring and evaluating the quality of component suppliers. Estimated warranty obligations are based upon warranty terms, product failure rates, repair costs and current period machine shipments. If actual product failure rates, repair costs, service delivery costs or post-sales support costs differ from estimates, revisions to the estimated warranty liability would be required. The Company does not believe it is reasonably likely that the warranty reserve will materially change in the near future. Revenue Recognition: Revenue is generally recognized on sales at the point in time when persuasive evidence of an arrangement exists, the price is fixed or determinable, the product has been delivered or services have been rendered and there is reasonable assurance of collection of the sales proceeds. The Company generally obtains purchase authorizations from its customers for a specified amount of product at a specified price with specified delivery terms. A significant portion of the Company’s equipment sales represents equipment produced in the Company’s plants under short-term contracts for a specific customer project or equipment designed to meet a customer’s specific requirements. Most of the equipment sold by the Company is based on standard configurations, some of which are modified to meet customer needs or specifications. The Company provides customers with technical design and performance specifications and performs pre-shipment testing to ensure the equipment performs according to design specifications, regardless of whether the Company provides installation services in addition to selling the equipment.
Certain contracts include terms and conditions through which the Company recognizes revenues upon completion of equipment production, which is subsequently stored at the Company’s plant at the customer’s request. Revenue is recorded on such contracts upon the customer’s assumption of title and risk of ownership and when collectability is reasonably assured. In addition, there must be a fixed schedule of delivery of the goods consistent with the customer’s business practices, the Company must not have retained any specific performance obligations such that the earnings process is not complete and the goods must have been segregated from the Company’s inventory prior to revenue recognition. The Company has certain sales accounted for as multiple-element arrangements, whereby revenue attributable to the sale of a product is recognized when the product is shipped, and the revenue attributable to services provided with respect to the product (such as installation services) is recognized when the service is performed. Consideration is allocated to deliverables using the relative selling price method using vendor specific objective evidence, if it exists. Otherwise, the Company uses third-party evidence of selling price or the Company’s best estimate of the selling price for the deliverables. The Company evaluates sales with multiple deliverable elements (such as an agreement to deliver equipment and related installation services) to determine whether revenue related to individual elements should be recognized separately, or as a combined unit. In addition to the previously mentioned general revenue recognition criteria, the Company only recognizes revenue on individual delivered elements when there is objective and reliable evidence that the delivered element has a determinable value to the customer on a standalone basis and there is no right of return. Goodwill and Other Intangible Assets: Intangible assets are classified into two categories: (1) intangible assets with definite lives subject to amortization, and (2) goodwill. Intangible assets with definite lives are tested for impairment if conditions exist that indicate the carrying value may not be recoverable. Risk factors that may be considered include an economic downturn in the general economy, a geographic market or the commercial and residential
MANAGEMENT’S DISCUSSION AND ANALYSIS (CONTINUED)
56
construction industries, a change in the assessment of future operations as well as the cyclical nature of our industry and the customization of the equipment we sell, each of which may cause adverse fluctuations in operating results. Other risk factors considered would be an increase in the price or a decrease in the availability of oil that could reduce the demand for our products in addition to the significant fluctuations in the purchase price of raw materials that could have a negative impact on the cost of production and gross margins as well as others more fully described in the Risk Factors section of our Form 10-K. An impairment charge is recorded when the carrying value of the definite lived intangible asset is not recoverable by the cash flows generated from the use of the asset. Some of the inputs used in the impairment testing are highly subjective and are affected by changes in business factors and other conditions. Changes in any of the inputs could have an effect on future tests and result in impairment charges.
Goodwill is not amortized but is tested for impairment annually or more frequently if events or circumstances indicate that such intangible assets or goodwill might be impaired. See Note 1, Summary of Significant Accounting Policies, for a description of testing performed by the Company to determine if the recorded value of intangible assets or goodwill has been impaired. The useful lives of identifiable intangible assets are determined after considering the specific facts and circumstances related to each intangible asset. Factors considered when determining useful lives include the contractual term of any agreement, the history of the asset, the Company’s long-term strategy for the use of the asset, any laws or other local regulations which could impact the useful life of the asset, and other economic factors, including competition and specific market conditions. Intangible assets that are deemed to have definite lives are amortized, generally on a straight-line basis, over their useful lives, ranging from 3 to 15 years. Income Taxes: The Company accounts for income taxes under the guidance of FASB Accounting Standards Codification Topic 740-10, “Income Taxes”. Deferred tax assets and liabilities are recognized for the future tax consequences attributable to differences between financial statement carrying amounts of existing assets and liabilities and their respective tax bases and operating loss and tax credit carryforwards. Deferred tax assets and liabilities are measured using enacted tax rates expected to apply to taxable income in the years in which those temporary differences are expected to be recovered or settled. A valuation allowance that represents a reserve on deferred tax assets for which utilization is not more likely than not is recorded. Judgment is required in determining the provision for income taxes, deferred tax assets and liabilities, and the valuation allowance recorded against net deferred tax assets. Income tax contingency accruals are determined and recorded under the guidance of ASC Topic 740-10. Liabilities for uncertain income tax positions are based on a two-step process. The first step is to evaluate the tax position for recognition by determining if the weight of available evidence indicates that it is more likely than not that the position will be sustained on audit, including resolution of related appeals or litigation processes, if any. The second step requires an estimate and measurement of the tax benefit as the largest amount that is more than 50% likely to be realized upon ultimate settlement. It is inherently difficult and subjective to estimate such amounts, as the Company must determine the probability of various possible outcomes. We reevaluate these uncertain tax positions on a quarterly basis or when new information becomes available. These reevaluations are based on factors including, but not limited to, changes in facts or circumstances, changes in tax law, successfully settled issues under audit, expirations due to statutes, and new audit activity. Such a change in recognition or measurement could result in the recognition of a tax benefit or an increase to accrued taxes. Recent Accounting Pronouncements
In May 2014, the FASB issued ASU No. 2014-09, "Revenue from Contracts with Customers", which supersedes existing revenue guidance under U.S. GAAP. The standard's core principle is that a company will recognize revenue when it transfers promised goods or services to customers in an amount that reflects the consideration to which the company expects to be entitled in exchange for those goods or services. The implementation of this new standard will require companies to use more judgment and to make more estimates than under current guidance. The standard, as amended, is effective for public companies for annual periods beginning after December 15, 2017. The Company plans to adopt the new standard effective January 1, 2018. The Company has not yet determined what impact, if any, the adoption of this new standard will have on the Company's financial position or results of operations. In July 2015, the FASB issued ASU No. 2015-11, "Inventory (Topic 330): Simplifying the Measurement of Inventory", which changes the measurement basis for inventory from the lower of cost or market to lower of cost and net realizable value and also eliminates the requirement for companies to consider replacement cost or net realizable value less an approximate normal profit margin when determining the recorded value of inventory. The standard is effective for public companies in fiscal years beginning after December 15, 2016, and the Company expects to adopt the standard effective January 1, 2017. The Company has not yet determined what impact, if any, the adoption of this new standard will have on the Company's financial position or results of operations.
MANAGEMENT’S DISCUSSION AND ANALYSIS (CONTINUED)
57
In November 2015, the FASB issued ASU No. 2015-17, “Balance Sheet Classification of Deferred Taxes”, which requires all companies to classify deferred tax assets and liabilities as noncurrent on the balance sheet instead of separating deferred taxes into current and noncurrent amounts. Also, companies will no longer allocate valuation allowances between current and noncurrent deferred tax assets because those allowances also will be classified as noncurrent. The standard is effective for public entities for annual periods beginning on or after December 15, 2016. Early adoption is permitted for annual financial statements that have not yet been issued. The Company’s prospective adoption of this standard for the year ended December 31, 2015 did not have a significant impact on the Company’s financial position or results of operations. Forward-Looking Statements
This annual report contains forward-looking statements made pursuant to the safe harbor provisions of the Private Securities Litigation Reform Act of 1995. Statements contained anywhere in this Annual Report that are not limited to historical information are considered forward-looking statements within the meaning of Section 21E of the Securities Exchange Act of 1934, including, without limitation, statements regarding:
• execution of the Company’s growth and operation strategy; • plans for technological innovation; • compliance with covenants in our credit facility; • liquidity and capital expenditures; • sufficiency of working capital, cash flows and available capacity under the Company’s credit facilities; • compliance with government regulations; • compliance with manufacturing and delivery timetables; • forecasting of results; • general economic trends and political uncertainty; • government funding and growth of highway construction and commercial projects; • taxes or usage fees; • interest rates; • integration of acquisitions; • industry trends; • pricing, demand and availability of steel, oil and liquid asphalt; • development of domestic oil and natural gas production; • condition of the economy; • strength of the U.S. dollar relative to foreign currencies; • the success of new product lines; • presence in the international marketplace; • suitability of our current facilities; • future payment of dividends; • competition in our business segments; • product liability and other claims; • protection of proprietary technology; • demand for products; • future fillings of backlogs; • employees; • the seasonality of our business; • tax assets and reserves for uncertain tax positions; • critical accounting policies and the impact of accounting changes; • anticipated future operations in our Brazilian operations; • our backlog; • ability to satisfy contingencies; • contributions to retirement plans and plan expenses; • reserve levels for self-insured insurance plans and product warranties; • construction of new manufacturing facilities; • supply of raw materials; and • inventory
MANAGEMENT’S DISCUSSION AND ANALYSIS (CONTINUED)
58
These forward-looking statements are based largely on management’s expectations, which are subject to a number of known and unknown risks, uncertainties and other factors discussed in this report and in other documents filed by the Company with the Securities and Exchange Commission, which may cause actual results, financial or otherwise, to be materially different from those anticipated, expressed or implied by the forward-looking statements. All forward-looking statements included in this document are based on information available to the Company on the date hereof, and the Company assumes no obligation to update any such forward-looking statements to reflect future events or circumstances. You can identify these statements by forward-looking words such as “expect”, “believe”, “anticipate”, “goal”, “plan”, “intend”, “estimate”, “may”, “will”, “should” and similar expressions. In addition to the risks and uncertainties identified elsewhere herein and in other documents filed by us with the Securities and Exchange Commission, the risk factors described in this document under the caption "Risk Factors" should be carefully considered when evaluating our business and future prospects, including without limitation risks relating to: changes or delays in highway funding; rising interest rates; changes in oil prices; changes in steel prices; changes in the general economy; unexpected capital expenditures and decreases in liquidity; the timing of large contracts; production capacity; general business conditions in the industry; non-compliance with covenants in the Company’s credit facilities; demand for the Company’s products; and those other factors listed from time to time in the Company’s reports filed with the Securities and Exchange Commission. Certain of the risks, uncertainties and other factors discussed above are more fully described in the section entitled “Risk Factors” in the Company’s Annual Report on Form 10-K for the year ended December 31, 2015.
ASTEC INDUSTRIES, INC. MANAGEMENT’S REPORT ON INTERNAL CONTROL OVER FINANCIAL REPORTING
59
The management of Astec Industries, Inc. (the “Company”) is responsible for establishing and maintaining adequate internal control over financial reporting for the Company. The Company’s internal control over financial reporting is a process designed to provide reasonable assurance regarding the reliability of financial reporting and the preparation of financial statements for external purposes in accordance with U.S. generally accepted accounting principles. The Company’s internal control over financial reporting includes those policies and procedures that (i) pertain to the maintenance of records that, in reasonable detail, accurately and fairly reflect the transactions and dispositions of assets of the Company; (ii) provide reasonable assurance that transactions are recorded as necessary to permit preparation of financial statements in accordance with generally accepted accounting principles, and that receipts and expenditures of the Company are being made only in accordance with authorizations of management and directors of the Company; and (iii) provide reasonable assurance regarding prevention or timely detection of unauthorized acquisition, use, or disposition of the Company’s assets that could have a material effect on the financial statements. Because of its inherent limitations, internal control over financial reporting may not prevent or detect misstatements. Also, projections of any evaluation of effectiveness to future periods are subject to the risk that controls may become inadequate because of changes in conditions, or that the degree of compliance with the policies and procedures may deteriorate. Management, under the supervision and with the participation of the Company’s principal executive officer and principal financial officer, has evaluated the effectiveness of the Company’s internal control over financial reporting as of December 31, 2015. In making this assessment, management used the criteria set forth by the Committee of Sponsoring Organizations of the Treadway Commission (COSO), Internal Control - Integrated Framework (2013). Based on its assessment, management concluded that, as of December 31, 2015, the Company’s internal control over financial reporting was effective. KPMG LLP, the Company’s independent registered public accounting firm, has issued an attestation report on the Company’s internal control over financial reporting as of December 31, 2015.
REPORT OF INDEPENDENT REGISTERED PUBLIC ACCOUNTING FIRM
60
The Board of Directors and Shareholders Astec Industries, Inc.: We have audited Astec Industries, Inc.’s internal control over financial reporting as of December 31, 2015, based on criteria established in Internal Control - Integrated Framework (2013) issued by the Committee of Sponsoring Organizations of the Treadway Commission (COSO). Astec Industries, Inc.’s management is responsible for maintaining effective internal control over financial reporting and for its assessment of the effectiveness of internal control over financial reporting, included in the accompanying Management’s Report on Internal Control over Financial Reporting. Our responsibility is to express an opinion on the Company’s internal control over financial reporting based on our audit. We conducted our audit in accordance with the standards of the Public Company Accounting Oversight Board (United States). Those standards require that we plan and perform the audit to obtain reasonable assurance about whether effective internal control over financial reporting was maintained in all material respects. Our audit included obtaining an understanding of internal control over financial reporting, assessing the risk that a material weakness exists, testing and evaluating the design and operating effectiveness of internal control based on the assessed risk. Our audit also included performing such other procedures as we considered necessary in the circumstances. We believe that our audit provides a reasonable basis for our opinion. A company’s internal control over financial reporting is a process designed to provide reasonable assurance regarding the reliability of financial reporting and the preparation of financial statements for external purposes in accordance with generally accepted accounting principles. A company’s internal control over financial reporting includes those policies and procedures that (1) pertain to the maintenance of records that, in reasonable detail, accurately and fairly reflect the transactions and dispositions of the assets of the company; (2) provide reasonable assurance that transactions are recorded as necessary to permit preparation of financial statements in accordance with generally accepted accounting principles, and that receipts and expenditures of the company are being made only in accordance with authorizations of management and directors of the company; and (3) provide reasonable assurance regarding prevention or timely detection of unauthorized acquisition, use, or disposition of the company’s assets that could have a material effect on the financial statements. Because of its inherent limitations, internal control over financial reporting may not prevent or detect misstatements. Also, projections of any evaluation of effectiveness to future periods are subject to the risk that controls may become inadequate because of changes in conditions, or that the degree of compliance with the policies or procedures may deteriorate. In our opinion, Astec Industries, Inc. maintained, in all material respects, effective internal control over financial reporting as of December 31, 2015, based on criteria established in Internal Control - Integrated Framework (2013) issued by COSO. We also have audited, in accordance with the standards of the Public Company Accounting Oversight Board (United States), the consolidated balance sheet of Astec Industries, Inc. and subsidiaries as of December 31, 2015, and the related consolidated statements of income, comprehensive income, equity and cash flows for the year ended December 31, 2015, and our report dated February 29, 2016 expressed an unqualified opinion on those consolidated financial statements.
Knoxville, Tennessee February 29, 2016
REPORT OF INDEPENDENT REGISTERED PUBLIC ACCOUNTING FIRM
61
The Board of Directors and Shareholders of Astec Industries, Inc. We have audited the accompanying consolidated balance sheets of Astec Industries, Inc. as of December 31, 2014, and the related consolidated statements of income, comprehensive income, equity and cash flows for each of the two years in the period ended December 31, 2014. These financial statements are the responsibility of the Company's management. Our responsibility is to express an opinion on these financial statements based on our audits. We conducted our audits in accordance with the standards of the Public Company Accounting Oversight Board (United States). Those standards require that we plan and perform the audit to obtain reasonable assurance about whether the financial statements are free of material misstatement. An audit includes examining, on a test basis, evidence supporting the amounts and disclosures in the financial statements. An audit also includes assessing the accounting principles used and significant estimates made by management, as well as evaluating the overall financial statement presentation. We believe that our audits provide a reasonable basis for our opinion. In our opinion, the financial statements referred to above present fairly, in all material respects, the consolidated financial position of Astec Industries, Inc. at December 31, 2014, and the consolidated results of its operations and its cash flows for each of the two years in the period ended December 31, 2014, in conformity with U.S. generally accepted accounting principles.
Chattanooga, Tennessee March 2, 2015, except for paragraph 58 in Note 1, as to which the date is February 29, 2016
REPORT OF INDEPENDENT REGISTERED PUBLIC ACCOUNTING FIRM
62
The Board of Directors and Shareholders Astec Industries, Inc.: We have audited the accompanying consolidated balance sheet of Astec Industries, Inc. and subsidiaries as of December 31, 2015, and the related consolidated statements of income, comprehensive income, equity and cash flows for the year ended December 31, 2015. These consolidated financial statements are the responsibility of the Company's management. Our responsibility is to express an opinion on these consolidated financial statements based on our audit. We conducted our audit in accordance with the standards of the Public Company Accounting Oversight Board (United States). Those standards require that we plan and perform the audit to obtain reasonable assurance about whether the financial statements are free of material misstatement. An audit includes examining, on a test basis, evidence supporting the amounts and disclosures in the financial statements. An audit also includes assessing the accounting principles used and significant estimates made by management, as well as evaluating the overall financial statement presentation. We believe that our audit provides a reasonable basis for our opinion. In our opinion, the consolidated financial statements referred to above present fairly, in all material respects, the financial position of Astec Industries, Inc. and subsidiaries as of December 31, 2015, and the results of their operations and their cash flows for the year ended December 31, 2015, in conformity with U.S. generally accepted accounting principles. We also have audited, in accordance with the standards of the Public Company Accounting Oversight Board (United States), Astec Industries, Inc.’s internal control over financial reporting as of December 31, 2015, based on criteria established in Internal Control - Integrated Framework (2013) issued by the Committee of Sponsoring Organizations of the Treadway Commission (COSO), and our report dated February 29, 2016 expressed an unqualified opinion on the effectiveness of the Company’s internal control over financial reporting.
Knoxville, Tennessee February 29, 2016
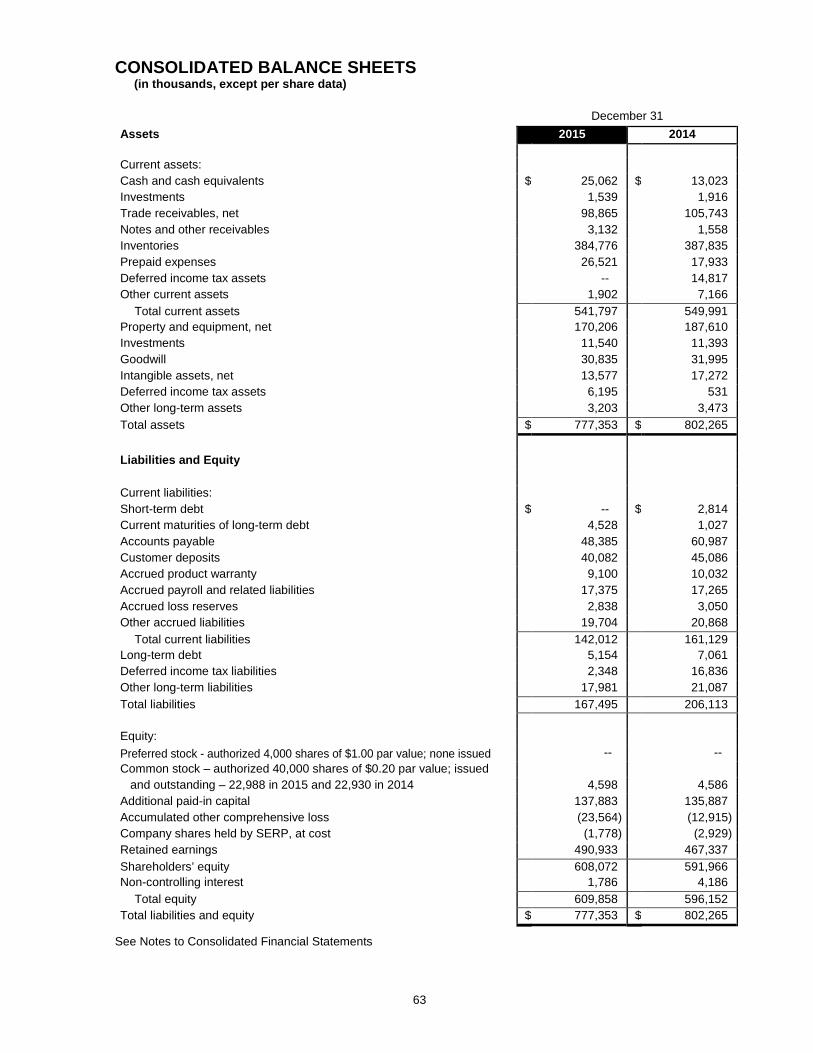
CONSOLIDATED BALANCE SHEETS (in thousands, except per share data)
63
December 31 Assets 2015 2014
Current assets: Cash and cash equivalents $ 25,062 $ 13,023 Investments 1,539 1,916 Trade receivables, net 98,865 105,743 Notes and other receivables 3,132 1,558 Inventories 384,776 387,835 Prepaid expenses 26,521 17,933 Deferred income tax assets -- 14,817 Other current assets 1,902 7,166
Total current assets 541,797 549,991 Property and equipment, net 170,206 187,610 Investments 11,540 11,393 Goodwill 30,835 31,995 Intangible assets, net 13,577 17,272 Deferred income tax assets 6,195 531 Other long-term assets 3,203 3,473 Total assets $ 777,353 $ 802,265 Liabilities and Equity Current liabilities: Short-term debt $ -- $ 2,814 Current maturities of long-term debt 4,528 1,027 Accounts payable 48,385 60,987 Customer deposits 40,082 45,086 Accrued product warranty 9,100 10,032 Accrued payroll and related liabilities 17,375 17,265 Accrued loss reserves 2,838 3,050 Other accrued liabilities 19,704 20,868
Total current liabilities 142,012 161,129 Long-term debt 5,154 7,061 Deferred income tax liabilities 2,348 16,836 Other long-term liabilities 17,981 21,087 Total liabilities 167,495 206,113 Equity: Preferred stock - authorized 4,000 shares of $1.00 par value; none issued -- -- Common stock – authorized 40,000 shares of $0.20 par value; issued and outstanding – 22,988 in 2015 and 22,930 in 2014 4,598 4,586 Additional paid-in capital 137,883 135,887 Accumulated other comprehensive loss (23,564) (12,915) Company shares held by SERP, at cost (1,778) (2,929) Retained earnings 490,933 467,337 Shareholders’ equity 608,072 591,966 Non-controlling interest 1,786 4,186
Total equity 609,858 596,152 Total liabilities and equity $ 777,353 $ 802,265
See Notes to Consolidated Financial Statements
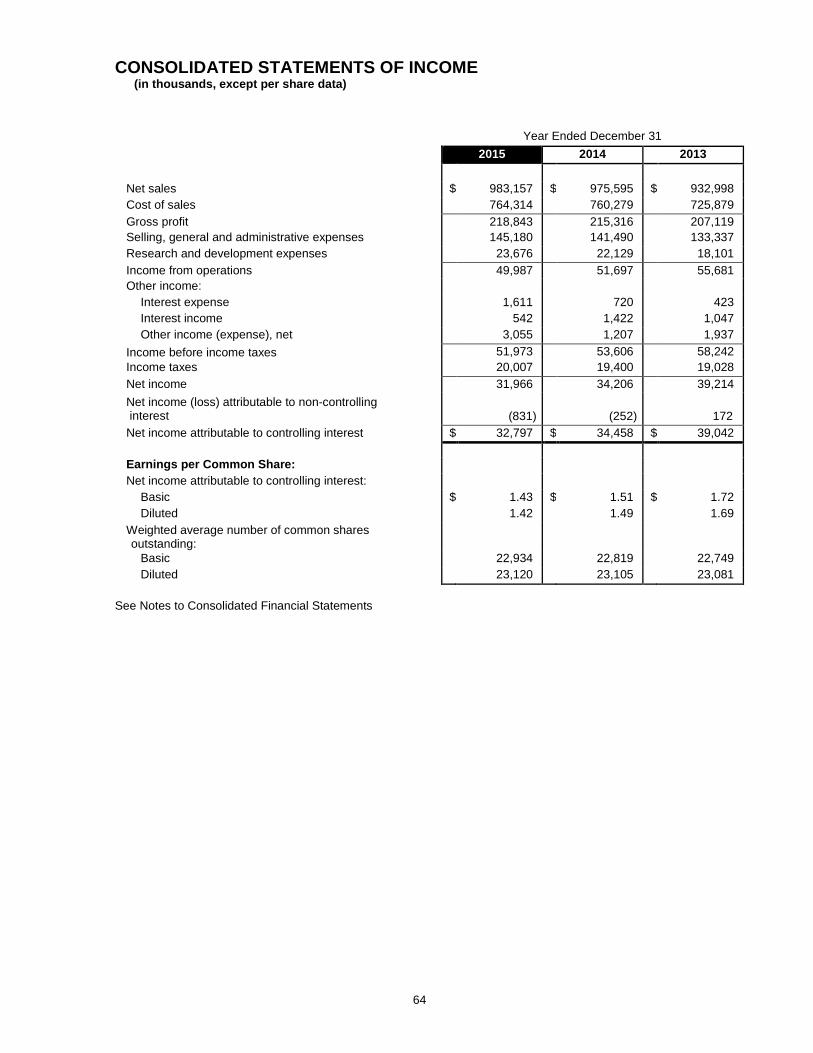
CONSOLIDATED STATEMENTS OF INCOME (in thousands, except per share data)
64
Year Ended December 31
2015 2014 2013 Net sales $ 983,157 $ 975,595 $ 932,998 Cost of sales 764,314 760,279 725,879 Gross profit 218,843 215,316 207,119 Selling, general and administrative expenses 145,180 141,490 133,337 Research and development expenses 23,676 22,129 18,101 Income from operations 49,987 51,697 55,681 Other income:
Interest expense 1,611 720 423 Interest income 542 1,422 1,047 Other income (expense), net 3,055 1,207 1,937
Income before income taxes 51,973 53,606 58,242 Income taxes 20,007 19,400 19,028 Net income 31,966 34,206 39,214 Net income (loss) attributable to non-controlling interest
(831)
(252)
172 Net income attributable to controlling interest $ 32,797 $ 34,458 $ 39,042 Earnings per Common Share: Net income attributable to controlling interest:
Basic $ 1.43 $ 1.51 $ 1.72 Diluted 1.42 1.49 1.69
Weighted average number of common shares outstanding:
Basic 22,934 22,819 22,749 Diluted 23,120 23,105 23,081
See Notes to Consolidated Financial Statements
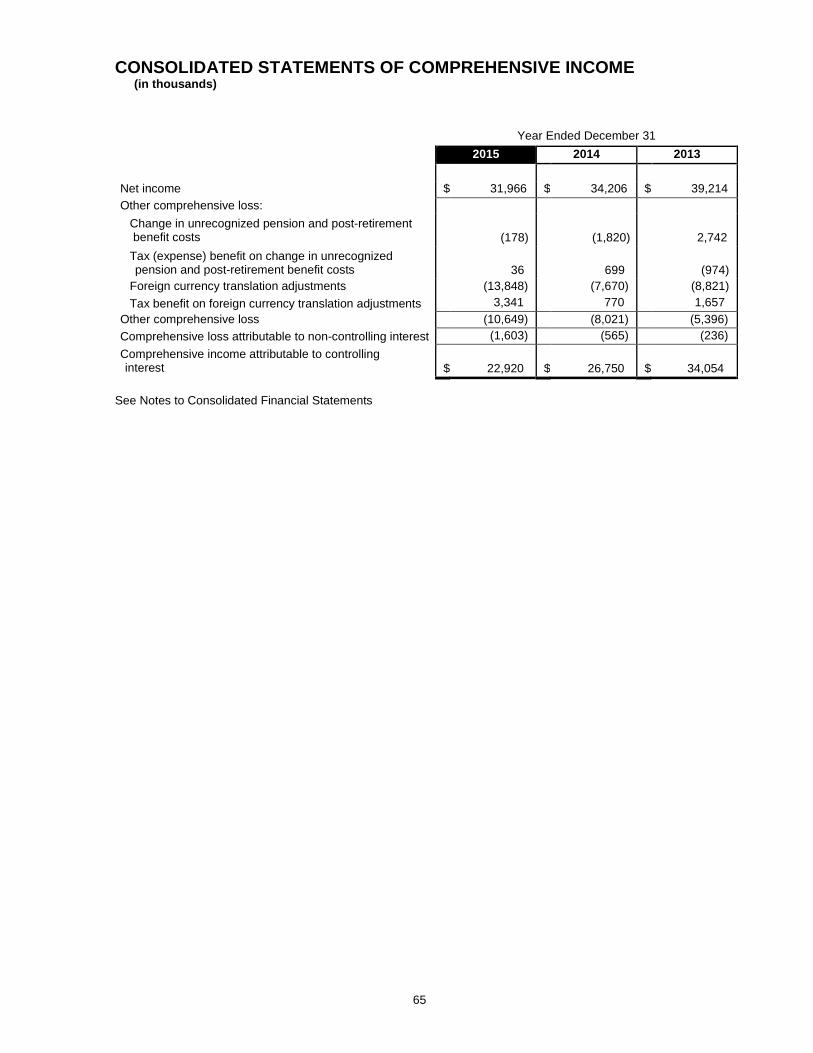
CONSOLIDATED STATEMENTS OF COMPREHENSIVE INCOME (in thousands)
65
Year Ended December 31
2015 2014 2013 Net income $ 31,966 $ 34,206 $ 39,214 Other comprehensive loss:
Change in unrecognized pension and post-retirement benefit costs
(178)
(1,820)
2,742
Tax (expense) benefit on change in unrecognized pension and post-retirement benefit costs
36
699
(974) Foreign currency translation adjustments (13,848) (7,670) (8,821) Tax benefit on foreign currency translation adjustments 3,341 770 1,657
Other comprehensive loss (10,649) (8,021) (5,396) Comprehensive loss attributable to non-controlling interest (1,603) (565) (236) Comprehensive income attributable to controlling interest
$
22,920
$
26,750
$
34,054
See Notes to Consolidated Financial Statements
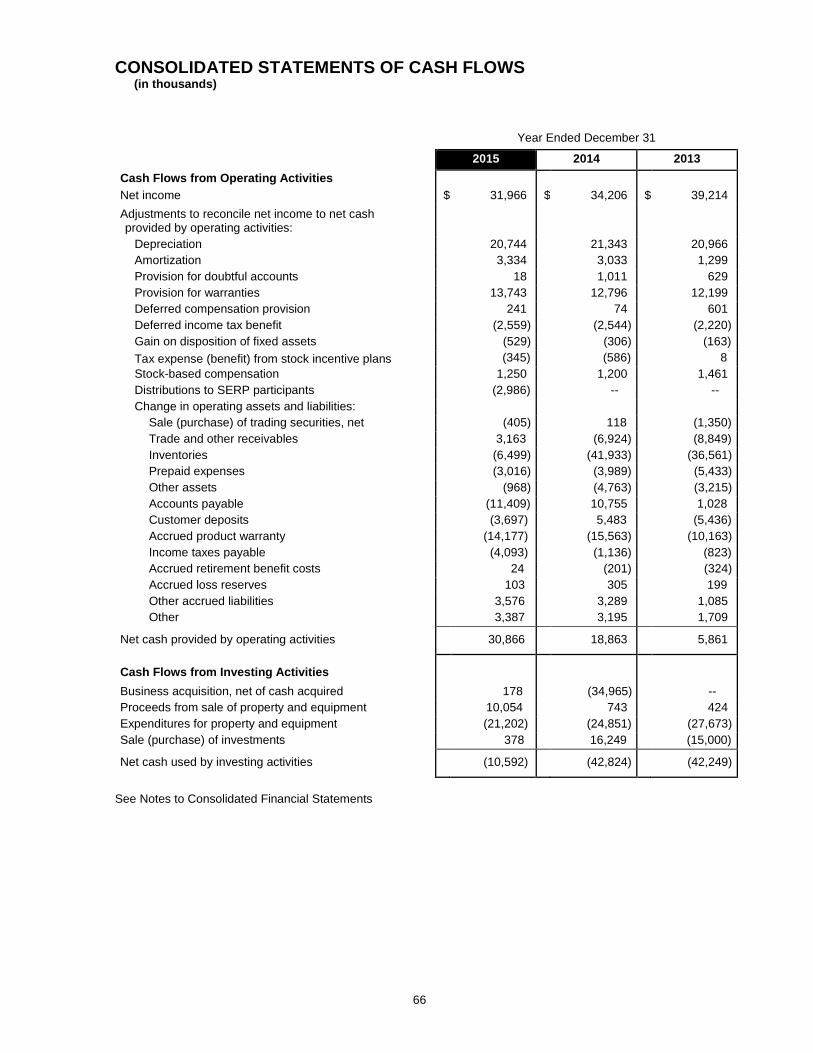
CONSOLIDATED STATEMENTS OF CASH FLOWS (in thousands)
66
Year Ended December 31
2015 2014 2013 Cash Flows from Operating Activities Net income $ 31,966 $ 34,206 $ 39,214 Adjustments to reconcile net income to net cash provided by operating activities:
Depreciation 20,744 21,343 20,966 Amortization 3,334 3,033 1,299 Provision for doubtful accounts 18 1,011 629 Provision for warranties 13,743 12,796 12,199 Deferred compensation provision 241 74 601 Deferred income tax benefit (2,559) (2,544) (2,220) Gain on disposition of fixed assets (529) (306) (163) Tax expense (benefit) from stock incentive plans (345) (586) 8 Stock-based compensation 1,250 1,200 1,461 Distributions to SERP participants (2,986) -- -- Change in operating assets and liabilities:
Sale (purchase) of trading securities, net (405) 118 (1,350) Trade and other receivables 3,163 (6,924) (8,849) Inventories (6,499) (41,933) (36,561) Prepaid expenses (3,016) (3,989) (5,433) Other assets (968) (4,763) (3,215) Accounts payable (11,409) 10,755 1,028 Customer deposits (3,697) 5,483 (5,436) Accrued product warranty (14,177) (15,563) (10,163) Income taxes payable (4,093) (1,136) (823) Accrued retirement benefit costs 24 (201) (324) Accrued loss reserves 103 305 199
Other accrued liabilities 3,576 3,289 1,085 Other 3,387 3,195 1,709
Net cash provided by operating activities 30,866 18,863 5,861
Cash Flows from Investing Activities Business acquisition, net of cash acquired 178 (34,965) -- Proceeds from sale of property and equipment 10,054 743 424 Expenditures for property and equipment (21,202) (24,851) (27,673) Sale (purchase) of investments 378 16,249 (15,000)
Net cash used by investing activities (10,592) (42,824) (42,249)
See Notes to Consolidated Financial Statements
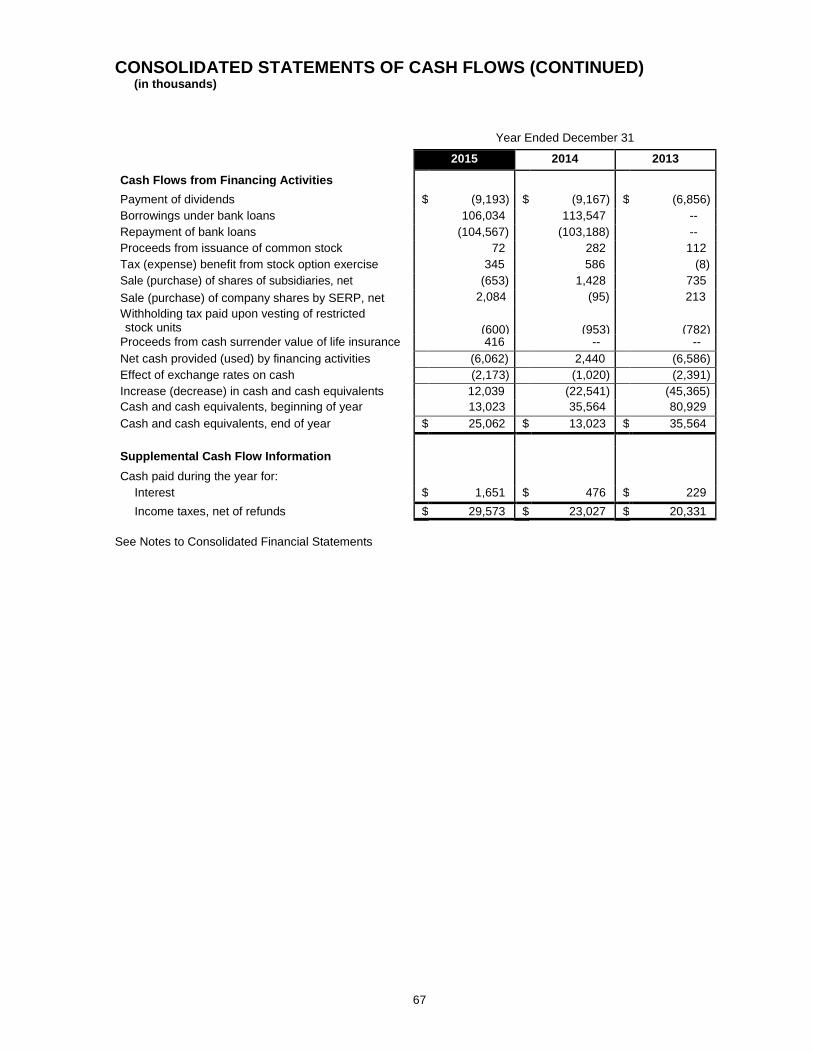
CONSOLIDATED STATEMENTS OF CASH FLOWS (CONTINUED) (in thousands)
67
Year Ended December 31
2015 2014 2013 Cash Flows from Financing Activities Payment of dividends $ (9,193) $ (9,167) $ (6,856) Borrowings under bank loans 106,034 113,547 -- Repayment of bank loans (104,567) (103,188) -- Proceeds from issuance of common stock 72 282 112 Tax (expense) benefit from stock option exercise 345 586 (8) Sale (purchase) of shares of subsidiaries, net (653) 1,428 735 Sale (purchase) of company shares by SERP, net 2,084 (95) 213 Withholding tax paid upon vesting of restricted stock units
(600)
(953)
(782)
Proceeds from cash surrender value of life insurance 416 -- -- Net cash provided (used) by financing activities (6,062) 2,440 (6,586) Effect of exchange rates on cash (2,173) (1,020) (2,391) Increase (decrease) in cash and cash equivalents 12,039 (22,541) (45,365) Cash and cash equivalents, beginning of year 13,023 35,564 80,929 Cash and cash equivalents, end of year $ 25,062 $ 13,023 $ 35,564 Supplemental Cash Flow Information Cash paid during the year for:
Interest $ 1,651 $ 476 $ 229 Income taxes, net of refunds $ 29,573 $ 23,027 $ 20,331
See Notes to Consolidated Financial Statements
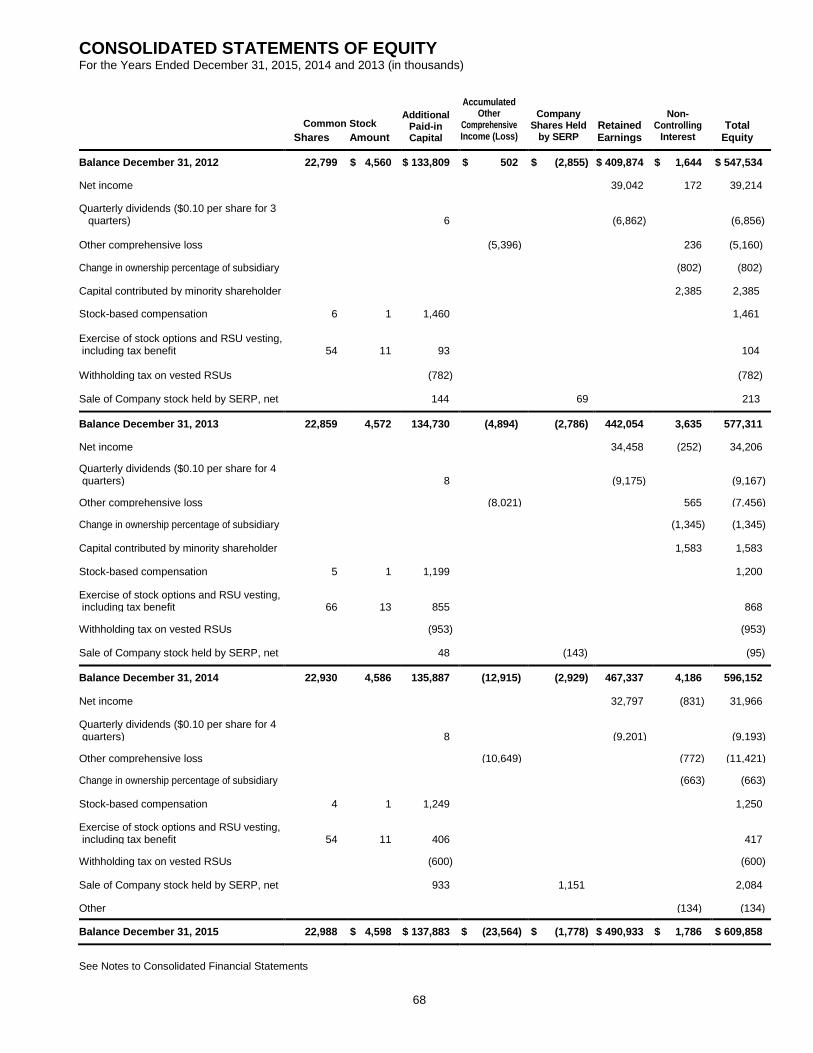
CONSOLIDATED STATEMENTS OF EQUITY For the Years Ended December 31, 2015, 2014 and 2013 (in thousands)
68
Shares
Amount
Additional
Paid-in Capital
Accumulated Other
Comprehensive Income (Loss)
Company
Shares Held by SERP
Retained Earnings
Non-
Controlling Interest
Total Equity
Balance December 31, 2012 22,799 $ 4,560 $ 133,809 $ 502 $ (2,855) $ 409,874 $ 1,644 $ 547,534
Net income 39,042 172 39,214
Quarterly dividends ($0.10 per share for 3 quarters)
6 (6,862)
(6,856)
Other comprehensive loss (5,396) 236 (5,160)
Change in ownership percentage of subsidiary (802) (802)
Capital contributed by minority shareholder 2,385 2,385
Stock-based compensation 6 1 1,460 1,461
Exercise of stock options and RSU vesting, including tax benefit
54
11
93
104
Withholding tax on vested RSUs (782) (782)
Sale of Company stock held by SERP, net 144 69 213
Balance December 31, 2013 22,859 4,572 134,730 (4,894) (2,786) 442,054 3,635 577,311
Net income 34,458 (252) 34,206
Quarterly dividends ($0.10 per share for 4 quarters)
8 (9,175)
(9,167)
Other comprehensive loss (8,021) 565 (7,456)
Change in ownership percentage of subsidiary (1,345) (1,345)
Capital contributed by minority shareholder 1,583 1,583
Stock-based compensation 5 1 1,199 1,200
Exercise of stock options and RSU vesting, including tax benefit
66
13
855
868
Withholding tax on vested RSUs (953) (953)
Sale of Company stock held by SERP, net 48 (143) (95)
Balance December 31, 2014 22,930 4,586 135,887 (12,915) (2,929) 467,337 4,186 596,152
Net income 32,797 (831) 31,966
Quarterly dividends ($0.10 per share for 4 quarters)
8
(9,201)
(9,193)
Other comprehensive loss (10,649) (772) (11,421)
Change in ownership percentage of subsidiary (663) (663)
Stock-based compensation 4 1 1,249 1,250
Exercise of stock options and RSU vesting, including tax benefit
54
11
406
417
Withholding tax on vested RSUs (600) (600)
Sale of Company stock held by SERP, net 933 1,151 2,084
Other (134) (134)
Balance December 31, 2015 22,988 $ 4,598 $ 137,883 $ (23,564) $ (1,778) $ 490,933 $ 1,786 $ 609,858
See Notes to Consolidated Financial Statements
Common Stock
NOTES TO CONSOLIDATED FINANCIAL STATEMENTS (Dollar and share amounts in thousands, except per share amounts unless otherwise specified)
69
1. Summary of Significant Accounting Policies Basis of Presentation - The consolidated financial statements include the accounts of Astec Industries, Inc. and its domestic and foreign subsidiaries (the “Company”). The Company’s significant wholly-owned and consolidated subsidiaries at December 31, 2015 are as follows: Astec Australia Pty Ltd Astec do Brasil Fabricacao de Equipamentos Ltda. (78% owned) Astec, Inc. Astec Insurance Company Astec Mobile Machinery GmbH Astec Mobile Screens, Inc. Breaker Technology, Inc. Breaker Technology Ltd. Carlson Paving Products, Inc. CEI Enterprises, Inc. GEFCO, Inc. Heatec, Inc. Johnson Crushers International, Inc. Kolberg-Pioneer, Inc. Osborn Engineered Products SA (Pty) Ltd Peterson Pacific Corp. (96% owned) Roadtec, Inc. Telestack Limited Telsmith, Inc. All intercompany accounts and transactions have been eliminated in consolidation. Use of Estimates - The preparation of financial statements in conformity with accounting principles generally accepted in the United States requires management to make estimates and assumptions that affect the amounts reported and disclosed in the financial statements and accompanying notes. Actual results could differ from those estimates. Foreign Currency Translation - Subsidiaries located in Australia, Brazil, Canada, Germany, Northern Ireland, and South Africa operate primarily using local functional currencies. Accordingly, assets and liabilities of these subsidiaries are translated using exchange rates in effect at the end of the period, and revenues and costs are translated using average exchange rates for the period. The resulting adjustments are presented as a separate component of accumulated other comprehensive income. Foreign currency transaction gains and losses, net are included in cost of sales and amounted to losses of $1,377, $1,971 and $522 in 2015, 2014 and 2013, respectively. Fair Value of Financial Instruments - For cash and cash equivalents, trade receivables, other receivables, revolving debt and accounts payable, the carrying amount approximates the fair value because of the short-term nature of those instruments. Trading equity investments are valued at their estimated fair value based on their quoted market prices and debt securities are valued based upon a mix of observable market prices and model driven prices derived from a matrix of observable market prices for assets with similar characteristics obtained from a nationally recognized third party pricing service. Financial assets and liabilities are categorized as of the end of each reporting period based upon the level of judgment associated with the inputs used to measure their fair value. The inputs used to measure the fair value are identified in the following hierarchy:
Level 1 - Unadjusted quoted prices in active markets for identical assets or liabilities. Level 2 - Unadjusted quoted prices in active markets for similar assets or liabilities; or
unadjusted quoted prices for identical or similar assets or liabilities in markets that are not active; or inputs other than quoted prices that are observable for the asset or liability.
Level 3 - Inputs reflect management’s best estimate of what market participants would
use in pricing the asset or liability at the measurement date. Consideration is given to the risk inherent in the valuation technique and the risk inherent in the inputs to the model.
All financial assets and liabilities held by the Company at December 31, 2015 and 2014 are classified as Level 1 or Level 2, as summarized in Note 3, Fair Value Measurements. Cash and Cash Equivalents - All highly liquid investments with an original maturity of three months or less when purchased are considered to be cash and cash equivalents.
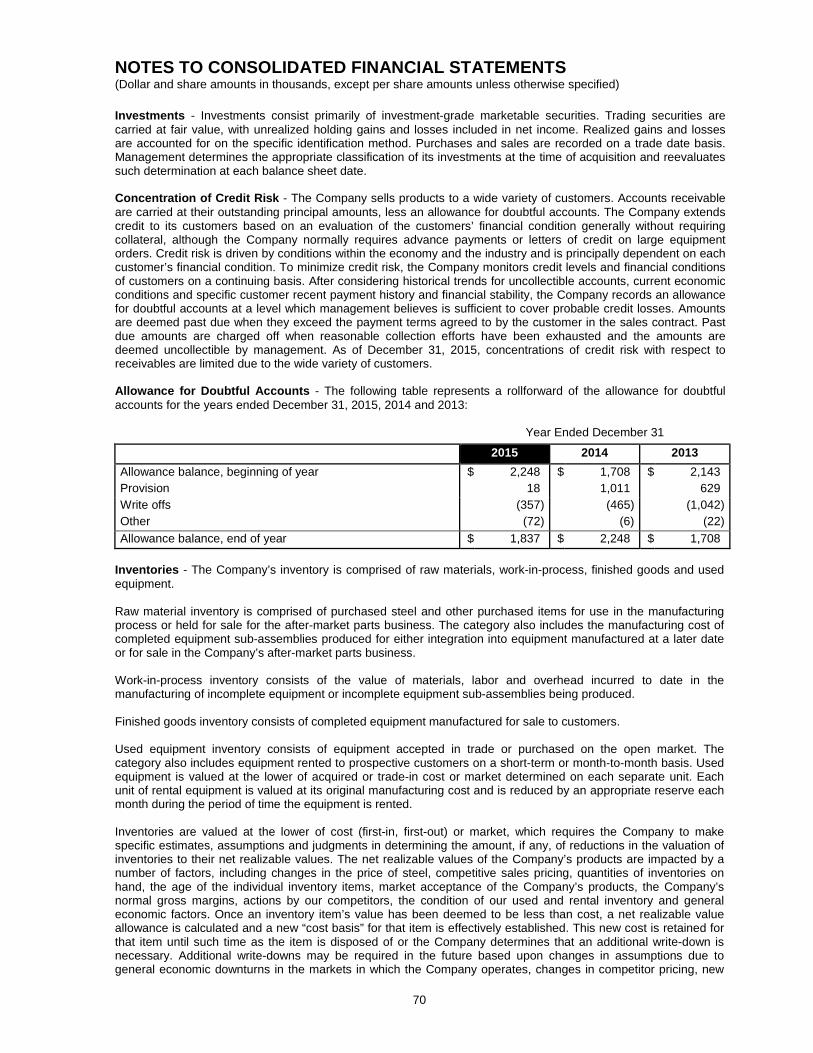
NOTES TO CONSOLIDATED FINANCIAL STATEMENTS (Dollar and share amounts in thousands, except per share amounts unless otherwise specified)
70
Investments - Investments consist primarily of investment-grade marketable securities. Trading securities are carried at fair value, with unrealized holding gains and losses included in net income. Realized gains and losses are accounted for on the specific identification method. Purchases and sales are recorded on a trade date basis. Management determines the appropriate classification of its investments at the time of acquisition and reevaluates such determination at each balance sheet date. Concentration of Credit Risk - The Company sells products to a wide variety of customers. Accounts receivable are carried at their outstanding principal amounts, less an allowance for doubtful accounts. The Company extends credit to its customers based on an evaluation of the customers’ financial condition generally without requiring collateral, although the Company normally requires advance payments or letters of credit on large equipment orders. Credit risk is driven by conditions within the economy and the industry and is principally dependent on each customer’s financial condition. To minimize credit risk, the Company monitors credit levels and financial conditions of customers on a continuing basis. After considering historical trends for uncollectible accounts, current economic conditions and specific customer recent payment history and financial stability, the Company records an allowance for doubtful accounts at a level which management believes is sufficient to cover probable credit losses. Amounts are deemed past due when they exceed the payment terms agreed to by the customer in the sales contract. Past due amounts are charged off when reasonable collection efforts have been exhausted and the amounts are deemed uncollectible by management. As of December 31, 2015, concentrations of credit risk with respect to receivables are limited due to the wide variety of customers. Allowance for Doubtful Accounts - The following table represents a rollforward of the allowance for doubtful accounts for the years ended December 31, 2015, 2014 and 2013: Year Ended December 31
2015 2014 2013 Allowance balance, beginning of year $ 2,248 $ 1,708 $ 2,143 Provision 18 1,011 629 Write offs (357) (465) (1,042) Other (72) (6) (22) Allowance balance, end of year $ 1,837 $ 2,248 $ 1,708
Inventories - The Company’s inventory is comprised of raw materials, work-in-process, finished goods and used equipment. Raw material inventory is comprised of purchased steel and other purchased items for use in the manufacturing process or held for sale for the after-market parts business. The category also includes the manufacturing cost of completed equipment sub-assemblies produced for either integration into equipment manufactured at a later date or for sale in the Company’s after-market parts business. Work-in-process inventory consists of the value of materials, labor and overhead incurred to date in the manufacturing of incomplete equipment or incomplete equipment sub-assemblies being produced. Finished goods inventory consists of completed equipment manufactured for sale to customers. Used equipment inventory consists of equipment accepted in trade or purchased on the open market. The category also includes equipment rented to prospective customers on a short-term or month-to-month basis. Used equipment is valued at the lower of acquired or trade-in cost or market determined on each separate unit. Each unit of rental equipment is valued at its original manufacturing cost and is reduced by an appropriate reserve each month during the period of time the equipment is rented. Inventories are valued at the lower of cost (first-in, first-out) or market, which requires the Company to make specific estimates, assumptions and judgments in determining the amount, if any, of reductions in the valuation of inventories to their net realizable values. The net realizable values of the Company’s products are impacted by a number of factors, including changes in the price of steel, competitive sales pricing, quantities of inventories on hand, the age of the individual inventory items, market acceptance of the Company’s products, the Company’s normal gross margins, actions by our competitors, the condition of our used and rental inventory and general economic factors. Once an inventory item’s value has been deemed to be less than cost, a net realizable value allowance is calculated and a new “cost basis” for that item is effectively established. This new cost is retained for that item until such time as the item is disposed of or the Company determines that an additional write-down is necessary. Additional write-downs may be required in the future based upon changes in assumptions due to general economic downturns in the markets in which the Company operates, changes in competitor pricing, new
NOTES TO CONSOLIDATED FINANCIAL STATEMENTS (Dollar and share amounts in thousands, except per share amounts unless otherwise specified)
71
product design or other technological advances introduced by the Company or its competitors and other factors unique to individual inventory items. The most significant component of the Company’s inventory is steel. A significant decline in the market price of steel could result in a decline in the market value of the equipment or parts we sell. During periods of significant declining steel prices, the Company reviews the valuation of its inventories to determine if reductions are needed in the recorded value of inventory on hand to its net realizable value. The Company reviews the individual items included in its finished goods, used equipment and rental equipment inventory on a model-by-model or unit-by-unit basis to determine if any item’s net realizable value is below its carrying value. This analysis is expanded to include items in work-in-process and raw material inventory if factors indicate those items may also be impacted. In performing this review, judgments are made and, in addition to the factors discussed above, additional consideration is given to the age of the specific items of used or rental inventory, prior sales offers or lack thereof, the physical condition of the specific items and general market conditions for the specific items. Additionally, an analysis of raw material inventory is performed to calculate reserves needed for obsolete inventory based upon quantities of items on hand, the age of those items and their recent and expected future usage or sale. When the Company determines that the value of inventory has become impaired through damage, deterioration, obsolescence, changes in price levels, excessive levels of inventory or other causes, the Company reduces the carrying value to estimated market value based on estimates, assumptions and judgments made from the information available at that time. Abnormal amounts of idle facility expense, freight, handling cost and wasted materials are recognized as current period charges. Property and Equipment - Property and equipment is stated at cost. Depreciation is calculated for financial reporting purposes using the straight-line method based on the estimated useful lives of the assets as follows: airplanes (20 years), buildings (40 years) and equipment (3 to 10 years). Both accelerated and straight-line methods are used for tax compliance purposes. Routine repair and maintenance costs and planned major maintenance are expensed when incurred. Goodwill and Other Intangible Assets - The Company classifies intangible assets as either intangible assets with definite lives subject to amortization or goodwill. The Company tests intangible assets with definite lives for impairment if conditions exist that indicate the carrying value may not be recoverable. Such conditions may include an economic downturn in a geographic market or a change in the assessment of future operations. An impairment charge is recorded when the carrying value of the definite lived intangible asset is not recoverable by the future undiscounted cash flows expected to be generated from the use of the asset. The Company determines the useful lives of identifiable intangible assets after considering the specific facts and circumstances related to each intangible asset. Factors considered when determining useful lives include the contractual terms of agreements, the history of the asset, the Company’s long-term strategy for the use of the asset, any laws or other local regulations which could impact the useful life of the asset, and other economic factors, including competition and specific market conditions. Intangible assets that are deemed to have definite lives are amortized over their useful lives, ranging from 3 to 15 years. Goodwill is not amortized. The Company tests goodwill for impairment annually or more frequently if events or circumstances indicate that goodwill might be impaired. The tests utilize a two-step method at the reporting unit level. The Company’s reporting units are typically defined as either subsidiaries or a combination of subsidiaries. The first step of the goodwill impairment test compares book value of a reporting unit, including goodwill, with the unit’s fair value. In this first step, the Company estimates the fair values of each of its reporting units that have goodwill using the income approach. The income approach uses a reporting unit’s projection of estimated future operating results and cash flows which are then discounted using a weighted average cost of capital determined based on current market conditions for the individual reporting unit. The projection uses management’s best estimates of cash flows over the projection period based on estimates of annual and terminal growth rates in sales and costs, changes in operating margins, selling, general and administrative expenses, working capital requirements and capital expenditures. The fair value of reporting units that do not have goodwill are estimated using either the income or market approaches, depending on which approach is to be the most appropriate for each reporting unit. The fair value of the reporting units that serve operating units in supporting roles, such as the captive insurance company and the corporate reporting unit are estimated using the cost approach. The sum of the fair values of all reporting units is
NOTES TO CONSOLIDATED FINANCIAL STATEMENTS (Dollar and share amounts in thousands, except per share amounts unless otherwise specified)
72
compared to the fair value of the consolidated Company, calculated using the market approach, which is inferred from the market capitalization of the Company at the date of the valuation, to confirm that the Company’s estimation of the fair value of its reporting units is reasonable. If the book value of a reporting unit exceeds its fair value, an indication of possible goodwill impairment, the second step of the impairment test must be performed to determine the amount, if any, of goodwill impairment. In this second step, the total implied fair value of the reporting unit’s goodwill is estimated by allocating the fair value of the reporting unit to all its assets, including any unrecognized intangible assets and liabilities other than goodwill. The difference between the total fair value of the reporting unit and the fair value of its assets and liabilities other than goodwill is the implied fair value of its goodwill. The amount of any impairment loss is equal to the excess, if any, of the book value of the goodwill over the implied fair value of its goodwill. Determining the “step one” fair values of the Company’s reporting units involves the use of significant estimates and assumptions. Due to the inherent uncertainty involved in making these estimates and assumptions, actual results could differ materially from those estimates. Impairment of Long-lived Assets - In the event that facts and circumstances indicate the carrying amounts of long-lived assets may be impaired, an evaluation of recoverability is performed. If an evaluation is required, the estimated future undiscounted cash flows associated with the asset are compared to the carrying amount for each asset (or group of assets) to determine if a write-down is required. If this review indicates that the assets will not be recoverable, the carrying values of the impaired assets are reduced to their estimated fair value. Fair value is estimated using discounted cash flows, prices for similar assets or other valuation techniques. Self-Insurance Reserves - The Company retains the risk for a portion of its workers’ compensation claims and general liability claims by way of a captive insurance company, Astec Insurance Company (“Astec Insurance” or “the captive”). Astec Insurance is incorporated under the laws of the state of Vermont. The objectives of Astec Insurance are to improve control over and reduce the cost of claims; to improve focus on risk reduction with the development of a program structure which rewards proactive loss control; and to ensure management participation in the defense and settlement process for claims. For general liability claims, the captive is liable for the first $1,000 per occurrence and $3,000 per year in the aggregate. The Company carries general liability, excess liability and umbrella policies for claims in excess of amounts covered by the captive. For workers’ compensation claims, the captive is liable for the first $350 per occurrence and $1,000 per year in the aggregate. The Company utilizes a large national insurance company as third party administrator for workers’ compensation claims and carries insurance coverage for claims liabilities in excess of amounts covered by the captive. The financial statements of the captive are consolidated into the financial statements of the Company. The short-term and long-term reserves for claims and potential claims related to general liability and workers’ compensation under the captive are included in accrued loss reserves or other long-term liabilities, respectively, in the consolidated balance sheets depending on the expected timing of future payments. The undiscounted reserves are actuarially determined to cover the ultimate cost of each claim based on the Company’s evaluation of the type and severity of individual claims and historical information, primarily its own claims experience, along with assumptions about future events. Changes in assumptions, as well as changes in actual experience, could cause these estimates to change in the future. However, the Company does not believe it is reasonably likely that the reserve level will materially change in the foreseeable future. The Company is self-insured for health and prescription claims under its Group Health Insurance Plan at all but one of the Company’s domestic manufacturing subsidiaries. The Company carries reinsurance coverage to limit its exposure for individual health claims above certain limits. Third parties administer health claims and prescription medication claims. The Company maintains a reserve for the self-insured health plan which is included in accrued loss reserves on the Company’s consolidated balance sheets. This reserve includes both unpaid claims and an estimate of claims incurred but not reported, based on historical claims and payment experience. Historically the reserves have been sufficient to provide for claims payments. Changes in actual claims experience or payment patterns could cause the reserve to change, but the Company does not believe it is reasonably likely that the reserve level will materially change in the near future. The remaining U.S. subsidiary is covered under a fully insured group health plan. Employees of the Company’s foreign subsidiaries are insured under separate health plans. No reserves are necessary for these fully insured health plans.
NOTES TO CONSOLIDATED FINANCIAL STATEMENTS (Dollar and share amounts in thousands, except per share amounts unless otherwise specified)
73
Revenue Recognition - Revenue is generally recognized on sales at the point in time when persuasive evidence of an arrangement exists, the price is fixed or determinable, the product has been delivered or services have been rendered and there is a reasonable assurance of collection of the sales proceeds. The Company generally obtains purchase authorizations from its customers for a specified amount of products at a specified price with specified delivery terms. A significant portion of the Company’s equipment sales represents equipment produced in the Company’s plants under short-term contracts for a specific customer project or equipment designed to meet a customer’s specific requirements. Most of the equipment sold by the Company is based on standard configurations, some of which are modified to meet customer needs or specifications. The Company provides customers with technical design and performance specifications and performs pre-shipment testing to ensure the equipment performs according to design specifications, regardless of whether the Company provides installation services in addition to selling the equipment. Certain contracts include terms and conditions pursuant to which the Company recognizes revenues upon completion of equipment production, which is subsequently stored at the Company’s plant at the customer’s request. Revenue is recorded on such contracts upon the customer’s assumption of title and risk of ownership and when collectability is reasonably assured. In addition, there must be a fixed schedule of delivery of the goods consistent with the customer’s business practices, the Company must not have retained any specific performance obligations such that the earnings process is not complete and the goods must have been segregated from the Company’s inventory prior to revenue recognition. The Company has certain sales accounted for as multiple-element arrangements, whereby revenue attributable to the sale of a product is recognized when the product is shipped, and the revenue attributable to services provided with respect to the product (such as installation services) is recognized when the service is performed. Consideration is allocated to deliverables using the relative selling price method using vendor specific objective evidence, if it exists. Otherwise, the Company uses third-party evidence of selling price or the Company’s best estimate of the selling price for the deliverables. The Company evaluates sales with multiple deliverable elements (such as an agreement to deliver equipment and related installation services) to determine whether revenue related to individual elements should be recognized separately, or as a combined unit. In addition to the previously mentioned general revenue recognition criteria, the Company only recognizes revenue on individual delivered elements when there is objective and reliable evidence that the delivered element has a determinable value to the customer on a standalone basis and there is no right of return. The Company presents in the statements of income any taxes assessed by a governmental authority that are directly imposed on revenue-producing transactions between the Company and its customers, such as sales, use, value-added and some excise taxes, on a net (excluded from revenue) basis. Advertising Expense - The cost of advertising is expensed as incurred. The Company incurred $4,231, $3,657, and $3,770 in advertising costs during 2015, 2014 and 2013, respectively, which is included in selling, general and administrative expenses. Income Taxes - Income taxes are based on pre-tax financial accounting income. Deferred tax assets and liabilities are recognized for the expected tax consequences of temporary differences between the tax bases of assets and liabilities and their reported amounts. The Company periodically assesses the need to establish valuation allowances against its deferred tax assets to the extent the Company no longer believes it is more likely than not that the tax assets will be fully utilized.
The Company evaluates a tax position to determine whether it is more likely than not that the tax position will be sustained upon examination, based upon the technical merits of the position. A tax position that meets the more-likely-than-not recognition threshold is subject to a measurement assessment to determine the amount of benefit to recognize and the appropriate reserve to establish, if any. If a tax position does not meet the more-likely-than-not recognition threshold, no benefit is recognized. The Company is periodically audited by U.S. federal and state as well as foreign tax authorities. While it is often difficult to predict final outcome or timing of resolution of any particular tax matter, the Company believes its reserve for uncertain tax positions is adequate to reduce the uncertain positions to the greatest amount of benefit that is more likely than not realizable.
Product Warranty Reserve - The Company accrues for the estimated cost of product warranties at the time revenue is recognized. Warranty obligations by product line or model are evaluated based on historical warranty claims experience. For equipment, the Company’s standard product warranty terms generally include post-sales support and repairs of products at no additional charge for periods ranging from three months to two years or up to a specified number of hours of operation. For parts from component suppliers, the Company relies on the original manufacturer’s warranty that accompanies those parts. Generally, Company fabricated parts are not covered by specific warranty terms. Although failure of fabricated parts due to material or workmanship is rare, if it occurs, the Company’s policy is to replace fabricated parts at no additional charge.
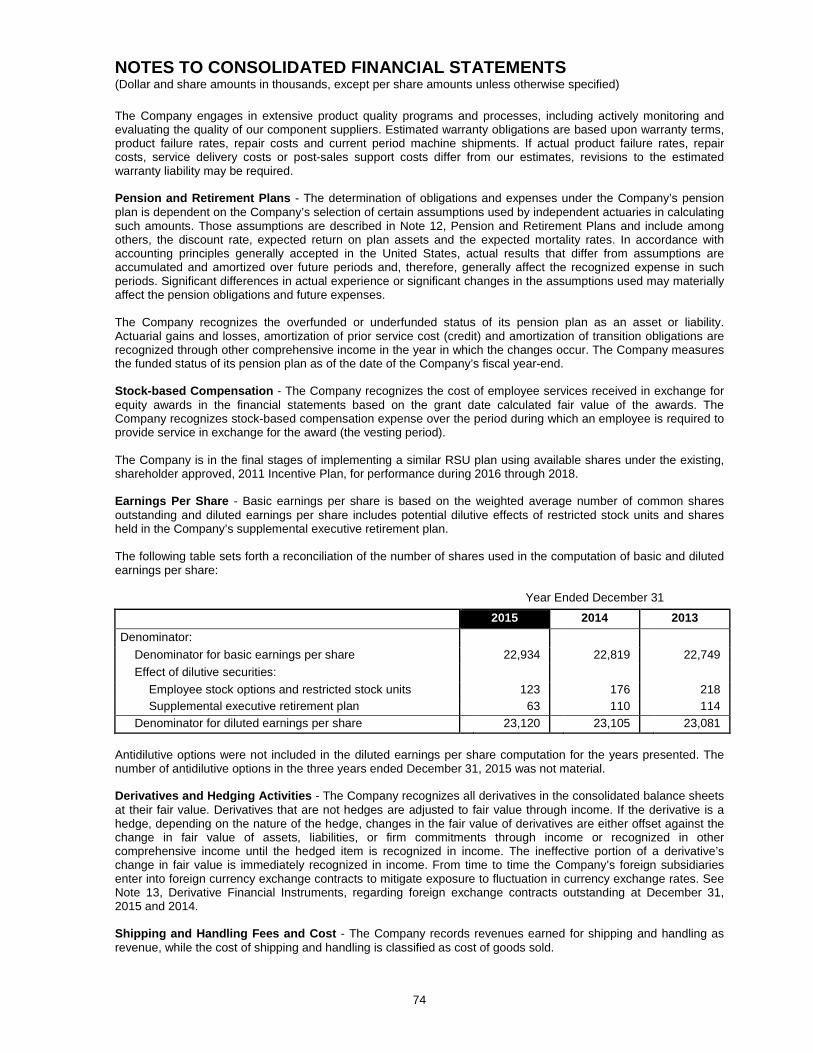
NOTES TO CONSOLIDATED FINANCIAL STATEMENTS (Dollar and share amounts in thousands, except per share amounts unless otherwise specified)
74
The Company engages in extensive product quality programs and processes, including actively monitoring and evaluating the quality of our component suppliers. Estimated warranty obligations are based upon warranty terms, product failure rates, repair costs and current period machine shipments. If actual product failure rates, repair costs, service delivery costs or post-sales support costs differ from our estimates, revisions to the estimated warranty liability may be required. Pension and Retirement Plans - The determination of obligations and expenses under the Company’s pension plan is dependent on the Company’s selection of certain assumptions used by independent actuaries in calculating such amounts. Those assumptions are described in Note 12, Pension and Retirement Plans and include among others, the discount rate, expected return on plan assets and the expected mortality rates. In accordance with accounting principles generally accepted in the United States, actual results that differ from assumptions are accumulated and amortized over future periods and, therefore, generally affect the recognized expense in such periods. Significant differences in actual experience or significant changes in the assumptions used may materially affect the pension obligations and future expenses. The Company recognizes the overfunded or underfunded status of its pension plan as an asset or liability. Actuarial gains and losses, amortization of prior service cost (credit) and amortization of transition obligations are recognized through other comprehensive income in the year in which the changes occur. The Company measures the funded status of its pension plan as of the date of the Company’s fiscal year-end.
Stock-based Compensation - The Company recognizes the cost of employee services received in exchange for equity awards in the financial statements based on the grant date calculated fair value of the awards. The Company recognizes stock-based compensation expense over the period during which an employee is required to provide service in exchange for the award (the vesting period). The Company is in the final stages of implementing a similar RSU plan using available shares under the existing, shareholder approved, 2011 Incentive Plan, for performance during 2016 through 2018. Earnings Per Share - Basic earnings per share is based on the weighted average number of common shares outstanding and diluted earnings per share includes potential dilutive effects of restricted stock units and shares held in the Company’s supplemental executive retirement plan. The following table sets forth a reconciliation of the number of shares used in the computation of basic and diluted earnings per share: Year Ended December 31
2015 2014 2013 Denominator:
Denominator for basic earnings per share 22,934 22,819 22,749 Effect of dilutive securities:
Employee stock options and restricted stock units 123 176 218 Supplemental executive retirement plan 63 110 114
Denominator for diluted earnings per share 23,120 23,105 23,081 Antidilutive options were not included in the diluted earnings per share computation for the years presented. The number of antidilutive options in the three years ended December 31, 2015 was not material. Derivatives and Hedging Activities - The Company recognizes all derivatives in the consolidated balance sheets at their fair value. Derivatives that are not hedges are adjusted to fair value through income. If the derivative is a hedge, depending on the nature of the hedge, changes in the fair value of derivatives are either offset against the change in fair value of assets, liabilities, or firm commitments through income or recognized in other comprehensive income until the hedged item is recognized in income. The ineffective portion of a derivative’s change in fair value is immediately recognized in income. From time to time the Company’s foreign subsidiaries enter into foreign currency exchange contracts to mitigate exposure to fluctuation in currency exchange rates. See Note 13, Derivative Financial Instruments, regarding foreign exchange contracts outstanding at December 31, 2015 and 2014. Shipping and Handling Fees and Cost - The Company records revenues earned for shipping and handling as revenue, while the cost of shipping and handling is classified as cost of goods sold.
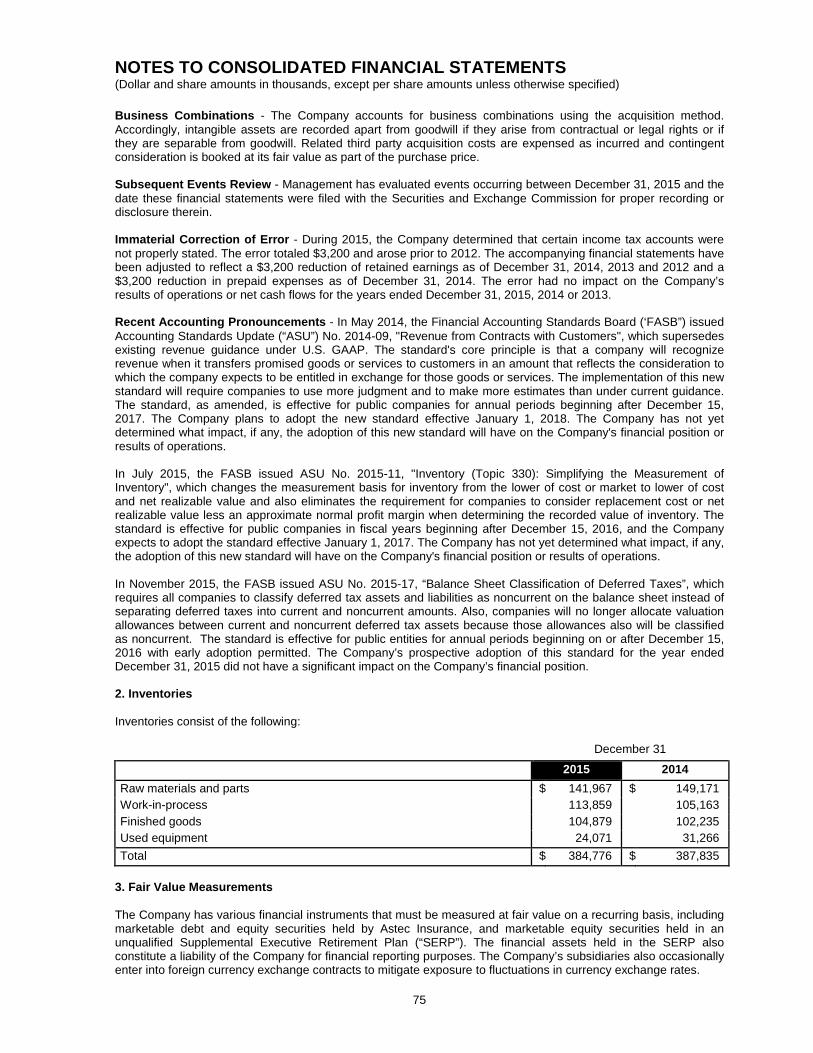
NOTES TO CONSOLIDATED FINANCIAL STATEMENTS (Dollar and share amounts in thousands, except per share amounts unless otherwise specified)
75
Business Combinations - The Company accounts for business combinations using the acquisition method. Accordingly, intangible assets are recorded apart from goodwill if they arise from contractual or legal rights or if they are separable from goodwill. Related third party acquisition costs are expensed as incurred and contingent consideration is booked at its fair value as part of the purchase price. Subsequent Events Review - Management has evaluated events occurring between December 31, 2015 and the date these financial statements were filed with the Securities and Exchange Commission for proper recording or disclosure therein. Immaterial Correction of Error - During 2015, the Company determined that certain income tax accounts were not properly stated. The error totaled $3,200 and arose prior to 2012. The accompanying financial statements have been adjusted to reflect a $3,200 reduction of retained earnings as of December 31, 2014, 2013 and 2012 and a $3,200 reduction in prepaid expenses as of December 31, 2014. The error had no impact on the Company’s results of operations or net cash flows for the years ended December 31, 2015, 2014 or 2013.
Recent Accounting Pronouncements - In May 2014, the Financial Accounting Standards Board (‘FASB”) issued Accounting Standards Update (“ASU”) No. 2014-09, "Revenue from Contracts with Customers", which supersedes existing revenue guidance under U.S. GAAP. The standard's core principle is that a company will recognize revenue when it transfers promised goods or services to customers in an amount that reflects the consideration to which the company expects to be entitled in exchange for those goods or services. The implementation of this new standard will require companies to use more judgment and to make more estimates than under current guidance. The standard, as amended, is effective for public companies for annual periods beginning after December 15, 2017. The Company plans to adopt the new standard effective January 1, 2018. The Company has not yet determined what impact, if any, the adoption of this new standard will have on the Company's financial position or results of operations. In July 2015, the FASB issued ASU No. 2015-11, "Inventory (Topic 330): Simplifying the Measurement of Inventory", which changes the measurement basis for inventory from the lower of cost or market to lower of cost and net realizable value and also eliminates the requirement for companies to consider replacement cost or net realizable value less an approximate normal profit margin when determining the recorded value of inventory. The standard is effective for public companies in fiscal years beginning after December 15, 2016, and the Company expects to adopt the standard effective January 1, 2017. The Company has not yet determined what impact, if any, the adoption of this new standard will have on the Company's financial position or results of operations. In November 2015, the FASB issued ASU No. 2015-17, “Balance Sheet Classification of Deferred Taxes”, which requires all companies to classify deferred tax assets and liabilities as noncurrent on the balance sheet instead of separating deferred taxes into current and noncurrent amounts. Also, companies will no longer allocate valuation allowances between current and noncurrent deferred tax assets because those allowances also will be classified as noncurrent. The standard is effective for public entities for annual periods beginning on or after December 15, 2016 with early adoption permitted. The Company’s prospective adoption of this standard for the year ended December 31, 2015 did not have a significant impact on the Company’s financial position. 2. Inventories Inventories consist of the following: December 31
2015 2014 Raw materials and parts $ 141,967 $ 149,171 Work-in-process 113,859 105,163 Finished goods 104,879 102,235 Used equipment 24,071 31,266 Total $ 384,776 $ 387,835
3. Fair Value Measurements
The Company has various financial instruments that must be measured at fair value on a recurring basis, including marketable debt and equity securities held by Astec Insurance, and marketable equity securities held in an unqualified Supplemental Executive Retirement Plan (“SERP”). The financial assets held in the SERP also constitute a liability of the Company for financial reporting purposes. The Company’s subsidiaries also occasionally enter into foreign currency exchange contracts to mitigate exposure to fluctuations in currency exchange rates.
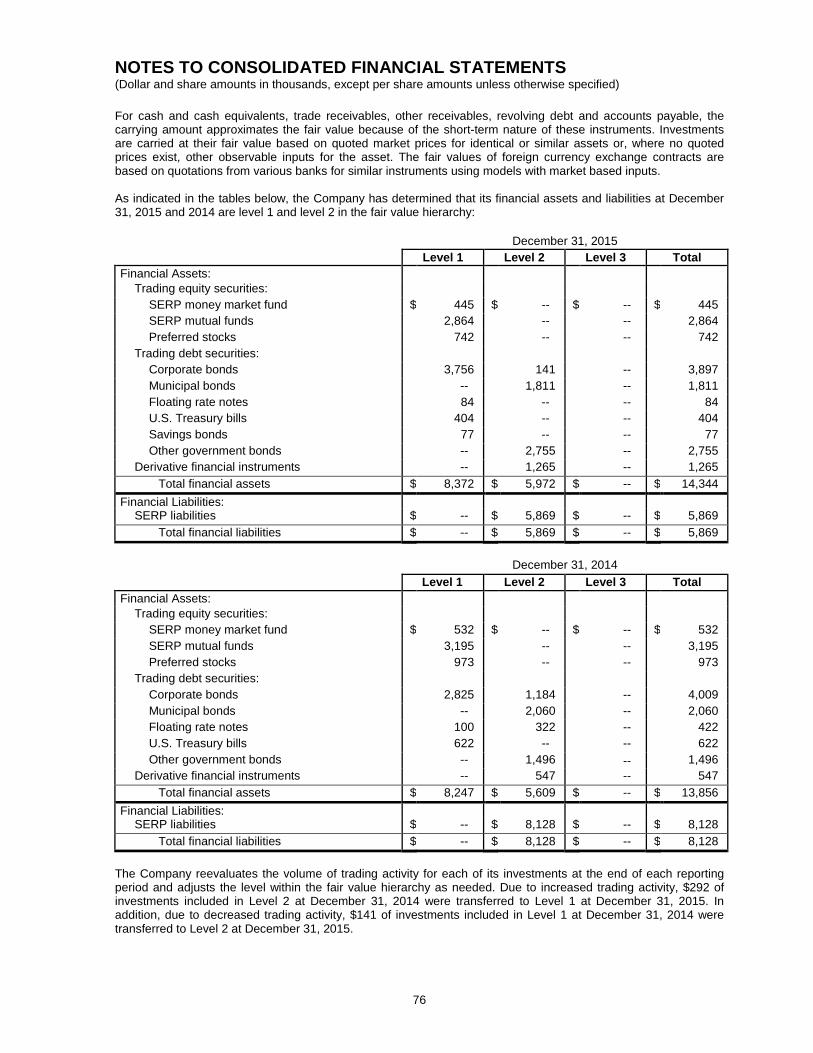
NOTES TO CONSOLIDATED FINANCIAL STATEMENTS (Dollar and share amounts in thousands, except per share amounts unless otherwise specified)
76
For cash and cash equivalents, trade receivables, other receivables, revolving debt and accounts payable, the carrying amount approximates the fair value because of the short-term nature of these instruments. Investments are carried at their fair value based on quoted market prices for identical or similar assets or, where no quoted prices exist, other observable inputs for the asset. The fair values of foreign currency exchange contracts are based on quotations from various banks for similar instruments using models with market based inputs. As indicated in the tables below, the Company has determined that its financial assets and liabilities at December 31, 2015 and 2014 are level 1 and level 2 in the fair value hierarchy: December 31, 2015 Level 1 Level 2 Level 3 Total Financial Assets:
Trading equity securities: SERP money market fund $ 445 $ -- $ -- $ 445 SERP mutual funds 2,864 -- -- 2,864 Preferred stocks 742 -- -- 742
Trading debt securities: Corporate bonds 3,756 141 -- 3,897 Municipal bonds -- 1,811 -- 1,811 Floating rate notes 84 -- -- 84 U.S. Treasury bills 404 -- -- 404 Savings bonds 77 -- -- 77 Other government bonds -- 2,755 -- 2,755
Derivative financial instruments -- 1,265 -- 1,265 Total financial assets $ 8,372 $ 5,972 $ -- $ 14,344
Financial Liabilities: SERP liabilities $ -- $ 5,869 $ -- $ 5,869
Total financial liabilities $ -- $ 5,869 $ -- $ 5,869 December 31, 2014
Level 1 Level 2 Level 3 Total Financial Assets:
Trading equity securities: SERP money market fund $ 532 $ -- $ -- $ 532 SERP mutual funds 3,195 -- -- 3,195 Preferred stocks 973 -- -- 973
Trading debt securities: Corporate bonds 2,825 1,184 -- 4,009 Municipal bonds -- 2,060 -- 2,060 Floating rate notes 100 322 -- 422 U.S. Treasury bills 622 -- -- 622 Other government bonds -- 1,496 -- 1,496
Derivative financial instruments -- 547 -- 547 Total financial assets $ 8,247 $ 5,609 $ -- $ 13,856
Financial Liabilities: SERP liabilities $ -- $ 8,128 $ -- $ 8,128
Total financial liabilities $ -- $ 8,128 $ -- $ 8,128 The Company reevaluates the volume of trading activity for each of its investments at the end of each reporting period and adjusts the level within the fair value hierarchy as needed. Due to increased trading activity, $292 of investments included in Level 2 at December 31, 2014 were transferred to Level 1 at December 31, 2015. In addition, due to decreased trading activity, $141 of investments included in Level 1 at December 31, 2014 were transferred to Level 2 at December 31, 2015.
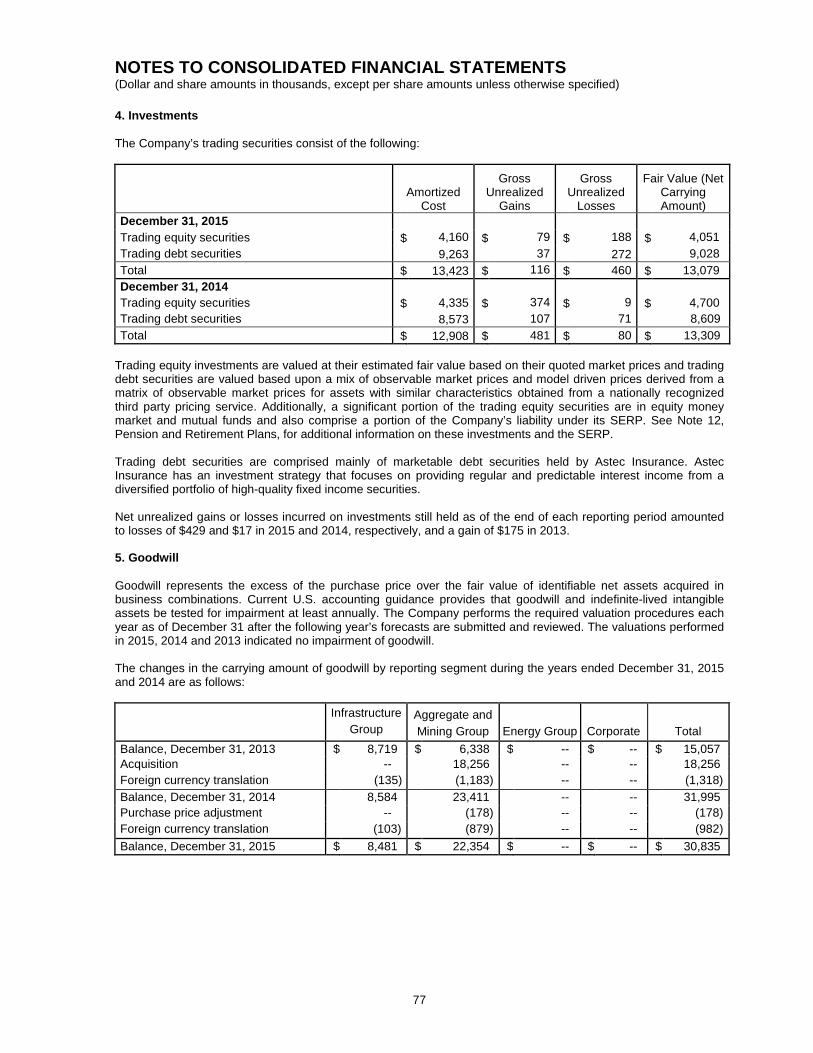
NOTES TO CONSOLIDATED FINANCIAL STATEMENTS (Dollar and share amounts in thousands, except per share amounts unless otherwise specified)
77
4. Investments The Company’s trading securities consist of the following:
Amortized Cost
Gross Unrealized
Gains
Gross Unrealized
Losses
Fair Value (Net Carrying Amount)
December 31, 2015 4,160
79
188
4,051 Trading equity securities $ $ $ $
Trading debt securities 9,263 37 272 9,028 Total $ 13,423 $ 116 $ 460 $ 13,079
December 31, 2014 4,335
374
9
4,700 Trading equity securities $ $ $ $
Trading debt securities 8,573 107 71 8,609 Total $ 12,908 $ 481 $ 80
$ 13,309
Trading equity investments are valued at their estimated fair value based on their quoted market prices and trading debt securities are valued based upon a mix of observable market prices and model driven prices derived from a matrix of observable market prices for assets with similar characteristics obtained from a nationally recognized third party pricing service. Additionally, a significant portion of the trading equity securities are in equity money market and mutual funds and also comprise a portion of the Company’s liability under its SERP. See Note 12, Pension and Retirement Plans, for additional information on these investments and the SERP. Trading debt securities are comprised mainly of marketable debt securities held by Astec Insurance. Astec Insurance has an investment strategy that focuses on providing regular and predictable interest income from a diversified portfolio of high-quality fixed income securities. Net unrealized gains or losses incurred on investments still held as of the end of each reporting period amounted to losses of $429 and $17 in 2015 and 2014, respectively, and a gain of $175 in 2013. 5. Goodwill
Goodwill represents the excess of the purchase price over the fair value of identifiable net assets acquired in business combinations. Current U.S. accounting guidance provides that goodwill and indefinite-lived intangible assets be tested for impairment at least annually. The Company performs the required valuation procedures each year as of December 31 after the following year’s forecasts are submitted and reviewed. The valuations performed in 2015, 2014 and 2013 indicated no impairment of goodwill. The changes in the carrying amount of goodwill by reporting segment during the years ended December 31, 2015 and 2014 are as follows:
Infrastructure
Group Aggregate and Mining Group Energy Group Corporate Total
Balance, December 31, 2013 $ 8,719 $ 6,338 $ -- $ -- $ 15,057 Acquisition -- 18,256 -- -- 18,256 Foreign currency translation (135) (1,183) -- -- (1,318) Balance, December 31, 2014 8,584 23,411 -- -- 31,995 Purchase price adjustment -- (178) -- -- (178) Foreign currency translation (103) (879) -- -- (982) Balance, December 31, 2015 $ 8,481 $ 22,354 $ -- $ -- $
30,835
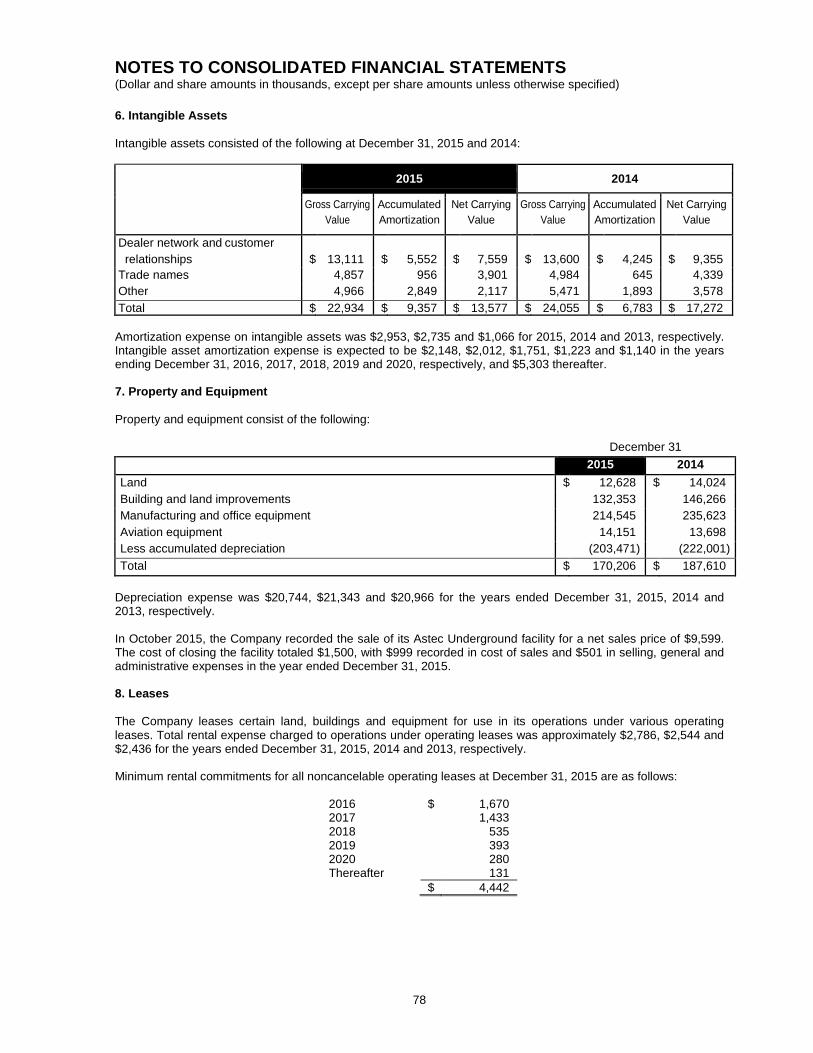
NOTES TO CONSOLIDATED FINANCIAL STATEMENTS (Dollar and share amounts in thousands, except per share amounts unless otherwise specified)
78
6. Intangible Assets Intangible assets consisted of the following at December 31, 2015 and 2014:
2015 2014
Gross Carrying
Value Accumulated Amortization
Net Carrying Value
Gross Carrying Value
Accumulated Amortization
Net Carrying Value
Dealer network and customer relationships
$
13,111
$
5,552
$
7,559
$
13,600
$
4,245
$
9,355
Trade names 4,857 956 3,901 4,984 645 4,339 Other 4,966 2,849 2,117 5,471 1,893 3,578 Total $ 22,934 $ 9,357 $ 13,577 $ 24,055 $ 6,783 $ 17,272
Amortization expense on intangible assets was $2,953, $2,735 and $1,066 for 2015, 2014 and 2013, respectively. Intangible asset amortization expense is expected to be $2,148, $2,012, $1,751, $1,223 and $1,140 in the years ending December 31, 2016, 2017, 2018, 2019 and 2020, respectively, and $5,303 thereafter.
7. Property and Equipment
Property and equipment consist of the following: December 31 2015 2014 Land $ 12,628 $ 14,024 Building and land improvements 132,353 146,266 Manufacturing and office equipment 214,545 235,623 Aviation equipment 14,151 13,698 Less accumulated depreciation (203,471) (222,001) Total $ 170,206 $ 187,610
Depreciation expense was $20,744, $21,343 and $20,966 for the years ended December 31, 2015, 2014 and 2013, respectively. In October 2015, the Company recorded the sale of its Astec Underground facility for a net sales price of $9,599. The cost of closing the facility totaled $1,500, with $999 recorded in cost of sales and $501 in selling, general and administrative expenses in the year ended December 31, 2015.
8. Leases
The Company leases certain land, buildings and equipment for use in its operations under various operating leases. Total rental expense charged to operations under operating leases was approximately $2,786, $2,544 and $2,436 for the years ended December 31, 2015, 2014 and 2013, respectively.
Minimum rental commitments for all noncancelable operating leases at December 31, 2015 are as follows:
2016 $ 1,670 2017 1,433 2018 535 2019 393 2020 280 Thereafter 131 $ 4,442
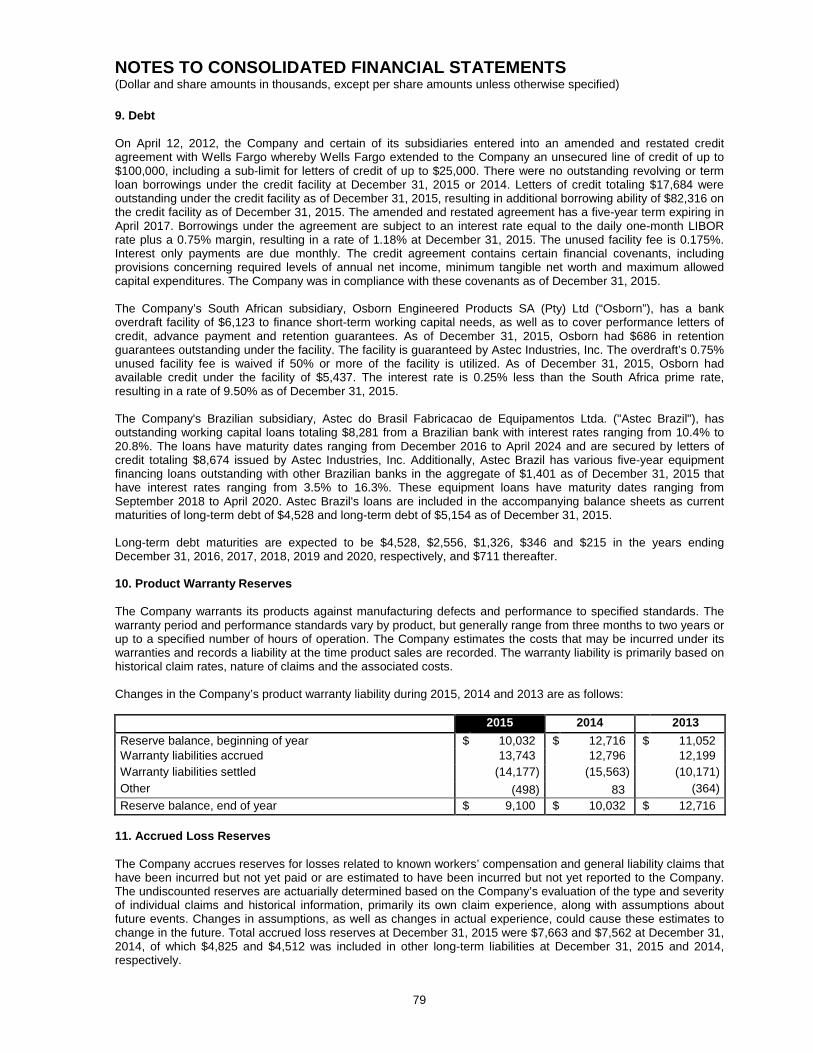
NOTES TO CONSOLIDATED FINANCIAL STATEMENTS (Dollar and share amounts in thousands, except per share amounts unless otherwise specified)
79
9. Debt
On April 12, 2012, the Company and certain of its subsidiaries entered into an amended and restated credit agreement with Wells Fargo whereby Wells Fargo extended to the Company an unsecured line of credit of up to $100,000, including a sub-limit for letters of credit of up to $25,000. There were no outstanding revolving or term loan borrowings under the credit facility at December 31, 2015 or 2014. Letters of credit totaling $17,684 were outstanding under the credit facility as of December 31, 2015, resulting in additional borrowing ability of $82,316 on the credit facility as of December 31, 2015. The amended and restated agreement has a five-year term expiring in April 2017. Borrowings under the agreement are subject to an interest rate equal to the daily one-month LIBOR rate plus a 0.75% margin, resulting in a rate of 1.18% at December 31, 2015. The unused facility fee is 0.175%. Interest only payments are due monthly. The credit agreement contains certain financial covenants, including provisions concerning required levels of annual net income, minimum tangible net worth and maximum allowed capital expenditures. The Company was in compliance with these covenants as of December 31, 2015. The Company’s South African subsidiary, Osborn Engineered Products SA (Pty) Ltd (“Osborn”), has a bank overdraft facility of $6,123 to finance short-term working capital needs, as well as to cover performance letters of credit, advance payment and retention guarantees. As of December 31, 2015, Osborn had $686 in retention guarantees outstanding under the facility. The facility is guaranteed by Astec Industries, Inc. The overdraft’s 0.75% unused facility fee is waived if 50% or more of the facility is utilized. As of December 31, 2015, Osborn had available credit under the facility of $5,437. The interest rate is 0.25% less than the South Africa prime rate, resulting in a rate of 9.50% as of December 31, 2015. The Company's Brazilian subsidiary, Astec do Brasil Fabricacao de Equipamentos Ltda. ("Astec Brazil"), has outstanding working capital loans totaling $8,281 from a Brazilian bank with interest rates ranging from 10.4% to 20.8%. The loans have maturity dates ranging from December 2016 to April 2024 and are secured by letters of credit totaling $8,674 issued by Astec Industries, Inc. Additionally, Astec Brazil has various five-year equipment financing loans outstanding with other Brazilian banks in the aggregate of $1,401 as of December 31, 2015 that have interest rates ranging from 3.5% to 16.3%. These equipment loans have maturity dates ranging from September 2018 to April 2020. Astec Brazil's loans are included in the accompanying balance sheets as current maturities of long-term debt of $4,528 and long-term debt of $5,154 as of December 31, 2015. Long-term debt maturities are expected to be $4,528, $2,556, $1,326, $346 and $215 in the years ending December 31, 2016, 2017, 2018, 2019 and 2020, respectively, and $711 thereafter. 10. Product Warranty Reserves
The Company warrants its products against manufacturing defects and performance to specified standards. The warranty period and performance standards vary by product, but generally range from three months to two years or up to a specified number of hours of operation. The Company estimates the costs that may be incurred under its warranties and records a liability at the time product sales are recorded. The warranty liability is primarily based on historical claim rates, nature of claims and the associated costs.
Changes in the Company’s product warranty liability during 2015, 2014 and 2013 are as follows: 2015 2014 2013 Reserve balance, beginning of year $ 10,032 $ 12,716 $ 11,052 Warranty liabilities accrued 13,743 12,796 12,199 Warranty liabilities settled (14,177) (15,563) (10,171) Other (498) 83 (364) Reserve balance, end of year $ 9,100 $ 10,032 $ 12,716
11. Accrued Loss Reserves
The Company accrues reserves for losses related to known workers’ compensation and general liability claims that have been incurred but not yet paid or are estimated to have been incurred but not yet reported to the Company. The undiscounted reserves are actuarially determined based on the Company’s evaluation of the type and severity of individual claims and historical information, primarily its own claim experience, along with assumptions about future events. Changes in assumptions, as well as changes in actual experience, could cause these estimates to change in the future. Total accrued loss reserves at December 31, 2015 were $7,663 and $7,562 at December 31, 2014, of which $4,825 and $4,512 was included in other long-term liabilities at December 31, 2015 and 2014, respectively.
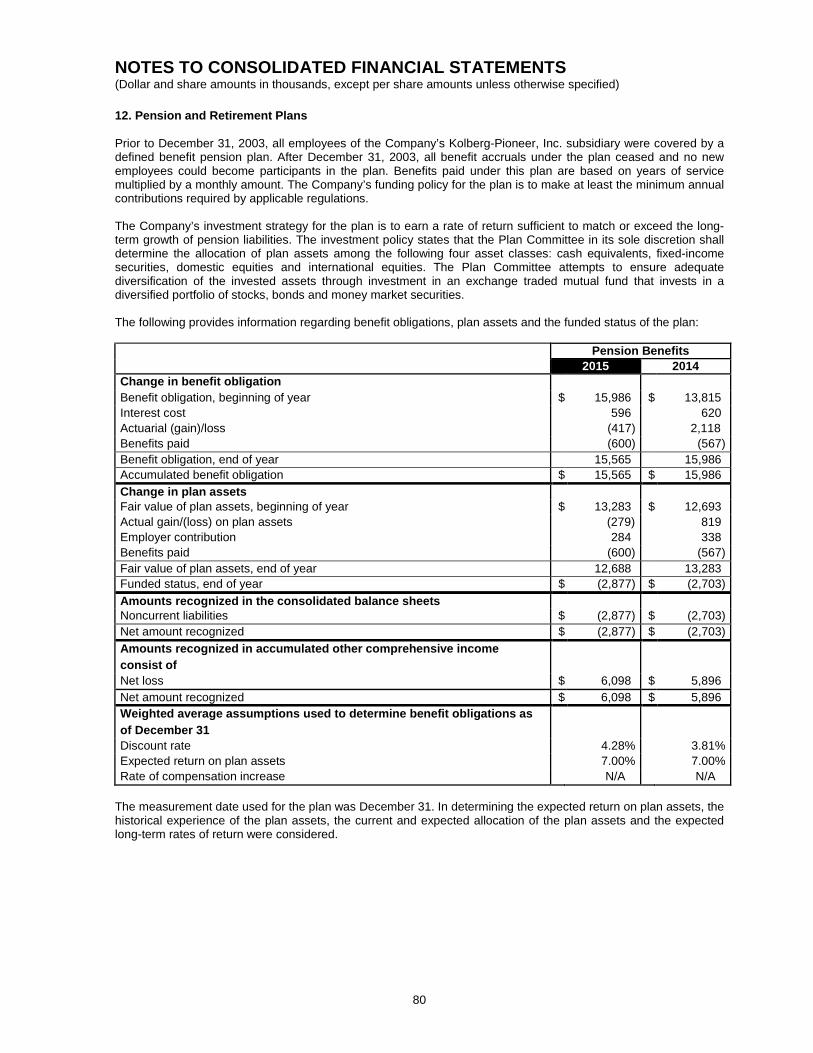
NOTES TO CONSOLIDATED FINANCIAL STATEMENTS (Dollar and share amounts in thousands, except per share amounts unless otherwise specified)
80
12. Pension and Retirement Plans
Prior to December 31, 2003, all employees of the Company’s Kolberg-Pioneer, Inc. subsidiary were covered by a defined benefit pension plan. After December 31, 2003, all benefit accruals under the plan ceased and no new employees could become participants in the plan. Benefits paid under this plan are based on years of service multiplied by a monthly amount. The Company’s funding policy for the plan is to make at least the minimum annual contributions required by applicable regulations.
The Company’s investment strategy for the plan is to earn a rate of return sufficient to match or exceed the long- term growth of pension liabilities. The investment policy states that the Plan Committee in its sole discretion shall determine the allocation of plan assets among the following four asset classes: cash equivalents, fixed-income securities, domestic equities and international equities. The Plan Committee attempts to ensure adequate diversification of the invested assets through investment in an exchange traded mutual fund that invests in a diversified portfolio of stocks, bonds and money market securities. The following provides information regarding benefit obligations, plan assets and the funded status of the plan: Pension Benefits 2015 2014 Change in benefit obligation Benefit obligation, beginning of year $ 15,986 $ 13,815 Interest cost 596 620 Actuarial (gain)/loss (417) 2,118 Benefits paid (600) (567) Benefit obligation, end of year 15,565 15,986 Accumulated benefit obligation $ 15,565 $ 15,986 Change in plan assets Fair value of plan assets, beginning of year $ 13,283 $ 12,693 Actual gain/(loss) on plan assets (279) 819 Employer contribution 284 338 Benefits paid (600) (567) Fair value of plan assets, end of year 12,688 13,283 Funded status, end of year $ (2,877) $ (2,703) Amounts recognized in the consolidated balance sheets Noncurrent liabilities $ (2,877) $ (2,703) Net amount recognized $ (2,877) $ (2,703) Amounts recognized in accumulated other comprehensive income consist of
Net loss $ 6,098 $ 5,896 Net amount recognized $ 6,098 $ 5,896 Weighted average assumptions used to determine benefit obligations as of December 31
Discount rate 4.28% 3.81% Expected return on plan assets 7.00% 7.00% Rate of compensation increase N/A N/A
The measurement date used for the plan was December 31. In determining the expected return on plan assets, the historical experience of the plan assets, the current and expected allocation of the plan assets and the expected long-term rates of return were considered.
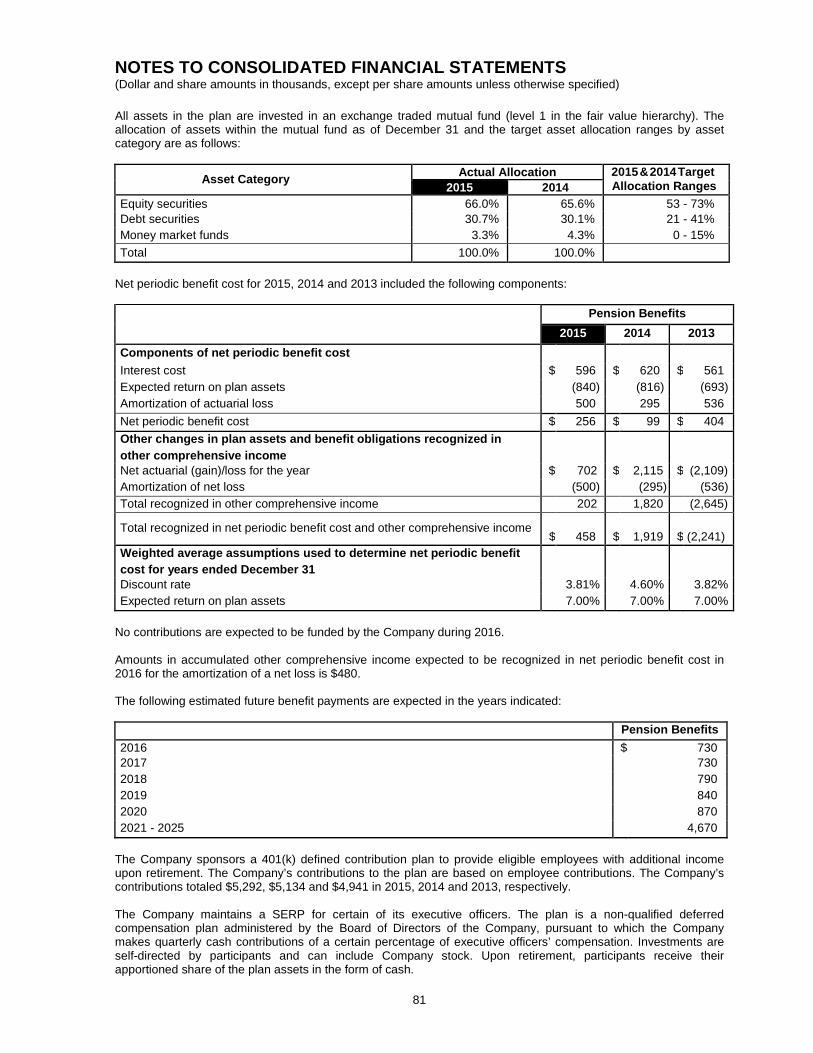
NOTES TO CONSOLIDATED FINANCIAL STATEMENTS (Dollar and share amounts in thousands, except per share amounts unless otherwise specified)
81
All assets in the plan are invested in an exchange traded mutual fund (level 1 in the fair value hierarchy). The allocation of assets within the mutual fund as of December 31 and the target asset allocation ranges by asset category are as follows:
Asset Category Actual Allocation 2015 & 2014 Target Allocation Ranges 2015 2014
Equity securities 66.0% 65.6% 53 - 73% Debt securities 30.7% 30.1% 21 - 41% Money market funds 3.3% 4.3% 0 - 15% Total 100.0% 100.0%
Net periodic benefit cost for 2015, 2014 and 2013 included the following components: Pension Benefits
2015 2014 2013 Components of net periodic benefit cost Interest cost $ 596 $ 620 $ 561 Expected return on plan assets (840) (816) (693) Amortization of actuarial loss 500 295 536 Net periodic benefit cost $ 256 $ 99 $ 404 Other changes in plan assets and benefit obligations recognized in other comprehensive income Net actuarial (gain)/loss for the year $ 702 $ 2,115 $ (2,109) Amortization of net loss (500) (295) (536) Total recognized in other comprehensive income 202 1,820 (2,645) Total recognized in net periodic benefit cost and other comprehensive income
$
458
$
1,919
$
(2,241) Weighted average assumptions used to determine net periodic benefit cost for years ended December 31 Discount rate 3.81% 4.60% 3.82% Expected return on plan assets 7.00% 7.00% 7.00%
No contributions are expected to be funded by the Company during 2016. Amounts in accumulated other comprehensive income expected to be recognized in net periodic benefit cost in 2016 for the amortization of a net loss is $480.
The following estimated future benefit payments are expected in the years indicated: Pension Benefits 2016 $ 730 2017 730 2018 790 2019 840 2020 870 2021 - 2025 4,670
The Company sponsors a 401(k) defined contribution plan to provide eligible employees with additional income upon retirement. The Company’s contributions to the plan are based on employee contributions. The Company’s contributions totaled $5,292, $5,134 and $4,941 in 2015, 2014 and 2013, respectively. The Company maintains a SERP for certain of its executive officers. The plan is a non-qualified deferred compensation plan administered by the Board of Directors of the Company, pursuant to which the Company makes quarterly cash contributions of a certain percentage of executive officers’ compensation. Investments are self-directed by participants and can include Company stock. Upon retirement, participants receive their apportioned share of the plan assets in the form of cash.
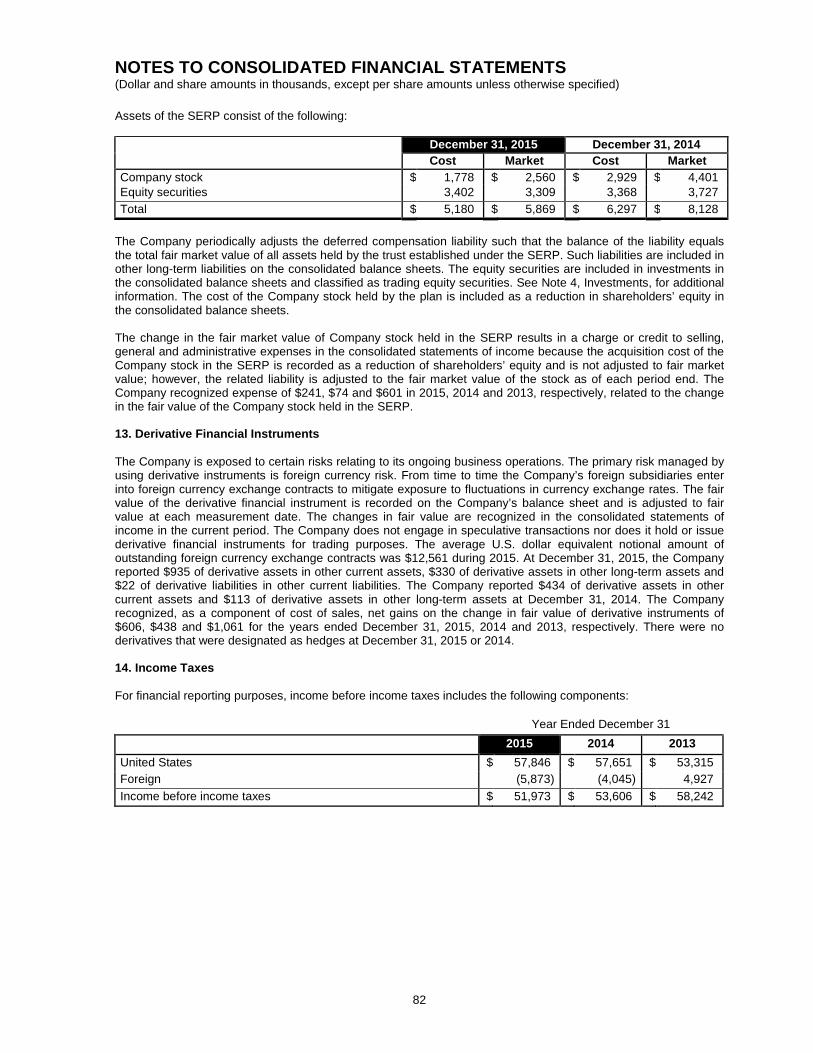
NOTES TO CONSOLIDATED FINANCIAL STATEMENTS (Dollar and share amounts in thousands, except per share amounts unless otherwise specified)
82
Assets of the SERP consist of the following: December 31, 2015 December 31, 2014 Cost Market Cost Market Company stock $ 1,778 $ 2,560 $ 2,929 $ 4,401 Equity securities 3,402 3,309 3,368 3,727 Total $ 5,180 $ 5,869 $ 6,297 $ 8,128
The Company periodically adjusts the deferred compensation liability such that the balance of the liability equals the total fair market value of all assets held by the trust established under the SERP. Such liabilities are included in other long-term liabilities on the consolidated balance sheets. The equity securities are included in investments in the consolidated balance sheets and classified as trading equity securities. See Note 4, Investments, for additional information. The cost of the Company stock held by the plan is included as a reduction in shareholders’ equity in the consolidated balance sheets. The change in the fair market value of Company stock held in the SERP results in a charge or credit to selling, general and administrative expenses in the consolidated statements of income because the acquisition cost of the Company stock in the SERP is recorded as a reduction of shareholders’ equity and is not adjusted to fair market value; however, the related liability is adjusted to the fair market value of the stock as of each period end. The Company recognized expense of $241, $74 and $601 in 2015, 2014 and 2013, respectively, related to the change in the fair value of the Company stock held in the SERP. 13. Derivative Financial Instruments The Company is exposed to certain risks relating to its ongoing business operations. The primary risk managed by using derivative instruments is foreign currency risk. From time to time the Company’s foreign subsidiaries enter into foreign currency exchange contracts to mitigate exposure to fluctuations in currency exchange rates. The fair value of the derivative financial instrument is recorded on the Company’s balance sheet and is adjusted to fair value at each measurement date. The changes in fair value are recognized in the consolidated statements of income in the current period. The Company does not engage in speculative transactions nor does it hold or issue derivative financial instruments for trading purposes. The average U.S. dollar equivalent notional amount of outstanding foreign currency exchange contracts was $12,561 during 2015. At December 31, 2015, the Company reported $935 of derivative assets in other current assets, $330 of derivative assets in other long-term assets and $22 of derivative liabilities in other current liabilities. The Company reported $434 of derivative assets in other current assets and $113 of derivative assets in other long-term assets at December 31, 2014. The Company recognized, as a component of cost of sales, net gains on the change in fair value of derivative instruments of $606, $438 and $1,061 for the years ended December 31, 2015, 2014 and 2013, respectively. There were no derivatives that were designated as hedges at December 31, 2015 or 2014. 14. Income Taxes
For financial reporting purposes, income before income taxes includes the following components: Year Ended December 31
2015 2014 2013 United States $ 57,846 $ 57,651 $ 53,315 Foreign (5,873) (4,045) 4,927 Income before income taxes $ 51,973 $ 53,606 $ 58,242
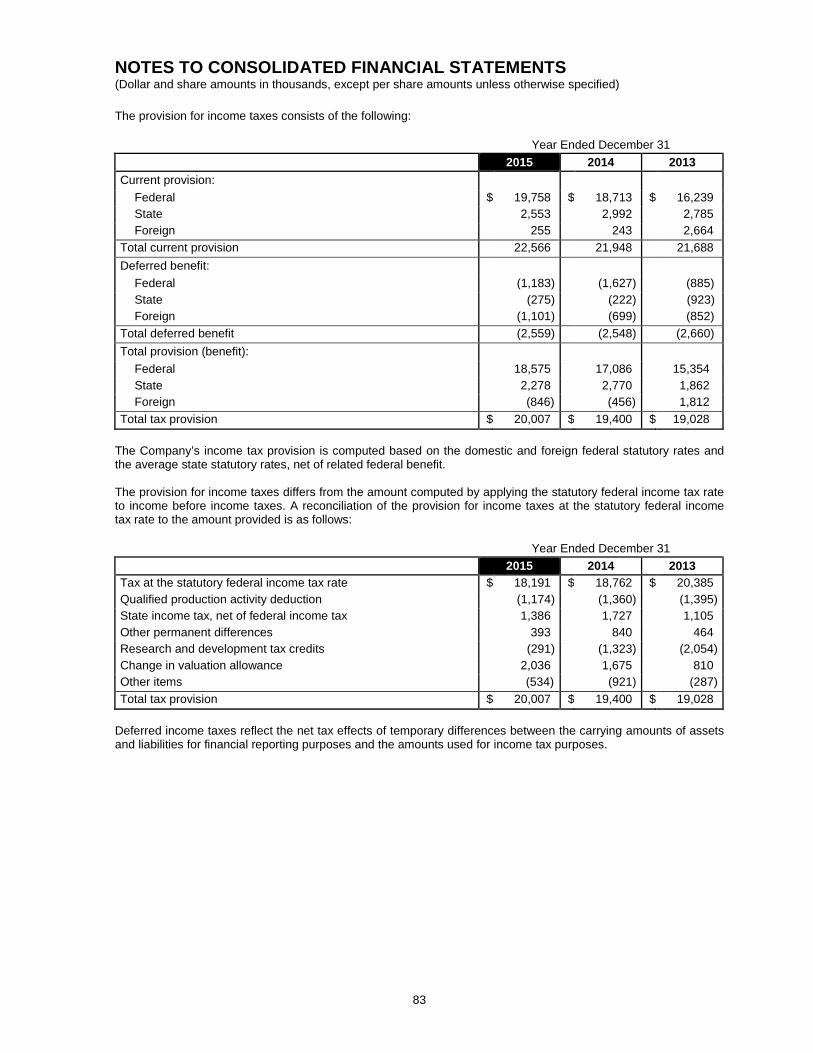
NOTES TO CONSOLIDATED FINANCIAL STATEMENTS (Dollar and share amounts in thousands, except per share amounts unless otherwise specified)
83
The provision for income taxes consists of the following: Year Ended December 31 2015 2014 2013 Current provision:
Federal $ 19,758 $ 18,713 $ 16,239 State 2,553 2,992 2,785 Foreign 255 243 2,664
Total current provision 22,566 21,948 21,688 Deferred benefit:
Federal (1,183) (1,627) (885) State (275) (222) (923) Foreign (1,101) (699) (852)
Total deferred benefit (2,559) (2,548) (2,660) Total provision (benefit):
Federal 18,575 17,086 15,354 State 2,278 2,770 1,862 Foreign (846) (456) 1,812
Total tax provision $ 20,007 $ 19,400 $ 19,028 The Company’s income tax provision is computed based on the domestic and foreign federal statutory rates and the average state statutory rates, net of related federal benefit. The provision for income taxes differs from the amount computed by applying the statutory federal income tax rate to income before income taxes. A reconciliation of the provision for income taxes at the statutory federal income tax rate to the amount provided is as follows: Year Ended December 31 2015 2014 2013 Tax at the statutory federal income tax rate $ 18,191 $ 18,762 $ 20,385 Qualified production activity deduction (1,174) (1,360) (1,395) State income tax, net of federal income tax 1,386 1,727 1,105 Other permanent differences 393 840 464 Research and development tax credits (291) (1,323) (2,054) Change in valuation allowance 2,036 1,675 810 Other items (534) (921) (287) Total tax provision $ 20,007 $ 19,400 $ 19,028
Deferred income taxes reflect the net tax effects of temporary differences between the carrying amounts of assets and liabilities for financial reporting purposes and the amounts used for income tax purposes.
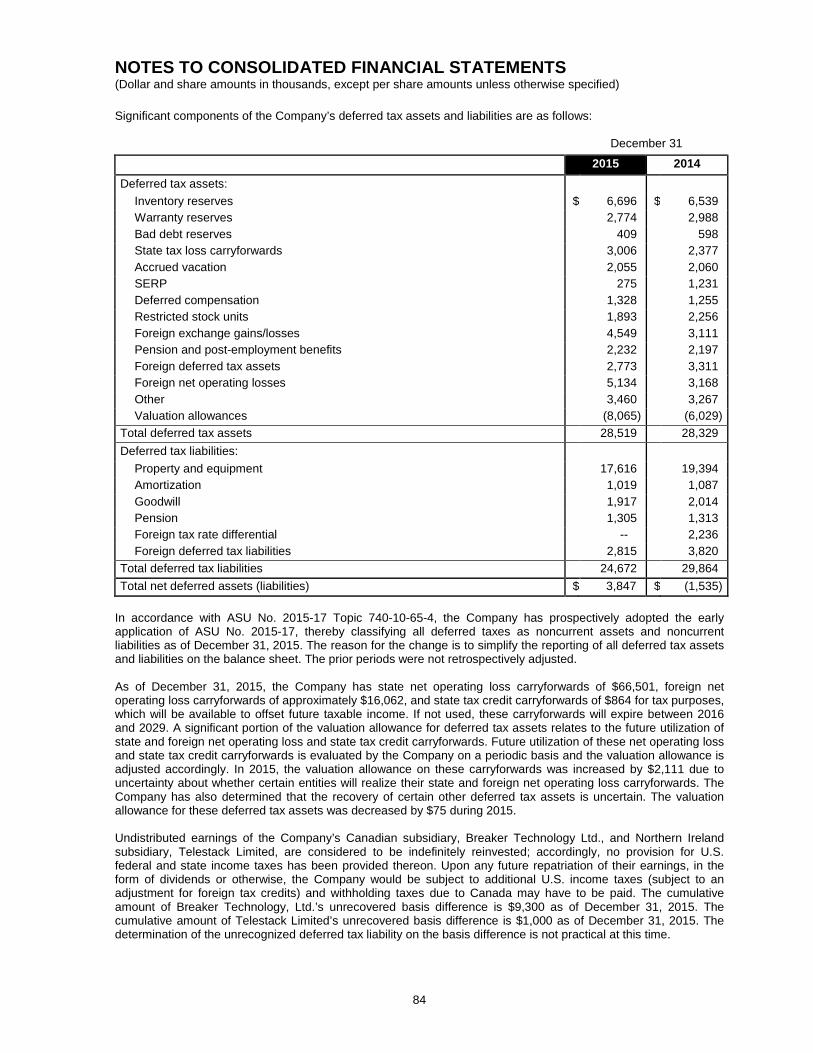
NOTES TO CONSOLIDATED FINANCIAL STATEMENTS (Dollar and share amounts in thousands, except per share amounts unless otherwise specified)
84
Significant components of the Company’s deferred tax assets and liabilities are as follows: December 31
2015 2014 Deferred tax assets:
Inventory reserves $ 6,696 $ 6,539 Warranty reserves 2,774 2,988 Bad debt reserves 409 598 State tax loss carryforwards 3,006 2,377 Accrued vacation 2,055 2,060 SERP 275 1,231 Deferred compensation 1,328 1,255 Restricted stock units 1,893 2,256 Foreign exchange gains/losses 4,549 3,111 Pension and post-employment benefits 2,232 2,197 Foreign deferred tax assets 2,773 3,311 Foreign net operating losses 5,134 3,168 Other 3,460 3,267 Valuation allowances (8,065) (6,029)
Total deferred tax assets 28,519 28,329 Deferred tax liabilities:
Property and equipment 17,616 19,394 Amortization 1,019 1,087 Goodwill 1,917 2,014 Pension 1,305 1,313 Foreign tax rate differential -- 2,236 Foreign deferred tax liabilities 2,815 3,820
Total deferred tax liabilities 24,672 29,864 Total net deferred assets (liabilities) $ 3,847 $ (1,535)
In accordance with ASU No. 2015-17 Topic 740-10-65-4, the Company has prospectively adopted the early application of ASU No. 2015-17, thereby classifying all deferred taxes as noncurrent assets and noncurrent liabilities as of December 31, 2015. The reason for the change is to simplify the reporting of all deferred tax assets and liabilities on the balance sheet. The prior periods were not retrospectively adjusted. As of December 31, 2015, the Company has state net operating loss carryforwards of $66,501, foreign net operating loss carryforwards of approximately $16,062, and state tax credit carryforwards of $864 for tax purposes, which will be available to offset future taxable income. If not used, these carryforwards will expire between 2016 and 2029. A significant portion of the valuation allowance for deferred tax assets relates to the future utilization of state and foreign net operating loss and state tax credit carryforwards. Future utilization of these net operating loss and state tax credit carryforwards is evaluated by the Company on a periodic basis and the valuation allowance is adjusted accordingly. In 2015, the valuation allowance on these carryforwards was increased by $2,111 due to uncertainty about whether certain entities will realize their state and foreign net operating loss carryforwards. The Company has also determined that the recovery of certain other deferred tax assets is uncertain. The valuation allowance for these deferred tax assets was decreased by $75 during 2015. Undistributed earnings of the Company’s Canadian subsidiary, Breaker Technology Ltd., and Northern Ireland subsidiary, Telestack Limited, are considered to be indefinitely reinvested; accordingly, no provision for U.S. federal and state income taxes has been provided thereon. Upon any future repatriation of their earnings, in the form of dividends or otherwise, the Company would be subject to additional U.S. income taxes (subject to an adjustment for foreign tax credits) and withholding taxes due to Canada may have to be paid. The cumulative amount of Breaker Technology, Ltd.’s unrecovered basis difference is $9,300 as of December 31, 2015. The cumulative amount of Telestack Limited’s unrecovered basis difference is $1,000 as of December 31, 2015. The determination of the unrecognized deferred tax liability on the basis difference is not practical at this time.
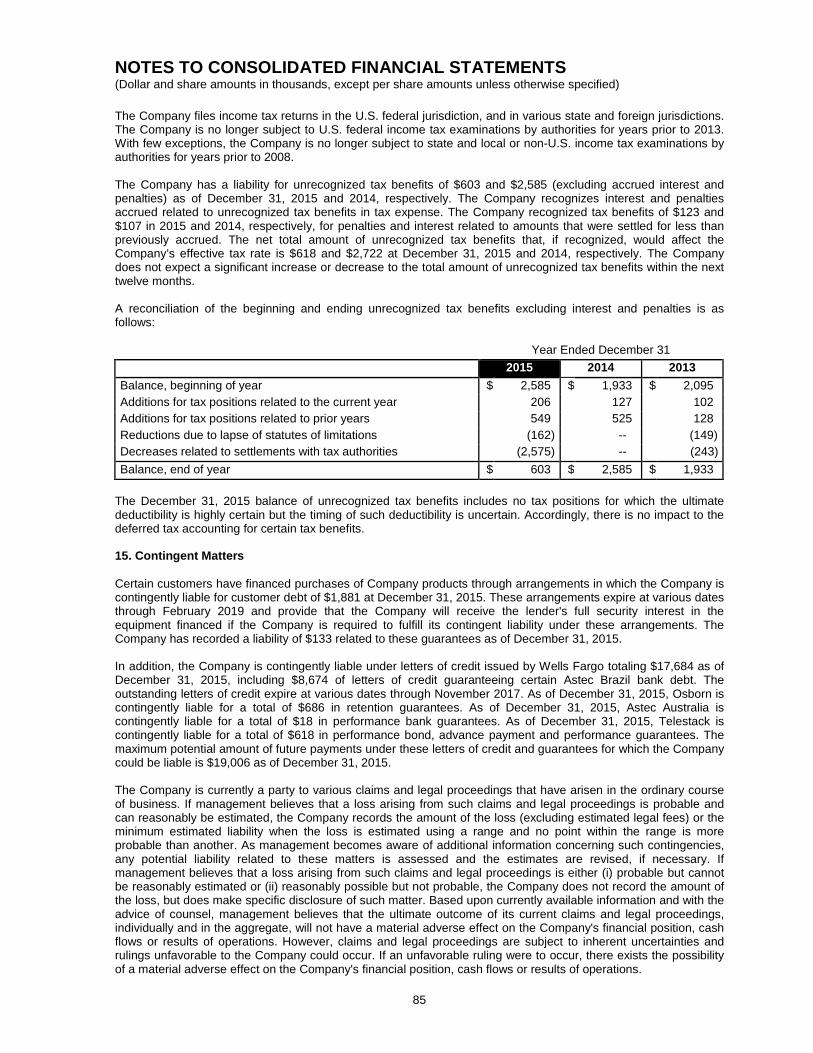
NOTES TO CONSOLIDATED FINANCIAL STATEMENTS (Dollar and share amounts in thousands, except per share amounts unless otherwise specified)
85
The Company files income tax returns in the U.S. federal jurisdiction, and in various state and foreign jurisdictions. The Company is no longer subject to U.S. federal income tax examinations by authorities for years prior to 2013. With few exceptions, the Company is no longer subject to state and local or non-U.S. income tax examinations by authorities for years prior to 2008. The Company has a liability for unrecognized tax benefits of $603 and $2,585 (excluding accrued interest and penalties) as of December 31, 2015 and 2014, respectively. The Company recognizes interest and penalties accrued related to unrecognized tax benefits in tax expense. The Company recognized tax benefits of $123 and $107 in 2015 and 2014, respectively, for penalties and interest related to amounts that were settled for less than previously accrued. The net total amount of unrecognized tax benefits that, if recognized, would affect the Company’s effective tax rate is $618 and $2,722 at December 31, 2015 and 2014, respectively. The Company does not expect a significant increase or decrease to the total amount of unrecognized tax benefits within the next twelve months.
A reconciliation of the beginning and ending unrecognized tax benefits excluding interest and penalties is as follows: Year Ended December 31 2015 2014 2013 Balance, beginning of year $ 2,585 $ 1,933 $ 2,095 Additions for tax positions related to the current year 206 127 102 Additions for tax positions related to prior years 549 525 128 Reductions due to lapse of statutes of limitations (162) -- (149) Decreases related to settlements with tax authorities (2,575) -- (243) Balance, end of year $ 603 $ 2,585 $ 1,933
The December 31, 2015 balance of unrecognized tax benefits includes no tax positions for which the ultimate deductibility is highly certain but the timing of such deductibility is uncertain. Accordingly, there is no impact to the deferred tax accounting for certain tax benefits. 15. Contingent Matters Certain customers have financed purchases of Company products through arrangements in which the Company is contingently liable for customer debt of $1,881 at December 31, 2015. These arrangements expire at various dates through February 2019 and provide that the Company will receive the lender's full security interest in the equipment financed if the Company is required to fulfill its contingent liability under these arrangements. The Company has recorded a liability of $133 related to these guarantees as of December 31, 2015. In addition, the Company is contingently liable under letters of credit issued by Wells Fargo totaling $17,684 as of December 31, 2015, including $8,674 of letters of credit guaranteeing certain Astec Brazil bank debt. The outstanding letters of credit expire at various dates through November 2017. As of December 31, 2015, Osborn is contingently liable for a total of $686 in retention guarantees. As of December 31, 2015, Astec Australia is contingently liable for a total of $18 in performance bank guarantees. As of December 31, 2015, Telestack is contingently liable for a total of $618 in performance bond, advance payment and performance guarantees. The maximum potential amount of future payments under these letters of credit and guarantees for which the Company could be liable is $19,006 as of December 31, 2015. The Company is currently a party to various claims and legal proceedings that have arisen in the ordinary course of business. If management believes that a loss arising from such claims and legal proceedings is probable and can reasonably be estimated, the Company records the amount of the loss (excluding estimated legal fees) or the minimum estimated liability when the loss is estimated using a range and no point within the range is more probable than another. As management becomes aware of additional information concerning such contingencies, any potential liability related to these matters is assessed and the estimates are revised, if necessary. If management believes that a loss arising from such claims and legal proceedings is either (i) probable but cannot be reasonably estimated or (ii) reasonably possible but not probable, the Company does not record the amount of the loss, but does make specific disclosure of such matter. Based upon currently available information and with the advice of counsel, management believes that the ultimate outcome of its current claims and legal proceedings, individually and in the aggregate, will not have a material adverse effect on the Company's financial position, cash flows or results of operations. However, claims and legal proceedings are subject to inherent uncertainties and rulings unfavorable to the Company could occur. If an unfavorable ruling were to occur, there exists the possibility of a material adverse effect on the Company's financial position, cash flows or results of operations.
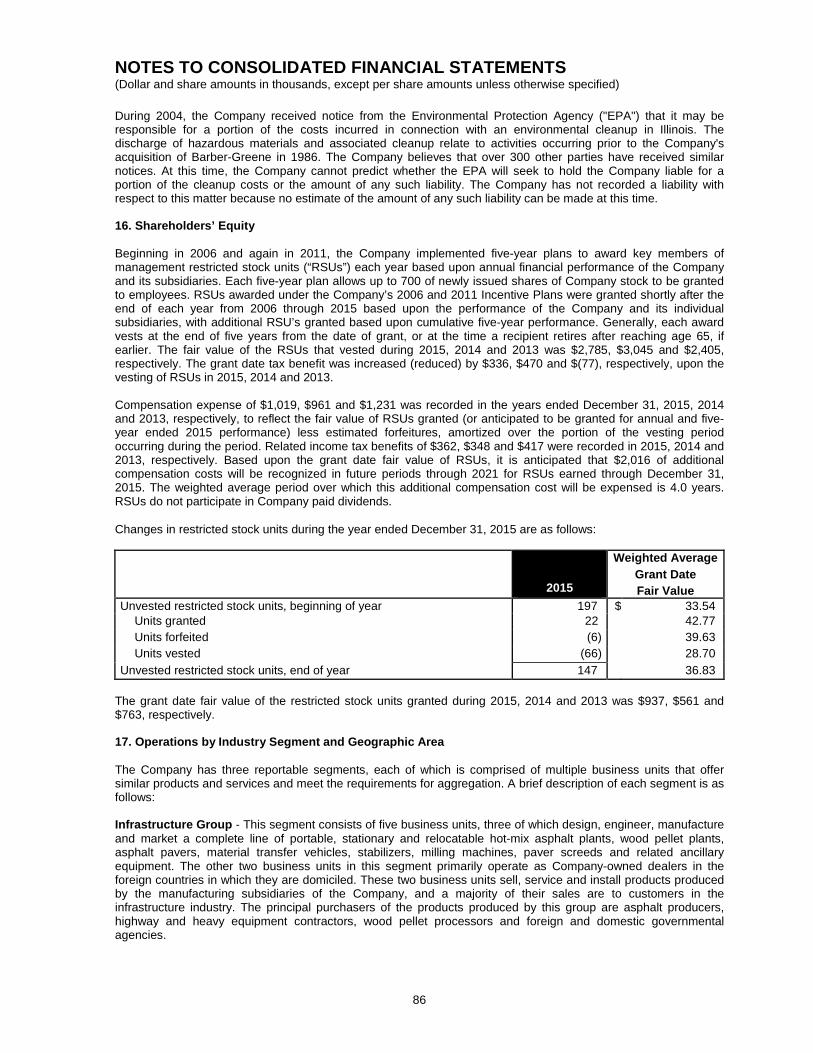
NOTES TO CONSOLIDATED FINANCIAL STATEMENTS (Dollar and share amounts in thousands, except per share amounts unless otherwise specified)
86
During 2004, the Company received notice from the Environmental Protection Agency ("EPA") that it may be responsible for a portion of the costs incurred in connection with an environmental cleanup in Illinois. The discharge of hazardous materials and associated cleanup relate to activities occurring prior to the Company's acquisition of Barber-Greene in 1986. The Company believes that over 300 other parties have received similar notices. At this time, the Company cannot predict whether the EPA will seek to hold the Company liable for a portion of the cleanup costs or the amount of any such liability. The Company has not recorded a liability with respect to this matter because no estimate of the amount of any such liability can be made at this time. 16. Shareholders’ Equity Beginning in 2006 and again in 2011, the Company implemented five-year plans to award key members of management restricted stock units (“RSUs”) each year based upon annual financial performance of the Company and its subsidiaries. Each five-year plan allows up to 700 of newly issued shares of Company stock to be granted to employees. RSUs awarded under the Company’s 2006 and 2011 Incentive Plans were granted shortly after the end of each year from 2006 through 2015 based upon the performance of the Company and its individual subsidiaries, with additional RSU’s granted based upon cumulative five-year performance. Generally, each award vests at the end of five years from the date of grant, or at the time a recipient retires after reaching age 65, if earlier. The fair value of the RSUs that vested during 2015, 2014 and 2013 was $2,785, $3,045 and $2,405, respectively. The grant date tax benefit was increased (reduced) by $336, $470 and $(77), respectively, upon the vesting of RSUs in 2015, 2014 and 2013. Compensation expense of $1,019, $961 and $1,231 was recorded in the years ended December 31, 2015, 2014 and 2013, respectively, to reflect the fair value of RSUs granted (or anticipated to be granted for annual and five-year ended 2015 performance) less estimated forfeitures, amortized over the portion of the vesting period occurring during the period. Related income tax benefits of $362, $348 and $417 were recorded in 2015, 2014 and 2013, respectively. Based upon the grant date fair value of RSUs, it is anticipated that $2,016 of additional compensation costs will be recognized in future periods through 2021 for RSUs earned through December 31, 2015. The weighted average period over which this additional compensation cost will be expensed is 4.0 years. RSUs do not participate in Company paid dividends. Changes in restricted stock units during the year ended December 31, 2015 are as follows:
2015
Weighted Average Grant Date Fair Value
Unvested restricted stock units, beginning of year 197 $ 33.54 Units granted 22 42.77 Units forfeited (6) 39.63 Units vested (66) 28.70
Unvested restricted stock units, end of year 147 36.83 The grant date fair value of the restricted stock units granted during 2015, 2014 and 2013 was $937, $561 and $763, respectively.
17. Operations by Industry Segment and Geographic Area
The Company has three reportable segments, each of which is comprised of multiple business units that offer similar products and services and meet the requirements for aggregation. A brief description of each segment is as follows: Infrastructure Group - This segment consists of five business units, three of which design, engineer, manufacture and market a complete line of portable, stationary and relocatable hot-mix asphalt plants, wood pellet plants, asphalt pavers, material transfer vehicles, stabilizers, milling machines, paver screeds and related ancillary equipment. The other two business units in this segment primarily operate as Company-owned dealers in the foreign countries in which they are domiciled. These two business units sell, service and install products produced by the manufacturing subsidiaries of the Company, and a majority of their sales are to customers in the infrastructure industry. The principal purchasers of the products produced by this group are asphalt producers, highway and heavy equipment contractors, wood pellet processors and foreign and domestic governmental agencies.
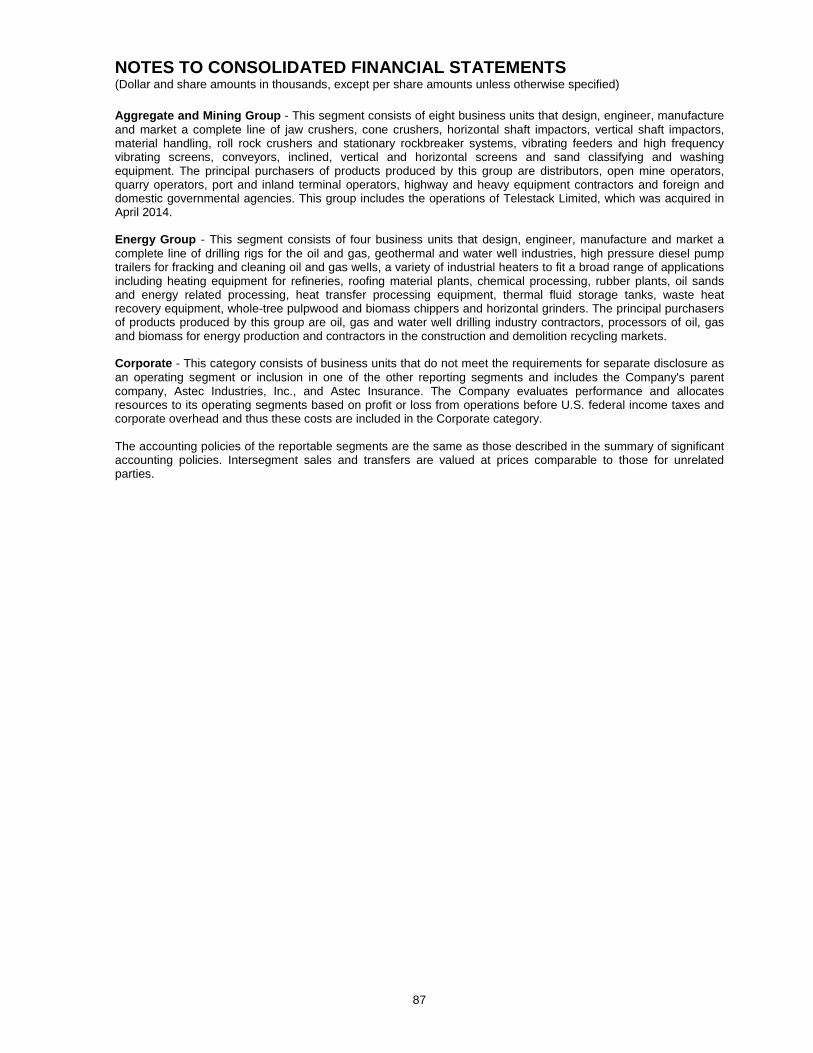
NOTES TO CONSOLIDATED FINANCIAL STATEMENTS (Dollar and share amounts in thousands, except per share amounts unless otherwise specified)
87
Aggregate and Mining Group - This segment consists of eight business units that design, engineer, manufacture and market a complete line of jaw crushers, cone crushers, horizontal shaft impactors, vertical shaft impactors, material handling, roll rock crushers and stationary rockbreaker systems, vibrating feeders and high frequency vibrating screens, conveyors, inclined, vertical and horizontal screens and sand classifying and washing equipment. The principal purchasers of products produced by this group are distributors, open mine operators, quarry operators, port and inland terminal operators, highway and heavy equipment contractors and foreign and domestic governmental agencies. This group includes the operations of Telestack Limited, which was acquired in April 2014. Energy Group - This segment consists of four business units that design, engineer, manufacture and market a complete line of drilling rigs for the oil and gas, geothermal and water well industries, high pressure diesel pump trailers for fracking and cleaning oil and gas wells, a variety of industrial heaters to fit a broad range of applications including heating equipment for refineries, roofing material plants, chemical processing, rubber plants, oil sands and energy related processing, heat transfer processing equipment, thermal fluid storage tanks, waste heat recovery equipment, whole-tree pulpwood and biomass chippers and horizontal grinders. The principal purchasers of products produced by this group are oil, gas and water well drilling industry contractors, processors of oil, gas and biomass for energy production and contractors in the construction and demolition recycling markets. Corporate - This category consists of business units that do not meet the requirements for separate disclosure as an operating segment or inclusion in one of the other reporting segments and includes the Company's parent company, Astec Industries, Inc., and Astec Insurance. The Company evaluates performance and allocates resources to its operating segments based on profit or loss from operations before U.S. federal income taxes and corporate overhead and thus these costs are included in the Corporate category. The accounting policies of the reportable segments are the same as those described in the summary of significant accounting policies. Intersegment sales and transfers are valued at prices comparable to those for unrelated parties.
NOTES TO CONSOLIDATED FINANCIAL STATEMENTS (Dollar and share amounts in thousands, except per share amounts unless otherwise specified)
88
Segment information for 2015
Infrastructure Group
Aggregate and Mining
Group Energy Group Corporate Total
Revenues from external customers $ 428,737 $ 370,813 $ 183,607 $ -- $ 983,157 Intersegment revenues 22,947 28,701 16,010 -- 67,658 Interest expense 258 1,005 10 338 1,611 Depreciation and amortization 6,907 10,719 5,553 899 24,078 Income taxes 1,224 764 (129) 18,148 20,007 Profit (loss) 33,890 30,690 3,609 (36,623) 31,566 Assets 567,936 496,089 256,978 306,511 1,627,514 Capital expenditures 8,043 8,807 4,049 389 21,288
Segment information for 2014
Infrastructure Group
Aggregate and Mining
Group Energy Group Corporate Total
Revenues from external customers $ 386,356 $ 384,883 $ 204,356 $ -- $ 975,595 Intersegment revenues 26,661 33,009 17,548 -- 77,218 Interest expense 31 463 11 215 720 Depreciation and amortization 7,045 10,120 6,358 853 24,376 Income taxes 1,365 1,235 348 16,452 19,400 Profit (loss) 29,477 32,900 10,316 (35,270) 37,423 Assets 539,794 494,428 244,003 302,082 1,580,307 Capital expenditures 5,375 16,169 2,875 413 24,832
Segment information for 2013
Infrastructure Group
Aggregate and Mining
Group Energy Group
Corporate
Total Revenues from external customers $ 398,399 $ 350,514 $ 184,085 $ -- $ 932,998 Intersegment revenues 21,682 45,435 12,857 -- 79,974 Interest expense 13 12 4 394 423 Depreciation and amortization 7,417 7,906 6,114 828 22,265 Income taxes 1,567 2,642 46 14,773 19,028 Profit (loss) 32,814 33,031 4,005 (30,367) 39,483 Assets 502,831 427,565 223,389 315,560 1,469,345 Capital expenditures 6,214 15,649 5,510 300 27,673
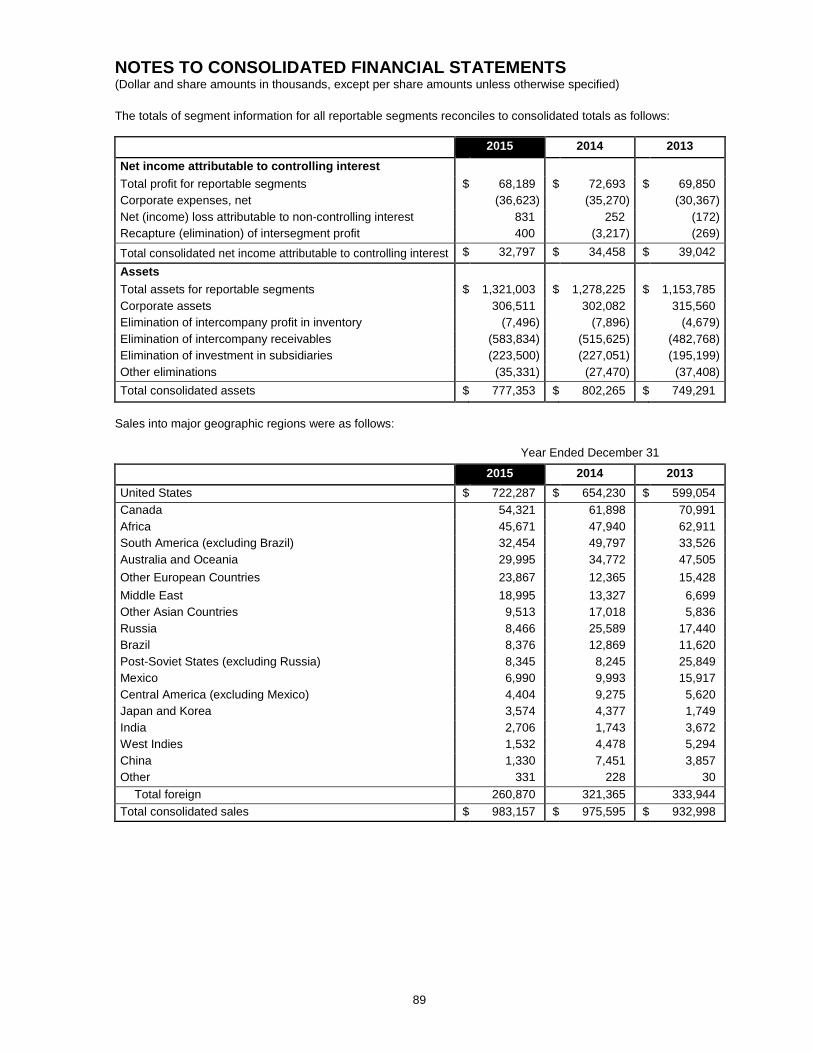
NOTES TO CONSOLIDATED FINANCIAL STATEMENTS (Dollar and share amounts in thousands, except per share amounts unless otherwise specified)
89
The totals of segment information for all reportable segments reconciles to consolidated totals as follows: 2015 2014 2013 Net income attributable to controlling interest Total profit for reportable segments $ 68,189 $ 72,693 $ 69,850 Corporate expenses, net (36,623) (35,270) (30,367) Net (income) loss attributable to non-controlling interest 831 252 (172) Recapture (elimination) of intersegment profit 400 (3,217) (269)
Total consolidated net income attributable to controlling interest $ 32,797 $ 34,458 $ 39,042 Assets Total assets for reportable segments $ 1,321,003 $ 1,278,225 $ 1,153,785 Corporate assets 306,511 302,082 315,560 Elimination of intercompany profit in inventory (7,496) (7,896) (4,679) Elimination of intercompany receivables (583,834) (515,625) (482,768) Elimination of investment in subsidiaries (223,500) (227,051) (195,199) Other eliminations (35,331) (27,470) (37,408) Total consolidated assets $ 777,353 $ 802,265 $ 749,291
Sales into major geographic regions were as follows: Year Ended December 31
2015 2014 2013 United States $ 722,287 $ 654,230 $ 599,054 Canada 54,321 61,898 70,991 Africa 45,671 47,940 62,911 South America (excluding Brazil) 32,454 49,797 33,526 Australia and Oceania 29,995 34,772 47,505 Other European Countries 23,867 12,365 15,428 Middle East 18,995 13,327 6,699 Other Asian Countries 9,513 17,018 5,836 Russia 8,466 25,589 17,440 Brazil 8,376 12,869 11,620 Post-Soviet States (excluding Russia) 8,345 8,245 25,849 Mexico 6,990 9,993 15,917 Central America (excluding Mexico) 4,404 9,275 5,620 Japan and Korea 3,574 4,377 1,749 India 2,706 1,743 3,672 West Indies 1,532 4,478 5,294 China 1,330 7,451 3,857 Other 331 228 30
Total foreign 260,870 321,365 333,944 Total consolidated sales $ 983,157 $ 975,595 $ 932,998
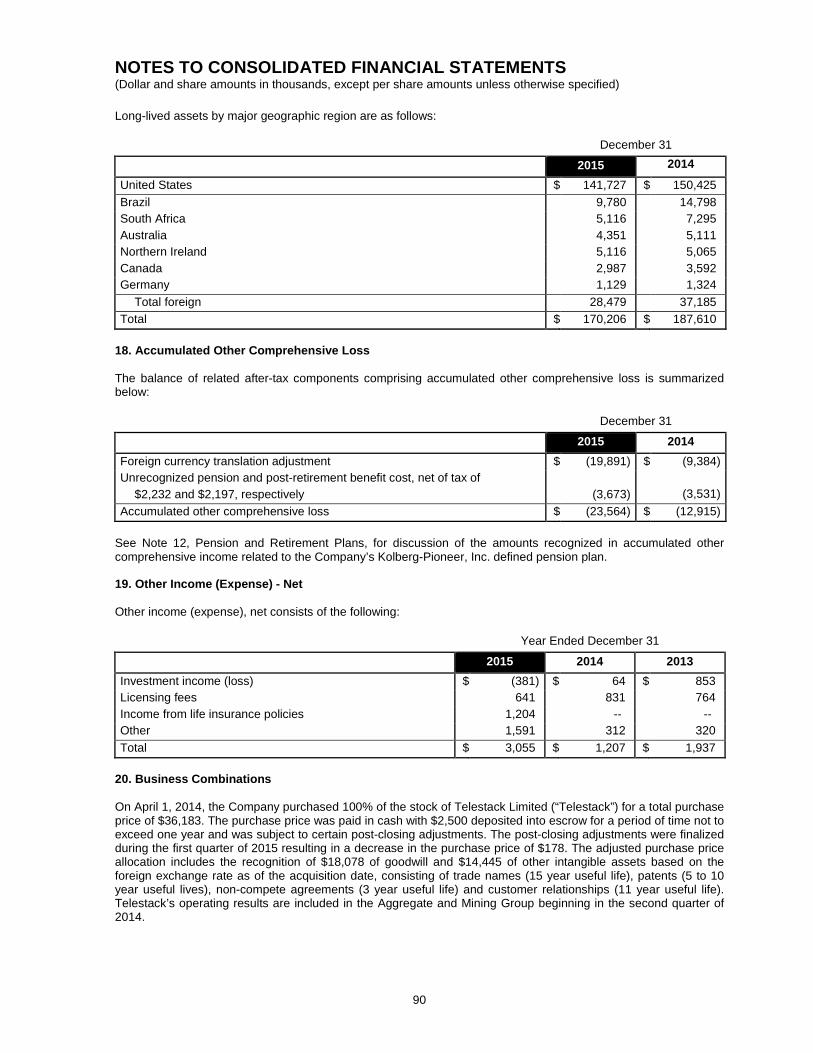
NOTES TO CONSOLIDATED FINANCIAL STATEMENTS (Dollar and share amounts in thousands, except per share amounts unless otherwise specified)
90
Long-lived assets by major geographic region are as follows: December 31
2015 2014 United States $ 141,727 $ 150,425 Brazil 9,780 14,798 South Africa 5,116 7,295 Australia 4,351 5,111 Northern Ireland 5,116 5,065 Canada 2,987 3,592 Germany 1,129 1,324
Total foreign 28,479 37,185 Total $ 170,206 $ 187,610
18. Accumulated Other Comprehensive Loss
The balance of related after-tax components comprising accumulated other comprehensive loss is summarized below: December 31
2015 2014 Foreign currency translation adjustment $ (19,891) $ (9,384) Unrecognized pension and post-retirement benefit cost, net of tax of
$2,232 and $2,197, respectively
(3,673)
(3,531)
Accumulated other comprehensive loss $ (23,564) $ (12,915) See Note 12, Pension and Retirement Plans, for discussion of the amounts recognized in accumulated other comprehensive income related to the Company’s Kolberg-Pioneer, Inc. defined pension plan. 19. Other Income (Expense) - Net
Other income (expense), net consists of the following: Year Ended December 31
2015 2014 2013 Investment income (loss) $ (381) $ 64 $ 853 Licensing fees 641 831 764 Income from life insurance policies 1,204 -- -- Other 1,591 312 320 Total $ 3,055 $ 1,207 $ 1,937
20. Business Combinations On April 1, 2014, the Company purchased 100% of the stock of Telestack Limited (“Telestack”) for a total purchase price of $36,183. The purchase price was paid in cash with $2,500 deposited into escrow for a period of time not to exceed one year and was subject to certain post-closing adjustments. The post-closing adjustments were finalized during the first quarter of 2015 resulting in a decrease in the purchase price of $178. The adjusted purchase price allocation includes the recognition of $18,078 of goodwill and $14,445 of other intangible assets based on the foreign exchange rate as of the acquisition date, consisting of trade names (15 year useful life), patents (5 to 10 year useful lives), non-compete agreements (3 year useful life) and customer relationships (11 year useful life). Telestack’s operating results are included in the Aggregate and Mining Group beginning in the second quarter of 2014.

NOTES TO CONSOLIDATED FINANCIAL STATEMENTS (Dollar and share amounts in thousands, except per share amounts unless otherwise specified)
91
Telestack, located in Omagh, Northern Ireland, began operations in 1999 and specializes in the complete in-house design, manufacture, installation and commissioning of a complete line of material handling systems used extensively in the port, aggregate and mining industries. Telestack markets its products throughout the world by a combination of direct sales and distribution through dealers. The Company anticipates the synergies between Telestack and the Company’s existing aggregate and wood pellet product lines will benefit both companies.
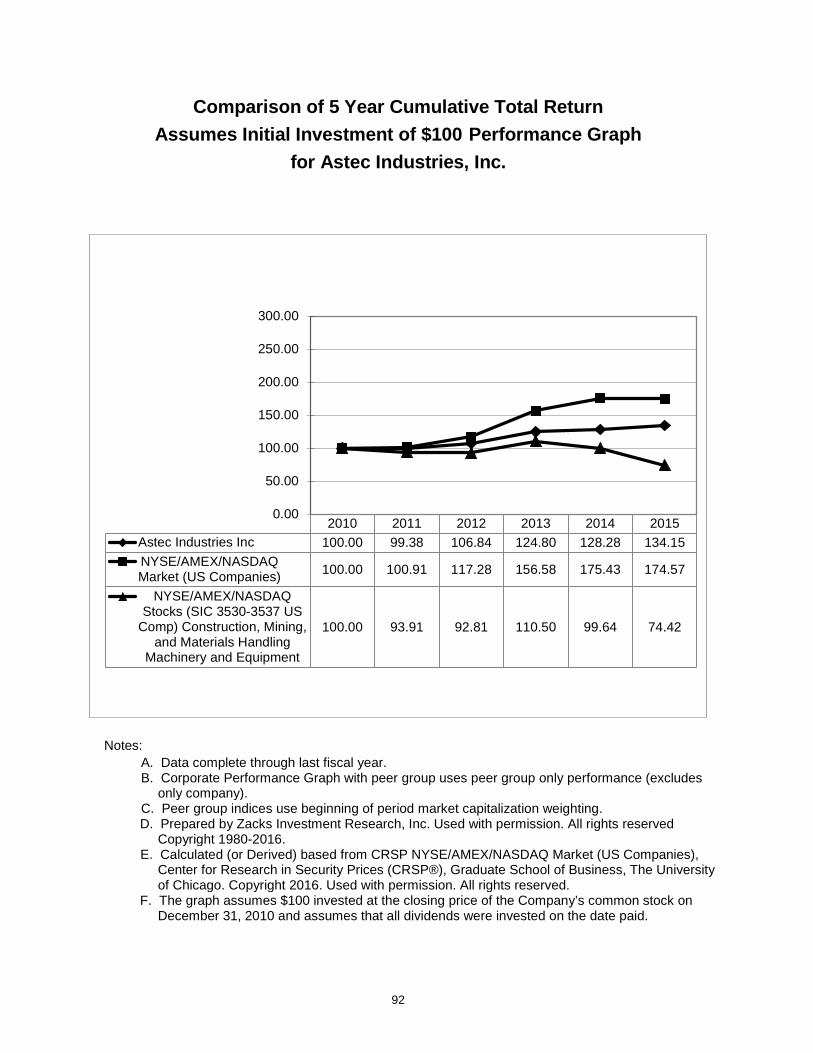
92
Comparison of 5 Year Cumulative Total Return Assumes Initial Investment of $100 Performance Graph
for Astec Industries, Inc.
Notes: A. Data complete through last fiscal year. B. Corporate Performance Graph with peer group uses peer group only performance (excludes
only company). C. Peer group indices use beginning of period market capitalization weighting.
D. Prepared by Zacks Investment Research, Inc. Used with permission. All rights reserved Copyright 1980-2016.
E. Calculated (or Derived) based from CRSP NYSE/AMEX/NASDAQ Market (US Companies), Center for Research in Security Prices (CRSP®), Graduate School of Business, The University of Chicago. Copyright 2016. Used with permission. All rights reserved.
F. The graph assumes $100 invested at the closing price of the Company’s common stock on December 31, 2010 and assumes that all dividends were invested on the date paid.
2010 2011 2012 2013 2014 2015Astec Industries Inc 100.00 99.38 106.84 124.80 128.28 134.15NYSE/AMEX/NASDAQMarket (US Companies) 100.00 100.91 117.28 156.58 175.43 174.57
NYSE/AMEX/NASDAQStocks (SIC 3530-3537 US
Comp) Construction, Mining,and Materials Handling
Machinery and Equipment
100.00 93.91 92.81 110.50 99.64 74.42
0.00
50.00
100.00
150.00
200.00
250.00
300.00
OTHER INFORMATION
Transfer AgentComputershare250 Royall Street, Canton, MA 02021800.617.6437www.computershare.com/investor
Stock ExchangeNASDAQ, National Market—ASTE
AuditorsKPMG LLP, Knoxville, TN
General Counsel and LitigationChambliss, Bahner & Stophel, P.C., Chattanooga, TN
Securities CounselAlston & Bird LLP, Atlanta, GA
Investor RelationsStephen C. Anderson, 423.553.5934
Corporate OfficeAstec Industries, Inc. 1725 Shepherd Road, Chattanooga, TN 37421Ph 423.899.5898�Fax 423.899.4456www.astecindustries.com
The form 10-K, as filed with the Securities and Exchange Commission, may be obtained at no cost by any shareholder upon written request to Astec Industries, Inc., Attention Investor Relations.
The Company’s Code of Conduct is posted at www.astecindustries.com.
The Annual Meeting will be held on April 28, 2016 at 10:00 A.M., EST in the Training Center of Astec, Inc. located at 4101 Jerome Avenue, Chattanooga, TN 37407.
An
nu
al R
ep
ort
De
sig
n b
y F
alk
Har
riso
n /
falk
har
riso
n.c
om

Corporate Headquarters:1725 Shepherd Road
Chattanooga, Tennessee 37421 USA
Tel: 423.899.5898 • Fax: 423.899.4456
www.astecindustries.com