Embed Size (px)
Citation preview

Foglight™ for Exchange 5.6.9User and Reference Guide
© 2015 Dell Inc. ALL RIGHTS RESERVED.
This guide contains proprietary information protected by copyright. The software described in this guide is furnished under a software license or nondisclosure agreement. This software may be used or copied only in accordance with the terms of the applicable agreement. No part of this guide may be reproduced or transmitted in any form or by any means, electronic or mechanical, including photocopying and recording for any purpose other than the purchaser’s personal use without the written permission of Dell Inc.
The information in this document is provided in connection with Dell products. No license, express or implied, by estoppel or otherwise, to any intellectual property right is granted by this document or in connection with the sale of Dell products. EXCEPT AS SET FORTH IN THE TERMS AND CONDITIONS AS SPECIFIED IN THE LICENSE AGREEMENT FOR THIS PRODUCT, DELL ASSUMES NO LIABILITY WHATSOEVER AND DISCLAIMS ANY EXPRESS, IMPLIED OR STATUTORY WARRANTY RELATING TO ITS PRODUCTS INCLUDING, BUT NOT LIMITED TO, THE IMPLIED WARRANTY OF MERCHANTABILITY, FITNESS FOR A PARTICULAR PURPOSE, OR NON-INFRINGEMENT. IN NO EVENT SHALL DELL BE LIABLE FOR ANY DIRECT, INDIRECT, CONSEQUENTIAL, PUNITIVE, SPECIAL OR INCIDENTAL DAMAGES (INCLUDING, WITHOUT LIMITATION, DAMAGES FOR LOSS OF PROFITS, BUSINESS INTERRUPTION OR LOSS OF INFORMATION) ARISING OUT OF THE USE OR INABILITY TO USE THIS DOCUMENT, EVEN IF DELL HAS BEEN ADVISED OF THE POSSIBILITY OF SUCH DAMAGES. Dell makes no representations or warranties with respect to the accuracy or completeness of the contents of this document and reserves the right to make changes to specifications and product descriptions at any time without notice. Dell does not make any commitment to update the information contained in this document.
If you have any questions regarding your potential use of this material, contact:
Dell Inc. Attn: LEGAL Dept 5 Polaris Way Aliso Viejo, CA 92656
Refer to our web site (software.dell.com) for regional and international office information.
Trademarks
Dell, the Dell logo, and Foglight, IntelliProfile, PerformaSure, and Tag and Follow are trademarks of Dell Inc. "Apache HTTP Server", Apache, "Apache Tomcat" and "Tomcat" are trademarks of the Apache Software Foundation. Google is a registered trademark of Google Inc. Chrome, Android, and Nexus are trademarks of Google Inc. Red Hat, JBoss, the JBoss logo, and Red Hat Enterprise Linux are registered trademarks of Red Hat, Inc. in the U.S. and other countries. CentOS is a trademark of Red Hat, Inc. in the U.S. and other countries. Microsoft, .NET, Active Directory, Internet Explorer, Hyper-V, SharePoint, SQL Server, Windows, Windows Vista and Windows Server are either registered trademarks or trademarks of Microsoft Corporation in the United States and/or other countries. AIX, IBM, and WebSphere are trademarks of International Business Machines Corporation, registered in many jurisdictions worldwide. Sun, Oracle, Java, Oracle Solaris, and WebLogic are trademarks or registered trademarks of Oracle and/or its affiliates in the United States and other countries. SPARC is a registered trademark of SPARC International, Inc. in the United States and other countries. Products bearing the SPARC trademarks are based on an architecture developed by Oracle Corporation. OpenLDAP is a registered trademark of the OpenLDAP Foundation. HP is a registered trademark that belongs to Hewlett-Packard Development Company, L.P. Linux is a registered trademark of Linus Torvalds in the United States, other countries, or both. MySQL is a registered trademark of MySQL AB in the United States, the European Union and other countries. Novell and eDirectory are registered trademarks of Novell, Inc., in the United States and other countries. VMware, ESX, ESXi, vSphere, vCenter, vMotion, and vCloud Director are registered trademarks or trademarks of VMware, Inc. in the United States and/or other jurisdictions. Sybase is a registered trademark of Sybase, Inc. The X Window System and UNIX are registered trademarks of The Open Group. Mozilla and Firefox are registered trademarks of the Mozilla Foundation. "Eclipse", "Eclipse Foundation Member", "EclipseCon", "Eclipse Summit", "Built on Eclipse", "Eclipse Ready" "Eclipse Incubation", and “Eclipse Proposals" are trademarks of Eclipse Foundation, Inc. IOS is a registered trademark or trademark of Cisco Systems, Inc. and/or its affiliates in the United States and certain other countries. Apple, iPad, iPhone, Xcode, Mac OS, and Safari are trademarks of Apple Inc., registered in the U.S. and other countries. Ubuntu is a registered trademark of Canonical Ltd. Symantec and Veritas are trademarks or registered trademarks of Symantec Corporation or its affiliates in the U.S. and other countries. YAST is a registered trademark of SUSE LLC in the United States and other countries. Citrix, AppFlow, NetScaler, and XenDesktop are trademarks of Citrix Systems, Inc. and/or one or more of its subsidiaries, and may be registered in the United States Patent and Trademark Office and in other countries. AlertSite and DéjàClick are either trademarks or registered trademarks of Boca Internet Technologies, Inc. Samsung, Galaxy S, and Galaxy Note are registered trademarks of Samsung Electronics America, Inc. and/or its related entities. MOTOROLA is a registered trademarks of Motorola Trademark Holdings, LLC. The Trademark BlackBerry Bold is owned by Research In Motion Limited and is registered in the United States and may be pending or registered in other countries. Dell is not endorsed, sponsored, affiliated with or otherwise authorized by Research In Motion Limited. Other trademarks and trade names may be used in this document to refer to either the entities claiming the marks and names or their products. Dell disclaims any proprietary interest in the marks and names of others.
Foglight for Exchange User and Reference Guide Updated - March 2015 Foglight Version - 5.7.1 Cartridge Version - 5.6.9
Legend
CAUTION: A CAUTION icon indicates potential damage to hardware or loss of data if instructions are not followed.
WARNING: A WARNING icon indicates a potential for property damage, personal injury, or death.
IMPORTANT NOTE, NOTE, TIP, MOBILE, or VIDEO: An information icon indicates supporting information.
Contents
Navigation basics . . . . . . . . . . . . . . . . . . . . . . . . . . . . . . . . . . . . . . . . . . . . . . . . 8
Foglight browser interface panels . . . . . . . . . . . . . . . . . . . . . . . . . . . . . . . . . . . . . 8Navigation panel . . . . . . . . . . . . . . . . . . . . . . . . . . . . . . . . . . . . . . . . . . . . . . 9Display panel . . . . . . . . . . . . . . . . . . . . . . . . . . . . . . . . . . . . . . . . . . . . . . . . 9Action panel . . . . . . . . . . . . . . . . . . . . . . . . . . . . . . . . . . . . . . . . . . . . . . . . . 9
Drill down actions . . . . . . . . . . . . . . . . . . . . . . . . . . . . . . . . . . . . . . . . . . . . . . . .10
Breadcrumb trail . . . . . . . . . . . . . . . . . . . . . . . . . . . . . . . . . . . . . . . . . . . . . . . . .10
Time range . . . . . . . . . . . . . . . . . . . . . . . . . . . . . . . . . . . . . . . . . . . . . . . . . . . .10
Lists . . . . . . . . . . . . . . . . . . . . . . . . . . . . . . . . . . . . . . . . . . . . . . . . . . . . . . . . .11Sorting content . . . . . . . . . . . . . . . . . . . . . . . . . . . . . . . . . . . . . . . . . . . . . . .11Hiding columns . . . . . . . . . . . . . . . . . . . . . . . . . . . . . . . . . . . . . . . . . . . . . . .11Filtering content . . . . . . . . . . . . . . . . . . . . . . . . . . . . . . . . . . . . . . . . . . . . . .12
Alarms and state indicators . . . . . . . . . . . . . . . . . . . . . . . . . . . . . . . . . . . . . . . . . .13
Mouse-over actions . . . . . . . . . . . . . . . . . . . . . . . . . . . . . . . . . . . . . . . . . . . . . . .13
Foglight for Exchange roles . . . . . . . . . . . . . . . . . . . . . . . . . . . . . . . . . . . . . . . . . .13
Exploring the Foglight for Exchange dashboards . . . . . . . . . . . . . . . . . . . . . . . . . . 15
Accessing the Foglight for Exchange dashboards . . . . . . . . . . . . . . . . . . . . . . . . . . . .15
Exchange Alarms dashboard . . . . . . . . . . . . . . . . . . . . . . . . . . . . . . . . . . . . . . . . .16
Exchange Environment dashboard . . . . . . . . . . . . . . . . . . . . . . . . . . . . . . . . . . . . .17Exchange Environment > Monitoring tab . . . . . . . . . . . . . . . . . . . . . . . . . . . . . . .17Exchange Environment > Administration tab . . . . . . . . . . . . . . . . . . . . . . . . . . . .20Exchange Environment > Reports tab . . . . . . . . . . . . . . . . . . . . . . . . . . . . . . . . .21Exchange Environment > FAQts tab . . . . . . . . . . . . . . . . . . . . . . . . . . . . . . . . . .24
Exchange Explorer dashboard . . . . . . . . . . . . . . . . . . . . . . . . . . . . . . . . . . . . . . . .25Exchange Infrastructure view . . . . . . . . . . . . . . . . . . . . . . . . . . . . . . . . . . . . . .26Exchange Explorer Primary view . . . . . . . . . . . . . . . . . . . . . . . . . . . . . . . . . . . .26
Exchange Rule Management dashboard . . . . . . . . . . . . . . . . . . . . . . . . . . . . . . . . . .29
Managing Exchange agents . . . . . . . . . . . . . . . . . . . . . . . . . . . . . . . . . . . . . . . . 30
Agent Status dashboard . . . . . . . . . . . . . . . . . . . . . . . . . . . . . . . . . . . . . . . . . . . .30
Exchange agent management . . . . . . . . . . . . . . . . . . . . . . . . . . . . . . . . . . . . . . . .30Tasks list . . . . . . . . . . . . . . . . . . . . . . . . . . . . . . . . . . . . . . . . . . . . . . . . . . .30Agent Management view . . . . . . . . . . . . . . . . . . . . . . . . . . . . . . . . . . . . . . . . .31
Exchange agent properties . . . . . . . . . . . . . . . . . . . . . . . . . . . . . . . . . . . . . . . . . .36Configuration . . . . . . . . . . . . . . . . . . . . . . . . . . . . . . . . . . . . . . . . . . . . . . . .37Monitor . . . . . . . . . . . . . . . . . . . . . . . . . . . . . . . . . . . . . . . . . . . . . . . . . . . .39Data Collection Scheduler . . . . . . . . . . . . . . . . . . . . . . . . . . . . . . . . . . . . . . . .40
Reporting on your Exchange environment . . . . . . . . . . . . . . . . . . . . . . . . . . . . . . 42
Foglight for Exchange reports . . . . . . . . . . . . . . . . . . . . . . . . . . . . . . . . . . . . . . . .42
Foglight for Exchange views . . . . . . . . . . . . . . . . . . . . . . . . . . . . . . . . . . . . . . . 45
Role views . . . . . . . . . . . . . . . . . . . . . . . . . . . . . . . . . . . . . . . . . . . . . . . . . . . . .45
Foglight for Exchange 5.6.9User and Reference Guide
3
Exchange Roles Environment Summary (All Exchange Roles) view . . . . . . . . . . . . . .46Client Access 2013 Role Environment Summary view . . . . . . . . . . . . . . . . . . . . . .47Edge Transport Role Environment Summary view . . . . . . . . . . . . . . . . . . . . . . . . .48Hub Transport Role Environment Summary view . . . . . . . . . . . . . . . . . . . . . . . . .49Mailbox Role Environment Summary view . . . . . . . . . . . . . . . . . . . . . . . . . . . . . .50Unified Messaging Role Environment Summary view . . . . . . . . . . . . . . . . . . . . . . .51Exchange Roles Explorer Summary (All Roles) view . . . . . . . . . . . . . . . . . . . . . . . .52Client Access 2013 Role Explorer Summary view . . . . . . . . . . . . . . . . . . . . . . . . .53Edge Transport Role Explorer Summary view . . . . . . . . . . . . . . . . . . . . . . . . . . . .55Hub Transport Role Explorer Summary view . . . . . . . . . . . . . . . . . . . . . . . . . . . .56Mailbox 2013 Role Explorer Summary view . . . . . . . . . . . . . . . . . . . . . . . . . . . . .57Unified Messaging Role Explorer Summary view . . . . . . . . . . . . . . . . . . . . . . . . . .58
Exchange Server views . . . . . . . . . . . . . . . . . . . . . . . . . . . . . . . . . . . . . . . . . . . . .59Exchange Servers Environment Summary (All Exchange Servers) view . . . . . . . . . . .59Exchange Server Environment Summary view . . . . . . . . . . . . . . . . . . . . . . . . . . .60Exchange Servers Explorer Summary (All Exchange Servers) view . . . . . . . . . . . . . .61Exchange Server Explorer Summary view . . . . . . . . . . . . . . . . . . . . . . . . . . . . . .62Resource Utilization Details view . . . . . . . . . . . . . . . . . . . . . . . . . . . . . . . . . . .63Exchange Server Roles view . . . . . . . . . . . . . . . . . . . . . . . . . . . . . . . . . . . . . . .64Exchange Server AD Health view . . . . . . . . . . . . . . . . . . . . . . . . . . . . . . . . . . . .68Exchange Server Managed Availability view . . . . . . . . . . . . . . . . . . . . . . . . . . . .69
Site views . . . . . . . . . . . . . . . . . . . . . . . . . . . . . . . . . . . . . . . . . . . . . . . . . . . . .70Exchange Sites Environment Summary (All Sites) view . . . . . . . . . . . . . . . . . . . . .70Exchange Site Environment Summary view . . . . . . . . . . . . . . . . . . . . . . . . . . . . .71Exchange Sites Explorer Summary (All Sites) view . . . . . . . . . . . . . . . . . . . . . . . .72Exchange Site Explorer Summary view . . . . . . . . . . . . . . . . . . . . . . . . . . . . . . . .73
Cluster views . . . . . . . . . . . . . . . . . . . . . . . . . . . . . . . . . . . . . . . . . . . . . . . . . . .75Exchange Clusters Environment Summary (All Clusters) view . . . . . . . . . . . . . . . . .75Exchange Cluster Environment Summary view . . . . . . . . . . . . . . . . . . . . . . . . . . .76Exchange Clusters Explorer Summary (All Clusters) view . . . . . . . . . . . . . . . . . . . .77Exchange Cluster Explorer Summary view . . . . . . . . . . . . . . . . . . . . . . . . . . . . . .78
Description of Embedded views . . . . . . . . . . . . . . . . . . . . . . . . . . . . . . . . . . . . . . .79Active CCR Storage Group view . . . . . . . . . . . . . . . . . . . . . . . . . . . . . . . . . . . .81Active DAG Database view . . . . . . . . . . . . . . . . . . . . . . . . . . . . . . . . . . . . . . . .82Active SCC Storage Group view . . . . . . . . . . . . . . . . . . . . . . . . . . . . . . . . . . . .84AD Dependencies view . . . . . . . . . . . . . . . . . . . . . . . . . . . . . . . . . . . . . . . . . .85Agent State view . . . . . . . . . . . . . . . . . . . . . . . . . . . . . . . . . . . . . . . . . . . . . .85Auto Attendant Calls view . . . . . . . . . . . . . . . . . . . . . . . . . . . . . . . . . . . . . . . .85Auto Attendant Directory Access view . . . . . . . . . . . . . . . . . . . . . . . . . . . . . . . .86Auto Attendant General view . . . . . . . . . . . . . . . . . . . . . . . . . . . . . . . . . . . . . .86Auto Attendant Transfers view . . . . . . . . . . . . . . . . . . . . . . . . . . . . . . . . . . . . .87Cached LDAP Searches/sec view . . . . . . . . . . . . . . . . . . . . . . . . . . . . . . . . . . . .87CAS AB Load view . . . . . . . . . . . . . . . . . . . . . . . . . . . . . . . . . . . . . . . . . . . . .88CAS AB Service view . . . . . . . . . . . . . . . . . . . . . . . . . . . . . . . . . . . . . . . . . . . .88CAS ActiveSync view . . . . . . . . . . . . . . . . . . . . . . . . . . . . . . . . . . . . . . . . . . .89CAS Control Panel Load view . . . . . . . . . . . . . . . . . . . . . . . . . . . . . . . . . . . . . .90CAS Load view . . . . . . . . . . . . . . . . . . . . . . . . . . . . . . . . . . . . . . . . . . . . . . . .91CAS OAB Download view . . . . . . . . . . . . . . . . . . . . . . . . . . . . . . . . . . . . . . . . .92
Foglight for Exchange 5.6.9User and Reference Guide
4

CAS RPC Client Access view . . . . . . . . . . . . . . . . . . . . . . . . . . . . . . . . . . . . . . .92CAS RPC Client Access Load view . . . . . . . . . . . . . . . . . . . . . . . . . . . . . . . . . . .93CAS RPC HTTP view . . . . . . . . . . . . . . . . . . . . . . . . . . . . . . . . . . . . . . . . . . . .93Client Access Features view . . . . . . . . . . . . . . . . . . . . . . . . . . . . . . . . . . . . . . .93Cluster Database Details view . . . . . . . . . . . . . . . . . . . . . . . . . . . . . . . . . . . . .95Cluster IP view . . . . . . . . . . . . . . . . . . . . . . . . . . . . . . . . . . . . . . . . . . . . . . .97Cluster Storage Group Details view . . . . . . . . . . . . . . . . . . . . . . . . . . . . . . . . . .97Cluster Summary and Resource Information view . . . . . . . . . . . . . . . . . . . . . . . . .99Cluster Summary view . . . . . . . . . . . . . . . . . . . . . . . . . . . . . . . . . . . . . . . . . .99CPU view . . . . . . . . . . . . . . . . . . . . . . . . . . . . . . . . . . . . . . . . . . . . . . . . . . 101Disk view . . . . . . . . . . . . . . . . . . . . . . . . . . . . . . . . . . . . . . . . . . . . . . . . . . 102Domain Controllers view . . . . . . . . . . . . . . . . . . . . . . . . . . . . . . . . . . . . . . . . 103Edge Agent view . . . . . . . . . . . . . . . . . . . . . . . . . . . . . . . . . . . . . . . . . . . . . 103Edge Transport Features view . . . . . . . . . . . . . . . . . . . . . . . . . . . . . . . . . . . . 104Exchange Roles Server Summary view . . . . . . . . . . . . . . . . . . . . . . . . . . . . . . . 106Exchange Roles Top 3 view . . . . . . . . . . . . . . . . . . . . . . . . . . . . . . . . . . . . . . 109Exchange Server Roles view . . . . . . . . . . . . . . . . . . . . . . . . . . . . . . . . . . . . . . 110Exchange Servers in This Cluster view . . . . . . . . . . . . . . . . . . . . . . . . . . . . . . . 122Exchange Servers view (Exchange Cluster Environment Summary) . . . . . . . . . . . . . 123Exchange Servers view (Exchange Explorer Summary) . . . . . . . . . . . . . . . . . . . . . 123Host Monitor view . . . . . . . . . . . . . . . . . . . . . . . . . . . . . . . . . . . . . . . . . . . . 124Hub Transport Features view . . . . . . . . . . . . . . . . . . . . . . . . . . . . . . . . . . . . . 124IP Address view . . . . . . . . . . . . . . . . . . . . . . . . . . . . . . . . . . . . . . . . . . . . . . 125Mailbox Features view . . . . . . . . . . . . . . . . . . . . . . . . . . . . . . . . . . . . . . . . . 126Mailbox Store Assistant view . . . . . . . . . . . . . . . . . . . . . . . . . . . . . . . . . . . . . 129Managed Availability Recovery Actions view . . . . . . . . . . . . . . . . . . . . . . . . . . . 129Memory view . . . . . . . . . . . . . . . . . . . . . . . . . . . . . . . . . . . . . . . . . . . . . . . 129Network view . . . . . . . . . . . . . . . . . . . . . . . . . . . . . . . . . . . . . . . . . . . . . . . 130Passive CCR Storage Group view . . . . . . . . . . . . . . . . . . . . . . . . . . . . . . . . . . . 131Passive DAG Database view . . . . . . . . . . . . . . . . . . . . . . . . . . . . . . . . . . . . . . 132Processes LDAP Read Time view . . . . . . . . . . . . . . . . . . . . . . . . . . . . . . . . . . . 133Resource Utilization view . . . . . . . . . . . . . . . . . . . . . . . . . . . . . . . . . . . . . . . 134Roles Explorer view . . . . . . . . . . . . . . . . . . . . . . . . . . . . . . . . . . . . . . . . . . . 135Role Servers view . . . . . . . . . . . . . . . . . . . . . . . . . . . . . . . . . . . . . . . . . . . . 136Server Health view . . . . . . . . . . . . . . . . . . . . . . . . . . . . . . . . . . . . . . . . . . . . 137Server Listing view . . . . . . . . . . . . . . . . . . . . . . . . . . . . . . . . . . . . . . . . . . . . 138Server Role Feature State view . . . . . . . . . . . . . . . . . . . . . . . . . . . . . . . . . . . 138Servers For This Role view . . . . . . . . . . . . . . . . . . . . . . . . . . . . . . . . . . . . . . . 138Servers In This Site view . . . . . . . . . . . . . . . . . . . . . . . . . . . . . . . . . . . . . . . . 139Site By Category view . . . . . . . . . . . . . . . . . . . . . . . . . . . . . . . . . . . . . . . . . . 139Store Calendar Attendant view . . . . . . . . . . . . . . . . . . . . . . . . . . . . . . . . . . . . 140Store Client Search view . . . . . . . . . . . . . . . . . . . . . . . . . . . . . . . . . . . . . . . . 140Store Content Indexing view . . . . . . . . . . . . . . . . . . . . . . . . . . . . . . . . . . . . . 141Store Database view . . . . . . . . . . . . . . . . . . . . . . . . . . . . . . . . . . . . . . . . . . 141Store Public Load view . . . . . . . . . . . . . . . . . . . . . . . . . . . . . . . . . . . . . . . . . 142Store Resource Booking view . . . . . . . . . . . . . . . . . . . . . . . . . . . . . . . . . . . . . 142Store RPC Client Throttling view . . . . . . . . . . . . . . . . . . . . . . . . . . . . . . . . . . 142Store Transport view . . . . . . . . . . . . . . . . . . . . . . . . . . . . . . . . . . . . . . . . . . 143
Foglight for Exchange 5.6.9User and Reference Guide
5
Store User Load view . . . . . . . . . . . . . . . . . . . . . . . . . . . . . . . . . . . . . . . . . . 143Summary and Resource Information view . . . . . . . . . . . . . . . . . . . . . . . . . . . . . 144Top 3 ASP.NET Current Requests views . . . . . . . . . . . . . . . . . . . . . . . . . . . . . . . 144Top 3 ASP.NET Requests In App Queue views . . . . . . . . . . . . . . . . . . . . . . . . . . . 145Top 3 CPU Consumers view . . . . . . . . . . . . . . . . . . . . . . . . . . . . . . . . . . . . . . 145Top 3 Hub Transport Access Failures view . . . . . . . . . . . . . . . . . . . . . . . . . . . . . 145Top 3 Mailbox Delivery Queues view . . . . . . . . . . . . . . . . . . . . . . . . . . . . . . . . 145Top 3 Mailbox Server Access Failures view . . . . . . . . . . . . . . . . . . . . . . . . . . . . 146Top 3 Memory Consumers view . . . . . . . . . . . . . . . . . . . . . . . . . . . . . . . . . . . . 146Top 3 Messages Received/sec view . . . . . . . . . . . . . . . . . . . . . . . . . . . . . . . . . 146Top 3 Network Consumers view . . . . . . . . . . . . . . . . . . . . . . . . . . . . . . . . . . . 147Top 3 Remote Delivery Queues view . . . . . . . . . . . . . . . . . . . . . . . . . . . . . . . . 147Top 3 RPC Requests view . . . . . . . . . . . . . . . . . . . . . . . . . . . . . . . . . . . . . . . . 147Top 3 Storage Consumers view . . . . . . . . . . . . . . . . . . . . . . . . . . . . . . . . . . . . 147Top 3 Submission Queues view . . . . . . . . . . . . . . . . . . . . . . . . . . . . . . . . . . . . 148Top 3 Mailbox Delivery Queues . . . . . . . . . . . . . . . . . . . . . . . . . . . . . . . . . . . . 148Total LDAP Read Time On All DCs view . . . . . . . . . . . . . . . . . . . . . . . . . . . . . . . 148Total Long-Running LDAP Operations On All DCs view . . . . . . . . . . . . . . . . . . . . . 149Transport Dumpster view . . . . . . . . . . . . . . . . . . . . . . . . . . . . . . . . . . . . . . . 149Transport Edge Sync view . . . . . . . . . . . . . . . . . . . . . . . . . . . . . . . . . . . . . . . 150Transport Extensibility Agent view . . . . . . . . . . . . . . . . . . . . . . . . . . . . . . . . . 150Transport Load Store Drivers view . . . . . . . . . . . . . . . . . . . . . . . . . . . . . . . . . . 151Transport Queues view . . . . . . . . . . . . . . . . . . . . . . . . . . . . . . . . . . . . . . . . . 151UM Availability view . . . . . . . . . . . . . . . . . . . . . . . . . . . . . . . . . . . . . . . . . . . 151UM Call Answer General view . . . . . . . . . . . . . . . . . . . . . . . . . . . . . . . . . . . . . 152UM Call Answer view . . . . . . . . . . . . . . . . . . . . . . . . . . . . . . . . . . . . . . . . . . 153UM Fax view . . . . . . . . . . . . . . . . . . . . . . . . . . . . . . . . . . . . . . . . . . . . . . . . 154UM General Current view . . . . . . . . . . . . . . . . . . . . . . . . . . . . . . . . . . . . . . . 155UM General view . . . . . . . . . . . . . . . . . . . . . . . . . . . . . . . . . . . . . . . . . . . . . 156UM Subscriber Access Calendar view . . . . . . . . . . . . . . . . . . . . . . . . . . . . . . . . 158UM Subscriber Access Directory view . . . . . . . . . . . . . . . . . . . . . . . . . . . . . . . . 158UM Subscriber Access General view . . . . . . . . . . . . . . . . . . . . . . . . . . . . . . . . . 159UM Subscriber Access Message view . . . . . . . . . . . . . . . . . . . . . . . . . . . . . . . . 160Unified Messaging Features view . . . . . . . . . . . . . . . . . . . . . . . . . . . . . . . . . . 161Windows Cluster view . . . . . . . . . . . . . . . . . . . . . . . . . . . . . . . . . . . . . . . . . . 162Windows Services view . . . . . . . . . . . . . . . . . . . . . . . . . . . . . . . . . . . . . . . . . 162
Foglight for Exchange rules . . . . . . . . . . . . . . . . . . . . . . . . . . . . . . . . . . . . . . . .164
Rules dashboard . . . . . . . . . . . . . . . . . . . . . . . . . . . . . . . . . . . . . . . . . . . . . . . . 164
Exchange Rule Management dashboard . . . . . . . . . . . . . . . . . . . . . . . . . . . . . . . . . 165
Managing Foglight for Exchange rules . . . . . . . . . . . . . . . . . . . . . . . . . . . . . . . . . . 168
Rules reference . . . . . . . . . . . . . . . . . . . . . . . . . . . . . . . . . . . . . . . . . . . . . . . . 169
Running diagnostic tests . . . . . . . . . . . . . . . . . . . . . . . . . . . . . . . . . . . . . . . . . .170
Diagnostic Tests dashboard . . . . . . . . . . . . . . . . . . . . . . . . . . . . . . . . . . . . . . . . . 170Tasks list . . . . . . . . . . . . . . . . . . . . . . . . . . . . . . . . . . . . . . . . . . . . . . . . . . 170About Diagnostic Test Types pane . . . . . . . . . . . . . . . . . . . . . . . . . . . . . . . . . . 173Diagnostic Tests list . . . . . . . . . . . . . . . . . . . . . . . . . . . . . . . . . . . . . . . . . . . 173
Foglight for Exchange 5.6.9User and Reference Guide
6
Diagnostic Tests reference . . . . . . . . . . . . . . . . . . . . . . . . . . . . . . . . . . . . . . . . . 175Internal Mailbox . . . . . . . . . . . . . . . . . . . . . . . . . . . . . . . . . . . . . . . . . . . . . 175Remote Forest Mailbox . . . . . . . . . . . . . . . . . . . . . . . . . . . . . . . . . . . . . . . . . 176Replication Health . . . . . . . . . . . . . . . . . . . . . . . . . . . . . . . . . . . . . . . . . . . . 176
Troubleshooting . . . . . . . . . . . . . . . . . . . . . . . . . . . . . . . . . . . . . . . . . . . . . . . . 177Configuring the agent to log on as a service . . . . . . . . . . . . . . . . . . . . . . . . . . . 177
Managing Exchange metrics . . . . . . . . . . . . . . . . . . . . . . . . . . . . . . . . . . . . . . . .179
Agent Status and Agent Properties dashboards . . . . . . . . . . . . . . . . . . . . . . . . . . . . 179
Exchange Metrics Management dashboard . . . . . . . . . . . . . . . . . . . . . . . . . . . . . . . 180
Managing Exchange metrics . . . . . . . . . . . . . . . . . . . . . . . . . . . . . . . . . . . . . . . . 182Using the Metrics Management dashboard . . . . . . . . . . . . . . . . . . . . . . . . . . . . 182Using the Agent Status and Agent Properties dashboards . . . . . . . . . . . . . . . . . . . 184
Appendix: Exchange metrics . . . . . . . . . . . . . . . . . . . . . . . . . . . . . . . . . . . . . . .185
Metrics collected by default . . . . . . . . . . . . . . . . . . . . . . . . . . . . . . . . . . . . . . . . 185Active CCR Storage Group view . . . . . . . . . . . . . . . . . . . . . . . . . . . . . . . . . . . 185Active DAG Database view . . . . . . . . . . . . . . . . . . . . . . . . . . . . . . . . . . . . . . . 186Active SCC Storage Group view . . . . . . . . . . . . . . . . . . . . . . . . . . . . . . . . . . . 187Passive CCR Storage Group view . . . . . . . . . . . . . . . . . . . . . . . . . . . . . . . . . . . 188Passive DAG Database view . . . . . . . . . . . . . . . . . . . . . . . . . . . . . . . . . . . . . . 188Exchange Server Roles view - Client Access . . . . . . . . . . . . . . . . . . . . . . . . . . . 189Exchange Server Roles view - Edge Transport . . . . . . . . . . . . . . . . . . . . . . . . . . 190Exchange Server Roles view - Hub Transport . . . . . . . . . . . . . . . . . . . . . . . . . . . 192Exchange Server Roles view - Mailbox . . . . . . . . . . . . . . . . . . . . . . . . . . . . . . . 193Exchange Server Roles view - Unified Messaging . . . . . . . . . . . . . . . . . . . . . . . . 196
Optional metrics . . . . . . . . . . . . . . . . . . . . . . . . . . . . . . . . . . . . . . . . . . . . . . . . 197Client Access Detail section . . . . . . . . . . . . . . . . . . . . . . . . . . . . . . . . . . . . . . 197Information Store Detail section . . . . . . . . . . . . . . . . . . . . . . . . . . . . . . . . . . . 199Transport Detail section . . . . . . . . . . . . . . . . . . . . . . . . . . . . . . . . . . . . . . . . 201Unified Messaging Detail section . . . . . . . . . . . . . . . . . . . . . . . . . . . . . . . . . . . 202
Foglight for Exchange 5.6.9User and Reference Guide
7

1
Navigation basics
This guide has been prepared to assist you in becoming familiar with Foglight for Exchange. It provides basic navigation techniques, describes the dashboards, views and reports included with Foglight for Exchange, and provides information about the rules that are available for your monitored system.
This chapter describes the basic techniques used to navigate through Foglight for Exchange. It is intended to introduce you to the layout of the Foglight user interface and how to navigate through the dashboards and views provided with Foglight for Exchange:
• Foglight browser interface panels
• Drill down actions
• Breadcrumb trail
• Time range
• Lists
• Alarms and state indicators
• Mouse-over actions
• Foglight for Exchange roles
For more information about Foglight navigation, see the Foglight User Guide or online help.
Foglight browser interface panelsDepending on who you log in as, you may see either the contents of the first bookmark (the Welcome page is the default) listed under Bookmarks, or a home page. For further details about these Foglight pages, see the Foglight User Guide or online help.
Typically the browser interface is divided into three panels:
• Navigation panel
• Display panel
• Action panel
Foglight for Exchange 5.6.9User and Reference Guide
8
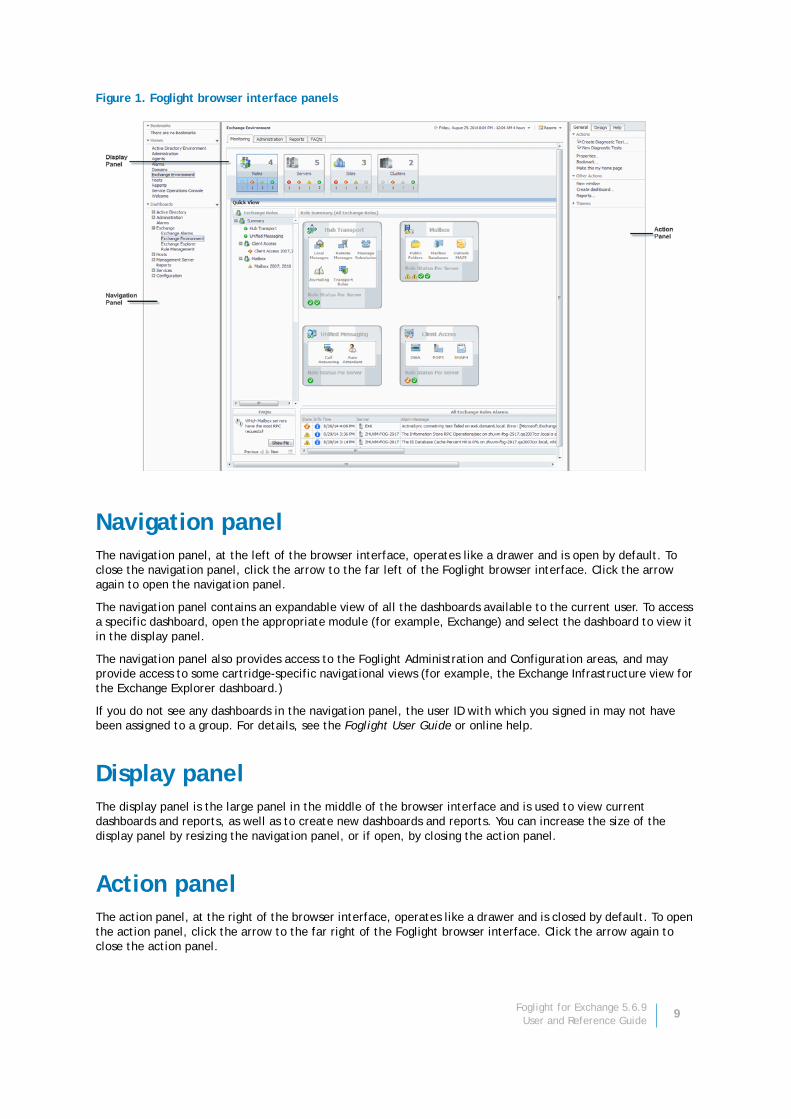
Figure 1. Foglight browser interface panels
Navigation panelThe navigation panel, at the left of the browser interface, operates like a drawer and is open by default. To close the navigation panel, click the arrow to the far left of the Foglight browser interface. Click the arrow again to open the navigation panel.
The navigation panel contains an expandable view of all the dashboards available to the current user. To access a specific dashboard, open the appropriate module (for example, Exchange) and select the dashboard to view it in the display panel.
The navigation panel also provides access to the Foglight Administration and Configuration areas, and may provide access to some cartridge-specific navigational views (for example, the Exchange Infrastructure view for the Exchange Explorer dashboard.)
If you do not see any dashboards in the navigation panel, the user ID with which you signed in may not have been assigned to a group. For details, see the Foglight User Guide or online help.
Display panelThe display panel is the large panel in the middle of the browser interface and is used to view current dashboards and reports, as well as to create new dashboards and reports. You can increase the size of the display panel by resizing the navigation panel, or if open, by closing the action panel.
Action panelThe action panel, at the right of the browser interface, operates like a drawer and is closed by default. To open the action panel, click the arrow to the far right of the Foglight browser interface. Click the arrow again to close the action panel.
Foglight for Exchange 5.6.9User and Reference Guide
9
The action panel lists the actions and tasks you can perform within the currently displayed dashboard. It also contains the views and data that you can add to a dashboard or report, and provides access to the online help files.
Drill down actionsUse the graphical and text links in views to drill down to additional details that may assist you in diagnosing problems. Depending on the link, you drill down to a different dashboard or smaller view called a popup that appears over the dashboard you are currently viewing.
You can drill down from many different parts of a view, including names of monitored components (such as Exchange servers or Exchange roles), the view in Explorer links in a dashboard, and items like charts, tables, cylinders and icons.
For example, in the Exchange Alarms dashboard, click on a server name. This displays a dialog allowing you to select either the Explorer or the Quick View. Select the Quick View link to display the selected server’s summary information on the Exchange Environment dashboard.
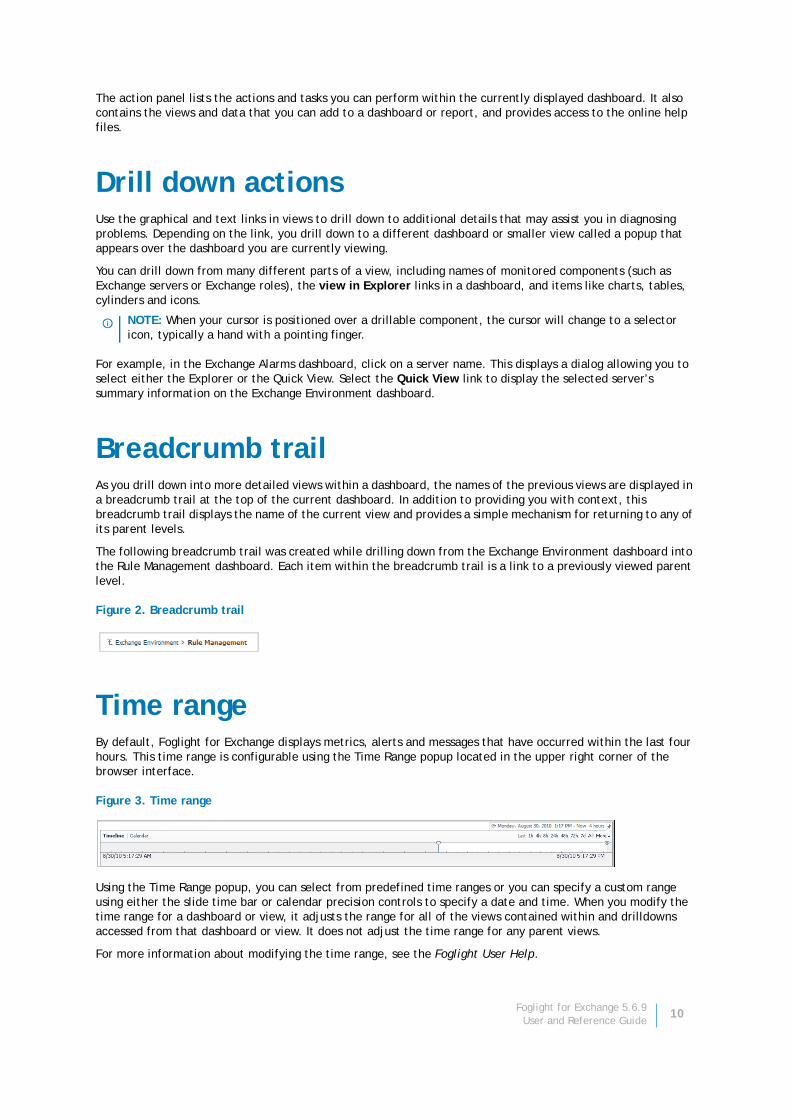
Breadcrumb trailAs you drill down into more detailed views within a dashboard, the names of the previous views are displayed in a breadcrumb trail at the top of the current dashboard. In addition to providing you with context, this breadcrumb trail displays the name of the current view and provides a simple mechanism for returning to any of its parent levels.
The following breadcrumb trail was created while drilling down from the Exchange Environment dashboard into the Rule Management dashboard. Each item within the breadcrumb trail is a link to a previously viewed parent level.
Figure 2. Breadcrumb trail
Time rangeBy default, Foglight for Exchange displays metrics, alerts and messages that have occurred within the last four hours. This time range is configurable using the Time Range popup located in the upper right corner of the browser interface.
Figure 3. Time range
Using the Time Range popup, you can select from predefined time ranges or you can specify a custom range using either the slide time bar or calendar precision controls to specify a date and time. When you modify the time range for a dashboard or view, it adjusts the range for all of the views contained within and drilldowns accessed from that dashboard or view. It does not adjust the time range for any parent views.
For more information about modifying the time range, see the Foglight User Help.
NOTE: When your cursor is positioned over a drillable component, the cursor will change to a selector icon, typically a hand with a pointing finger.
Foglight for Exchange 5.6.9User and Reference Guide
10

ListsThe lists displayed throughout Foglight for Exchange allow you to define the sort criteria and order, hide columns, and filter content based on user-defined search criteria:
• Sorting content
• Hiding columns
• Filtering content
Sorting contentSome views in the Foglight for Exchange dashboards contain sortable lists. An example of a sortable list is the Servers For This Role view on the Exchange Explorer dashboard.
Figure 4. Servers For This Role view
An arrow in the column heading identifies the sort criteria and order, ascending or descending, being used to display information.
To change the sort criteria in a list:
1 Click on the column heading to be used to sort the list.
2 The sort order is in ascending order, but can be changed to descending order by clicking on the heading a second time.
The list is redrawn according to your specification.
Hiding columnsThe Foglight for Exchange lists display a default set of columns; however, you can customize the content of the lists by hiding columns.
To hide columns in the list:
1 Select the button in the upper right corner of the list to display the Show Columns dialog.
2 On the Show Columns dialog, click a column heading from the list to clear the corresponding check box.
3 Select Apply to display the list displaying only the columns that are currently selected in the Show Columns dialog.
Foglight for Exchange 5.6.9User and Reference Guide
11

Filtering contentMany of the lists displayed in the Foglight for Exchange dashboards and views allow you to filter the information displayed using the search controls at the top of the list. You can either conduct a search on all of the columns in the list or specify the columns to be searched.
Figure 5. Filtering content
To filter a list based on content in any of the fields:
1 Enter a text string into the text field.
The list now displays the entries found as a result of your search.
2 To clear the search string and display the original list, select .
To specify individual fields to be searched:
1 Click the arrow control and select Advanced Search.
A dialog appears allowing you to enter the search criteria to be used to filter your list and sort the results.
2 To define the number of items to be included in the list and the sort criteria and order of the results, select the Limit to nn items from top check box.
3 By default, the top 10 items are displayed. To change this value, enter a different number in the value field.
4 The Order by field contains the column heading currently selected as the sort criteria. To change the sort criteria, click in the Order by field and select the column heading to be used. Use the arrow control to define the sort order: ascending or descending.
5 To define the search criteria, select the Match the following rule check box and specify the following information:
• Click in the first field to specify the column to be searched.
• Use the arrow control to define the comparison operator to be used (for example, does not contain, starts with, ends with.)
• Enter the text string to be matched.
• The Case Insensitive check box is selected by default and will find matches regardless of case. For a case-sensitive search, clear this check box.
NOTE: Select the Use Regular Expression option that appears when you select the arrow control to the right of the Search field to specify a regular expression which allows you to enter a search pattern using wildcard characters instead of a literal text string.
Foglight for Exchange 5.6.9User and Reference Guide
12
6 To add an additional search rule, select and repeat the previous step to specify the additional search criteria.
7 Once you have entered your search criteria, select Search to close the dialog and conduct the search.
8 The results of your search is displayed in the list.
9 To clear the search string and display the original list, select .
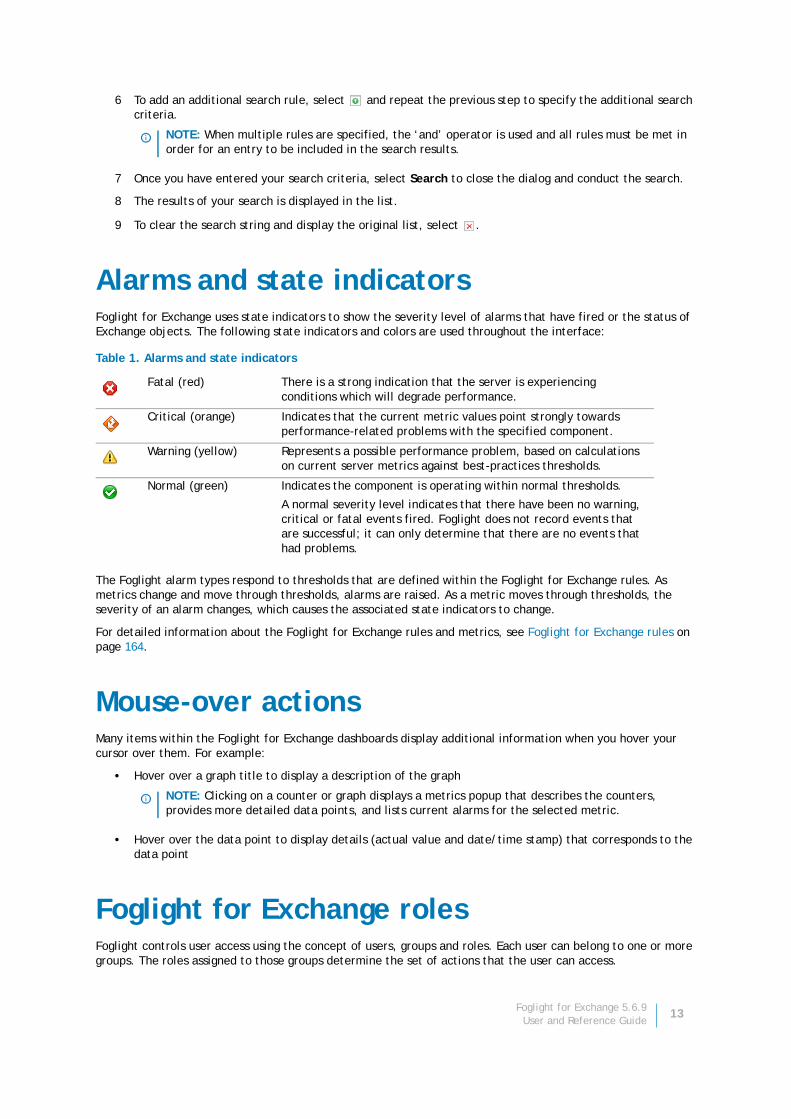
Alarms and state indicatorsFoglight for Exchange uses state indicators to show the severity level of alarms that have fired or the status of Exchange objects. The following state indicators and colors are used throughout the interface:
The Foglight alarm types respond to thresholds that are defined within the Foglight for Exchange rules. As metrics change and move through thresholds, alarms are raised. As a metric moves through thresholds, the severity of an alarm changes, which causes the associated state indicators to change.
For detailed information about the Foglight for Exchange rules and metrics, see Foglight for Exchange rules on page 164.
Mouse-over actionsMany items within the Foglight for Exchange dashboards display additional information when you hover your cursor over them. For example:
• Hover over a graph title to display a description of the graph
• Hover over the data point to display details (actual value and date/time stamp) that corresponds to the data point
Foglight for Exchange rolesFoglight controls user access using the concept of users, groups and roles. Each user can belong to one or more groups. The roles assigned to those groups determine the set of actions that the user can access.
NOTE: When multiple rules are specified, the ‘and’ operator is used and all rules must be met in order for an entry to be included in the search results.
Table 1. Alarms and state indicators
Fatal (red) There is a strong indication that the server is experiencing conditions which will degrade performance.
Critical (orange) Indicates that the current metric values point strongly towards performance-related problems with the specified component.
Warning (yellow) Represents a possible performance problem, based on calculations on current server metrics against best-practices thresholds.
Normal (green) Indicates the component is operating within normal thresholds.
A normal severity level indicates that there have been no warning, critical or fatal events fired. Foglight does not record events that are successful; it can only determine that there are no events that had problems.
NOTE: Clicking on a counter or graph displays a metrics popup that describes the counters, provides more detailed data points, and lists current alarms for the selected metric.
Foglight for Exchange 5.6.9User and Reference Guide
13
Foglight comes with a set of built-in roles. In addition to these built-in roles, Foglight for Exchange comes with the following additional built-in roles which control access to the dashboards in Foglight for Exchange.
• EX Administrator. Allows access to all dashboards in Foglight for Exchange.
• EX QuickView User. Allows access to the Exchange Environment dashboard in Foglight for Exchange.
• EX Report User. When implemented, this role will allow access to the Report Management dashboard and Exchange reports.
The Users & Security dashboard allows you to manage user access. To access this dashboard, on the navigation panel, select Dashboards > Administration > Users & Security Management. For more information on managing users and security, see the Foglight Administration and Configuration Guide or online help.
NOTE: The EX Report User role is available starting with cartridges installed with Foglight Management Server 5.6.2.
Foglight for Exchange 5.6.9User and Reference Guide
14

2
Exploring the Foglight for Exchange dashboards
Foglight for Exchange includes dashboards which aid in the monitoring, analysis and investigation of an Exchange environment’s health and performance.
These dashboards provide real-time views into the present state and relationships of the major components in your Exchange environment, including:
• Exchange Server Roles. There are five Exchange server roles that allow administrators to split up the functions of an Exchange server and place each role, or a combination of roles, on different servers. The views provided allow you to monitor the health of the servers hosting these Exchange roles.
• Exchange Servers. An Exchange server is any server that has Exchange services installed on it.
• Sites. A site is a logical grouping of computers within Active Directory® that have reliable connectivity. The views provided allow you to monitor the health of the sites that are hosting Exchange servers.
• Clusters. A cluster is composed of individual servers running cluster software which enables these computers to work together as a computer cluster, to provide failover and improve performance and availability over that of a single computer.
This chapter explains how to access the Exchange dashboards, describes the layout of each dashboard, and explains how to navigate through the embedded views of each dashboard:
• Accessing the Foglight for Exchange dashboards
• Exchange Alarms dashboard
• Exchange Environment dashboard
• Exchange Explorer dashboard
• Exchange Rule Management dashboard
For a description of the metrics captured in each of the embedded views, see Foglight for Exchange views.
Accessing the Foglight for Exchange dashboardsTo access the dashboards:
1 On the navigation panel, under Dashboards, click the expansion state box to the left of Exchange.
2 Click one of the dashboard items.
• Click Exchange Alarms to display a list of the current alarms triggered within Foglight for Exchange.
• Click Exchange Environment to display the Exchange Environment dashboard, which includes the following tabs:
• Monitoring: displays a summary of the Exchange servers being monitored and their current state.
Foglight for Exchange 5.6.9User and Reference Guide
15
• Administration: allows you to perform administrative tasks, including:
• Deploy the Exchange agent package, create and activate Exchange agents, and start or stop collecting data.
• View and manage rules that exist in your environment.
• View a list of diagnostic tests that are available, as well as run a test immediately or define a schedule for when a test is to be run.
• View, edit and enable/ disable the optional metric collections that are configurable for Exchange agents.
• Reports: allows you to build, view, and manage custom reports.
• FAQTs: displays questions relating to a selected object.
• Click Exchange Explorer to display performance metrics and alarms for an Exchange server or group of servers.
• Click Rule Management to view and manage Foglight for Exchange rules.
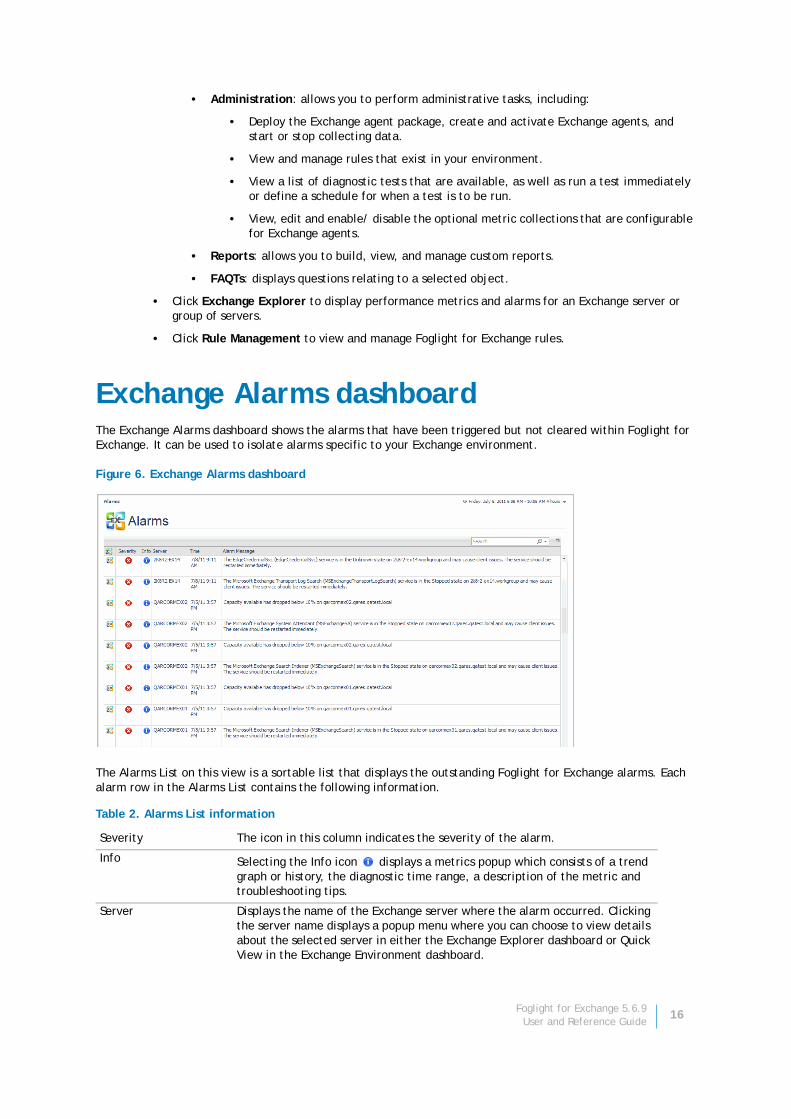
Exchange Alarms dashboardThe Exchange Alarms dashboard shows the alarms that have been triggered but not cleared within Foglight for Exchange. It can be used to isolate alarms specific to your Exchange environment.
Figure 6. Exchange Alarms dashboard
The Alarms List on this view is a sortable list that displays the outstanding Foglight for Exchange alarms. Each alarm row in the Alarms List contains the following information.
Table 2. Alarms List information
Severity The icon in this column indicates the severity of the alarm.
Info Selecting the Info icon displays a metrics popup which consists of a trend graph or history, the diagnostic time range, a description of the metric and troubleshooting tips.
Server Displays the name of the Exchange server where the alarm occurred. Clicking the server name displays a popup menu where you can choose to view details about the selected server in either the Exchange Explorer dashboard or Quick View in the Exchange Environment dashboard.
Foglight for Exchange 5.6.9User and Reference Guide
16

Clicking an alarm’s severity icon, object icon, alarm message, or time displays a popup where you can acknowledge or clear the alarm. This popup provides pertinent information about the selected alarm, such as the rule of origin of the alarm, the history of the alarm, and all of the notes attached to the alarm. For more information about managing alarms, see the Foglight User Guide or online help.
Exchange Environment dashboardThe Exchange Environment dashboard includes the following tabs:
• Monitoring: displays a summary of the Exchange servers being monitored and their current state. For details, see Exchange Environment > Monitoring tab.
• Administration: allows you to perform administrative tasks, including:
• Deploy the Exchange agent package, create and activate Exchange agents, and start or stop collecting data.
• View and manage rules that exist in your environment.
• View a list of diagnostic tests that are available, as well as run a test immediately or define a schedule for when a test is to be run.
• View, edit and enable/ disable the optional metric collections that are configurable for Exchange agents.
For details, see Exchange Environment > Administration tab.
• Reports: allows you to manage custom Exchange reports. For details, see Exchange Environment > Reports tab.
• FAQts: displays questions relating to a selected object. For details, see Exchange Environment > FAQts tab.
Exchange Environment > Monitoring tabThe Monitoring tab provides a summary of the Exchange servers in your environment, the Exchange roles performed by these servers, and the sites where these servers reside. This tab consists of the following views:
• Exchange Environment Overview
• Quick View
Exchange Environment OverviewThe Exchange Environment Overview is located across the top of the Exchange Environment dashboard. It provides you with an overview of your Exchange environment.
Figure 7. Exchange Environment Overview
Time Displays the date and time when the alarm occurred.
Alarm Message Displays the alarm message.
Table 2. Alarms List information
Foglight for Exchange 5.6.9User and Reference Guide
17
The overview contains a tile for the following object types in your Exchange infrastructure: roles, servers, sites and clusters. Each tile shows the number of corresponding objects of that type in your Exchange infrastructure as well as a count of objects of that type in each of the alarm states (fatal, critical, warning, and normal).
Clicking a tile displays summary information for that object type in the Quick View. Clicking an alarm state (for example, warning) on a tile displays summary information in the Quick View for the objects of that type that are in the selected alarm state.
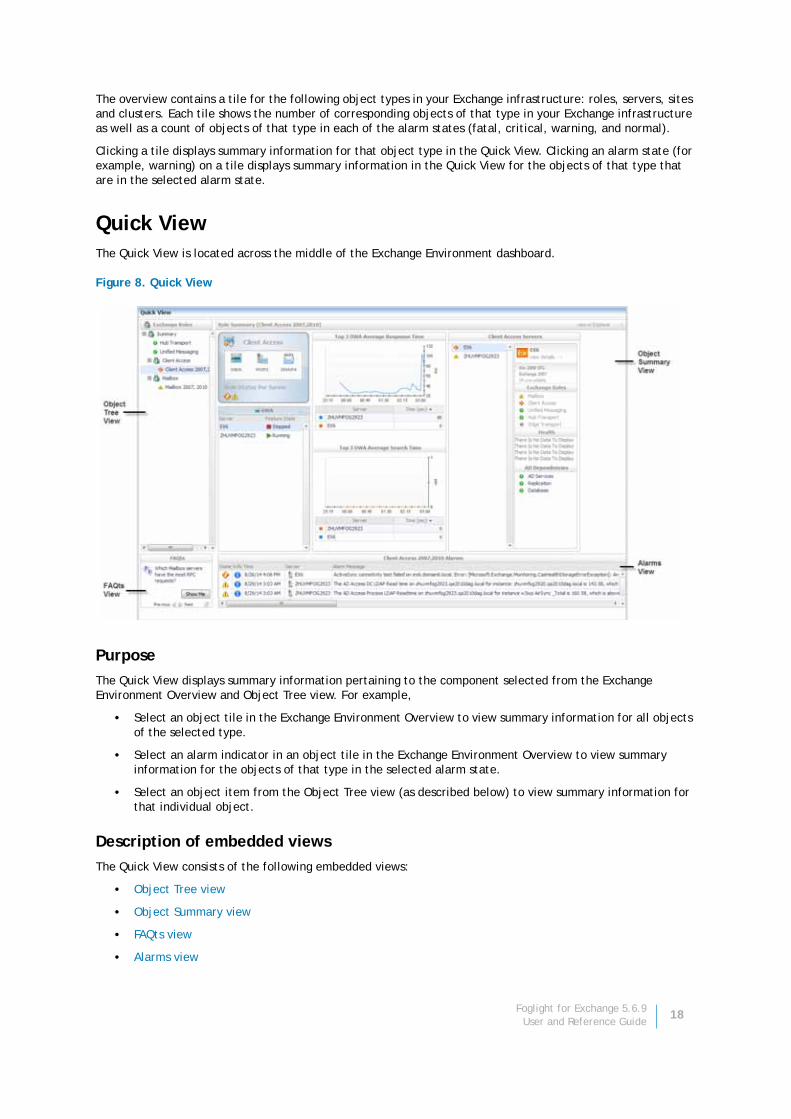
Quick ViewThe Quick View is located across the middle of the Exchange Environment dashboard.
Figure 8. Quick View
Purpose
The Quick View displays summary information pertaining to the component selected from the Exchange Environment Overview and Object Tree view. For example,
• Select an object tile in the Exchange Environment Overview to view summary information for all objects of the selected type.
• Select an alarm indicator in an object tile in the Exchange Environment Overview to view summary information for the objects of that type in the selected alarm state.
• Select an object item from the Object Tree view (as described below) to view summary information for that individual object.
Description of embedded views
The Quick View consists of the following embedded views:
• Object Tree view
• Object Summary view
• FAQts view
• Alarms view
Foglight for Exchange 5.6.9User and Reference Guide
18
Object Tree view
The Object Tree view is located at the left of the Quick View and displays objects based on the tile selected in the Exchange Environment Overview. Use the Object Tree view to select a single object or a group of objects of a particular type for display in the Object Summary view.
Object Summary view
The Object Summary view is located to the right of the Object Tree view and displays summary information for a single object or a group of objects, depending on what is selected in the Object Tree view.
The Object Summary view displays role, server, site, and cluster controller tiles (with the tile type reflecting the selected object type) or a number of embedded views which is determined by the item selected in the Exchange Environment Overview and Object Tree view. A role, server, site, or cluster controller tile provides a quick and easy view into the items that make up the selected Exchange object and the alarm states of these items.
In addition, in the top right of the Overview Summary view there is a link to the Exchange Explorer dashboard. This enables you to quickly navigate to the Exchange Explorer for more detailed metrics about the selected object or group of objects.
The following table lists the information displayed when the different object tiles are selected.
Table 3. Object Summary view information
Item Selected in OverviewItem Selected in Object Tree
Views Displayed in Object Summary View
Roles Tile Summary A role tile for each Exchange role defined in your Exchange environment.
Roles Tile - Alarm Indicator Summary A role tile for each Exchange role in the selected state.
Roles Tile or Alarm Indicator
Role Item In addition to a role tile for the selected role, the following embedded views are displayed based on the feature selected on the role tile:
• Server list
• Top 3 graphs
• Exchange Servers Details
Servers Tile Summary A server tile for each Exchange server in your environment.
Servers Tile - Alarm Indicator
Summary A server tile for each Exchange server in the selected state.
Servers Tile or Alarm Indicator
Server Item In addition to a server tile for the selected server, the following embedded views are displayed:
• Host Monitor View
• AD Dependencies
• Server Health View
• Exchange Roles View
Sites Tile Summary A site tile for each site in your Exchange environment.
Sites Tile - Alarm Indicator Summary A site tile for each site in the selected state.
Sites Tile or Alarm Indicator
Site Item In addition to a site tile for the selected site, the following embedded views are displayed:
• Server Listing
• Site By Category View
• Exchange Roles Top 3
Clusters Tile Summary A cluster tile for each cluster in your Exchange environment.
Foglight for Exchange 5.6.9User and Reference Guide
19
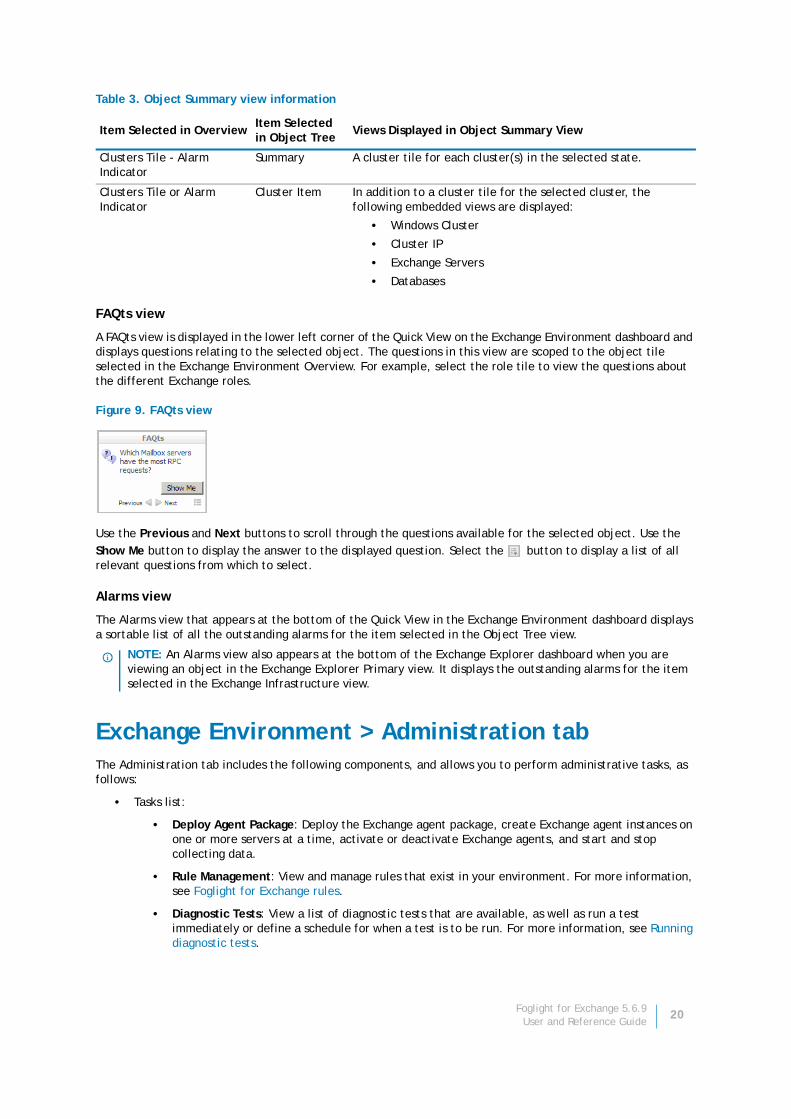
FAQts view
A FAQts view is displayed in the lower left corner of the Quick View on the Exchange Environment dashboard and displays questions relating to the selected object. The questions in this view are scoped to the object tile selected in the Exchange Environment Overview. For example, select the role tile to view the questions about the different Exchange roles.
Figure 9. FAQts view
Use the Previous and Next buttons to scroll through the questions available for the selected object. Use the Show Me button to display the answer to the displayed question. Select the button to display a list of all relevant questions from which to select.
Alarms view
The Alarms view that appears at the bottom of the Quick View in the Exchange Environment dashboard displays a sortable list of all the outstanding alarms for the item selected in the Object Tree view.
Exchange Environment > Administration tabThe Administration tab includes the following components, and allows you to perform administrative tasks, as follows:
• Tasks list:
• Deploy Agent Package: Deploy the Exchange agent package, create Exchange agent instances on one or more servers at a time, activate or deactivate Exchange agents, and start and stop collecting data.
• Rule Management: View and manage rules that exist in your environment. For more information, see Foglight for Exchange rules.
• Diagnostic Tests: View a list of diagnostic tests that are available, as well as run a test immediately or define a schedule for when a test is to be run. For more information, see Running diagnostic tests.
Clusters Tile - Alarm Indicator
Summary A cluster tile for each cluster(s) in the selected state.
Clusters Tile or Alarm Indicator
Cluster Item In addition to a cluster tile for the selected cluster, the following embedded views are displayed:
• Windows Cluster
• Cluster IP
• Exchange Servers
• Databases
NOTE: An Alarms view also appears at the bottom of the Exchange Explorer dashboard when you are viewing an object in the Exchange Explorer Primary view. It displays the outstanding alarms for the item selected in the Exchange Infrastructure view.
Table 3. Object Summary view information
Item Selected in OverviewItem Selected in Object Tree
Views Displayed in Object Summary View
Foglight for Exchange 5.6.9User and Reference Guide
20
• Metrics Management: View, edit, and enable/ disable the optional metric collections that are configurable for Exchange agents. For more information, see Managing Exchange metrics and Appendix: Exchange metrics.
• Agents view: Add and configure Exchange agents on one or more servers. Once added, the Agent Management view displays all of the Exchange agents configured to monitor Exchange metrics. For more information on using the Agent Setup wizard and the Agent Management view to manage your Exchange agents, see Managing Exchange agents.
Figure 10. Exchange Environment > Administration tab
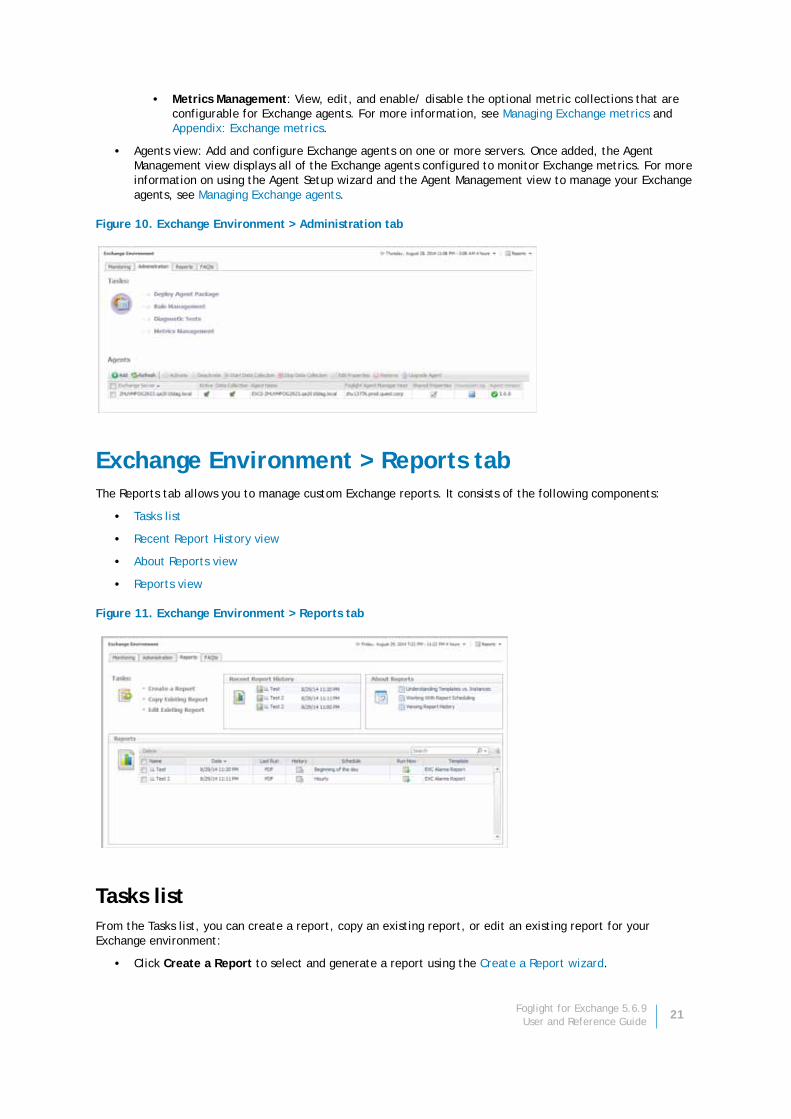
Exchange Environment > Reports tabThe Reports tab allows you to manage custom Exchange reports. It consists of the following components:
• Tasks list
• Recent Report History view
• About Reports view
• Reports view
Figure 11. Exchange Environment > Reports tab
Tasks listFrom the Tasks list, you can create a report, copy an existing report, or edit an existing report for your Exchange environment:
• Click Create a Report to select and generate a report using the Create a Report wizard.
Foglight for Exchange 5.6.9User and Reference Guide
21

• Click Copy Existing Report to duplicate an existing report using the Copy Existing Report wizard.
• Click Edit Existing Report to modify an existing report using the Edit Existing Report wizard.
Create a Report wizard
To create a report:
1 Start the Create a Report wizard.
2 On the Basic Configuration page, define the following settings, then click Next:
• Scheduled Report Name: Type a valid name for the report.
• Report Templates: Select the template on which you want to base your report. The Report Inputs section is populated with the template’s report parameters. Use the default parameters to quickly create a report, or optionally change the report parameters to customize the report to better meet your requirements. For more details about Exchange template reports, see Foglight for Exchange reports.
3 On the Advanced Configuration page, define the following settings, then click Finish:
• Schedule: Select the report schedule from the list of available options.
• Retained Results: Type the number of results retained for the report.
• Enabled: Select the check box if you want to enable the report. Clear the check box if you want to disable the report.
• Report Format: Select the report format from the list of available options.
• Email Recipients: Type the email addresses of the recipients to be notified when the report is generated.
The scheduled report is created and appears in the Reports view.
Copy Existing Report wizard
To copy an existing report:
1 Start the Copy Existing Report wizard.
2 On the Select Report page, select the report to be copied, then click Next.
3 On the Edit Report Configuration page, define the following settings, then click Finish:
• Scheduled Report Name: Type a valid name for the new report.
• Report Templates: The report template can not be modified, only the report parameters in the Report Inputs section at the bottom of the page.
• Schedule: Select the report schedule from the list of available options.
• Retained Results: Type the number of results retained for the report.
• Enabled: Select the check box if you want to enable the report. Clear the check box if you want to disable the report.
• Report Format: Select the report format from the list of available options.
• Email Recipients: Type the email addresses of the recipients to be notified when the report is generated.
The scheduled report is created and appears in the Reports view.
Edit Existing Report wizard
To edit an existing report:
1 Start the Edit Existing Report wizard.
Foglight for Exchange 5.6.9User and Reference Guide
22
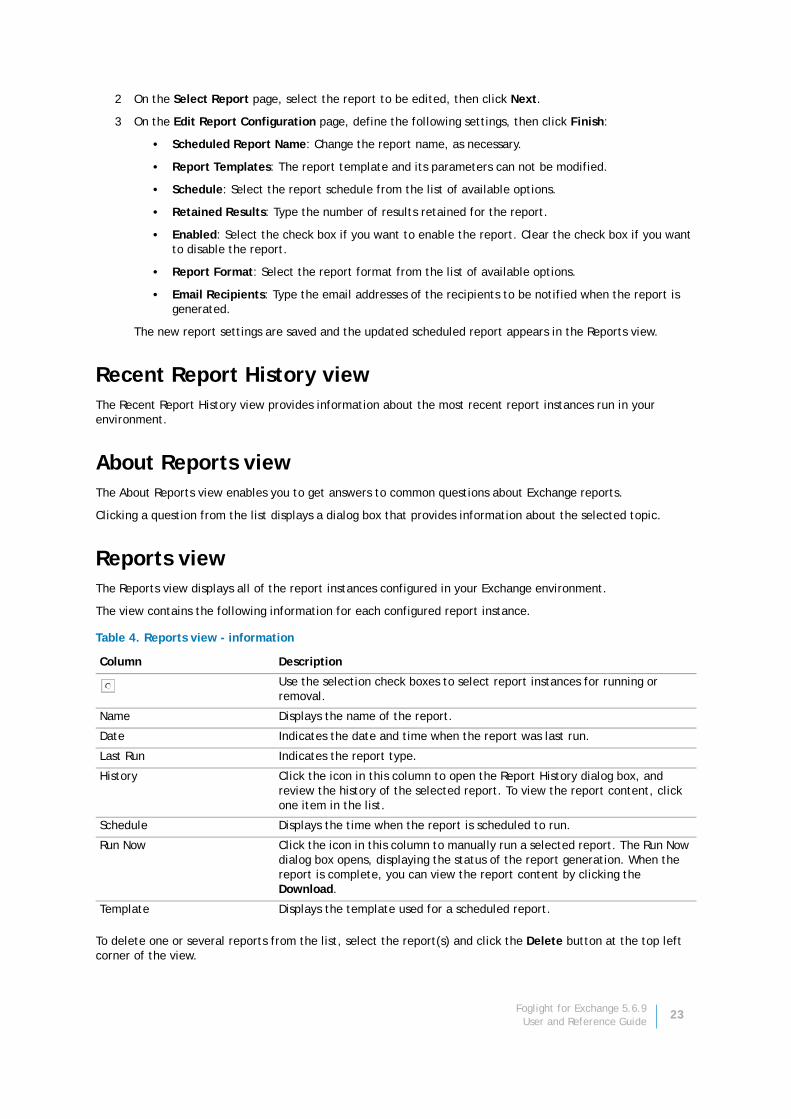
2 On the Select Report page, select the report to be edited, then click Next.
3 On the Edit Report Configuration page, define the following settings, then click Finish:
• Scheduled Report Name: Change the report name, as necessary.
• Report Templates: The report template and its parameters can not be modified.
• Schedule: Select the report schedule from the list of available options.
• Retained Results: Type the number of results retained for the report.
• Enabled: Select the check box if you want to enable the report. Clear the check box if you want to disable the report.
• Report Format: Select the report format from the list of available options.
• Email Recipients: Type the email addresses of the recipients to be notified when the report is generated.
The new report settings are saved and the updated scheduled report appears in the Reports view.
Recent Report History viewThe Recent Report History view provides information about the most recent report instances run in your environment.
About Reports viewThe About Reports view enables you to get answers to common questions about Exchange reports.
Clicking a question from the list displays a dialog box that provides information about the selected topic.
Reports viewThe Reports view displays all of the report instances configured in your Exchange environment.
The view contains the following information for each configured report instance.
To delete one or several reports from the list, select the report(s) and click the Delete button at the top left corner of the view.
Table 4. Reports view - information
Column Description
Use the selection check boxes to select report instances for running or removal.
Name Displays the name of the report.
Date Indicates the date and time when the report was last run.
Last Run Indicates the report type.
History Click the icon in this column to open the Report History dialog box, and review the history of the selected report. To view the report content, click one item in the list.
Schedule Displays the time when the report is scheduled to run.
Run Now Click the icon in this column to manually run a selected report. The Run Now dialog box opens, displaying the status of the report generation. When the report is complete, you can view the report content by clicking the Download.
Template Displays the template used for a scheduled report.
Foglight for Exchange 5.6.9User and Reference Guide
23
To search for a particular report, type the report name on the Search box at the top right corner of the view, then click Enter.
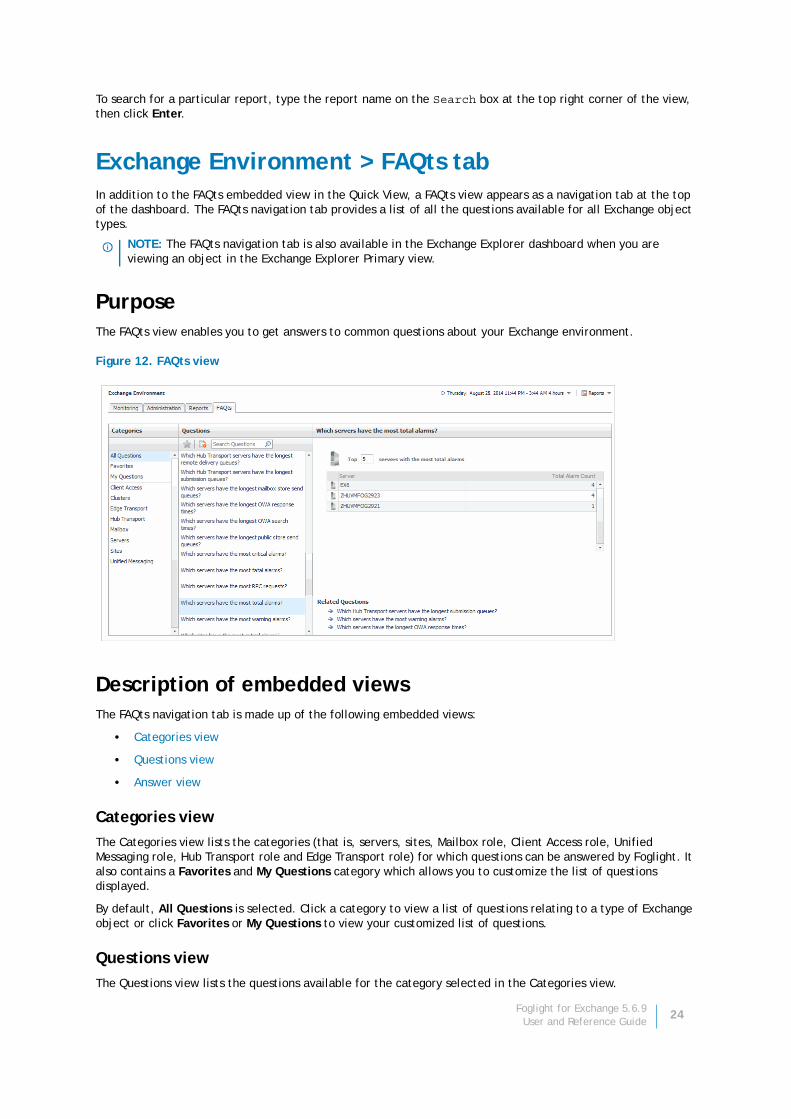
Exchange Environment > FAQts tabIn addition to the FAQts embedded view in the Quick View, a FAQts view appears as a navigation tab at the top of the dashboard. The FAQts navigation tab provides a list of all the questions available for all Exchange object types.
PurposeThe FAQts view enables you to get answers to common questions about your Exchange environment.
Figure 12. FAQts view
Description of embedded viewsThe FAQts navigation tab is made up of the following embedded views:
• Categories view
• Questions view
• Answer view
Categories view
The Categories view lists the categories (that is, servers, sites, Mailbox role, Client Access role, Unified Messaging role, Hub Transport role and Edge Transport role) for which questions can be answered by Foglight. It also contains a Favorites and My Questions category which allows you to customize the list of questions displayed.
By default, All Questions is selected. Click a category to view a list of questions relating to a type of Exchange object or click Favorites or My Questions to view your customized list of questions.
Questions view
The Questions view lists the questions available for the category selected in the Categories view.
NOTE: The FAQts navigation tab is also available in the Exchange Explorer dashboard when you are viewing an object in the Exchange Explorer Primary view.
Foglight for Exchange 5.6.9User and Reference Guide
24
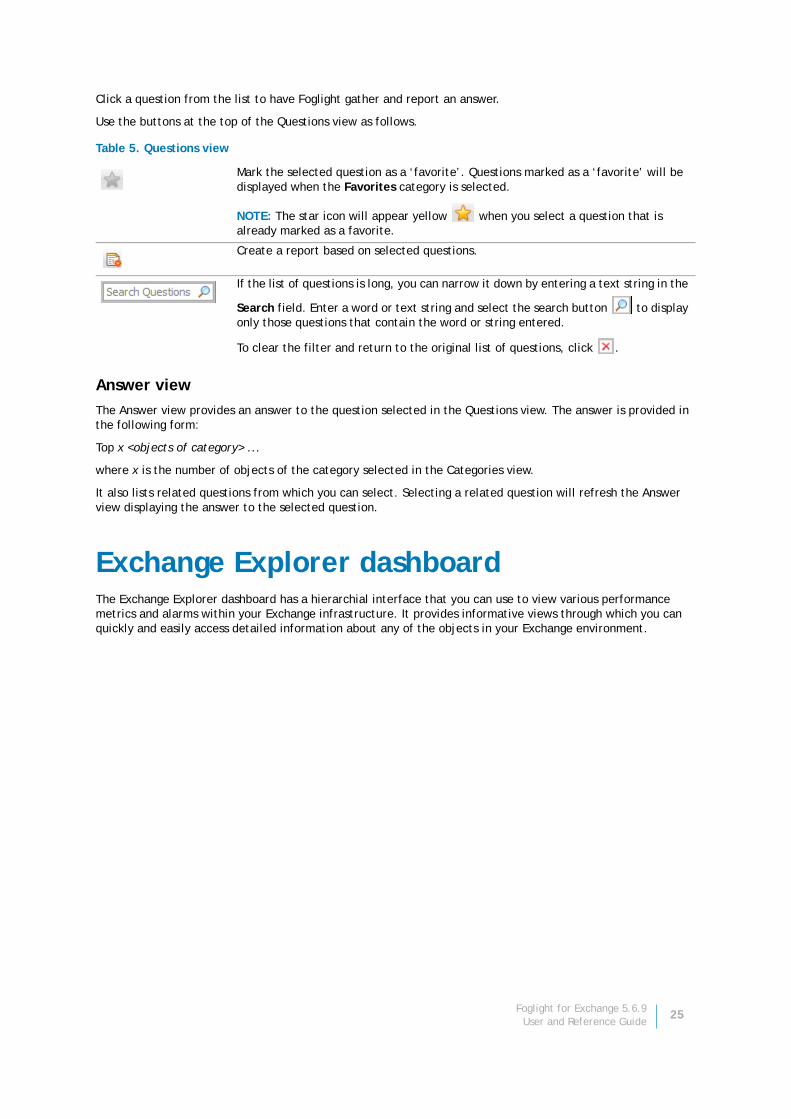
Click a question from the list to have Foglight gather and report an answer.
Use the buttons at the top of the Questions view as follows.
Answer view
The Answer view provides an answer to the question selected in the Questions view. The answer is provided in the following form:
Top x <objects of category> ...
where x is the number of objects of the category selected in the Categories view.
It also lists related questions from which you can select. Selecting a related question will refresh the Answer view displaying the answer to the selected question.
Exchange Explorer dashboardThe Exchange Explorer dashboard has a hierarchial interface that you can use to view various performance metrics and alarms within your Exchange infrastructure. It provides informative views through which you can quickly and easily access detailed information about any of the objects in your Exchange environment.
Table 5. Questions view
Mark the selected question as a ‘favorite’. Questions marked as a ‘favorite’ will be displayed when the Favorites category is selected.
NOTE: The star icon will appear yellow when you select a question that is already marked as a favorite.
Create a report based on selected questions.
If the list of questions is long, you can narrow it down by entering a text string in the
Search field. Enter a word or text string and select the search button to display only those questions that contain the word or string entered.
To clear the filter and return to the original list of questions, click .
Foglight for Exchange 5.6.9User and Reference Guide
25
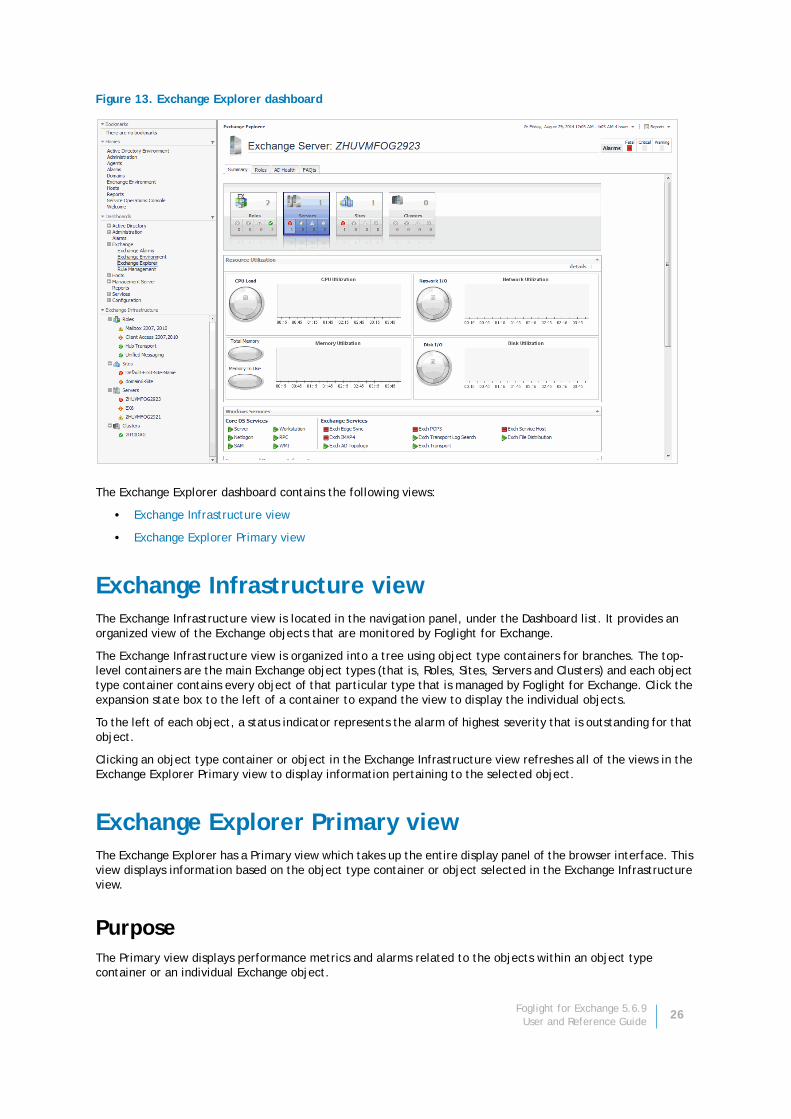
Figure 13. Exchange Explorer dashboard
The Exchange Explorer dashboard contains the following views:
• Exchange Infrastructure view
• Exchange Explorer Primary view
Exchange Infrastructure viewThe Exchange Infrastructure view is located in the navigation panel, under the Dashboard list. It provides an organized view of the Exchange objects that are monitored by Foglight for Exchange.
The Exchange Infrastructure view is organized into a tree using object type containers for branches. The top-level containers are the main Exchange object types (that is, Roles, Sites, Servers and Clusters) and each object type container contains every object of that particular type that is managed by Foglight for Exchange. Click the expansion state box to the left of a container to expand the view to display the individual objects.
To the left of each object, a status indicator represents the alarm of highest severity that is outstanding for that object.
Clicking an object type container or object in the Exchange Infrastructure view refreshes all of the views in the Exchange Explorer Primary view to display information pertaining to the selected object.
Exchange Explorer Primary viewThe Exchange Explorer has a Primary view which takes up the entire display panel of the browser interface. This view displays information based on the object type container or object selected in the Exchange Infrastructure view.
PurposeThe Primary view displays performance metrics and alarms related to the objects within an object type container or an individual Exchange object.
Foglight for Exchange 5.6.9User and Reference Guide
26
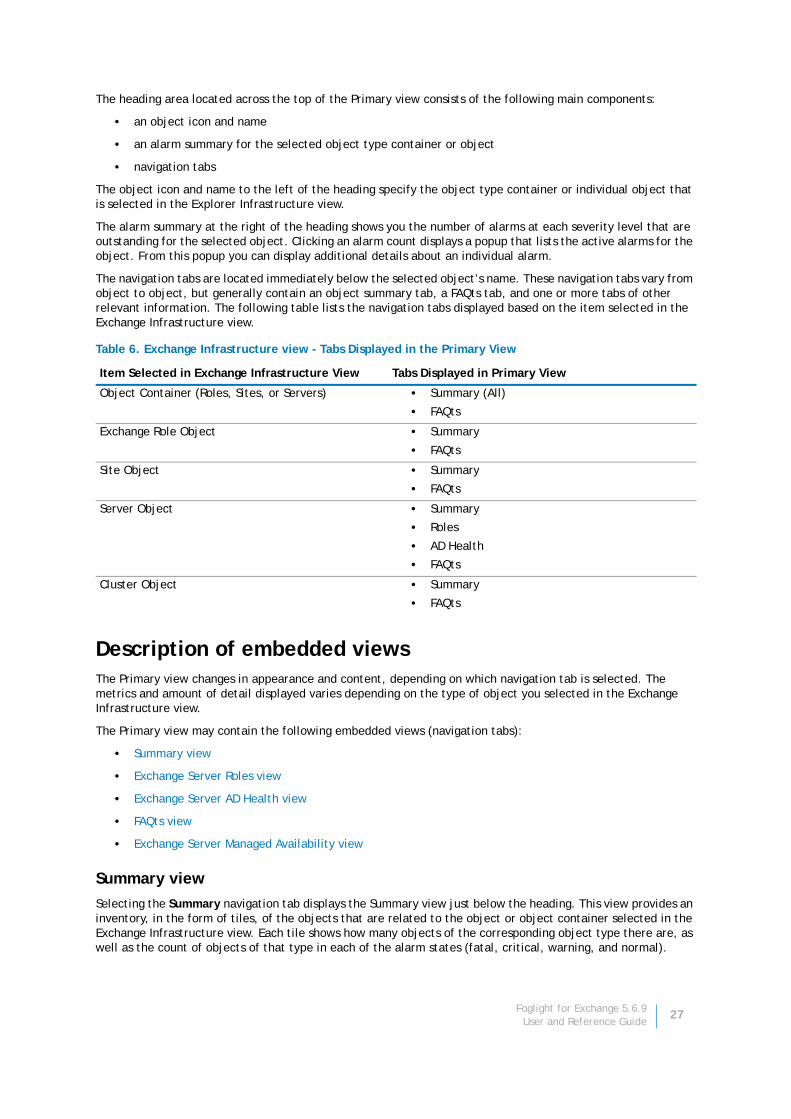
The heading area located across the top of the Primary view consists of the following main components:
• an object icon and name
• an alarm summary for the selected object type container or object
• navigation tabs
The object icon and name to the left of the heading specify the object type container or individual object that is selected in the Explorer Infrastructure view.
The alarm summary at the right of the heading shows you the number of alarms at each severity level that are outstanding for the selected object. Clicking an alarm count displays a popup that lists the active alarms for the object. From this popup you can display additional details about an individual alarm.
The navigation tabs are located immediately below the selected object’s name. These navigation tabs vary from object to object, but generally contain an object summary tab, a FAQts tab, and one or more tabs of other relevant information. The following table lists the navigation tabs displayed based on the item selected in the Exchange Infrastructure view.
Description of embedded viewsThe Primary view changes in appearance and content, depending on which navigation tab is selected. The metrics and amount of detail displayed varies depending on the type of object you selected in the Exchange Infrastructure view.
The Primary view may contain the following embedded views (navigation tabs):
• Summary view
• Exchange Server Roles view
• Exchange Server AD Health view
• FAQts view
• Exchange Server Managed Availability view
Summary view
Selecting the Summary navigation tab displays the Summary view just below the heading. This view provides an inventory, in the form of tiles, of the objects that are related to the object or object container selected in the Exchange Infrastructure view. Each tile shows how many objects of the corresponding object type there are, as well as the count of objects of that type in each of the alarm states (fatal, critical, warning, and normal).
Table 6. Exchange Infrastructure view - Tabs Displayed in the Primary View
Item Selected in Exchange Infrastructure View Tabs Displayed in Primary View
Object Container (Roles, Sites, or Servers) • Summary (All)
• FAQts
Exchange Role Object • Summary
• FAQts
Site Object • Summary
• FAQts
Server Object • Summary
• Roles
• AD Health
• FAQts
Cluster Object • Summary
• FAQts
Foglight for Exchange 5.6.9User and Reference Guide
27
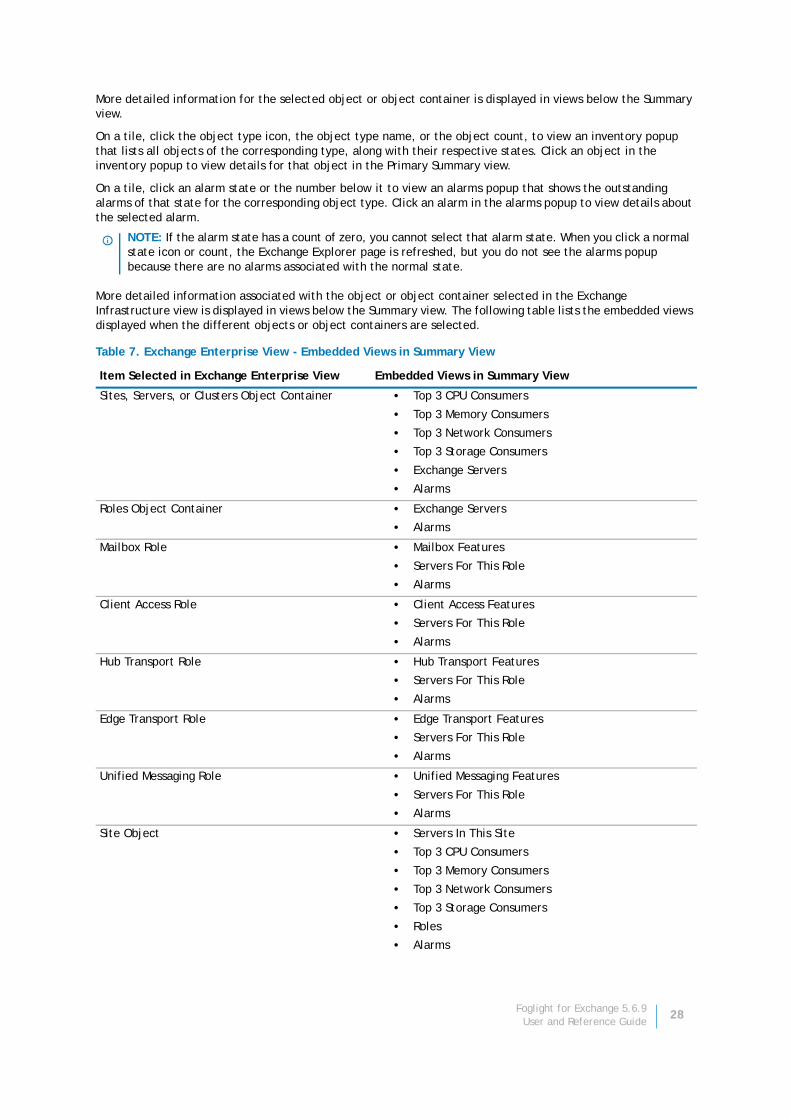
More detailed information for the selected object or object container is displayed in views below the Summary view.
On a tile, click the object type icon, the object type name, or the object count, to view an inventory popup that lists all objects of the corresponding type, along with their respective states. Click an object in the inventory popup to view details for that object in the Primary Summary view.
On a tile, click an alarm state or the number below it to view an alarms popup that shows the outstanding alarms of that state for the corresponding object type. Click an alarm in the alarms popup to view details about the selected alarm.
More detailed information associated with the object or object container selected in the Exchange Infrastructure view is displayed in views below the Summary view. The following table lists the embedded views displayed when the different objects or object containers are selected.
NOTE: If the alarm state has a count of zero, you cannot select that alarm state. When you click a normal state icon or count, the Exchange Explorer page is refreshed, but you do not see the alarms popup because there are no alarms associated with the normal state.
Table 7. Exchange Enterprise View - Embedded Views in Summary View
Item Selected in Exchange Enterprise View Embedded Views in Summary View
Sites, Servers, or Clusters Object Container • Top 3 CPU Consumers
• Top 3 Memory Consumers
• Top 3 Network Consumers
• Top 3 Storage Consumers
• Exchange Servers
• Alarms
Roles Object Container • Exchange Servers
• Alarms
Mailbox Role • Mailbox Features
• Servers For This Role
• Alarms
Client Access Role • Client Access Features
• Servers For This Role
• Alarms
Hub Transport Role • Hub Transport Features
• Servers For This Role
• Alarms
Edge Transport Role • Edge Transport Features
• Servers For This Role
• Alarms
Unified Messaging Role • Unified Messaging Features
• Servers For This Role
• Alarms
Site Object • Servers In This Site
• Top 3 CPU Consumers
• Top 3 Memory Consumers
• Top 3 Network Consumers
• Top 3 Storage Consumers
• Roles
• Alarms
Foglight for Exchange 5.6.9User and Reference Guide
28

Exchange Server Roles view
When an individual server is selected in the Exchange Infrastructure view, the Roles navigation tab appears. The content of this view is based on the Exchange role selected at the top of the Exchange Server Roles view. By default, each role view displays performance metrics and information for the Exchange roles being performed by the selected Exchange server. Additional metrics can optionally be displayed by enabling the corresponding collection group on the Exchange Metrics Management dashboard.
Exchange Server AD Health view
When an individual server is selected in the Exchange Infrastructure view, the AD Health navigation tab appears. This tab displays the Exchange Server AD Health view, which displays performance metrics about the DCs in your Active Directory® environment.
FAQts view
Selecting the FAQts navigation tab displays a list of all the questions available for all Exchange object types.
Exchange Server Managed Availability view
When an individual Exchange 2013 server is selected in the Exchange Infrastructure view, the Managed Availability navigation tab appears.
The Managed Availability Recovery Action results view on this tab displays a list of actions that the Managed Availability process triggered to address availability and latency issues or errors, in order to resume the service. For each action, the list displays the time when it was logged. In addition, the Message column contains the description of the recovery action. Click the Probe Results column to review the detected errors that possibly triggered the recovery action.
Exchange Rule Management dashboardThe Exchange Rule Management dashboard contains a sortable list of the conditional severity rules used by the Foglight for Exchange. From this dashboard you can quickly see which conditional rules are enabled/disabled, the states (fatal, critical or warning) with active conditions, recommended alarm threshold values, rules with current alarms, and a brief description of each rule.
For a description of the Exchange Rule Management dashboard and for more information on the Foglight for Exchange rules and how to enable, disable or modify them, see Foglight for Exchange rules.
Server Object • Resource Utilization
• Windows Services
• Summary and Resource Information
• Alarms
Cluster Object • Windows Cluster Summary Information
• Exchange Servers In This Cluster
• Databases
• Top 3 CPU Consumers
• Top 3 Memory Consumers
• Top 3 Network Consumers
• Top 3 Storage Consumers
• Alarms
NOTE: The FAQts navigation tab is also available in the Exchange Environment dashboard. See Exchange Environment > FAQts tab for more information.
Table 7. Exchange Enterprise View - Embedded Views in Summary View
Item Selected in Exchange Enterprise View Embedded Views in Summary View
Foglight for Exchange 5.6.9User and Reference Guide
29
3
Managing Exchange agents
The Exchange agents collect data from remote Exchange servers, which is then used to populate the health and performance metrics presented throughout the Foglight for Exchange dashboards and views.
Foglight for Exchange provides an additional dashboard that can be used to manage Exchange agent instances. Therefore, the Exchange agent instances can be created and managed using one of the following dashboards:
• Agent Status dashboard (Dashboards > Administration > Agents > Agent Status)
• Exchange Environment dashboard > Administration tab (Dashboards > Exchange Environment > Administration tab)
This chapter describes the Deploy Agent Package dialog, the Agent Setup wizard which is used to add and configure new Exchange agents and the Agent Management view which is populated with information about each Exchange agent instance. It also provides a description of the Exchange agent properties used to connect to the target server from which data is to be collected.
For more details, see these topics:
• Agent Status dashboard
• Exchange agent management
• Exchange agent properties
Agent Status dashboardThe Agent Status dashboard allows you to deploy agent packages and create agent instances one host at a time. Once an agent is created, use this dashboard to view agent information and edit the properties of one or more agents.
For more information about using the Agent Status dashboard to create and manage agent instances, see “Deploying agent packages to monitored hosts” in the Foglight Administration and Configuration Help.
Exchange agent managementThe Exchange Environment dashboard > Administration tab allows you to deploy the Exchange agent package, create Exchange agent instances for one or more servers at a time, activate or deactivate Exchange agents, and start and stop collecting data.
The Administration tab consists of the following components:
• Tasks list
• Agent Management view
Tasks listThe Tasks list, in the upper left corner of the view, contains a list of tasks that can be performed from this view.
Foglight for Exchange 5.6.9User and Reference Guide
30
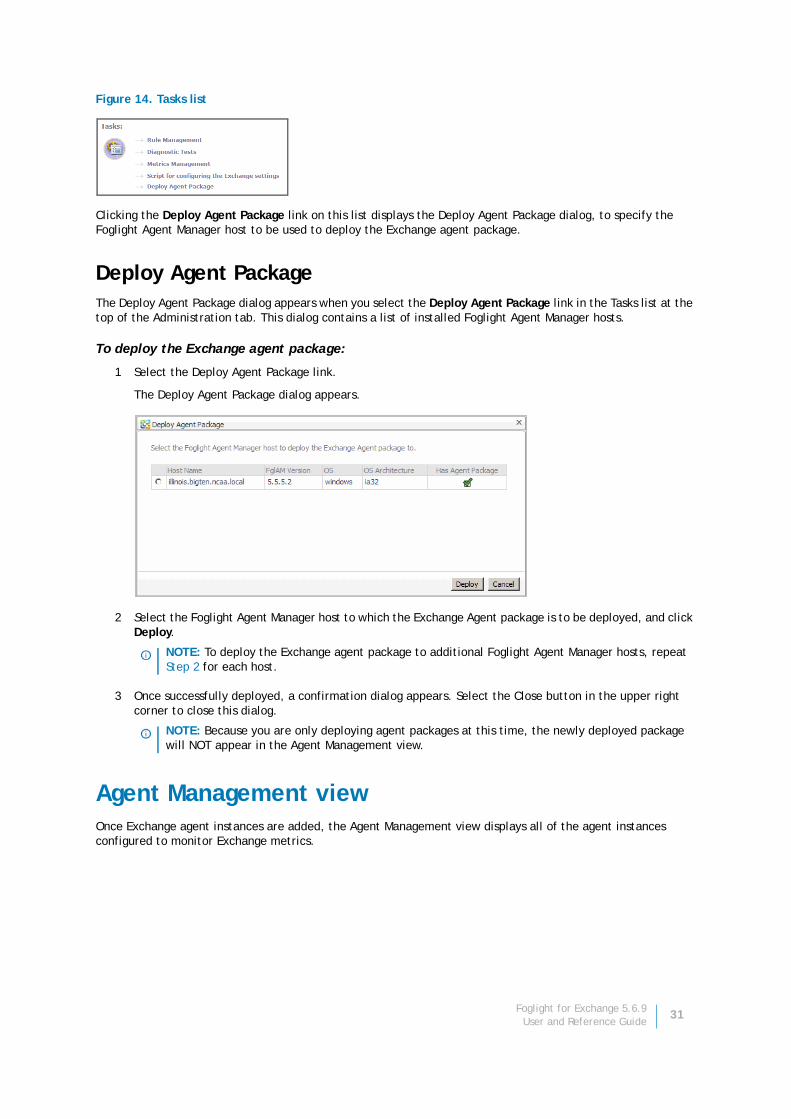
Figure 14. Tasks list
Clicking the Deploy Agent Package link on this list displays the Deploy Agent Package dialog, to specify the Foglight Agent Manager host to be used to deploy the Exchange agent package.
Deploy Agent PackageThe Deploy Agent Package dialog appears when you select the Deploy Agent Package link in the Tasks list at the top of the Administration tab. This dialog contains a list of installed Foglight Agent Manager hosts.
To deploy the Exchange agent package:
1 Select the Deploy Agent Package link.
The Deploy Agent Package dialog appears.
2 Select the Foglight Agent Manager host to which the Exchange Agent package is to be deployed, and click Deploy.
3 Once successfully deployed, a confirmation dialog appears. Select the Close button in the upper right corner to close this dialog.
Agent Management viewOnce Exchange agent instances are added, the Agent Management view displays all of the agent instances configured to monitor Exchange metrics.
NOTE: To deploy the Exchange agent package to additional Foglight Agent Manager hosts, repeat Step 2 for each host.
NOTE: Because you are only deploying agent packages at this time, the newly deployed package will NOT appear in the Agent Management view.
Foglight for Exchange 5.6.9User and Reference Guide
31
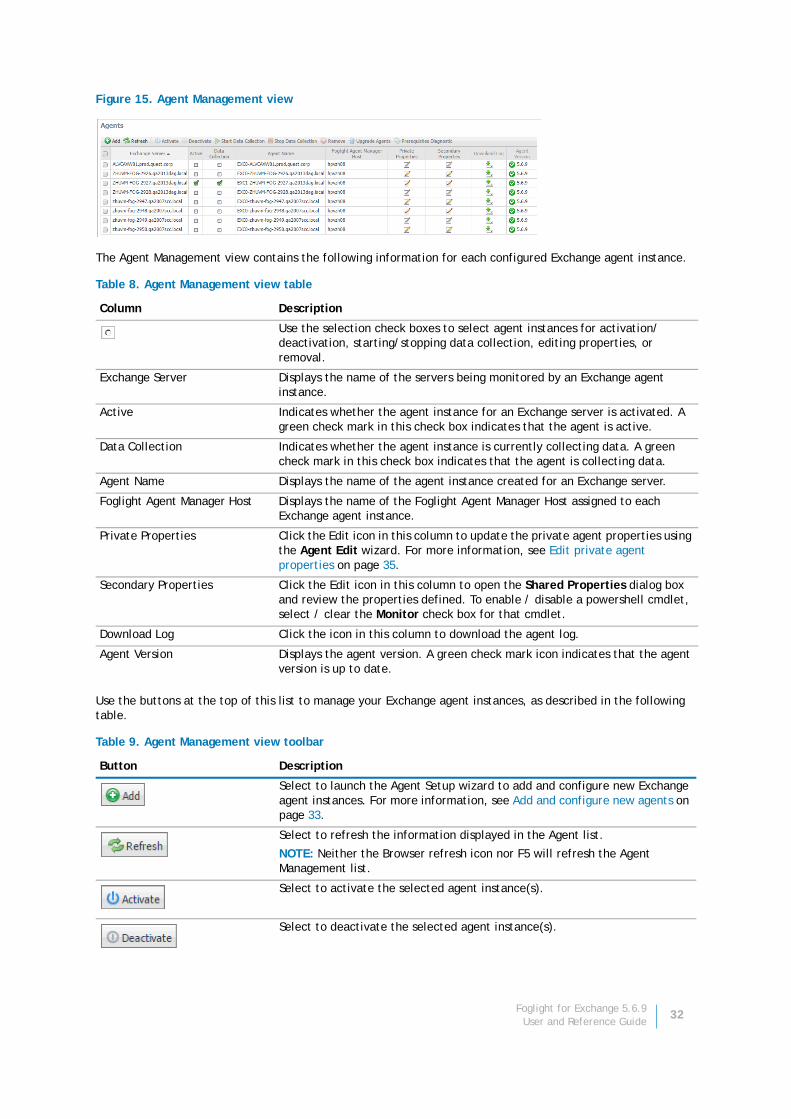
Figure 15. Agent Management view
The Agent Management view contains the following information for each configured Exchange agent instance.
Use the buttons at the top of this list to manage your Exchange agent instances, as described in the following table.
Table 8. Agent Management view table
Column Description
Use the selection check boxes to select agent instances for activation/deactivation, starting/stopping data collection, editing properties, or removal.
Exchange Server Displays the name of the servers being monitored by an Exchange agent instance.
Active Indicates whether the agent instance for an Exchange server is activated. A green check mark in this check box indicates that the agent is active.
Data Collection Indicates whether the agent instance is currently collecting data. A green check mark in this check box indicates that the agent is collecting data.
Agent Name Displays the name of the agent instance created for an Exchange server.
Foglight Agent Manager Host Displays the name of the Foglight Agent Manager Host assigned to each Exchange agent instance.
Private Properties Click the Edit icon in this column to update the private agent properties using the Agent Edit wizard. For more information, see Edit private agent properties on page 35.
Secondary Properties Click the Edit icon in this column to open the Shared Properties dialog box and review the properties defined. To enable / disable a powershell cmdlet, select / clear the Monitor check box for that cmdlet.
Download Log Click the icon in this column to download the agent log.
Agent Version Displays the agent version. A green check mark icon indicates that the agent version is up to date.
Table 9. Agent Management view toolbar
Button Description
Select to launch the Agent Setup wizard to add and configure new Exchange agent instances. For more information, see Add and configure new agents on page 33.
Select to refresh the information displayed in the Agent list.
NOTE: Neither the Browser refresh icon nor F5 will refresh the Agent Management list.
Select to activate the selected agent instance(s).
Select to deactivate the selected agent instance(s).
Foglight for Exchange 5.6.9User and Reference Guide
32

Add and configure new agentsThe Agent Setup wizard guides you through the process of adding and configuring Exchange agent instances on one or more servers.
To add and configure a new agent:
1 At the top of the Agent Management view, click Add to launch the Agent Setup wizard.
2 On the Prepare page, carefully read the instructions about the steps that you need to take before proceeding with the wizard.
You can either manually configure your Exchange environment for monitoring, or download and run a script that automatically configures the Exchange servers. To download the script, click Script for configuring the Exchange settings.
When done, click Next.
3 On the Select the Agent Manager Host page, select the Foglight Agent Manager host to be used for the new Exchange agent instances.
The table displays the following Foglight Agent Manager information (the same information is displayed on the Administration > Agents > Agent Hosts dashboard):
• Host Name
• Agent Manager version
• OS type
• OS Architecture
The Has Agent Package column indicates whether the Exchange agent package is already deployed to the Agent Manager host(s). A green check in this column indicates that the Exchange agent package has been deployed.
Click Next.
4 On the Select Auto-Discover or Manual Configuration page, indicate if you want to manually configure an agent to monitor a single Exchange server, or search your domain and auto-discover Exchange servers and create one or several agents. Click Next.
• If you selected Auto Discover, continue with Step 5.
• If you selected Manual, continue with Step 7.
Select to start collecting data on the selected agent instance(s).
Select to stop collecting data on the selected agent instance(s).
Select to remove the selected agent instance(s).
Create and automatically assign credentials for Exchange agents created before version 5.6.6.
Verify agent configuration. For more information, see Inspect agent prerequisites on page 36.
NOTE: This value is not aware of a package’s version. Therefore, if you have upgraded the cartridge, you must deploy the new agent package even if this column indicates that the FglaM host already has an agent package.
Table 9. Agent Management view toolbar
Button Description
Foglight for Exchange 5.6.9User and Reference Guide
33
5 On the Select the Search Domain page, specify the domain to be used to search for Exchange servers where Exchange agent instances are to be created and activated.
• Domain: Type the fully qualified name (myDomain.com) of a domain to search for Exchange servers.
• User Name: Type the user principal name ([email protected]) of the account to be used to query Active Directory® on the selected domain.
• Password: Enter the password associated with the above user account.
• Enable SSL For LDAP: Selecting this check box if security LDAP is required.
Click Next.
6 On the Select Servers page, select one or more Exchange servers that you want to monitor.
This page displays the following information about the Exchange servers found on the selected domain:
• Exchange Server: The name of the Exchange server found on the selected domain.
• Has Agent: Indicates whether an Exchange agent instance has already been created for an Exchange server. A green check mark in this check box indicates that an agent instance is already created to monitor the Exchange server.
Click Next.
7 On the Configure Agent Properties page, review the Exchange agent properties, and edit them, as necessary.
• Exchange Server(s): The name of one or more Exchange servers found on the selected domain.
• Domain Controller: The name of the domain controller found on the selected domain.
• Is a Virtual Host: Indicates if the selected Exchange server runs on a virtual host.
• Virtual Environment: The type of the virtual environment: VMware® or Hyper-V®. This property only appears if the selected Exchange server runs on a virtual host.
• Communication Protocol: Selects to run the WMI query through DCOM or WinRM.
• WinRM Port: The WinRM port number on the monitored server. This property only appears if the Communication Protocol is set to WinRM through HTTP or WinRM through HTTPS.
• LDAP Authentication Scheme: The authentication scheme used to connect to the LDAP server: Simple (default) or Kerberos.
• Enable SSL For LDAP: Indicates if the LDAP connection is secure or not (default).
• Enable ActiveSync Collection: Indicates if the collection of ActiveSync Top N users is disabled or enabled.
• IIS Log Folder: The file path to the IIS log on the Exchange Client Access Server.
• ActiveSync Collection Time: The time when the ActiveSync collection task starts.
• Top N Users: The number of top N users for which data is submitted to the Management Server.
Click Next.
8 On the Assign and Validate Credentials page, review the available credentials, and edit them, as necessary.
• To create a new credential, click Add host(s) to a new credential.
• In the Create New Credential and Assign dialog box, create a credential that you want to use to access the monitored resource. Type a new credential name, domain, user name, password, and lockbox, and click Submit.
• To select an existing credential, click Add host(s) to a new credential.
NOTE: All selected servers will use the same user credentials for access.
Foglight for Exchange 5.6.9User and Reference Guide
34
• In the Select Existing Credential dialog box, select an existing credential, and click Submit.
Click Next.
9 On the Summary page, review the configuration settings chosen for the new agent, and its prerequisite diagnostics, including:
• Agent Name: The name of the selected Exchange agent instance.
• Agent Creation Result: Success or Error.
• Diagnostic Result:
• Success: The agent instance can connect to the monitored Exchange server and collect data.
• Error: The agent instance cannot connect to the monitored Exchange server instance and collect data. Click this link to find out what causes this error. Carefully review the information in the popup that appears in order address the problem.
Click Finish.
The Agent Setup wizard closes. The Exchange agent is now added and configured, and appears in the Agent Management view, on the Administration tab.
Edit private agent propertiesThe Agent Edit wizard guides you through the process of editing private agent properties.
To edit private agent properties:
1 In the Agent Management view, in the row containing the agent whose properties you want to edit, click the Private Properties column.
2 In the Agent Setup wizard, on the Configure Agent Properties page, review the Exchange agent properties, and edit them, as necessary.
• Exchange Server(s): The name of one or more Exchange servers found on the selected domain.
• Domain Controller: The name of the domain controller found on the selected domain.
• Is a Virtual Host: Indicates if the selected Exchange server runs on a virtual host.
• Virtual Environment: The type of the virtual environment: VMware® or Hyper-V®. This property only appears if the selected Exchange server runs on a virtual host.
• Communication Protocol: Selects to run the WMI query through DCOM or WinRM.
• WinRM Port: The WinRM port number on the monitored server. This property only appears if the Communication Protocol is set to WinRM through HTTP or WinRM through HTTPS.
• LDAP Authentication Scheme: The authentication scheme used to connect to the LDAP server: Simple (default) or Kerberos.
• Enable SSL For LDAP: Indicates if the LDAP connection is secure or not (default).
• Enable ActiveSync Collection: Indicates if the collection of ActiveSync Top N users is disabled or enabled.
• IIS Log Folder: The file path to the IIS log on the Exchange Client Access Server.
• ActiveSync Collection Time: The time when the ActiveSync collection task starts.
• Top N Users: The number of top N users for which data is submitted to the Management Server.
Click Next.
3 On the Assign and Validate Credentials page, review the available credentials, and edit them, as necessary.
Foglight for Exchange 5.6.9User and Reference Guide
35
• To create a new credential, click Add host(s) to a new credential.
• In the Create New Credential and Assign dialog box, create a credential that you want to use to access the monitored resource. Type a new credential name, domain, user name, password, and lockbox, and click Submit.
• To select an existing credential, click Add host(s) to a new credential.
• In the Select Existing Credential dialog box, select an existing credential, and click Submit.
Click Next.
4 On the Summary page, review the newly updated configuration settings, then click Finish.
The Agent Edit wizard closes. The private properties are now updated.
Inspect agent prerequisitesIf any monitoring agents are unable to collect data or connect to the monitored Exchange servers, you can inspect the underlying cause using the Prerequisites Diagnostic button on the Agent Management toolbar.
To examine agent prerequisites:
1 In the Agent Management view, select the row containing the agent whose prerequisites you want to examine, and click Prerequisites Diagnostic on the toolbar.
2 Observe the results in the Prerequisites Diagnostic dialog box.
• Agent Name: The name of the selected Exchange agent instance.
• Monitored Host: The name of the host on which the monitored Exchange server is running.
• Diagnostic Result:
• Success: The agent instance can connect to the monitored Exchange server and collect data.
• Error: The agent instance cannot connect to the monitored Exchange server instance and collect data. Click this link to find out what causes this error. Carefully review the information in the popup that appears in order address the problem.
Exchange agent propertiesThe primary properties for an Exchange agent instance are required to connect to the target server from which data is to be collected. These properties are either specified when the agent instance is configured or they have a pre-defined default value.
To display an agent’s properties page, use one of the following methods:
• From the navigation panel, navigate to Dashboards > Administration > Agents > Agent Properties. On the Agent Properties dashboard, select an agent. The Properties panel is displayed, showing the current properties for the selected agent instance.
• From the navigation panel, navigate to Dashboards > Administration > Agents > Agent Status. On the Agent Status dashboard, select an agent from the list and click Edit > Edit Properties. The Agent Status dashboard refreshes, showing the current properties for the selected agent instance.
Foglight for Exchange 5.6.9User and Reference Guide
36

Figure 16. Exchange agent properties
For more information on using the Agent Status dashboard to edit agent properties, see the Foglight Administration and Configuration Help.
The following tables describe the properties that can be modified for either an individual or all Exchange agent instances, by clicking Modify the private properties for this agent or Modify the properties of all ExchangeAgent agents links, respectively.
• Configuration
• Monitor
• Data Collection Scheduler
ConfigurationUse the properties in the Configuration panel to specify the target server from which data is to be collected, to define what cartridge is to be used to collect the host metrics, and specify whether the target server is a virtual machine.
NOTE: It is recommended to configure the agent properties that are to be applied globally to the majority of the Exchange agent instances, then modify the private properties of those individual agents, as required.
NOTE: The properties defined here apply to either a single Exchange agent or all agents with the type of ExchangeAgent based on the option selected in the Property Scope area at the top of the Agent Status dashboard.
Foglight for Exchange 5.6.9User and Reference Guide
37
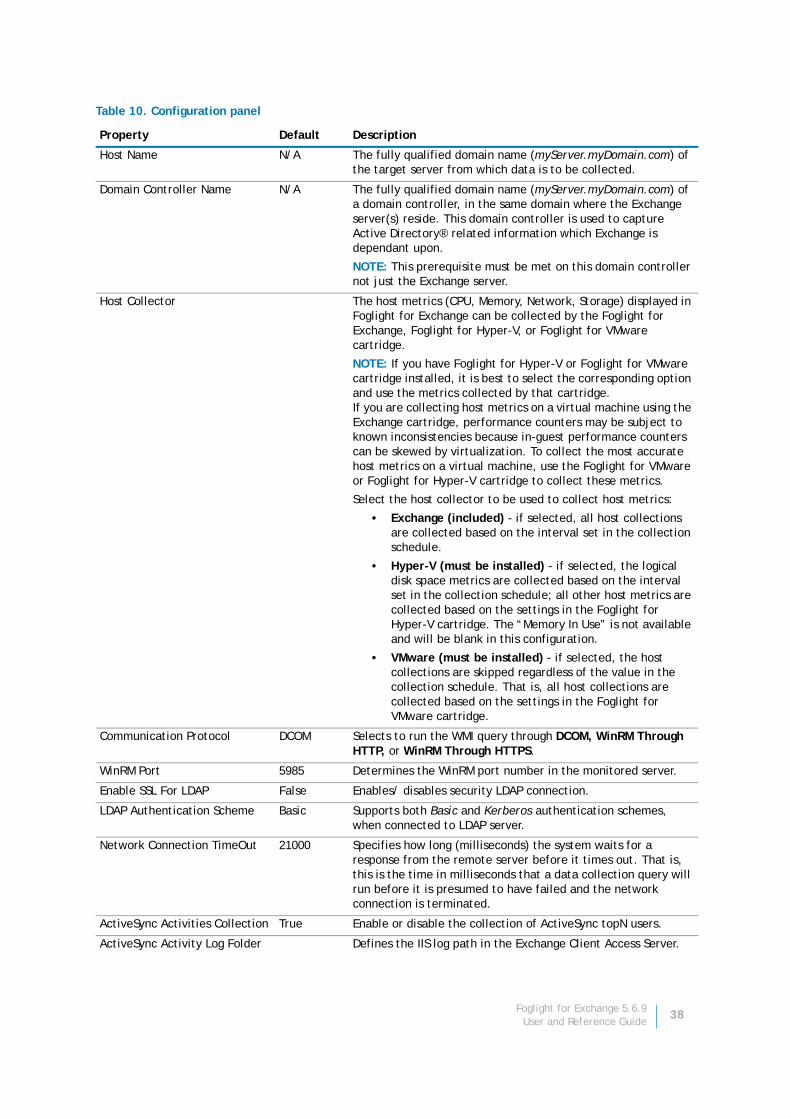
Table 10. Configuration panel
Property Default Description
Host Name N/A The fully qualified domain name (myServer.myDomain.com) of the target server from which data is to be collected.
Domain Controller Name N/A The fully qualified domain name (myServer.myDomain.com) of a domain controller, in the same domain where the Exchange server(s) reside. This domain controller is used to capture Active Directory® related information which Exchange is dependant upon.
NOTE: This prerequisite must be met on this domain controller not just the Exchange server.
Host Collector The host metrics (CPU, Memory, Network, Storage) displayed in Foglight for Exchange can be collected by the Foglight for Exchange, Foglight for Hyper-V, or Foglight for VMware cartridge.
NOTE: If you have Foglight for Hyper-V or Foglight for VMware cartridge installed, it is best to select the corresponding option and use the metrics collected by that cartridge. If you are collecting host metrics on a virtual machine using the Exchange cartridge, performance counters may be subject to known inconsistencies because in-guest performance counters can be skewed by virtualization. To collect the most accurate host metrics on a virtual machine, use the Foglight for VMware or Foglight for Hyper-V cartridge to collect these metrics.
Select the host collector to be used to collect host metrics:
• Exchange (included) - if selected, all host collections are collected based on the interval set in the collection schedule.
• Hyper-V (must be installed) - if selected, the logical disk space metrics are collected based on the interval set in the collection schedule; all other host metrics are collected based on the settings in the Foglight for Hyper-V cartridge. The “Memory In Use” is not available and will be blank in this configuration.
• VMware (must be installed) - if selected, the host collections are skipped regardless of the value in the collection schedule. That is, all host collections are collected based on the settings in the Foglight for VMware cartridge.
Communication Protocol DCOM Selects to run the WMI query through DCOM, WinRM Through HTTP, or WinRM Through HTTPS.
WinRM Port 5985 Determines the WinRM port number in the monitored server.
Enable SSL For LDAP False Enables/ disables security LDAP connection.
LDAP Authentication Scheme Basic Supports both Basic and Kerberos authentication schemes, when connected to LDAP server.
Network Connection TimeOut 21000 Specifies how long (milliseconds) the system waits for a response from the remote server before it times out. That is, this is the time in milliseconds that a data collection query will run before it is presumed to have failed and the network connection is terminated.
ActiveSync Activities Collection True Enable or disable the collection of ActiveSync topN users.
ActiveSync Activity Log Folder Defines the IIS log path in the Exchange Client Access Server.
Foglight for Exchange 5.6.9User and Reference Guide
38
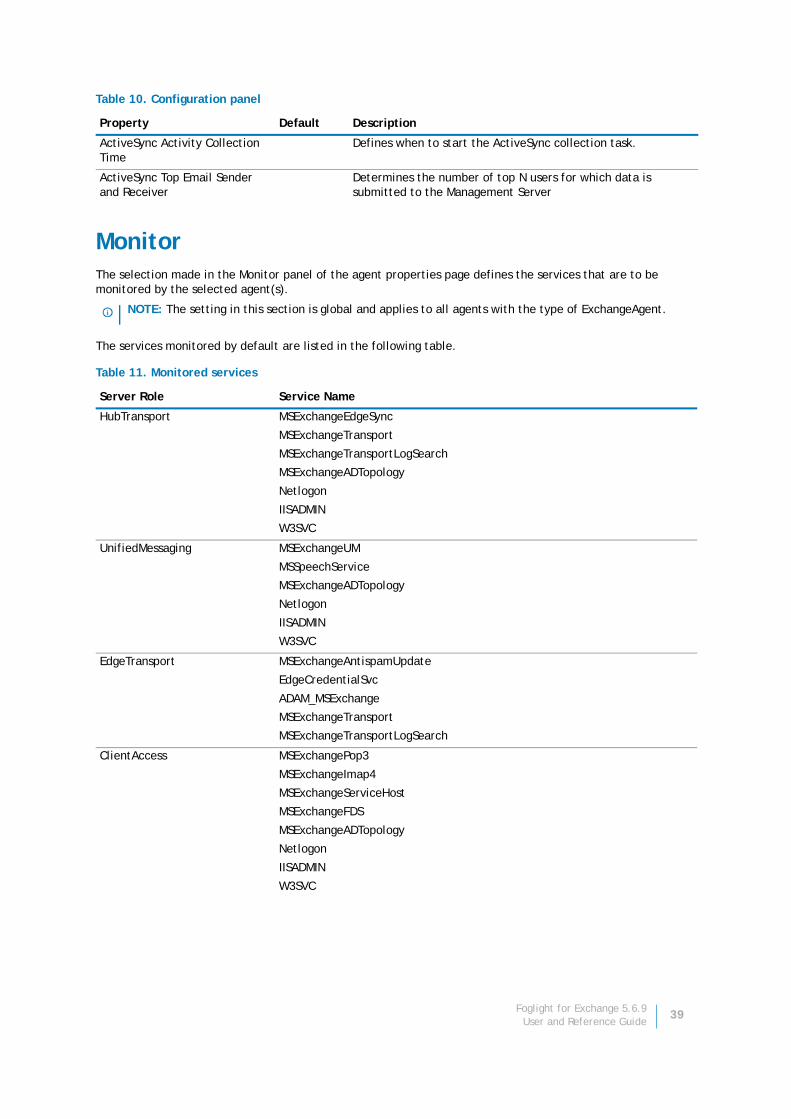
MonitorThe selection made in the Monitor panel of the agent properties page defines the services that are to be monitored by the selected agent(s).
The services monitored by default are listed in the following table.
ActiveSync Activity Collection Time
Defines when to start the ActiveSync collection task.
ActiveSync Top Email Sender and Receiver
Determines the number of top N users for which data is submitted to the Management Server
NOTE: The setting in this section is global and applies to all agents with the type of ExchangeAgent.
Table 11. Monitored services
Server Role Service Name
HubTransport MSExchangeEdgeSync
MSExchangeTransport
MSExchangeTransportLogSearch
MSExchangeADTopology
Netlogon
IISADMIN
W3SVC
UnifiedMessaging MSExchangeUM
MSSpeechService
MSExchangeADTopology
Netlogon
IISADMIN
W3SVC
EdgeTransport MSExchangeAntispamUpdate
EdgeCredentialSvc
ADAM_MSExchange
MSExchangeTransport
MSExchangeTransportLogSearch
ClientAccess MSExchangePop3
MSExchangeImap4
MSExchangeServiceHost
MSExchangeFDS
MSExchangeADTopology
Netlogon
IISADMIN
W3SVC
Table 10. Configuration panel
Property Default Description
Foglight for Exchange 5.6.9User and Reference Guide
39
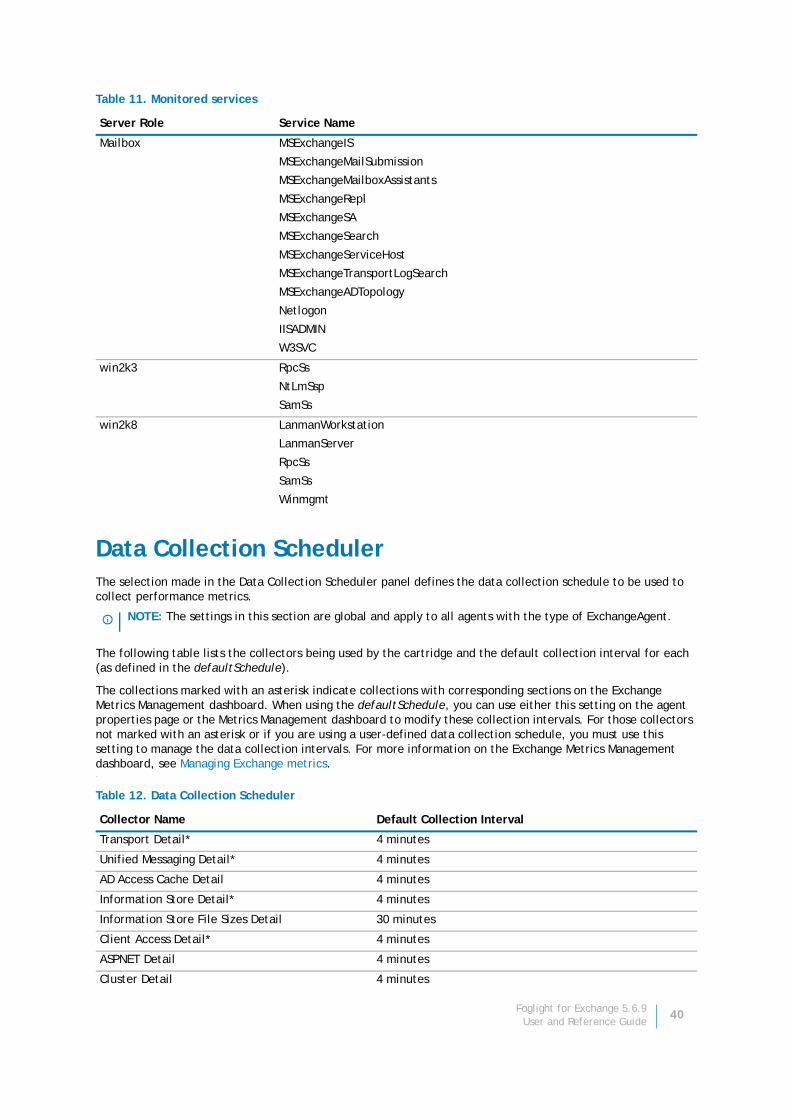
Data Collection SchedulerThe selection made in the Data Collection Scheduler panel defines the data collection schedule to be used to collect performance metrics.
The following table lists the collectors being used by the cartridge and the default collection interval for each (as defined in the defaultSchedule).
The collections marked with an asterisk indicate collections with corresponding sections on the Exchange Metrics Management dashboard. When using the defaultSchedule, you can use either this setting on the agent properties page or the Metrics Management dashboard to modify these collection intervals. For those collectors not marked with an asterisk or if you are using a user-defined data collection schedule, you must use this setting to manage the data collection intervals. For more information on the Exchange Metrics Management dashboard, see Managing Exchange metrics..
Mailbox MSExchangeIS
MSExchangeMailSubmission
MSExchangeMailboxAssistants
MSExchangeRepl
MSExchangeSA
MSExchangeSearch
MSExchangeServiceHost
MSExchangeTransportLogSearch
MSExchangeADTopology
Netlogon
IISADMIN
W3SVC
win2k3 RpcSs
NtLmSsp
SamSs
win2k8 LanmanWorkstation
LanmanServer
RpcSs
SamSs
Winmgmt
NOTE: The settings in this section are global and apply to all agents with the type of ExchangeAgent.
Table 12. Data Collection Scheduler
Collector Name Default Collection Interval
Transport Detail* 4 minutes
Unified Messaging Detail* 4 minutes
AD Access Cache Detail 4 minutes
Information Store Detail* 4 minutes
Information Store File Sizes Detail 30 minutes
Client Access Detail* 4 minutes
ASPNET Detail 4 minutes
Cluster Detail 4 minutes
Table 11. Monitored services
Server Role Service Name
Foglight for Exchange 5.6.9User and Reference Guide
40

Host Hardware Detail 1 minute
Dot Net Framework Detail 4 minutes
Table 12. Data Collection Scheduler
Collector Name Default Collection Interval
Foglight for Exchange 5.6.9User and Reference Guide
41
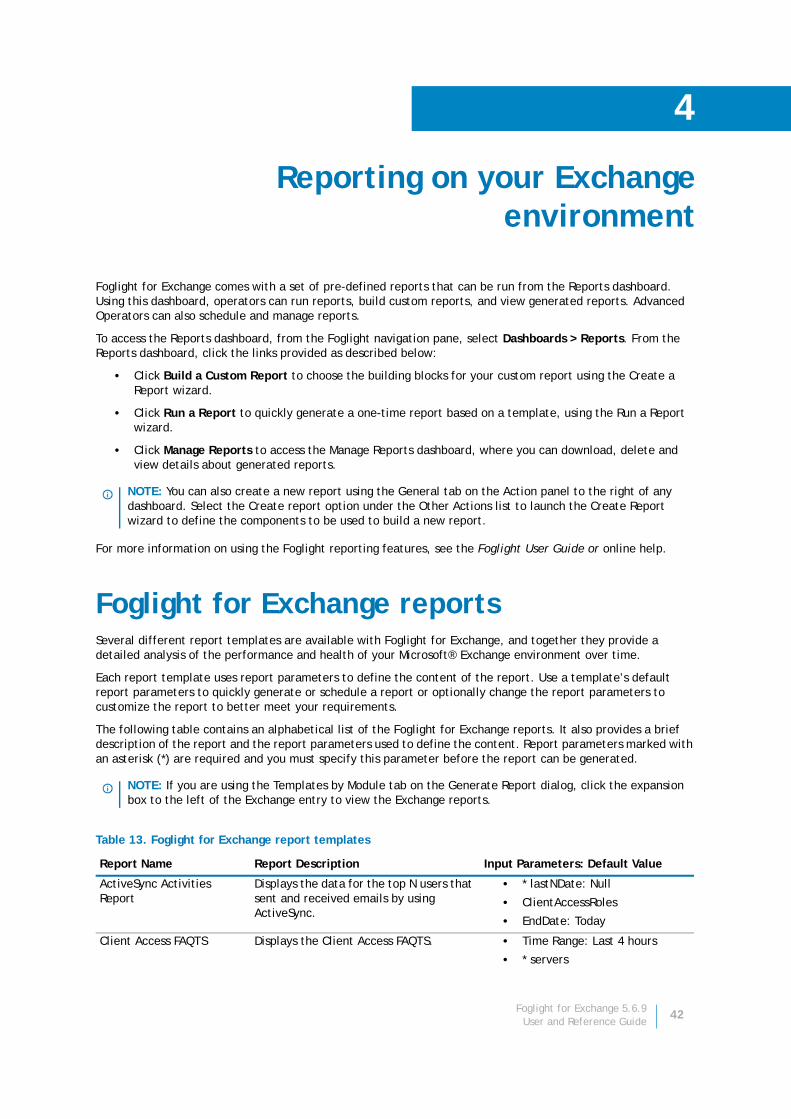
4
Reporting on your Exchange environment
Foglight for Exchange comes with a set of pre-defined reports that can be run from the Reports dashboard. Using this dashboard, operators can run reports, build custom reports, and view generated reports. Advanced Operators can also schedule and manage reports.
To access the Reports dashboard, from the Foglight navigation pane, select Dashboards > Reports. From the Reports dashboard, click the links provided as described below:
• Click Build a Custom Report to choose the building blocks for your custom report using the Create a Report wizard.
• Click Run a Report to quickly generate a one-time report based on a template, using the Run a Report wizard.
• Click Manage Reports to access the Manage Reports dashboard, where you can download, delete and view details about generated reports.
For more information on using the Foglight reporting features, see the Foglight User Guide or online help.
Foglight for Exchange reportsSeveral different report templates are available with Foglight for Exchange, and together they provide a detailed analysis of the performance and health of your Microsoft® Exchange environment over time.
Each report template uses report parameters to define the content of the report. Use a template’s default report parameters to quickly generate or schedule a report or optionally change the report parameters to customize the report to better meet your requirements.
The following table contains an alphabetical list of the Foglight for Exchange reports. It also provides a brief description of the report and the report parameters used to define the content. Report parameters marked with an asterisk (*) are required and you must specify this parameter before the report can be generated.
NOTE: You can also create a new report using the General tab on the Action panel to the right of any dashboard. Select the Create report option under the Other Actions list to launch the Create Report wizard to define the components to be used to build a new report.
NOTE: If you are using the Templates by Module tab on the Generate Report dialog, click the expansion box to the left of the Exchange entry to view the Exchange reports.
Table 13. Foglight for Exchange report templates
Report Name Report Description Input Parameters: Default Value
ActiveSync Activities Report
Displays the data for the top N users that sent and received emails by using ActiveSync.
• * lastNDate: Null
• ClientAccessRoles
• EndDate: Today
Client Access FAQTS Displays the Client Access FAQTS. • Time Range: Last 4 hours
• * servers
Foglight for Exchange 5.6.9User and Reference Guide
42
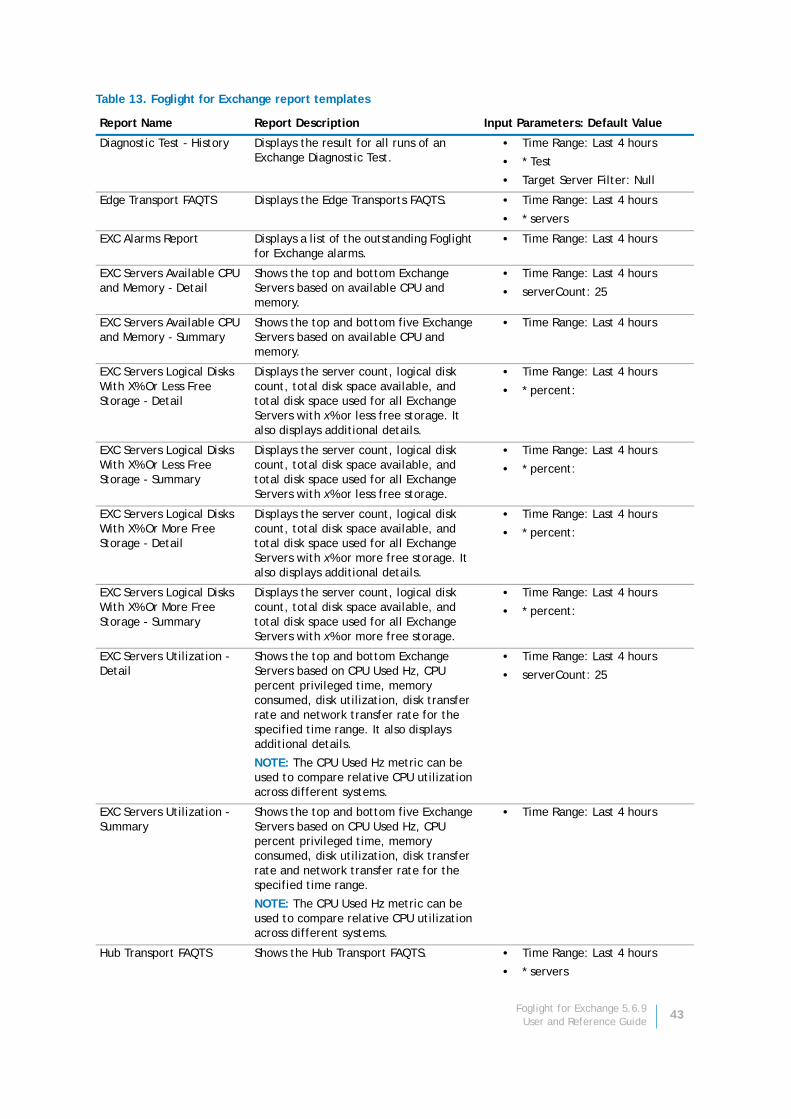
Diagnostic Test - History Displays the result for all runs of an Exchange Diagnostic Test.
• Time Range: Last 4 hours
• * Test
• Target Server Filter: Null
Edge Transport FAQTS Displays the Edge Transports FAQTS. • Time Range: Last 4 hours
• * servers
EXC Alarms Report Displays a list of the outstanding Foglight for Exchange alarms.
• Time Range: Last 4 hours
EXC Servers Available CPU and Memory - Detail
Shows the top and bottom Exchange Servers based on available CPU and memory.
• Time Range: Last 4 hours
• serverCount: 25
EXC Servers Available CPU and Memory - Summary
Shows the top and bottom five Exchange Servers based on available CPU and memory.
• Time Range: Last 4 hours
EXC Servers Logical Disks With X% Or Less Free Storage - Detail
Displays the server count, logical disk count, total disk space available, and total disk space used for all Exchange Servers with x% or less free storage. It also displays additional details.
• Time Range: Last 4 hours
• * percent:
EXC Servers Logical Disks With X% Or Less Free Storage - Summary
Displays the server count, logical disk count, total disk space available, and total disk space used for all Exchange Servers with x% or less free storage.
• Time Range: Last 4 hours
• * percent:
EXC Servers Logical Disks With X% Or More Free Storage - Detail
Displays the server count, logical disk count, total disk space available, and total disk space used for all Exchange Servers with x% or more free storage. It also displays additional details.
• Time Range: Last 4 hours
• * percent:
EXC Servers Logical Disks With X% Or More Free Storage - Summary
Displays the server count, logical disk count, total disk space available, and total disk space used for all Exchange Servers with x% or more free storage.
• Time Range: Last 4 hours
• * percent:
EXC Servers Utilization - Detail
Shows the top and bottom Exchange Servers based on CPU Used Hz, CPU percent privileged time, memory consumed, disk utilization, disk transfer rate and network transfer rate for the specified time range. It also displays additional details.
NOTE: The CPU Used Hz metric can be used to compare relative CPU utilization across different systems.
• Time Range: Last 4 hours
• serverCount: 25
EXC Servers Utilization - Summary
Shows the top and bottom five Exchange Servers based on CPU Used Hz, CPU percent privileged time, memory consumed, disk utilization, disk transfer rate and network transfer rate for the specified time range.
NOTE: The CPU Used Hz metric can be used to compare relative CPU utilization across different systems.
• Time Range: Last 4 hours
Hub Transport FAQTS Shows the Hub Transport FAQTS. • Time Range: Last 4 hours
• * servers
Table 13. Foglight for Exchange report templates
Report Name Report Description Input Parameters: Default Value
Foglight for Exchange 5.6.9User and Reference Guide
43
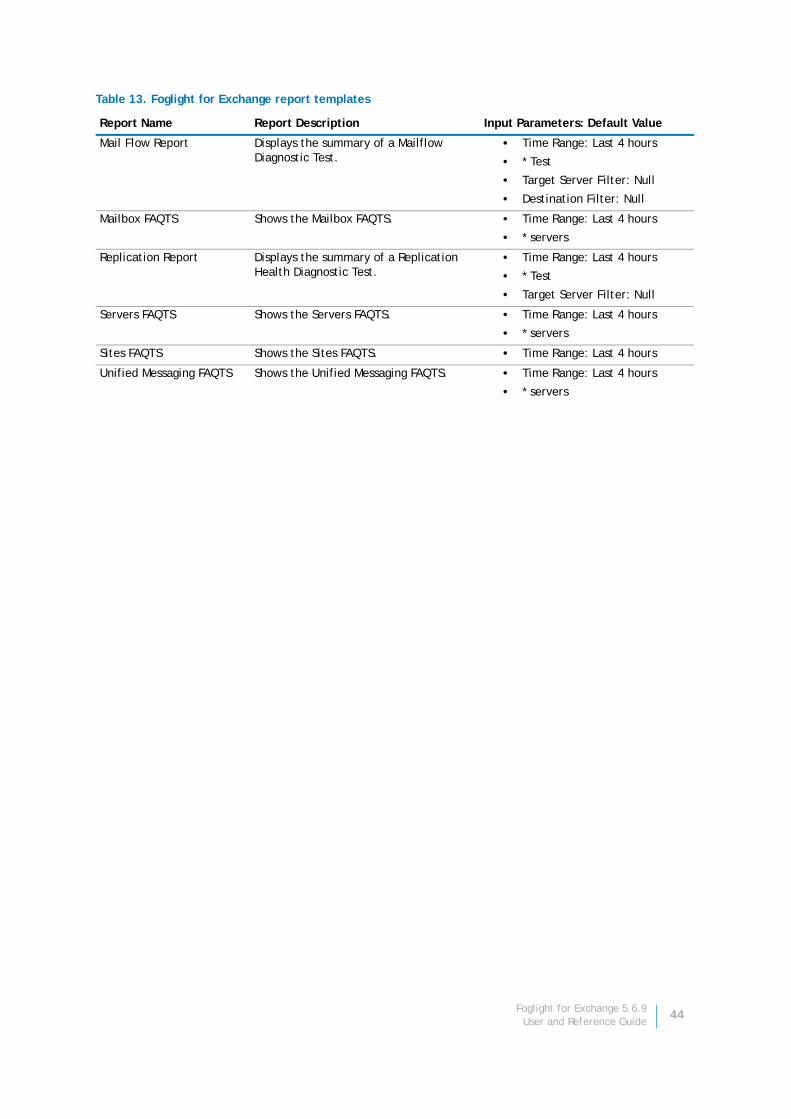
Mail Flow Report Displays the summary of a Mailflow Diagnostic Test.
• Time Range: Last 4 hours
• * Test
• Target Server Filter: Null
• Destination Filter: Null
Mailbox FAQTS Shows the Mailbox FAQTS. • Time Range: Last 4 hours
• * servers
Replication Report Displays the summary of a Replication Health Diagnostic Test.
• Time Range: Last 4 hours
• * Test
• Target Server Filter: Null
Servers FAQTS Shows the Servers FAQTS. • Time Range: Last 4 hours
• * servers
Sites FAQTS Shows the Sites FAQTS. • Time Range: Last 4 hours
Unified Messaging FAQTS Shows the Unified Messaging FAQTS. • Time Range: Last 4 hours
• * servers
Table 13. Foglight for Exchange report templates
Report Name Report Description Input Parameters: Default Value
Foglight for Exchange 5.6.9User and Reference Guide
44
5
Foglight for Exchange views
Foglight displays monitoring data in views that group, format, and display data. The main types are described below.
Dashboards are top-level views that contain lower-level views. The dashboards supplied with Foglight, as well as those created by users, are accessible from the navigation panel.
Lower-level views can be added to dashboards or can be accessed by drilling down from a dashboard. They receive and display data directly from the Foglight Management Server or from other views. Some views filter or select data that appears in other views in the same dashboard. Some are tree views with expandable nodes for selecting servers, applications or data.
This chapter provides a description of the metrics displayed in the lower-level views on the Foglight for Exchange dashboards. The beginning of the chapter explains which views are available to monitor the health of your Exchange servers broken down by Exchange role, server or site.
• Role views
• Exchange Server views
• Site views
• Cluster views
The latter part of the chapter provides a detailed description of the information and metrics displayed in the embedded views.
• Description of Embedded views
Role viewsServer roles allow administrators to split up the functions of an Exchange server and place each role, or a combination of roles, on different servers. There are five server roles that can be installed in an Exchange organization:
• Edge Transport is installed on a stand alone server that is not a member of the Active Directory® domain and routes mail between the Exchange organization and the Internet. It provides protection against spam and viruses.
• Hub Transport is the mail routing server responsible for routing mail within the Exchange organization.
• Client Access is the server that users connect to using their mail client, mobile device or web browser. The Client Access role is installed in every Exchange organization and every Active Directory site that has the Mailbox server role installed.
• Mailbox which holds the Exchange databases where the user mailboxes and public folders reside.
• Unified Messaging is responsible for merging your VOIP infrastructure with your Exchange system.
The following views are available to monitor the health and performance of the servers hosting these Exchange roles.
• Exchange Roles Environment Summary (All Exchange Roles) view
• Client Access 2013 Role Environment Summary view
• Edge Transport Role Environment Summary view
Foglight for Exchange 5.6.9User and Reference Guide
45
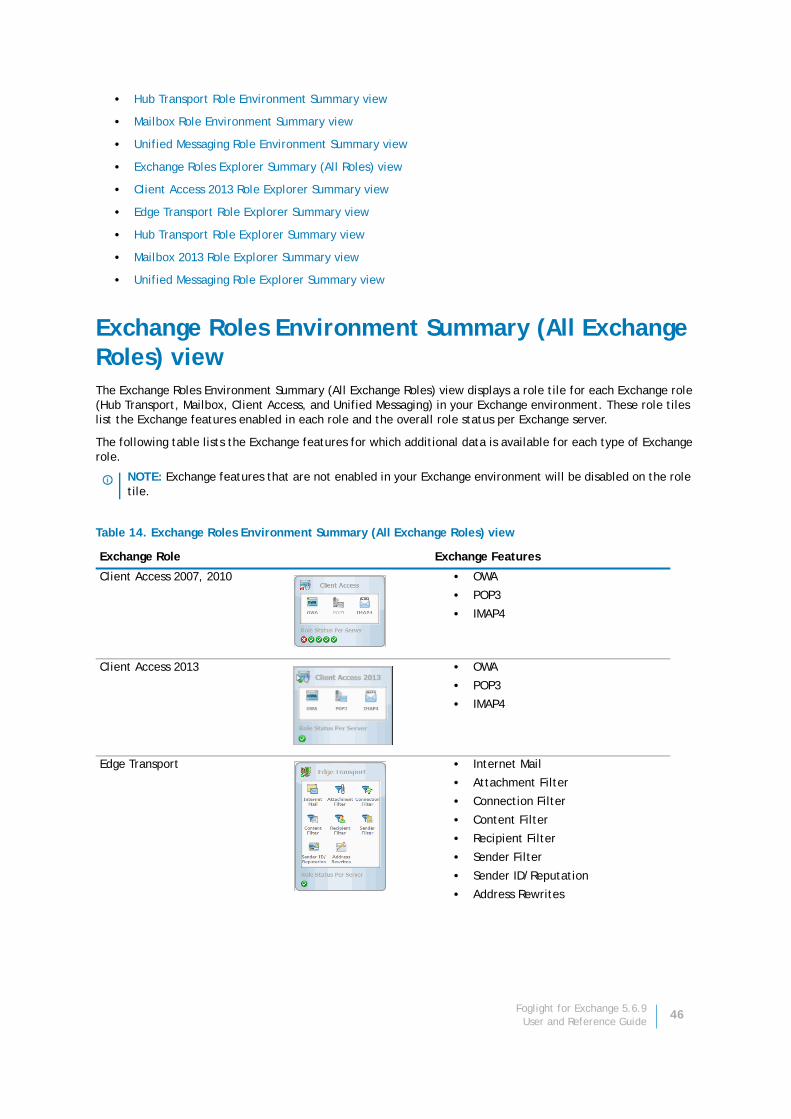
• Hub Transport Role Environment Summary view
• Mailbox Role Environment Summary view
• Unified Messaging Role Environment Summary view
• Exchange Roles Explorer Summary (All Roles) view
• Client Access 2013 Role Explorer Summary view
• Edge Transport Role Explorer Summary view
• Hub Transport Role Explorer Summary view
• Mailbox 2013 Role Explorer Summary view
• Unified Messaging Role Explorer Summary view
Exchange Roles Environment Summary (All Exchange Roles) viewThe Exchange Roles Environment Summary (All Exchange Roles) view displays a role tile for each Exchange role (Hub Transport, Mailbox, Client Access, and Unified Messaging) in your Exchange environment. These role tiles list the Exchange features enabled in each role and the overall role status per Exchange server.
The following table lists the Exchange features for which additional data is available for each type of Exchange role.
NOTE: Exchange features that are not enabled in your Exchange environment will be disabled on the role tile.
Table 14. Exchange Roles Environment Summary (All Exchange Roles) view
Exchange Role Exchange Features
Client Access 2007, 2010 • OWA
• POP3
• IMAP4
Client Access 2013 • OWA
• POP3
• IMAP4
Edge Transport • Internet Mail
• Attachment Filter
• Connection Filter
• Content Filter
• Recipient Filter
• Sender Filter
• Sender ID/Reputation
• Address Rewrites
Foglight for Exchange 5.6.9User and Reference Guide
46
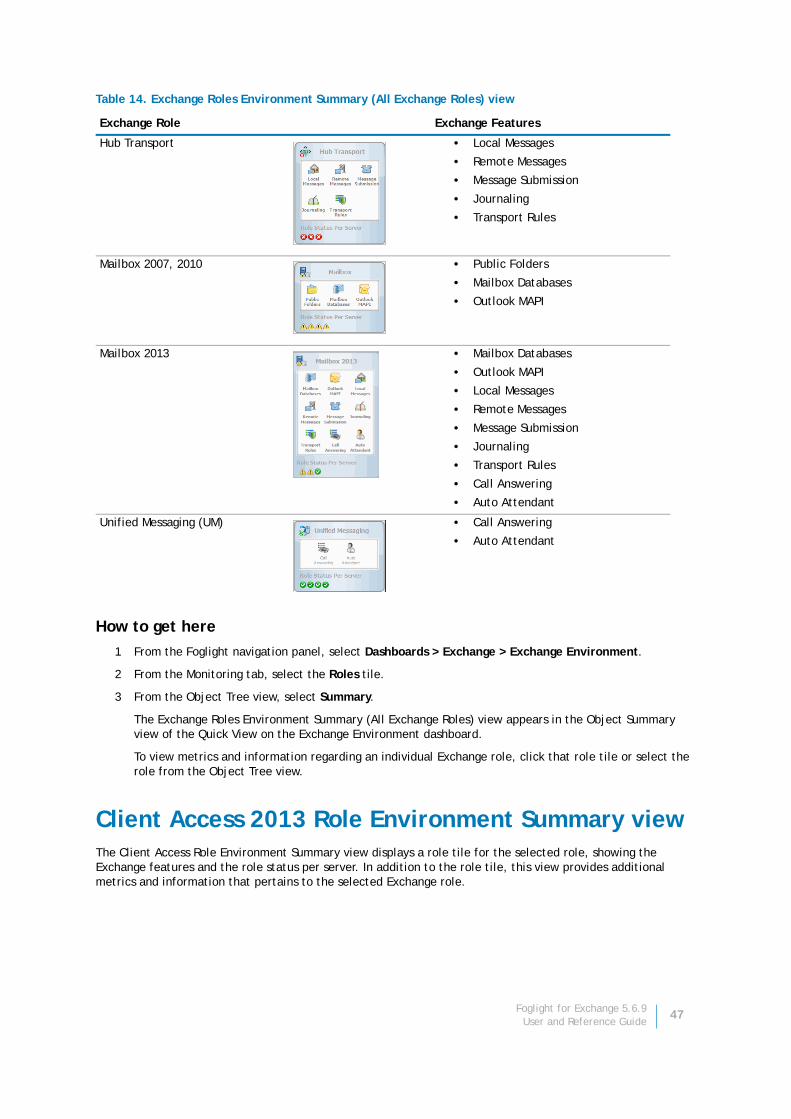
How to get here
1 From the Foglight navigation panel, select Dashboards > Exchange > Exchange Environment.
2 From the Monitoring tab, select the Roles tile.
3 From the Object Tree view, select Summary.
The Exchange Roles Environment Summary (All Exchange Roles) view appears in the Object Summary view of the Quick View on the Exchange Environment dashboard.
To view metrics and information regarding an individual Exchange role, click that role tile or select the role from the Object Tree view.
Client Access 2013 Role Environment Summary viewThe Client Access Role Environment Summary view displays a role tile for the selected role, showing the Exchange features and the role status per server. In addition to the role tile, this view provides additional metrics and information that pertains to the selected Exchange role.
Hub Transport • Local Messages
• Remote Messages
• Message Submission
• Journaling
• Transport Rules
Mailbox 2007, 2010 • Public Folders
• Mailbox Databases
• Outlook MAPI
Mailbox 2013 • Mailbox Databases
• Outlook MAPI
• Local Messages
• Remote Messages
• Message Submission
• Journaling
• Transport Rules
• Call Answering
• Auto Attendant
Unified Messaging (UM) • Call Answering
• Auto Attendant
Table 14. Exchange Roles Environment Summary (All Exchange Roles) view
Exchange Role Exchange Features
Foglight for Exchange 5.6.9User and Reference Guide
47
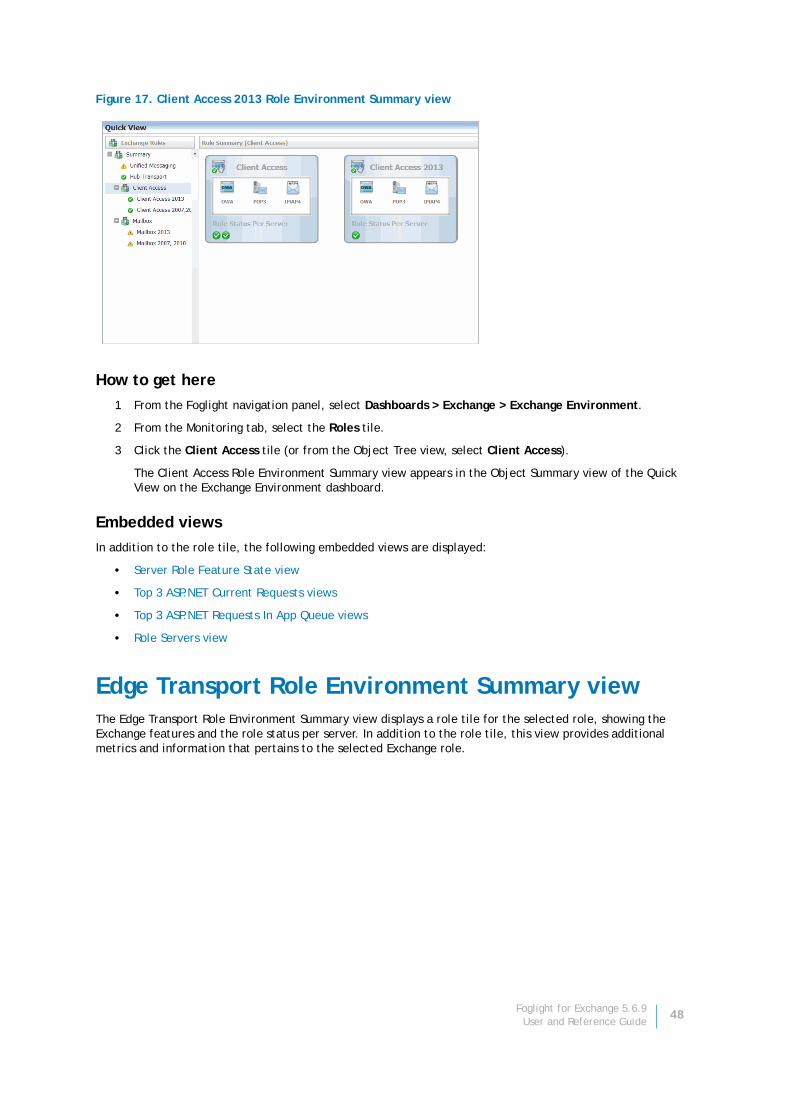
Figure 17. Client Access 2013 Role Environment Summary view
How to get here
1 From the Foglight navigation panel, select Dashboards > Exchange > Exchange Environment.
2 From the Monitoring tab, select the Roles tile.
3 Click the Client Access tile (or from the Object Tree view, select Client Access).
The Client Access Role Environment Summary view appears in the Object Summary view of the Quick View on the Exchange Environment dashboard.
Embedded views
In addition to the role tile, the following embedded views are displayed:
• Server Role Feature State view
• Top 3 ASP.NET Current Requests views
• Top 3 ASP.NET Requests In App Queue views
• Role Servers view
Edge Transport Role Environment Summary viewThe Edge Transport Role Environment Summary view displays a role tile for the selected role, showing the Exchange features and the role status per server. In addition to the role tile, this view provides additional metrics and information that pertains to the selected Exchange role.
Foglight for Exchange 5.6.9User and Reference Guide
48
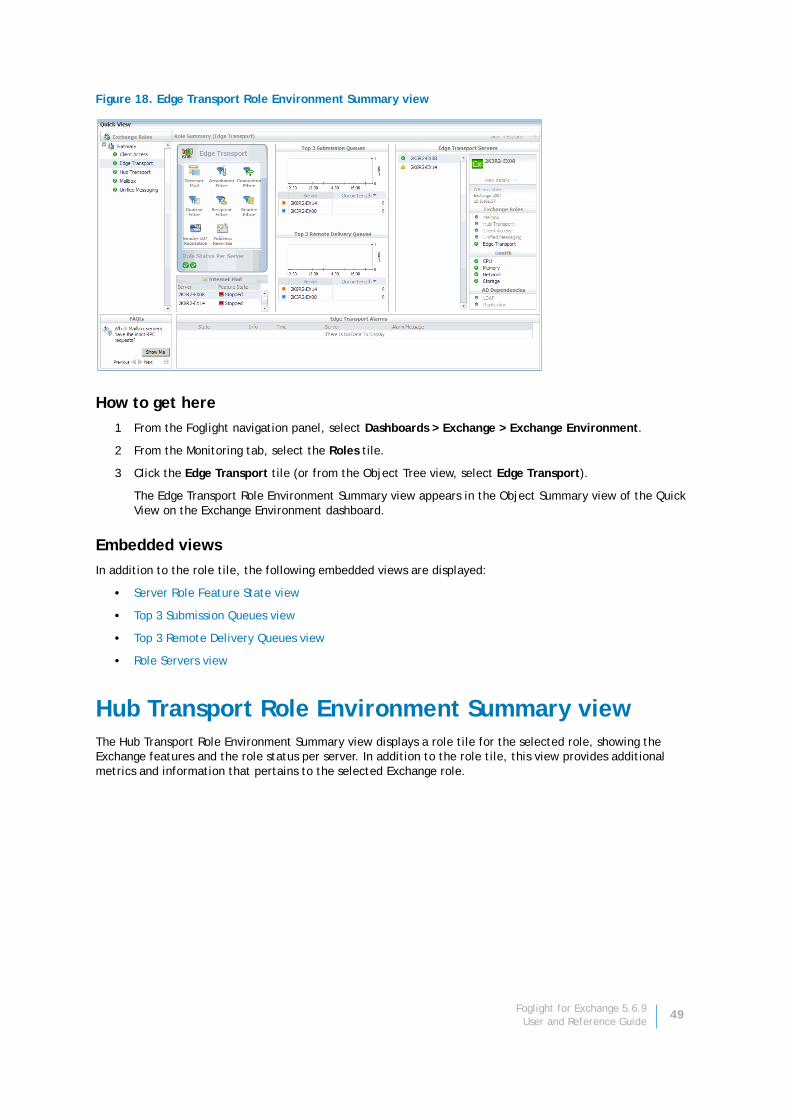
Figure 18. Edge Transport Role Environment Summary view
How to get here
1 From the Foglight navigation panel, select Dashboards > Exchange > Exchange Environment.
2 From the Monitoring tab, select the Roles tile.
3 Click the Edge Transport tile (or from the Object Tree view, select Edge Transport).
The Edge Transport Role Environment Summary view appears in the Object Summary view of the Quick View on the Exchange Environment dashboard.
Embedded views
In addition to the role tile, the following embedded views are displayed:
• Server Role Feature State view
• Top 3 Submission Queues view
• Top 3 Remote Delivery Queues view
• Role Servers view
Hub Transport Role Environment Summary viewThe Hub Transport Role Environment Summary view displays a role tile for the selected role, showing the Exchange features and the role status per server. In addition to the role tile, this view provides additional metrics and information that pertains to the selected Exchange role.
Foglight for Exchange 5.6.9User and Reference Guide
49
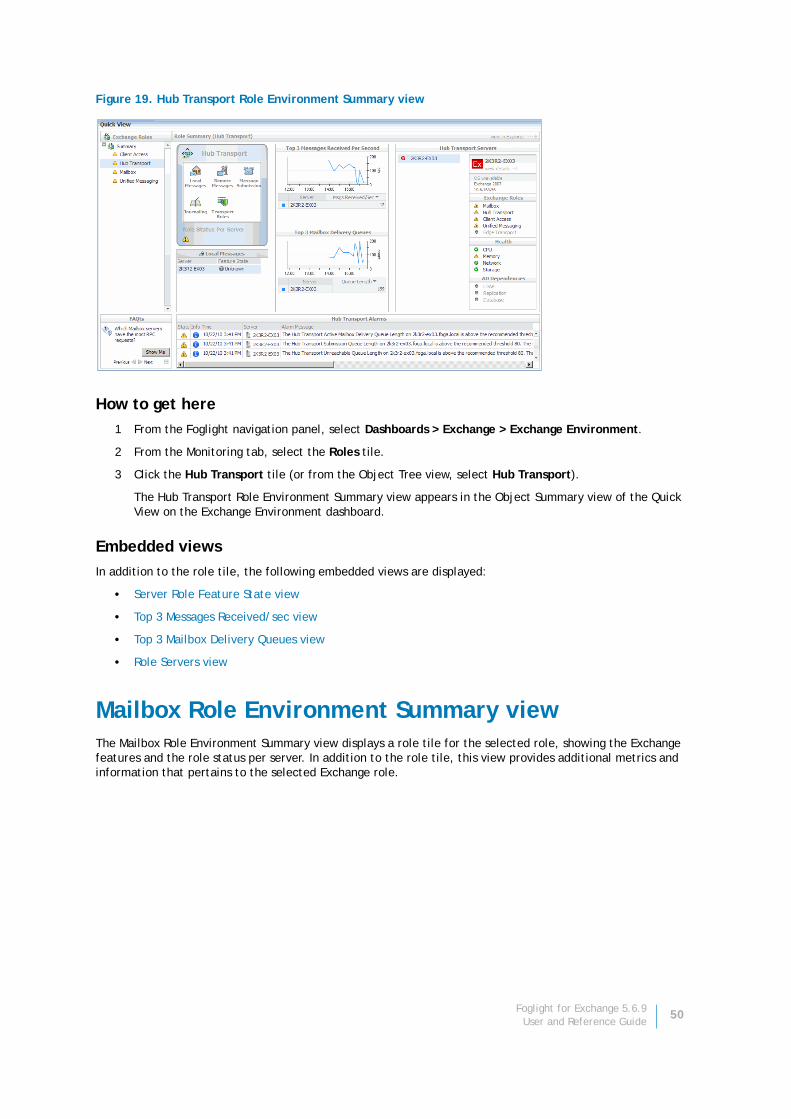
Figure 19. Hub Transport Role Environment Summary view
How to get here
1 From the Foglight navigation panel, select Dashboards > Exchange > Exchange Environment.
2 From the Monitoring tab, select the Roles tile.
3 Click the Hub Transport tile (or from the Object Tree view, select Hub Transport).
The Hub Transport Role Environment Summary view appears in the Object Summary view of the Quick View on the Exchange Environment dashboard.
Embedded views
In addition to the role tile, the following embedded views are displayed:
• Server Role Feature State view
• Top 3 Messages Received/sec view
• Top 3 Mailbox Delivery Queues view
• Role Servers view
Mailbox Role Environment Summary viewThe Mailbox Role Environment Summary view displays a role tile for the selected role, showing the Exchange features and the role status per server. In addition to the role tile, this view provides additional metrics and information that pertains to the selected Exchange role.
Foglight for Exchange 5.6.9User and Reference Guide
50
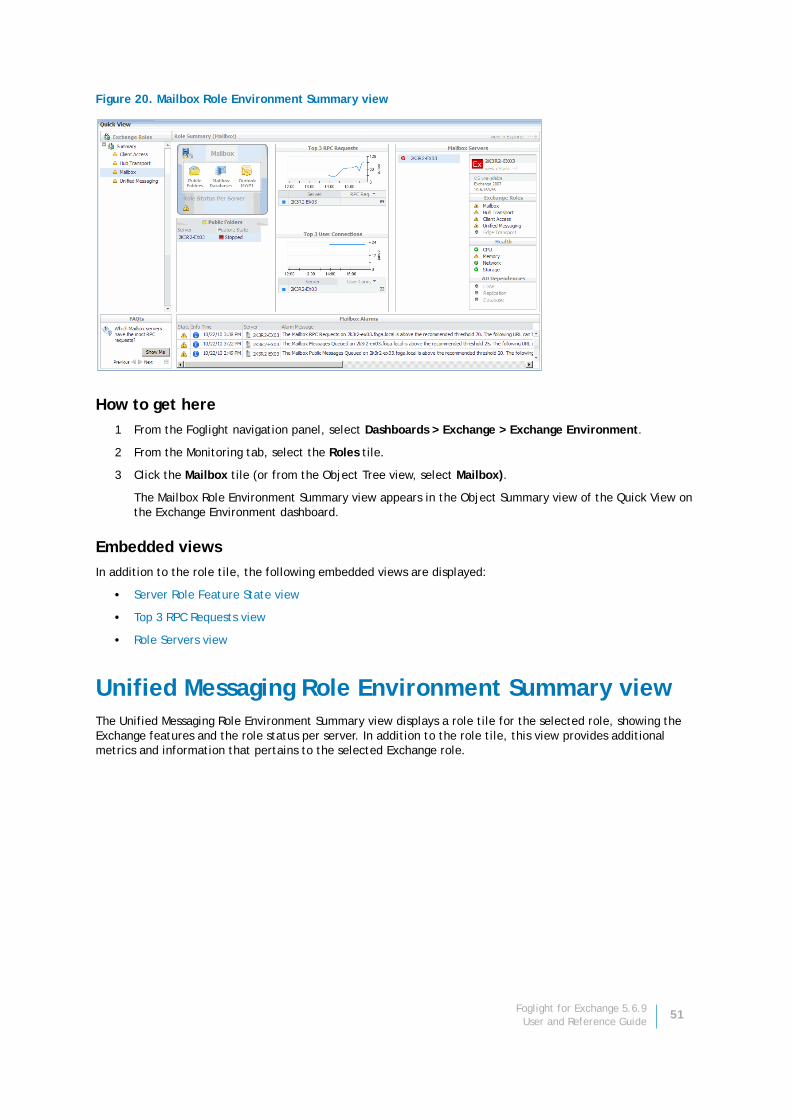
Figure 20. Mailbox Role Environment Summary view
How to get here
1 From the Foglight navigation panel, select Dashboards > Exchange > Exchange Environment.
2 From the Monitoring tab, select the Roles tile.
3 Click the Mailbox tile (or from the Object Tree view, select Mailbox).
The Mailbox Role Environment Summary view appears in the Object Summary view of the Quick View on the Exchange Environment dashboard.
Embedded views
In addition to the role tile, the following embedded views are displayed:
• Server Role Feature State view
• Top 3 RPC Requests view
• Role Servers view
Unified Messaging Role Environment Summary viewThe Unified Messaging Role Environment Summary view displays a role tile for the selected role, showing the Exchange features and the role status per server. In addition to the role tile, this view provides additional metrics and information that pertains to the selected Exchange role.
Foglight for Exchange 5.6.9User and Reference Guide
51

Figure 21. Unified Messaging Role Environment Summary view
How to get here
1 From the Foglight navigation panel, select Dashboards > Exchange > Exchange Environment.
2 From the Monitoring tab, select the Roles tile.
3 Click the Unified Messaging tile (or from the Object Tree view, select Unified Messaging).
The Unified Messaging Role Environment Summary view appears in the Object Summary view of the Quick View on the Exchange Environment dashboard.
Embedded views
In addition to the role tile, the following embedded views are displayed:
• Server Role Feature State view
• Top 3 Hub Transport Access Failures view
• Top 3 Mailbox Server Access Failures view
• Role Servers view
Exchange Roles Explorer Summary (All Roles) viewThe Exchange Roles Explorer Summary (All Roles) view displays a list of all the Exchange servers assigned to the different Exchange roles in your environment.
Foglight for Exchange 5.6.9User and Reference Guide
52
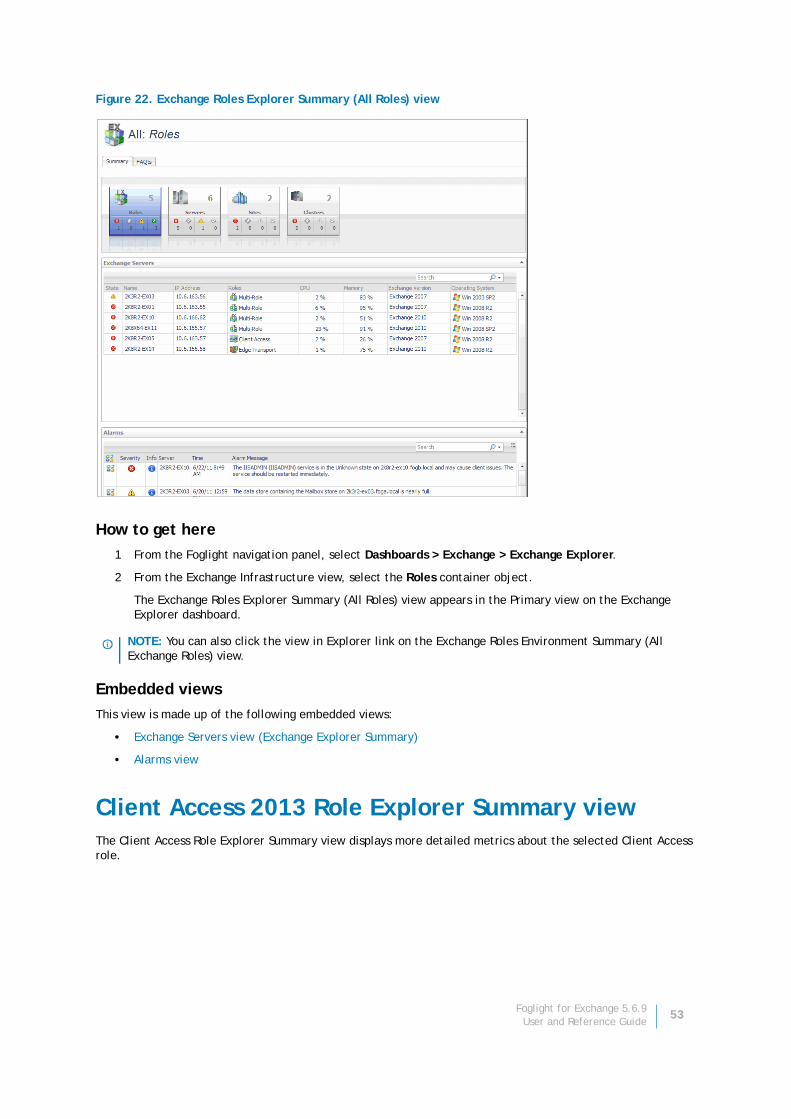
Figure 22. Exchange Roles Explorer Summary (All Roles) view
How to get here
1 From the Foglight navigation panel, select Dashboards > Exchange > Exchange Explorer.
2 From the Exchange Infrastructure view, select the Roles container object.
The Exchange Roles Explorer Summary (All Roles) view appears in the Primary view on the Exchange Explorer dashboard.
Embedded views
This view is made up of the following embedded views:
• Exchange Servers view (Exchange Explorer Summary)
• Alarms view
Client Access 2013 Role Explorer Summary viewThe Client Access Role Explorer Summary view displays more detailed metrics about the selected Client Access role.
NOTE: You can also click the view in Explorer link on the Exchange Roles Environment Summary (All Exchange Roles) view.
Foglight for Exchange 5.6.9User and Reference Guide
53
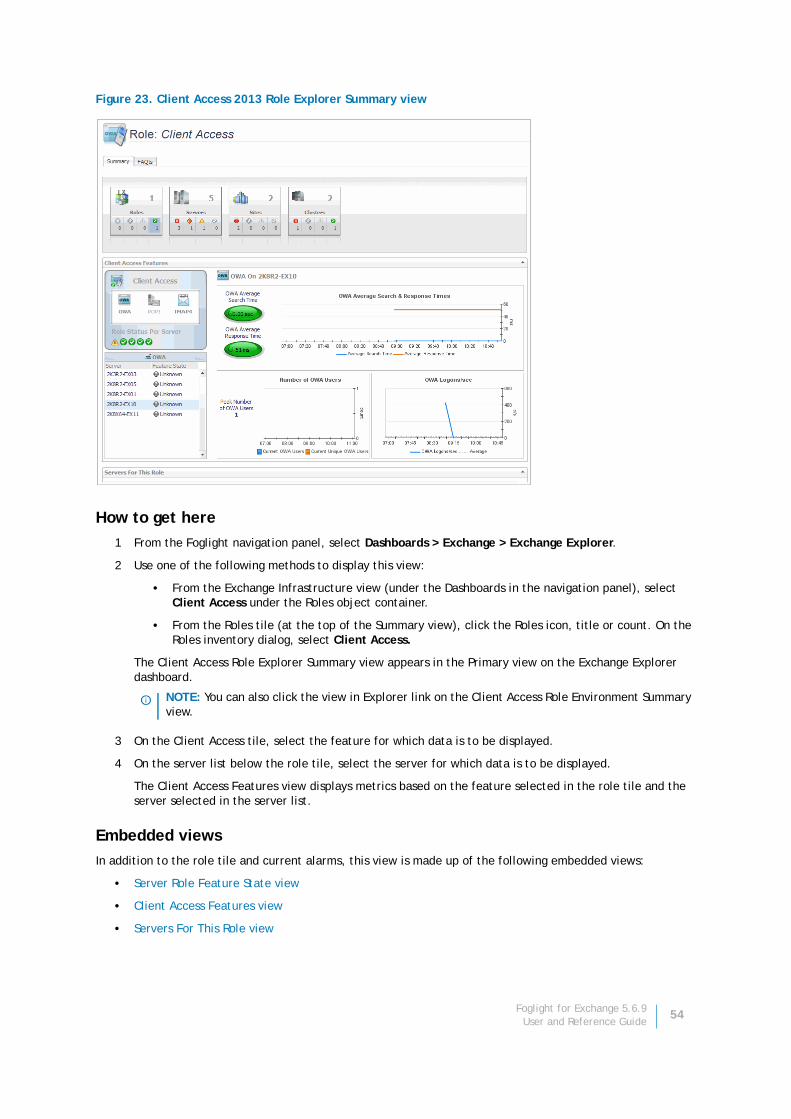
Figure 23. Client Access 2013 Role Explorer Summary view
How to get here
1 From the Foglight navigation panel, select Dashboards > Exchange > Exchange Explorer.
2 Use one of the following methods to display this view:
• From the Exchange Infrastructure view (under the Dashboards in the navigation panel), select Client Access under the Roles object container.
• From the Roles tile (at the top of the Summary view), click the Roles icon, title or count. On the Roles inventory dialog, select Client Access.
The Client Access Role Explorer Summary view appears in the Primary view on the Exchange Explorer dashboard.
3 On the Client Access tile, select the feature for which data is to be displayed.
4 On the server list below the role tile, select the server for which data is to be displayed.
The Client Access Features view displays metrics based on the feature selected in the role tile and the server selected in the server list.
Embedded views
In addition to the role tile and current alarms, this view is made up of the following embedded views:
• Server Role Feature State view
• Client Access Features view
• Servers For This Role view
NOTE: You can also click the view in Explorer link on the Client Access Role Environment Summary view.
Foglight for Exchange 5.6.9User and Reference Guide
54
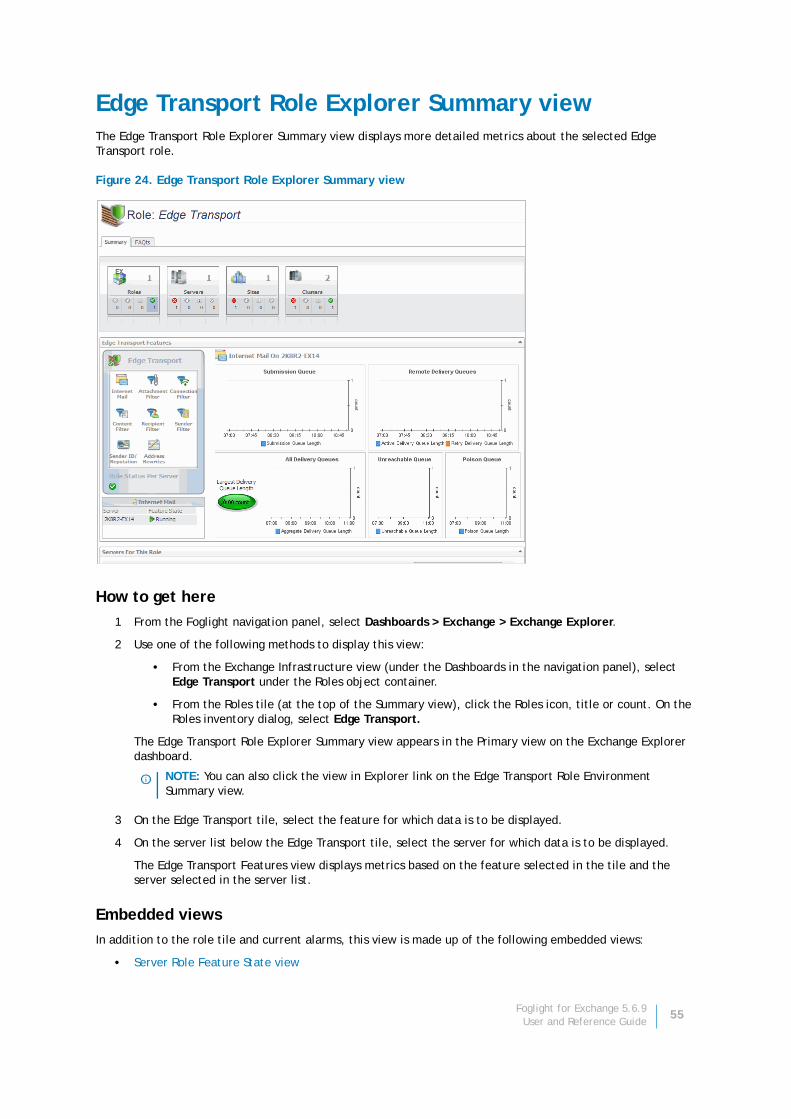
Edge Transport Role Explorer Summary viewThe Edge Transport Role Explorer Summary view displays more detailed metrics about the selected Edge Transport role.
Figure 24. Edge Transport Role Explorer Summary view
How to get here
1 From the Foglight navigation panel, select Dashboards > Exchange > Exchange Explorer.
2 Use one of the following methods to display this view:
• From the Exchange Infrastructure view (under the Dashboards in the navigation panel), select Edge Transport under the Roles object container.
• From the Roles tile (at the top of the Summary view), click the Roles icon, title or count. On the Roles inventory dialog, select Edge Transport.
The Edge Transport Role Explorer Summary view appears in the Primary view on the Exchange Explorer dashboard.
3 On the Edge Transport tile, select the feature for which data is to be displayed.
4 On the server list below the Edge Transport tile, select the server for which data is to be displayed.
The Edge Transport Features view displays metrics based on the feature selected in the tile and the server selected in the server list.
Embedded views
In addition to the role tile and current alarms, this view is made up of the following embedded views:
• Server Role Feature State view
NOTE: You can also click the view in Explorer link on the Edge Transport Role Environment Summary view.
Foglight for Exchange 5.6.9User and Reference Guide
55
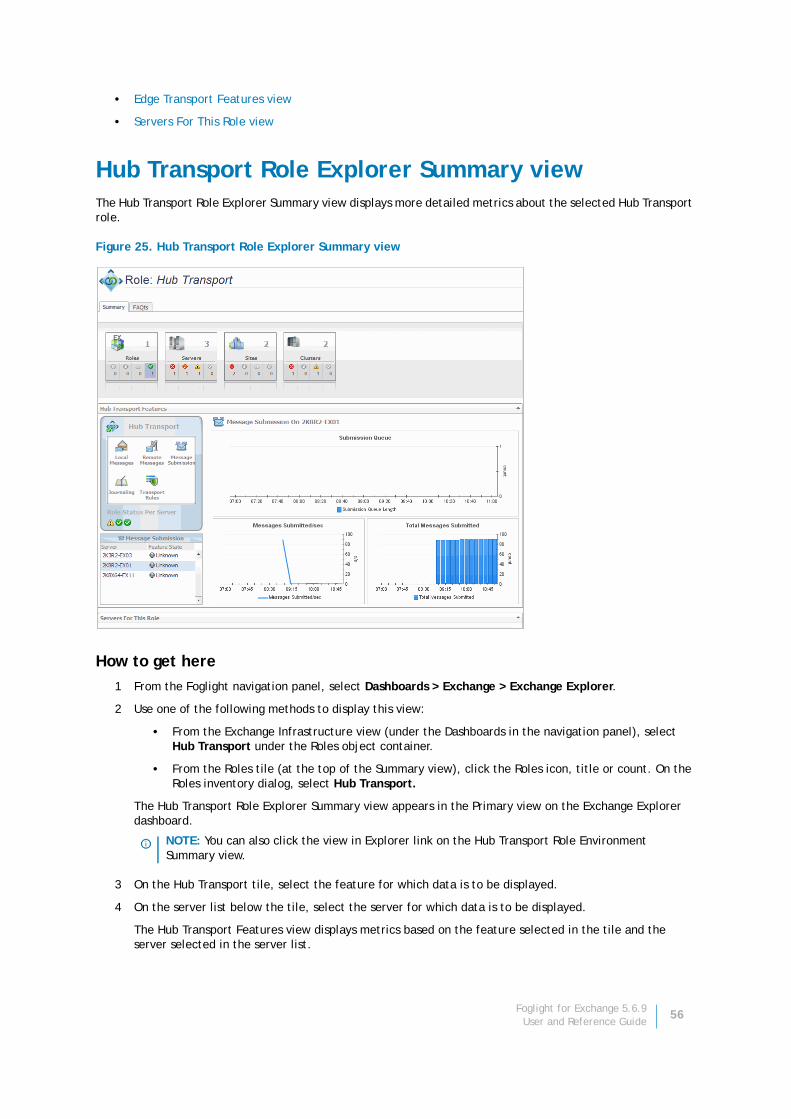
• Edge Transport Features view
• Servers For This Role view
Hub Transport Role Explorer Summary viewThe Hub Transport Role Explorer Summary view displays more detailed metrics about the selected Hub Transport role.
Figure 25. Hub Transport Role Explorer Summary view
How to get here
1 From the Foglight navigation panel, select Dashboards > Exchange > Exchange Explorer.
2 Use one of the following methods to display this view:
• From the Exchange Infrastructure view (under the Dashboards in the navigation panel), select Hub Transport under the Roles object container.
• From the Roles tile (at the top of the Summary view), click the Roles icon, title or count. On the Roles inventory dialog, select Hub Transport.
The Hub Transport Role Explorer Summary view appears in the Primary view on the Exchange Explorer dashboard.
3 On the Hub Transport tile, select the feature for which data is to be displayed.
4 On the server list below the tile, select the server for which data is to be displayed.
The Hub Transport Features view displays metrics based on the feature selected in the tile and the server selected in the server list.
NOTE: You can also click the view in Explorer link on the Hub Transport Role Environment Summary view.
Foglight for Exchange 5.6.9User and Reference Guide
56
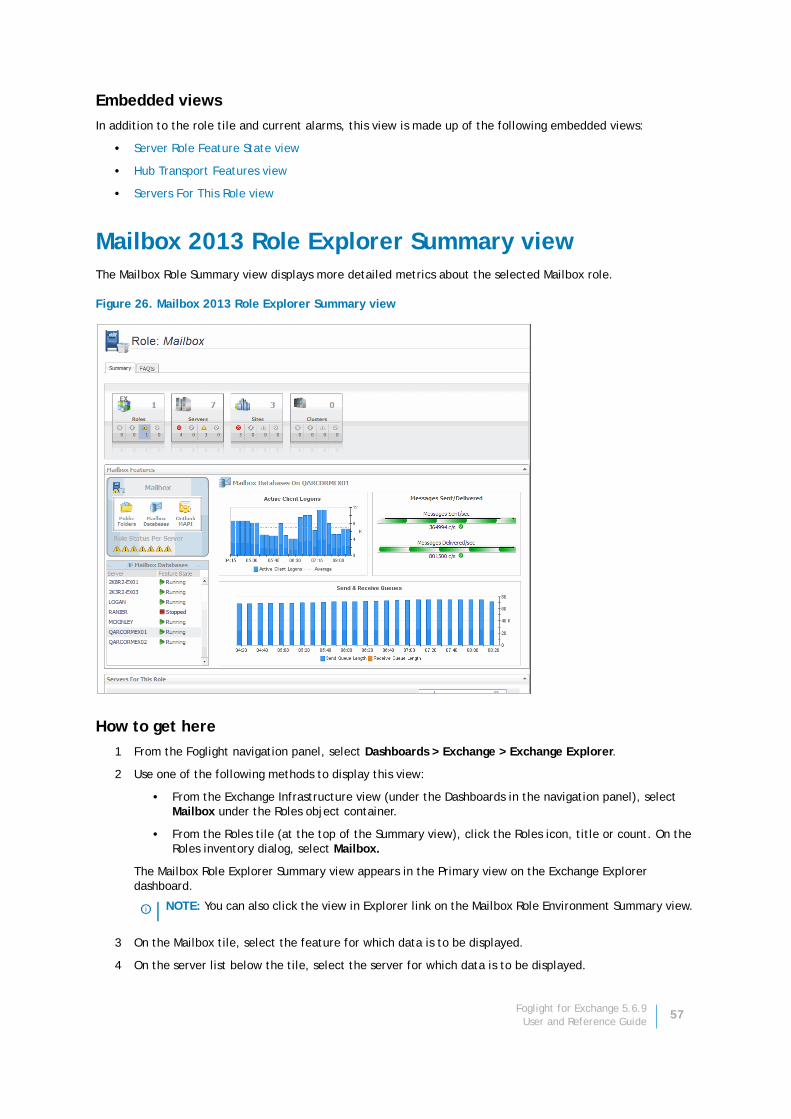
Embedded views
In addition to the role tile and current alarms, this view is made up of the following embedded views:
• Server Role Feature State view
• Hub Transport Features view
• Servers For This Role view
Mailbox 2013 Role Explorer Summary viewThe Mailbox Role Summary view displays more detailed metrics about the selected Mailbox role.
Figure 26. Mailbox 2013 Role Explorer Summary view
How to get here
1 From the Foglight navigation panel, select Dashboards > Exchange > Exchange Explorer.
2 Use one of the following methods to display this view:
• From the Exchange Infrastructure view (under the Dashboards in the navigation panel), select Mailbox under the Roles object container.
• From the Roles tile (at the top of the Summary view), click the Roles icon, title or count. On the Roles inventory dialog, select Mailbox.
The Mailbox Role Explorer Summary view appears in the Primary view on the Exchange Explorer dashboard.
3 On the Mailbox tile, select the feature for which data is to be displayed.
4 On the server list below the tile, select the server for which data is to be displayed.
NOTE: You can also click the view in Explorer link on the Mailbox Role Environment Summary view.
Foglight for Exchange 5.6.9User and Reference Guide
57
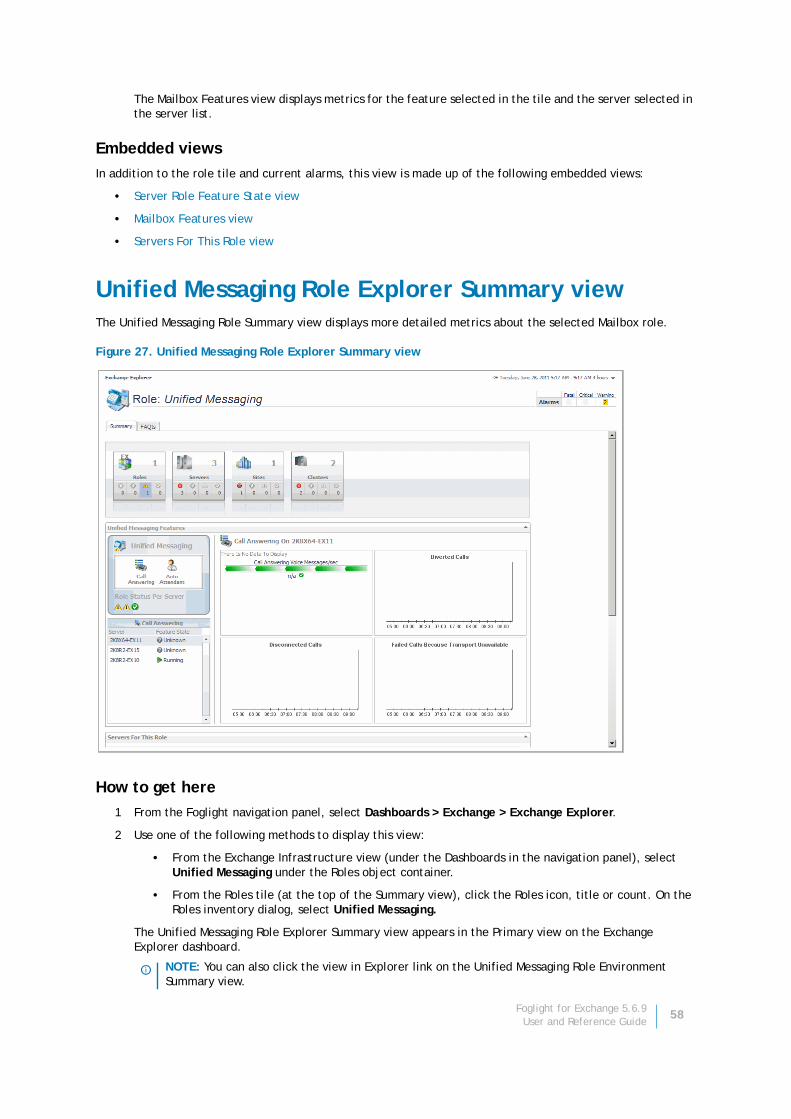
The Mailbox Features view displays metrics for the feature selected in the tile and the server selected in the server list.
Embedded views
In addition to the role tile and current alarms, this view is made up of the following embedded views:
• Server Role Feature State view
• Mailbox Features view
• Servers For This Role view
Unified Messaging Role Explorer Summary viewThe Unified Messaging Role Summary view displays more detailed metrics about the selected Mailbox role.
Figure 27. Unified Messaging Role Explorer Summary view
How to get here
1 From the Foglight navigation panel, select Dashboards > Exchange > Exchange Explorer.
2 Use one of the following methods to display this view:
• From the Exchange Infrastructure view (under the Dashboards in the navigation panel), select Unified Messaging under the Roles object container.
• From the Roles tile (at the top of the Summary view), click the Roles icon, title or count. On the Roles inventory dialog, select Unified Messaging.
The Unified Messaging Role Explorer Summary view appears in the Primary view on the Exchange Explorer dashboard.
NOTE: You can also click the view in Explorer link on the Unified Messaging Role Environment Summary view.
Foglight for Exchange 5.6.9User and Reference Guide
58
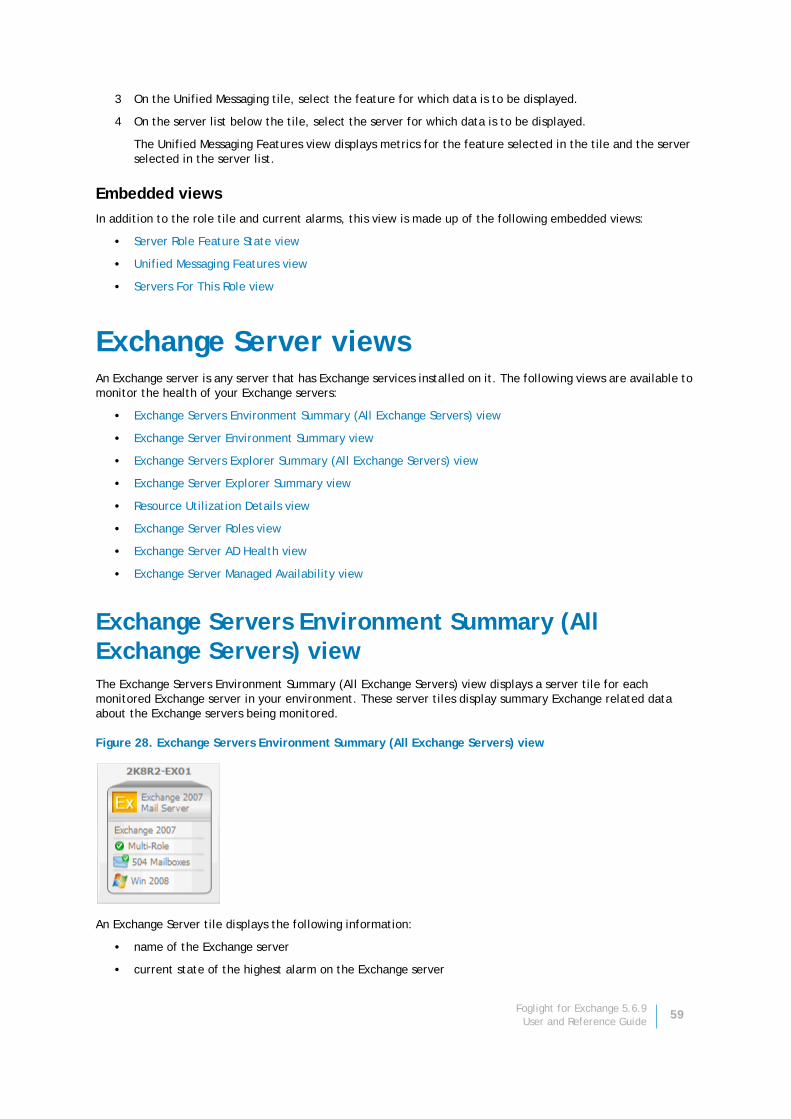
3 On the Unified Messaging tile, select the feature for which data is to be displayed.
4 On the server list below the tile, select the server for which data is to be displayed.
The Unified Messaging Features view displays metrics for the feature selected in the tile and the server selected in the server list.
Embedded views
In addition to the role tile and current alarms, this view is made up of the following embedded views:
• Server Role Feature State view
• Unified Messaging Features view
• Servers For This Role view
Exchange Server viewsAn Exchange server is any server that has Exchange services installed on it. The following views are available to monitor the health of your Exchange servers:
• Exchange Servers Environment Summary (All Exchange Servers) view
• Exchange Server Environment Summary view
• Exchange Servers Explorer Summary (All Exchange Servers) view
• Exchange Server Explorer Summary view
• Resource Utilization Details view
• Exchange Server Roles view
• Exchange Server AD Health view
• Exchange Server Managed Availability view
Exchange Servers Environment Summary (All Exchange Servers) viewThe Exchange Servers Environment Summary (All Exchange Servers) view displays a server tile for each monitored Exchange server in your environment. These server tiles display summary Exchange related data about the Exchange servers being monitored.
Figure 28. Exchange Servers Environment Summary (All Exchange Servers) view
An Exchange Server tile displays the following information:
• name of the Exchange server
• current state of the highest alarm on the Exchange server
Foglight for Exchange 5.6.9User and Reference Guide
59

• whether the server is a Mail Server or a Role Server
• Exchange version installed on the server
• Exchange roles assigned to the server
• number of mailboxes on the Mail Server
• Windows® operating system running on the Exchange server
• the icon in the lower left corner indicates that the Exchange server is a virtual machine that is being monitored by Foglight for VMware or Foglight for Hyper-V. In addition, the tile is outlined in blue when the server is a virtual machine that is being monitored by one of these cartridges.
How to get here
1 From the Foglight navigation panel, select Dashboards > Exchange > Exchange Environment.
2 From the Monitoring tab, select the Servers tile.
3 From the Object Tree view, select Summary.
The Exchange Servers Environment Summary (All Exchange Servers) view appears in the Object Summary view of the Quick View on the Exchange Environment dashboard.
To view metrics and information about an individual server, click that server’s tile or select the server from the Object Tree view.
Exchange Server Environment Summary viewThe Exchange Server Environment Summary view displays a server tile for the selected Exchange server that lists the Exchange features enabled on the server. In addition to the Exchange server tile, this view displays resource metrics and environment information about the selected Exchange server.
NOTE: If you would prefer to view a list of Exchange servers, instead of tiles for each server, select the Toggle View icon. You can then use the search controls to the right to filter your list of servers.
NOTE: If the Server Health metrics are not appearing on this view, check the Host Collector setting on the agent’s properties page. The VMware option is selected by default. If Foglight for Exchange or Foglight for Hyper-V cartridge is being used to collect the host metrics, this setting must be set to the appropriate option.
Foglight for Exchange 5.6.9User and Reference Guide
60
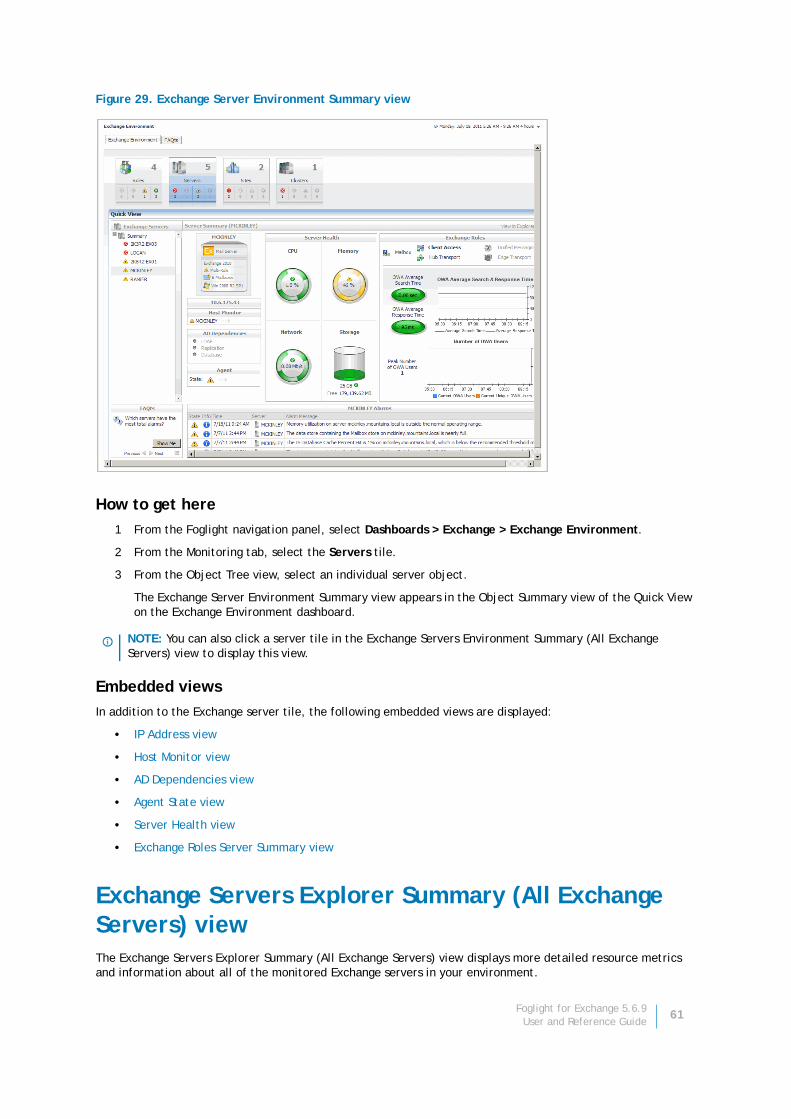
Figure 29. Exchange Server Environment Summary view
How to get here
1 From the Foglight navigation panel, select Dashboards > Exchange > Exchange Environment.
2 From the Monitoring tab, select the Servers tile.
3 From the Object Tree view, select an individual server object.
The Exchange Server Environment Summary view appears in the Object Summary view of the Quick View on the Exchange Environment dashboard.
Embedded views
In addition to the Exchange server tile, the following embedded views are displayed:
• IP Address view
• Host Monitor view
• AD Dependencies view
• Agent State view
• Server Health view
• Exchange Roles Server Summary view
Exchange Servers Explorer Summary (All Exchange Servers) viewThe Exchange Servers Explorer Summary (All Exchange Servers) view displays more detailed resource metrics and information about all of the monitored Exchange servers in your environment.
NOTE: You can also click a server tile in the Exchange Servers Environment Summary (All Exchange Servers) view to display this view.
Foglight for Exchange 5.6.9User and Reference Guide
61

Figure 30. Exchange Servers Explorer Summary (All Exchange Servers) view
How to get here
1 From the Foglight navigation panel, select Dashboards > Exchange > Exchange Explorer.
2 From the Exchange Infrastructure view (under Dashboards in the navigation panel), select the Servers container object.
The Exchange Servers Explorer Summary (All Exchange Servers) view appears in the Primary view on the Exchange Explorer dashboard.
Embedded views
In addition to the current Exchange server alarms, this view is made up of the following embedded views:
• Top 3 ASP.NET Current Requests views
• Top 3 Memory Consumers view
• Top 3 Network Consumers view
• Top 3 Storage Consumers view
• Exchange Servers view (Exchange Explorer Summary)
Exchange Server Explorer Summary viewThe Exchange Server Explorer Summary view displays more detailed resource metrics and information about the selected Exchange server.
NOTE: You can also click the view in Explorer link on the Exchange Servers Environment Summary (All Exchange Servers) view.
NOTE: If the resource utilization metrics and data are not appearing on this view, check the Host Collector setting on the agent’s properties page. The VMware option is selected by default. If Foglight for Exchange or Foglight for Hyper-V cartridge is being used to collect the host metrics, this setting must be set to the appropriate option.
Foglight for Exchange 5.6.9User and Reference Guide
62
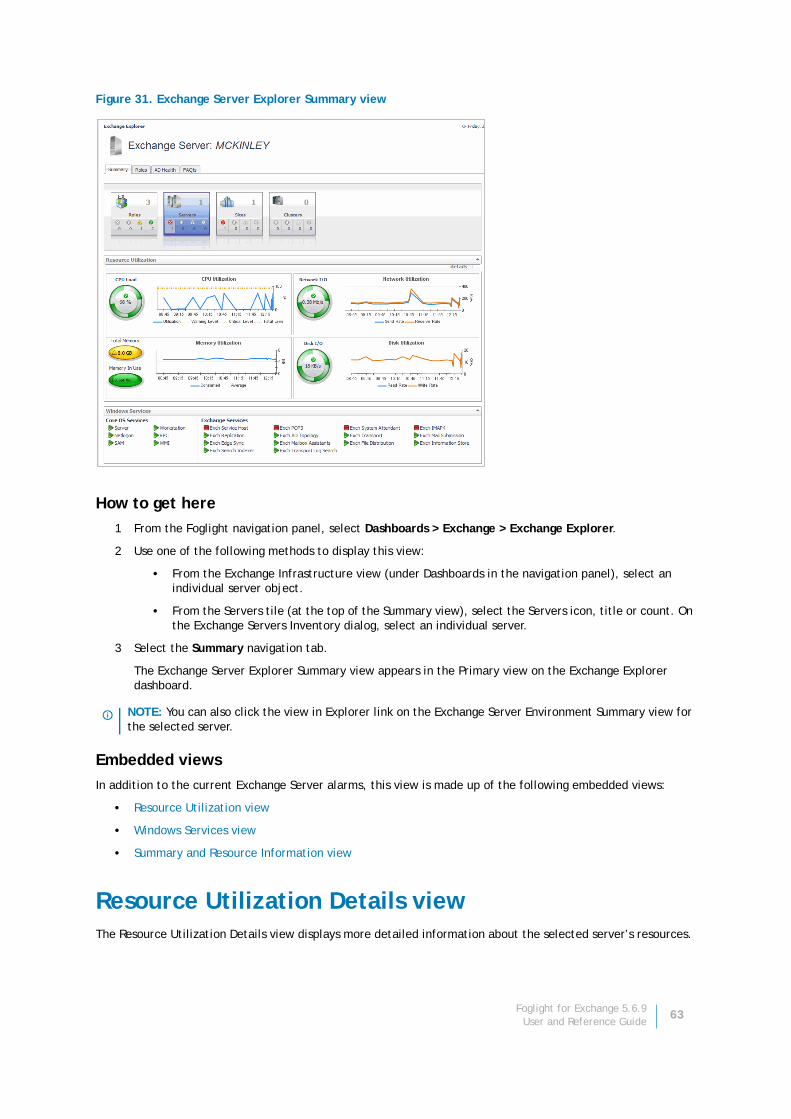
Figure 31. Exchange Server Explorer Summary view
How to get here
1 From the Foglight navigation panel, select Dashboards > Exchange > Exchange Explorer.
2 Use one of the following methods to display this view:
• From the Exchange Infrastructure view (under Dashboards in the navigation panel), select an individual server object.
• From the Servers tile (at the top of the Summary view), select the Servers icon, title or count. On the Exchange Servers Inventory dialog, select an individual server.
3 Select the Summary navigation tab.
The Exchange Server Explorer Summary view appears in the Primary view on the Exchange Explorer dashboard.
Embedded views
In addition to the current Exchange Server alarms, this view is made up of the following embedded views:
• Resource Utilization view
• Windows Services view
• Summary and Resource Information view
Resource Utilization Details viewThe Resource Utilization Details view displays more detailed information about the selected server’s resources.
NOTE: You can also click the view in Explorer link on the Exchange Server Environment Summary view for the selected server.
Foglight for Exchange 5.6.9User and Reference Guide
63
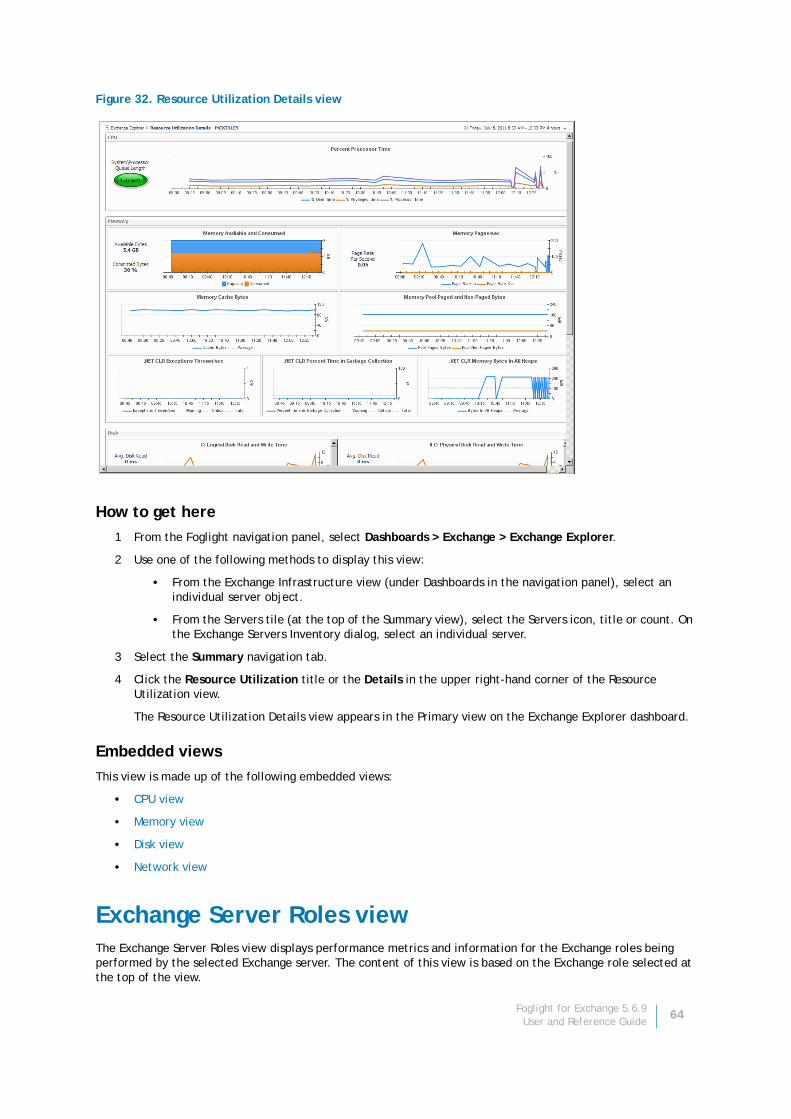
Figure 32. Resource Utilization Details view
How to get here
1 From the Foglight navigation panel, select Dashboards > Exchange > Exchange Explorer.
2 Use one of the following methods to display this view:
• From the Exchange Infrastructure view (under Dashboards in the navigation panel), select an individual server object.
• From the Servers tile (at the top of the Summary view), select the Servers icon, title or count. On the Exchange Servers Inventory dialog, select an individual server.
3 Select the Summary navigation tab.
4 Click the Resource Utilization title or the Details in the upper right-hand corner of the Resource Utilization view.
The Resource Utilization Details view appears in the Primary view on the Exchange Explorer dashboard.
Embedded views
This view is made up of the following embedded views:
• CPU view
• Memory view
• Disk view
• Network view
Exchange Server Roles viewThe Exchange Server Roles view displays performance metrics and information for the Exchange roles being performed by the selected Exchange server. The content of this view is based on the Exchange role selected at the top of the view.
Foglight for Exchange 5.6.9User and Reference Guide
64

Figure 33. Exchange Server Roles view
How to get here
1 From the Foglight navigation panel, select Dashboards > Exchange > Exchange Explorer.
2 Use one of the following methods to display this view:
• From the Exchange Infrastructure view (under Dashboards in the navigation panel), select an individual server object.
• From the Servers tile (at the top of the Summary view), select the Servers icon, title or count. On the Exchange Servers Inventory dialog, select an individual server.
3 Select the Roles navigation tab.
The Exchange Server Roles view appears in the Primary view on the Exchange Explorer dashboard.
Embedded views
The embedded views in this view are dependant upon the Exchange role selected at the top of the Exchange Server Roles view. Based on the Exchange role selected, this view is made up of the following embedded views:
NOTE: To display an optional embedded view, enable the collection and display of the corresponding collection group on the Exchange Metrics Management dashboard.
Foglight for Exchange 5.6.9User and Reference Guide
65
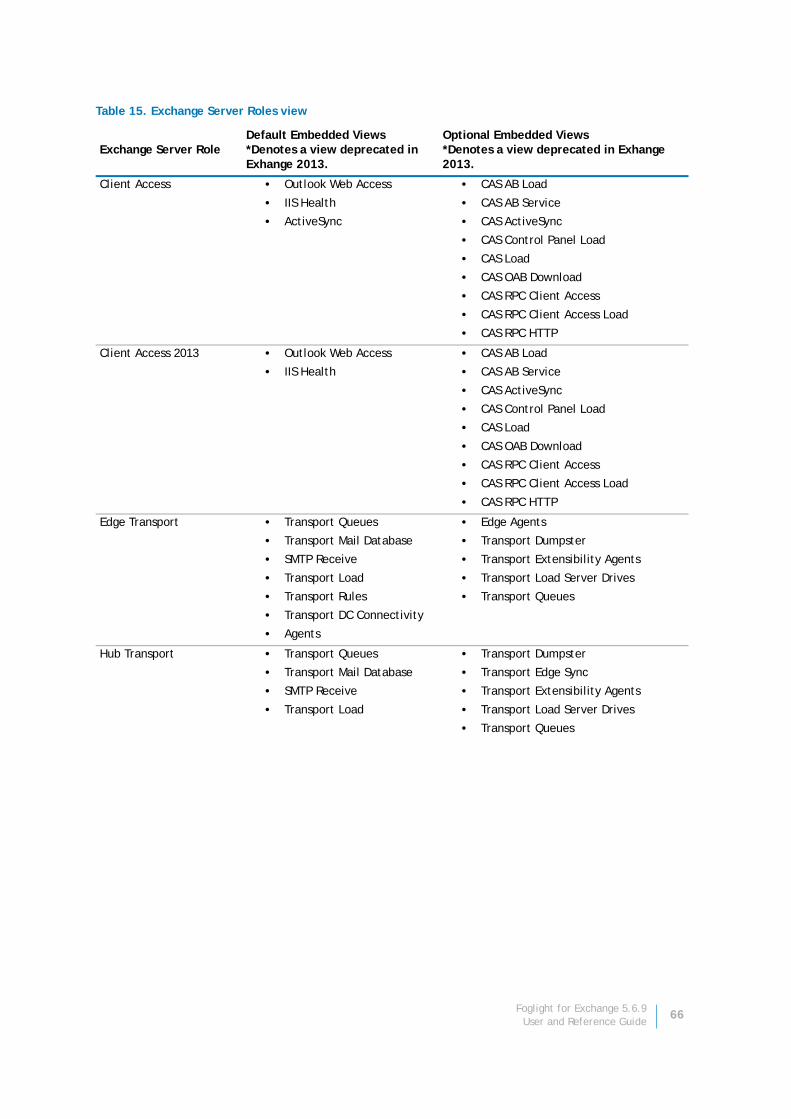
Table 15. Exchange Server Roles view
Exchange Server RoleDefault Embedded Views*Denotes a view deprecated in Exhange 2013.
Optional Embedded Views*Denotes a view deprecated in Exhange 2013.
Client Access • Outlook Web Access
• IIS Health
• ActiveSync
• CAS AB Load
• CAS AB Service
• CAS ActiveSync
• CAS Control Panel Load
• CAS Load
• CAS OAB Download
• CAS RPC Client Access
• CAS RPC Client Access Load
• CAS RPC HTTP
Client Access 2013 • Outlook Web Access
• IIS Health
• CAS AB Load
• CAS AB Service
• CAS ActiveSync
• CAS Control Panel Load
• CAS Load
• CAS OAB Download
• CAS RPC Client Access
• CAS RPC Client Access Load
• CAS RPC HTTP
Edge Transport • Transport Queues
• Transport Mail Database
• SMTP Receive
• Transport Load
• Transport Rules
• Transport DC Connectivity
• Agents
• Edge Agents
• Transport Dumpster
• Transport Extensibility Agents
• Transport Load Server Drives
• Transport Queues
Hub Transport • Transport Queues
• Transport Mail Database
• SMTP Receive
• Transport Load
• Transport Dumpster
• Transport Edge Sync
• Transport Extensibility Agents
• Transport Load Server Drives
• Transport Queues
Foglight for Exchange 5.6.9User and Reference Guide
66
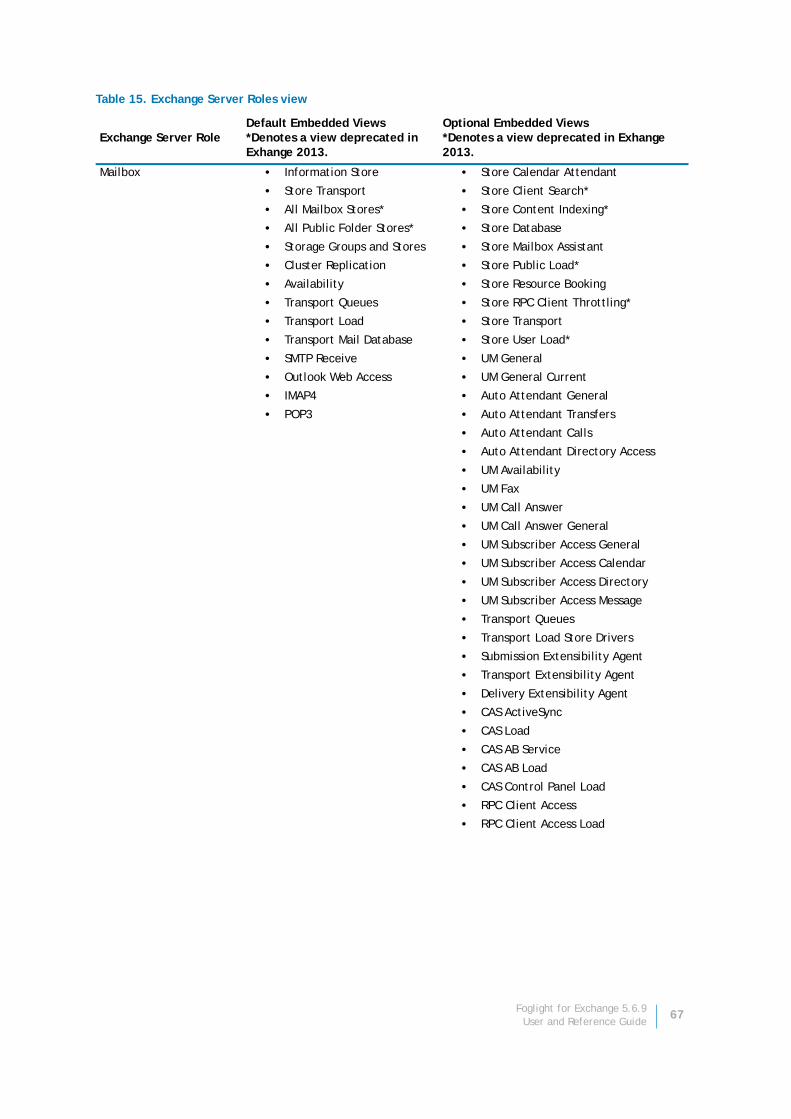
Mailbox • Information Store
• Store Transport
• All Mailbox Stores*
• All Public Folder Stores*
• Storage Groups and Stores
• Cluster Replication
• Availability
• Transport Queues
• Transport Load
• Transport Mail Database
• SMTP Receive
• Outlook Web Access
• IMAP4
• POP3
• Store Calendar Attendant
• Store Client Search*
• Store Content Indexing*
• Store Database
• Store Mailbox Assistant
• Store Public Load*
• Store Resource Booking
• Store RPC Client Throttling*
• Store Transport
• Store User Load*
• UM General
• UM General Current
• Auto Attendant General
• Auto Attendant Transfers
• Auto Attendant Calls
• Auto Attendant Directory Access
• UM Availability
• UM Fax
• UM Call Answer
• UM Call Answer General
• UM Subscriber Access General
• UM Subscriber Access Calendar
• UM Subscriber Access Directory
• UM Subscriber Access Message
• Transport Queues
• Transport Load Store Drivers
• Submission Extensibility Agent
• Transport Extensibility Agent
• Delivery Extensibility Agent
• CAS ActiveSync
• CAS Load
• CAS AB Service
• CAS AB Load
• CAS Control Panel Load
• RPC Client Access
• RPC Client Access Load
Table 15. Exchange Server Roles view
Exchange Server RoleDefault Embedded Views*Denotes a view deprecated in Exhange 2013.
Optional Embedded Views*Denotes a view deprecated in Exhange 2013.
Foglight for Exchange 5.6.9User and Reference Guide
67
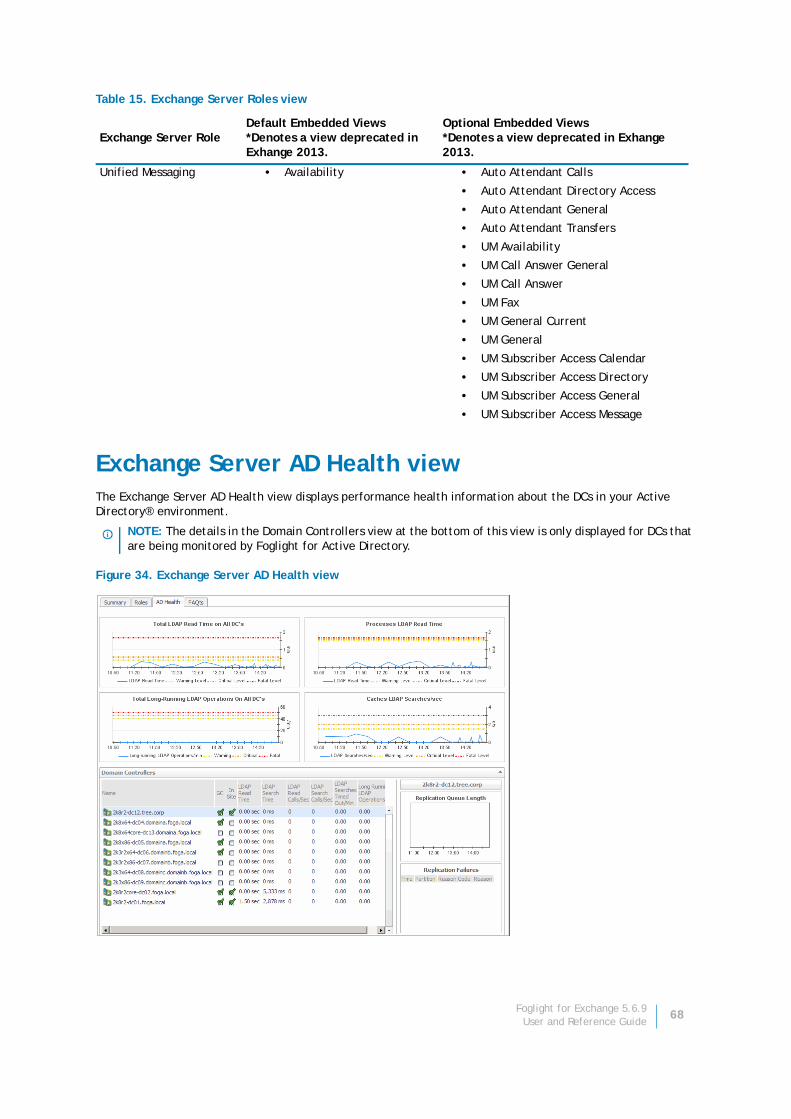
Exchange Server AD Health viewThe Exchange Server AD Health view displays performance health information about the DCs in your Active Directory® environment.
Figure 34. Exchange Server AD Health view
Unified Messaging • Availability • Auto Attendant Calls
• Auto Attendant Directory Access
• Auto Attendant General
• Auto Attendant Transfers
• UM Availability
• UM Call Answer General
• UM Call Answer
• UM Fax
• UM General Current
• UM General
• UM Subscriber Access Calendar
• UM Subscriber Access Directory
• UM Subscriber Access General
• UM Subscriber Access Message
NOTE: The details in the Domain Controllers view at the bottom of this view is only displayed for DCs that are being monitored by Foglight for Active Directory.
Table 15. Exchange Server Roles view
Exchange Server RoleDefault Embedded Views*Denotes a view deprecated in Exhange 2013.
Optional Embedded Views*Denotes a view deprecated in Exhange 2013.
Foglight for Exchange 5.6.9User and Reference Guide
68

How to get here
1 From the Foglight navigation panel, select Dashboards > Exchange > Exchange Explorer.
2 Use one of the following methods to display this view:
• From the Exchange Infrastructure view (under Dashboards in the navigation panel), select an individual server object.
• From the Servers tile (at the top of the Summary view), select the Servers icon, title or count. On the Exchange Servers Inventory dialog, select an individual server.
3 Select the AD Health navigation tab.
The Exchange Server AD Health view appears in the Primary view on the Exchange Explorer dashboard.
Embedded views
This view is made up of the following embedded views:
• Top 3 ASP.NET Current Requests views
• Processes LDAP Read Time view
• Total Long-Running LDAP Operations On All DCs view
• Cached LDAP Searches/sec view
• Domain Controllers view
Exchange Server Managed Availability viewWhen an individual Exchange 2013 server is selected in the Exchange Infrastructure view, the Managed Availability navigation tab appears. The Managed Availability process addresses availability and latency issues or errors by triggering applicable actions. These actions are displayed on the Managed Availability view.
Figure 35. Exchange Server Managed Availability view
How to get here
1 From the Foglight navigation panel, select Dashboards > Exchange > Exchange Explorer.
2 Use one of the following methods to display this view:
• From the Exchange Infrastructure view (under Dashboards in the navigation panel), select an individual server object.
• From the Servers tile (at the top of the Summary view), select the Servers icon, title or count. On the Exchange Servers Inventory dialog, select an individual server.
Foglight for Exchange 5.6.9User and Reference Guide
69
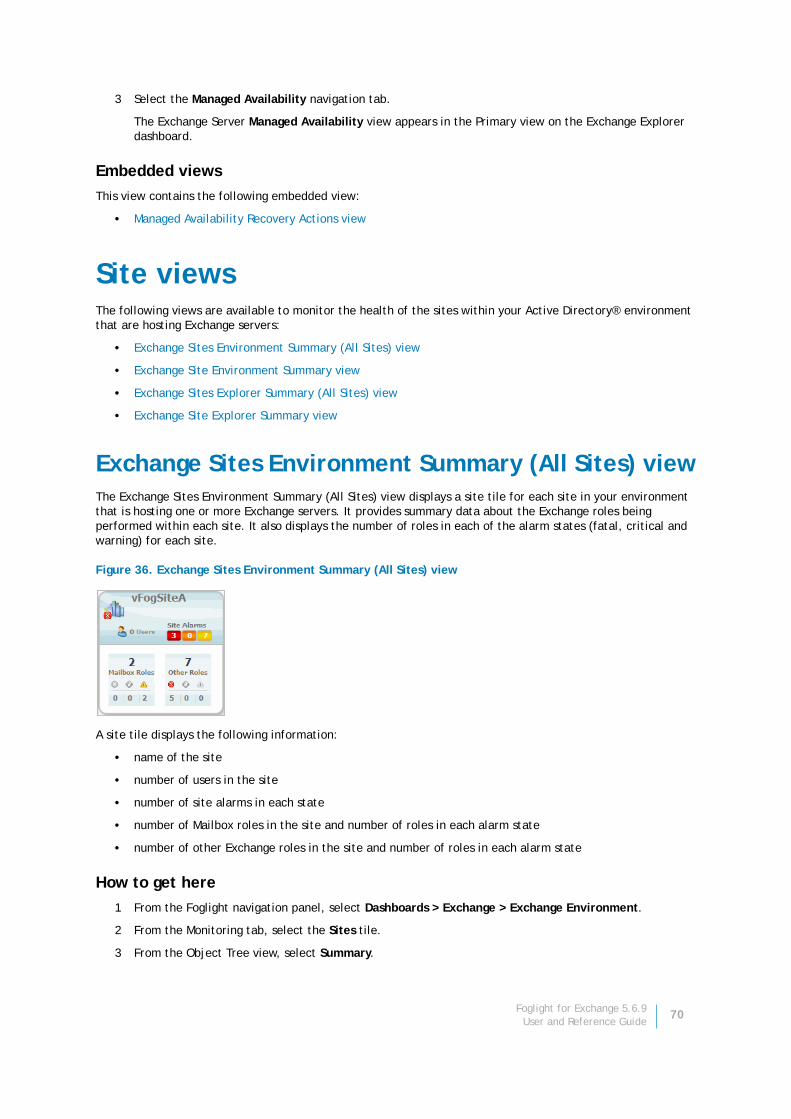
3 Select the Managed Availability navigation tab.
The Exchange Server Managed Availability view appears in the Primary view on the Exchange Explorer dashboard.
Embedded views
This view contains the following embedded view:
• Managed Availability Recovery Actions view
Site viewsThe following views are available to monitor the health of the sites within your Active Directory® environment that are hosting Exchange servers:
• Exchange Sites Environment Summary (All Sites) view
• Exchange Site Environment Summary view
• Exchange Sites Explorer Summary (All Sites) view
• Exchange Site Explorer Summary view
Exchange Sites Environment Summary (All Sites) viewThe Exchange Sites Environment Summary (All Sites) view displays a site tile for each site in your environment that is hosting one or more Exchange servers. It provides summary data about the Exchange roles being performed within each site. It also displays the number of roles in each of the alarm states (fatal, critical and warning) for each site.
Figure 36. Exchange Sites Environment Summary (All Sites) view
A site tile displays the following information:
• name of the site
• number of users in the site
• number of site alarms in each state
• number of Mailbox roles in the site and number of roles in each alarm state
• number of other Exchange roles in the site and number of roles in each alarm state
How to get here
1 From the Foglight navigation panel, select Dashboards > Exchange > Exchange Environment.
2 From the Monitoring tab, select the Sites tile.
3 From the Object Tree view, select Summary.
Foglight for Exchange 5.6.9User and Reference Guide
70
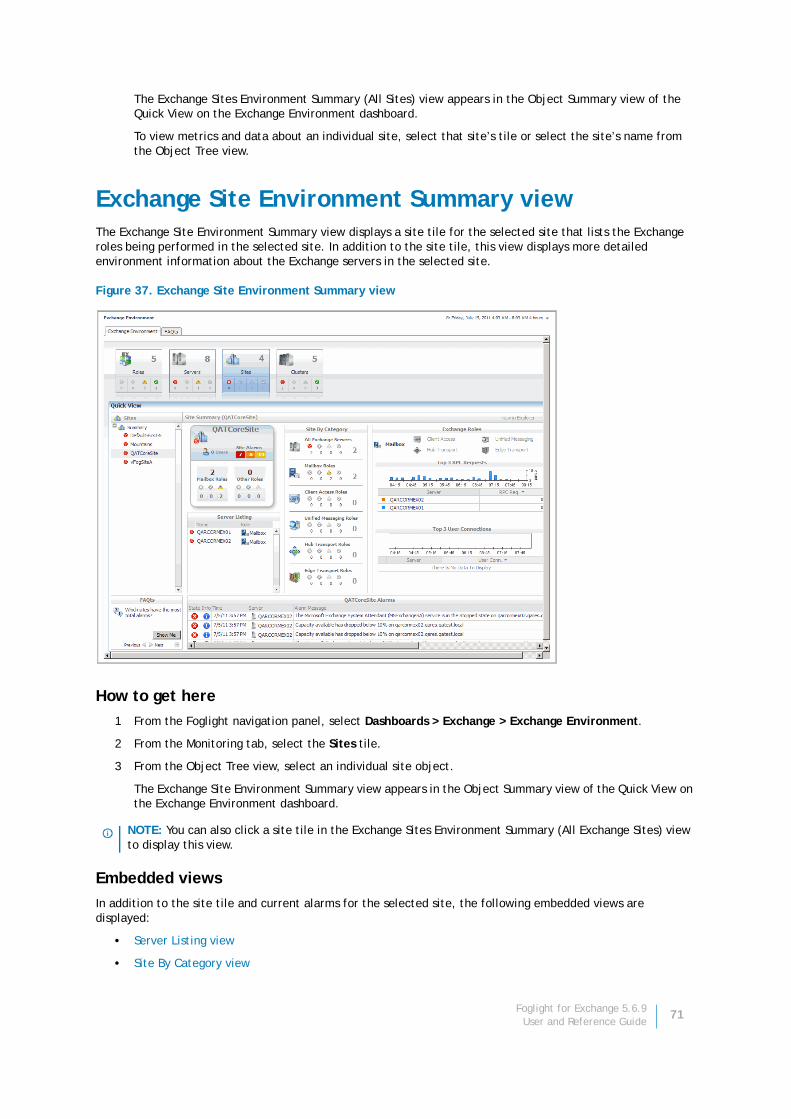
The Exchange Sites Environment Summary (All Sites) view appears in the Object Summary view of the Quick View on the Exchange Environment dashboard.
To view metrics and data about an individual site, select that site’s tile or select the site’s name from the Object Tree view.
Exchange Site Environment Summary viewThe Exchange Site Environment Summary view displays a site tile for the selected site that lists the Exchange roles being performed in the selected site. In addition to the site tile, this view displays more detailed environment information about the Exchange servers in the selected site.
Figure 37. Exchange Site Environment Summary view
How to get here
1 From the Foglight navigation panel, select Dashboards > Exchange > Exchange Environment.
2 From the Monitoring tab, select the Sites tile.
3 From the Object Tree view, select an individual site object.
The Exchange Site Environment Summary view appears in the Object Summary view of the Quick View on the Exchange Environment dashboard.
Embedded views
In addition to the site tile and current alarms for the selected site, the following embedded views are displayed:
• Server Listing view
• Site By Category view
NOTE: You can also click a site tile in the Exchange Sites Environment Summary (All Exchange Sites) view to display this view.
Foglight for Exchange 5.6.9User and Reference Guide
71
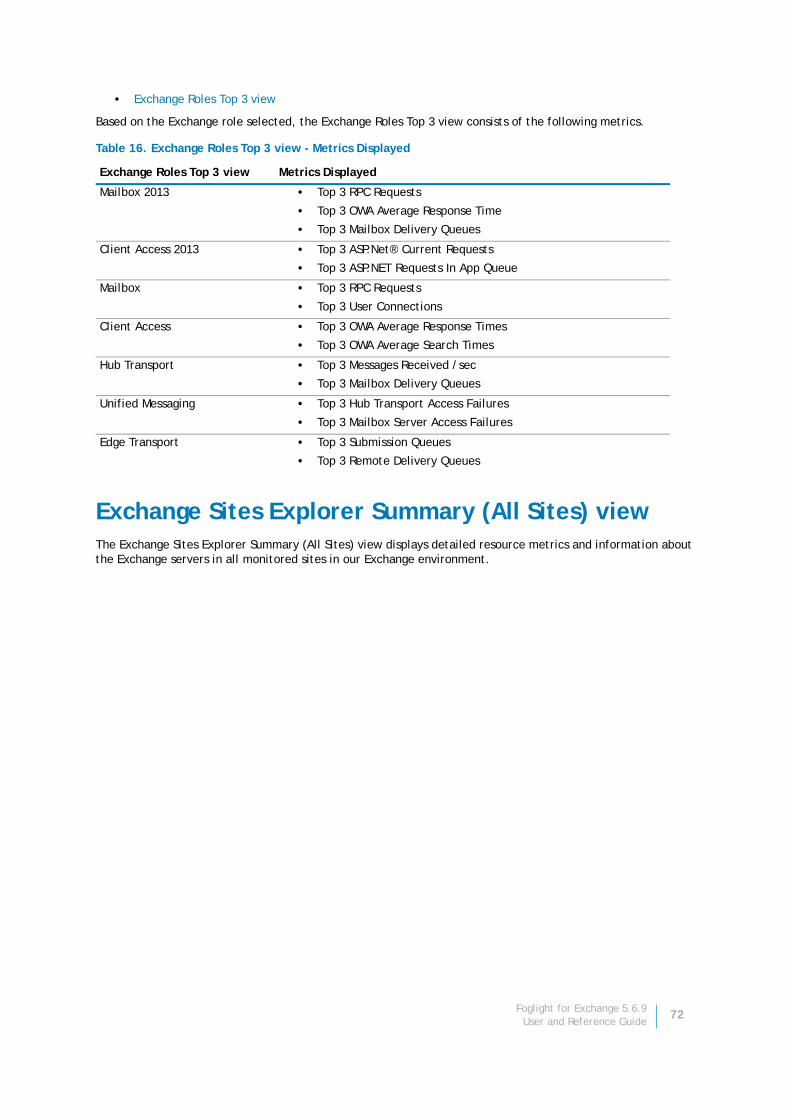
• Exchange Roles Top 3 view
Based on the Exchange role selected, the Exchange Roles Top 3 view consists of the following metrics.
Exchange Sites Explorer Summary (All Sites) viewThe Exchange Sites Explorer Summary (All Sites) view displays detailed resource metrics and information about the Exchange servers in all monitored sites in our Exchange environment.
Table 16. Exchange Roles Top 3 view - Metrics Displayed
Exchange Roles Top 3 view Metrics Displayed
Mailbox 2013 • Top 3 RPC Requests
• Top 3 OWA Average Response Time
• Top 3 Mailbox Delivery Queues
Client Access 2013 • Top 3 ASP.Net® Current Requests
• Top 3 ASP.NET Requests In App Queue
Mailbox • Top 3 RPC Requests
• Top 3 User Connections
Client Access • Top 3 OWA Average Response Times
• Top 3 OWA Average Search Times
Hub Transport • Top 3 Messages Received /sec
• Top 3 Mailbox Delivery Queues
Unified Messaging • Top 3 Hub Transport Access Failures
• Top 3 Mailbox Server Access Failures
Edge Transport • Top 3 Submission Queues
• Top 3 Remote Delivery Queues
Foglight for Exchange 5.6.9User and Reference Guide
72
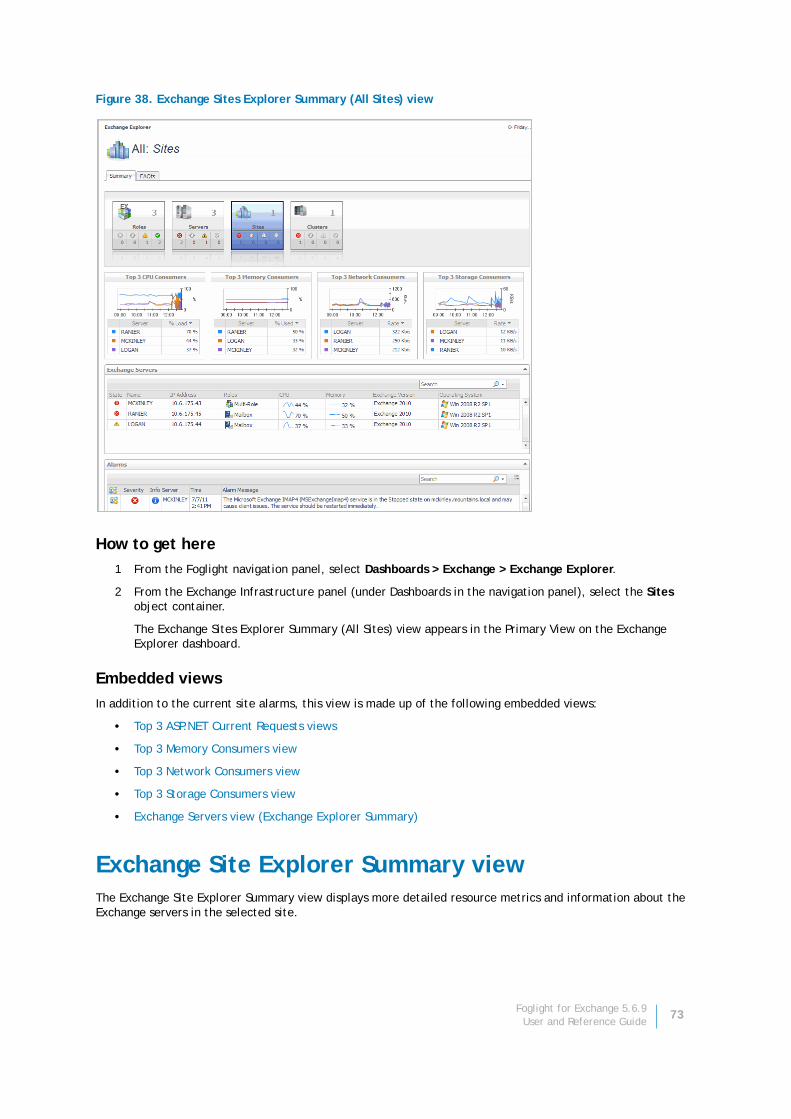
Figure 38. Exchange Sites Explorer Summary (All Sites) view
How to get here
1 From the Foglight navigation panel, select Dashboards > Exchange > Exchange Explorer.
2 From the Exchange Infrastructure panel (under Dashboards in the navigation panel), select the Sites object container.
The Exchange Sites Explorer Summary (All Sites) view appears in the Primary View on the Exchange Explorer dashboard.
Embedded views
In addition to the current site alarms, this view is made up of the following embedded views:
• Top 3 ASP.NET Current Requests views
• Top 3 Memory Consumers view
• Top 3 Network Consumers view
• Top 3 Storage Consumers view
• Exchange Servers view (Exchange Explorer Summary)
Exchange Site Explorer Summary viewThe Exchange Site Explorer Summary view displays more detailed resource metrics and information about the Exchange servers in the selected site.
Foglight for Exchange 5.6.9User and Reference Guide
73
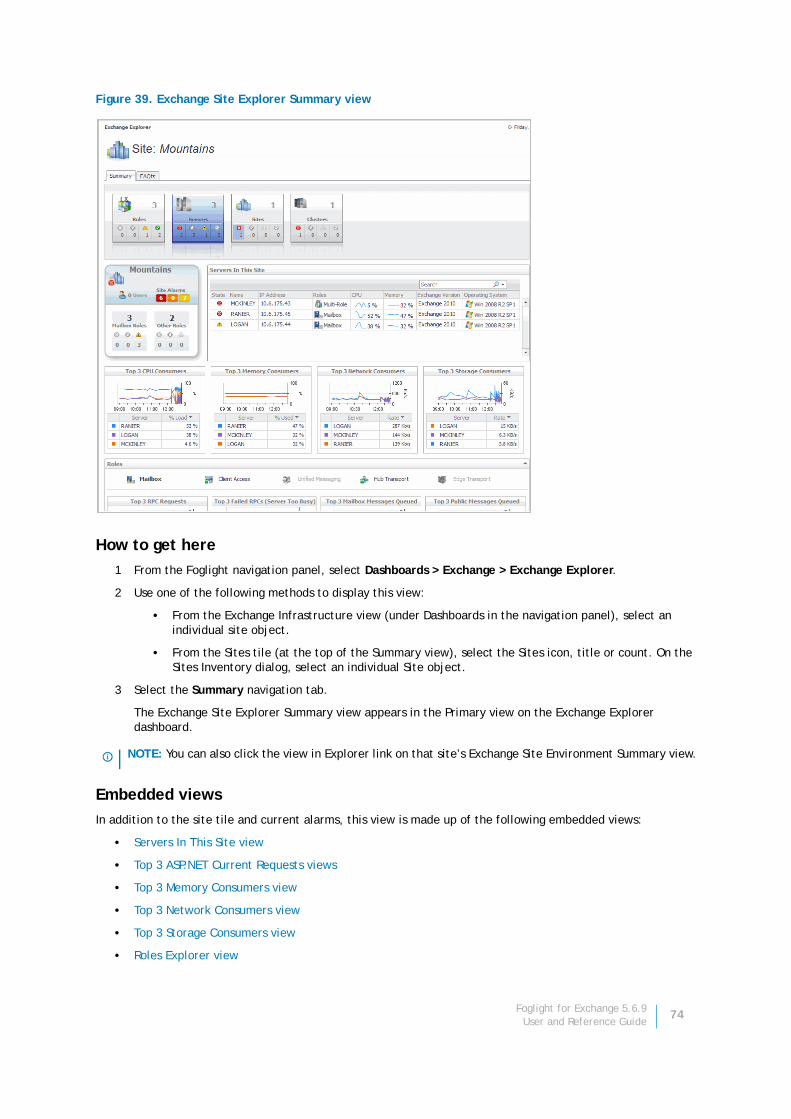
Figure 39. Exchange Site Explorer Summary view
How to get here
1 From the Foglight navigation panel, select Dashboards > Exchange > Exchange Explorer.
2 Use one of the following methods to display this view:
• From the Exchange Infrastructure view (under Dashboards in the navigation panel), select an individual site object.
• From the Sites tile (at the top of the Summary view), select the Sites icon, title or count. On the Sites Inventory dialog, select an individual Site object.
3 Select the Summary navigation tab.
The Exchange Site Explorer Summary view appears in the Primary view on the Exchange Explorer dashboard.
Embedded views
In addition to the site tile and current alarms, this view is made up of the following embedded views:
• Servers In This Site view
• Top 3 ASP.NET Current Requests views
• Top 3 Memory Consumers view
• Top 3 Network Consumers view
• Top 3 Storage Consumers view
• Roles Explorer view
NOTE: You can also click the view in Explorer link on that site’s Exchange Site Environment Summary view.
Foglight for Exchange 5.6.9User and Reference Guide
74
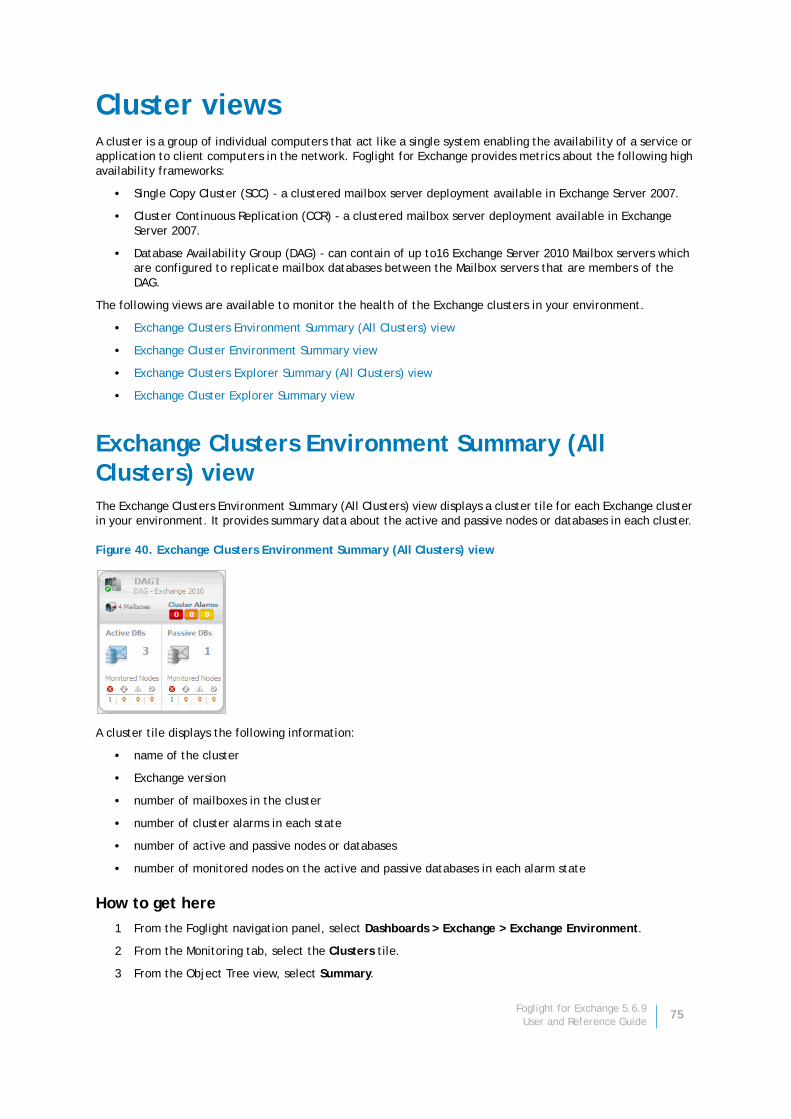
Cluster viewsA cluster is a group of individual computers that act like a single system enabling the availability of a service or application to client computers in the network. Foglight for Exchange provides metrics about the following high availability frameworks:
• Single Copy Cluster (SCC) - a clustered mailbox server deployment available in Exchange Server 2007.
• Cluster Continuous Replication (CCR) - a clustered mailbox server deployment available in Exchange Server 2007.
• Database Availability Group (DAG) - can contain of up to16 Exchange Server 2010 Mailbox servers which are configured to replicate mailbox databases between the Mailbox servers that are members of the DAG.
The following views are available to monitor the health of the Exchange clusters in your environment.
• Exchange Clusters Environment Summary (All Clusters) view
• Exchange Cluster Environment Summary view
• Exchange Clusters Explorer Summary (All Clusters) view
• Exchange Cluster Explorer Summary view
Exchange Clusters Environment Summary (All Clusters) viewThe Exchange Clusters Environment Summary (All Clusters) view displays a cluster tile for each Exchange cluster in your environment. It provides summary data about the active and passive nodes or databases in each cluster.
Figure 40. Exchange Clusters Environment Summary (All Clusters) view
A cluster tile displays the following information:
• name of the cluster
• Exchange version
• number of mailboxes in the cluster
• number of cluster alarms in each state
• number of active and passive nodes or databases
• number of monitored nodes on the active and passive databases in each alarm state
How to get here
1 From the Foglight navigation panel, select Dashboards > Exchange > Exchange Environment.
2 From the Monitoring tab, select the Clusters tile.
3 From the Object Tree view, select Summary.
Foglight for Exchange 5.6.9User and Reference Guide
75
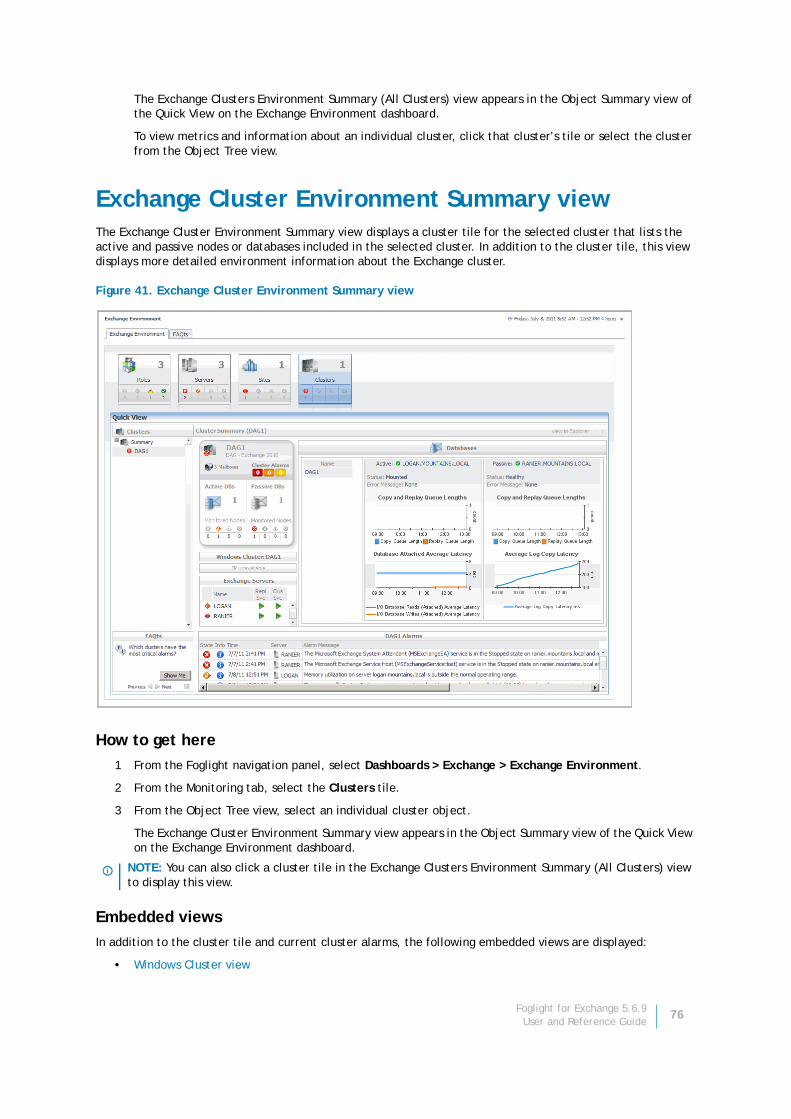
The Exchange Clusters Environment Summary (All Clusters) view appears in the Object Summary view of the Quick View on the Exchange Environment dashboard.
To view metrics and information about an individual cluster, click that cluster’s tile or select the cluster from the Object Tree view.
Exchange Cluster Environment Summary viewThe Exchange Cluster Environment Summary view displays a cluster tile for the selected cluster that lists the active and passive nodes or databases included in the selected cluster. In addition to the cluster tile, this view displays more detailed environment information about the Exchange cluster.
Figure 41. Exchange Cluster Environment Summary view
How to get here
1 From the Foglight navigation panel, select Dashboards > Exchange > Exchange Environment.
2 From the Monitoring tab, select the Clusters tile.
3 From the Object Tree view, select an individual cluster object.
The Exchange Cluster Environment Summary view appears in the Object Summary view of the Quick View on the Exchange Environment dashboard.
Embedded views
In addition to the cluster tile and current cluster alarms, the following embedded views are displayed:
• Windows Cluster view
NOTE: You can also click a cluster tile in the Exchange Clusters Environment Summary (All Clusters) view to display this view.
Foglight for Exchange 5.6.9User and Reference Guide
76
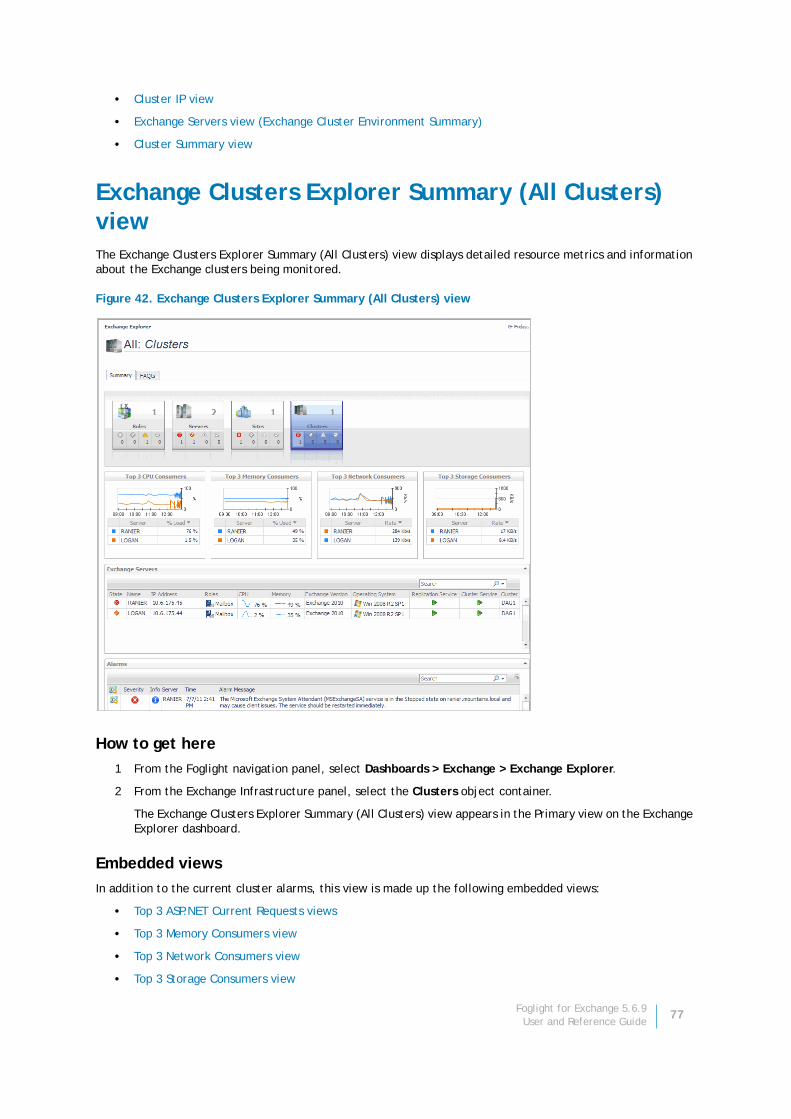
• Cluster IP view
• Exchange Servers view (Exchange Cluster Environment Summary)
• Cluster Summary view
Exchange Clusters Explorer Summary (All Clusters) viewThe Exchange Clusters Explorer Summary (All Clusters) view displays detailed resource metrics and information about the Exchange clusters being monitored.
Figure 42. Exchange Clusters Explorer Summary (All Clusters) view
How to get here
1 From the Foglight navigation panel, select Dashboards > Exchange > Exchange Explorer.
2 From the Exchange Infrastructure panel, select the Clusters object container.
The Exchange Clusters Explorer Summary (All Clusters) view appears in the Primary view on the Exchange Explorer dashboard.
Embedded views
In addition to the current cluster alarms, this view is made up the following embedded views:
• Top 3 ASP.NET Current Requests views
• Top 3 Memory Consumers view
• Top 3 Network Consumers view
• Top 3 Storage Consumers view
Foglight for Exchange 5.6.9User and Reference Guide
77
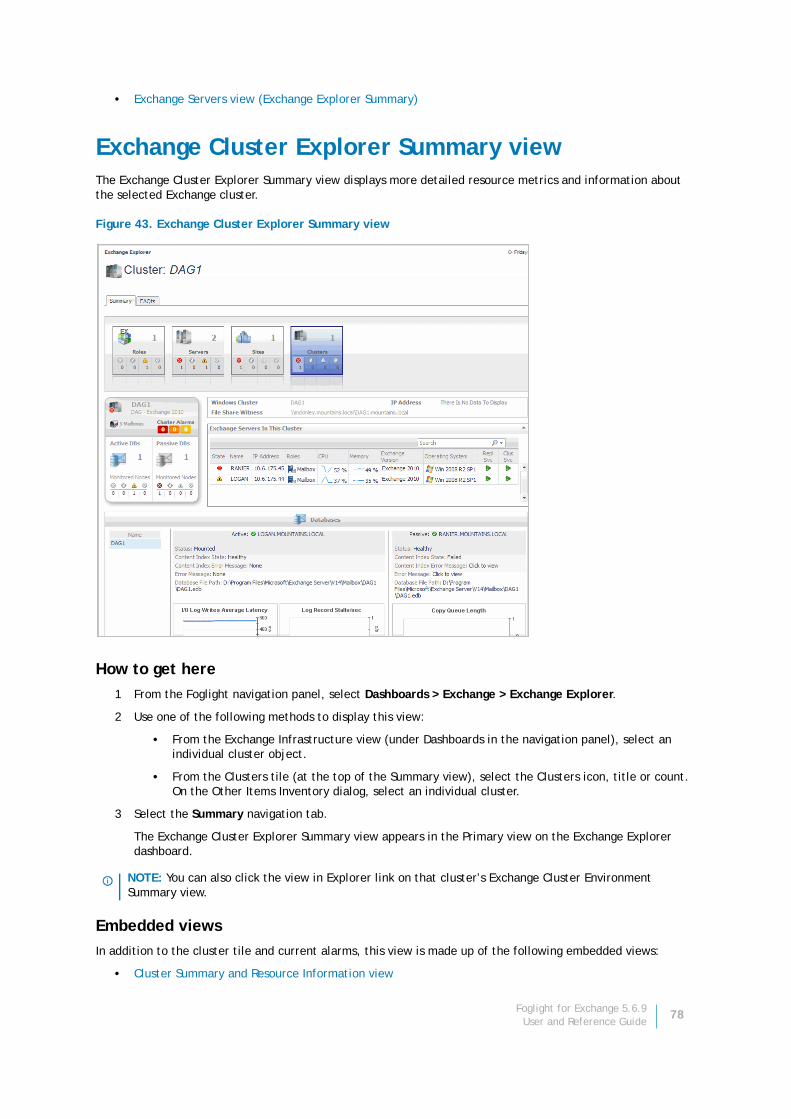
• Exchange Servers view (Exchange Explorer Summary)
Exchange Cluster Explorer Summary viewThe Exchange Cluster Explorer Summary view displays more detailed resource metrics and information about the selected Exchange cluster.
Figure 43. Exchange Cluster Explorer Summary view
How to get here
1 From the Foglight navigation panel, select Dashboards > Exchange > Exchange Explorer.
2 Use one of the following methods to display this view:
• From the Exchange Infrastructure view (under Dashboards in the navigation panel), select an individual cluster object.
• From the Clusters tile (at the top of the Summary view), select the Clusters icon, title or count. On the Other Items Inventory dialog, select an individual cluster.
3 Select the Summary navigation tab.
The Exchange Cluster Explorer Summary view appears in the Primary view on the Exchange Explorer dashboard.
Embedded views
In addition to the cluster tile and current alarms, this view is made up of the following embedded views:
• Cluster Summary and Resource Information view
NOTE: You can also click the view in Explorer link on that cluster’s Exchange Cluster Environment Summary view.
Foglight for Exchange 5.6.9User and Reference Guide
78
• Exchange Servers in This Cluster view
• Cluster Database Details view
• Cluster Storage Group Details view
• Top 3 ASP.NET Current Requests views
• Top 3 Memory Consumers view
• Top 3 Network Consumers view
• Top 3 Storage Consumers view
Description of Embedded viewsThe remainder of this chapter provides a detailed description of the information and metrics presented in the embedded views introduced earlier in this chapter.
• Active CCR Storage Group view
• Active DAG Database view
• Active SCC Storage Group view
• AD Dependencies view
• Agent State view
• Auto Attendant Calls view
• Auto Attendant Directory Access view
• Auto Attendant General view
• Auto Attendant Transfers view
• Cached LDAP Searches/sec view
• CAS AB Load view
• CAS AB Service view
• CAS ActiveSync view
• CAS Control Panel Load view
• CAS Load view
• CAS OAB Download view
• CAS RPC Client Access view
• CAS RPC Client Access Load view
• CAS RPC HTTP view
• Client Access Features view
• Cluster Database Details view
• Cluster IP view
• Cluster Storage Group Details view
• Cluster Summary and Resource Information view
• Cluster Summary view
• CPU view
• Disk view
• Domain Controllers view
Foglight for Exchange 5.6.9User and Reference Guide
79

• Edge Agent view
• Edge Transport Features view
• Exchange Roles Server Summary view
• Exchange Roles Top 3 view
• Exchange Server Roles view
• Exchange Servers in This Cluster view
• Exchange Servers view (Exchange Cluster Environment Summary)
• Exchange Servers view (Exchange Explorer Summary)
• Host Monitor view
• Hub Transport Features view
• IP Address view
• Mailbox Features view
• Mailbox Store Assistant view
• Memory view
• Network view
• Passive CCR Storage Group view
• Passive DAG Database view
• Processes LDAP Read Time view
• Resource Utilization view
• Roles Explorer view
• Role Servers view
• Server Health view
• Server Listing view
• Server Role Feature State view
• Servers For This Role view
• Servers In This Site view
• Site By Category view
• Store Calendar Attendant view
• Store Client Search view
• Store Content Indexing view
• Store Database view
• Store Public Load view
• Store Resource Booking view
• Store RPC Client Throttling view
• Store Transport view
• Store User Load view
• Summary and Resource Information view
• Top 3 ASP.NET Current Requests views
• Top 3 ASP.NET Requests In App Queue views
• Top 3 ASP.NET Current Requests views
Foglight for Exchange 5.6.9User and Reference Guide
80
• Top 3 Hub Transport Access Failures view
• Top 3 Mailbox Delivery Queues view
• Top 3 Mailbox Server Access Failures view
• Top 3 Memory Consumers view
• Top 3 Messages Received/sec view
• Top 3 Network Consumers view
• Top 3 Remote Delivery Queues view
• Top 3 RPC Requests view
• Top 3 Storage Consumers view
• Top 3 Submission Queues view
• Total LDAP Read Time On All DCs view
• Total Long-Running LDAP Operations On All DCs view
• Transport Dumpster view
• Transport Edge Sync view
• Transport Extensibility Agent view
• Transport Load Store Drivers view
• Transport Queues view
• UM Availability view
• UM Call Answer General view
• UM Call Answer view
• UM Fax view
• UM General Current view
• UM General view
• UM Subscriber Access Calendar view
• UM Subscriber Access Directory view
• UM Subscriber Access General view
• UM Subscriber Access Message view
• Unified Messaging Features view
• Windows Cluster view
• Windows Services view
Active CCR Storage Group viewThis view appears when you click on the name of the active storage group at the top of the Cluster Storage Group Details view on the Exchange Explorer dashboard or at the top of the Cluster Summary view on the Exchange Environment dashboard.
NOTE: This view is only available when an Exchange Server 2007 cluster is selected.
Foglight for Exchange 5.6.9User and Reference Guide
81
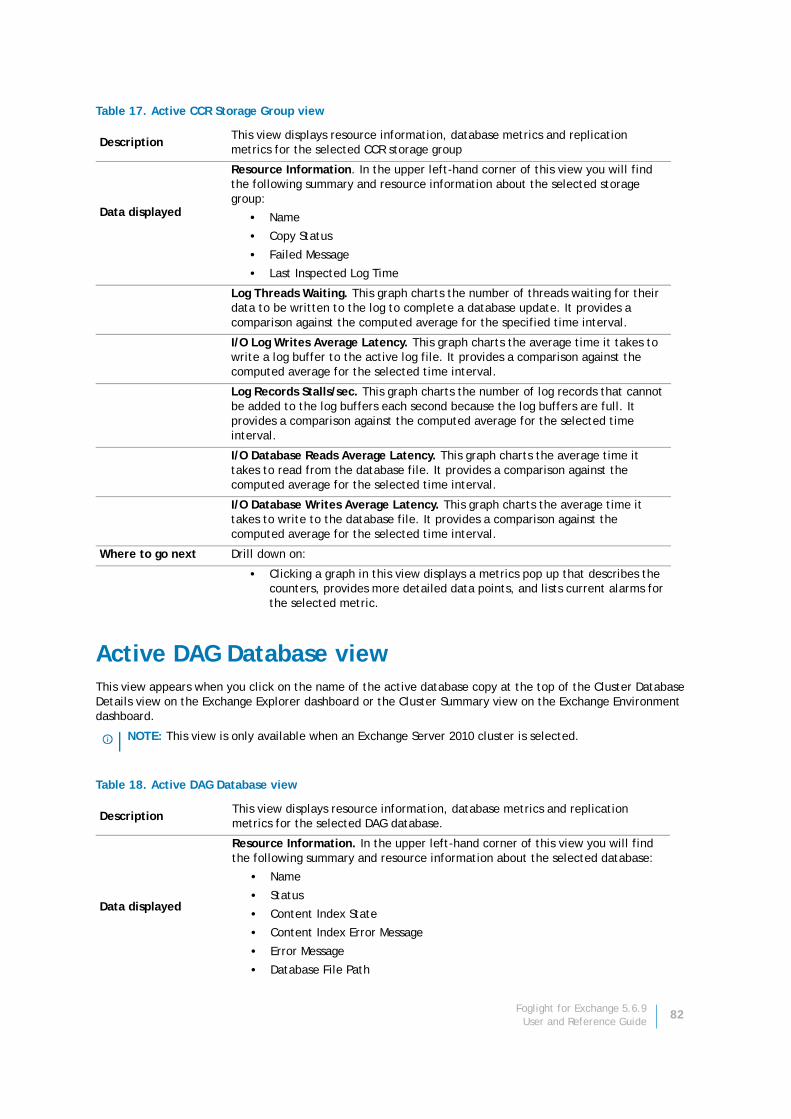
Active DAG Database viewThis view appears when you click on the name of the active database copy at the top of the Cluster Database Details view on the Exchange Explorer dashboard or the Cluster Summary view on the Exchange Environment dashboard.
Table 17. Active CCR Storage Group view
DescriptionThis view displays resource information, database metrics and replication metrics for the selected CCR storage group
Data displayed
Resource Information. In the upper left-hand corner of this view you will find the following summary and resource information about the selected storage group:
• Name
• Copy Status
• Failed Message
• Last Inspected Log Time
Log Threads Waiting. This graph charts the number of threads waiting for their data to be written to the log to complete a database update. It provides a comparison against the computed average for the specified time interval.
I/O Log Writes Average Latency. This graph charts the average time it takes to write a log buffer to the active log file. It provides a comparison against the computed average for the selected time interval.
Log Records Stalls/sec. This graph charts the number of log records that cannot be added to the log buffers each second because the log buffers are full. It provides a comparison against the computed average for the selected time interval.
I/O Database Reads Average Latency. This graph charts the average time it takes to read from the database file. It provides a comparison against the computed average for the selected time interval.
I/O Database Writes Average Latency. This graph charts the average time it takes to write to the database file. It provides a comparison against the computed average for the selected time interval.
Where to go next Drill down on:
• Clicking a graph in this view displays a metrics pop up that describes the counters, provides more detailed data points, and lists current alarms for the selected metric.
NOTE: This view is only available when an Exchange Server 2010 cluster is selected.
Table 18. Active DAG Database view
DescriptionThis view displays resource information, database metrics and replication metrics for the selected DAG database.
Data displayed
Resource Information. In the upper left-hand corner of this view you will find the following summary and resource information about the selected database:
• Name
• Status
• Content Index State
• Content Index Error Message
• Error Message
• Database File Path
Foglight for Exchange 5.6.9User and Reference Guide
82
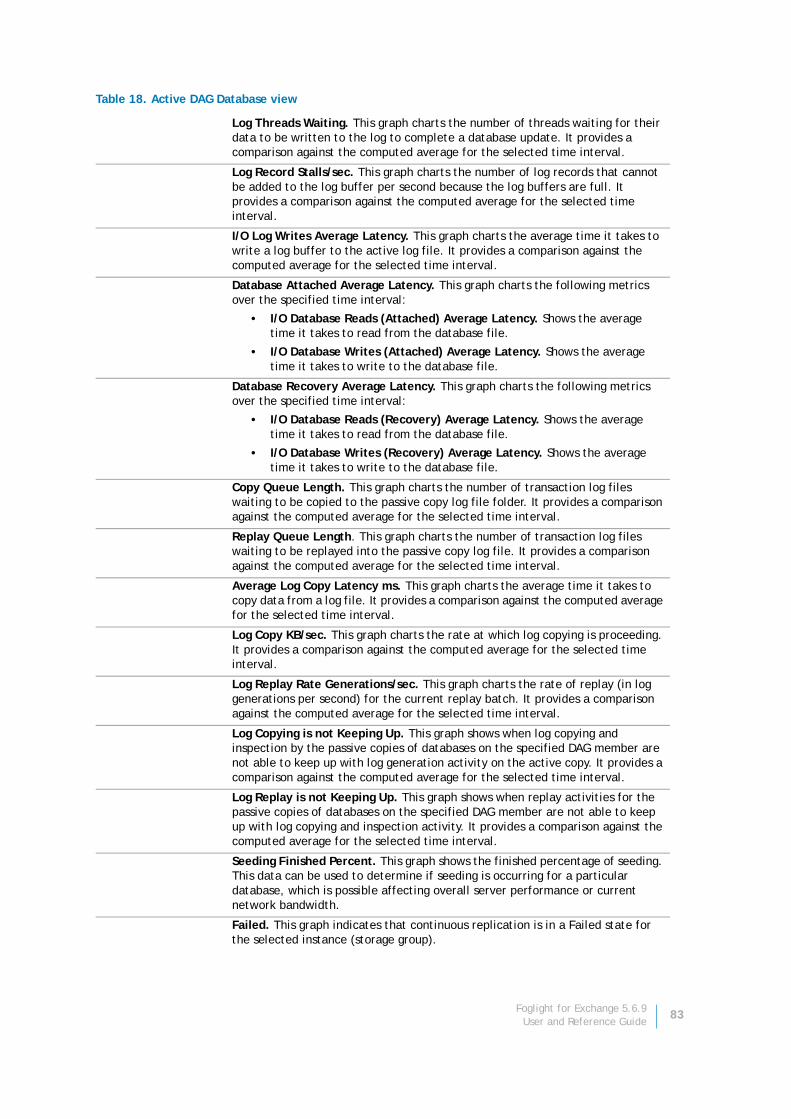
Log Threads Waiting. This graph charts the number of threads waiting for their data to be written to the log to complete a database update. It provides a comparison against the computed average for the selected time interval.
Log Record Stalls/sec. This graph charts the number of log records that cannot be added to the log buffer per second because the log buffers are full. It provides a comparison against the computed average for the selected time interval.
I/O Log Writes Average Latency. This graph charts the average time it takes to write a log buffer to the active log file. It provides a comparison against the computed average for the selected time interval.
Database Attached Average Latency. This graph charts the following metrics over the specified time interval:
• I/O Database Reads (Attached) Average Latency. Shows the average time it takes to read from the database file.
• I/O Database Writes (Attached) Average Latency. Shows the average time it takes to write to the database file.
Database Recovery Average Latency. This graph charts the following metrics over the specified time interval:
• I/O Database Reads (Recovery) Average Latency. Shows the average time it takes to read from the database file.
• I/O Database Writes (Recovery) Average Latency. Shows the average time it takes to write to the database file.
Copy Queue Length. This graph charts the number of transaction log files waiting to be copied to the passive copy log file folder. It provides a comparison against the computed average for the selected time interval.
Replay Queue Length. This graph charts the number of transaction log files waiting to be replayed into the passive copy log file. It provides a comparison against the computed average for the selected time interval.
Average Log Copy Latency ms. This graph charts the average time it takes to copy data from a log file. It provides a comparison against the computed average for the selected time interval.
Log Copy KB/sec. This graph charts the rate at which log copying is proceeding. It provides a comparison against the computed average for the selected time interval.
Log Replay Rate Generations/sec. This graph charts the rate of replay (in log generations per second) for the current replay batch. It provides a comparison against the computed average for the selected time interval.
Log Copying is not Keeping Up. This graph shows when log copying and inspection by the passive copies of databases on the specified DAG member are not able to keep up with log generation activity on the active copy. It provides a comparison against the computed average for the selected time interval.
Log Replay is not Keeping Up. This graph shows when replay activities for the passive copies of databases on the specified DAG member are not able to keep up with log copying and inspection activity. It provides a comparison against the computed average for the selected time interval.
Seeding Finished Percent. This graph shows the finished percentage of seeding. This data can be used to determine if seeding is occurring for a particular database, which is possible affecting overall server performance or current network bandwidth.
Failed. This graph indicates that continuous replication is in a Failed state for the selected instance (storage group).
Table 18. Active DAG Database view
Foglight for Exchange 5.6.9User and Reference Guide
83

Active SCC Storage Group viewThis view appears when you click on the name of the active storage group at the top of the Cluster Storage Group Details view on the Exchange Explorer dashboard or at the top of the Cluster Summary view on the Exchange Environment dashboard.
Initializing. This graph indicates that continuous replication is in an Initializing state for the selected instance (storage group). While in this state, the system is verifying that the database and log stream are in a consistent state.
Suspended. This graph indicates that continuous replication activity is suspended and log files are not being copied or replayed into the passive copy. This state may be a result of an administrator manually suspending the database copy.
Activation Suspended. This graph indicates whether activation on the mailbox database copy is suspended.
Failed Suspended. This graph indicates whether the Failed and Suspended states have been set simultaneously by the system because a failure was detected, and because resolution of the failure explicitly requires administrator intervention.
Disconnected. This graph indicates whether a mailbox copy is in a state of Disconnected on the specified DAG member.
Where to go next N/A
NOTE: This view is only available when an Exchange Server 2007 cluster is selected.
Table 19. Active SCC Storage Group view
DescriptionThis view displays resource information, database metrics and replication metrics for the selected SCC storage group
Data displayed Name. In the upper left corner the name of the selected SCC storage group is displayed with a state indicator showing the storage group’s current state.
Log Threads Waiting. This graph charts the number of threads waiting for their data to be written to the log to complete a database update. It provides a comparison against the computed average for the specified time interval.
I/O Log Writes Average Latency. This graph charts the average time it takes to write a log buffer to the active log file. It provides a comparison against the computed average for the selected time interval.
Log Records Stalls/sec. This graph charts the number of log records that cannot be added to the log buffers each second because the log buffers are full. It provides a comparison against the computed average for the selected time interval.
I/O Database Reads Average Latency. This graph charts the average time it takes to read from the database file. It provides a comparison against the computed average for the selected time interval.
I/O Database Writes Average Latency. This graph charts the average time it takes to write to the database file. It provides a comparison against the computed average for the selected time interval.
Where to go next Drill down on:
• Clicking a graph in this view displays a metrics pop up that describes the counters, provides more detailed data points, and lists current alarms for the selected metric.
Table 18. Active DAG Database view
Foglight for Exchange 5.6.9User and Reference Guide
84

AD Dependencies viewThis embedded view is part of the Exchange Server Environment Summary view, which appears when an individual Exchange server is selected in the Object Tree view on the Exchange Environment dashboard.
Agent State viewThis embedded view is part of the Exchange Server Environment Summary view, which appears when an individual Exchange server is selected in the Object Tree view on the Exchange Environment dashboard.
Auto Attendant Calls viewTo display this view, enable the UM Auto Att Calls Group in the Unified Messaging Detail section of the Metrics Management dashboard. When this collection group is enabled, this view is added to the Unified Messaging views on the Roles navigation tab in the Exchange Explorer dashboard.
NOTE: If Foglight for Active Directory® is not installed, the data in this view will not be displayed.
Table 20. AD Dependencies view
Description
This view displays the Active Directory processes which the selected Exchange server uses and indicates the current health of each of these Active Directory processes.
NOTE: Active Directory processes that are not being used by this Exchange server are disabled.
Data displayed LDAP. Indicates the health of LDAP performance.
Replication. Indicates the health of replication performance.
Database. Indicates the health of database performance.
Where to go next N/A
Table 21. Agent State view
DescriptionThis view displays the current state of the agent hosting the selected Exchange server.
Where to go next Drill down on:
• State icon. Displays a popup listing the current alarms.
• Agent Link (arrow). Displays the Agents on All Hosts dashboard which lists the agents that are available for each host. This dashboard also displays health history and the outstanding alarms for all monitored hosts and agents. For more information about this dashboard, see Investigating Problems with Agents in the Foglight User Help.
Table 22. Auto Attendant Calls view
DescriptionThis view displays call metrics for the Unified Messaging auto attendant on the selected Exchange server, which are gathered when the UM Auto Att Calls collection group is enabled.
Data displayedTotal Calls. This counter displays the number of calls that have been processed by the auto attendant.
Business Hour Calls. This counter displays the number of calls processed by the auto attendant during business hours.
Out of Hours Calls. This counter displays the number of calls processed by this auto attendant outside of business hours.
Foglight for Exchange 5.6.9User and Reference Guide
85
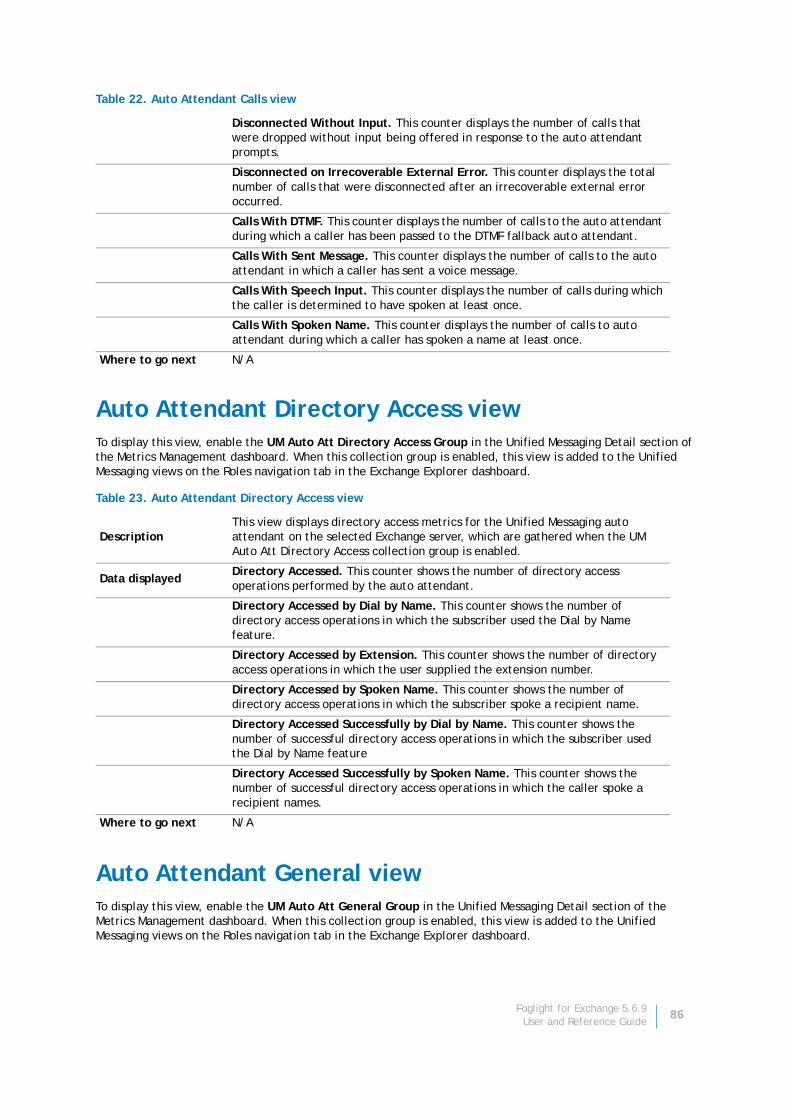
Auto Attendant Directory Access viewTo display this view, enable the UM Auto Att Directory Access Group in the Unified Messaging Detail section of the Metrics Management dashboard. When this collection group is enabled, this view is added to the Unified Messaging views on the Roles navigation tab in the Exchange Explorer dashboard.
Auto Attendant General viewTo display this view, enable the UM Auto Att General Group in the Unified Messaging Detail section of the Metrics Management dashboard. When this collection group is enabled, this view is added to the Unified Messaging views on the Roles navigation tab in the Exchange Explorer dashboard.
Disconnected Without Input. This counter displays the number of calls that were dropped without input being offered in response to the auto attendant prompts.
Disconnected on Irrecoverable External Error. This counter displays the total number of calls that were disconnected after an irrecoverable external error occurred.
Calls With DTMF. This counter displays the number of calls to the auto attendant during which a caller has been passed to the DTMF fallback auto attendant.
Calls With Sent Message. This counter displays the number of calls to the auto attendant in which a caller has sent a voice message.
Calls With Speech Input. This counter displays the number of calls during which the caller is determined to have spoken at least once.
Calls With Spoken Name. This counter displays the number of calls to auto attendant during which a caller has spoken a name at least once.
Where to go next N/A
Table 23. Auto Attendant Directory Access view
DescriptionThis view displays directory access metrics for the Unified Messaging auto attendant on the selected Exchange server, which are gathered when the UM Auto Att Directory Access collection group is enabled.
Data displayedDirectory Accessed. This counter shows the number of directory access operations performed by the auto attendant.
Directory Accessed by Dial by Name. This counter shows the number of directory access operations in which the subscriber used the Dial by Name feature.
Directory Accessed by Extension. This counter shows the number of directory access operations in which the user supplied the extension number.
Directory Accessed by Spoken Name. This counter shows the number of directory access operations in which the subscriber spoke a recipient name.
Directory Accessed Successfully by Dial by Name. This counter shows the number of successful directory access operations in which the subscriber used the Dial by Name feature
Directory Accessed Successfully by Spoken Name. This counter shows the number of successful directory access operations in which the caller spoke a recipient names.
Where to go next N/A
Table 22. Auto Attendant Calls view
Foglight for Exchange 5.6.9User and Reference Guide
86
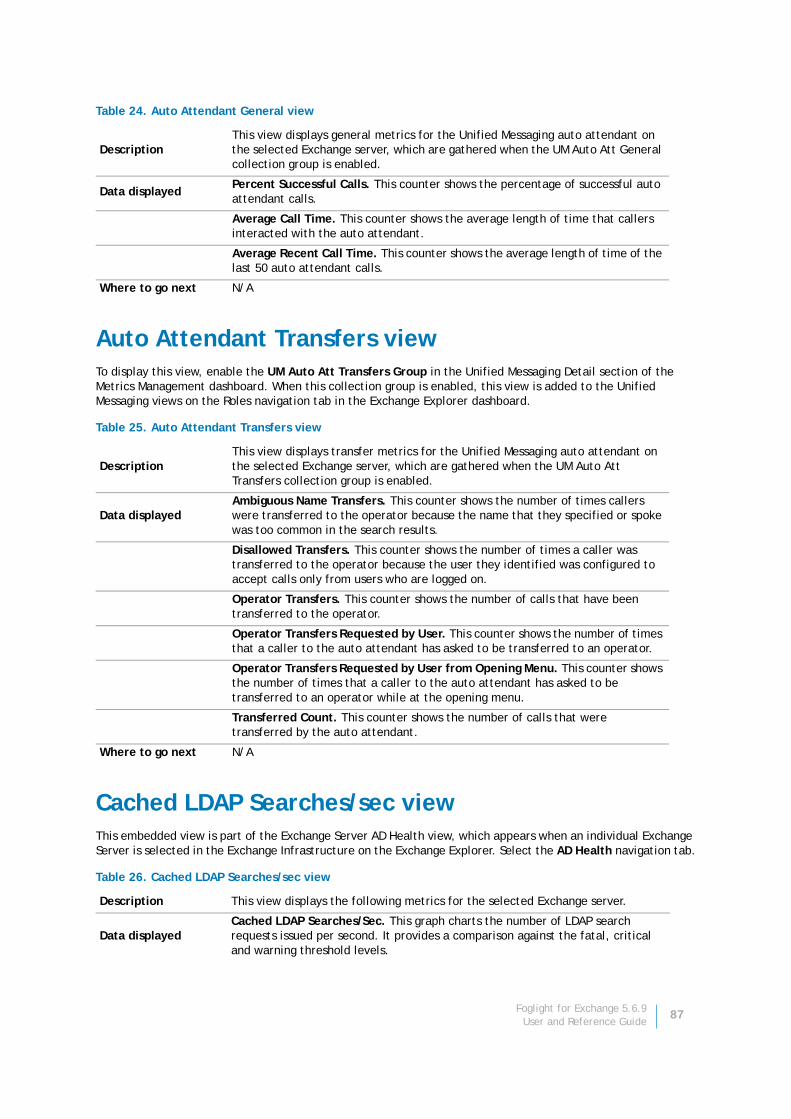
Auto Attendant Transfers viewTo display this view, enable the UM Auto Att Transfers Group in the Unified Messaging Detail section of the Metrics Management dashboard. When this collection group is enabled, this view is added to the Unified Messaging views on the Roles navigation tab in the Exchange Explorer dashboard.
Cached LDAP Searches/sec viewThis embedded view is part of the Exchange Server AD Health view, which appears when an individual Exchange Server is selected in the Exchange Infrastructure on the Exchange Explorer. Select the AD Health navigation tab.
Table 24. Auto Attendant General view
DescriptionThis view displays general metrics for the Unified Messaging auto attendant on the selected Exchange server, which are gathered when the UM Auto Att General collection group is enabled.
Data displayedPercent Successful Calls. This counter shows the percentage of successful auto attendant calls.
Average Call Time. This counter shows the average length of time that callers interacted with the auto attendant.
Average Recent Call Time. This counter shows the average length of time of the last 50 auto attendant calls.
Where to go next N/A
Table 25. Auto Attendant Transfers view
DescriptionThis view displays transfer metrics for the Unified Messaging auto attendant on the selected Exchange server, which are gathered when the UM Auto Att Transfers collection group is enabled.
Data displayedAmbiguous Name Transfers. This counter shows the number of times callers were transferred to the operator because the name that they specified or spoke was too common in the search results.
Disallowed Transfers. This counter shows the number of times a caller was transferred to the operator because the user they identified was configured to accept calls only from users who are logged on.
Operator Transfers. This counter shows the number of calls that have been transferred to the operator.
Operator Transfers Requested by User. This counter shows the number of times that a caller to the auto attendant has asked to be transferred to an operator.
Operator Transfers Requested by User from Opening Menu. This counter shows the number of times that a caller to the auto attendant has asked to be transferred to an operator while at the opening menu.
Transferred Count. This counter shows the number of calls that were transferred by the auto attendant.
Where to go next N/A
Table 26. Cached LDAP Searches/sec view
Description This view displays the following metrics for the selected Exchange server.
Data displayedCached LDAP Searches/Sec. This graph charts the number of LDAP search requests issued per second. It provides a comparison against the fatal, critical and warning threshold levels.
Foglight for Exchange 5.6.9User and Reference Guide
87

CAS AB Load viewTo display this view, enable the CAS AB Load Group in the Client Access Detail section of the Metrics Management dashboard. When this collection group is enabled, this view is added to the Client Access views on the Roles navigation tab in the Exchange Explorer dashboard.
CAS AB Service viewTo display this view, enable the CAS AB Service Group in the Client Access Detail section of the Metrics Management dashboard. When this collection group is enabled, this view is added to the Client Access views on the Roles navigation tab in the Exchange Explorer dashboard.
Where to go next Drill down on:
• Clicking the graph in this view displays a metrics popup that describes the counter, provides more detailed data points, and lists current alarms for the selected metric.
NOTE: This view is only available when an Exchange 2010 server is selected in the Exchange Infrastructure view.
Table 27. CAS AB Load view
DescriptionThis view displays CAS Address Book load metrics for the selected Exchange server, which are gathered when the CAS AB Load collection group is enabled.
Data displayedNSPI Connections Current. This graph charts the number of NSPI clients currently connected to the server. It provides a comparison against the computed average for the specified time interval.
Connections and Requests/sec. This graph charts the following metrics over the specified time interval:
• NSPI Connections/sec. Shows the number of NSPI client connections established to the server each second.
• NSPI RPC Requests/sec. Shows the rate at which NSPI requests occur each second.
• Referral RPC Requests/sec. Shows the rate at which referral requests occur each second.
Where to go next Drill down on:
• Clicking a graph in this view displays a metrics popup that describes the counters, provides more detailed data points, and lists current alarms for the selected metric.
NOTE: This view is only available when an Exchange 2010 server is selected in the Exchange Infrastructure view.
Table 26. Cached LDAP Searches/sec view
Foglight for Exchange 5.6.9User and Reference Guide
88
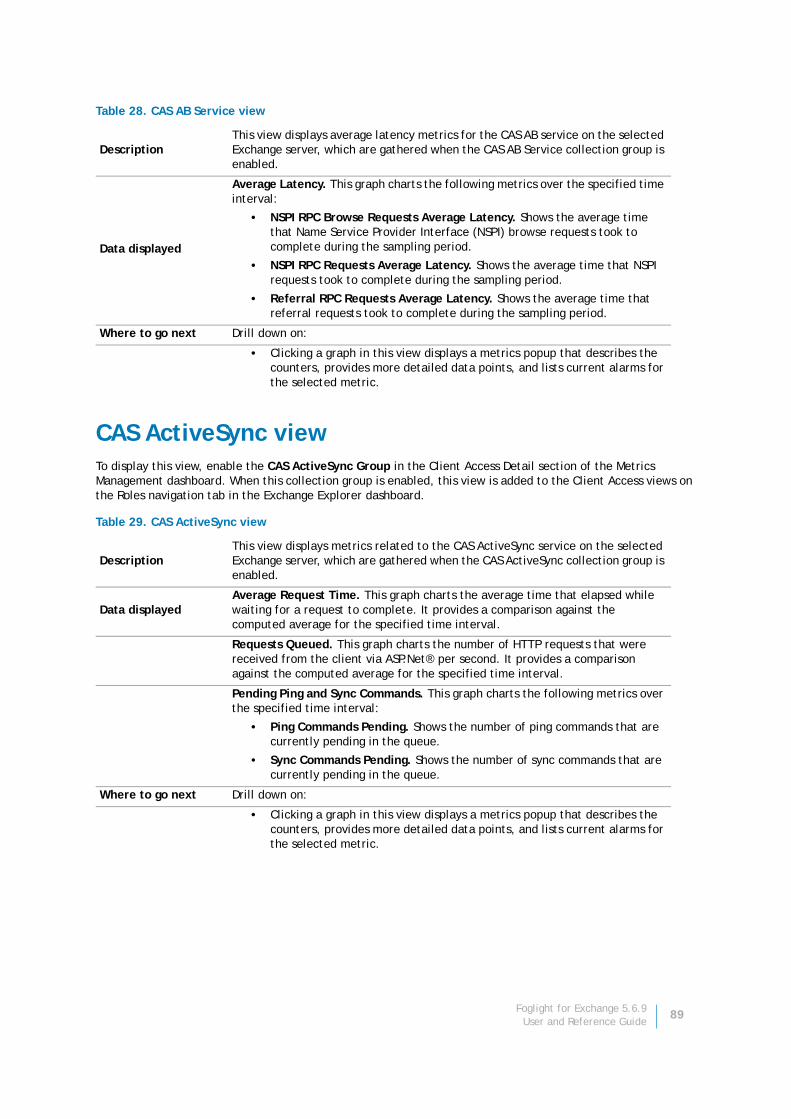
CAS ActiveSync viewTo display this view, enable the CAS ActiveSync Group in the Client Access Detail section of the Metrics Management dashboard. When this collection group is enabled, this view is added to the Client Access views on the Roles navigation tab in the Exchange Explorer dashboard.
Table 28. CAS AB Service view
DescriptionThis view displays average latency metrics for the CAS AB service on the selected Exchange server, which are gathered when the CAS AB Service collection group is enabled.
Data displayed
Average Latency. This graph charts the following metrics over the specified time interval:
• NSPI RPC Browse Requests Average Latency. Shows the average time that Name Service Provider Interface (NSPI) browse requests took to complete during the sampling period.
• NSPI RPC Requests Average Latency. Shows the average time that NSPI requests took to complete during the sampling period.
• Referral RPC Requests Average Latency. Shows the average time that referral requests took to complete during the sampling period.
Where to go next Drill down on:
• Clicking a graph in this view displays a metrics popup that describes the counters, provides more detailed data points, and lists current alarms for the selected metric.
Table 29. CAS ActiveSync view
DescriptionThis view displays metrics related to the CAS ActiveSync service on the selected Exchange server, which are gathered when the CAS ActiveSync collection group is enabled.
Data displayedAverage Request Time. This graph charts the average time that elapsed while waiting for a request to complete. It provides a comparison against the computed average for the specified time interval.
Requests Queued. This graph charts the number of HTTP requests that were received from the client via ASP.Net® per second. It provides a comparison against the computed average for the specified time interval.
Pending Ping and Sync Commands. This graph charts the following metrics over the specified time interval:
• Ping Commands Pending. Shows the number of ping commands that are currently pending in the queue.
• Sync Commands Pending. Shows the number of sync commands that are currently pending in the queue.
Where to go next Drill down on:
• Clicking a graph in this view displays a metrics popup that describes the counters, provides more detailed data points, and lists current alarms for the selected metric.
Foglight for Exchange 5.6.9User and Reference Guide
89
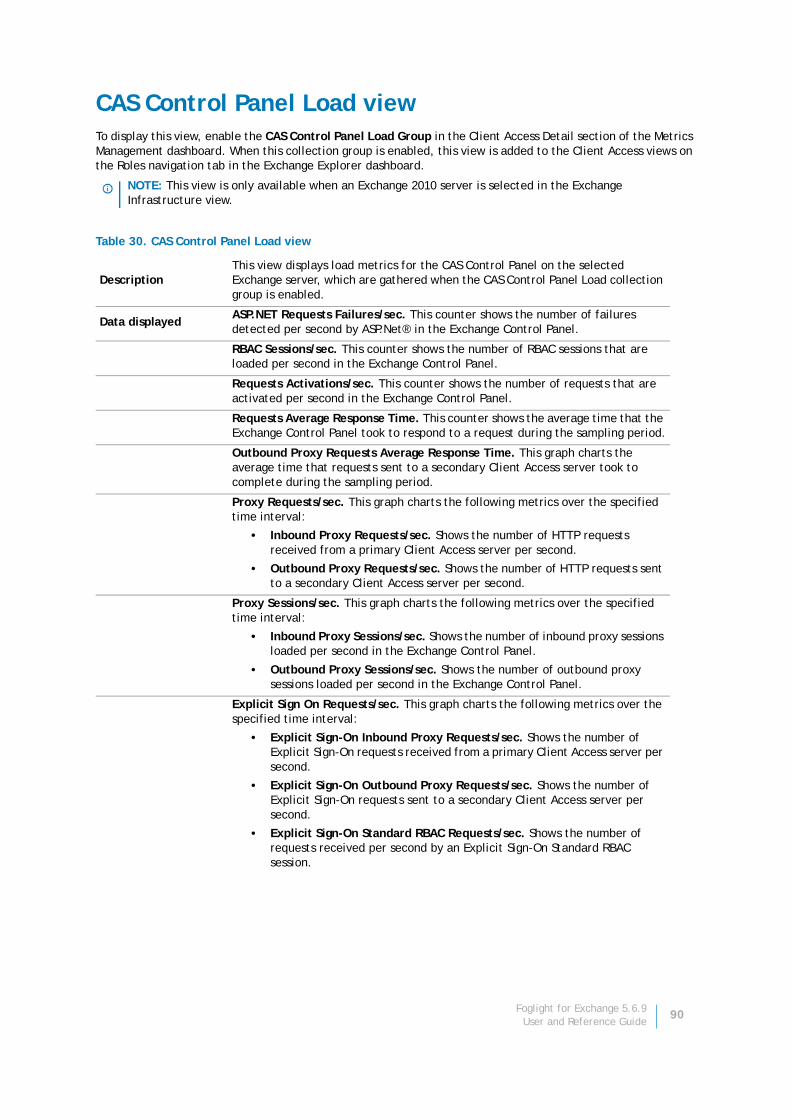
CAS Control Panel Load viewTo display this view, enable the CAS Control Panel Load Group in the Client Access Detail section of the Metrics Management dashboard. When this collection group is enabled, this view is added to the Client Access views on the Roles navigation tab in the Exchange Explorer dashboard.
NOTE: This view is only available when an Exchange 2010 server is selected in the Exchange Infrastructure view.
Table 30. CAS Control Panel Load view
DescriptionThis view displays load metrics for the CAS Control Panel on the selected Exchange server, which are gathered when the CAS Control Panel Load collection group is enabled.
Data displayedASP.NET Requests Failures/sec. This counter shows the number of failures detected per second by ASP.Net® in the Exchange Control Panel.
RBAC Sessions/sec. This counter shows the number of RBAC sessions that are loaded per second in the Exchange Control Panel.
Requests Activations/sec. This counter shows the number of requests that are activated per second in the Exchange Control Panel.
Requests Average Response Time. This counter shows the average time that the Exchange Control Panel took to respond to a request during the sampling period.
Outbound Proxy Requests Average Response Time. This graph charts the average time that requests sent to a secondary Client Access server took to complete during the sampling period.
Proxy Requests/sec. This graph charts the following metrics over the specified time interval:
• Inbound Proxy Requests/sec. Shows the number of HTTP requests received from a primary Client Access server per second.
• Outbound Proxy Requests/sec. Shows the number of HTTP requests sent to a secondary Client Access server per second.
Proxy Sessions/sec. This graph charts the following metrics over the specified time interval:
• Inbound Proxy Sessions/sec. Shows the number of inbound proxy sessions loaded per second in the Exchange Control Panel.
• Outbound Proxy Sessions/sec. Shows the number of outbound proxy sessions loaded per second in the Exchange Control Panel.
Explicit Sign On Requests/sec. This graph charts the following metrics over the specified time interval:
• Explicit Sign-On Inbound Proxy Requests/sec. Shows the number of Explicit Sign-On requests received from a primary Client Access server per second.
• Explicit Sign-On Outbound Proxy Requests/sec. Shows the number of Explicit Sign-On requests sent to a secondary Client Access server per second.
• Explicit Sign-On Standard RBAC Requests/sec. Shows the number of requests received per second by an Explicit Sign-On Standard RBAC session.
Foglight for Exchange 5.6.9User and Reference Guide
90
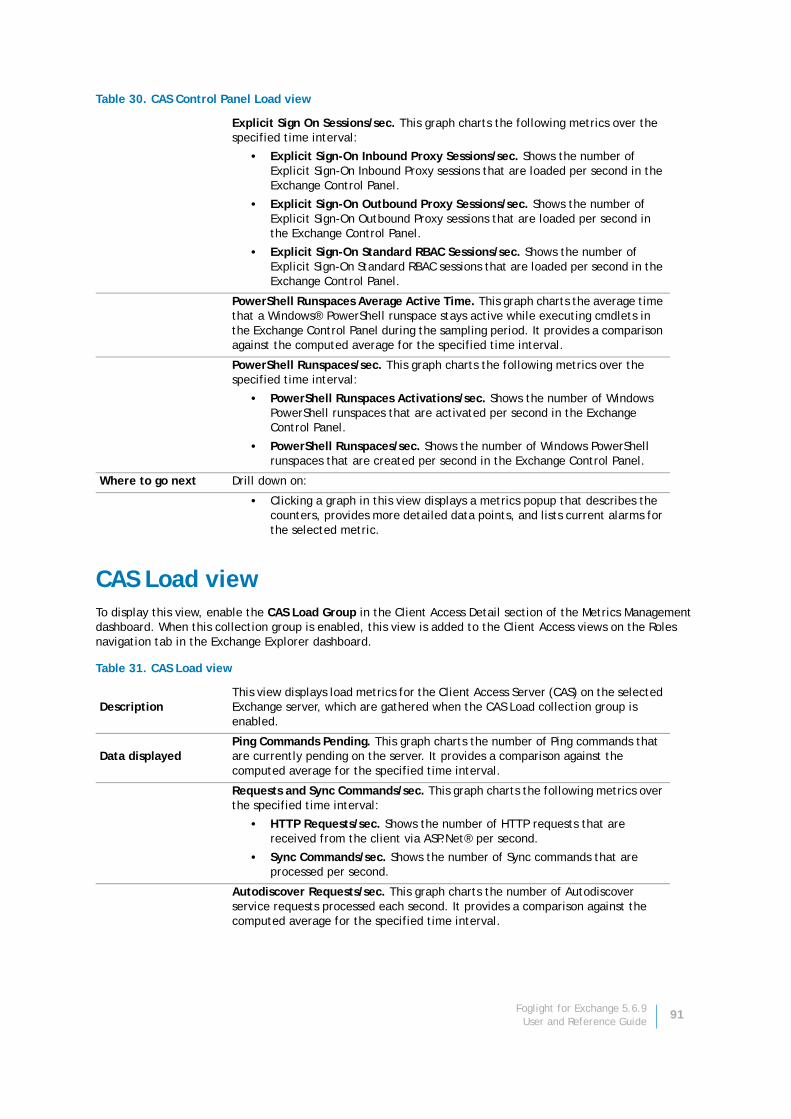
CAS Load viewTo display this view, enable the CAS Load Group in the Client Access Detail section of the Metrics Management dashboard. When this collection group is enabled, this view is added to the Client Access views on the Roles navigation tab in the Exchange Explorer dashboard.
Explicit Sign On Sessions/sec. This graph charts the following metrics over the specified time interval:
• Explicit Sign-On Inbound Proxy Sessions/sec. Shows the number of Explicit Sign-On Inbound Proxy sessions that are loaded per second in the Exchange Control Panel.
• Explicit Sign-On Outbound Proxy Sessions/sec. Shows the number of Explicit Sign-On Outbound Proxy sessions that are loaded per second in the Exchange Control Panel.
• Explicit Sign-On Standard RBAC Sessions/sec. Shows the number of Explicit Sign-On Standard RBAC sessions that are loaded per second in the Exchange Control Panel.
PowerShell Runspaces Average Active Time. This graph charts the average time that a Windows® PowerShell runspace stays active while executing cmdlets in the Exchange Control Panel during the sampling period. It provides a comparison against the computed average for the specified time interval.
PowerShell Runspaces/sec. This graph charts the following metrics over the specified time interval:
• PowerShell Runspaces Activations/sec. Shows the number of Windows PowerShell runspaces that are activated per second in the Exchange Control Panel.
• PowerShell Runspaces/sec. Shows the number of Windows PowerShell runspaces that are created per second in the Exchange Control Panel.
Where to go next Drill down on:
• Clicking a graph in this view displays a metrics popup that describes the counters, provides more detailed data points, and lists current alarms for the selected metric.
Table 31. CAS Load view
DescriptionThis view displays load metrics for the Client Access Server (CAS) on the selected Exchange server, which are gathered when the CAS Load collection group is enabled.
Data displayedPing Commands Pending. This graph charts the number of Ping commands that are currently pending on the server. It provides a comparison against the computed average for the specified time interval.
Requests and Sync Commands/sec. This graph charts the following metrics over the specified time interval:
• HTTP Requests/sec. Shows the number of HTTP requests that are received from the client via ASP.Net® per second.
• Sync Commands/sec. Shows the number of Sync commands that are processed per second.
Autodiscover Requests/sec. This graph charts the number of Autodiscover service requests processed each second. It provides a comparison against the computed average for the specified time interval.
Table 30. CAS Control Panel Load view
Foglight for Exchange 5.6.9User and Reference Guide
91
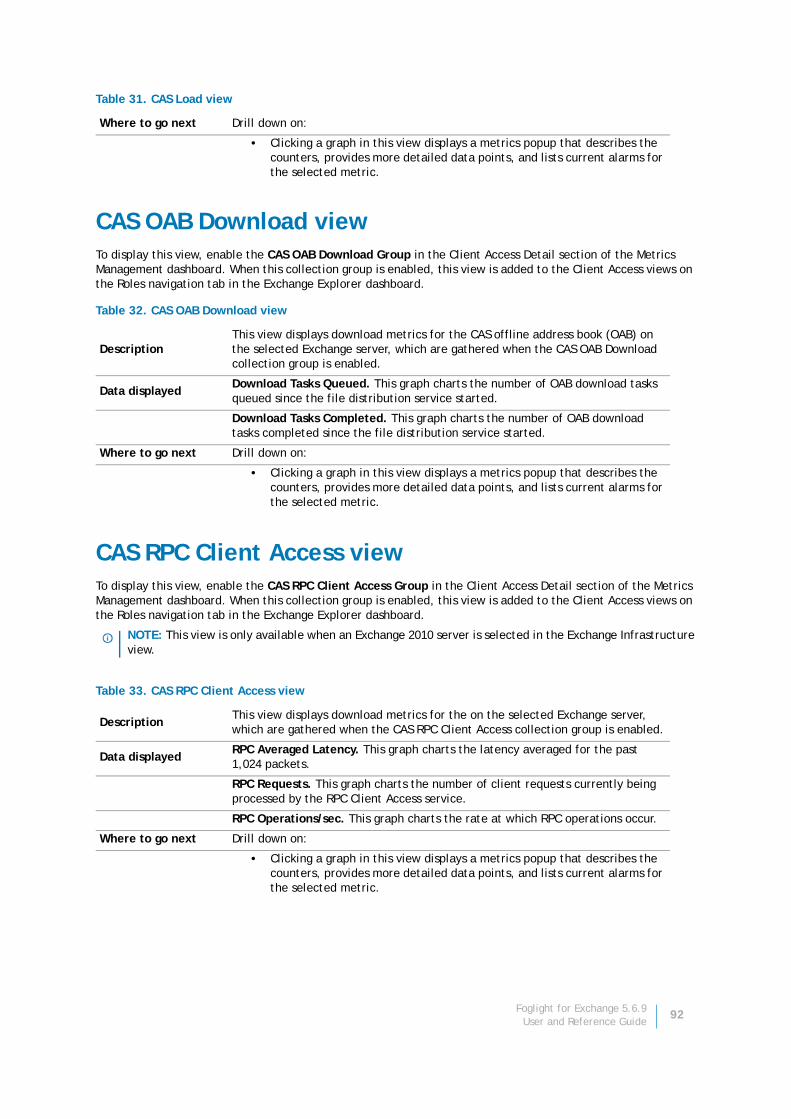
CAS OAB Download viewTo display this view, enable the CAS OAB Download Group in the Client Access Detail section of the Metrics Management dashboard. When this collection group is enabled, this view is added to the Client Access views on the Roles navigation tab in the Exchange Explorer dashboard.
CAS RPC Client Access viewTo display this view, enable the CAS RPC Client Access Group in the Client Access Detail section of the Metrics Management dashboard. When this collection group is enabled, this view is added to the Client Access views on the Roles navigation tab in the Exchange Explorer dashboard.
Where to go next Drill down on:
• Clicking a graph in this view displays a metrics popup that describes the counters, provides more detailed data points, and lists current alarms for the selected metric.
Table 32. CAS OAB Download view
DescriptionThis view displays download metrics for the CAS offline address book (OAB) on the selected Exchange server, which are gathered when the CAS OAB Download collection group is enabled.
Data displayedDownload Tasks Queued. This graph charts the number of OAB download tasks queued since the file distribution service started.
Download Tasks Completed. This graph charts the number of OAB download tasks completed since the file distribution service started.
Where to go next Drill down on:
• Clicking a graph in this view displays a metrics popup that describes the counters, provides more detailed data points, and lists current alarms for the selected metric.
NOTE: This view is only available when an Exchange 2010 server is selected in the Exchange Infrastructure view.
Table 33. CAS RPC Client Access view
DescriptionThis view displays download metrics for the on the selected Exchange server, which are gathered when the CAS RPC Client Access collection group is enabled.
Data displayedRPC Averaged Latency. This graph charts the latency averaged for the past 1,024 packets.
RPC Requests. This graph charts the number of client requests currently being processed by the RPC Client Access service.
RPC Operations/sec. This graph charts the rate at which RPC operations occur.
Where to go next Drill down on:
• Clicking a graph in this view displays a metrics popup that describes the counters, provides more detailed data points, and lists current alarms for the selected metric.
Table 31. CAS Load view
Foglight for Exchange 5.6.9User and Reference Guide
92
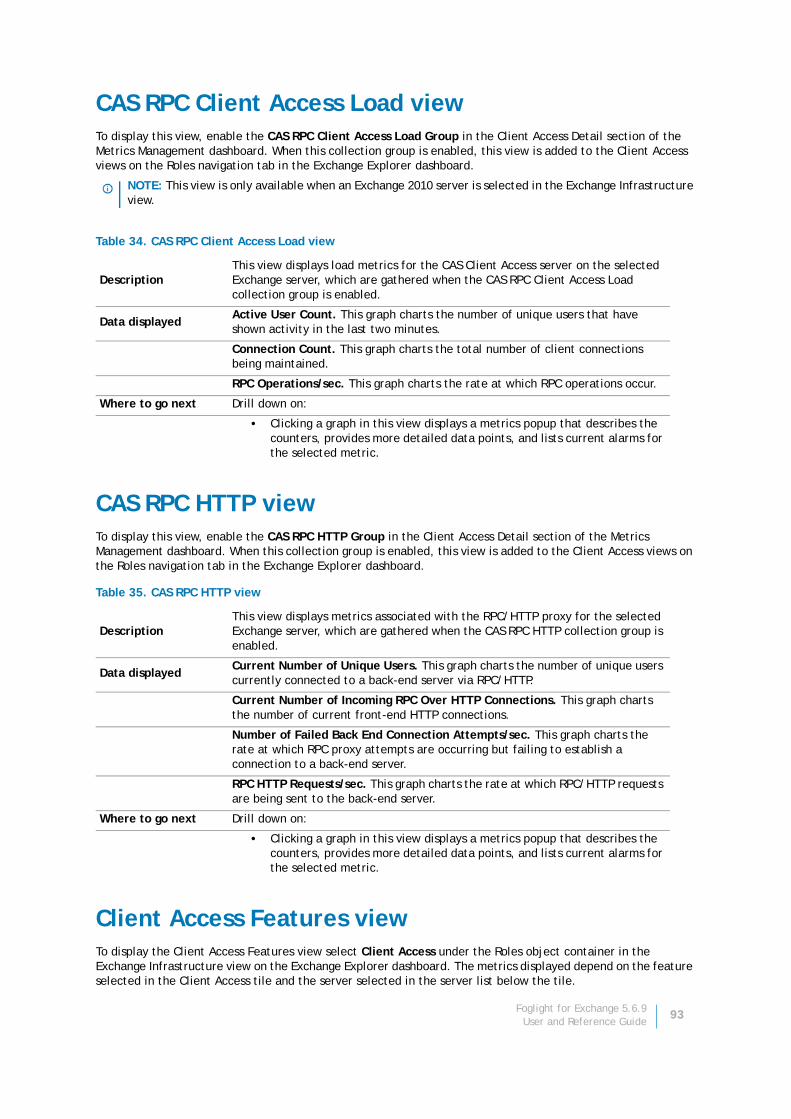
CAS RPC Client Access Load viewTo display this view, enable the CAS RPC Client Access Load Group in the Client Access Detail section of the Metrics Management dashboard. When this collection group is enabled, this view is added to the Client Access views on the Roles navigation tab in the Exchange Explorer dashboard.
CAS RPC HTTP viewTo display this view, enable the CAS RPC HTTP Group in the Client Access Detail section of the Metrics Management dashboard. When this collection group is enabled, this view is added to the Client Access views on the Roles navigation tab in the Exchange Explorer dashboard.
Client Access Features viewTo display the Client Access Features view select Client Access under the Roles object container in the Exchange Infrastructure view on the Exchange Explorer dashboard. The metrics displayed depend on the feature selected in the Client Access tile and the server selected in the server list below the tile.
NOTE: This view is only available when an Exchange 2010 server is selected in the Exchange Infrastructure view.
Table 34. CAS RPC Client Access Load view
DescriptionThis view displays load metrics for the CAS Client Access server on the selected Exchange server, which are gathered when the CAS RPC Client Access Load collection group is enabled.
Data displayedActive User Count. This graph charts the number of unique users that have shown activity in the last two minutes.
Connection Count. This graph charts the total number of client connections being maintained.
RPC Operations/sec. This graph charts the rate at which RPC operations occur.
Where to go next Drill down on:
• Clicking a graph in this view displays a metrics popup that describes the counters, provides more detailed data points, and lists current alarms for the selected metric.
Table 35. CAS RPC HTTP view
DescriptionThis view displays metrics associated with the RPC/HTTP proxy for the selected Exchange server, which are gathered when the CAS RPC HTTP collection group is enabled.
Data displayedCurrent Number of Unique Users. This graph charts the number of unique users currently connected to a back-end server via RPC/HTTP.
Current Number of Incoming RPC Over HTTP Connections. This graph charts the number of current front-end HTTP connections.
Number of Failed Back End Connection Attempts/sec. This graph charts the rate at which RPC proxy attempts are occurring but failing to establish a connection to a back-end server.
RPC HTTP Requests/sec. This graph charts the rate at which RPC/HTTP requests are being sent to the back-end server.
Where to go next Drill down on:
• Clicking a graph in this view displays a metrics popup that describes the counters, provides more detailed data points, and lists current alarms for the selected metric.
Foglight for Exchange 5.6.9User and Reference Guide
93
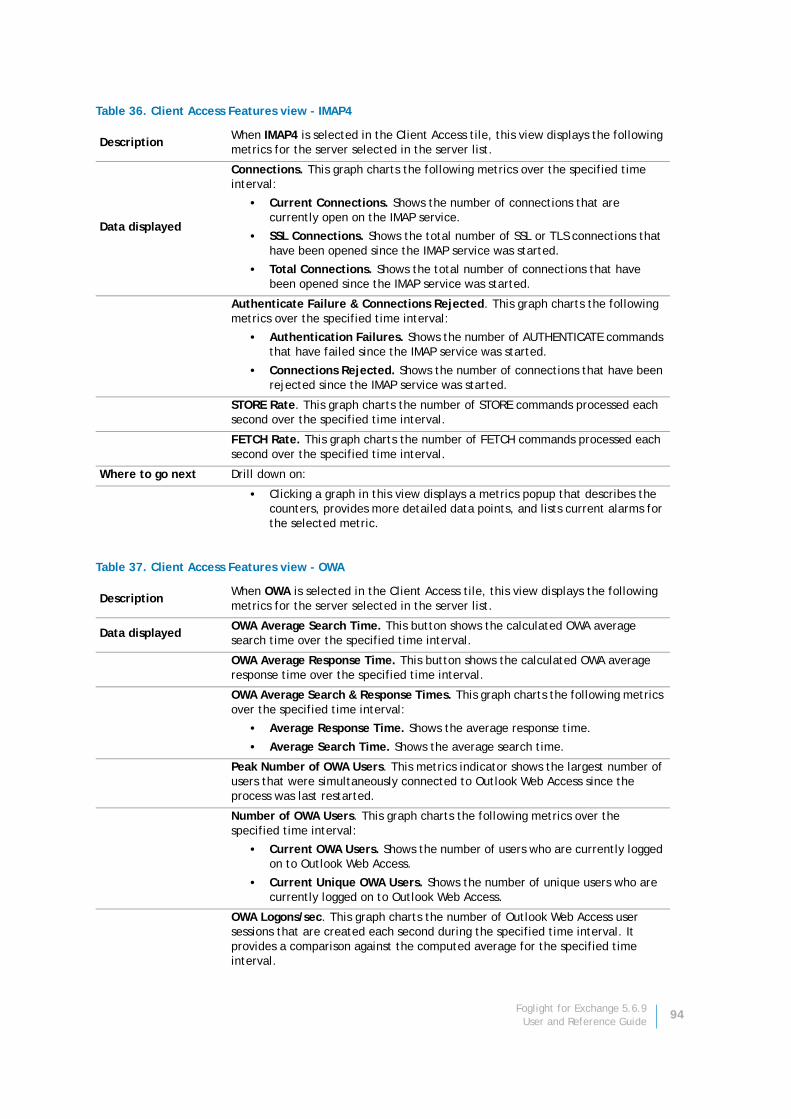
Table 36. Client Access Features view - IMAP4
DescriptionWhen IMAP4 is selected in the Client Access tile, this view displays the following metrics for the server selected in the server list.
Data displayed
Connections. This graph charts the following metrics over the specified time interval:
• Current Connections. Shows the number of connections that are currently open on the IMAP service.
• SSL Connections. Shows the total number of SSL or TLS connections that have been opened since the IMAP service was started.
• Total Connections. Shows the total number of connections that have been opened since the IMAP service was started.
Authenticate Failure & Connections Rejected. This graph charts the following metrics over the specified time interval:
• Authentication Failures. Shows the number of AUTHENTICATE commands that have failed since the IMAP service was started.
• Connections Rejected. Shows the number of connections that have been rejected since the IMAP service was started.
STORE Rate. This graph charts the number of STORE commands processed each second over the specified time interval.
FETCH Rate. This graph charts the number of FETCH commands processed each second over the specified time interval.
Where to go next Drill down on:
• Clicking a graph in this view displays a metrics popup that describes the counters, provides more detailed data points, and lists current alarms for the selected metric.
Table 37. Client Access Features view - OWA
DescriptionWhen OWA is selected in the Client Access tile, this view displays the following metrics for the server selected in the server list.
Data displayedOWA Average Search Time. This button shows the calculated OWA average search time over the specified time interval.
OWA Average Response Time. This button shows the calculated OWA average response time over the specified time interval.
OWA Average Search & Response Times. This graph charts the following metrics over the specified time interval:
• Average Response Time. Shows the average response time.
• Average Search Time. Shows the average search time.
Peak Number of OWA Users. This metrics indicator shows the largest number of users that were simultaneously connected to Outlook Web Access since the process was last restarted.
Number of OWA Users. This graph charts the following metrics over the specified time interval:
• Current OWA Users. Shows the number of users who are currently logged on to Outlook Web Access.
• Current Unique OWA Users. Shows the number of unique users who are currently logged on to Outlook Web Access.
OWA Logons/sec. This graph charts the number of Outlook Web Access user sessions that are created each second during the specified time interval. It provides a comparison against the computed average for the specified time interval.
Foglight for Exchange 5.6.9User and Reference Guide
94
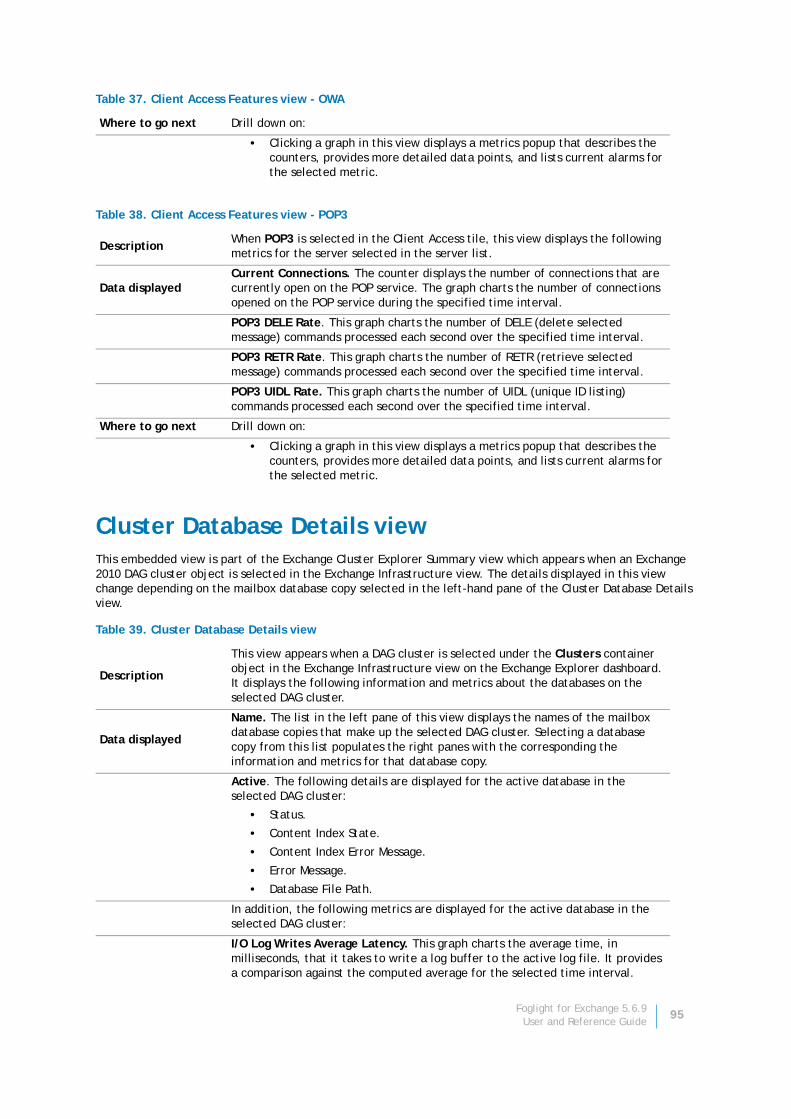
Cluster Database Details viewThis embedded view is part of the Exchange Cluster Explorer Summary view which appears when an Exchange 2010 DAG cluster object is selected in the Exchange Infrastructure view. The details displayed in this view change depending on the mailbox database copy selected in the left-hand pane of the Cluster Database Details view.
Where to go next Drill down on:
• Clicking a graph in this view displays a metrics popup that describes the counters, provides more detailed data points, and lists current alarms for the selected metric.
Table 38. Client Access Features view - POP3
DescriptionWhen POP3 is selected in the Client Access tile, this view displays the following metrics for the server selected in the server list.
Data displayedCurrent Connections. The counter displays the number of connections that are currently open on the POP service. The graph charts the number of connections opened on the POP service during the specified time interval.
POP3 DELE Rate. This graph charts the number of DELE (delete selected message) commands processed each second over the specified time interval.
POP3 RETR Rate. This graph charts the number of RETR (retrieve selected message) commands processed each second over the specified time interval.
POP3 UIDL Rate. This graph charts the number of UIDL (unique ID listing) commands processed each second over the specified time interval.
Where to go next Drill down on:
• Clicking a graph in this view displays a metrics popup that describes the counters, provides more detailed data points, and lists current alarms for the selected metric.
Table 39. Cluster Database Details view
Description
This view appears when a DAG cluster is selected under the Clusters container object in the Exchange Infrastructure view on the Exchange Explorer dashboard. It displays the following information and metrics about the databases on the selected DAG cluster.
Data displayed
Name. The list in the left pane of this view displays the names of the mailbox database copies that make up the selected DAG cluster. Selecting a database copy from this list populates the right panes with the corresponding the information and metrics for that database copy.
Active. The following details are displayed for the active database in the selected DAG cluster:
• Status.
• Content Index State.
• Content Index Error Message.
• Error Message.
• Database File Path.
In addition, the following metrics are displayed for the active database in the selected DAG cluster:
I/O Log Writes Average Latency. This graph charts the average time, in milliseconds, that it takes to write a log buffer to the active log file. It provides a comparison against the computed average for the selected time interval.
Table 37. Client Access Features view - OWA
Foglight for Exchange 5.6.9User and Reference Guide
95
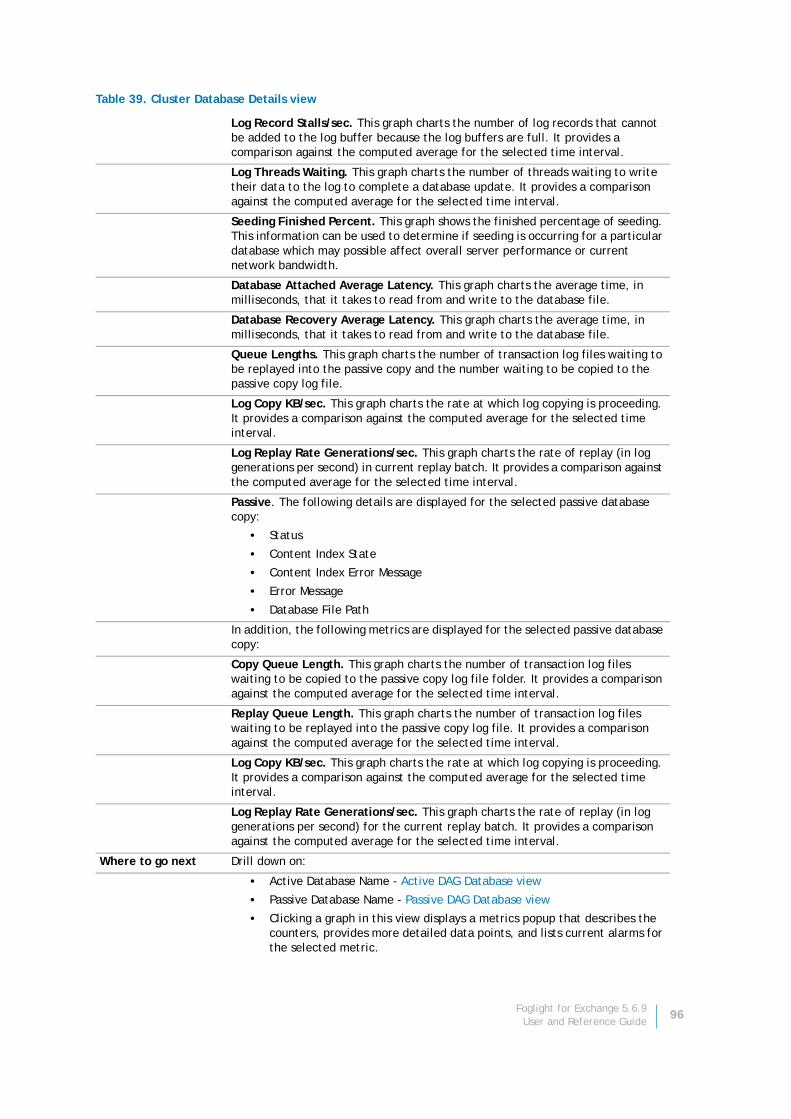
Log Record Stalls/sec. This graph charts the number of log records that cannot be added to the log buffer because the log buffers are full. It provides a comparison against the computed average for the selected time interval.
Log Threads Waiting. This graph charts the number of threads waiting to write their data to the log to complete a database update. It provides a comparison against the computed average for the selected time interval.
Seeding Finished Percent. This graph shows the finished percentage of seeding. This information can be used to determine if seeding is occurring for a particular database which may possible affect overall server performance or current network bandwidth.
Database Attached Average Latency. This graph charts the average time, in milliseconds, that it takes to read from and write to the database file.
Database Recovery Average Latency. This graph charts the average time, in milliseconds, that it takes to read from and write to the database file.
Queue Lengths. This graph charts the number of transaction log files waiting to be replayed into the passive copy and the number waiting to be copied to the passive copy log file.
Log Copy KB/sec. This graph charts the rate at which log copying is proceeding. It provides a comparison against the computed average for the selected time interval.
Log Replay Rate Generations/sec. This graph charts the rate of replay (in log generations per second) in current replay batch. It provides a comparison against the computed average for the selected time interval.
Passive. The following details are displayed for the selected passive database copy:
• Status
• Content Index State
• Content Index Error Message
• Error Message
• Database File Path
In addition, the following metrics are displayed for the selected passive database copy:
Copy Queue Length. This graph charts the number of transaction log files waiting to be copied to the passive copy log file folder. It provides a comparison against the computed average for the selected time interval.
Replay Queue Length. This graph charts the number of transaction log files waiting to be replayed into the passive copy log file. It provides a comparison against the computed average for the selected time interval.
Log Copy KB/sec. This graph charts the rate at which log copying is proceeding. It provides a comparison against the computed average for the selected time interval.
Log Replay Rate Generations/sec. This graph charts the rate of replay (in log generations per second) for the current replay batch. It provides a comparison against the computed average for the selected time interval.
Where to go next Drill down on:
• Active Database Name - Active DAG Database view
• Passive Database Name - Passive DAG Database view
• Clicking a graph in this view displays a metrics popup that describes the counters, provides more detailed data points, and lists current alarms for the selected metric.
Table 39. Cluster Database Details view
Foglight for Exchange 5.6.9User and Reference Guide
96
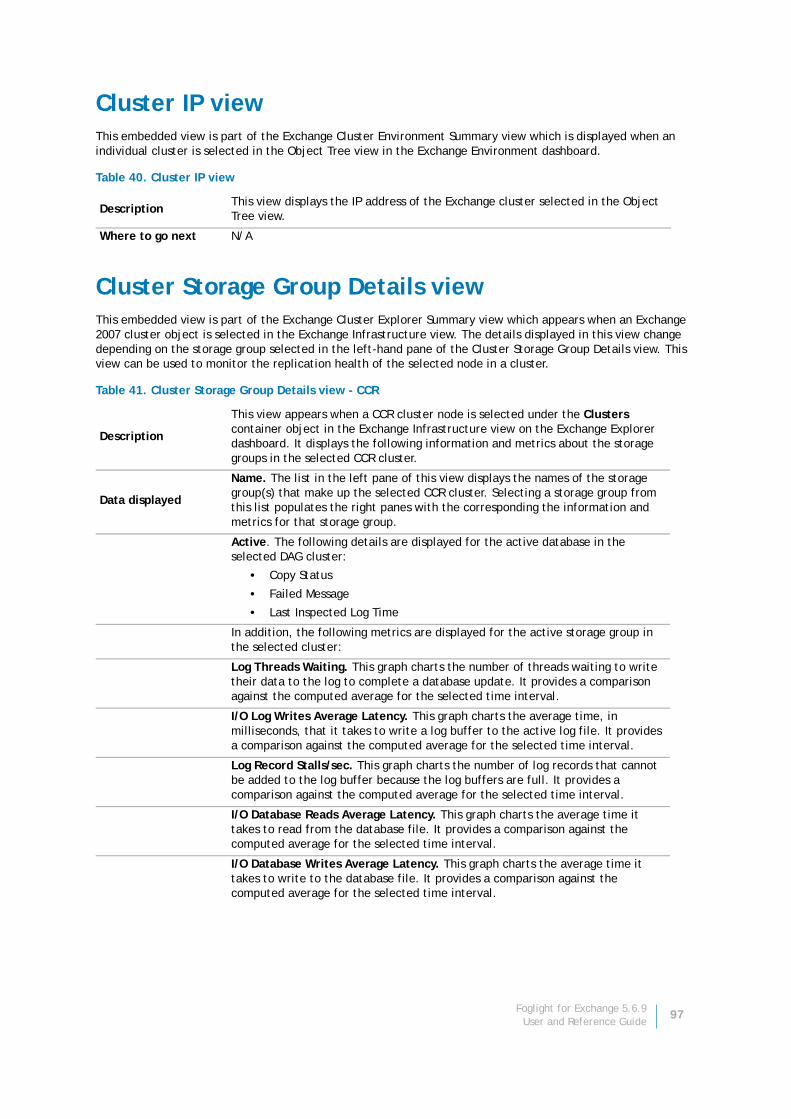
Cluster IP viewThis embedded view is part of the Exchange Cluster Environment Summary view which is displayed when an individual cluster is selected in the Object Tree view in the Exchange Environment dashboard.
Cluster Storage Group Details viewThis embedded view is part of the Exchange Cluster Explorer Summary view which appears when an Exchange 2007 cluster object is selected in the Exchange Infrastructure view. The details displayed in this view change depending on the storage group selected in the left-hand pane of the Cluster Storage Group Details view. This view can be used to monitor the replication health of the selected node in a cluster.
Table 40. Cluster IP view
DescriptionThis view displays the IP address of the Exchange cluster selected in the Object Tree view.
Where to go next N/A
Table 41. Cluster Storage Group Details view - CCR
Description
This view appears when a CCR cluster node is selected under the Clusters container object in the Exchange Infrastructure view on the Exchange Explorer dashboard. It displays the following information and metrics about the storage groups in the selected CCR cluster.
Data displayed
Name. The list in the left pane of this view displays the names of the storage group(s) that make up the selected CCR cluster. Selecting a storage group from this list populates the right panes with the corresponding the information and metrics for that storage group.
Active. The following details are displayed for the active database in the selected DAG cluster:
• Copy Status
• Failed Message
• Last Inspected Log Time
In addition, the following metrics are displayed for the active storage group in the selected cluster:
Log Threads Waiting. This graph charts the number of threads waiting to write their data to the log to complete a database update. It provides a comparison against the computed average for the selected time interval.
I/O Log Writes Average Latency. This graph charts the average time, in milliseconds, that it takes to write a log buffer to the active log file. It provides a comparison against the computed average for the selected time interval.
Log Record Stalls/sec. This graph charts the number of log records that cannot be added to the log buffer because the log buffers are full. It provides a comparison against the computed average for the selected time interval.
I/O Database Reads Average Latency. This graph charts the average time it takes to read from the database file. It provides a comparison against the computed average for the selected time interval.
I/O Database Writes Average Latency. This graph charts the average time it takes to write to the database file. It provides a comparison against the computed average for the selected time interval.
Foglight for Exchange 5.6.9User and Reference Guide
97
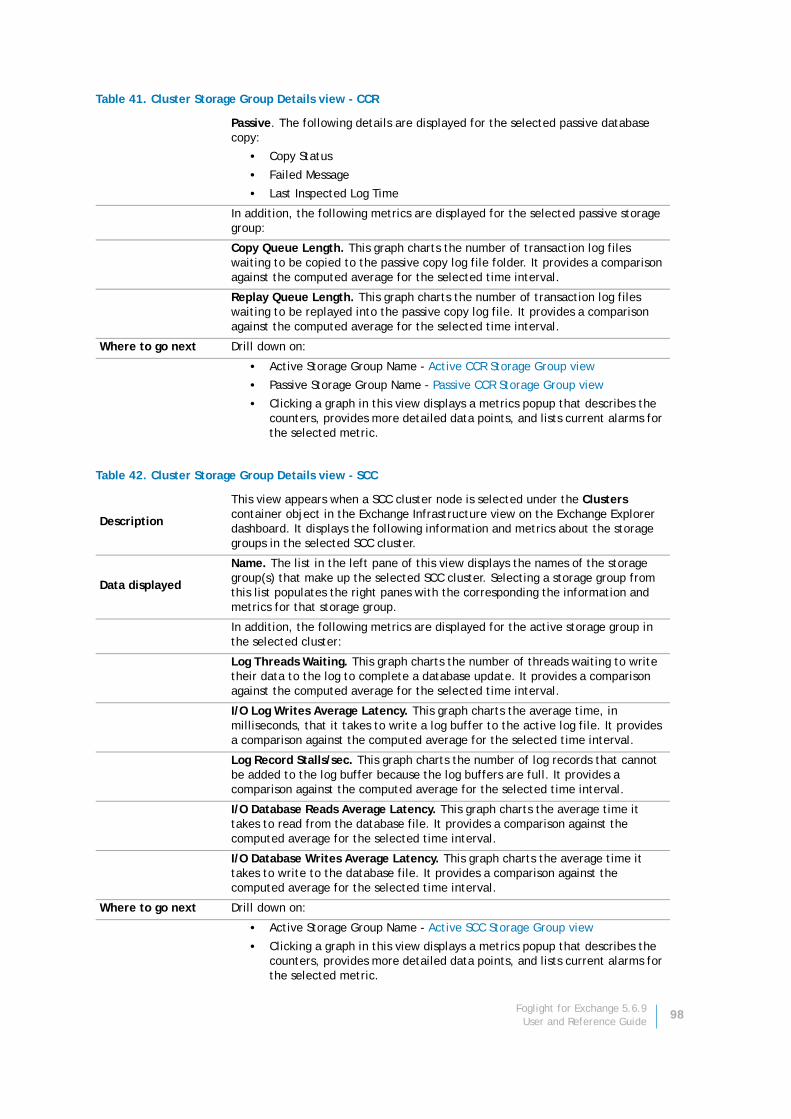
Passive. The following details are displayed for the selected passive database copy:
• Copy Status
• Failed Message
• Last Inspected Log Time
In addition, the following metrics are displayed for the selected passive storage group:
Copy Queue Length. This graph charts the number of transaction log files waiting to be copied to the passive copy log file folder. It provides a comparison against the computed average for the selected time interval.
Replay Queue Length. This graph charts the number of transaction log files waiting to be replayed into the passive copy log file. It provides a comparison against the computed average for the selected time interval.
Where to go next Drill down on:
• Active Storage Group Name - Active CCR Storage Group view
• Passive Storage Group Name - Passive CCR Storage Group view
• Clicking a graph in this view displays a metrics popup that describes the counters, provides more detailed data points, and lists current alarms for the selected metric.
Table 42. Cluster Storage Group Details view - SCC
Description
This view appears when a SCC cluster node is selected under the Clusters container object in the Exchange Infrastructure view on the Exchange Explorer dashboard. It displays the following information and metrics about the storage groups in the selected SCC cluster.
Data displayed
Name. The list in the left pane of this view displays the names of the storage group(s) that make up the selected SCC cluster. Selecting a storage group from this list populates the right panes with the corresponding the information and metrics for that storage group.
In addition, the following metrics are displayed for the active storage group in the selected cluster:
Log Threads Waiting. This graph charts the number of threads waiting to write their data to the log to complete a database update. It provides a comparison against the computed average for the selected time interval.
I/O Log Writes Average Latency. This graph charts the average time, in milliseconds, that it takes to write a log buffer to the active log file. It provides a comparison against the computed average for the selected time interval.
Log Record Stalls/sec. This graph charts the number of log records that cannot be added to the log buffer because the log buffers are full. It provides a comparison against the computed average for the selected time interval.
I/O Database Reads Average Latency. This graph charts the average time it takes to read from the database file. It provides a comparison against the computed average for the selected time interval.
I/O Database Writes Average Latency. This graph charts the average time it takes to write to the database file. It provides a comparison against the computed average for the selected time interval.
Where to go next Drill down on:
• Active Storage Group Name - Active SCC Storage Group view
• Clicking a graph in this view displays a metrics popup that describes the counters, provides more detailed data points, and lists current alarms for the selected metric.
Table 41. Cluster Storage Group Details view - CCR
Foglight for Exchange 5.6.9User and Reference Guide
98

Cluster Summary and Resource Information viewThis embedded view is part of the Exchange Cluster Explorer Summary view which is displayed when an individual cluster is selected in the Exchange Infrastructure view in the Exchange Explorer dashboard.
Cluster Summary viewThis view appears to the right of the Quick View on the Exchange Cluster Environment Summary view when an individual cluster is selected in the Object Tree view. This view either displays information and metrics for the database copies or the storage groups that make up the selected cluster.
Table 43. Cluster Summary and Resource Information view
DescriptionThis view displays the following information for cluster selected in the Object Tree view.
Windows Cluster. Displays the name of the selected Windows® cluster.
IP Address. Displays the IP address of the selected Windows cluster.
File Share Witness. Displays the path and name of the file share hosting the file share witness. (Applies to DAG and CCR clusters only.)
Where to go next N/A
Table 44. Cluster Summary view - Databases
Description
This view appears when an Exchange 2010 DAG cluster is selected in the Object Tree view on the Exchange Environment dashboard. It displays the following information and metrics about the mailbox database copies in the selected DAG cluster.
Data displayed
Name. The list in the left pane of this view displays the names of the mailbox database copies that make up the selected DAG cluster. Selecting a database from this list populates the right panes with the corresponding database information and metrics.
Active. The following details are displayed for the active database copy:
• Status
• Error Message
In addition, the following metrics are displayed for the active database copy:
Copy and Replay Queue Lengths. This graph charts the number of transaction log files in the copy queue and replay queue. It provides a comparison of the following counters:
• Copy Queue Length. Shows the number of transaction log files waiting to be copied tot he passive copy log file folder.
• Replay Queue Length. Shows the number of transaction log files waiting to be replayed into the passive copy.
Database Attached Average Latency. This graph charts the average time, in milliseconds, that it takes to read from and write to the database file. It provides a comparison of the following counters:
• I/O Database Reads (Attached) Average Latency. Shows the average time it takes to read from the database file.
• I/O Database Writes (Attached) Average Latency. Shows the average time it takes to write to the database file.
Passive. The following details are displayed for the passive database copy:
• Status
• Error Message
Foglight for Exchange 5.6.9User and Reference Guide
99
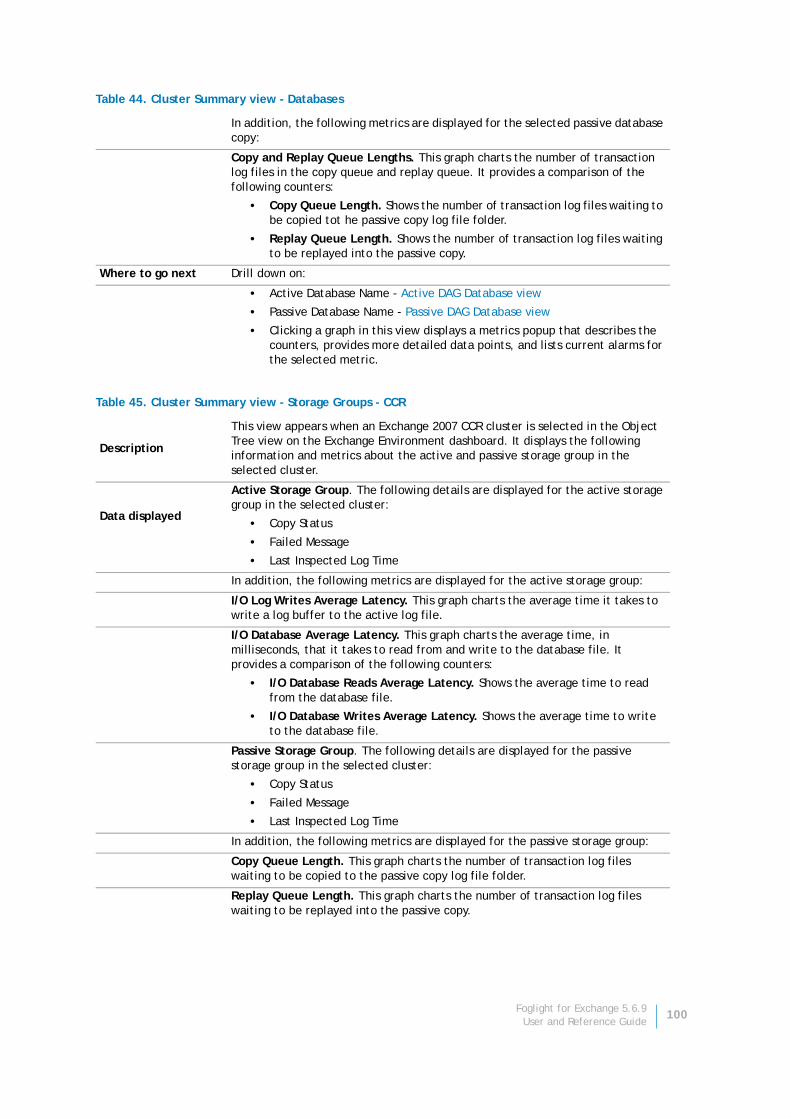
In addition, the following metrics are displayed for the selected passive database copy:
Copy and Replay Queue Lengths. This graph charts the number of transaction log files in the copy queue and replay queue. It provides a comparison of the following counters:
• Copy Queue Length. Shows the number of transaction log files waiting to be copied tot he passive copy log file folder.
• Replay Queue Length. Shows the number of transaction log files waiting to be replayed into the passive copy.
Where to go next Drill down on:
• Active Database Name - Active DAG Database view
• Passive Database Name - Passive DAG Database view
• Clicking a graph in this view displays a metrics popup that describes the counters, provides more detailed data points, and lists current alarms for the selected metric.
Table 45. Cluster Summary view - Storage Groups - CCR
Description
This view appears when an Exchange 2007 CCR cluster is selected in the Object Tree view on the Exchange Environment dashboard. It displays the following information and metrics about the active and passive storage group in the selected cluster.
Data displayed
Active Storage Group. The following details are displayed for the active storage group in the selected cluster:
• Copy Status
• Failed Message
• Last Inspected Log Time
In addition, the following metrics are displayed for the active storage group:
I/O Log Writes Average Latency. This graph charts the average time it takes to write a log buffer to the active log file.
I/O Database Average Latency. This graph charts the average time, in milliseconds, that it takes to read from and write to the database file. It provides a comparison of the following counters:
• I/O Database Reads Average Latency. Shows the average time to read from the database file.
• I/O Database Writes Average Latency. Shows the average time to write to the database file.
Passive Storage Group. The following details are displayed for the passive storage group in the selected cluster:
• Copy Status
• Failed Message
• Last Inspected Log Time
In addition, the following metrics are displayed for the passive storage group:
Copy Queue Length. This graph charts the number of transaction log files waiting to be copied to the passive copy log file folder.
Replay Queue Length. This graph charts the number of transaction log files waiting to be replayed into the passive copy.
Table 44. Cluster Summary view - Databases
Foglight for Exchange 5.6.9User and Reference Guide
100
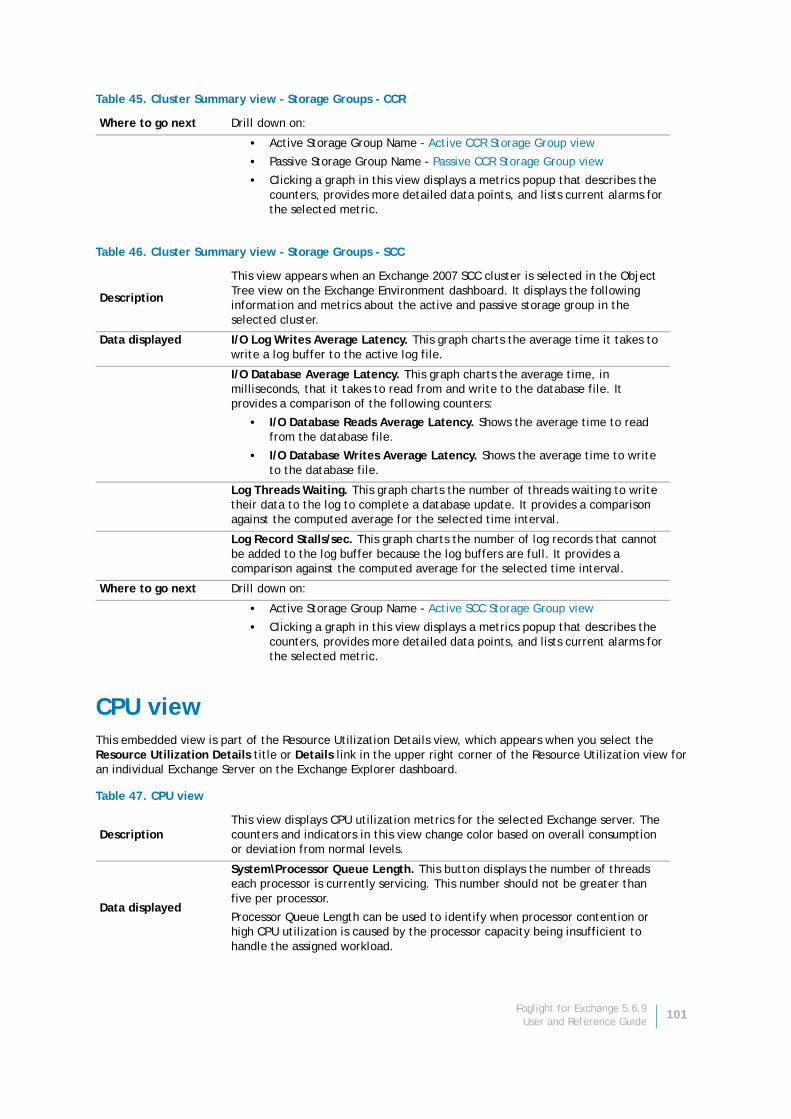
CPU viewThis embedded view is part of the Resource Utilization Details view, which appears when you select the Resource Utilization Details title or Details link in the upper right corner of the Resource Utilization view for an individual Exchange Server on the Exchange Explorer dashboard.
Where to go next Drill down on:
• Active Storage Group Name - Active CCR Storage Group view
• Passive Storage Group Name - Passive CCR Storage Group view
• Clicking a graph in this view displays a metrics popup that describes the counters, provides more detailed data points, and lists current alarms for the selected metric.
Table 46. Cluster Summary view - Storage Groups - SCC
Description
This view appears when an Exchange 2007 SCC cluster is selected in the Object Tree view on the Exchange Environment dashboard. It displays the following information and metrics about the active and passive storage group in the selected cluster.
Data displayed I/O Log Writes Average Latency. This graph charts the average time it takes to write a log buffer to the active log file.
I/O Database Average Latency. This graph charts the average time, in milliseconds, that it takes to read from and write to the database file. It provides a comparison of the following counters:
• I/O Database Reads Average Latency. Shows the average time to read from the database file.
• I/O Database Writes Average Latency. Shows the average time to write to the database file.
Log Threads Waiting. This graph charts the number of threads waiting to write their data to the log to complete a database update. It provides a comparison against the computed average for the selected time interval.
Log Record Stalls/sec. This graph charts the number of log records that cannot be added to the log buffer because the log buffers are full. It provides a comparison against the computed average for the selected time interval.
Where to go next Drill down on:
• Active Storage Group Name - Active SCC Storage Group view
• Clicking a graph in this view displays a metrics popup that describes the counters, provides more detailed data points, and lists current alarms for the selected metric.
Table 47. CPU view
DescriptionThis view displays CPU utilization metrics for the selected Exchange server. The counters and indicators in this view change color based on overall consumption or deviation from normal levels.
Data displayed
System\Processor Queue Length. This button displays the number of threads each processor is currently servicing. This number should not be greater than five per processor.
Processor Queue Length can be used to identify when processor contention or high CPU utilization is caused by the processor capacity being insufficient to handle the assigned workload.
Table 45. Cluster Summary view - Storage Groups - CCR
Foglight for Exchange 5.6.9User and Reference Guide
101
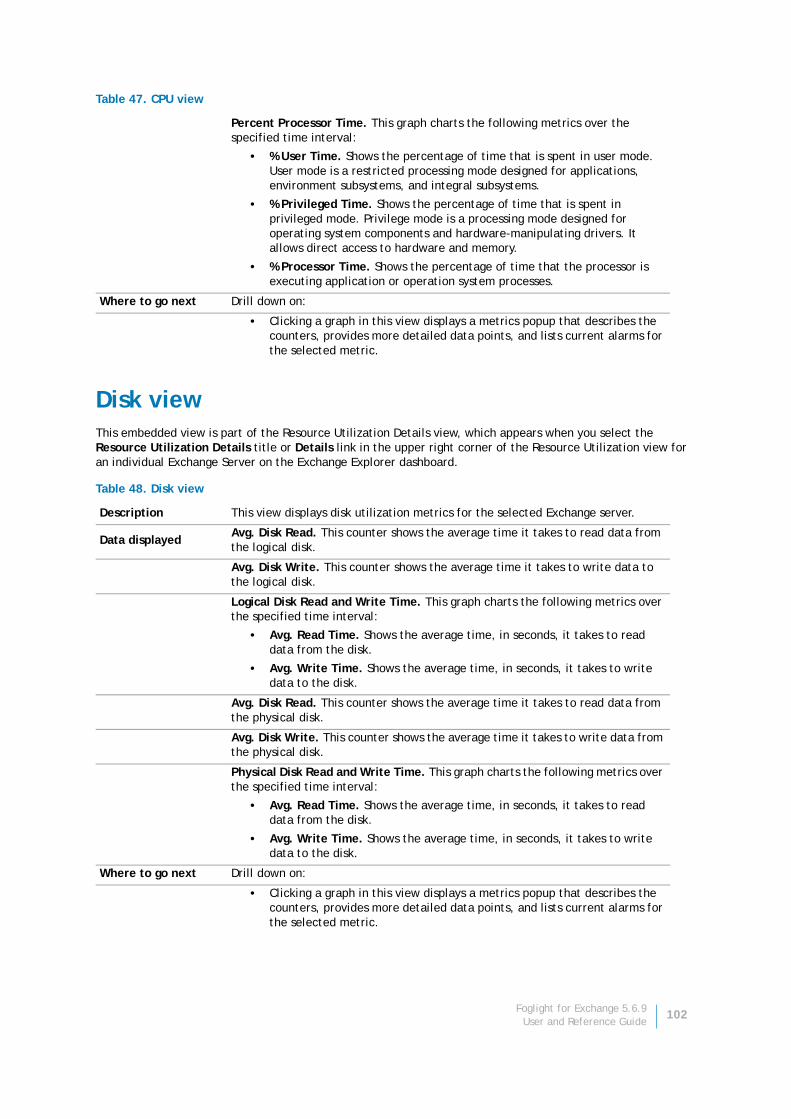
Disk viewThis embedded view is part of the Resource Utilization Details view, which appears when you select the Resource Utilization Details title or Details link in the upper right corner of the Resource Utilization view for an individual Exchange Server on the Exchange Explorer dashboard.
Percent Processor Time. This graph charts the following metrics over the specified time interval:
• % User Time. Shows the percentage of time that is spent in user mode. User mode is a restricted processing mode designed for applications, environment subsystems, and integral subsystems.
• % Privileged Time. Shows the percentage of time that is spent in privileged mode. Privilege mode is a processing mode designed for operating system components and hardware-manipulating drivers. It allows direct access to hardware and memory.
• % Processor Time. Shows the percentage of time that the processor is executing application or operation system processes.
Where to go next Drill down on:
• Clicking a graph in this view displays a metrics popup that describes the counters, provides more detailed data points, and lists current alarms for the selected metric.
Table 48. Disk view
Description This view displays disk utilization metrics for the selected Exchange server.
Data displayedAvg. Disk Read. This counter shows the average time it takes to read data from the logical disk.
Avg. Disk Write. This counter shows the average time it takes to write data to the logical disk.
Logical Disk Read and Write Time. This graph charts the following metrics over the specified time interval:
• Avg. Read Time. Shows the average time, in seconds, it takes to read data from the disk.
• Avg. Write Time. Shows the average time, in seconds, it takes to write data to the disk.
Avg. Disk Read. This counter shows the average time it takes to read data from the physical disk.
Avg. Disk Write. This counter shows the average time it takes to write data from the physical disk.
Physical Disk Read and Write Time. This graph charts the following metrics over the specified time interval:
• Avg. Read Time. Shows the average time, in seconds, it takes to read data from the disk.
• Avg. Write Time. Shows the average time, in seconds, it takes to write data to the disk.
Where to go next Drill down on:
• Clicking a graph in this view displays a metrics popup that describes the counters, provides more detailed data points, and lists current alarms for the selected metric.
Table 47. CPU view
Foglight for Exchange 5.6.9User and Reference Guide
102
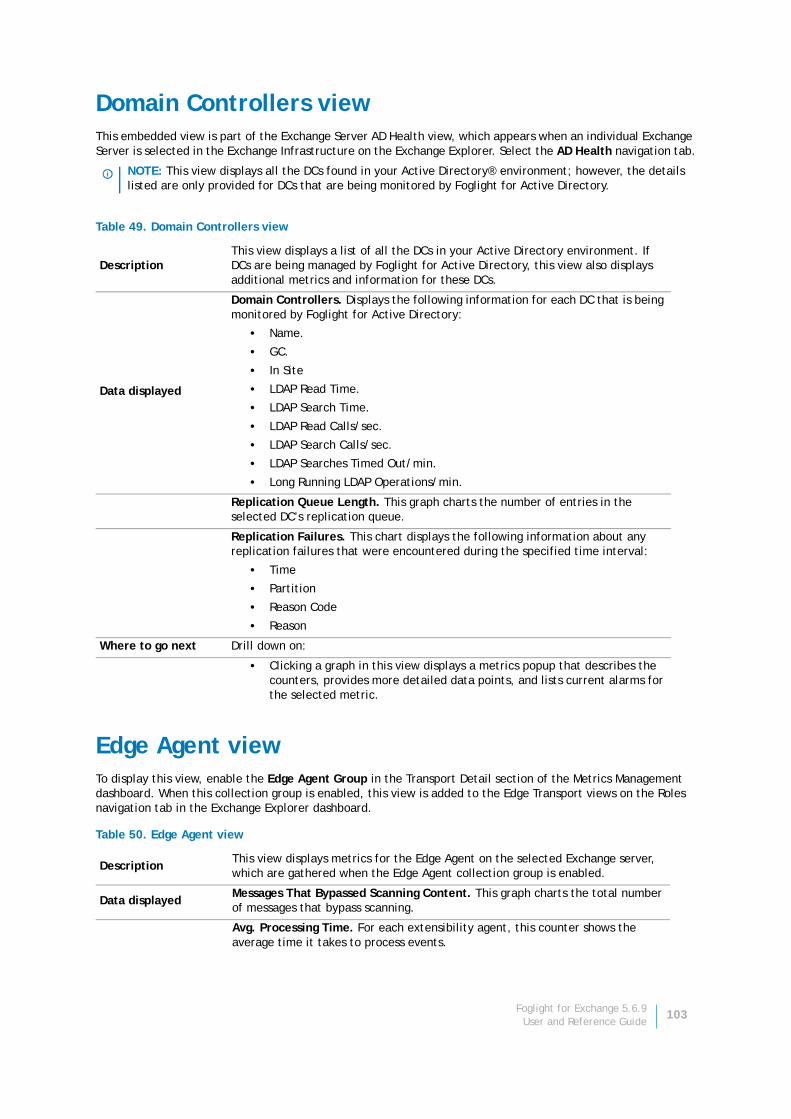
Domain Controllers viewThis embedded view is part of the Exchange Server AD Health view, which appears when an individual Exchange Server is selected in the Exchange Infrastructure on the Exchange Explorer. Select the AD Health navigation tab.
Edge Agent viewTo display this view, enable the Edge Agent Group in the Transport Detail section of the Metrics Management dashboard. When this collection group is enabled, this view is added to the Edge Transport views on the Roles navigation tab in the Exchange Explorer dashboard.
NOTE: This view displays all the DCs found in your Active Directory® environment; however, the details listed are only provided for DCs that are being monitored by Foglight for Active Directory.
Table 49. Domain Controllers view
DescriptionThis view displays a list of all the DCs in your Active Directory environment. If DCs are being managed by Foglight for Active Directory, this view also displays additional metrics and information for these DCs.
Data displayed
Domain Controllers. Displays the following information for each DC that is being monitored by Foglight for Active Directory:
• Name.
• GC.
• In Site
• LDAP Read Time.
• LDAP Search Time.
• LDAP Read Calls/sec.
• LDAP Search Calls/sec.
• LDAP Searches Timed Out/min.
• Long Running LDAP Operations/min.
Replication Queue Length. This graph charts the number of entries in the selected DC’s replication queue.
Replication Failures. This chart displays the following information about any replication failures that were encountered during the specified time interval:
• Time
• Partition
• Reason Code
• Reason
Where to go next Drill down on:
• Clicking a graph in this view displays a metrics popup that describes the counters, provides more detailed data points, and lists current alarms for the selected metric.
Table 50. Edge Agent view
DescriptionThis view displays metrics for the Edge Agent on the selected Exchange server, which are gathered when the Edge Agent collection group is enabled.
Data displayedMessages That Bypassed Scanning Content. This graph charts the total number of messages that bypass scanning.
Avg. Processing Time. For each extensibility agent, this counter shows the average time it takes to process events.
Foglight for Exchange 5.6.9User and Reference Guide
103
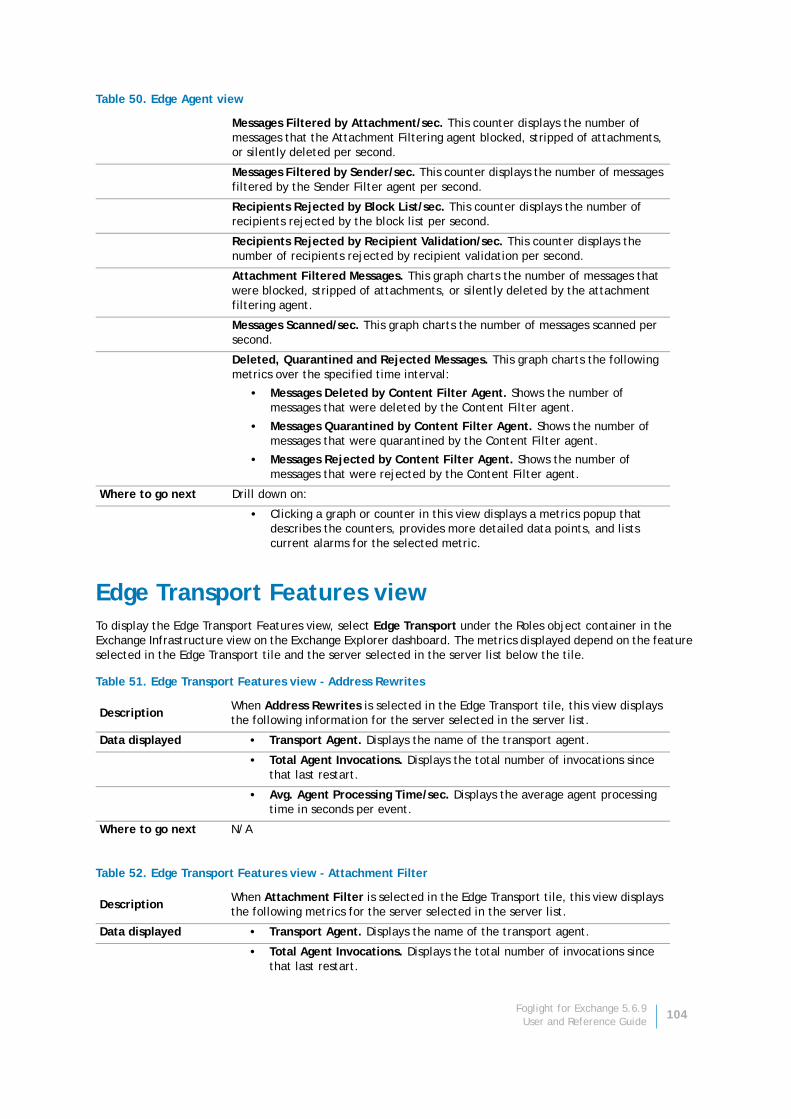
Edge Transport Features viewTo display the Edge Transport Features view, select Edge Transport under the Roles object container in the Exchange Infrastructure view on the Exchange Explorer dashboard. The metrics displayed depend on the feature selected in the Edge Transport tile and the server selected in the server list below the tile.
Messages Filtered by Attachment/sec. This counter displays the number of messages that the Attachment Filtering agent blocked, stripped of attachments, or silently deleted per second.
Messages Filtered by Sender/sec. This counter displays the number of messages filtered by the Sender Filter agent per second.
Recipients Rejected by Block List/sec. This counter displays the number of recipients rejected by the block list per second.
Recipients Rejected by Recipient Validation/sec. This counter displays the number of recipients rejected by recipient validation per second.
Attachment Filtered Messages. This graph charts the number of messages that were blocked, stripped of attachments, or silently deleted by the attachment filtering agent.
Messages Scanned/sec. This graph charts the number of messages scanned per second.
Deleted, Quarantined and Rejected Messages. This graph charts the following metrics over the specified time interval:
• Messages Deleted by Content Filter Agent. Shows the number of messages that were deleted by the Content Filter agent.
• Messages Quarantined by Content Filter Agent. Shows the number of messages that were quarantined by the Content Filter agent.
• Messages Rejected by Content Filter Agent. Shows the number of messages that were rejected by the Content Filter agent.
Where to go next Drill down on:
• Clicking a graph or counter in this view displays a metrics popup that describes the counters, provides more detailed data points, and lists current alarms for the selected metric.
Table 51. Edge Transport Features view - Address Rewrites
DescriptionWhen Address Rewrites is selected in the Edge Transport tile, this view displays the following information for the server selected in the server list.
Data displayed • Transport Agent. Displays the name of the transport agent.
• Total Agent Invocations. Displays the total number of invocations since that last restart.
• Avg. Agent Processing Time/sec. Displays the average agent processing time in seconds per event.
Where to go next N/A
Table 52. Edge Transport Features view - Attachment Filter
DescriptionWhen Attachment Filter is selected in the Edge Transport tile, this view displays the following metrics for the server selected in the server list.
Data displayed • Transport Agent. Displays the name of the transport agent.
• Total Agent Invocations. Displays the total number of invocations since that last restart.
Table 50. Edge Agent view
Foglight for Exchange 5.6.9User and Reference Guide
104
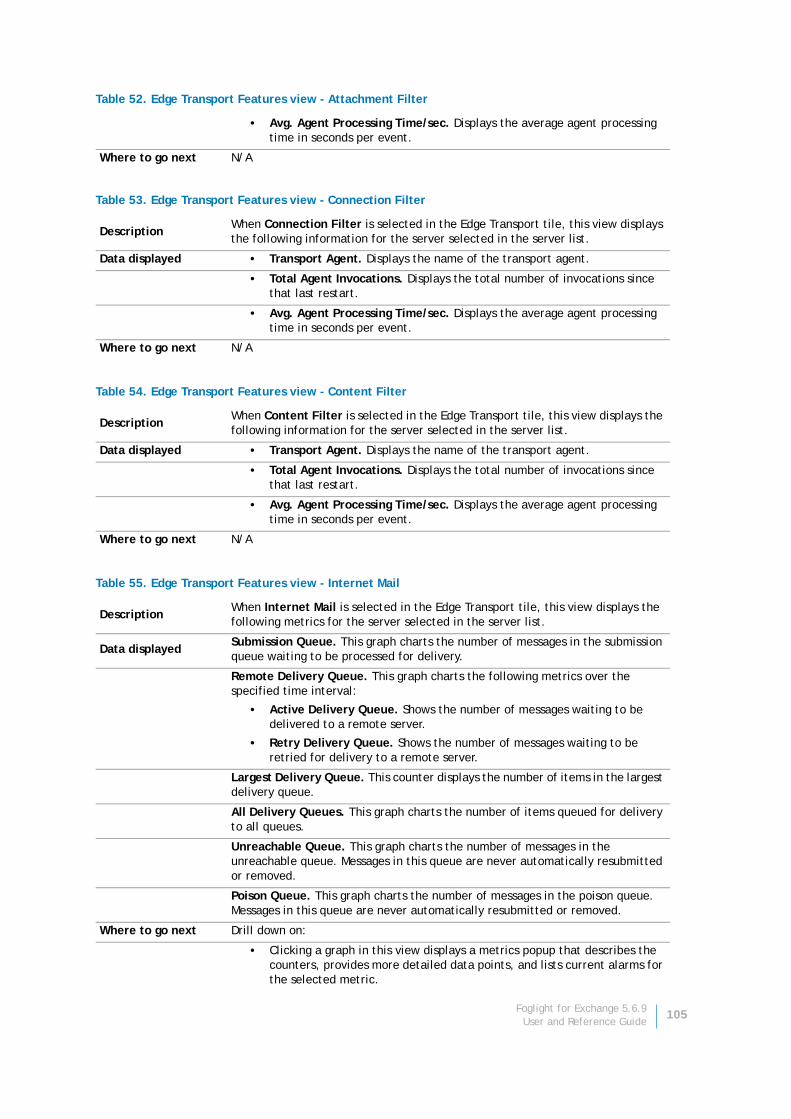
• Avg. Agent Processing Time/sec. Displays the average agent processing time in seconds per event.
Where to go next N/A
Table 53. Edge Transport Features view - Connection Filter
DescriptionWhen Connection Filter is selected in the Edge Transport tile, this view displays the following information for the server selected in the server list.
Data displayed • Transport Agent. Displays the name of the transport agent.
• Total Agent Invocations. Displays the total number of invocations since that last restart.
• Avg. Agent Processing Time/sec. Displays the average agent processing time in seconds per event.
Where to go next N/A
Table 54. Edge Transport Features view - Content Filter
DescriptionWhen Content Filter is selected in the Edge Transport tile, this view displays the following information for the server selected in the server list.
Data displayed • Transport Agent. Displays the name of the transport agent.
• Total Agent Invocations. Displays the total number of invocations since that last restart.
• Avg. Agent Processing Time/sec. Displays the average agent processing time in seconds per event.
Where to go next N/A
Table 55. Edge Transport Features view - Internet Mail
DescriptionWhen Internet Mail is selected in the Edge Transport tile, this view displays the following metrics for the server selected in the server list.
Data displayedSubmission Queue. This graph charts the number of messages in the submission queue waiting to be processed for delivery.
Remote Delivery Queue. This graph charts the following metrics over the specified time interval:
• Active Delivery Queue. Shows the number of messages waiting to be delivered to a remote server.
• Retry Delivery Queue. Shows the number of messages waiting to be retried for delivery to a remote server.
Largest Delivery Queue. This counter displays the number of items in the largest delivery queue.
All Delivery Queues. This graph charts the number of items queued for delivery to all queues.
Unreachable Queue. This graph charts the number of messages in the unreachable queue. Messages in this queue are never automatically resubmitted or removed.
Poison Queue. This graph charts the number of messages in the poison queue. Messages in this queue are never automatically resubmitted or removed.
Where to go next Drill down on:
• Clicking a graph in this view displays a metrics popup that describes the counters, provides more detailed data points, and lists current alarms for the selected metric.
Table 52. Edge Transport Features view - Attachment Filter
Foglight for Exchange 5.6.9User and Reference Guide
105
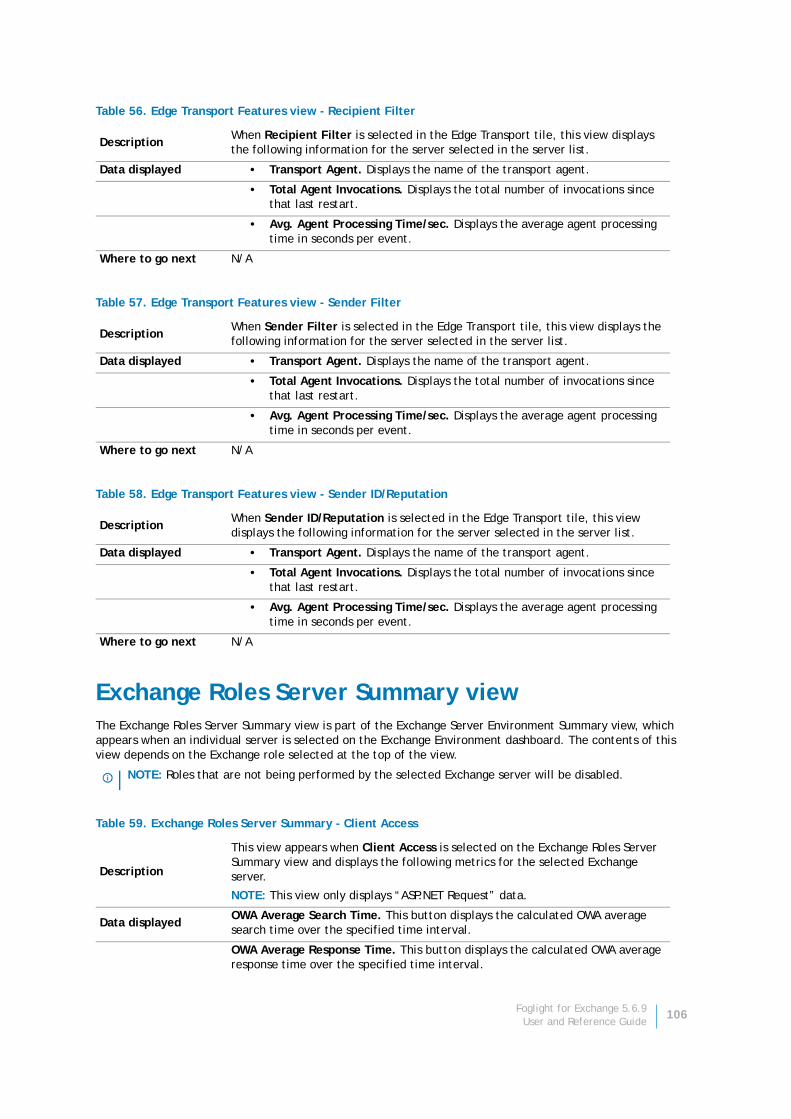
Exchange Roles Server Summary viewThe Exchange Roles Server Summary view is part of the Exchange Server Environment Summary view, which appears when an individual server is selected on the Exchange Environment dashboard. The contents of this view depends on the Exchange role selected at the top of the view.
Table 56. Edge Transport Features view - Recipient Filter
DescriptionWhen Recipient Filter is selected in the Edge Transport tile, this view displays the following information for the server selected in the server list.
Data displayed • Transport Agent. Displays the name of the transport agent.
• Total Agent Invocations. Displays the total number of invocations since that last restart.
• Avg. Agent Processing Time/sec. Displays the average agent processing time in seconds per event.
Where to go next N/A
Table 57. Edge Transport Features view - Sender Filter
DescriptionWhen Sender Filter is selected in the Edge Transport tile, this view displays the following information for the server selected in the server list.
Data displayed • Transport Agent. Displays the name of the transport agent.
• Total Agent Invocations. Displays the total number of invocations since that last restart.
• Avg. Agent Processing Time/sec. Displays the average agent processing time in seconds per event.
Where to go next N/A
Table 58. Edge Transport Features view - Sender ID/Reputation
DescriptionWhen Sender ID/Reputation is selected in the Edge Transport tile, this view displays the following information for the server selected in the server list.
Data displayed • Transport Agent. Displays the name of the transport agent.
• Total Agent Invocations. Displays the total number of invocations since that last restart.
• Avg. Agent Processing Time/sec. Displays the average agent processing time in seconds per event.
Where to go next N/A
NOTE: Roles that are not being performed by the selected Exchange server will be disabled.
Table 59. Exchange Roles Server Summary - Client Access
Description
This view appears when Client Access is selected on the Exchange Roles Server Summary view and displays the following metrics for the selected Exchange server.
NOTE: This view only displays “ASP.NET Request” data.
Data displayedOWA Average Search Time. This button displays the calculated OWA average search time over the specified time interval.
OWA Average Response Time. This button displays the calculated OWA average response time over the specified time interval.
Foglight for Exchange 5.6.9User and Reference Guide
106

OWA Average Search & Response Time. This graph charts the following metrics over the specified time interval:
• Average Response Time. Shows the average time (in ms) that elapsed between the beginning and end of an OEH or ASPX request.
• Average Search Time. Shows the average time that elapsed while waiting for a search to complete.
Peak Number of OWA Users. This metric indicator shows the largest number of users that were simultaneously connect to Outlook Web Access since the process was last restarted.
Number of OWA Users. This graph charts the following metrics over the specified time interval:
• Current OWA Users. Shows the number of users who are currently logged on to Outlook Web Access.
• Current Unique OWA Users. Shows the number of unique users who are currently logged on to Outlook Web Access.
Where to go next Drill down on:
• Clicking a entry in this list displays a metrics popup that describes the counter, provides more detailed data points, and lists current alarms for the selected metric.
Table 60. Exchange Roles Server Summary - Edge Transport
DescriptionThis view appears when Edge Transport is selected on the Exchange Roles Server Summary view and displays the following metrics for the selected server.
Data displayedSubmission Queue. This graph charts the number of messages waiting to be processed for delivery.
Remote Delivery Queues. This graph charts the following metrics over the specified time interval:
• Active Delivery Queue Length. Shows the number of messages waiting to be delivered to a remote server.
• Retry Delivery Queue Length. Shows the number of messages waiting to be retried for delivery to a remote server.
Messages Received/sec. This graph charts the number of messages received by the SMTP server per second.
Bytes Received/sec. This graph charts the number of bytes received in messages per second.
Where to go next Drill down on:
• Clicking a graph in this view displays a metrics popup that describes the counters, provides more detailed data points, and lists current alarms for the selected metric.
Table 61. Exchange Roles Server Summary - Hub Transport
DescriptionThis view appears when Hub Transport is selected on the Exchange Roles Server Summary view and displays the following metrics for the selected server.
Data displayedMailbox Delivery Queues. This graph charts the number of messages waiting to be retried for delivery to a Mailbox server.
Table 59. Exchange Roles Server Summary - Client Access
Foglight for Exchange 5.6.9User and Reference Guide
107
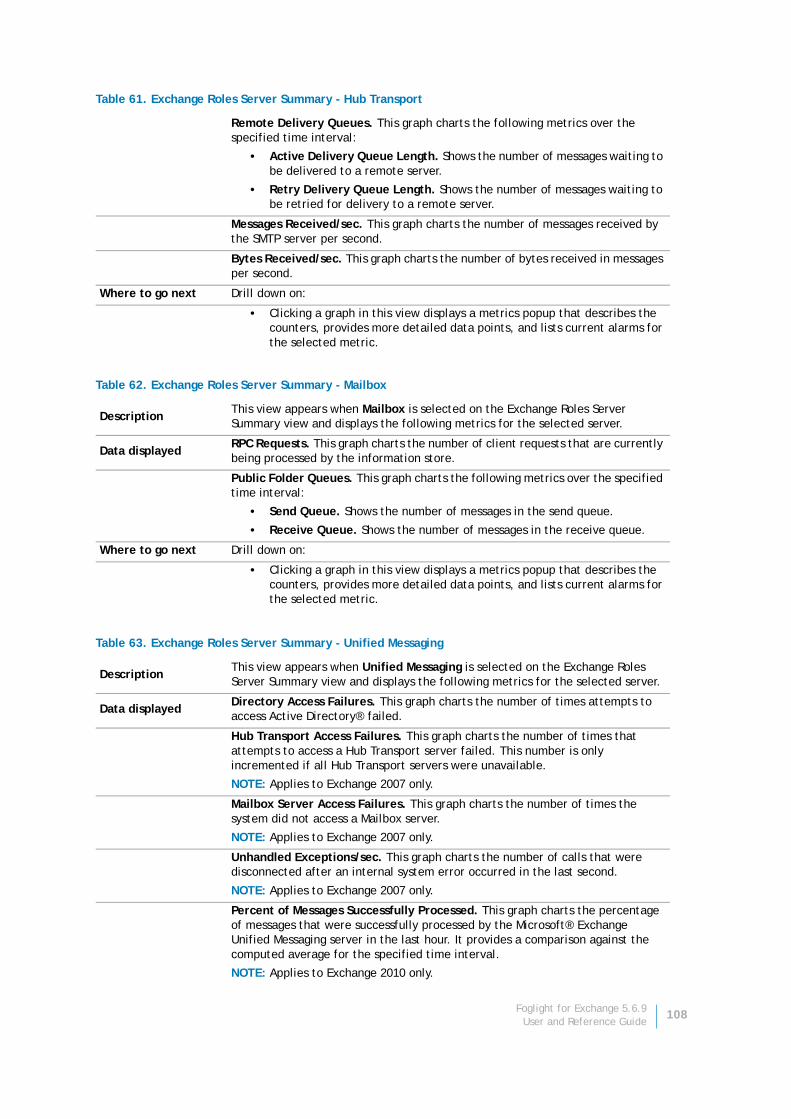
Remote Delivery Queues. This graph charts the following metrics over the specified time interval:
• Active Delivery Queue Length. Shows the number of messages waiting to be delivered to a remote server.
• Retry Delivery Queue Length. Shows the number of messages waiting to be retried for delivery to a remote server.
Messages Received/sec. This graph charts the number of messages received by the SMTP server per second.
Bytes Received/sec. This graph charts the number of bytes received in messages per second.
Where to go next Drill down on:
• Clicking a graph in this view displays a metrics popup that describes the counters, provides more detailed data points, and lists current alarms for the selected metric.
Table 62. Exchange Roles Server Summary - Mailbox
DescriptionThis view appears when Mailbox is selected on the Exchange Roles Server Summary view and displays the following metrics for the selected server.
Data displayedRPC Requests. This graph charts the number of client requests that are currently being processed by the information store.
Public Folder Queues. This graph charts the following metrics over the specified time interval:
• Send Queue. Shows the number of messages in the send queue.
• Receive Queue. Shows the number of messages in the receive queue.
Where to go next Drill down on:
• Clicking a graph in this view displays a metrics popup that describes the counters, provides more detailed data points, and lists current alarms for the selected metric.
Table 63. Exchange Roles Server Summary - Unified Messaging
DescriptionThis view appears when Unified Messaging is selected on the Exchange Roles Server Summary view and displays the following metrics for the selected server.
Data displayedDirectory Access Failures. This graph charts the number of times attempts to access Active Directory® failed.
Hub Transport Access Failures. This graph charts the number of times that attempts to access a Hub Transport server failed. This number is only incremented if all Hub Transport servers were unavailable.
NOTE: Applies to Exchange 2007 only.
Mailbox Server Access Failures. This graph charts the number of times the system did not access a Mailbox server.
NOTE: Applies to Exchange 2007 only.
Unhandled Exceptions/sec. This graph charts the number of calls that were disconnected after an internal system error occurred in the last second.
NOTE: Applies to Exchange 2007 only.
Percent of Messages Successfully Processed. This graph charts the percentage of messages that were successfully processed by the Microsoft® Exchange Unified Messaging server in the last hour. It provides a comparison against the computed average for the specified time interval.
NOTE: Applies to Exchange 2010 only.
Table 61. Exchange Roles Server Summary - Hub Transport
Foglight for Exchange 5.6.9User and Reference Guide
108
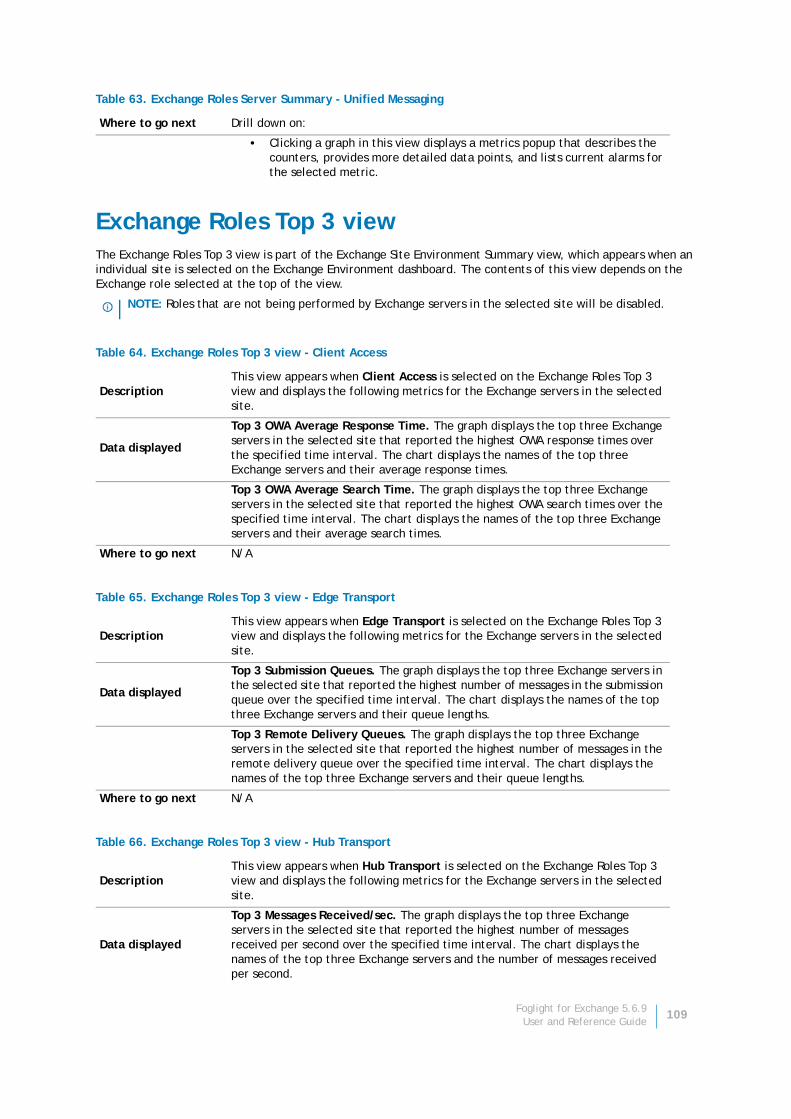
Exchange Roles Top 3 viewThe Exchange Roles Top 3 view is part of the Exchange Site Environment Summary view, which appears when an individual site is selected on the Exchange Environment dashboard. The contents of this view depends on the Exchange role selected at the top of the view.
Where to go next Drill down on:
• Clicking a graph in this view displays a metrics popup that describes the counters, provides more detailed data points, and lists current alarms for the selected metric.
NOTE: Roles that are not being performed by Exchange servers in the selected site will be disabled.
Table 64. Exchange Roles Top 3 view - Client Access
DescriptionThis view appears when Client Access is selected on the Exchange Roles Top 3 view and displays the following metrics for the Exchange servers in the selected site.
Data displayed
Top 3 OWA Average Response Time. The graph displays the top three Exchange servers in the selected site that reported the highest OWA response times over the specified time interval. The chart displays the names of the top three Exchange servers and their average response times.
Top 3 OWA Average Search Time. The graph displays the top three Exchange servers in the selected site that reported the highest OWA search times over the specified time interval. The chart displays the names of the top three Exchange servers and their average search times.
Where to go next N/A
Table 65. Exchange Roles Top 3 view - Edge Transport
DescriptionThis view appears when Edge Transport is selected on the Exchange Roles Top 3 view and displays the following metrics for the Exchange servers in the selected site.
Data displayed
Top 3 Submission Queues. The graph displays the top three Exchange servers in the selected site that reported the highest number of messages in the submission queue over the specified time interval. The chart displays the names of the top three Exchange servers and their queue lengths.
Top 3 Remote Delivery Queues. The graph displays the top three Exchange servers in the selected site that reported the highest number of messages in the remote delivery queue over the specified time interval. The chart displays the names of the top three Exchange servers and their queue lengths.
Where to go next N/A
Table 66. Exchange Roles Top 3 view - Hub Transport
DescriptionThis view appears when Hub Transport is selected on the Exchange Roles Top 3 view and displays the following metrics for the Exchange servers in the selected site.
Data displayed
Top 3 Messages Received/sec. The graph displays the top three Exchange servers in the selected site that reported the highest number of messages received per second over the specified time interval. The chart displays the names of the top three Exchange servers and the number of messages received per second.
Table 63. Exchange Roles Server Summary - Unified Messaging
Foglight for Exchange 5.6.9User and Reference Guide
109
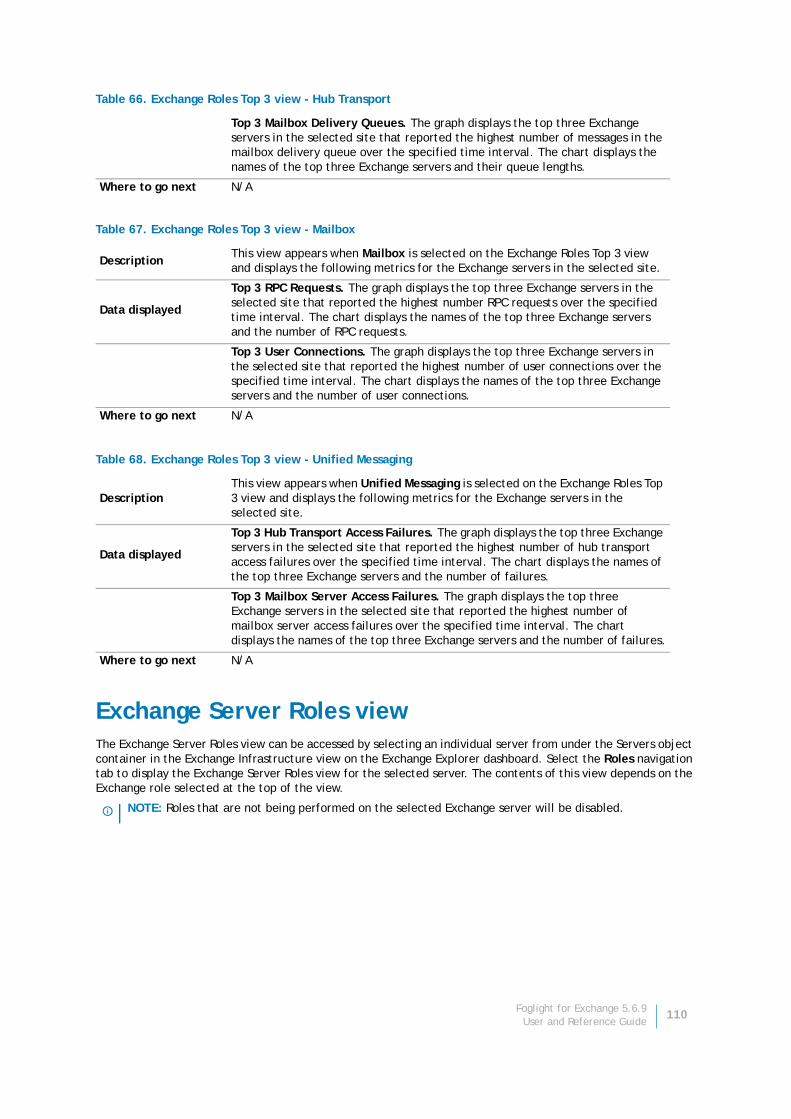
Exchange Server Roles viewThe Exchange Server Roles view can be accessed by selecting an individual server from under the Servers object container in the Exchange Infrastructure view on the Exchange Explorer dashboard. Select the Roles navigation tab to display the Exchange Server Roles view for the selected server. The contents of this view depends on the Exchange role selected at the top of the view.
Top 3 Mailbox Delivery Queues. The graph displays the top three Exchange servers in the selected site that reported the highest number of messages in the mailbox delivery queue over the specified time interval. The chart displays the names of the top three Exchange servers and their queue lengths.
Where to go next N/A
Table 67. Exchange Roles Top 3 view - Mailbox
DescriptionThis view appears when Mailbox is selected on the Exchange Roles Top 3 view and displays the following metrics for the Exchange servers in the selected site.
Data displayed
Top 3 RPC Requests. The graph displays the top three Exchange servers in the selected site that reported the highest number RPC requests over the specified time interval. The chart displays the names of the top three Exchange servers and the number of RPC requests.
Top 3 User Connections. The graph displays the top three Exchange servers in the selected site that reported the highest number of user connections over the specified time interval. The chart displays the names of the top three Exchange servers and the number of user connections.
Where to go next N/A
Table 68. Exchange Roles Top 3 view - Unified Messaging
DescriptionThis view appears when Unified Messaging is selected on the Exchange Roles Top 3 view and displays the following metrics for the Exchange servers in the selected site.
Data displayed
Top 3 Hub Transport Access Failures. The graph displays the top three Exchange servers in the selected site that reported the highest number of hub transport access failures over the specified time interval. The chart displays the names of the top three Exchange servers and the number of failures.
Top 3 Mailbox Server Access Failures. The graph displays the top three Exchange servers in the selected site that reported the highest number of mailbox server access failures over the specified time interval. The chart displays the names of the top three Exchange servers and the number of failures.
Where to go next N/A
NOTE: Roles that are not being performed on the selected Exchange server will be disabled.
Table 66. Exchange Roles Top 3 view - Hub Transport
Foglight for Exchange 5.6.9User and Reference Guide
110
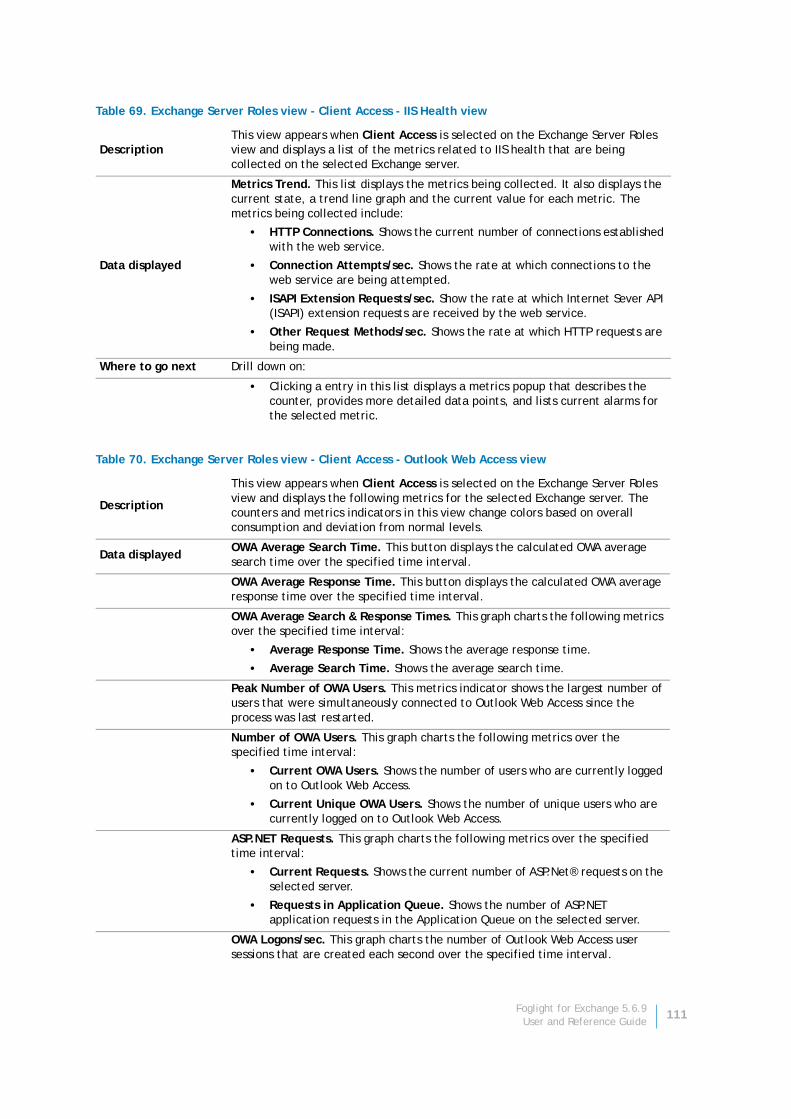
Table 69. Exchange Server Roles view - Client Access - IIS Health view
DescriptionThis view appears when Client Access is selected on the Exchange Server Roles view and displays a list of the metrics related to IIS health that are being collected on the selected Exchange server.
Data displayed
Metrics Trend. This list displays the metrics being collected. It also displays the current state, a trend line graph and the current value for each metric. The metrics being collected include:
• HTTP Connections. Shows the current number of connections established with the web service.
• Connection Attempts/sec. Shows the rate at which connections to the web service are being attempted.
• ISAPI Extension Requests/sec. Show the rate at which Internet Sever API (ISAPI) extension requests are received by the web service.
• Other Request Methods/sec. Shows the rate at which HTTP requests are being made.
Where to go next Drill down on:
• Clicking a entry in this list displays a metrics popup that describes the counter, provides more detailed data points, and lists current alarms for the selected metric.
Table 70. Exchange Server Roles view - Client Access - Outlook Web Access view
Description
This view appears when Client Access is selected on the Exchange Server Roles view and displays the following metrics for the selected Exchange server. The counters and metrics indicators in this view change colors based on overall consumption and deviation from normal levels.
Data displayedOWA Average Search Time. This button displays the calculated OWA average search time over the specified time interval.
OWA Average Response Time. This button displays the calculated OWA average response time over the specified time interval.
OWA Average Search & Response Times. This graph charts the following metrics over the specified time interval:
• Average Response Time. Shows the average response time.
• Average Search Time. Shows the average search time.
Peak Number of OWA Users. This metrics indicator shows the largest number of users that were simultaneously connected to Outlook Web Access since the process was last restarted.
Number of OWA Users. This graph charts the following metrics over the specified time interval:
• Current OWA Users. Shows the number of users who are currently logged on to Outlook Web Access.
• Current Unique OWA Users. Shows the number of unique users who are currently logged on to Outlook Web Access.
ASP.NET Requests. This graph charts the following metrics over the specified time interval:
• Current Requests. Shows the current number of ASP.Net® requests on the selected server.
• Requests in Application Queue. Shows the number of ASP.NET application requests in the Application Queue on the selected server.
OWA Logons/sec. This graph charts the number of Outlook Web Access user sessions that are created each second over the specified time interval.
Foglight for Exchange 5.6.9User and Reference Guide
111
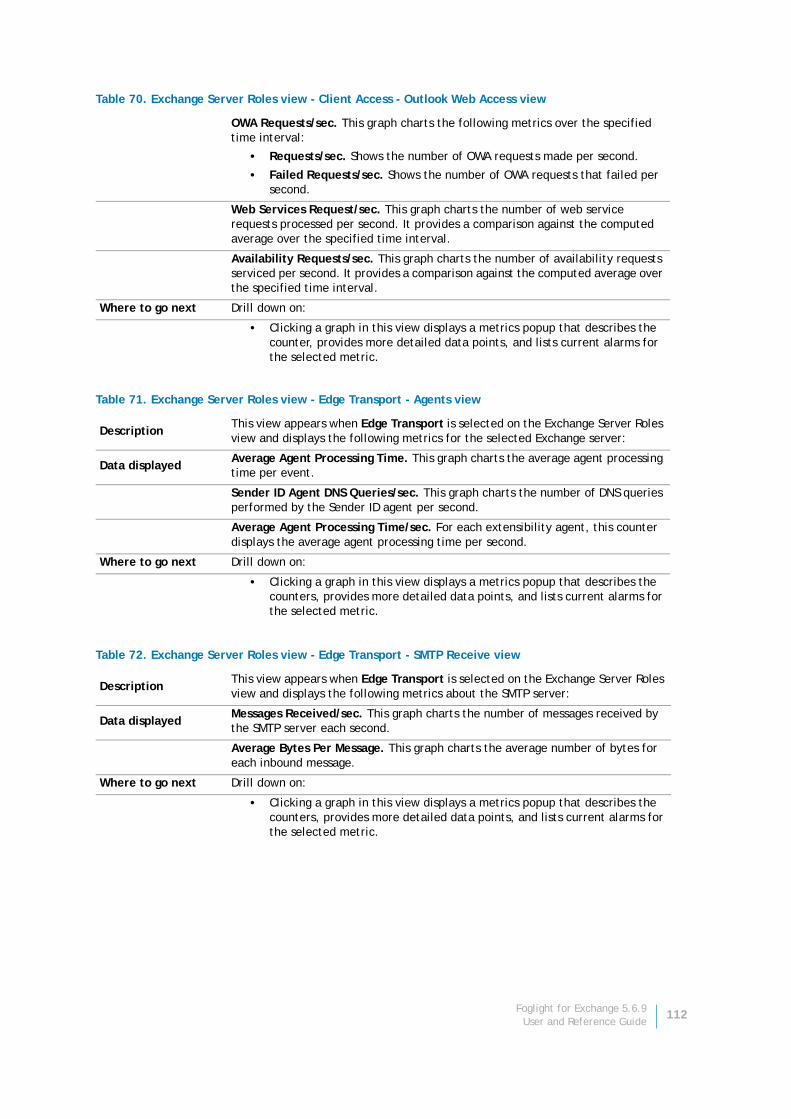
OWA Requests/sec. This graph charts the following metrics over the specified time interval:
• Requests/sec. Shows the number of OWA requests made per second.
• Failed Requests/sec. Shows the number of OWA requests that failed per second.
Web Services Request/sec. This graph charts the number of web service requests processed per second. It provides a comparison against the computed average over the specified time interval.
Availability Requests/sec. This graph charts the number of availability requests serviced per second. It provides a comparison against the computed average over the specified time interval.
Where to go next Drill down on:
• Clicking a graph in this view displays a metrics popup that describes the counter, provides more detailed data points, and lists current alarms for the selected metric.
Table 71. Exchange Server Roles view - Edge Transport - Agents view
DescriptionThis view appears when Edge Transport is selected on the Exchange Server Roles view and displays the following metrics for the selected Exchange server:
Data displayedAverage Agent Processing Time. This graph charts the average agent processing time per event.
Sender ID Agent DNS Queries/sec. This graph charts the number of DNS queries performed by the Sender ID agent per second.
Average Agent Processing Time/sec. For each extensibility agent, this counter displays the average agent processing time per second.
Where to go next Drill down on:
• Clicking a graph in this view displays a metrics popup that describes the counters, provides more detailed data points, and lists current alarms for the selected metric.
Table 72. Exchange Server Roles view - Edge Transport - SMTP Receive view
DescriptionThis view appears when Edge Transport is selected on the Exchange Server Roles view and displays the following metrics about the SMTP server:
Data displayedMessages Received/sec. This graph charts the number of messages received by the SMTP server each second.
Average Bytes Per Message. This graph charts the average number of bytes for each inbound message.
Where to go next Drill down on:
• Clicking a graph in this view displays a metrics popup that describes the counters, provides more detailed data points, and lists current alarms for the selected metric.
Table 70. Exchange Server Roles view - Client Access - Outlook Web Access view
Foglight for Exchange 5.6.9User and Reference Guide
112

Table 73. Exchange Server Roles view - Edge Transport - Transport DC Connectivity view
DescriptionThis view appears when Edge Transport is selected on the Exchange Server Roles view and displays the following metrics about the SMTP server:
Data displayed
The Domain Controller Instance table displays the following metrics for each DC instance:
• LDAP Read Time.
• LDAP Search Time.
• LDAP Search Time Out/min.
• Long Running LDAP Operations/min.
The Process Instance table displays the following metrics for each process:
• LDAP Read Time.
• LDAP Search Time.
The Cache Instance table displays the following metric for each cache instance:
• LDAP Search/sec.
Where to go next N/A
Table 74. Exchange Server Roles view - Edge Transport - Transport Load view
DescriptionThis view appears when Edge Transport is selected on the Exchange Server Roles view and displays the following metrics about the transport load:
Data displayedSMTP Messages Sent/sec. This graph charts the number of messages sent by the SMTP send connector each second. It provides a comparison against the computed average for the specified time interval.
Items Completed Delivery/sec. This graph charts the rate at which messages completed delivery per second since the server was started. It provides a comparison against the computed average for the specified time interval.
Submission Queue Length. This graph charts the number of messages in the submission queue. It provides a comparison against the computed average for the specified time interval.
Messages Completed Delivery/sec. This counter displays the number of messages that are delivered per second.
Messages Queued for Delivery/sec. This counter displays the number of messages that have been queued for delivery per second.
Messages Submitted/sec. This counter displays the number of messages that have been queued in the Submission queues per second.
Where to go next Drill down on:
• Clicking a graph or counter in this view displays a metrics popup that describes the counters, provides more detailed data points, and lists current alarms for the selected metric.
Table 75. Exchange Server Roles view - Edge Transport - Transport Mail Database view
DescriptionThis view appears when Edge Transport is selected on the Exchange Server Roles view and displays the following metrics about the transport mail database for the selected server.
Data displayedLog Generation Checkpoint Depth. This graph charts the number of transaction log files that have not yet been saved to the database.
Log Threads Waiting. This graph charts the number of threads waiting for their data to be written to the log in order to complete the database update.
Foglight for Exchange 5.6.9User and Reference Guide
113

Log Record Stalls/sec. This graph charts the number of log records that cannot be added to the log buffers each second because the log buffers are full.
I/O Database Reads/sec. This counter displays the rate at which bytes are read from the database.
I/O Database Writes/sec. This counter displays the rate at which bytes are written to the database.
I/O Log Reads/sec. This counter displays the rate at which bytes are read from the log.
I/O Log Writes/sec. This counter displays the rate at which bytes are written to the log.
Version Buckets Allocated. This counter displays the total number of version buckets allocated.
Total Database Cache Size MB. This counter displays the amount of system memory used by the database cache manager to hold commonly used information from the database files to prevent file operations.
The Database Instance table at the bottom of this view displays the following metrics for each database instance:
• DB Reads/sec.
• DB Writes/sec.
• Log Reads/sec.
• Log Writes/sec.
• Log Generation Checkpoint Depth.
• Log Record Stalls/sec.
• Log Threads Waiting.
• Version Buckets Allocated.
Where to go next Drill down on:
• Clicking a graph in this view displays a metrics popup that describes the counters, provides more detailed data points, and lists current alarms for the selected metric.
Table 76. Exchange Server Roles view - Edge Transport - Transport Queues view
DescriptionThis view appears when Edge Transport is selected on the Exchange Server Roles view and displays the following transport queue metrics for the selected server.
Data displayedMailbox Delivery Queues. This graph charts the number of messages waiting to be retried for delivery to a Mailbox server.
Remote Delivery Queues. This graph charts the following metrics over the specified time interval:
• Active Delivery Queue Length. Shows the number of messages waiting to be delivered to a remote server.
• Retry Delivery Queue Length. Shows the number of messages waiting to be retried for delivery to a remote server.
Submission Queues. This graph charts the number of messages in the submission queue waiting to be processed for delivery.
Unreachable Queue. This graph charts the number of messages in the unreachable queue.
NOTE: The messages in this queue are not automatically resubmitted or removed.
Table 75. Exchange Server Roles view - Edge Transport - Transport Mail Database view
Foglight for Exchange 5.6.9User and Reference Guide
114
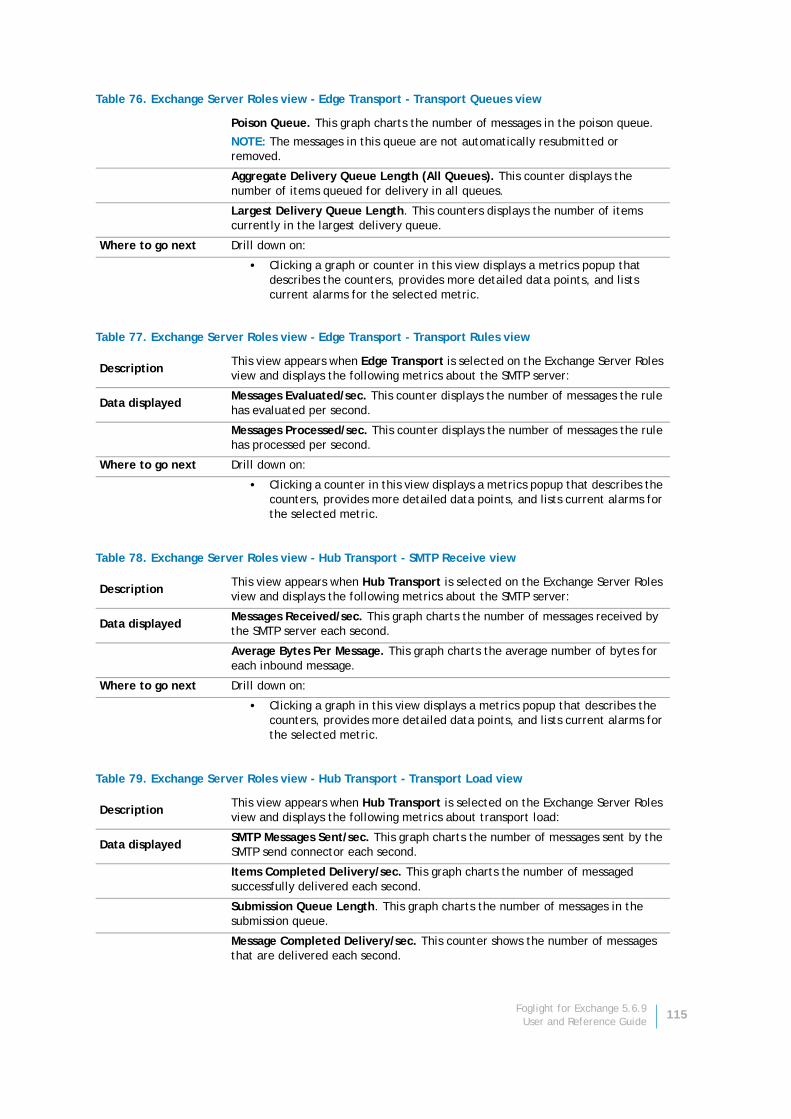
Poison Queue. This graph charts the number of messages in the poison queue.
NOTE: The messages in this queue are not automatically resubmitted or removed.
Aggregate Delivery Queue Length (All Queues). This counter displays the number of items queued for delivery in all queues.
Largest Delivery Queue Length. This counters displays the number of items currently in the largest delivery queue.
Where to go next Drill down on:
• Clicking a graph or counter in this view displays a metrics popup that describes the counters, provides more detailed data points, and lists current alarms for the selected metric.
Table 77. Exchange Server Roles view - Edge Transport - Transport Rules view
DescriptionThis view appears when Edge Transport is selected on the Exchange Server Roles view and displays the following metrics about the SMTP server:
Data displayedMessages Evaluated/sec. This counter displays the number of messages the rule has evaluated per second.
Messages Processed/sec. This counter displays the number of messages the rule has processed per second.
Where to go next Drill down on:
• Clicking a counter in this view displays a metrics popup that describes the counters, provides more detailed data points, and lists current alarms for the selected metric.
Table 78. Exchange Server Roles view - Hub Transport - SMTP Receive view
DescriptionThis view appears when Hub Transport is selected on the Exchange Server Roles view and displays the following metrics about the SMTP server:
Data displayedMessages Received/sec. This graph charts the number of messages received by the SMTP server each second.
Average Bytes Per Message. This graph charts the average number of bytes for each inbound message.
Where to go next Drill down on:
• Clicking a graph in this view displays a metrics popup that describes the counters, provides more detailed data points, and lists current alarms for the selected metric.
Table 79. Exchange Server Roles view - Hub Transport - Transport Load view
DescriptionThis view appears when Hub Transport is selected on the Exchange Server Roles view and displays the following metrics about transport load:
Data displayedSMTP Messages Sent/sec. This graph charts the number of messages sent by the SMTP send connector each second.
Items Completed Delivery/sec. This graph charts the number of messaged successfully delivered each second.
Submission Queue Length. This graph charts the number of messages in the submission queue.
Message Completed Delivery/sec. This counter shows the number of messages that are delivered each second.
Table 76. Exchange Server Roles view - Edge Transport - Transport Queues view
Foglight for Exchange 5.6.9User and Reference Guide
115

Messages Queued for Delivery/sec. This counter shows the number of messages that have been queued for delivery per second.
Messages Submitted/sec. This counter shows the number of messages that have been queued in the submission queue per second.
Where to go next Drill down on:
• Clicking a graph in this view displays a metrics popup that describes the counters, provides more detailed data points, and lists current alarms for the selected metric.
Table 80. Exchange Server Roles view - Hub Transport - Transport Mail Database view
DescriptionThis view appears when Hub Transport is selected on the Exchange Server Roles view and displays the following metrics about the transport mail database for the selected server.
Data displayedLog Generation Checkpoint Depth. This graph charts the number of transaction log files that have not yet been saved to the database.
Log Record Stalls Per Second. This graph charts the number of log records that cannot be added to the log buffers each second because the log buffers are full.
Log Threads Waiting. This graph charts the number of threads waiting for their data to be written to the log in order to complete the database update.
I/O Database Reads/sec. This counter shows the rate at which bytes are read from the database.
I/O Database Writes/sec. This counter shows the rate at which bytes are written to the database.
I/O Log Reads/sec. This counter shows the rate at which bytes are read from the log.
I/O Log Writes/sec. This counter shows the rate at which bytes are written to the log.
Version Buckets Allocated. This counter show the total number of version buckets allocated.
Total Database Cache Size in MB. This counter shows the amount of system memory used by the database cache manager to hold commonly used information from the database files to prevent file operations.
Database Instance Details. This list displays the following details about each database instance:
• Database Instance Name. Displays the name of the database instance.
• DB Reads/sec. Displays the current value for the I/O Database Reads/sec metric.
• DB Writes/sec. Displays the current value for the I/O Database Writes/sec metric.
• Log Reads/sec. Displays the current value for the I/O Log Reads/sec metric.
• Log Writes/sec. Displays the current value for the I/O Log Writes/sec metric.
• Log Generation Checkpoint Depth. Displays the current value for the Log Generation Checkpoint Depth metric.
• Log Records Stalls/sec. Displays the current value for the Log Record Stalls/sec metric.
• Log Threads Waiting. Displays the current value for the Log Threads Waiting metric.
Table 79. Exchange Server Roles view - Hub Transport - Transport Load view
Foglight for Exchange 5.6.9User and Reference Guide
116
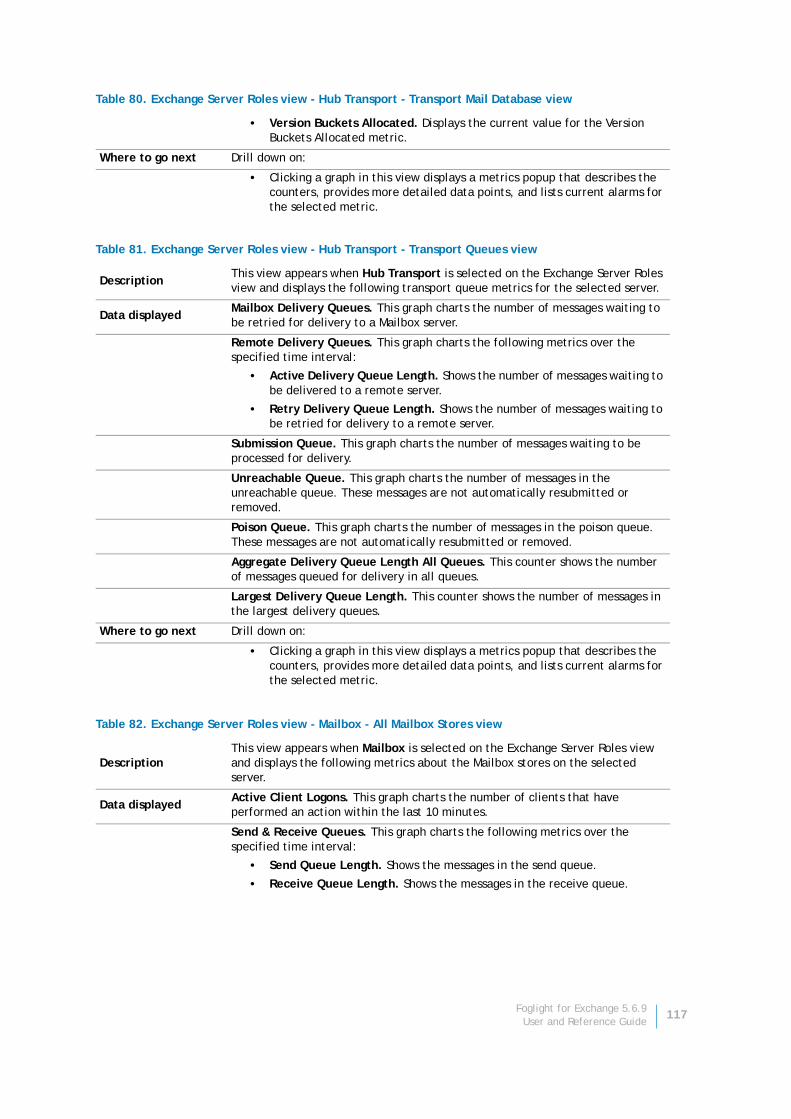
• Version Buckets Allocated. Displays the current value for the Version Buckets Allocated metric.
Where to go next Drill down on:
• Clicking a graph in this view displays a metrics popup that describes the counters, provides more detailed data points, and lists current alarms for the selected metric.
Table 81. Exchange Server Roles view - Hub Transport - Transport Queues view
DescriptionThis view appears when Hub Transport is selected on the Exchange Server Roles view and displays the following transport queue metrics for the selected server.
Data displayedMailbox Delivery Queues. This graph charts the number of messages waiting to be retried for delivery to a Mailbox server.
Remote Delivery Queues. This graph charts the following metrics over the specified time interval:
• Active Delivery Queue Length. Shows the number of messages waiting to be delivered to a remote server.
• Retry Delivery Queue Length. Shows the number of messages waiting to be retried for delivery to a remote server.
Submission Queue. This graph charts the number of messages waiting to be processed for delivery.
Unreachable Queue. This graph charts the number of messages in the unreachable queue. These messages are not automatically resubmitted or removed.
Poison Queue. This graph charts the number of messages in the poison queue. These messages are not automatically resubmitted or removed.
Aggregate Delivery Queue Length All Queues. This counter shows the number of messages queued for delivery in all queues.
Largest Delivery Queue Length. This counter shows the number of messages in the largest delivery queues.
Where to go next Drill down on:
• Clicking a graph in this view displays a metrics popup that describes the counters, provides more detailed data points, and lists current alarms for the selected metric.
Table 82. Exchange Server Roles view - Mailbox - All Mailbox Stores view
DescriptionThis view appears when Mailbox is selected on the Exchange Server Roles view and displays the following metrics about the Mailbox stores on the selected server.
Data displayedActive Client Logons. This graph charts the number of clients that have performed an action within the last 10 minutes.
Send & Receive Queues. This graph charts the following metrics over the specified time interval:
• Send Queue Length. Shows the messages in the send queue.
• Receive Queue Length. Shows the messages in the receive queue.
Table 80. Exchange Server Roles view - Hub Transport - Transport Mail Database view
Foglight for Exchange 5.6.9User and Reference Guide
117
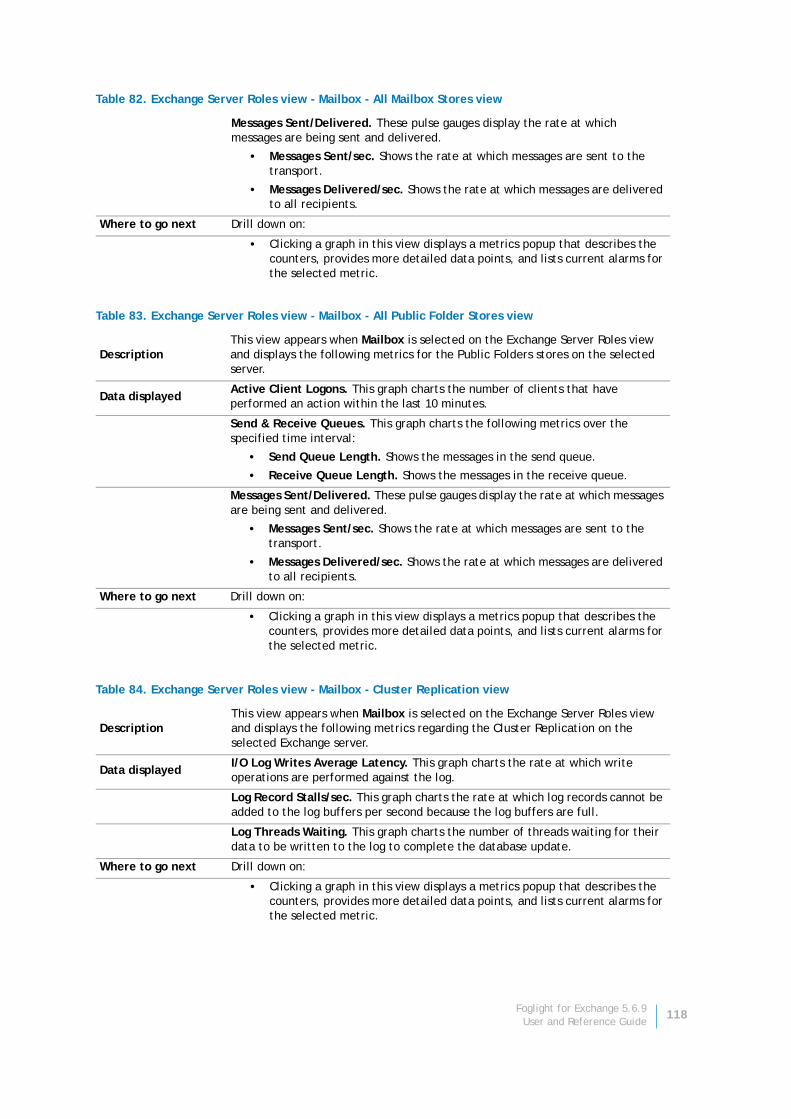
Messages Sent/Delivered. These pulse gauges display the rate at which messages are being sent and delivered.
• Messages Sent/sec. Shows the rate at which messages are sent to the transport.
• Messages Delivered/sec. Shows the rate at which messages are delivered to all recipients.
Where to go next Drill down on:
• Clicking a graph in this view displays a metrics popup that describes the counters, provides more detailed data points, and lists current alarms for the selected metric.
Table 83. Exchange Server Roles view - Mailbox - All Public Folder Stores view
DescriptionThis view appears when Mailbox is selected on the Exchange Server Roles view and displays the following metrics for the Public Folders stores on the selected server.
Data displayedActive Client Logons. This graph charts the number of clients that have performed an action within the last 10 minutes.
Send & Receive Queues. This graph charts the following metrics over the specified time interval:
• Send Queue Length. Shows the messages in the send queue.
• Receive Queue Length. Shows the messages in the receive queue.
Messages Sent/Delivered. These pulse gauges display the rate at which messages are being sent and delivered.
• Messages Sent/sec. Shows the rate at which messages are sent to the transport.
• Messages Delivered/sec. Shows the rate at which messages are delivered to all recipients.
Where to go next Drill down on:
• Clicking a graph in this view displays a metrics popup that describes the counters, provides more detailed data points, and lists current alarms for the selected metric.
Table 84. Exchange Server Roles view - Mailbox - Cluster Replication view
DescriptionThis view appears when Mailbox is selected on the Exchange Server Roles view and displays the following metrics regarding the Cluster Replication on the selected Exchange server.
Data displayedI/O Log Writes Average Latency. This graph charts the rate at which write operations are performed against the log.
Log Record Stalls/sec. This graph charts the rate at which log records cannot be added to the log buffers per second because the log buffers are full.
Log Threads Waiting. This graph charts the number of threads waiting for their data to be written to the log to complete the database update.
Where to go next Drill down on:
• Clicking a graph in this view displays a metrics popup that describes the counters, provides more detailed data points, and lists current alarms for the selected metric.
Table 82. Exchange Server Roles view - Mailbox - All Mailbox Stores view
Foglight for Exchange 5.6.9User and Reference Guide
118
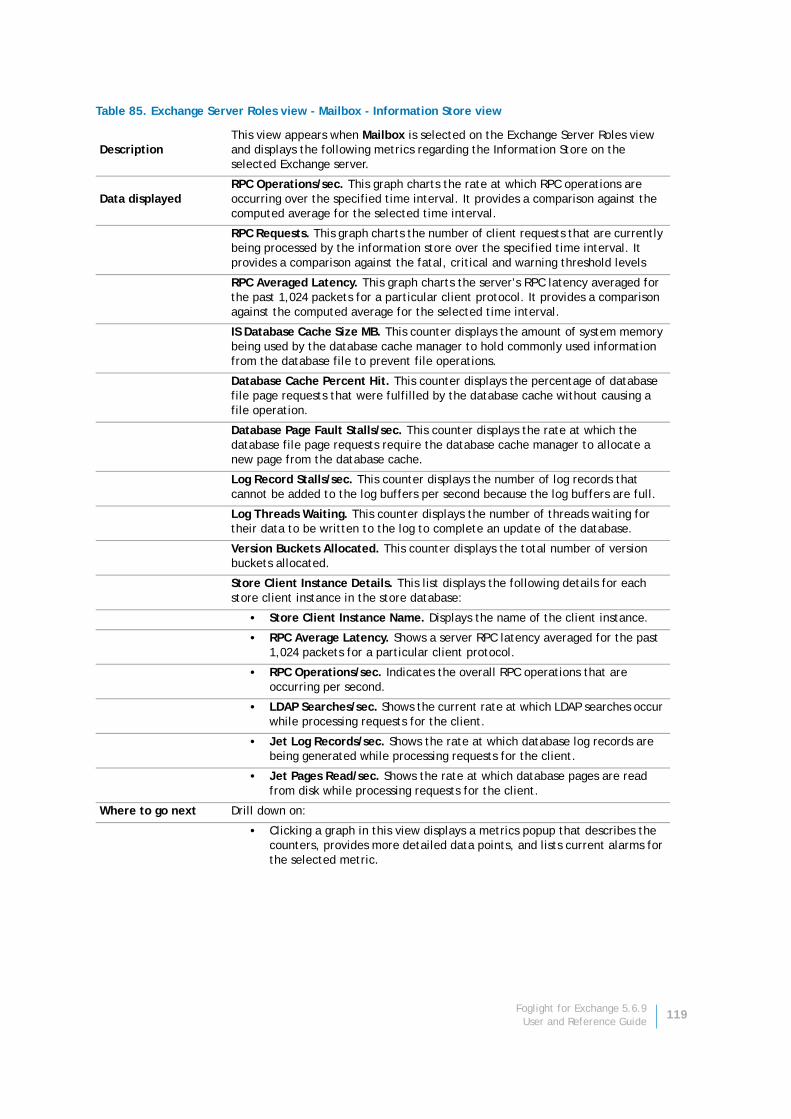
Table 85. Exchange Server Roles view - Mailbox - Information Store view
DescriptionThis view appears when Mailbox is selected on the Exchange Server Roles view and displays the following metrics regarding the Information Store on the selected Exchange server.
Data displayedRPC Operations/sec. This graph charts the rate at which RPC operations are occurring over the specified time interval. It provides a comparison against the computed average for the selected time interval.
RPC Requests. This graph charts the number of client requests that are currently being processed by the information store over the specified time interval. It provides a comparison against the fatal, critical and warning threshold levels
RPC Averaged Latency. This graph charts the server’s RPC latency averaged for the past 1,024 packets for a particular client protocol. It provides a comparison against the computed average for the selected time interval.
IS Database Cache Size MB. This counter displays the amount of system memory being used by the database cache manager to hold commonly used information from the database file to prevent file operations.
Database Cache Percent Hit. This counter displays the percentage of database file page requests that were fulfilled by the database cache without causing a file operation.
Database Page Fault Stalls/sec. This counter displays the rate at which the database file page requests require the database cache manager to allocate a new page from the database cache.
Log Record Stalls/sec. This counter displays the number of log records that cannot be added to the log buffers per second because the log buffers are full.
Log Threads Waiting. This counter displays the number of threads waiting for their data to be written to the log to complete an update of the database.
Version Buckets Allocated. This counter displays the total number of version buckets allocated.
Store Client Instance Details. This list displays the following details for each store client instance in the store database:
• Store Client Instance Name. Displays the name of the client instance.
• RPC Average Latency. Shows a server RPC latency averaged for the past 1,024 packets for a particular client protocol.
• RPC Operations/sec. Indicates the overall RPC operations that are occurring per second.
• LDAP Searches/sec. Shows the current rate at which LDAP searches occur while processing requests for the client.
• Jet Log Records/sec. Shows the rate at which database log records are being generated while processing requests for the client.
• Jet Pages Read/sec. Shows the rate at which database pages are read from disk while processing requests for the client.
Where to go next Drill down on:
• Clicking a graph in this view displays a metrics popup that describes the counters, provides more detailed data points, and lists current alarms for the selected metric.
Foglight for Exchange 5.6.9User and Reference Guide
119
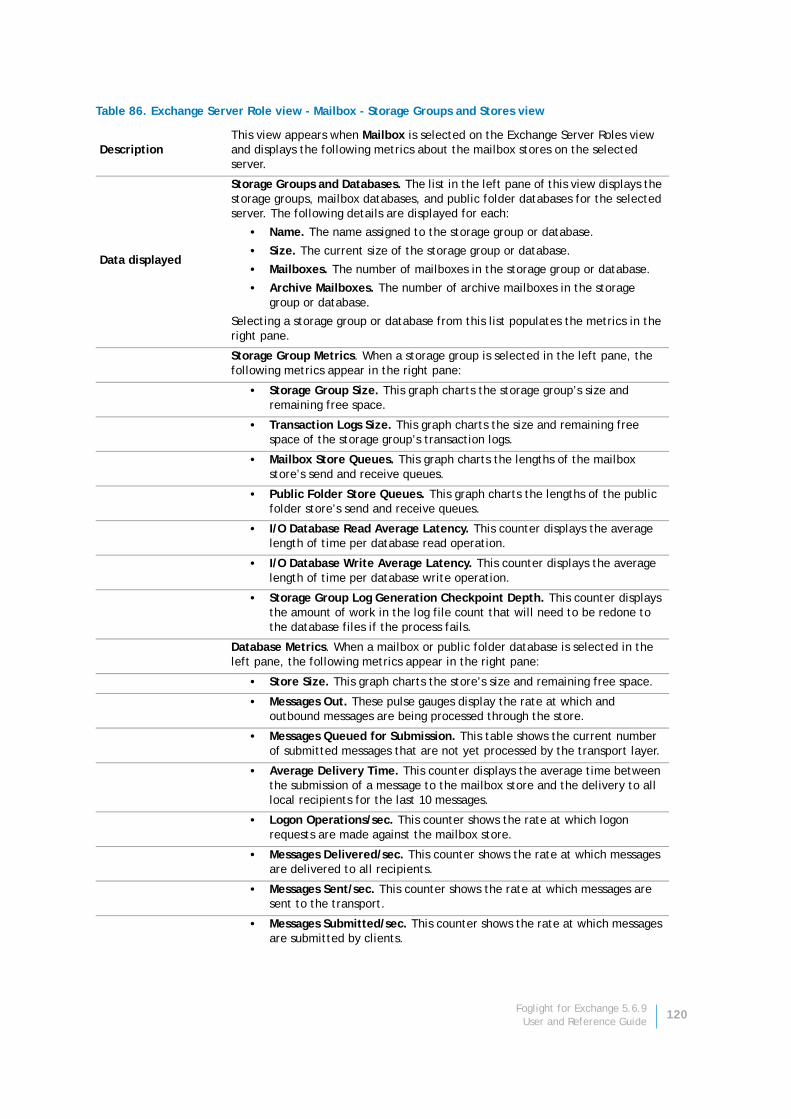
Table 86. Exchange Server Role view - Mailbox - Storage Groups and Stores view
DescriptionThis view appears when Mailbox is selected on the Exchange Server Roles view and displays the following metrics about the mailbox stores on the selected server.
Data displayed
Storage Groups and Databases. The list in the left pane of this view displays the storage groups, mailbox databases, and public folder databases for the selected server. The following details are displayed for each:
• Name. The name assigned to the storage group or database.
• Size. The current size of the storage group or database.
• Mailboxes. The number of mailboxes in the storage group or database.
• Archive Mailboxes. The number of archive mailboxes in the storage group or database.
Selecting a storage group or database from this list populates the metrics in the right pane.
Storage Group Metrics. When a storage group is selected in the left pane, the following metrics appear in the right pane:
• Storage Group Size. This graph charts the storage group’s size and remaining free space.
• Transaction Logs Size. This graph charts the size and remaining free space of the storage group’s transaction logs.
• Mailbox Store Queues. This graph charts the lengths of the mailbox store’s send and receive queues.
• Public Folder Store Queues. This graph charts the lengths of the public folder store’s send and receive queues.
• I/O Database Read Average Latency. This counter displays the average length of time per database read operation.
• I/O Database Write Average Latency. This counter displays the average length of time per database write operation.
• Storage Group Log Generation Checkpoint Depth. This counter displays the amount of work in the log file count that will need to be redone to the database files if the process fails.
Database Metrics. When a mailbox or public folder database is selected in the left pane, the following metrics appear in the right pane:
• Store Size. This graph charts the store’s size and remaining free space.
• Messages Out. These pulse gauges display the rate at which and outbound messages are being processed through the store.
• Messages Queued for Submission. This table shows the current number of submitted messages that are not yet processed by the transport layer.
• Average Delivery Time. This counter displays the average time between the submission of a message to the mailbox store and the delivery to all local recipients for the last 10 messages.
• Logon Operations/sec. This counter shows the rate at which logon requests are made against the mailbox store.
• Messages Delivered/sec. This counter shows the rate at which messages are delivered to all recipients.
• Messages Sent/sec. This counter shows the rate at which messages are sent to the transport.
• Messages Submitted/sec. This counter shows the rate at which messages are submitted by clients.
Foglight for Exchange 5.6.9User and Reference Guide
120
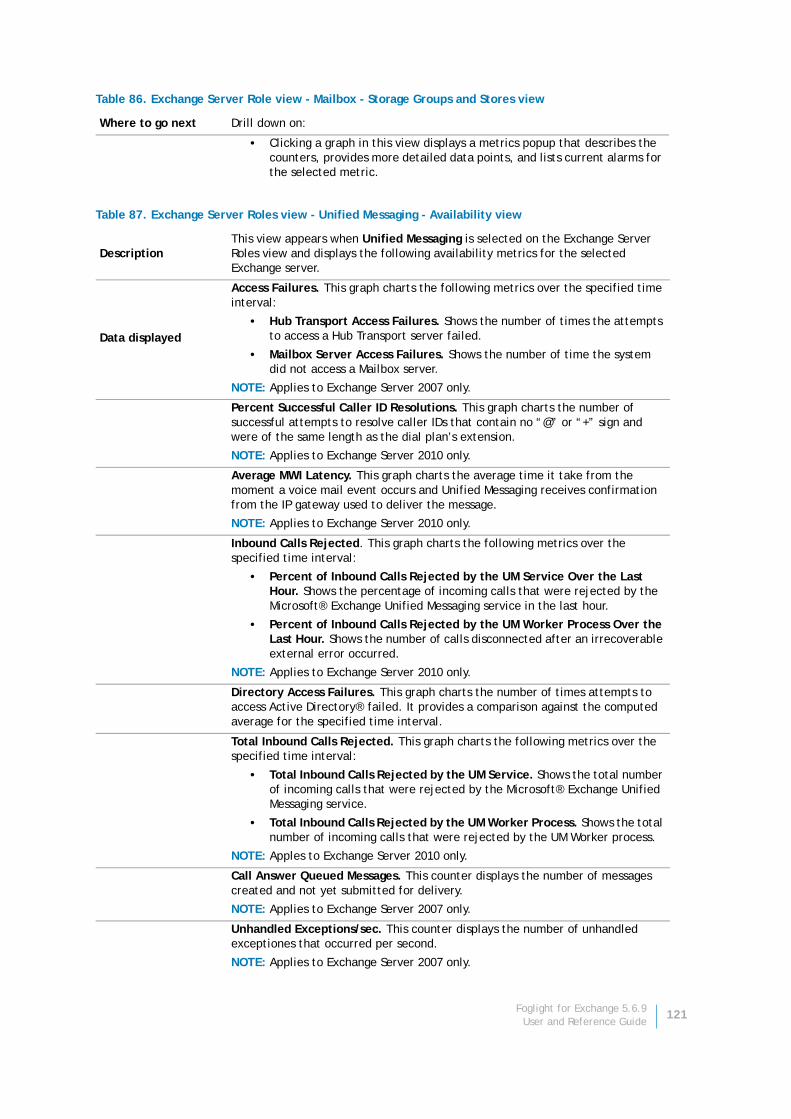
Where to go next Drill down on:
• Clicking a graph in this view displays a metrics popup that describes the counters, provides more detailed data points, and lists current alarms for the selected metric.
Table 87. Exchange Server Roles view - Unified Messaging - Availability view
DescriptionThis view appears when Unified Messaging is selected on the Exchange Server Roles view and displays the following availability metrics for the selected Exchange server.
Data displayed
Access Failures. This graph charts the following metrics over the specified time interval:
• Hub Transport Access Failures. Shows the number of times the attempts to access a Hub Transport server failed.
• Mailbox Server Access Failures. Shows the number of time the system did not access a Mailbox server.
NOTE: Applies to Exchange Server 2007 only.
Percent Successful Caller ID Resolutions. This graph charts the number of successful attempts to resolve caller IDs that contain no “@” or “+” sign and were of the same length as the dial plan’s extension.
NOTE: Applies to Exchange Server 2010 only.
Average MWI Latency. This graph charts the average time it take from the moment a voice mail event occurs and Unified Messaging receives confirmation from the IP gateway used to deliver the message.
NOTE: Applies to Exchange Server 2010 only.
Inbound Calls Rejected. This graph charts the following metrics over the specified time interval:
• Percent of Inbound Calls Rejected by the UM Service Over the Last Hour. Shows the percentage of incoming calls that were rejected by the Microsoft® Exchange Unified Messaging service in the last hour.
• Percent of Inbound Calls Rejected by the UM Worker Process Over the Last Hour. Shows the number of calls disconnected after an irrecoverable external error occurred.
NOTE: Applies to Exchange Server 2010 only.
Directory Access Failures. This graph charts the number of times attempts to access Active Directory® failed. It provides a comparison against the computed average for the specified time interval.
Total Inbound Calls Rejected. This graph charts the following metrics over the specified time interval:
• Total Inbound Calls Rejected by the UM Service. Shows the total number of incoming calls that were rejected by the Microsoft® Exchange Unified Messaging service.
• Total Inbound Calls Rejected by the UM Worker Process. Shows the total number of incoming calls that were rejected by the UM Worker process.
NOTE: Apples to Exchange Server 2010 only.
Call Answer Queued Messages. This counter displays the number of messages created and not yet submitted for delivery.
NOTE: Applies to Exchange Server 2007 only.
Unhandled Exceptions/sec. This counter displays the number of unhandled exceptiones that occurred per second.
NOTE: Applies to Exchange Server 2007 only.
Table 86. Exchange Server Role view - Mailbox - Storage Groups and Stores view
Foglight for Exchange 5.6.9User and Reference Guide
121

Exchange Servers in This Cluster viewThis embedded view is part of the Exchange Cluster Explorer Summary when an individual cluster object is selected in the Exchange Infrastructure view on the Exchange Explorer dashboard. .
Percent of Failed Mailbox Connection Attempts Over the Last Hour. This counter displays the percentage of mailbox connection attempts that failed in the last hour.
NOTE: Apples to Exchange Server 2010 only.
Percent of Messages Successfully Processed Over the Last Hour. This counter displays the percentage of messages that were successfully processed by the Microsoft® Exchange Unified Messaging service in the last hour.
NOTE: Applies to Exchange Server 2010 only.
Percent of Partner Voice Message Transcription Failures Over the Last Hour. This counter displays the percentage of partner voice message transcription failures in the last hour.
NOTE: Applies to Exchange Server 2010 only.
Where to go next Drill down on:
• Clicking a graph in this view displays a metrics popup that describes the counters, provides more detailed data points, and lists current alarms for the selected metric.
Table 88. Exchange Servers in This Cluster view
DescriptionThis sortable list contains the following information for each Exchange server in the selected cluster.
Data displayed • State. Indicates the highest alarm triggered for each server.
• Name. Displays the name of each Exchange server.
• IP Address. Displays the IP address of each server.
• Roles. Displays the Exchange roles being performed by each server.
NOTE: Multi-Role indicates that the server is performing multiple Exchange roles. Hover your cursor over the Multi-Role entry to display a list of the roles being performed by the server.
• CPU. Displays the current CPU utilization on the server.
• Memory. Displays the current memory utilization on the server.
• Exchange Version. Displays the version of Exchange installed on each server.
• Operating System. Displays the Windows® operating system running on the server.
• Repl Svc. Indicates the current state of the replication service.
• Clus Svc. Indicates the current state of the cluster service.
Where to go next Drill down on:
• Exchange Server row. Displays the Exchange Server Explorer Summary view for the selected server.
Table 87. Exchange Server Roles view - Unified Messaging - Availability view
Foglight for Exchange 5.6.9User and Reference Guide
122
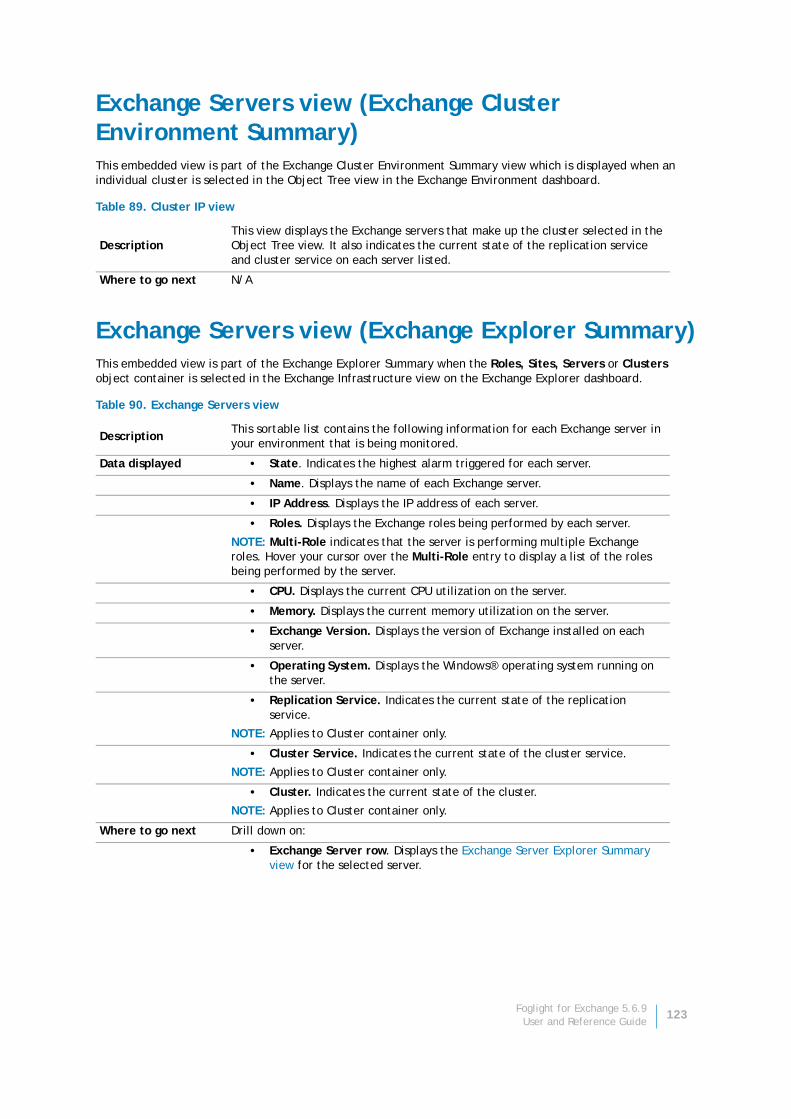
Exchange Servers view (Exchange Cluster Environment Summary)This embedded view is part of the Exchange Cluster Environment Summary view which is displayed when an individual cluster is selected in the Object Tree view in the Exchange Environment dashboard.
Exchange Servers view (Exchange Explorer Summary)This embedded view is part of the Exchange Explorer Summary when the Roles, Sites, Servers or Clusters object container is selected in the Exchange Infrastructure view on the Exchange Explorer dashboard.
Table 89. Cluster IP view
DescriptionThis view displays the Exchange servers that make up the cluster selected in the Object Tree view. It also indicates the current state of the replication service and cluster service on each server listed.
Where to go next N/A
Table 90. Exchange Servers view
DescriptionThis sortable list contains the following information for each Exchange server in your environment that is being monitored.
Data displayed • State. Indicates the highest alarm triggered for each server.
• Name. Displays the name of each Exchange server.
• IP Address. Displays the IP address of each server.
• Roles. Displays the Exchange roles being performed by each server.
NOTE: Multi-Role indicates that the server is performing multiple Exchange roles. Hover your cursor over the Multi-Role entry to display a list of the roles being performed by the server.
• CPU. Displays the current CPU utilization on the server.
• Memory. Displays the current memory utilization on the server.
• Exchange Version. Displays the version of Exchange installed on each server.
• Operating System. Displays the Windows® operating system running on the server.
• Replication Service. Indicates the current state of the replication service.
NOTE: Applies to Cluster container only.
• Cluster Service. Indicates the current state of the cluster service.
NOTE: Applies to Cluster container only.
• Cluster. Indicates the current state of the cluster.
NOTE: Applies to Cluster container only.
Where to go next Drill down on:
• Exchange Server row. Displays the Exchange Server Explorer Summary view for the selected server.
Foglight for Exchange 5.6.9User and Reference Guide
123
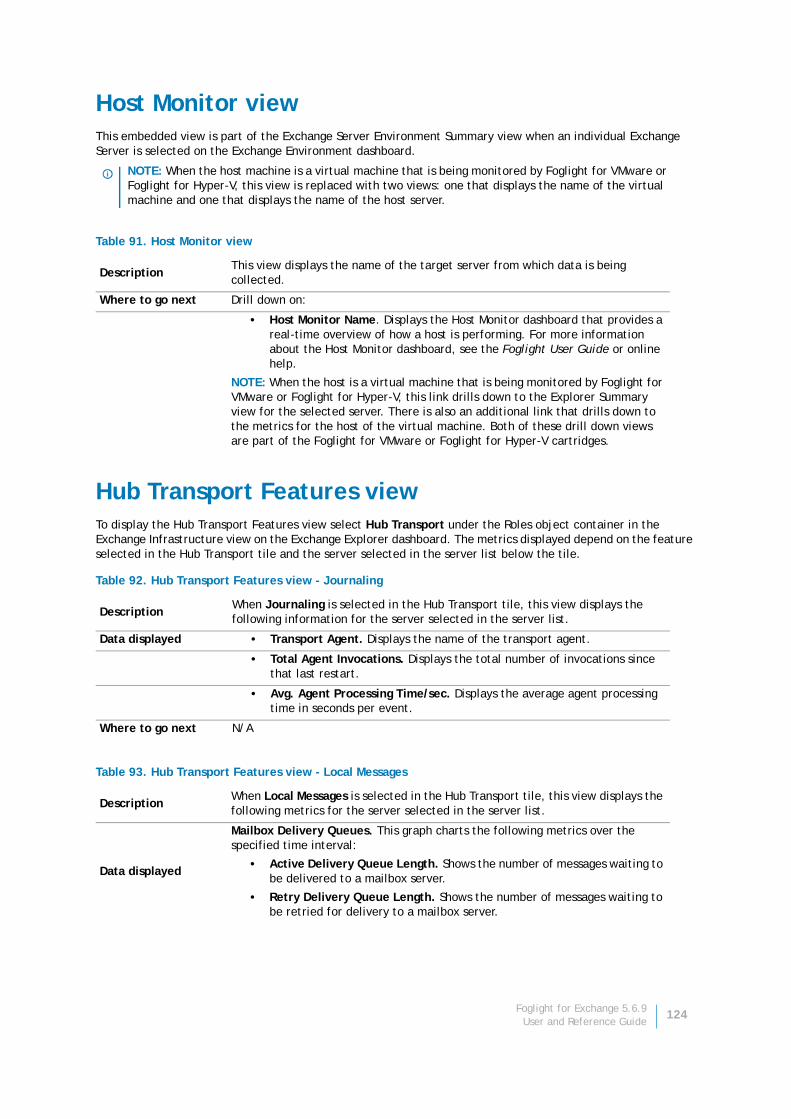
Host Monitor viewThis embedded view is part of the Exchange Server Environment Summary view when an individual Exchange Server is selected on the Exchange Environment dashboard.
Hub Transport Features viewTo display the Hub Transport Features view select Hub Transport under the Roles object container in the Exchange Infrastructure view on the Exchange Explorer dashboard. The metrics displayed depend on the feature selected in the Hub Transport tile and the server selected in the server list below the tile.
NOTE: When the host machine is a virtual machine that is being monitored by Foglight for VMware or Foglight for Hyper-V, this view is replaced with two views: one that displays the name of the virtual machine and one that displays the name of the host server.
Table 91. Host Monitor view
DescriptionThis view displays the name of the target server from which data is being collected.
Where to go next Drill down on:
• Host Monitor Name. Displays the Host Monitor dashboard that provides a real-time overview of how a host is performing. For more information about the Host Monitor dashboard, see the Foglight User Guide or online help.
NOTE: When the host is a virtual machine that is being monitored by Foglight for VMware or Foglight for Hyper-V, this link drills down to the Explorer Summary view for the selected server. There is also an additional link that drills down to the metrics for the host of the virtual machine. Both of these drill down views are part of the Foglight for VMware or Foglight for Hyper-V cartridges.
Table 92. Hub Transport Features view - Journaling
DescriptionWhen Journaling is selected in the Hub Transport tile, this view displays the following information for the server selected in the server list.
Data displayed • Transport Agent. Displays the name of the transport agent.
• Total Agent Invocations. Displays the total number of invocations since that last restart.
• Avg. Agent Processing Time/sec. Displays the average agent processing time in seconds per event.
Where to go next N/A
Table 93. Hub Transport Features view - Local Messages
DescriptionWhen Local Messages is selected in the Hub Transport tile, this view displays the following metrics for the server selected in the server list.
Data displayed
Mailbox Delivery Queues. This graph charts the following metrics over the specified time interval:
• Active Delivery Queue Length. Shows the number of messages waiting to be delivered to a mailbox server.
• Retry Delivery Queue Length. Shows the number of messages waiting to be retried for delivery to a mailbox server.
Foglight for Exchange 5.6.9User and Reference Guide
124
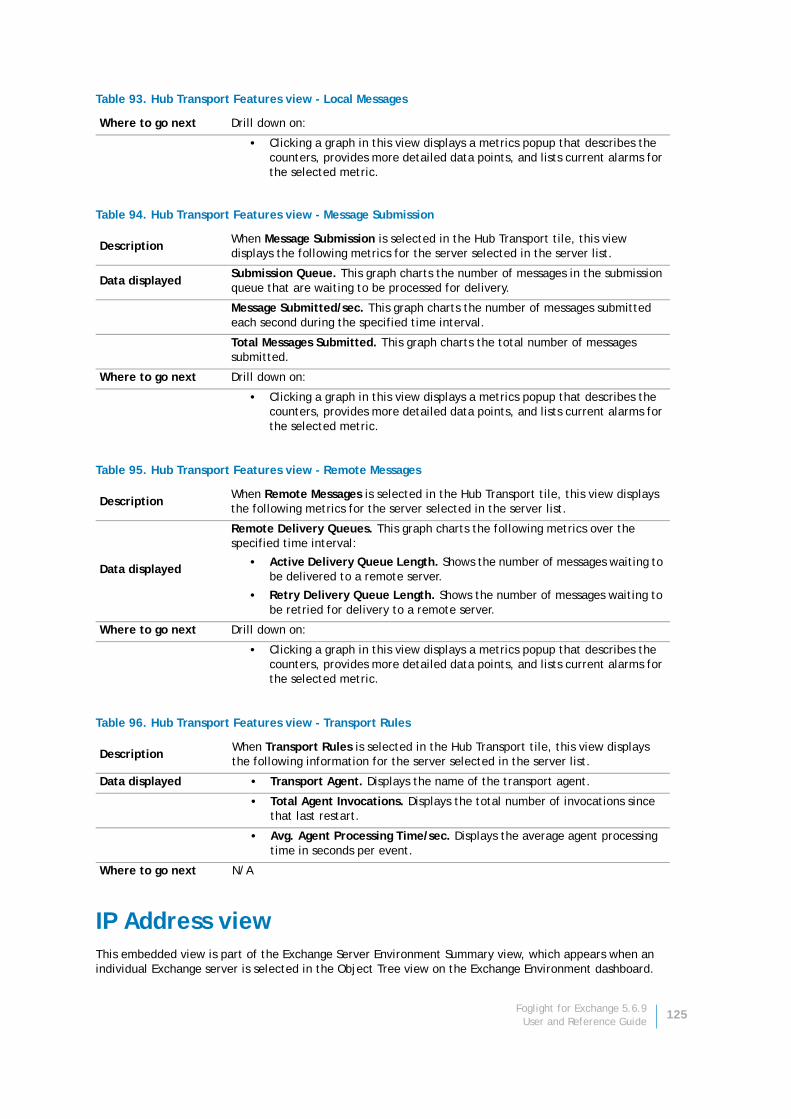
IP Address viewThis embedded view is part of the Exchange Server Environment Summary view, which appears when an individual Exchange server is selected in the Object Tree view on the Exchange Environment dashboard.
Where to go next Drill down on:
• Clicking a graph in this view displays a metrics popup that describes the counters, provides more detailed data points, and lists current alarms for the selected metric.
Table 94. Hub Transport Features view - Message Submission
DescriptionWhen Message Submission is selected in the Hub Transport tile, this view displays the following metrics for the server selected in the server list.
Data displayedSubmission Queue. This graph charts the number of messages in the submission queue that are waiting to be processed for delivery.
Message Submitted/sec. This graph charts the number of messages submitted each second during the specified time interval.
Total Messages Submitted. This graph charts the total number of messages submitted.
Where to go next Drill down on:
• Clicking a graph in this view displays a metrics popup that describes the counters, provides more detailed data points, and lists current alarms for the selected metric.
Table 95. Hub Transport Features view - Remote Messages
DescriptionWhen Remote Messages is selected in the Hub Transport tile, this view displays the following metrics for the server selected in the server list.
Data displayed
Remote Delivery Queues. This graph charts the following metrics over the specified time interval:
• Active Delivery Queue Length. Shows the number of messages waiting to be delivered to a remote server.
• Retry Delivery Queue Length. Shows the number of messages waiting to be retried for delivery to a remote server.
Where to go next Drill down on:
• Clicking a graph in this view displays a metrics popup that describes the counters, provides more detailed data points, and lists current alarms for the selected metric.
Table 96. Hub Transport Features view - Transport Rules
DescriptionWhen Transport Rules is selected in the Hub Transport tile, this view displays the following information for the server selected in the server list.
Data displayed • Transport Agent. Displays the name of the transport agent.
• Total Agent Invocations. Displays the total number of invocations since that last restart.
• Avg. Agent Processing Time/sec. Displays the average agent processing time in seconds per event.
Where to go next N/A
Table 93. Hub Transport Features view - Local Messages
Foglight for Exchange 5.6.9User and Reference Guide
125
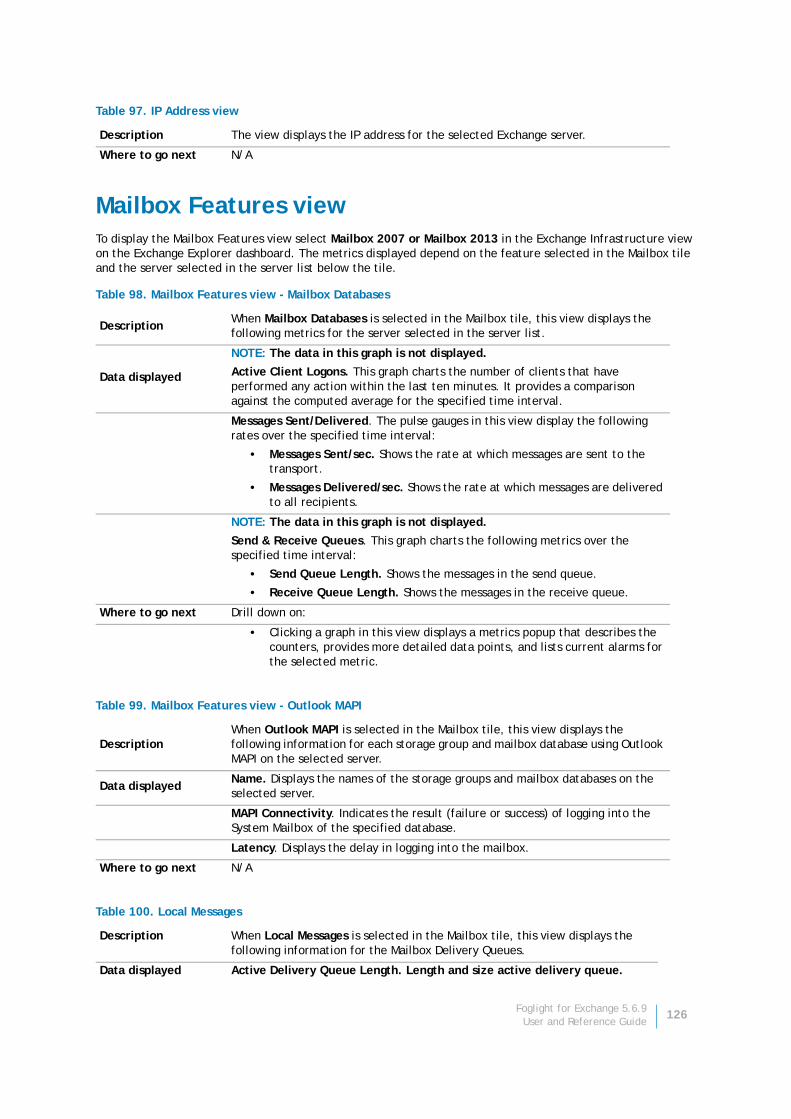
Mailbox Features viewTo display the Mailbox Features view select Mailbox 2007 or Mailbox 2013 in the Exchange Infrastructure view on the Exchange Explorer dashboard. The metrics displayed depend on the feature selected in the Mailbox tile and the server selected in the server list below the tile.
Table 97. IP Address view
Description The view displays the IP address for the selected Exchange server.
Where to go next N/A
Table 98. Mailbox Features view - Mailbox Databases
DescriptionWhen Mailbox Databases is selected in the Mailbox tile, this view displays the following metrics for the server selected in the server list.
Data displayed
NOTE: The data in this graph is not displayed.
Active Client Logons. This graph charts the number of clients that have performed any action within the last ten minutes. It provides a comparison against the computed average for the specified time interval.
Messages Sent/Delivered. The pulse gauges in this view display the following rates over the specified time interval:
• Messages Sent/sec. Shows the rate at which messages are sent to the transport.
• Messages Delivered/sec. Shows the rate at which messages are delivered to all recipients.
NOTE: The data in this graph is not displayed.
Send & Receive Queues. This graph charts the following metrics over the specified time interval:
• Send Queue Length. Shows the messages in the send queue.
• Receive Queue Length. Shows the messages in the receive queue.
Where to go next Drill down on:
• Clicking a graph in this view displays a metrics popup that describes the counters, provides more detailed data points, and lists current alarms for the selected metric.
Table 99. Mailbox Features view - Outlook MAPI
DescriptionWhen Outlook MAPI is selected in the Mailbox tile, this view displays the following information for each storage group and mailbox database using Outlook MAPI on the selected server.
Data displayedName. Displays the names of the storage groups and mailbox databases on the selected server.
MAPI Connectivity. Indicates the result (failure or success) of logging into the System Mailbox of the specified database.
Latency. Displays the delay in logging into the mailbox.
Where to go next N/A
Table 100. Local Messages
Description When Local Messages is selected in the Mailbox tile, this view displays the following information for the Mailbox Delivery Queues.
Data displayed Active Delivery Queue Length. Length and size active delivery queue.
Foglight for Exchange 5.6.9User and Reference Guide
126
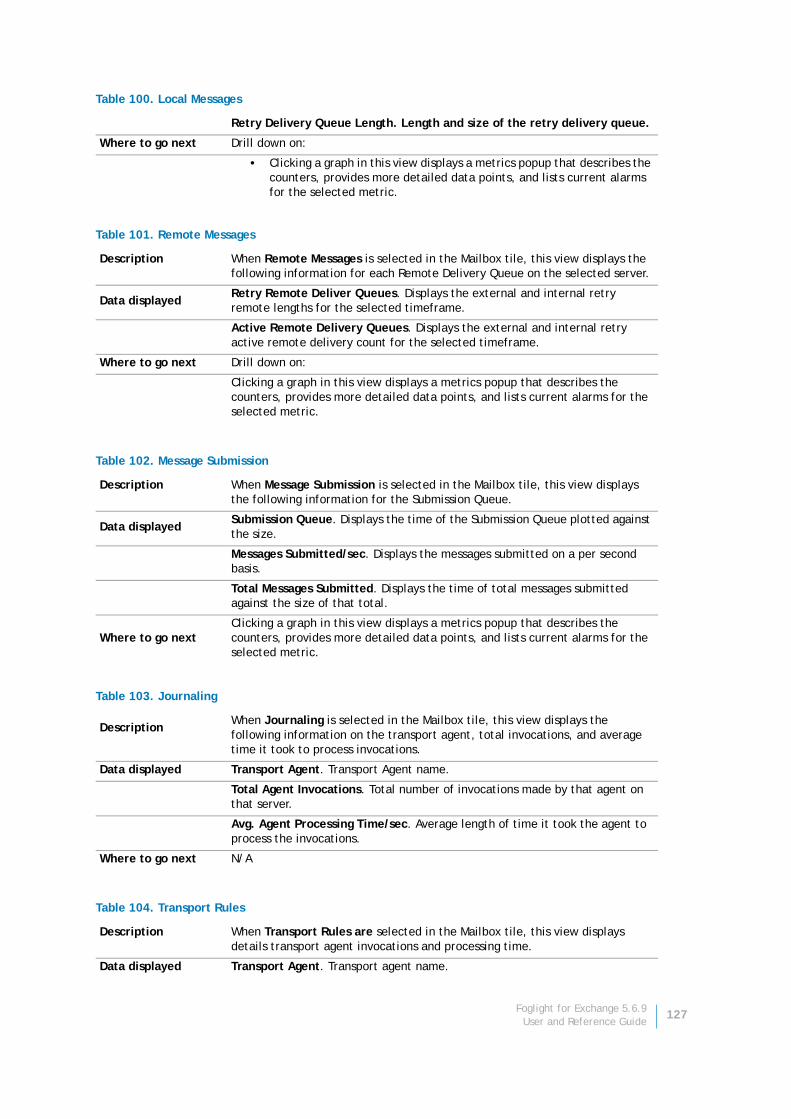
Retry Delivery Queue Length. Length and size of the retry delivery queue.
Where to go next Drill down on:
• Clicking a graph in this view displays a metrics popup that describes the counters, provides more detailed data points, and lists current alarms for the selected metric.
Table 101. Remote Messages
Description When Remote Messages is selected in the Mailbox tile, this view displays the following information for each Remote Delivery Queue on the selected server.
Data displayedRetry Remote Deliver Queues. Displays the external and internal retry remote lengths for the selected timeframe.
Active Remote Delivery Queues. Displays the external and internal retry active remote delivery count for the selected timeframe.
Where to go next Drill down on:
Clicking a graph in this view displays a metrics popup that describes the counters, provides more detailed data points, and lists current alarms for the selected metric.
Table 102. Message Submission
Description When Message Submission is selected in the Mailbox tile, this view displays the following information for the Submission Queue.
Data displayedSubmission Queue. Displays the time of the Submission Queue plotted against the size.
Messages Submitted/sec. Displays the messages submitted on a per second basis.
Total Messages Submitted. Displays the time of total messages submitted against the size of that total.
Where to go nextClicking a graph in this view displays a metrics popup that describes the counters, provides more detailed data points, and lists current alarms for the selected metric.
Table 103. Journaling
DescriptionWhen Journaling is selected in the Mailbox tile, this view displays the following information on the transport agent, total invocations, and average time it took to process invocations.
Data displayed Transport Agent. Transport Agent name.
Total Agent Invocations. Total number of invocations made by that agent on that server.
Avg. Agent Processing Time/sec. Average length of time it took the agent to process the invocations.
Where to go next N/A
Table 104. Transport Rules
Description When Transport Rules are selected in the Mailbox tile, this view displays details transport agent invocations and processing time.
Data displayed Transport Agent. Transport agent name.
Table 100. Local Messages
Foglight for Exchange 5.6.9User and Reference Guide
127
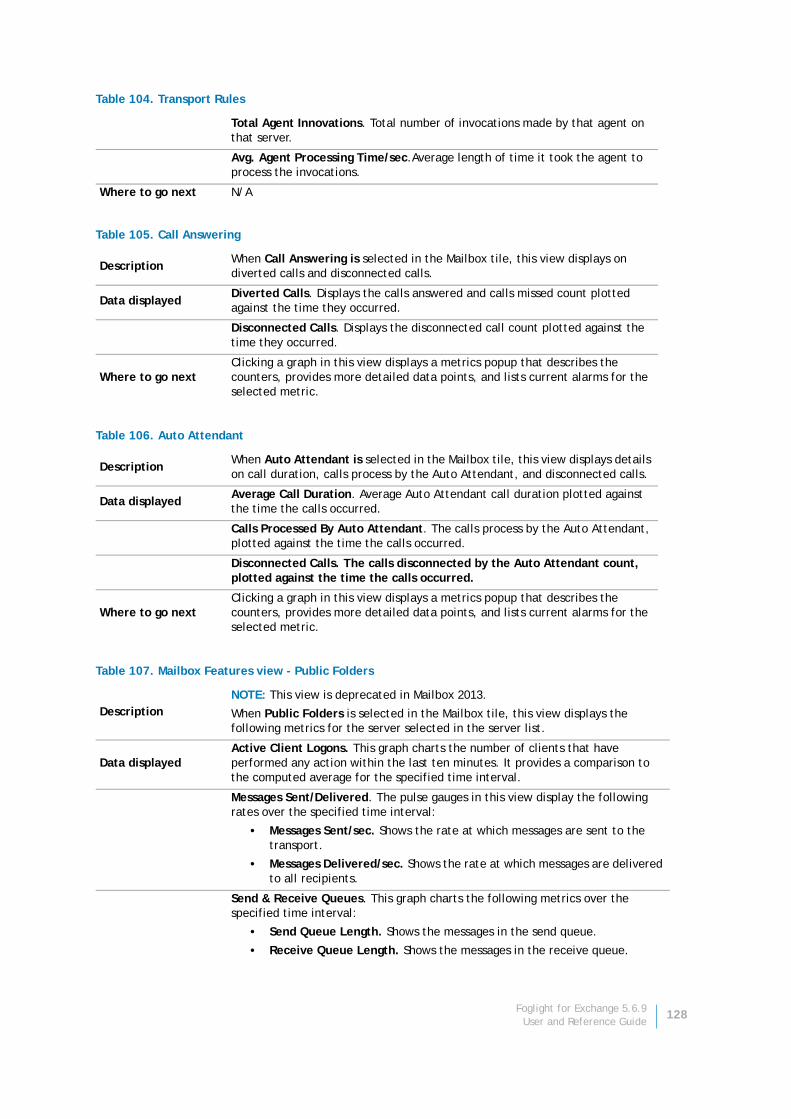
Total Agent Innovations. Total number of invocations made by that agent on that server.
Avg. Agent Processing Time/sec.Average length of time it took the agent to process the invocations.
Where to go next N/A
Table 105. Call Answering
DescriptionWhen Call Answering is selected in the Mailbox tile, this view displays on diverted calls and disconnected calls.
Data displayedDiverted Calls. Displays the calls answered and calls missed count plotted against the time they occurred.
Disconnected Calls. Displays the disconnected call count plotted against the time they occurred.
Where to go nextClicking a graph in this view displays a metrics popup that describes the counters, provides more detailed data points, and lists current alarms for the selected metric.
Table 106. Auto Attendant
DescriptionWhen Auto Attendant is selected in the Mailbox tile, this view displays details on call duration, calls process by the Auto Attendant, and disconnected calls.
Data displayedAverage Call Duration. Average Auto Attendant call duration plotted against the time the calls occurred.
Calls Processed By Auto Attendant. The calls process by the Auto Attendant, plotted against the time the calls occurred.
Disconnected Calls. The calls disconnected by the Auto Attendant count, plotted against the time the calls occurred.
Where to go nextClicking a graph in this view displays a metrics popup that describes the counters, provides more detailed data points, and lists current alarms for the selected metric.
Table 107. Mailbox Features view - Public Folders
DescriptionNOTE: This view is deprecated in Mailbox 2013.
When Public Folders is selected in the Mailbox tile, this view displays the following metrics for the server selected in the server list.
Data displayedActive Client Logons. This graph charts the number of clients that have performed any action within the last ten minutes. It provides a comparison to the computed average for the specified time interval.
Messages Sent/Delivered. The pulse gauges in this view display the following rates over the specified time interval:
• Messages Sent/sec. Shows the rate at which messages are sent to the transport.
• Messages Delivered/sec. Shows the rate at which messages are delivered to all recipients.
Send & Receive Queues. This graph charts the following metrics over the specified time interval:
• Send Queue Length. Shows the messages in the send queue.
• Receive Queue Length. Shows the messages in the receive queue.
Table 104. Transport Rules
Foglight for Exchange 5.6.9User and Reference Guide
128
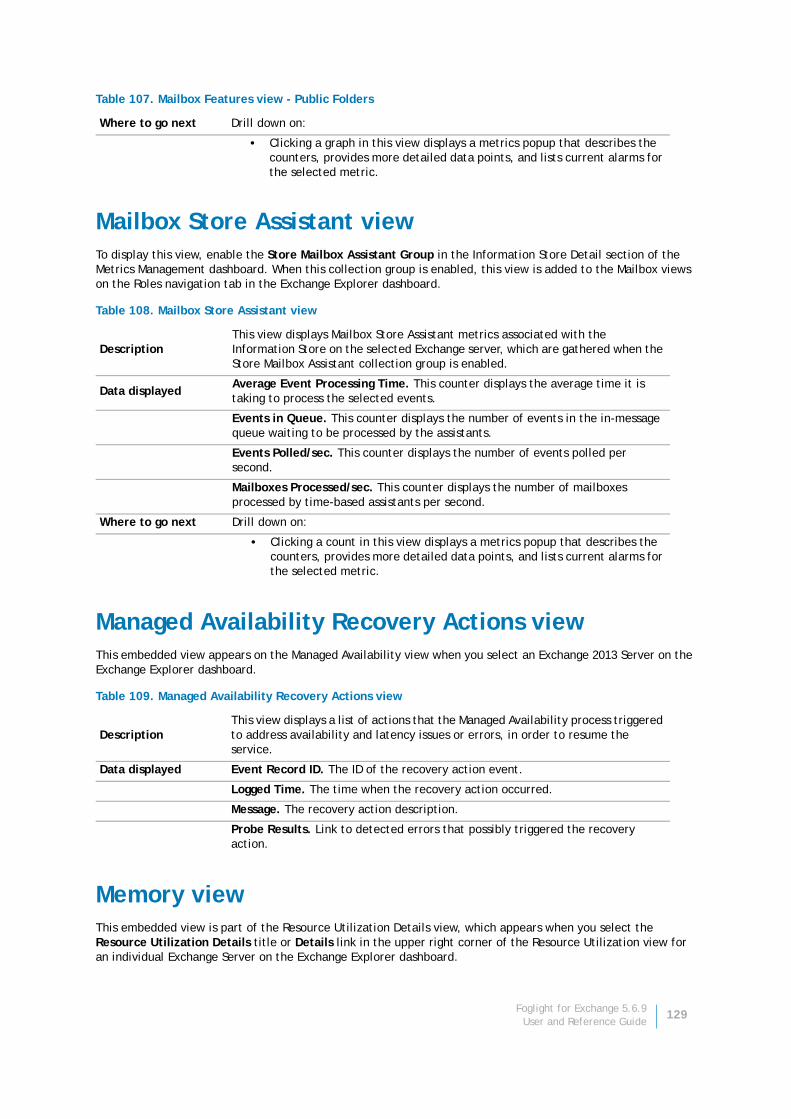
Mailbox Store Assistant viewTo display this view, enable the Store Mailbox Assistant Group in the Information Store Detail section of the Metrics Management dashboard. When this collection group is enabled, this view is added to the Mailbox views on the Roles navigation tab in the Exchange Explorer dashboard.
Managed Availability Recovery Actions viewThis embedded view appears on the Managed Availability view when you select an Exchange 2013 Server on the Exchange Explorer dashboard.
Memory viewThis embedded view is part of the Resource Utilization Details view, which appears when you select the Resource Utilization Details title or Details link in the upper right corner of the Resource Utilization view for an individual Exchange Server on the Exchange Explorer dashboard.
Where to go next Drill down on:
• Clicking a graph in this view displays a metrics popup that describes the counters, provides more detailed data points, and lists current alarms for the selected metric.
Table 108. Mailbox Store Assistant view
DescriptionThis view displays Mailbox Store Assistant metrics associated with the Information Store on the selected Exchange server, which are gathered when the Store Mailbox Assistant collection group is enabled.
Data displayedAverage Event Processing Time. This counter displays the average time it is taking to process the selected events.
Events in Queue. This counter displays the number of events in the in-message queue waiting to be processed by the assistants.
Events Polled/sec. This counter displays the number of events polled per second.
Mailboxes Processed/sec. This counter displays the number of mailboxes processed by time-based assistants per second.
Where to go next Drill down on:
• Clicking a count in this view displays a metrics popup that describes the counters, provides more detailed data points, and lists current alarms for the selected metric.
Table 109. Managed Availability Recovery Actions view
DescriptionThis view displays a list of actions that the Managed Availability process triggered to address availability and latency issues or errors, in order to resume the service.
Data displayed Event Record ID. The ID of the recovery action event.
Logged Time. The time when the recovery action occurred.
Message. The recovery action description.
Probe Results. Link to detected errors that possibly triggered the recovery action.
Table 107. Mailbox Features view - Public Folders
Foglight for Exchange 5.6.9User and Reference Guide
129
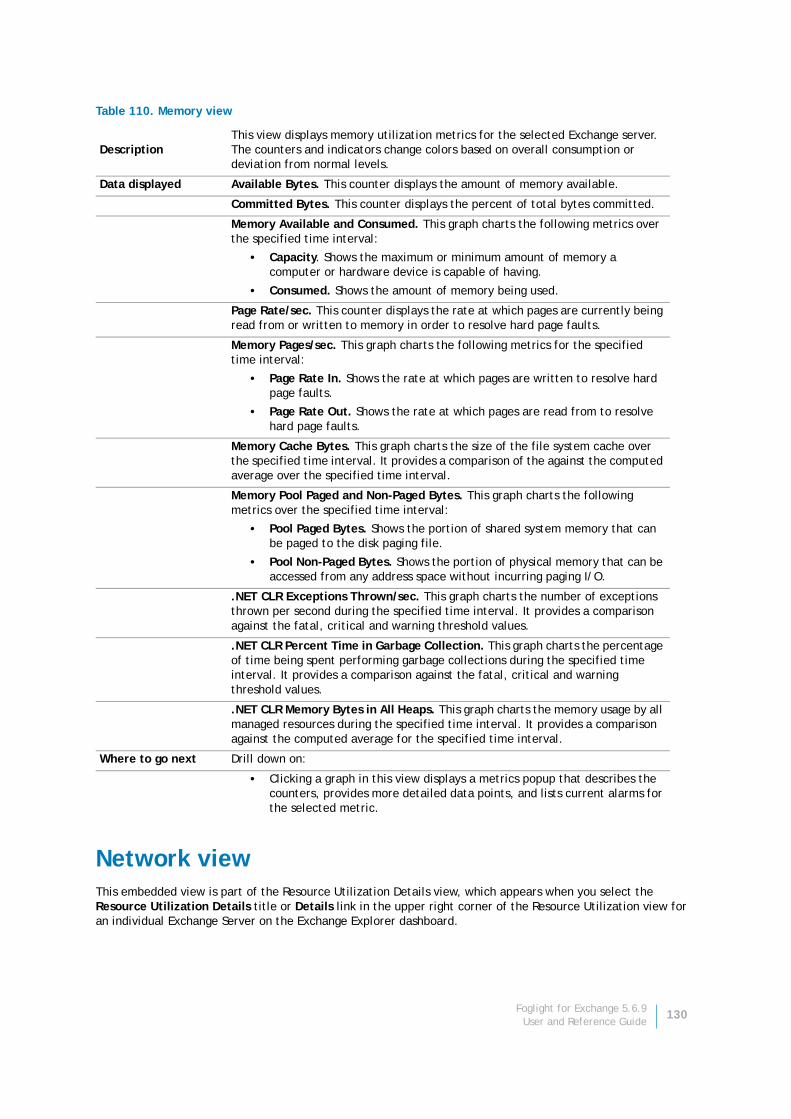
Network viewThis embedded view is part of the Resource Utilization Details view, which appears when you select the Resource Utilization Details title or Details link in the upper right corner of the Resource Utilization view for an individual Exchange Server on the Exchange Explorer dashboard.
Table 110. Memory view
DescriptionThis view displays memory utilization metrics for the selected Exchange server. The counters and indicators change colors based on overall consumption or deviation from normal levels.
Data displayed Available Bytes. This counter displays the amount of memory available.
Committed Bytes. This counter displays the percent of total bytes committed.
Memory Available and Consumed. This graph charts the following metrics over the specified time interval:
• Capacity. Shows the maximum or minimum amount of memory a computer or hardware device is capable of having.
• Consumed. Shows the amount of memory being used.
Page Rate/sec. This counter displays the rate at which pages are currently being read from or written to memory in order to resolve hard page faults.
Memory Pages/sec. This graph charts the following metrics for the specified time interval:
• Page Rate In. Shows the rate at which pages are written to resolve hard page faults.
• Page Rate Out. Shows the rate at which pages are read from to resolve hard page faults.
Memory Cache Bytes. This graph charts the size of the file system cache over the specified time interval. It provides a comparison of the against the computed average over the specified time interval.
Memory Pool Paged and Non-Paged Bytes. This graph charts the following metrics over the specified time interval:
• Pool Paged Bytes. Shows the portion of shared system memory that can be paged to the disk paging file.
• Pool Non-Paged Bytes. Shows the portion of physical memory that can be accessed from any address space without incurring paging I/O.
.NET CLR Exceptions Thrown/sec. This graph charts the number of exceptions thrown per second during the specified time interval. It provides a comparison against the fatal, critical and warning threshold values.
.NET CLR Percent Time in Garbage Collection. This graph charts the percentage of time being spent performing garbage collections during the specified time interval. It provides a comparison against the fatal, critical and warning threshold values.
.NET CLR Memory Bytes in All Heaps. This graph charts the memory usage by all managed resources during the specified time interval. It provides a comparison against the computed average for the specified time interval.
Where to go next Drill down on:
• Clicking a graph in this view displays a metrics popup that describes the counters, provides more detailed data points, and lists current alarms for the selected metric.
Foglight for Exchange 5.6.9User and Reference Guide
130
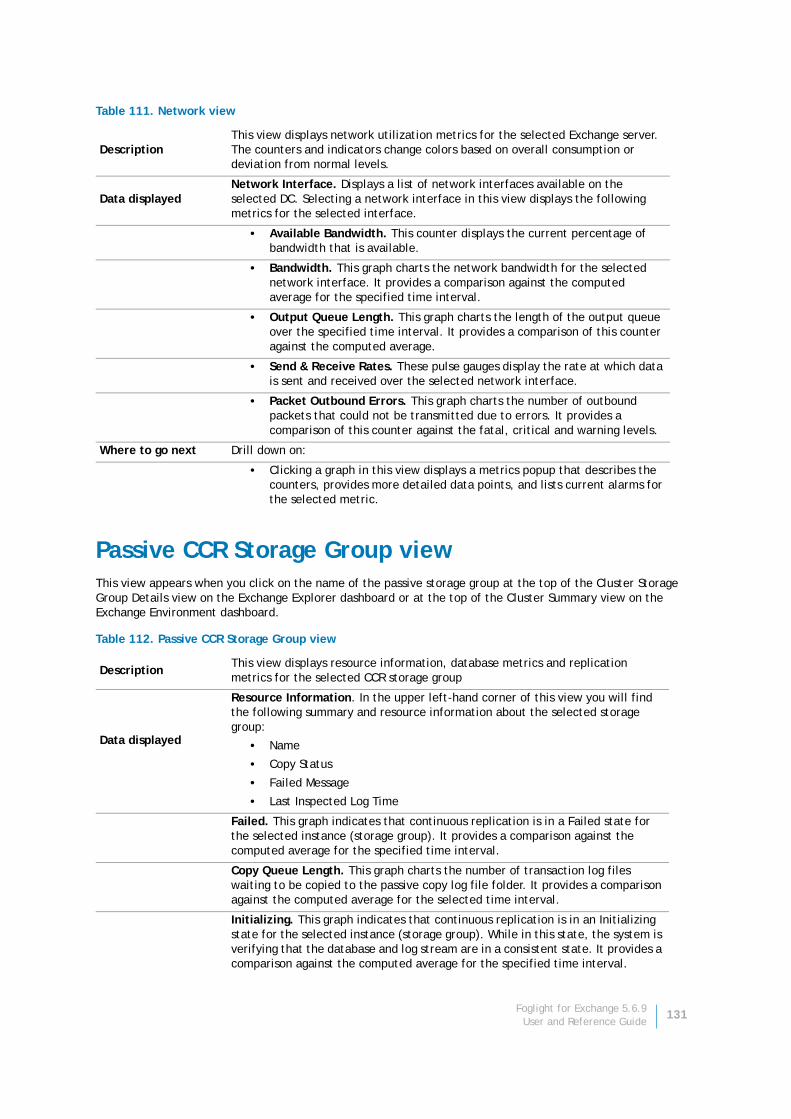
Passive CCR Storage Group viewThis view appears when you click on the name of the passive storage group at the top of the Cluster Storage Group Details view on the Exchange Explorer dashboard or at the top of the Cluster Summary view on the Exchange Environment dashboard.
Table 111. Network view
DescriptionThis view displays network utilization metrics for the selected Exchange server. The counters and indicators change colors based on overall consumption or deviation from normal levels.
Data displayedNetwork Interface. Displays a list of network interfaces available on the selected DC. Selecting a network interface in this view displays the following metrics for the selected interface.
• Available Bandwidth. This counter displays the current percentage of bandwidth that is available.
• Bandwidth. This graph charts the network bandwidth for the selected network interface. It provides a comparison against the computed average for the specified time interval.
• Output Queue Length. This graph charts the length of the output queue over the specified time interval. It provides a comparison of this counter against the computed average.
• Send & Receive Rates. These pulse gauges display the rate at which data is sent and received over the selected network interface.
• Packet Outbound Errors. This graph charts the number of outbound packets that could not be transmitted due to errors. It provides a comparison of this counter against the fatal, critical and warning levels.
Where to go next Drill down on:
• Clicking a graph in this view displays a metrics popup that describes the counters, provides more detailed data points, and lists current alarms for the selected metric.
Table 112. Passive CCR Storage Group view
DescriptionThis view displays resource information, database metrics and replication metrics for the selected CCR storage group
Data displayed
Resource Information. In the upper left-hand corner of this view you will find the following summary and resource information about the selected storage group:
• Name
• Copy Status
• Failed Message
• Last Inspected Log Time
Failed. This graph indicates that continuous replication is in a Failed state for the selected instance (storage group). It provides a comparison against the computed average for the specified time interval.
Copy Queue Length. This graph charts the number of transaction log files waiting to be copied to the passive copy log file folder. It provides a comparison against the computed average for the selected time interval.
Initializing. This graph indicates that continuous replication is in an Initializing state for the selected instance (storage group). While in this state, the system is verifying that the database and log stream are in a consistent state. It provides a comparison against the computed average for the specified time interval.
Foglight for Exchange 5.6.9User and Reference Guide
131
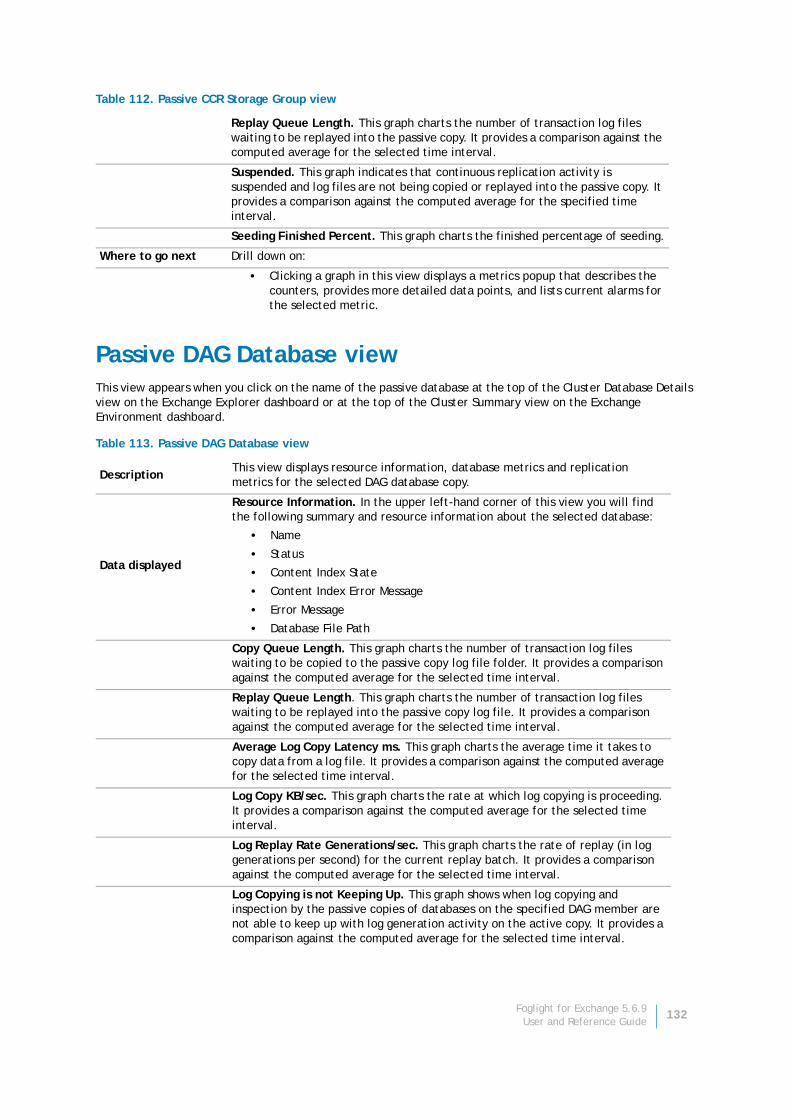
Passive DAG Database viewThis view appears when you click on the name of the passive database at the top of the Cluster Database Details view on the Exchange Explorer dashboard or at the top of the Cluster Summary view on the Exchange Environment dashboard.
Replay Queue Length. This graph charts the number of transaction log files waiting to be replayed into the passive copy. It provides a comparison against the computed average for the selected time interval.
Suspended. This graph indicates that continuous replication activity is suspended and log files are not being copied or replayed into the passive copy. It provides a comparison against the computed average for the specified time interval.
Seeding Finished Percent. This graph charts the finished percentage of seeding.
Where to go next Drill down on:
• Clicking a graph in this view displays a metrics popup that describes the counters, provides more detailed data points, and lists current alarms for the selected metric.
Table 113. Passive DAG Database view
DescriptionThis view displays resource information, database metrics and replication metrics for the selected DAG database copy.
Data displayed
Resource Information. In the upper left-hand corner of this view you will find the following summary and resource information about the selected database:
• Name
• Status
• Content Index State
• Content Index Error Message
• Error Message
• Database File Path
Copy Queue Length. This graph charts the number of transaction log files waiting to be copied to the passive copy log file folder. It provides a comparison against the computed average for the selected time interval.
Replay Queue Length. This graph charts the number of transaction log files waiting to be replayed into the passive copy log file. It provides a comparison against the computed average for the selected time interval.
Average Log Copy Latency ms. This graph charts the average time it takes to copy data from a log file. It provides a comparison against the computed average for the selected time interval.
Log Copy KB/sec. This graph charts the rate at which log copying is proceeding. It provides a comparison against the computed average for the selected time interval.
Log Replay Rate Generations/sec. This graph charts the rate of replay (in log generations per second) for the current replay batch. It provides a comparison against the computed average for the selected time interval.
Log Copying is not Keeping Up. This graph shows when log copying and inspection by the passive copies of databases on the specified DAG member are not able to keep up with log generation activity on the active copy. It provides a comparison against the computed average for the selected time interval.
Table 112. Passive CCR Storage Group view
Foglight for Exchange 5.6.9User and Reference Guide
132
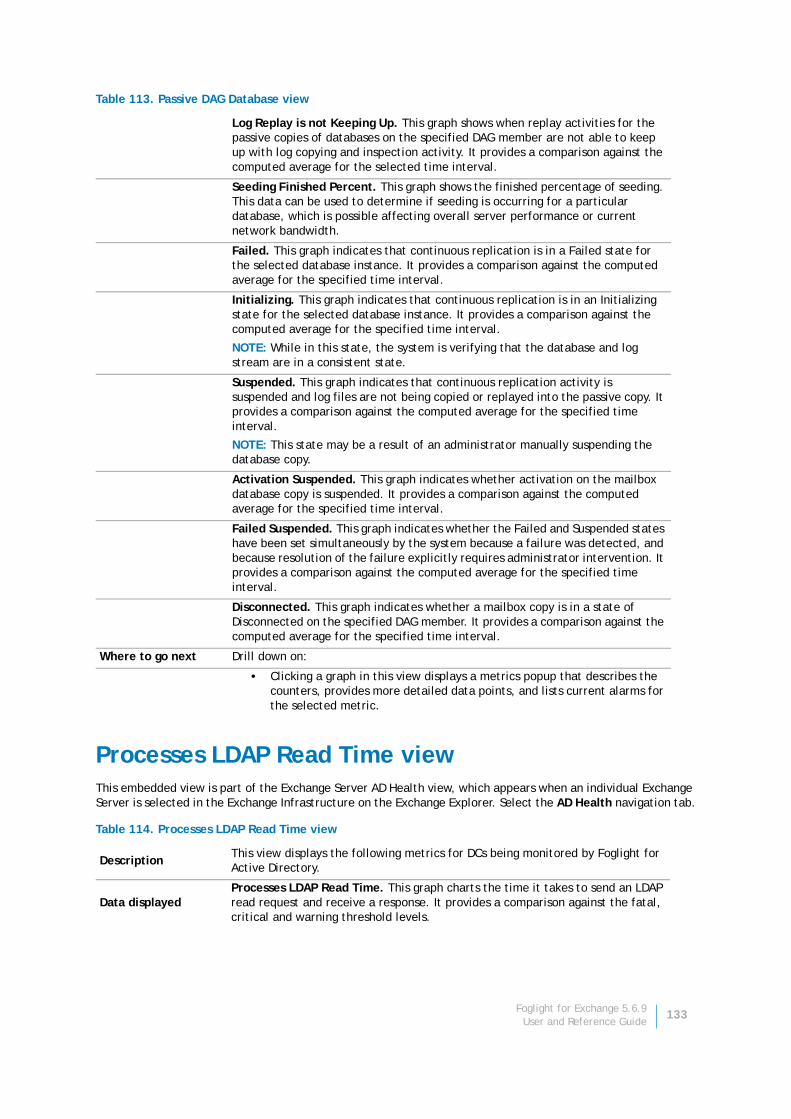
Processes LDAP Read Time viewThis embedded view is part of the Exchange Server AD Health view, which appears when an individual Exchange Server is selected in the Exchange Infrastructure on the Exchange Explorer. Select the AD Health navigation tab.
Log Replay is not Keeping Up. This graph shows when replay activities for the passive copies of databases on the specified DAG member are not able to keep up with log copying and inspection activity. It provides a comparison against the computed average for the selected time interval.
Seeding Finished Percent. This graph shows the finished percentage of seeding. This data can be used to determine if seeding is occurring for a particular database, which is possible affecting overall server performance or current network bandwidth.
Failed. This graph indicates that continuous replication is in a Failed state for the selected database instance. It provides a comparison against the computed average for the specified time interval.
Initializing. This graph indicates that continuous replication is in an Initializing state for the selected database instance. It provides a comparison against the computed average for the specified time interval.
NOTE: While in this state, the system is verifying that the database and log stream are in a consistent state.
Suspended. This graph indicates that continuous replication activity is suspended and log files are not being copied or replayed into the passive copy. It provides a comparison against the computed average for the specified time interval.
NOTE: This state may be a result of an administrator manually suspending the database copy.
Activation Suspended. This graph indicates whether activation on the mailbox database copy is suspended. It provides a comparison against the computed average for the specified time interval.
Failed Suspended. This graph indicates whether the Failed and Suspended states have been set simultaneously by the system because a failure was detected, and because resolution of the failure explicitly requires administrator intervention. It provides a comparison against the computed average for the specified time interval.
Disconnected. This graph indicates whether a mailbox copy is in a state of Disconnected on the specified DAG member. It provides a comparison against the computed average for the specified time interval.
Where to go next Drill down on:
• Clicking a graph in this view displays a metrics popup that describes the counters, provides more detailed data points, and lists current alarms for the selected metric.
Table 114. Processes LDAP Read Time view
DescriptionThis view displays the following metrics for DCs being monitored by Foglight for Active Directory.
Data displayedProcesses LDAP Read Time. This graph charts the time it takes to send an LDAP read request and receive a response. It provides a comparison against the fatal, critical and warning threshold levels.
Table 113. Passive DAG Database view
Foglight for Exchange 5.6.9User and Reference Guide
133
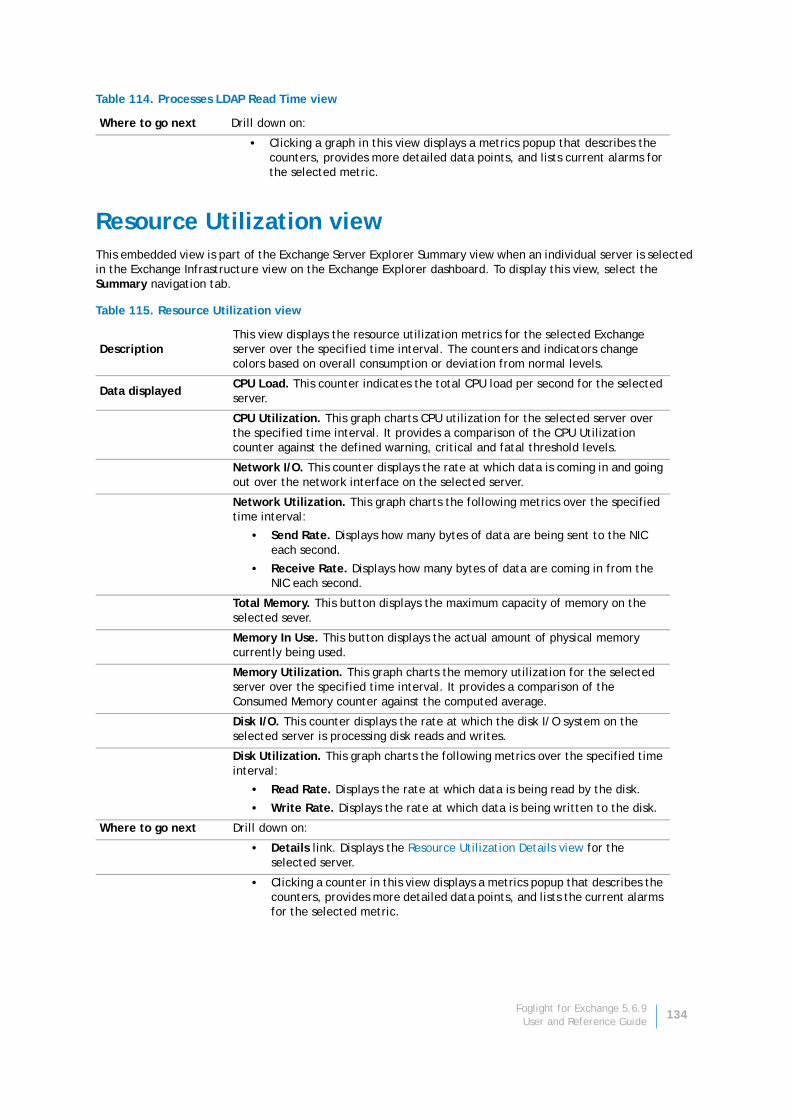
Resource Utilization viewThis embedded view is part of the Exchange Server Explorer Summary view when an individual server is selected in the Exchange Infrastructure view on the Exchange Explorer dashboard. To display this view, select the Summary navigation tab.
Where to go next Drill down on:
• Clicking a graph in this view displays a metrics popup that describes the counters, provides more detailed data points, and lists current alarms for the selected metric.
Table 115. Resource Utilization view
DescriptionThis view displays the resource utilization metrics for the selected Exchange server over the specified time interval. The counters and indicators change colors based on overall consumption or deviation from normal levels.
Data displayedCPU Load. This counter indicates the total CPU load per second for the selected server.
CPU Utilization. This graph charts CPU utilization for the selected server over the specified time interval. It provides a comparison of the CPU Utilization counter against the defined warning, critical and fatal threshold levels.
Network I/O. This counter displays the rate at which data is coming in and going out over the network interface on the selected server.
Network Utilization. This graph charts the following metrics over the specified time interval:
• Send Rate. Displays how many bytes of data are being sent to the NIC each second.
• Receive Rate. Displays how many bytes of data are coming in from the NIC each second.
Total Memory. This button displays the maximum capacity of memory on the selected sever.
Memory In Use. This button displays the actual amount of physical memory currently being used.
Memory Utilization. This graph charts the memory utilization for the selected server over the specified time interval. It provides a comparison of the Consumed Memory counter against the computed average.
Disk I/O. This counter displays the rate at which the disk I/O system on the selected server is processing disk reads and writes.
Disk Utilization. This graph charts the following metrics over the specified time interval:
• Read Rate. Displays the rate at which data is being read by the disk.
• Write Rate. Displays the rate at which data is being written to the disk.
Where to go next Drill down on:
• Details link. Displays the Resource Utilization Details view for the selected server.
• Clicking a counter in this view displays a metrics popup that describes the counters, provides more detailed data points, and lists the current alarms for the selected metric.
Table 114. Processes LDAP Read Time view
Foglight for Exchange 5.6.9User and Reference Guide
134
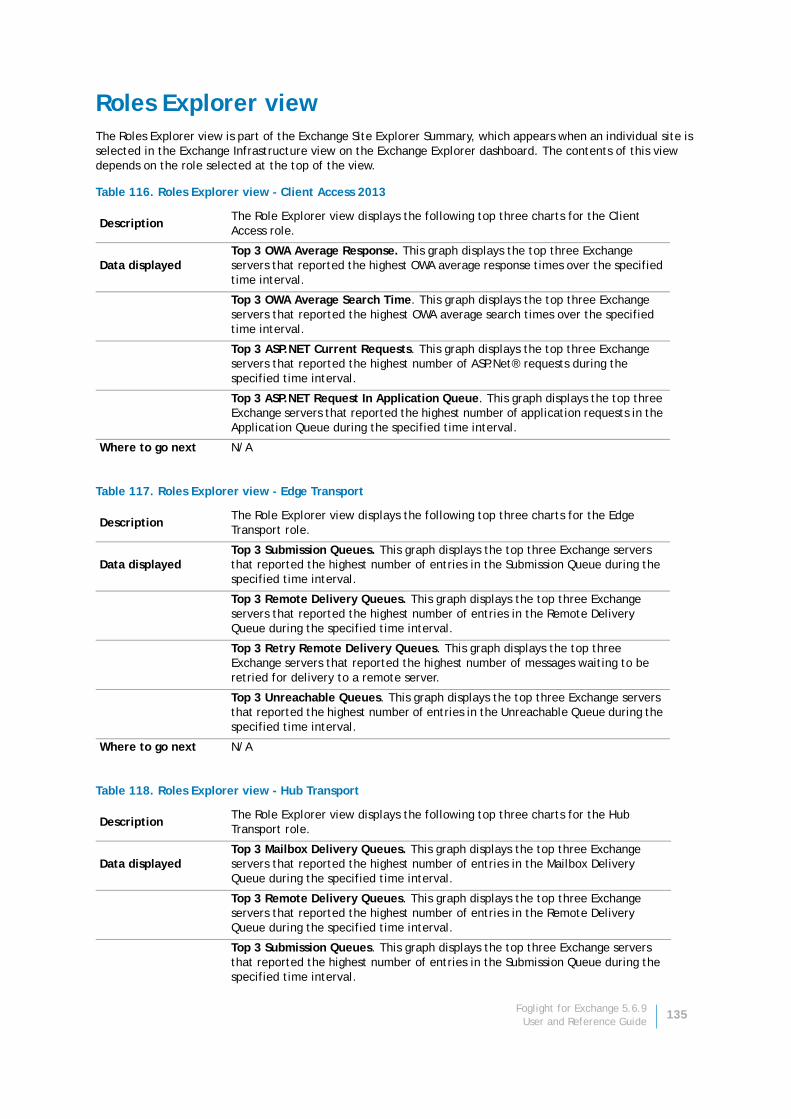
Roles Explorer viewThe Roles Explorer view is part of the Exchange Site Explorer Summary, which appears when an individual site is selected in the Exchange Infrastructure view on the Exchange Explorer dashboard. The contents of this view depends on the role selected at the top of the view.
Table 116. Roles Explorer view - Client Access 2013
DescriptionThe Role Explorer view displays the following top three charts for the Client Access role.
Data displayedTop 3 OWA Average Response. This graph displays the top three Exchange servers that reported the highest OWA average response times over the specified time interval.
Top 3 OWA Average Search Time. This graph displays the top three Exchange servers that reported the highest OWA average search times over the specified time interval.
Top 3 ASP.NET Current Requests. This graph displays the top three Exchange servers that reported the highest number of ASP.Net® requests during the specified time interval.
Top 3 ASP.NET Request In Application Queue. This graph displays the top three Exchange servers that reported the highest number of application requests in the Application Queue during the specified time interval.
Where to go next N/A
Table 117. Roles Explorer view - Edge Transport
DescriptionThe Role Explorer view displays the following top three charts for the Edge Transport role.
Data displayedTop 3 Submission Queues. This graph displays the top three Exchange servers that reported the highest number of entries in the Submission Queue during the specified time interval.
Top 3 Remote Delivery Queues. This graph displays the top three Exchange servers that reported the highest number of entries in the Remote Delivery Queue during the specified time interval.
Top 3 Retry Remote Delivery Queues. This graph displays the top three Exchange servers that reported the highest number of messages waiting to be retried for delivery to a remote server.
Top 3 Unreachable Queues. This graph displays the top three Exchange servers that reported the highest number of entries in the Unreachable Queue during the specified time interval.
Where to go next N/A
Table 118. Roles Explorer view - Hub Transport
DescriptionThe Role Explorer view displays the following top three charts for the Hub Transport role.
Data displayedTop 3 Mailbox Delivery Queues. This graph displays the top three Exchange servers that reported the highest number of entries in the Mailbox Delivery Queue during the specified time interval.
Top 3 Remote Delivery Queues. This graph displays the top three Exchange servers that reported the highest number of entries in the Remote Delivery Queue during the specified time interval.
Top 3 Submission Queues. This graph displays the top three Exchange servers that reported the highest number of entries in the Submission Queue during the specified time interval.
Foglight for Exchange 5.6.9User and Reference Guide
135
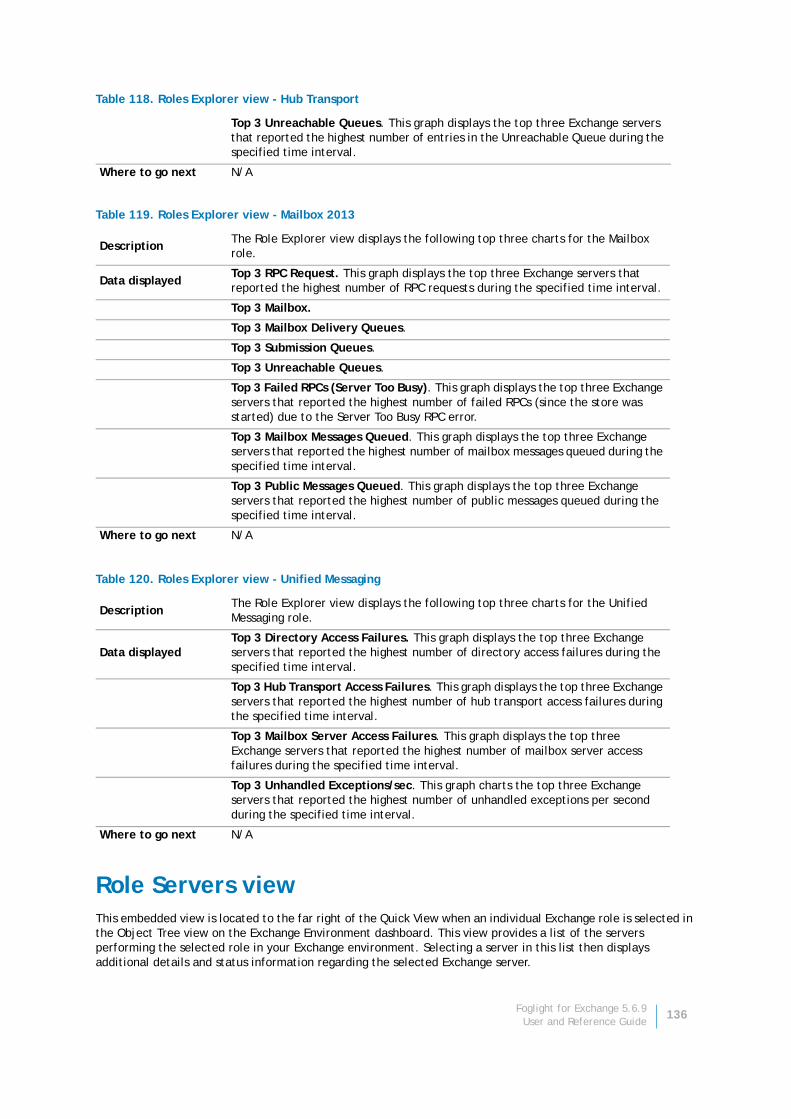
Role Servers viewThis embedded view is located to the far right of the Quick View when an individual Exchange role is selected in the Object Tree view on the Exchange Environment dashboard. This view provides a list of the servers performing the selected role in your Exchange environment. Selecting a server in this list then displays additional details and status information regarding the selected Exchange server.
Top 3 Unreachable Queues. This graph displays the top three Exchange servers that reported the highest number of entries in the Unreachable Queue during the specified time interval.
Where to go next N/A
Table 119. Roles Explorer view - Mailbox 2013
DescriptionThe Role Explorer view displays the following top three charts for the Mailbox role.
Data displayedTop 3 RPC Request. This graph displays the top three Exchange servers that reported the highest number of RPC requests during the specified time interval.
Top 3 Mailbox.
Top 3 Mailbox Delivery Queues.
Top 3 Submission Queues.
Top 3 Unreachable Queues.
Top 3 Failed RPCs (Server Too Busy). This graph displays the top three Exchange servers that reported the highest number of failed RPCs (since the store was started) due to the Server Too Busy RPC error.
Top 3 Mailbox Messages Queued. This graph displays the top three Exchange servers that reported the highest number of mailbox messages queued during the specified time interval.
Top 3 Public Messages Queued. This graph displays the top three Exchange servers that reported the highest number of public messages queued during the specified time interval.
Where to go next N/A
Table 120. Roles Explorer view - Unified Messaging
DescriptionThe Role Explorer view displays the following top three charts for the Unified Messaging role.
Data displayedTop 3 Directory Access Failures. This graph displays the top three Exchange servers that reported the highest number of directory access failures during the specified time interval.
Top 3 Hub Transport Access Failures. This graph displays the top three Exchange servers that reported the highest number of hub transport access failures during the specified time interval.
Top 3 Mailbox Server Access Failures. This graph displays the top three Exchange servers that reported the highest number of mailbox server access failures during the specified time interval.
Top 3 Unhandled Exceptions/sec. This graph charts the top three Exchange servers that reported the highest number of unhandled exceptions per second during the specified time interval.
Where to go next N/A
Table 118. Roles Explorer view - Hub Transport
Foglight for Exchange 5.6.9User and Reference Guide
136
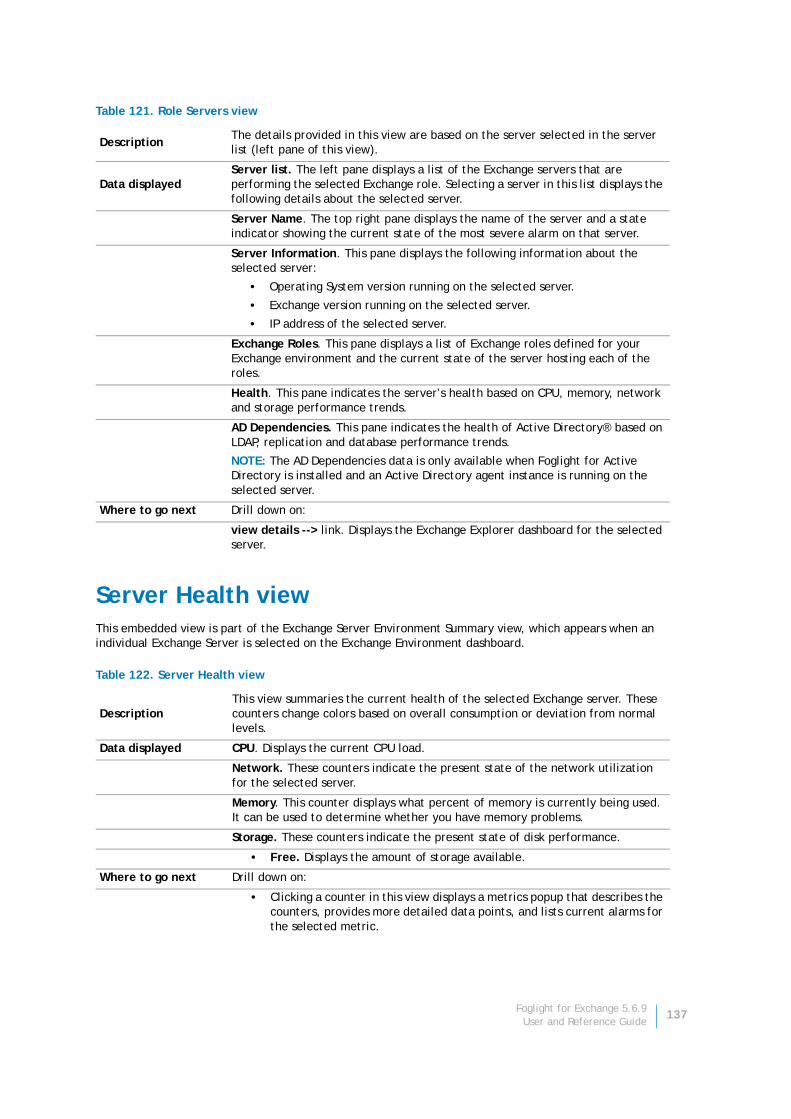
Server Health viewThis embedded view is part of the Exchange Server Environment Summary view, which appears when an individual Exchange Server is selected on the Exchange Environment dashboard.
Table 121. Role Servers view
DescriptionThe details provided in this view are based on the server selected in the server list (left pane of this view).
Data displayedServer list. The left pane displays a list of the Exchange servers that are performing the selected Exchange role. Selecting a server in this list displays the following details about the selected server.
Server Name. The top right pane displays the name of the server and a state indicator showing the current state of the most severe alarm on that server.
Server Information. This pane displays the following information about the selected server:
• Operating System version running on the selected server.
• Exchange version running on the selected server.
• IP address of the selected server.
Exchange Roles. This pane displays a list of Exchange roles defined for your Exchange environment and the current state of the server hosting each of the roles.
Health. This pane indicates the server’s health based on CPU, memory, network and storage performance trends.
AD Dependencies. This pane indicates the health of Active Directory® based on LDAP, replication and database performance trends.
NOTE: The AD Dependencies data is only available when Foglight for Active Directory is installed and an Active Directory agent instance is running on the selected server.
Where to go next Drill down on:
view details --> link. Displays the Exchange Explorer dashboard for the selected server.
Table 122. Server Health view
DescriptionThis view summaries the current health of the selected Exchange server. These counters change colors based on overall consumption or deviation from normal levels.
Data displayed CPU. Displays the current CPU load.
Network. These counters indicate the present state of the network utilization for the selected server.
Memory. This counter displays what percent of memory is currently being used. It can be used to determine whether you have memory problems.
Storage. These counters indicate the present state of disk performance.
• Free. Displays the amount of storage available.
Where to go next Drill down on:
• Clicking a counter in this view displays a metrics popup that describes the counters, provides more detailed data points, and lists current alarms for the selected metric.
Foglight for Exchange 5.6.9User and Reference Guide
137
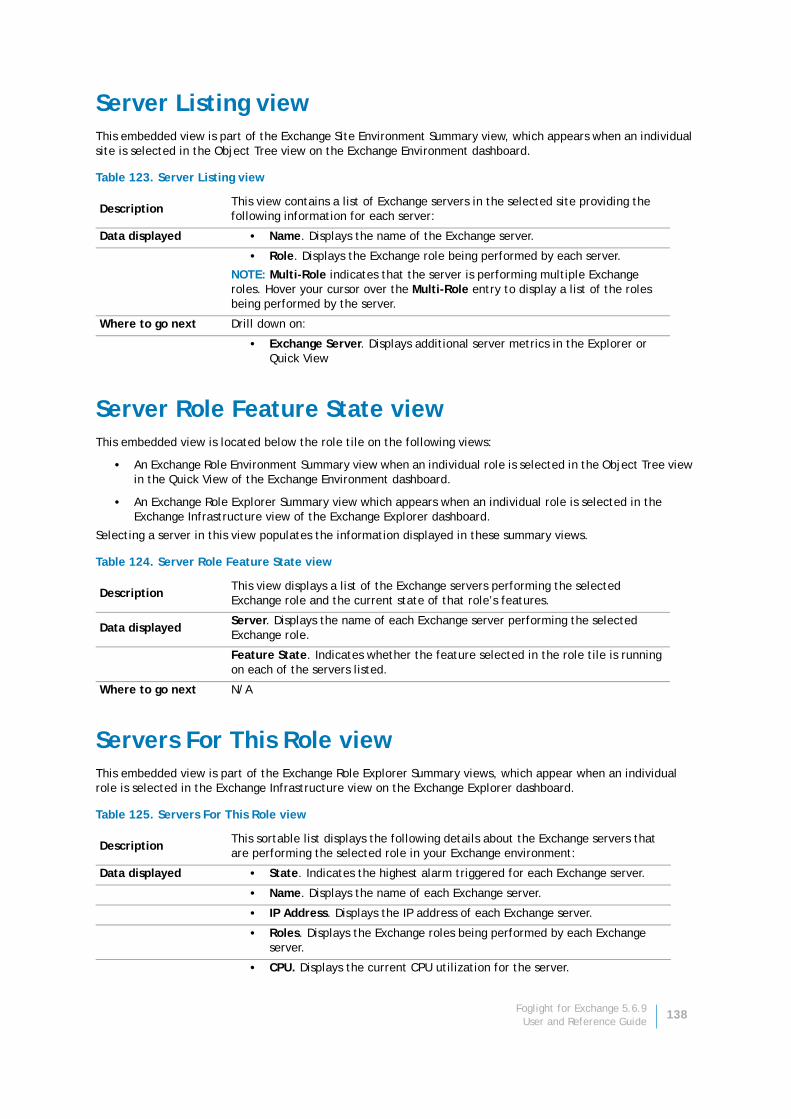
Server Listing viewThis embedded view is part of the Exchange Site Environment Summary view, which appears when an individual site is selected in the Object Tree view on the Exchange Environment dashboard.
Server Role Feature State viewThis embedded view is located below the role tile on the following views:
• An Exchange Role Environment Summary view when an individual role is selected in the Object Tree view in the Quick View of the Exchange Environment dashboard.
• An Exchange Role Explorer Summary view which appears when an individual role is selected in the Exchange Infrastructure view of the Exchange Explorer dashboard.
Selecting a server in this view populates the information displayed in these summary views.
Servers For This Role viewThis embedded view is part of the Exchange Role Explorer Summary views, which appear when an individual role is selected in the Exchange Infrastructure view on the Exchange Explorer dashboard.
Table 123. Server Listing view
DescriptionThis view contains a list of Exchange servers in the selected site providing the following information for each server:
Data displayed • Name. Displays the name of the Exchange server.
• Role. Displays the Exchange role being performed by each server.
NOTE: Multi-Role indicates that the server is performing multiple Exchange roles. Hover your cursor over the Multi-Role entry to display a list of the roles being performed by the server.
Where to go next Drill down on:
• Exchange Server. Displays additional server metrics in the Explorer or Quick View
Table 124. Server Role Feature State view
DescriptionThis view displays a list of the Exchange servers performing the selected Exchange role and the current state of that role’s features.
Data displayedServer. Displays the name of each Exchange server performing the selected Exchange role.
Feature State. Indicates whether the feature selected in the role tile is running on each of the servers listed.
Where to go next N/A
Table 125. Servers For This Role view
DescriptionThis sortable list displays the following details about the Exchange servers that are performing the selected role in your Exchange environment:
Data displayed • State. Indicates the highest alarm triggered for each Exchange server.
• Name. Displays the name of each Exchange server.
• IP Address. Displays the IP address of each Exchange server.
• Roles. Displays the Exchange roles being performed by each Exchange server.
• CPU. Displays the current CPU utilization for the server.
Foglight for Exchange 5.6.9User and Reference Guide
138
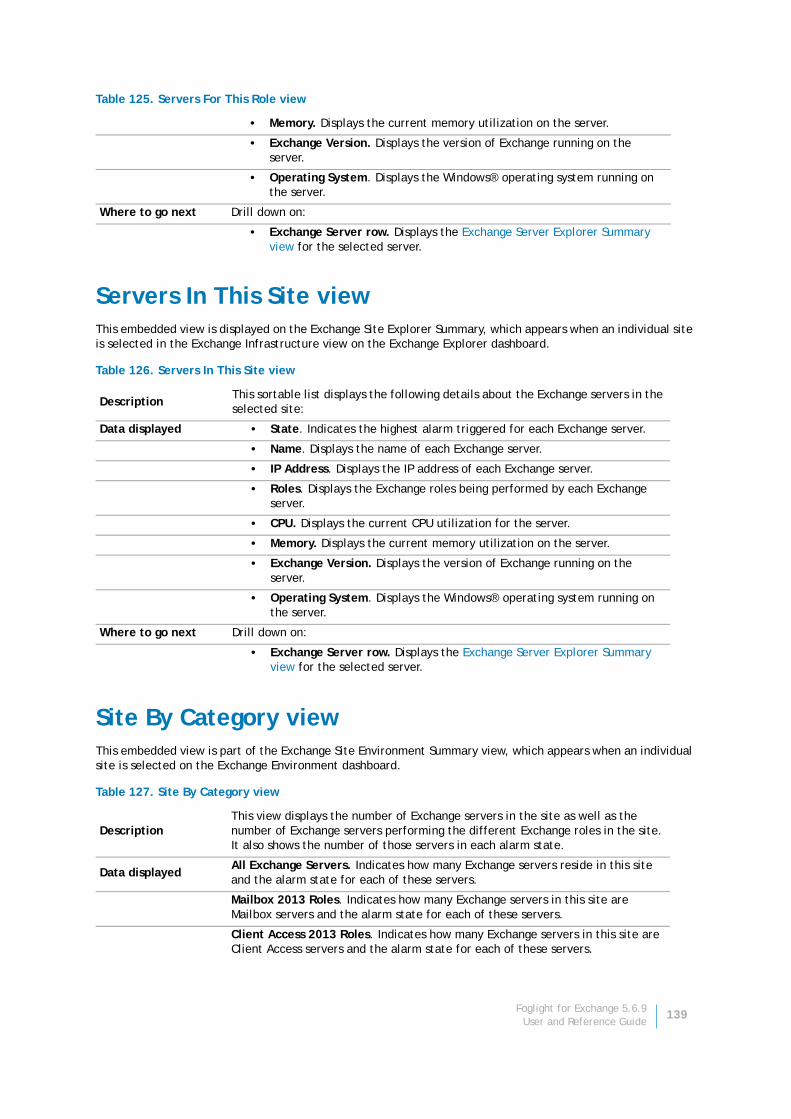
Servers In This Site viewThis embedded view is displayed on the Exchange Site Explorer Summary, which appears when an individual site is selected in the Exchange Infrastructure view on the Exchange Explorer dashboard.
Site By Category viewThis embedded view is part of the Exchange Site Environment Summary view, which appears when an individual site is selected on the Exchange Environment dashboard.
• Memory. Displays the current memory utilization on the server.
• Exchange Version. Displays the version of Exchange running on the server.
• Operating System. Displays the Windows® operating system running on the server.
Where to go next Drill down on:
• Exchange Server row. Displays the Exchange Server Explorer Summary view for the selected server.
Table 126. Servers In This Site view
DescriptionThis sortable list displays the following details about the Exchange servers in the selected site:
Data displayed • State. Indicates the highest alarm triggered for each Exchange server.
• Name. Displays the name of each Exchange server.
• IP Address. Displays the IP address of each Exchange server.
• Roles. Displays the Exchange roles being performed by each Exchange server.
• CPU. Displays the current CPU utilization for the server.
• Memory. Displays the current memory utilization on the server.
• Exchange Version. Displays the version of Exchange running on the server.
• Operating System. Displays the Windows® operating system running on the server.
Where to go next Drill down on:
• Exchange Server row. Displays the Exchange Server Explorer Summary view for the selected server.
Table 127. Site By Category view
DescriptionThis view displays the number of Exchange servers in the site as well as the number of Exchange servers performing the different Exchange roles in the site. It also shows the number of those servers in each alarm state.
Data displayedAll Exchange Servers. Indicates how many Exchange servers reside in this site and the alarm state for each of these servers.
Mailbox 2013 Roles. Indicates how many Exchange servers in this site are Mailbox servers and the alarm state for each of these servers.
Client Access 2013 Roles. Indicates how many Exchange servers in this site are Client Access servers and the alarm state for each of these servers.
Table 125. Servers For This Role view
Foglight for Exchange 5.6.9User and Reference Guide
139
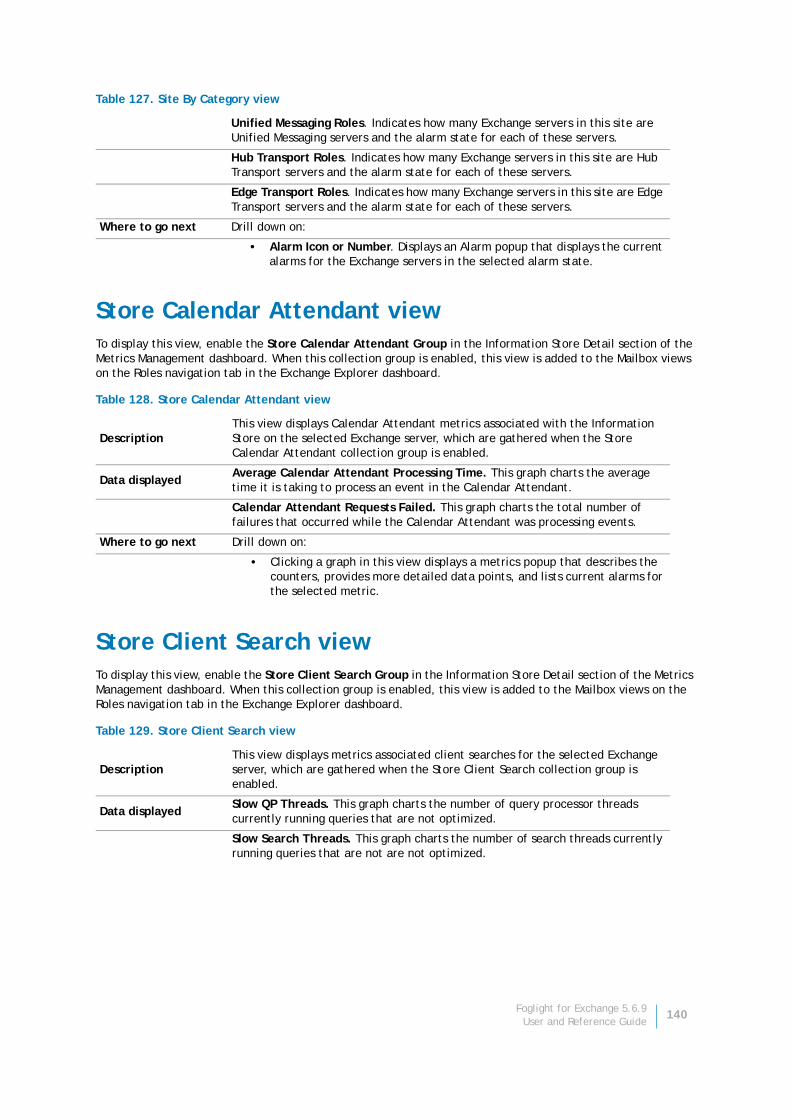
Store Calendar Attendant viewTo display this view, enable the Store Calendar Attendant Group in the Information Store Detail section of the Metrics Management dashboard. When this collection group is enabled, this view is added to the Mailbox views on the Roles navigation tab in the Exchange Explorer dashboard.
Store Client Search viewTo display this view, enable the Store Client Search Group in the Information Store Detail section of the Metrics Management dashboard. When this collection group is enabled, this view is added to the Mailbox views on the Roles navigation tab in the Exchange Explorer dashboard.
Unified Messaging Roles. Indicates how many Exchange servers in this site are Unified Messaging servers and the alarm state for each of these servers.
Hub Transport Roles. Indicates how many Exchange servers in this site are Hub Transport servers and the alarm state for each of these servers.
Edge Transport Roles. Indicates how many Exchange servers in this site are Edge Transport servers and the alarm state for each of these servers.
Where to go next Drill down on:
• Alarm Icon or Number. Displays an Alarm popup that displays the current alarms for the Exchange servers in the selected alarm state.
Table 128. Store Calendar Attendant view
DescriptionThis view displays Calendar Attendant metrics associated with the Information Store on the selected Exchange server, which are gathered when the Store Calendar Attendant collection group is enabled.
Data displayedAverage Calendar Attendant Processing Time. This graph charts the average time it is taking to process an event in the Calendar Attendant.
Calendar Attendant Requests Failed. This graph charts the total number of failures that occurred while the Calendar Attendant was processing events.
Where to go next Drill down on:
• Clicking a graph in this view displays a metrics popup that describes the counters, provides more detailed data points, and lists current alarms for the selected metric.
Table 129. Store Client Search view
DescriptionThis view displays metrics associated client searches for the selected Exchange server, which are gathered when the Store Client Search collection group is enabled.
Data displayedSlow QP Threads. This graph charts the number of query processor threads currently running queries that are not optimized.
Slow Search Threads. This graph charts the number of search threads currently running queries that are not are not optimized.
Table 127. Site By Category view
Foglight for Exchange 5.6.9User and Reference Guide
140
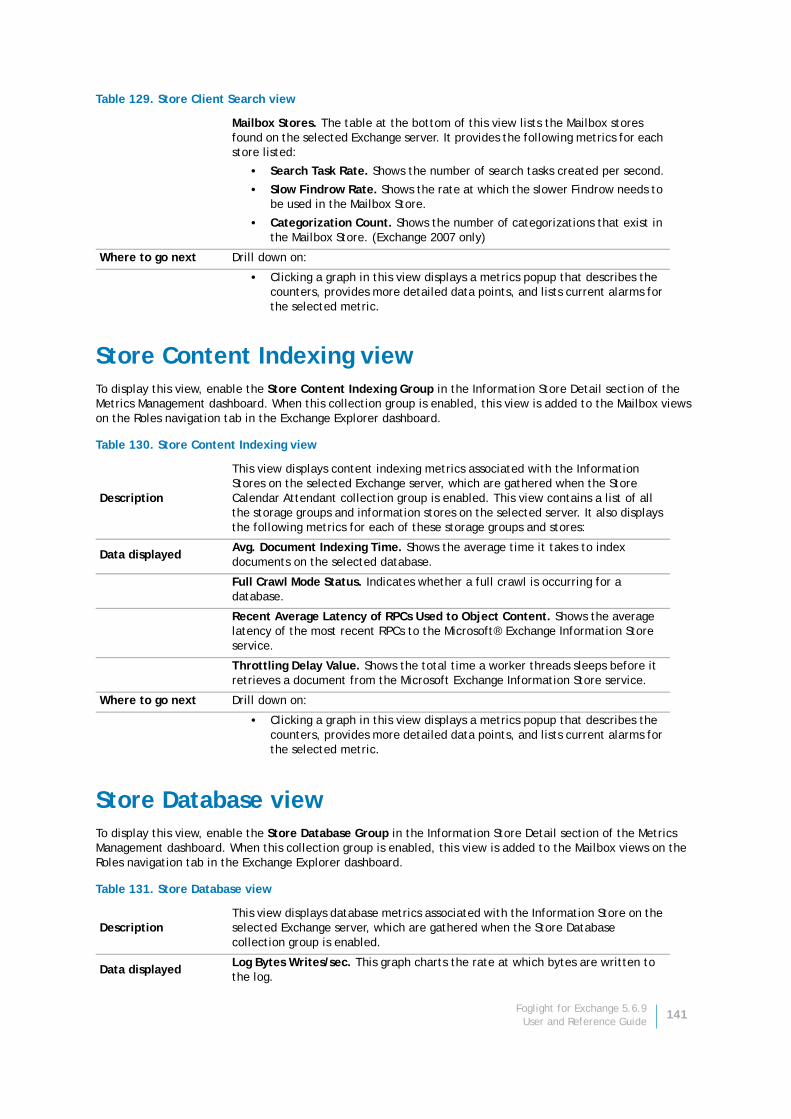
Store Content Indexing viewTo display this view, enable the Store Content Indexing Group in the Information Store Detail section of the Metrics Management dashboard. When this collection group is enabled, this view is added to the Mailbox views on the Roles navigation tab in the Exchange Explorer dashboard.
Store Database view To display this view, enable the Store Database Group in the Information Store Detail section of the Metrics Management dashboard. When this collection group is enabled, this view is added to the Mailbox views on the Roles navigation tab in the Exchange Explorer dashboard.
Mailbox Stores. The table at the bottom of this view lists the Mailbox stores found on the selected Exchange server. It provides the following metrics for each store listed:
• Search Task Rate. Shows the number of search tasks created per second.
• Slow Findrow Rate. Shows the rate at which the slower Findrow needs to be used in the Mailbox Store.
• Categorization Count. Shows the number of categorizations that exist in the Mailbox Store. (Exchange 2007 only)
Where to go next Drill down on:
• Clicking a graph in this view displays a metrics popup that describes the counters, provides more detailed data points, and lists current alarms for the selected metric.
Table 130. Store Content Indexing view
Description
This view displays content indexing metrics associated with the Information Stores on the selected Exchange server, which are gathered when the Store Calendar Attendant collection group is enabled. This view contains a list of all the storage groups and information stores on the selected server. It also displays the following metrics for each of these storage groups and stores:
Data displayedAvg. Document Indexing Time. Shows the average time it takes to index documents on the selected database.
Full Crawl Mode Status. Indicates whether a full crawl is occurring for a database.
Recent Average Latency of RPCs Used to Object Content. Shows the average latency of the most recent RPCs to the Microsoft® Exchange Information Store service.
Throttling Delay Value. Shows the total time a worker threads sleeps before it retrieves a document from the Microsoft Exchange Information Store service.
Where to go next Drill down on:
• Clicking a graph in this view displays a metrics popup that describes the counters, provides more detailed data points, and lists current alarms for the selected metric.
Table 131. Store Database view
DescriptionThis view displays database metrics associated with the Information Store on the selected Exchange server, which are gathered when the Store Database collection group is enabled.
Data displayedLog Bytes Writes/sec. This graph charts the rate at which bytes are written to the log.
Table 129. Store Client Search view
Foglight for Exchange 5.6.9User and Reference Guide
141
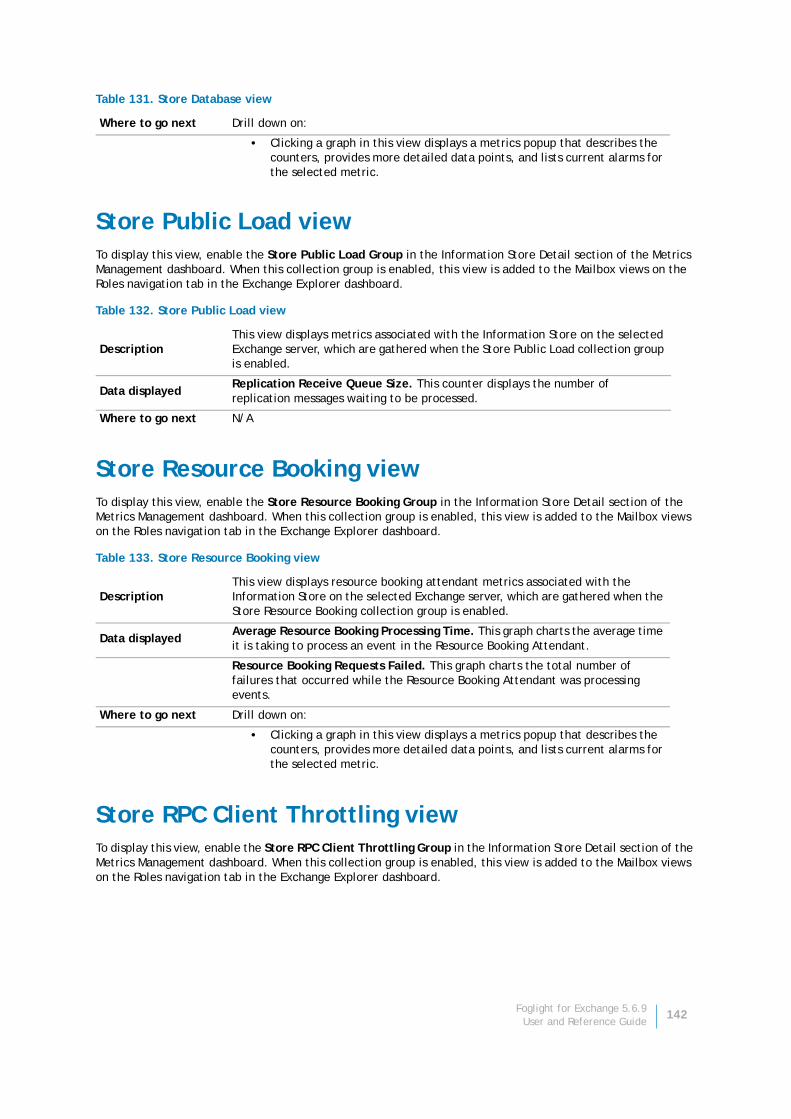
Store Public Load viewTo display this view, enable the Store Public Load Group in the Information Store Detail section of the Metrics Management dashboard. When this collection group is enabled, this view is added to the Mailbox views on the Roles navigation tab in the Exchange Explorer dashboard.
Store Resource Booking viewTo display this view, enable the Store Resource Booking Group in the Information Store Detail section of the Metrics Management dashboard. When this collection group is enabled, this view is added to the Mailbox views on the Roles navigation tab in the Exchange Explorer dashboard.
Store RPC Client Throttling viewTo display this view, enable the Store RPC Client Throttling Group in the Information Store Detail section of the Metrics Management dashboard. When this collection group is enabled, this view is added to the Mailbox views on the Roles navigation tab in the Exchange Explorer dashboard.
Where to go next Drill down on:
• Clicking a graph in this view displays a metrics popup that describes the counters, provides more detailed data points, and lists current alarms for the selected metric.
Table 132. Store Public Load view
DescriptionThis view displays metrics associated with the Information Store on the selected Exchange server, which are gathered when the Store Public Load collection group is enabled.
Data displayedReplication Receive Queue Size. This counter displays the number of replication messages waiting to be processed.
Where to go next N/A
Table 133. Store Resource Booking view
DescriptionThis view displays resource booking attendant metrics associated with the Information Store on the selected Exchange server, which are gathered when the Store Resource Booking collection group is enabled.
Data displayedAverage Resource Booking Processing Time. This graph charts the average time it is taking to process an event in the Resource Booking Attendant.
Resource Booking Requests Failed. This graph charts the total number of failures that occurred while the Resource Booking Attendant was processing events.
Where to go next Drill down on:
• Clicking a graph in this view displays a metrics popup that describes the counters, provides more detailed data points, and lists current alarms for the selected metric.
Table 131. Store Database view
Foglight for Exchange 5.6.9User and Reference Guide
142
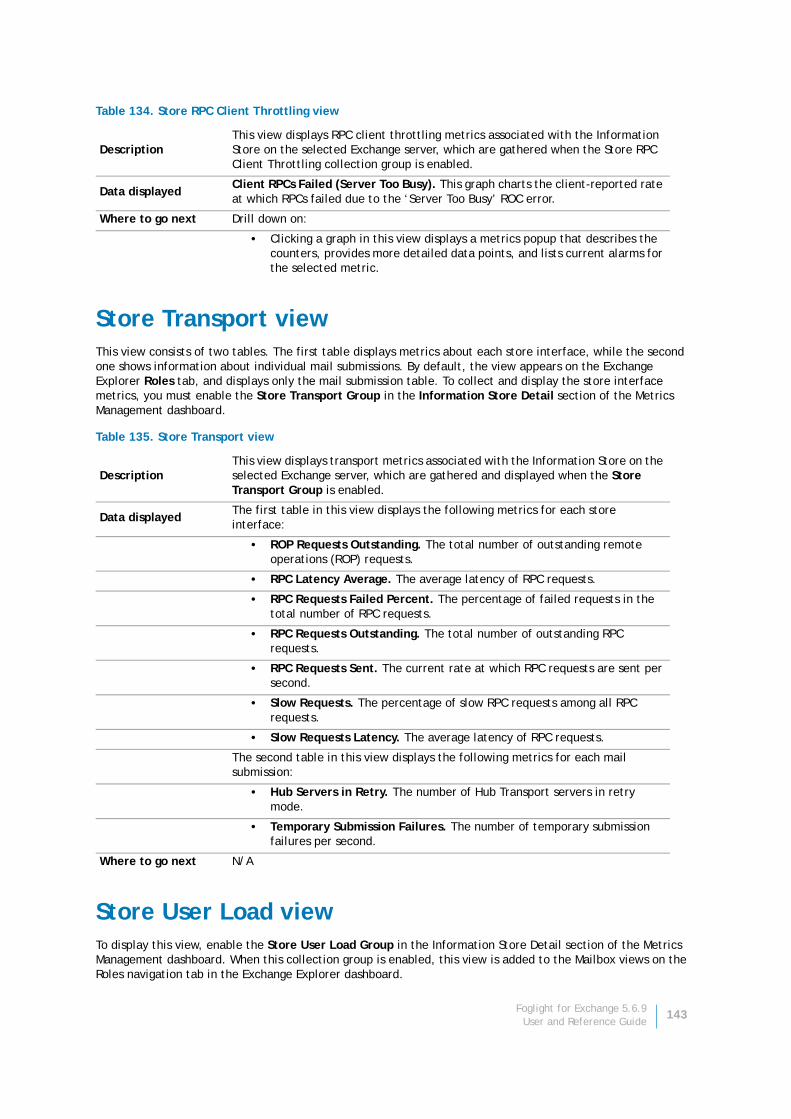
Store Transport viewThis view consists of two tables. The first table displays metrics about each store interface, while the second one shows information about individual mail submissions. By default, the view appears on the Exchange Explorer Roles tab, and displays only the mail submission table. To collect and display the store interface metrics, you must enable the Store Transport Group in the Information Store Detail section of the Metrics Management dashboard.
Store User Load viewTo display this view, enable the Store User Load Group in the Information Store Detail section of the Metrics Management dashboard. When this collection group is enabled, this view is added to the Mailbox views on the Roles navigation tab in the Exchange Explorer dashboard.
Table 134. Store RPC Client Throttling view
DescriptionThis view displays RPC client throttling metrics associated with the Information Store on the selected Exchange server, which are gathered when the Store RPC Client Throttling collection group is enabled.
Data displayedClient RPCs Failed (Server Too Busy). This graph charts the client-reported rate at which RPCs failed due to the ‘Server Too Busy’ ROC error.
Where to go next Drill down on:
• Clicking a graph in this view displays a metrics popup that describes the counters, provides more detailed data points, and lists current alarms for the selected metric.
Table 135. Store Transport view
DescriptionThis view displays transport metrics associated with the Information Store on the selected Exchange server, which are gathered and displayed when the Store Transport Group is enabled.
Data displayedThe first table in this view displays the following metrics for each store interface:
• ROP Requests Outstanding. The total number of outstanding remote operations (ROP) requests.
• RPC Latency Average. The average latency of RPC requests.
• RPC Requests Failed Percent. The percentage of failed requests in the total number of RPC requests.
• RPC Requests Outstanding. The total number of outstanding RPC requests.
• RPC Requests Sent. The current rate at which RPC requests are sent per second.
• Slow Requests. The percentage of slow RPC requests among all RPC requests.
• Slow Requests Latency. The average latency of RPC requests.
The second table in this view displays the following metrics for each mail submission:
• Hub Servers in Retry. The number of Hub Transport servers in retry mode.
• Temporary Submission Failures. The number of temporary submission failures per second.
Where to go next N/A
Foglight for Exchange 5.6.9User and Reference Guide
143

Summary and Resource Information viewThis embedded view is part of the Exchange Server Explorer Summary view when an individual server is selected in the Exchange Infrastructure view on the Exchange Explorer dashboard. To display this view, select the Summary navigation tab and scroll to the bottom of the view.
Top 3 ASP.NET Current Requests viewsThis embedded view is part of the following views:
• Exchange Site Environment Summary when Client Access is selected in the Exchange Roles view.
Table 136. Store User Load view
DescriptionThis view displays user load metrics associated with the Information Store on the selected Exchange server, which are gathered when the Store User Load collection group is enabled.
Data displayedUser Count. This graph charts the average time it is taking to process an event in the Calendar Attendant.
Replication Receive Queue Size. This counter displays the number of messages in the public store’s receive queue.
Where to go next Drill down on:
• Clicking a graph in this view displays a metrics popup that describes the counters, provides more detailed data points, and lists current alarms for the selected metric.
Table 137. Summary and Resource Information view
Description This view displays the following information about the selected Exchange server:
Data displayed Server Name. Displays the name of the selected Exchange server.
IP Address. Displays the IP address of the selected Exchange server.
Operating System. Displays the operating system running on the selected server.
Exchange Version. Displays the Exchange version running on the selected server.
Domain. Displays the domain to which this server belongs.
Site. Displays the name of the site to which the selected server belongs.
Processors. Displays the number of CPUs on the selected server.
Memory Capacity. Displays the memory capacity of the selected server.
Network Interfaces. Displays the number of network interfaces available on the selected server.
Physical Disks. Displays the number of physical disk drives on the selected server.
Where to go next N/A
Table 138. Top 3 ASP.NET Current Requests view
Description
The graph charts ASP.Net® utilization for the top three Exchange servers in the selected object container or site. The list at the bottom of this view displays the top three Exchange servers that are consuming the most requests during the specified time interval.
Where to go next N/A
Foglight for Exchange 5.6.9User and Reference Guide
144
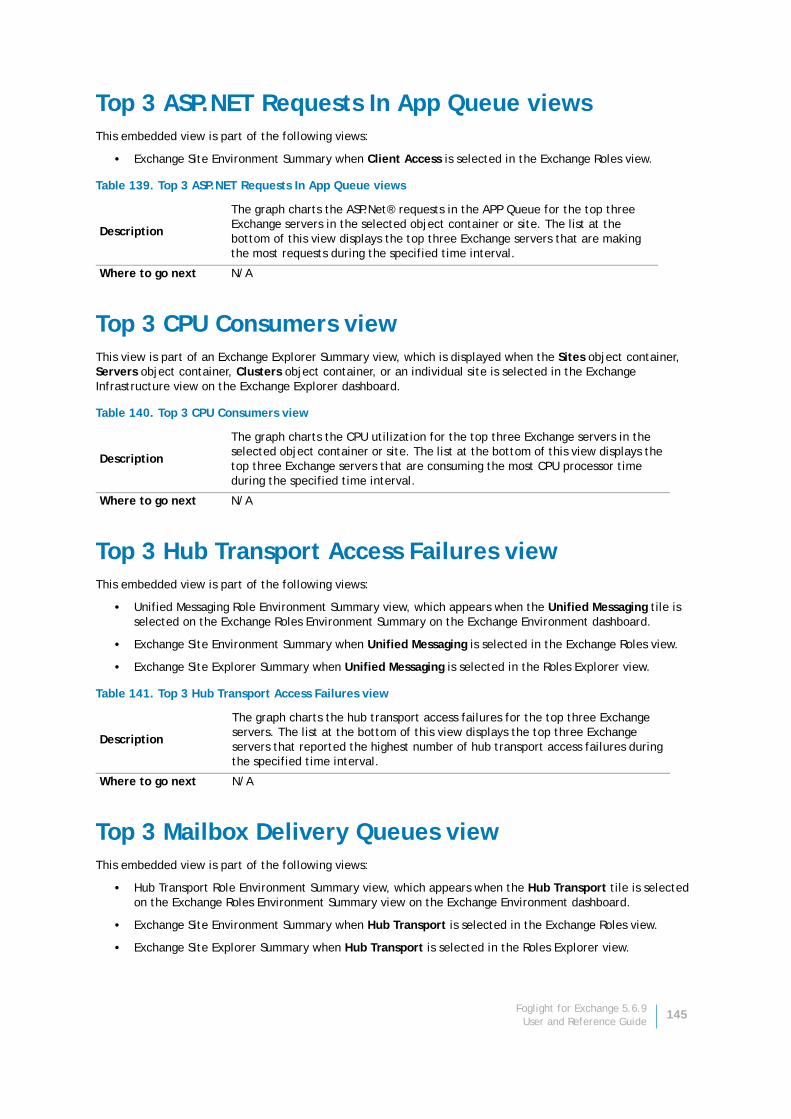
Top 3 ASP.NET Requests In App Queue viewsThis embedded view is part of the following views:
• Exchange Site Environment Summary when Client Access is selected in the Exchange Roles view.
Top 3 CPU Consumers viewThis view is part of an Exchange Explorer Summary view, which is displayed when the Sites object container, Servers object container, Clusters object container, or an individual site is selected in the Exchange Infrastructure view on the Exchange Explorer dashboard.
Top 3 Hub Transport Access Failures viewThis embedded view is part of the following views:
• Unified Messaging Role Environment Summary view, which appears when the Unified Messaging tile is selected on the Exchange Roles Environment Summary on the Exchange Environment dashboard.
• Exchange Site Environment Summary when Unified Messaging is selected in the Exchange Roles view.
• Exchange Site Explorer Summary when Unified Messaging is selected in the Roles Explorer view.
Top 3 Mailbox Delivery Queues viewThis embedded view is part of the following views:
• Hub Transport Role Environment Summary view, which appears when the Hub Transport tile is selected on the Exchange Roles Environment Summary view on the Exchange Environment dashboard.
• Exchange Site Environment Summary when Hub Transport is selected in the Exchange Roles view.
• Exchange Site Explorer Summary when Hub Transport is selected in the Roles Explorer view.
Table 139. Top 3 ASP.NET Requests In App Queue views
Description
The graph charts the ASP.Net® requests in the APP Queue for the top three Exchange servers in the selected object container or site. The list at the bottom of this view displays the top three Exchange servers that are making the most requests during the specified time interval.
Where to go next N/A
Table 140. Top 3 CPU Consumers view
Description
The graph charts the CPU utilization for the top three Exchange servers in the selected object container or site. The list at the bottom of this view displays the top three Exchange servers that are consuming the most CPU processor time during the specified time interval.
Where to go next N/A
Table 141. Top 3 Hub Transport Access Failures view
Description
The graph charts the hub transport access failures for the top three Exchange servers. The list at the bottom of this view displays the top three Exchange servers that reported the highest number of hub transport access failures during the specified time interval.
Where to go next N/A
Foglight for Exchange 5.6.9User and Reference Guide
145

Top 3 Mailbox Server Access Failures viewThis embedded view is part of the following views:
• Unified Messaging Role Environment Summary view, which appears when the Unified Messaging tile is selected on the Exchange Roles Environment Summary on the Exchange Environment dashboard.
• Exchange Site Environment Summary when Unified Messaging is selected in the Exchange Roles view.
• Exchange Site Explorer Summary when Unified Messaging is selected in the Roles Explorer view.
Top 3 Memory Consumers viewThis view is part of an Exchange Explorer Summary view, which is displayed when the Sites object container, Servers object container, Clusters object container, or an individual site is selected in the Exchange Infrastructure view on the Exchange Explorer dashboard.
Top 3 Messages Received/sec viewThis embedded view is part of the following views:
• Hub Transport Role Environment Summary view, which appears when the Hub Transport tile is selected on the Exchange Roles Environment Summary view on the Exchange Environment dashboard.
• Exchange Site Environment Summary view when Hub Transport is selected in the Exchange Roles view.
Table 142. Top 3 Mailbox Delivery Queues view
Description
The graph charts the mailbox delivery queues for the top three Exchange servers. The list at the bottom of this view displays the top three Exchange servers that reported the highest number of entries in the mailbox delivery queue during the specified time interval.
Where to go next N/A
Table 143. Top 3 Mailbox Server Access Failures view
Description
The graph charts the mailbox server access failures for the top three Exchange servers. The list at the bottom of this view displays the top three Exchange servers that reported the highest number of mailbox server access failures during the specified time interval.
Where to go next N/A
Table 144. Top 3 Memory Consumers view
Description
The graph charts the memory utilization for the top three Exchange servers in the selected object container or site. The list at the bottom of this view displays the top three Exchange servers that are consuming the most memory during the specified time interval.
Where to go next N/A
Table 145. Top 3 Messages Received/sec view
Description
The graph charts the messages received per second for the top three Exchange servers. The list at the bottom of this view displays the top three Exchange servers that reported the highest number of messages received per second during the specified time interval.
Where to go next N/A
Foglight for Exchange 5.6.9User and Reference Guide
146
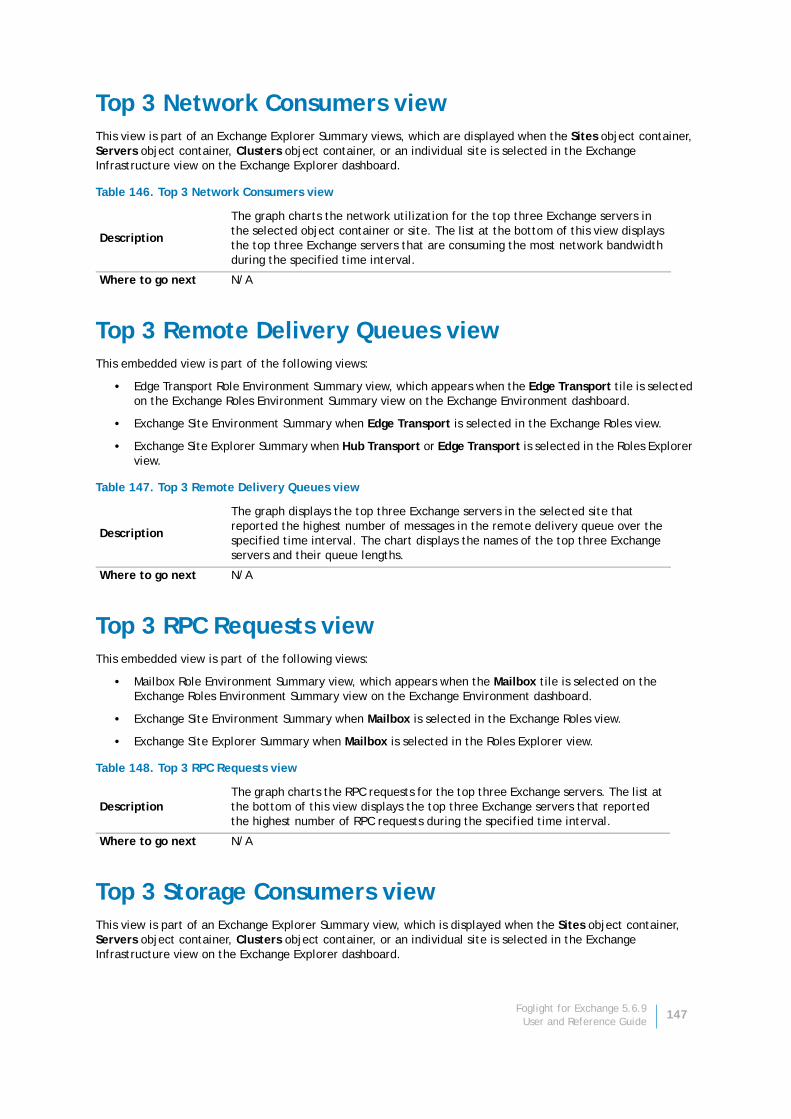
Top 3 Network Consumers viewThis view is part of an Exchange Explorer Summary views, which are displayed when the Sites object container, Servers object container, Clusters object container, or an individual site is selected in the Exchange Infrastructure view on the Exchange Explorer dashboard.
Top 3 Remote Delivery Queues viewThis embedded view is part of the following views:
• Edge Transport Role Environment Summary view, which appears when the Edge Transport tile is selected on the Exchange Roles Environment Summary view on the Exchange Environment dashboard.
• Exchange Site Environment Summary when Edge Transport is selected in the Exchange Roles view.
• Exchange Site Explorer Summary when Hub Transport or Edge Transport is selected in the Roles Explorer view.
Top 3 RPC Requests viewThis embedded view is part of the following views:
• Mailbox Role Environment Summary view, which appears when the Mailbox tile is selected on the Exchange Roles Environment Summary view on the Exchange Environment dashboard.
• Exchange Site Environment Summary when Mailbox is selected in the Exchange Roles view.
• Exchange Site Explorer Summary when Mailbox is selected in the Roles Explorer view.
Top 3 Storage Consumers viewThis view is part of an Exchange Explorer Summary view, which is displayed when the Sites object container, Servers object container, Clusters object container, or an individual site is selected in the Exchange Infrastructure view on the Exchange Explorer dashboard.
Table 146. Top 3 Network Consumers view
Description
The graph charts the network utilization for the top three Exchange servers in the selected object container or site. The list at the bottom of this view displays the top three Exchange servers that are consuming the most network bandwidth during the specified time interval.
Where to go next N/A
Table 147. Top 3 Remote Delivery Queues view
Description
The graph displays the top three Exchange servers in the selected site that reported the highest number of messages in the remote delivery queue over the specified time interval. The chart displays the names of the top three Exchange servers and their queue lengths.
Where to go next N/A
Table 148. Top 3 RPC Requests view
DescriptionThe graph charts the RPC requests for the top three Exchange servers. The list at the bottom of this view displays the top three Exchange servers that reported the highest number of RPC requests during the specified time interval.
Where to go next N/A
Foglight for Exchange 5.6.9User and Reference Guide
147
Top 3 Submission Queues viewThis embedded view is part of the following views:
• Edge Transport Role Environment Summary view, which appears when the Edge Transport tile is selected on the Exchange Roles Environment Summary view on the Exchange Environment dashboard.
• Exchange Site Environment Summary when Edge Transport is selected in the Exchange Roles view.
• Exchange Site Explorer Summary when Hub Transport or Edge Transport is selected in the Roles Explorer view.
Top 3 Mailbox Delivery Queues This embedded view is part of the following views:
• Mailbox Role Environment Summary view, which appears when the Mailbox tile is selected on the Exchange Environment dashboard.
• Exchange Site Environment Summary when Mailbox is selected in the Exchange Roles view.
Total LDAP Read Time On All DCs viewThis embedded view is part of the Exchange Server AD Health view, which appears when an individual Exchange Server is selected in the Exchange Infrastructure on the Exchange Explorer. Select the AD Health navigation tab.
Table 149. Top 3 Storage Consumers view
Description
The graph charts the storage utilization for the top three Exchange servers in the selected object container or site. The list at the bottom of this view displays the top three Exchange servers that are consuming the most storage space during the specified time interval.
Where to go next N/A
Table 150. Top 3 Submission Queues view
Description
The graph displays the top three Exchange servers in the selected site that reported the highest number of messages in the submission queue over the specified time interval. The chart displays the names of the top three Exchange servers and their queue lengths.
Where to go next N/A
Table 151. Top 3 Mailbox Delivery Queues
Description
The graph charts the user connections for the top three Exchange servers. The list at the bottom of this view displays the top three Exchange servers that reported the highest number of user connections during the specified time interval.
Where to go next N/A
Table 152. Total LDAP Read Time On All DCs view
DescriptionThis view displays the following metrics for the all the DCs found in your Active Directory® environment.
Data displayedLDAP Read Time. This graph charts the amount of time it takes to send an LDAP read request to the DC and receive a response. It provides a comparison against the fatal, critical and warning threshold levels.
Foglight for Exchange 5.6.9User and Reference Guide
148
Total Long-Running LDAP Operations On All DCs viewThis embedded view is part of the Exchange Server AD Health view, which appears when an individual Exchange Server is selected in the Exchange Infrastructure on the Exchange Explorer. Select the AD Health navigation tab.
Transport Dumpster viewTo display this view, enable the Transport Dumpster Group in the Transport Detail section of the Metrics Management dashboard. When this collection group is enabled, this view is added to the Edge Transport or Hub Transport views on the Roles navigation tab in the Exchange Explorer dashboard.
Where to go next Drill down on:
• Clicking a graph in this view displays a metrics popup that describes the counters, provides more detailed data points, and lists current alarms for the selected metric.
Table 153. Total Long-Running LDAP Operations On All DCs view
DescriptionThis view displays the following metrics for the all the DCs found in your Active Directory® environment.
Data displayed
Total Long-Running LDAP Operations On All DCs. This graph charts the number of LDAP operations on all DCs that took longer than the specified threshold per minute. The default threshold is 15 minutes. It provides a comparison against the fatal, critical and warning threshold levels.
Where to go next Drill down on:
• Clicking a graph in this view displays a metrics popup that describes the counters, provides more detailed data points, and lists current alarms for the selected metric.
Table 154. Transport Dumpster view
DescriptionThis view displays transport dumpster metrics for the selected Exchange server, which are gathered when the Transport Dumpster collection group is enabled.
Data displayed
Deletes and Inserts/sec. This graph charts the following metrics over the specified time interval:
• Dumpster Deletes/sec. Shows the rate at which items are deleted from the transport dumpster on the selected server.
• Dumpster Inserts/sec. Shows the rate at which items are inserted into the transport dumpster on the selected server.
Dumpster Item Count. This graph charts the total number of mail items currently in the transport dumpster on the selected server.
Dumpster Size. This graph charts the total size of mail items currently in the transport dumpster on the selected server.
Where to go next Drill down on:
• Clicking a graph in this view displays a metrics popup that describes the counters, provides more detailed data points, and lists current alarms for the selected metric.
Table 152. Total LDAP Read Time On All DCs view
Foglight for Exchange 5.6.9User and Reference Guide
149
Transport Edge Sync viewTo display this view, enable the Transport Edge Sync Group in the Transport Detail section of the Metrics Management dashboard. When this collection group is enabled, this view is added to the Hub Transport views on the Roles navigation tab in the Exchange Explorer dashboard.
Transport Extensibility Agent viewTo display this view, enable the Transport Extensibility Agent Group in the Transport Detail section of the Metrics Management dashboard. When this collection group is enabled, this view is added to the Edge Transport or Hub Transport views on the Roles navigation tab in the Exchange Explorer dashboard.
Table 155. Transport Edge Sync view
DescriptionThis view displays EdgeSync metrics for the selected Exchange server, which are gathered when the Transport Edge Sync collection group is enabled.
Data displayed
Objects Added, Deleted and Updated/sec. This graph charts the following metrics over the specified time interval:
• Edge Objects Added/sec. Shows the rate at which Edge objects are being added by the EdgeSync per second.
• Edge Objects Deleted/sec. Shows the rate at which Edge objects are being deleted by the EdgeSync per second.
• Edge Objects Updated/sec. Shows the rate at which Edge objects are being updated by the EdgeSync per second.
Scan Jobs. This graph charts the following metrics over the specified time interval:
• Scan Jobs Completed Successfully Total. Shows the total number of scan jobs completed successfully by EdgeSync.
• Scan Jobs Failed Because Could Not Extend Lock Total. Shows the total number of EdgeSync scan jobs that failed because EdgeSync could not extend its lease of an Edge Transport server.
• Scan Jobs Failed Because of Directory Error Total. Shows the total number of EdgeSync directory errors.
• Scan Jobs Not Started Because Could Not Lock Total. Shows the total number of EdgeSync scan jobs that failed.
Where to go next Drill down on:
• Clicking a graph in this view displays a metrics popup that describes the counters, provides more detailed data points, and lists current alarms for the selected metric.
Table 156. Transport Extensibility Agent view
DescriptionThis view displays metrics for the transport extensibility agents on the selected Exchange server, which are gathered when the Transport Extensibility Agent collection group is enabled.
Data displayedTotal Agent Invocations. For each agent listed, this counter displays the total number of invocations since the last restart.
Average Agent Processing Time. For each agent listed, this counter displays the average agent processing time (in seconds) per event.
Where to go next N/A
Foglight for Exchange 5.6.9User and Reference Guide
150
Transport Load Store Drivers viewTo display this view, enable the Transport Load Group in the Transport Detail section of the Metrics Management dashboard. When this collection group is enabled, this view is added to the Edge Transport or Hub Transport views on the Roles navigation tab in the Exchange Explorer dashboard.
Transport Queues viewTo display this view, enable the Transport Queues Group in the Transport Detail section of the Metrics Management dashboard. When this collection group is enabled, this view is added to the Edge Transport or Hub Transport views on the Roles navigation tab in the Exchange Explorer dashboard.
UM Availability viewTo display this view, enable the UM Availability Group in the Unified Messaging Detail section of the Metrics Management dashboard. When this collection group is enabled, this view is added to the Unified Messaging views on the Roles navigation tab in the Exchange Explorer dashboard.
Table 157. Transport Load Store Drivers view
DescriptionThis view displays transport load metrics for the selected Exchange server, which are gathered when the Transport Load collection group is enabled.
Data displayedInbound Local Delivery Calls/sec. This counter displays the number of local delivery calls made per second.
Inbound Message Delivery Attempts/sec. This counter displays the number of local delivery attempts made per second.
Inbound Recipients Delivery/sec. This counter displays the number of inbound recipients delivered per second.
Outbound Submitted Mail Items/sec. This counter displays the number of mail items being submitted per second.
Where to go next Drill down on:
• Clicking a counter in this view displays a metrics popup that describes the counters, provides more detailed data points, and lists current alarms for the selected metric.
NOTE: There is also a Transport Queues view displayed by default for both the Edge Transport and Hub Transport roles. See Exchange Server Roles view - Edge Transport - Transport Queues view and Exchange Server Roles view - Hub Transport - Transport Queues view for information on these default views.
Table 158. Transport Queues view
DescriptionThis view displays additional metrics for the transport queues on the selected Exchange server, which are gathered when the Transport Queues collection group is enabled.
Data displayedActive Mailbox Delivery Queue Length. This counter displays the number of messages in the active mailbox queues.
Active Non-SMTP Delivery Queue Length. This counter displays the number of messages in the Drop directory that is used by a Foreign connector.
Retry Non-SMTP Delivery Queue Length. This counter displays the number of messages in a retry state in the non-SMTP gateway delivery queues.
Where to go next Drill down on:
• Clicking a counter in this view displays a metrics popup that describes the counters, provides more detailed data points, and lists current alarms for the selected metric.
Foglight for Exchange 5.6.9User and Reference Guide
151
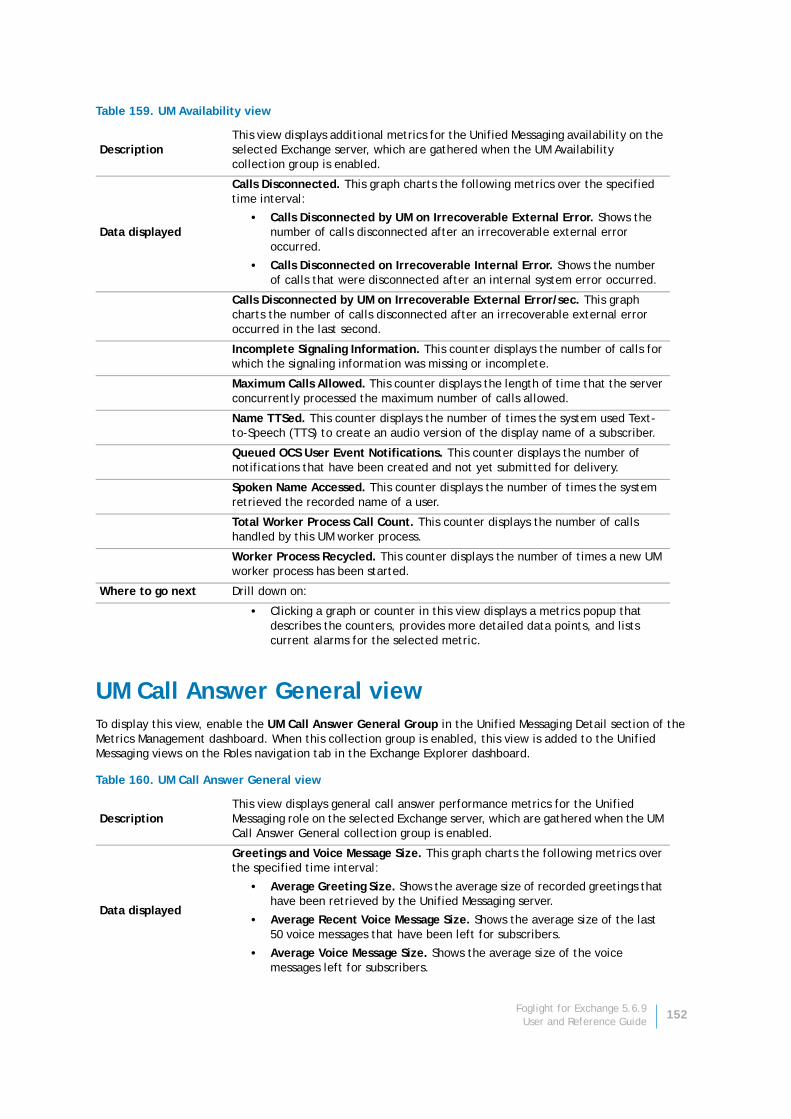
UM Call Answer General viewTo display this view, enable the UM Call Answer General Group in the Unified Messaging Detail section of the Metrics Management dashboard. When this collection group is enabled, this view is added to the Unified Messaging views on the Roles navigation tab in the Exchange Explorer dashboard.
Table 159. UM Availability view
DescriptionThis view displays additional metrics for the Unified Messaging availability on the selected Exchange server, which are gathered when the UM Availability collection group is enabled.
Data displayed
Calls Disconnected. This graph charts the following metrics over the specified time interval:
• Calls Disconnected by UM on Irrecoverable External Error. Shows the number of calls disconnected after an irrecoverable external error occurred.
• Calls Disconnected on Irrecoverable Internal Error. Shows the number of calls that were disconnected after an internal system error occurred.
Calls Disconnected by UM on Irrecoverable External Error/sec. This graph charts the number of calls disconnected after an irrecoverable external error occurred in the last second.
Incomplete Signaling Information. This counter displays the number of calls for which the signaling information was missing or incomplete.
Maximum Calls Allowed. This counter displays the length of time that the server concurrently processed the maximum number of calls allowed.
Name TTSed. This counter displays the number of times the system used Text-to-Speech (TTS) to create an audio version of the display name of a subscriber.
Queued OCS User Event Notifications. This counter displays the number of notifications that have been created and not yet submitted for delivery.
Spoken Name Accessed. This counter displays the number of times the system retrieved the recorded name of a user.
Total Worker Process Call Count. This counter displays the number of calls handled by this UM worker process.
Worker Process Recycled. This counter displays the number of times a new UM worker process has been started.
Where to go next Drill down on:
• Clicking a graph or counter in this view displays a metrics popup that describes the counters, provides more detailed data points, and lists current alarms for the selected metric.
Table 160. UM Call Answer General view
DescriptionThis view displays general call answer performance metrics for the Unified Messaging role on the selected Exchange server, which are gathered when the UM Call Answer General collection group is enabled.
Data displayed
Greetings and Voice Message Size. This graph charts the following metrics over the specified time interval:
• Average Greeting Size. Shows the average size of recorded greetings that have been retrieved by the Unified Messaging server.
• Average Recent Voice Message Size. Shows the average size of the last 50 voice messages that have been left for subscribers.
• Average Voice Message Size. Shows the average size of the voice messages left for subscribers.
Foglight for Exchange 5.6.9User and Reference Guide
152
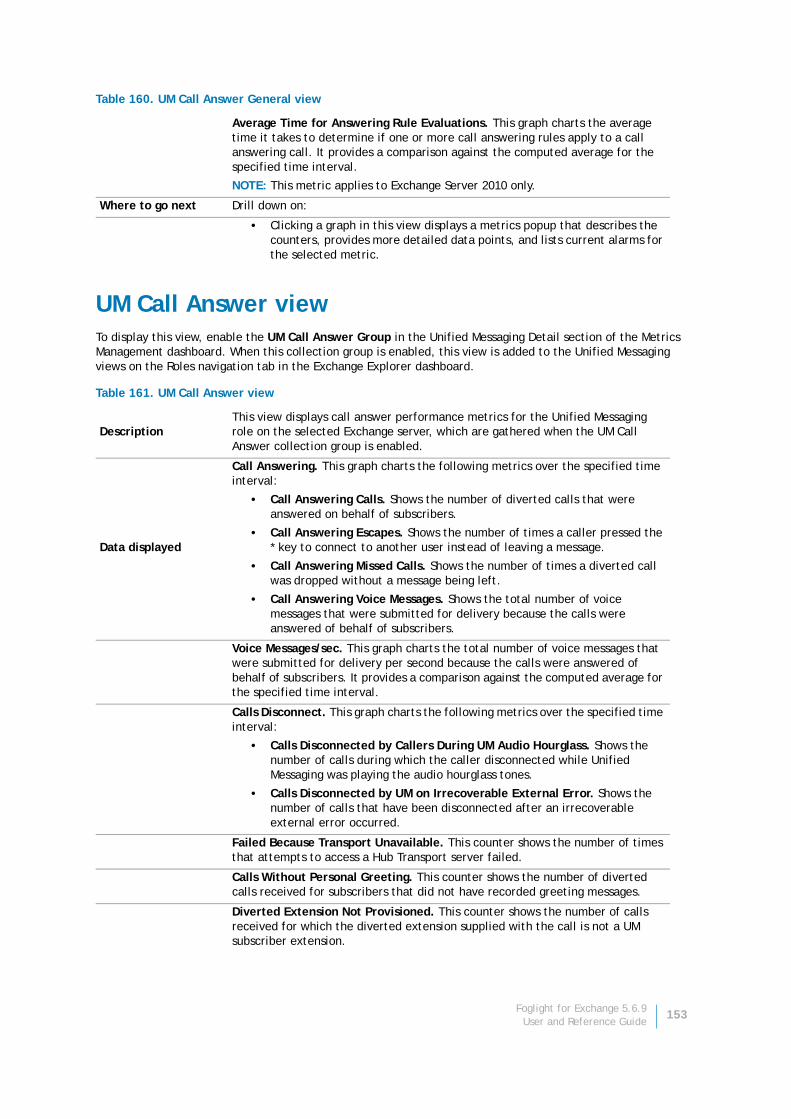
UM Call Answer viewTo display this view, enable the UM Call Answer Group in the Unified Messaging Detail section of the Metrics Management dashboard. When this collection group is enabled, this view is added to the Unified Messaging views on the Roles navigation tab in the Exchange Explorer dashboard.
Average Time for Answering Rule Evaluations. This graph charts the average time it takes to determine if one or more call answering rules apply to a call answering call. It provides a comparison against the computed average for the specified time interval.
NOTE: This metric applies to Exchange Server 2010 only.
Where to go next Drill down on:
• Clicking a graph in this view displays a metrics popup that describes the counters, provides more detailed data points, and lists current alarms for the selected metric.
Table 161. UM Call Answer view
DescriptionThis view displays call answer performance metrics for the Unified Messaging role on the selected Exchange server, which are gathered when the UM Call Answer collection group is enabled.
Data displayed
Call Answering. This graph charts the following metrics over the specified time interval:
• Call Answering Calls. Shows the number of diverted calls that were answered on behalf of subscribers.
• Call Answering Escapes. Shows the number of times a caller pressed the * key to connect to another user instead of leaving a message.
• Call Answering Missed Calls. Shows the number of times a diverted call was dropped without a message being left.
• Call Answering Voice Messages. Shows the total number of voice messages that were submitted for delivery because the calls were answered of behalf of subscribers.
Voice Messages/sec. This graph charts the total number of voice messages that were submitted for delivery per second because the calls were answered of behalf of subscribers. It provides a comparison against the computed average for the specified time interval.
Calls Disconnect. This graph charts the following metrics over the specified time interval:
• Calls Disconnected by Callers During UM Audio Hourglass. Shows the number of calls during which the caller disconnected while Unified Messaging was playing the audio hourglass tones.
• Calls Disconnected by UM on Irrecoverable External Error. Shows the number of calls that have been disconnected after an irrecoverable external error occurred.
Failed Because Transport Unavailable. This counter shows the number of times that attempts to access a Hub Transport server failed.
Calls Without Personal Greeting. This counter shows the number of diverted calls received for subscribers that did not have recorded greeting messages.
Diverted Extension Not Provisioned. This counter shows the number of calls received for which the diverted extension supplied with the call is not a UM subscriber extension.
Table 160. UM Call Answer General view
Foglight for Exchange 5.6.9User and Reference Guide
153
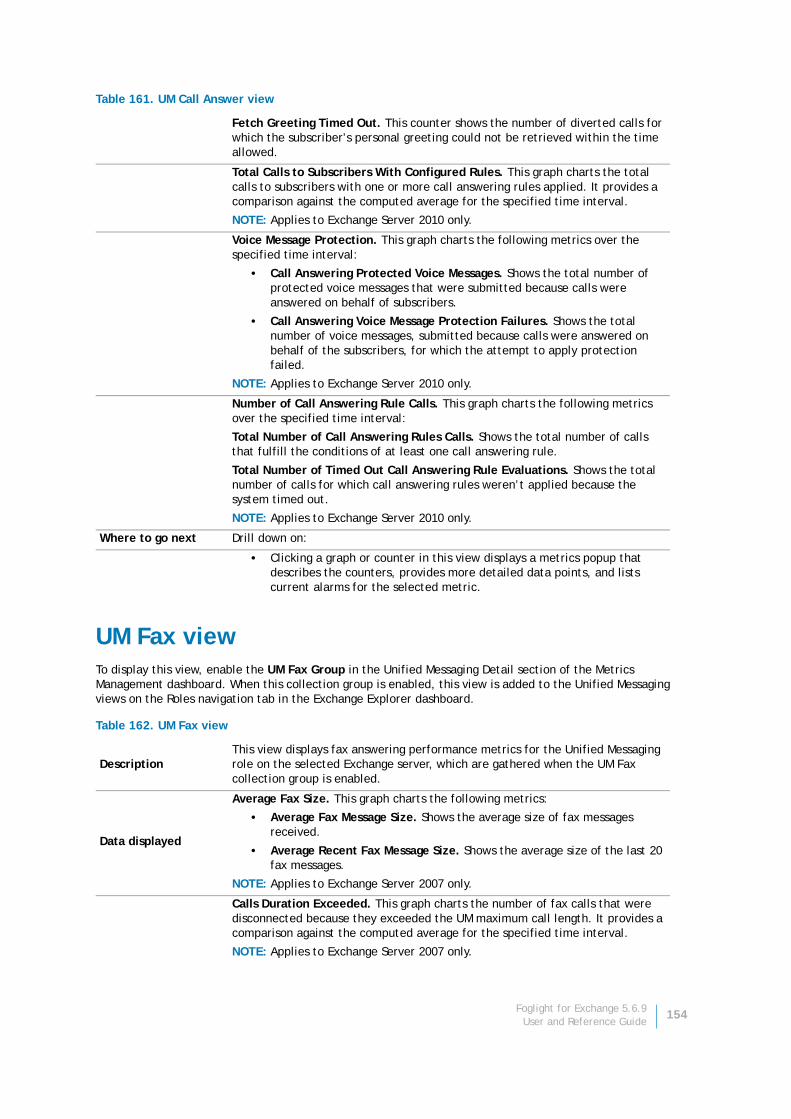
UM Fax viewTo display this view, enable the UM Fax Group in the Unified Messaging Detail section of the Metrics Management dashboard. When this collection group is enabled, this view is added to the Unified Messaging views on the Roles navigation tab in the Exchange Explorer dashboard.
Fetch Greeting Timed Out. This counter shows the number of diverted calls for which the subscriber’s personal greeting could not be retrieved within the time allowed.
Total Calls to Subscribers With Configured Rules. This graph charts the total calls to subscribers with one or more call answering rules applied. It provides a comparison against the computed average for the specified time interval.
NOTE: Applies to Exchange Server 2010 only.
Voice Message Protection. This graph charts the following metrics over the specified time interval:
• Call Answering Protected Voice Messages. Shows the total number of protected voice messages that were submitted because calls were answered on behalf of subscribers.
• Call Answering Voice Message Protection Failures. Shows the total number of voice messages, submitted because calls were answered on behalf of the subscribers, for which the attempt to apply protection failed.
NOTE: Applies to Exchange Server 2010 only.
Number of Call Answering Rule Calls. This graph charts the following metrics over the specified time interval:
Total Number of Call Answering Rules Calls. Shows the total number of calls that fulfill the conditions of at least one call answering rule.
Total Number of Timed Out Call Answering Rule Evaluations. Shows the total number of calls for which call answering rules weren’t applied because the system timed out.
NOTE: Applies to Exchange Server 2010 only.
Where to go next Drill down on:
• Clicking a graph or counter in this view displays a metrics popup that describes the counters, provides more detailed data points, and lists current alarms for the selected metric.
Table 162. UM Fax view
DescriptionThis view displays fax answering performance metrics for the Unified Messaging role on the selected Exchange server, which are gathered when the UM Fax collection group is enabled.
Data displayed
Average Fax Size. This graph charts the following metrics:
• Average Fax Message Size. Shows the average size of fax messages received.
• Average Recent Fax Message Size. Shows the average size of the last 20 fax messages.
NOTE: Applies to Exchange Server 2007 only.
Calls Duration Exceeded. This graph charts the number of fax calls that were disconnected because they exceeded the UM maximum call length. It provides a comparison against the computed average for the specified time interval.
NOTE: Applies to Exchange Server 2007 only.
Table 161. UM Call Answer view
Foglight for Exchange 5.6.9User and Reference Guide
154
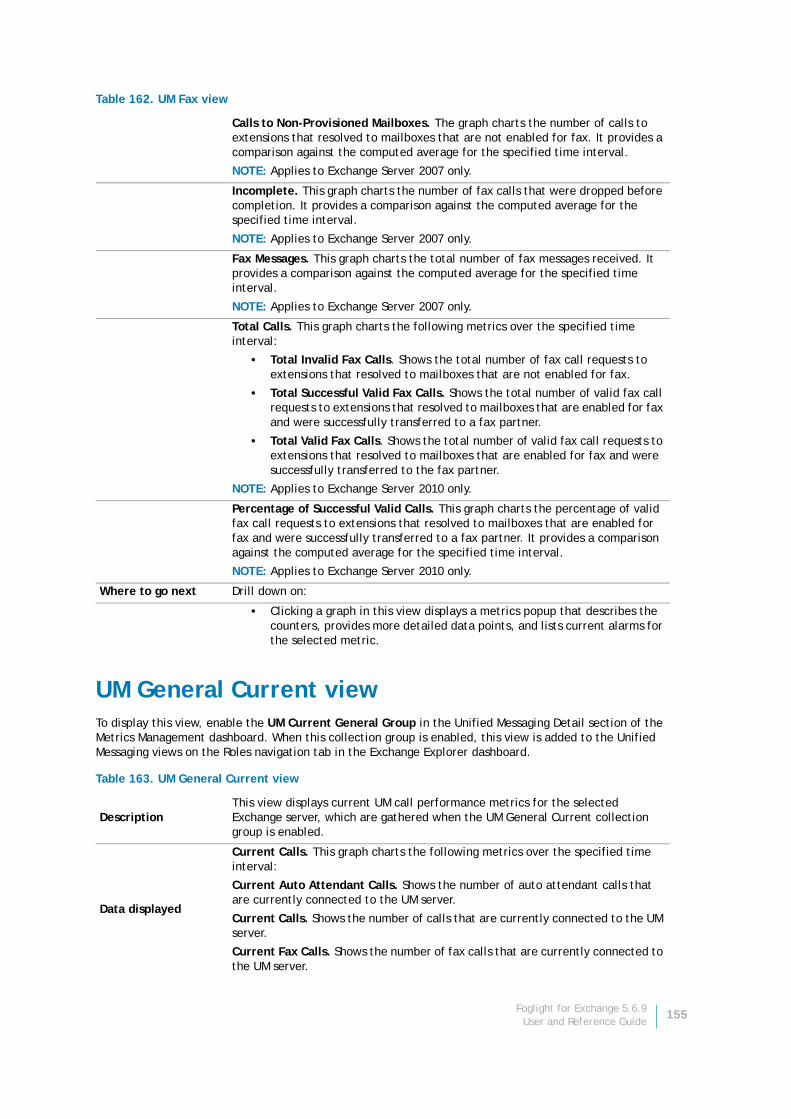
UM General Current viewTo display this view, enable the UM Current General Group in the Unified Messaging Detail section of the Metrics Management dashboard. When this collection group is enabled, this view is added to the Unified Messaging views on the Roles navigation tab in the Exchange Explorer dashboard.
Calls to Non-Provisioned Mailboxes. The graph charts the number of calls to extensions that resolved to mailboxes that are not enabled for fax. It provides a comparison against the computed average for the specified time interval.
NOTE: Applies to Exchange Server 2007 only.
Incomplete. This graph charts the number of fax calls that were dropped before completion. It provides a comparison against the computed average for the specified time interval.
NOTE: Applies to Exchange Server 2007 only.
Fax Messages. This graph charts the total number of fax messages received. It provides a comparison against the computed average for the specified time interval.
NOTE: Applies to Exchange Server 2007 only.
Total Calls. This graph charts the following metrics over the specified time interval:
• Total Invalid Fax Calls. Shows the total number of fax call requests to extensions that resolved to mailboxes that are not enabled for fax.
• Total Successful Valid Fax Calls. Shows the total number of valid fax call requests to extensions that resolved to mailboxes that are enabled for fax and were successfully transferred to a fax partner.
• Total Valid Fax Calls. Shows the total number of valid fax call requests to extensions that resolved to mailboxes that are enabled for fax and were successfully transferred to the fax partner.
NOTE: Applies to Exchange Server 2010 only.
Percentage of Successful Valid Calls. This graph charts the percentage of valid fax call requests to extensions that resolved to mailboxes that are enabled for fax and were successfully transferred to a fax partner. It provides a comparison against the computed average for the specified time interval.
NOTE: Applies to Exchange Server 2010 only.
Where to go next Drill down on:
• Clicking a graph in this view displays a metrics popup that describes the counters, provides more detailed data points, and lists current alarms for the selected metric.
Table 163. UM General Current view
DescriptionThis view displays current UM call performance metrics for the selected Exchange server, which are gathered when the UM General Current collection group is enabled.
Data displayed
Current Calls. This graph charts the following metrics over the specified time interval:
Current Auto Attendant Calls. Shows the number of auto attendant calls that are currently connected to the UM server.
Current Calls. Shows the number of calls that are currently connected to the UM server.
Current Fax Calls. Shows the number of fax calls that are currently connected to the UM server.
Table 162. UM Fax view
Foglight for Exchange 5.6.9User and Reference Guide
155
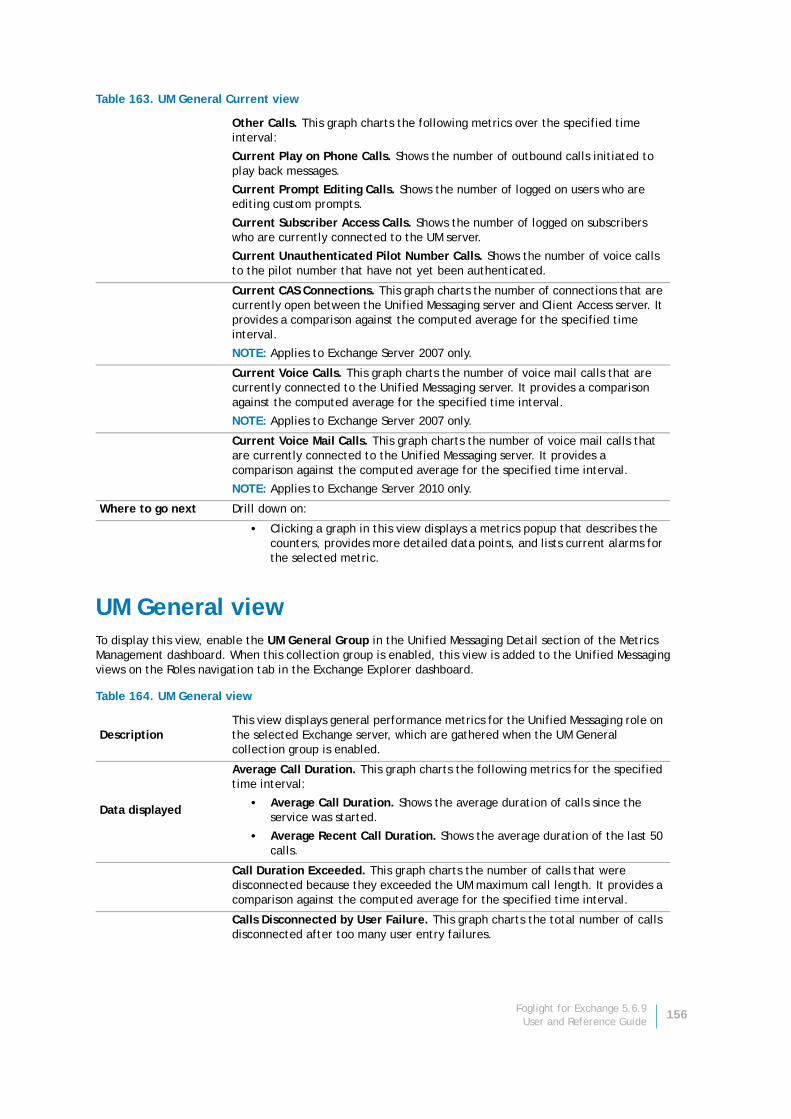
UM General viewTo display this view, enable the UM General Group in the Unified Messaging Detail section of the Metrics Management dashboard. When this collection group is enabled, this view is added to the Unified Messaging views on the Roles navigation tab in the Exchange Explorer dashboard.
Other Calls. This graph charts the following metrics over the specified time interval:
Current Play on Phone Calls. Shows the number of outbound calls initiated to play back messages.
Current Prompt Editing Calls. Shows the number of logged on users who are editing custom prompts.
Current Subscriber Access Calls. Shows the number of logged on subscribers who are currently connected to the UM server.
Current Unauthenticated Pilot Number Calls. Shows the number of voice calls to the pilot number that have not yet been authenticated.
Current CAS Connections. This graph charts the number of connections that are currently open between the Unified Messaging server and Client Access server. It provides a comparison against the computed average for the specified time interval.
NOTE: Applies to Exchange Server 2007 only.
Current Voice Calls. This graph charts the number of voice mail calls that are currently connected to the Unified Messaging server. It provides a comparison against the computed average for the specified time interval.
NOTE: Applies to Exchange Server 2007 only.
Current Voice Mail Calls. This graph charts the number of voice mail calls that are currently connected to the Unified Messaging server. It provides a comparison against the computed average for the specified time interval.
NOTE: Applies to Exchange Server 2010 only.
Where to go next Drill down on:
• Clicking a graph in this view displays a metrics popup that describes the counters, provides more detailed data points, and lists current alarms for the selected metric.
Table 164. UM General view
DescriptionThis view displays general performance metrics for the Unified Messaging role on the selected Exchange server, which are gathered when the UM General collection group is enabled.
Data displayed
Average Call Duration. This graph charts the following metrics for the specified time interval:
• Average Call Duration. Shows the average duration of calls since the service was started.
• Average Recent Call Duration. Shows the average duration of the last 50 calls.
Call Duration Exceeded. This graph charts the number of calls that were disconnected because they exceeded the UM maximum call length. It provides a comparison against the computed average for the specified time interval.
Calls Disconnected by User Failure. This graph charts the total number of calls disconnected after too many user entry failures.
Table 163. UM General Current view
Foglight for Exchange 5.6.9User and Reference Guide
156

Total Calls. This graph charts the following metrics for the specified time interval:
• Total Calls. Shows the number of calls answered or placed since the service was started. Transfers are not included.
• Total Play on Phone Calls. Shows the total number of Play on Phone calls that have been initiated since the service was started.
Total Calls/sec. This graph charts the number of new calls that have arrived in the last second. It provides a comparison against the computed average for the specified time interval.
Delayed Calls. This counter shows the number of calls that experienced one or more delays longer than two seconds.
OCS User Event Notifications. This counter shows the number of OCS user event notifications that occurred since the service was started.
User Response Latency. This counter shows the average response time for the system to respond to a user request.
Calls Rejected. This graph charts the total number of new invitations that have been rejected. It provides a comparison against the computed average for the specified time interval.
NOTE: Applies to Exchange Server 2007 only.
Calls Rejected/sec. This graph charts the number of new call invitations that have been rejected in the last second. It provides a comparison against the computed average for the specified time interval.
NOTE: Applies to Exchange Server 2007 only.
Caller ID Resolutions. This graph charts the following metrics for the specified time interval:
• Caller ID Resolutions Attempted. Shows the number of caller ID resolutions that were attempted.
• Caller ID Resolutions Succeeded. Shows the number of caller IDs that were resolved successfully.
NOTE: Applies to Exchange Server 2010 only.
Percent Successful Extension Caller ID Resolutions. This graph charts the percentage of caller IDs that were resolved successfully. It provides a comparison against the computed average for the specified time interval.
NOTE: Applies to Exchange Server 2010 only.
Extension Caller ID Resolutions. This graph charts the following metrics over the specified time interval:
• Extension Caller ID Resolutions Attempted. Shows the number of caller ID resolutions that were attempted.
• Extension Caller ID Resolutions Succeeded. Shows the number of successful attempts to resolve caller IDs that contained no “@” or “+” signs and were of the same length as the dial plan’s extension.
NOTE: Applies to Exchange Server 2010 only.
Where to go next Drill down on:
• Clicking a graph or counter in this view displays a metrics popup that describes the counters, provides more detailed data points, and lists current alarms for the selected metric.
Table 164. UM General view
Foglight for Exchange 5.6.9User and Reference Guide
157
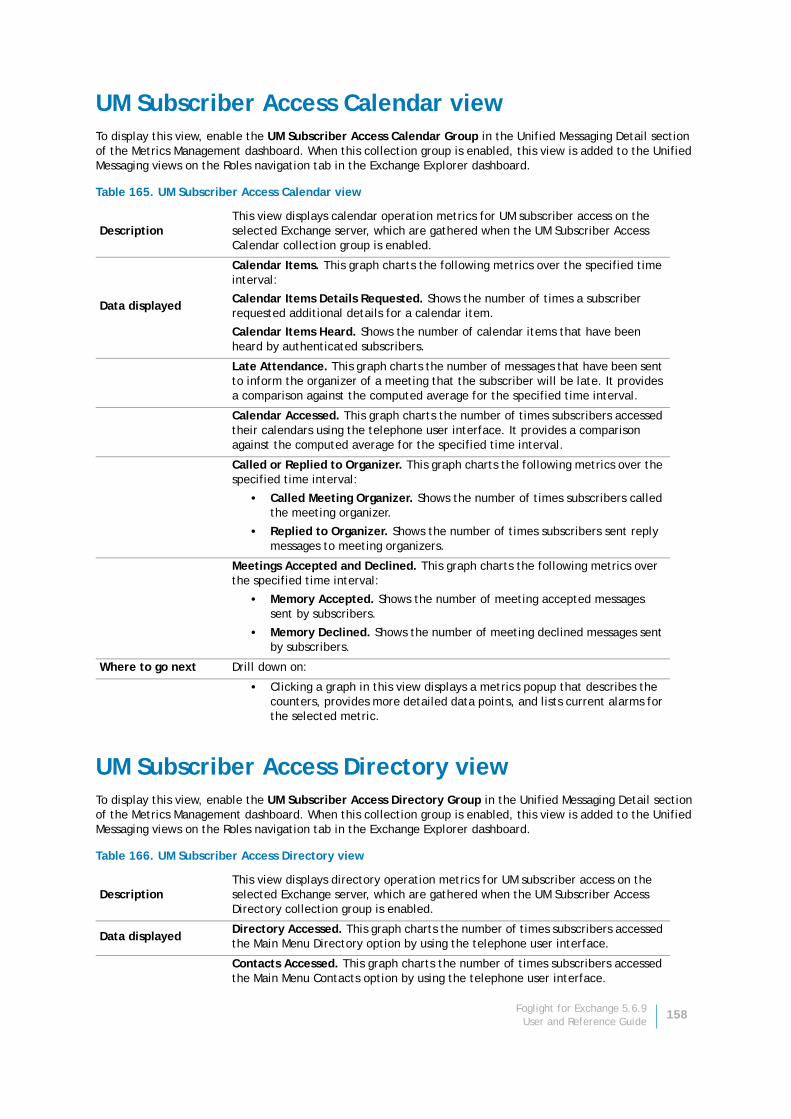
UM Subscriber Access Calendar viewTo display this view, enable the UM Subscriber Access Calendar Group in the Unified Messaging Detail section of the Metrics Management dashboard. When this collection group is enabled, this view is added to the Unified Messaging views on the Roles navigation tab in the Exchange Explorer dashboard.
UM Subscriber Access Directory viewTo display this view, enable the UM Subscriber Access Directory Group in the Unified Messaging Detail section of the Metrics Management dashboard. When this collection group is enabled, this view is added to the Unified Messaging views on the Roles navigation tab in the Exchange Explorer dashboard.
Table 165. UM Subscriber Access Calendar view
DescriptionThis view displays calendar operation metrics for UM subscriber access on the selected Exchange server, which are gathered when the UM Subscriber Access Calendar collection group is enabled.
Data displayed
Calendar Items. This graph charts the following metrics over the specified time interval:
Calendar Items Details Requested. Shows the number of times a subscriber requested additional details for a calendar item.
Calendar Items Heard. Shows the number of calendar items that have been heard by authenticated subscribers.
Late Attendance. This graph charts the number of messages that have been sent to inform the organizer of a meeting that the subscriber will be late. It provides a comparison against the computed average for the specified time interval.
Calendar Accessed. This graph charts the number of times subscribers accessed their calendars using the telephone user interface. It provides a comparison against the computed average for the specified time interval.
Called or Replied to Organizer. This graph charts the following metrics over the specified time interval:
• Called Meeting Organizer. Shows the number of times subscribers called the meeting organizer.
• Replied to Organizer. Shows the number of times subscribers sent reply messages to meeting organizers.
Meetings Accepted and Declined. This graph charts the following metrics over the specified time interval:
• Memory Accepted. Shows the number of meeting accepted messages sent by subscribers.
• Memory Declined. Shows the number of meeting declined messages sent by subscribers.
Where to go next Drill down on:
• Clicking a graph in this view displays a metrics popup that describes the counters, provides more detailed data points, and lists current alarms for the selected metric.
Table 166. UM Subscriber Access Directory view
DescriptionThis view displays directory operation metrics for UM subscriber access on the selected Exchange server, which are gathered when the UM Subscriber Access Directory collection group is enabled.
Data displayedDirectory Accessed. This graph charts the number of times subscribers accessed the Main Menu Directory option by using the telephone user interface.
Contacts Accessed. This graph charts the number of times subscribers accessed the Main Menu Contacts option by using the telephone user interface.
Foglight for Exchange 5.6.9User and Reference Guide
158
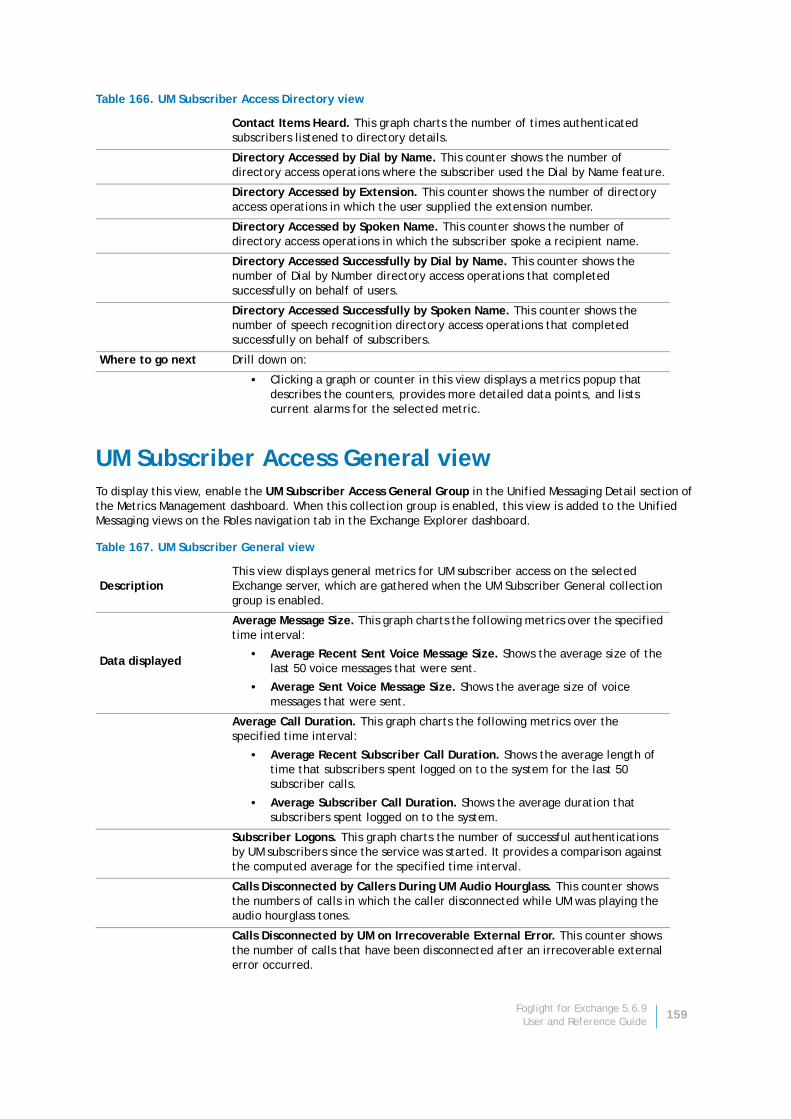
UM Subscriber Access General viewTo display this view, enable the UM Subscriber Access General Group in the Unified Messaging Detail section of the Metrics Management dashboard. When this collection group is enabled, this view is added to the Unified Messaging views on the Roles navigation tab in the Exchange Explorer dashboard.
Contact Items Heard. This graph charts the number of times authenticated subscribers listened to directory details.
Directory Accessed by Dial by Name. This counter shows the number of directory access operations where the subscriber used the Dial by Name feature.
Directory Accessed by Extension. This counter shows the number of directory access operations in which the user supplied the extension number.
Directory Accessed by Spoken Name. This counter shows the number of directory access operations in which the subscriber spoke a recipient name.
Directory Accessed Successfully by Dial by Name. This counter shows the number of Dial by Number directory access operations that completed successfully on behalf of users.
Directory Accessed Successfully by Spoken Name. This counter shows the number of speech recognition directory access operations that completed successfully on behalf of subscribers.
Where to go next Drill down on:
• Clicking a graph or counter in this view displays a metrics popup that describes the counters, provides more detailed data points, and lists current alarms for the selected metric.
Table 167. UM Subscriber General view
DescriptionThis view displays general metrics for UM subscriber access on the selected Exchange server, which are gathered when the UM Subscriber General collection group is enabled.
Data displayed
Average Message Size. This graph charts the following metrics over the specified time interval:
• Average Recent Sent Voice Message Size. Shows the average size of the last 50 voice messages that were sent.
• Average Sent Voice Message Size. Shows the average size of voice messages that were sent.
Average Call Duration. This graph charts the following metrics over the specified time interval:
• Average Recent Subscriber Call Duration. Shows the average length of time that subscribers spent logged on to the system for the last 50 subscriber calls.
• Average Subscriber Call Duration. Shows the average duration that subscribers spent logged on to the system.
Subscriber Logons. This graph charts the number of successful authentications by UM subscribers since the service was started. It provides a comparison against the computed average for the specified time interval.
Calls Disconnected by Callers During UM Audio Hourglass. This counter shows the numbers of calls in which the caller disconnected while UM was playing the audio hourglass tones.
Calls Disconnected by UM on Irrecoverable External Error. This counter shows the number of calls that have been disconnected after an irrecoverable external error occurred.
Table 166. UM Subscriber Access Directory view
Foglight for Exchange 5.6.9User and Reference Guide
159

UM Subscriber Access Message viewTo display this view, enable the UM Subscriber Access Message Group in the Unified Messaging Detail section of the Metrics Management dashboard. When this collection group is enabled, this view is added to the Unified Messaging views on the Roles navigation tab in the Exchange Explorer dashboard.
Launched Calls. This counter shows the number of subscriber calls that resulted in an outbound call being placed.
Subscriber Authentication Failures. This counter shows the number of authentication failures that have occurred since the service was started.
Subscriber Logon Failures. This counter shows the number of logon failures since the service was started.
Where to go next Drill down on:
• Clicking a graph or counter in this view displays a metrics popup that describes the counters, provides more detailed data points, and lists current alarms for the selected metric.
Table 168. UM Subscriber Access Message view
DescriptionThis view displays message operation metrics for UM subscriber access on the selected Exchange server, which are gathered when the UM Subscriber Access Message collection group is enabled.
Data displayed
Email Messages Heard, Deleted and Queue Accessed. This graph charts the following metrics over the specified time interval:
• Email Messages Queue Accessed. Shows the number of times subscribers accessed their email message queue by using the telephone user interface.
• Email Messages Deleted. Shows the number of email messages that were deleted by authenticated subscribers.
• Email Messages Heard. Shows the number of email messages that were heard by authenticated subscribers.
Forward and Reply Messages Sent. This graph charts the following metrics over the specified time interval:
• Forward Messages Sent. Shows the number of messages that have been forwarded by authenticated subscribers.
• Reply Messages Sent. Shows the number of replies sent by authenticated subscribers.
Voice Messages Deleted, Heard and Sent. This graph charts the following metrics over the specified time interval:
• Voice Messages Deleted. Shows the number of voice messages that were deleted by authenticated subscribers.
• Voice Messages Heard. Shows the number of voice messages played to subscribers. This count is incremented as soon as playback starts.
• Voice Messages Sent. Shows the number of voice messages that have been sent by authenticated UM subscribers.
Protected Voice Messages Heard. This counter shows the number of protected voice messages played to subscribers.
NOTE: Applies to Exchange Server 2010 only.
Protected Voice Messages Sent. This counter shows the number of protected voice messages sent by authenticated UM subscribers.
NOTE: Applies to Exchange Server 2010 only.
Table 167. UM Subscriber General view
Foglight for Exchange 5.6.9User and Reference Guide
160
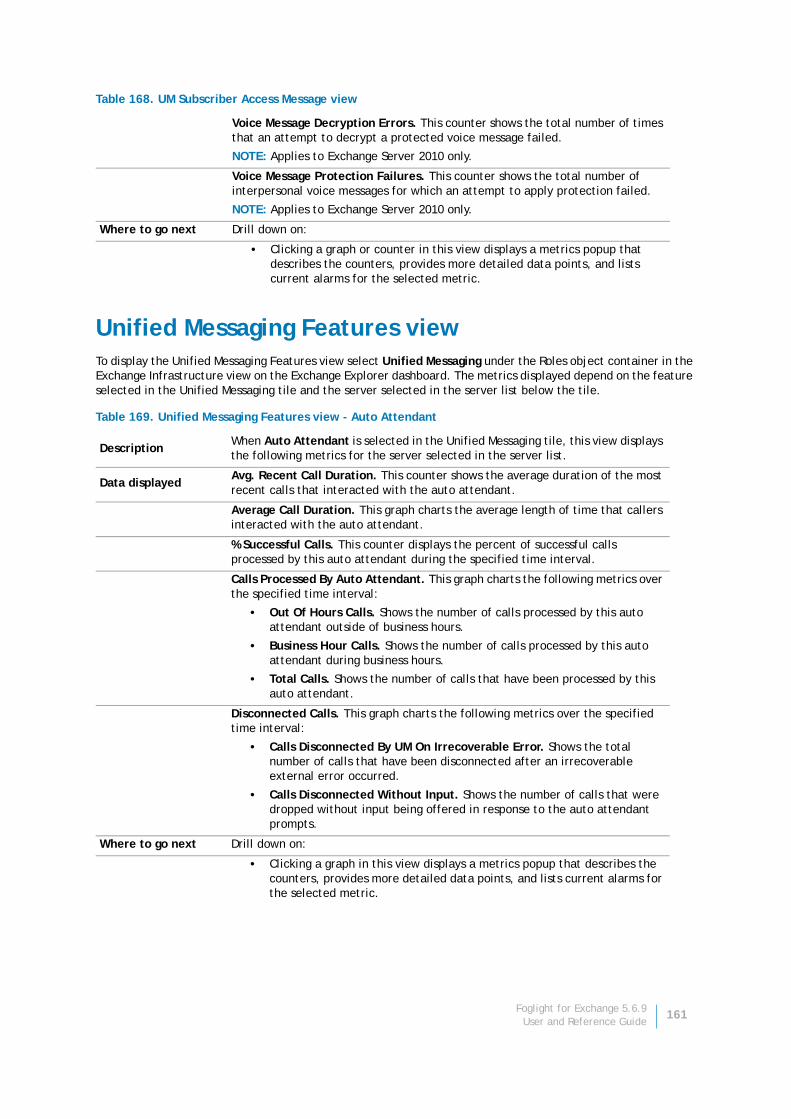
Unified Messaging Features viewTo display the Unified Messaging Features view select Unified Messaging under the Roles object container in the Exchange Infrastructure view on the Exchange Explorer dashboard. The metrics displayed depend on the feature selected in the Unified Messaging tile and the server selected in the server list below the tile.
Voice Message Decryption Errors. This counter shows the total number of times that an attempt to decrypt a protected voice message failed.
NOTE: Applies to Exchange Server 2010 only.
Voice Message Protection Failures. This counter shows the total number of interpersonal voice messages for which an attempt to apply protection failed.
NOTE: Applies to Exchange Server 2010 only.
Where to go next Drill down on:
• Clicking a graph or counter in this view displays a metrics popup that describes the counters, provides more detailed data points, and lists current alarms for the selected metric.
Table 169. Unified Messaging Features view - Auto Attendant
DescriptionWhen Auto Attendant is selected in the Unified Messaging tile, this view displays the following metrics for the server selected in the server list.
Data displayedAvg. Recent Call Duration. This counter shows the average duration of the most recent calls that interacted with the auto attendant.
Average Call Duration. This graph charts the average length of time that callers interacted with the auto attendant.
% Successful Calls. This counter displays the percent of successful calls processed by this auto attendant during the specified time interval.
Calls Processed By Auto Attendant. This graph charts the following metrics over the specified time interval:
• Out Of Hours Calls. Shows the number of calls processed by this auto attendant outside of business hours.
• Business Hour Calls. Shows the number of calls processed by this auto attendant during business hours.
• Total Calls. Shows the number of calls that have been processed by this auto attendant.
Disconnected Calls. This graph charts the following metrics over the specified time interval:
• Calls Disconnected By UM On Irrecoverable Error. Shows the total number of calls that have been disconnected after an irrecoverable external error occurred.
• Calls Disconnected Without Input. Shows the number of calls that were dropped without input being offered in response to the auto attendant prompts.
Where to go next Drill down on:
• Clicking a graph in this view displays a metrics popup that describes the counters, provides more detailed data points, and lists current alarms for the selected metric.
Table 168. UM Subscriber Access Message view
Foglight for Exchange 5.6.9User and Reference Guide
161
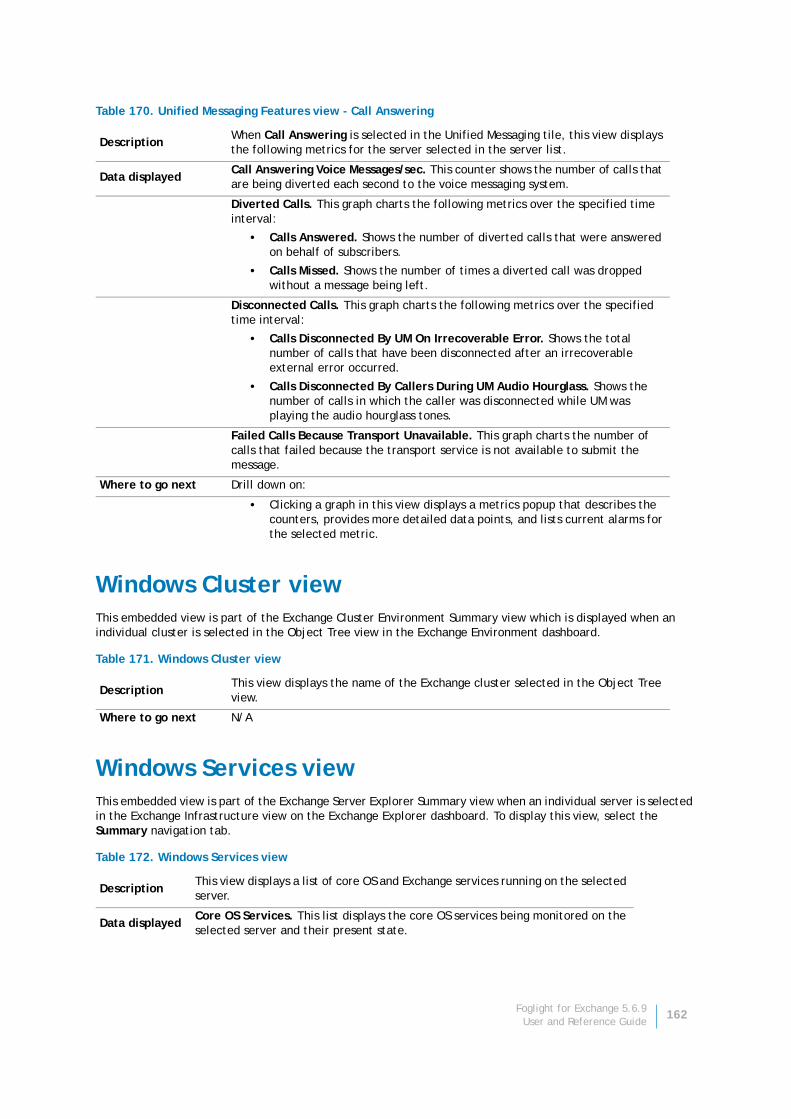
Windows Cluster viewThis embedded view is part of the Exchange Cluster Environment Summary view which is displayed when an individual cluster is selected in the Object Tree view in the Exchange Environment dashboard.
Windows Services viewThis embedded view is part of the Exchange Server Explorer Summary view when an individual server is selected in the Exchange Infrastructure view on the Exchange Explorer dashboard. To display this view, select the Summary navigation tab.
Table 170. Unified Messaging Features view - Call Answering
DescriptionWhen Call Answering is selected in the Unified Messaging tile, this view displays the following metrics for the server selected in the server list.
Data displayedCall Answering Voice Messages/sec. This counter shows the number of calls that are being diverted each second to the voice messaging system.
Diverted Calls. This graph charts the following metrics over the specified time interval:
• Calls Answered. Shows the number of diverted calls that were answered on behalf of subscribers.
• Calls Missed. Shows the number of times a diverted call was dropped without a message being left.
Disconnected Calls. This graph charts the following metrics over the specified time interval:
• Calls Disconnected By UM On Irrecoverable Error. Shows the total number of calls that have been disconnected after an irrecoverable external error occurred.
• Calls Disconnected By Callers During UM Audio Hourglass. Shows the number of calls in which the caller was disconnected while UM was playing the audio hourglass tones.
Failed Calls Because Transport Unavailable. This graph charts the number of calls that failed because the transport service is not available to submit the message.
Where to go next Drill down on:
• Clicking a graph in this view displays a metrics popup that describes the counters, provides more detailed data points, and lists current alarms for the selected metric.
Table 171. Windows Cluster view
DescriptionThis view displays the name of the Exchange cluster selected in the Object Tree view.
Where to go next N/A
Table 172. Windows Services view
DescriptionThis view displays a list of core OS and Exchange services running on the selected server.
Data displayedCore OS Services. This list displays the core OS services being monitored on the selected server and their present state.
Foglight for Exchange 5.6.9User and Reference Guide
162
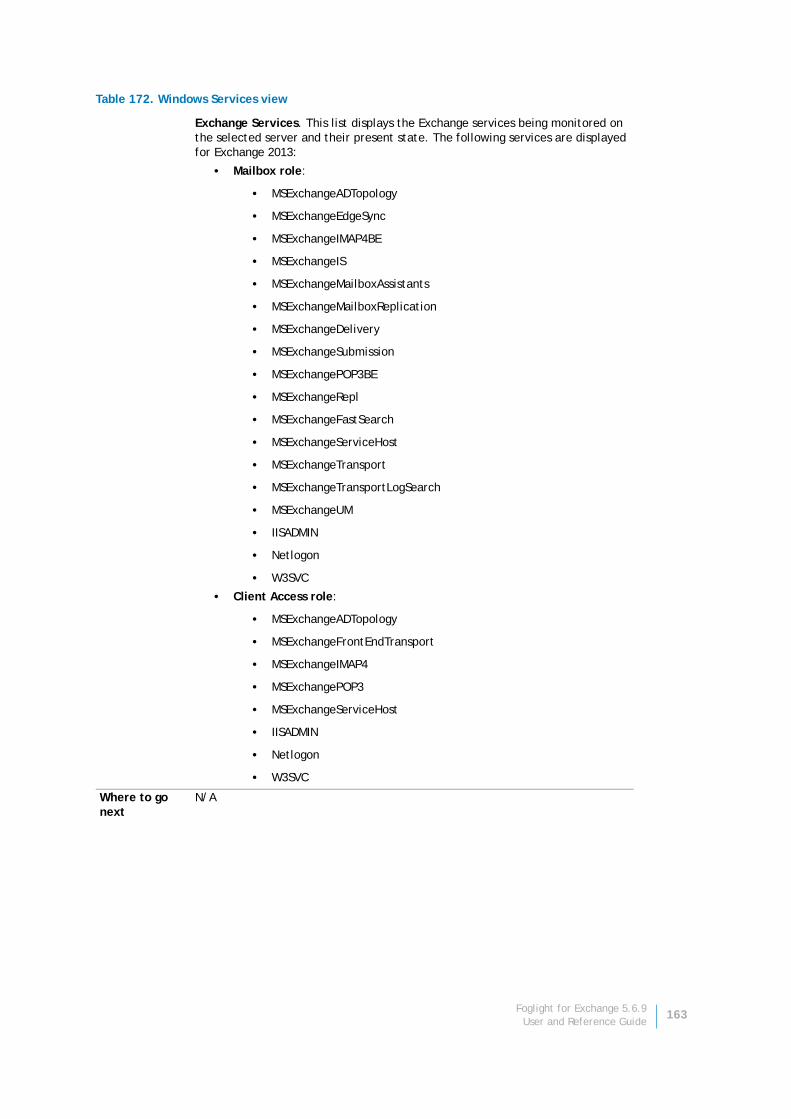
Exchange Services. This list displays the Exchange services being monitored on the selected server and their present state. The following services are displayed for Exchange 2013:
• Mailbox role:
• MSExchangeADTopology
• MSExchangeEdgeSync
• MSExchangeIMAP4BE
• MSExchangeIS
• MSExchangeMailboxAssistants
• MSExchangeMailboxReplication
• MSExchangeDelivery
• MSExchangeSubmission
• MSExchangePOP3BE
• MSExchangeRepl
• MSExchangeFastSearch
• MSExchangeServiceHost
• MSExchangeTransport
• MSExchangeTransportLogSearch
• MSExchangeUM
• IISADMIN
• Netlogon
• W3SVC
• Client Access role:
• MSExchangeADTopology
• MSExchangeFrontEndTransport
• MSExchangeIMAP4
• MSExchangePOP3
• MSExchangeServiceHost
• IISADMIN
• Netlogon
• W3SVC
Where to go next
N/A
Table 172. Windows Services view
Foglight for Exchange 5.6.9User and Reference Guide
163
6
Foglight for Exchange rules
Foglight for Exchange includes a number of predefined rules to monitor all critical components of Exchange on a continuous basis to ensure that the Exchange organization is functioning properly. The rules included in Foglight for Exchange alert you to key conditions that may affect the health of Exchange. Foglight allows you to modify these predefined rules or create your own rules to ensure you are monitoring statistics and alerting on conditions specific to your Exchange environment.
Foglight for Exchange provides additional dashboards for managing Foglight for Exchange rules:
• Rules dashboard (Dashboards > Administration > Rules > All)
• Exchange Rule Management dashboard (Dashboards > Exchange > Rule Management)
This chapter describes the Exchange Rule Management dashboard and explains the tasks that can be performed from this dashboard:
• Rules dashboard
• Exchange Rule Management dashboard
• Managing Foglight for Exchange rules
• Rules reference
Rules dashboardThe Rules dashboard lists all rules that exist in your environment and allows you to drill down to rule definitions. From this dashboard you can copy, edit, and remove Foglight rules.
To review and edit rules:
1 In the navigation panel, under Homes, click Administration.
2 In the Administration dashboard, click Rules > All.
The Rules dashboard opens.
3 From the Cartridge list, select ExchangeMonitoring.
The dashboard refreshes to display only the Foglight for Exchange rules.
4 From here, you can perform the following tasks:
• Review a short description of the rule.
NOTE: All original rules in each cartridge are reset when the cartridge is upgraded; therefore if you applied custom conditions to any original rules these modifications will be lost. It is recommended that when modifying rules you make a copy of the original, disable the original and enable the copy with the new condition. Use the copy rule icon to the far right of a rule on the Manage Rules dashboard to copy a rule.
NOTE: Predefined rules may be modified during regular software updates. To avoid losing changes to these rules, we recommend copying a rule and making edits to the copy. Enable the copy and disable the original rule. You may want to identify your custom rules with a unique prefix to make them easy to find.
Foglight for Exchange 5.6.9User and Reference Guide
164
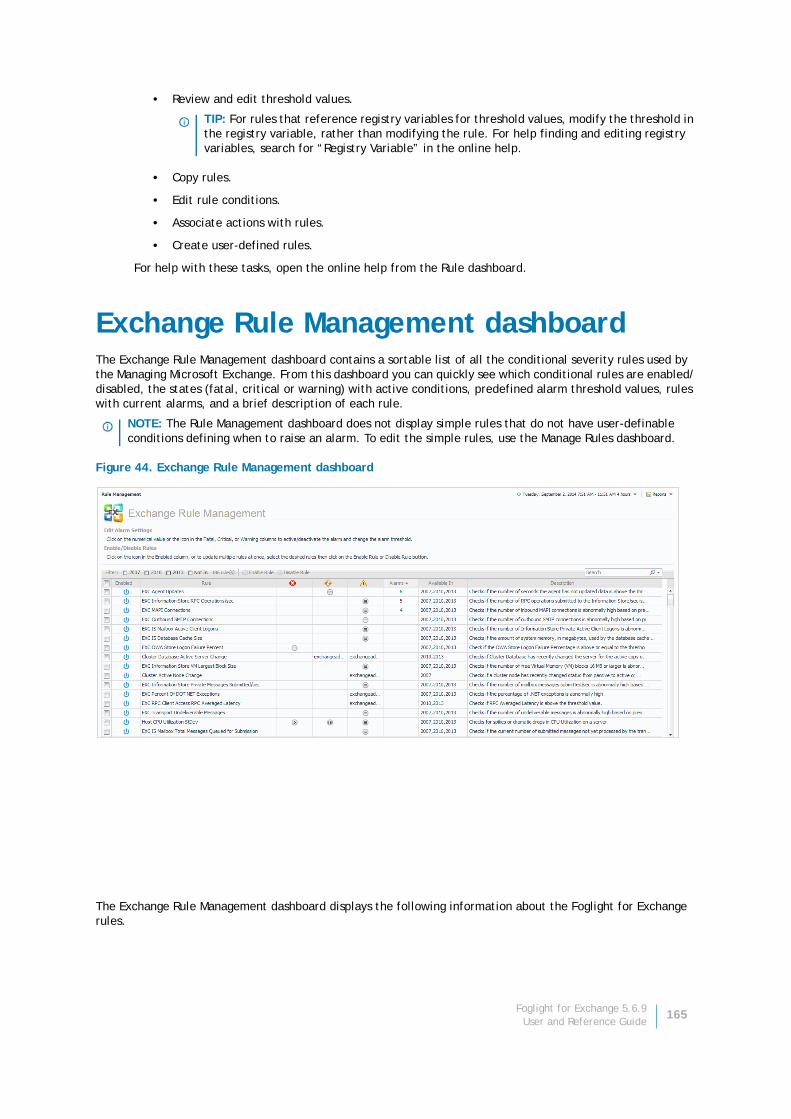
• Review and edit threshold values.
• Copy rules.
• Edit rule conditions.
• Associate actions with rules.
• Create user-defined rules.
For help with these tasks, open the online help from the Rule dashboard.
Exchange Rule Management dashboardThe Exchange Rule Management dashboard contains a sortable list of all the conditional severity rules used by the Managing Microsoft Exchange. From this dashboard you can quickly see which conditional rules are enabled/disabled, the states (fatal, critical or warning) with active conditions, predefined alarm threshold values, rules with current alarms, and a brief description of each rule.
Figure 44. Exchange Rule Management dashboard
The Exchange Rule Management dashboard displays the following information about the Foglight for Exchange rules.
TIP: For rules that reference registry variables for threshold values, modify the threshold in the registry variable, rather than modifying the rule. For help finding and editing registry variables, search for “Registry Variable” in the online help.
NOTE: The Rule Management dashboard does not display simple rules that do not have user-definable conditions defining when to raise an alarm. To edit the simple rules, use the Manage Rules dashboard.
Foglight for Exchange 5.6.9User and Reference Guide
165
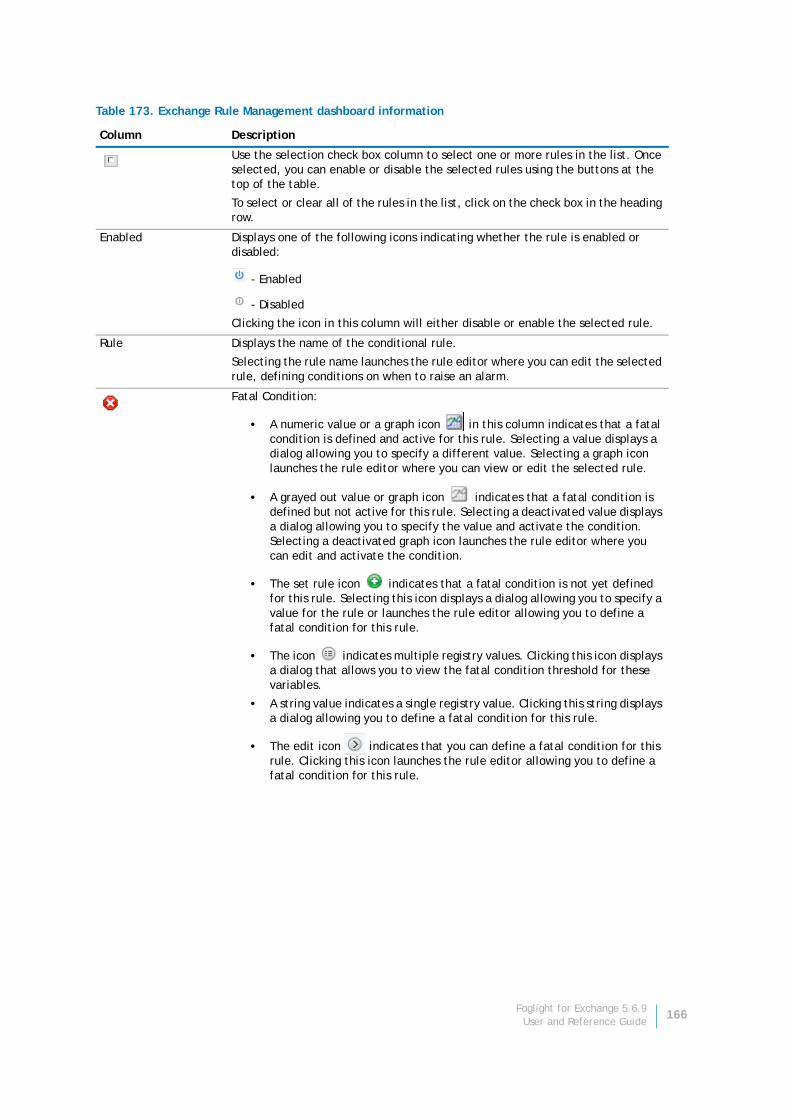
Table 173. Exchange Rule Management dashboard information
Column Description
Use the selection check box column to select one or more rules in the list. Once selected, you can enable or disable the selected rules using the buttons at the top of the table.
To select or clear all of the rules in the list, click on the check box in the heading row.
Enabled Displays one of the following icons indicating whether the rule is enabled or disabled:
- Enabled
- Disabled
Clicking the icon in this column will either disable or enable the selected rule.
Rule Displays the name of the conditional rule.
Selecting the rule name launches the rule editor where you can edit the selected rule, defining conditions on when to raise an alarm.
Fatal Condition:
• A numeric value or a graph icon in this column indicates that a fatal condition is defined and active for this rule. Selecting a value displays a dialog allowing you to specify a different value. Selecting a graph icon launches the rule editor where you can view or edit the selected rule.
• A grayed out value or graph icon indicates that a fatal condition is defined but not active for this rule. Selecting a deactivated value displays a dialog allowing you to specify the value and activate the condition. Selecting a deactivated graph icon launches the rule editor where you can edit and activate the condition.
• The set rule icon indicates that a fatal condition is not yet defined for this rule. Selecting this icon displays a dialog allowing you to specify a value for the rule or launches the rule editor allowing you to define a fatal condition for this rule.
• The icon indicates multiple registry values. Clicking this icon displays a dialog that allows you to view the fatal condition threshold for these variables.
• A string value indicates a single registry value. Clicking this string displays a dialog allowing you to define a fatal condition for this rule.
• The edit icon indicates that you can define a fatal condition for this rule. Clicking this icon launches the rule editor allowing you to define a fatal condition for this rule.
Foglight for Exchange 5.6.9User and Reference Guide
166
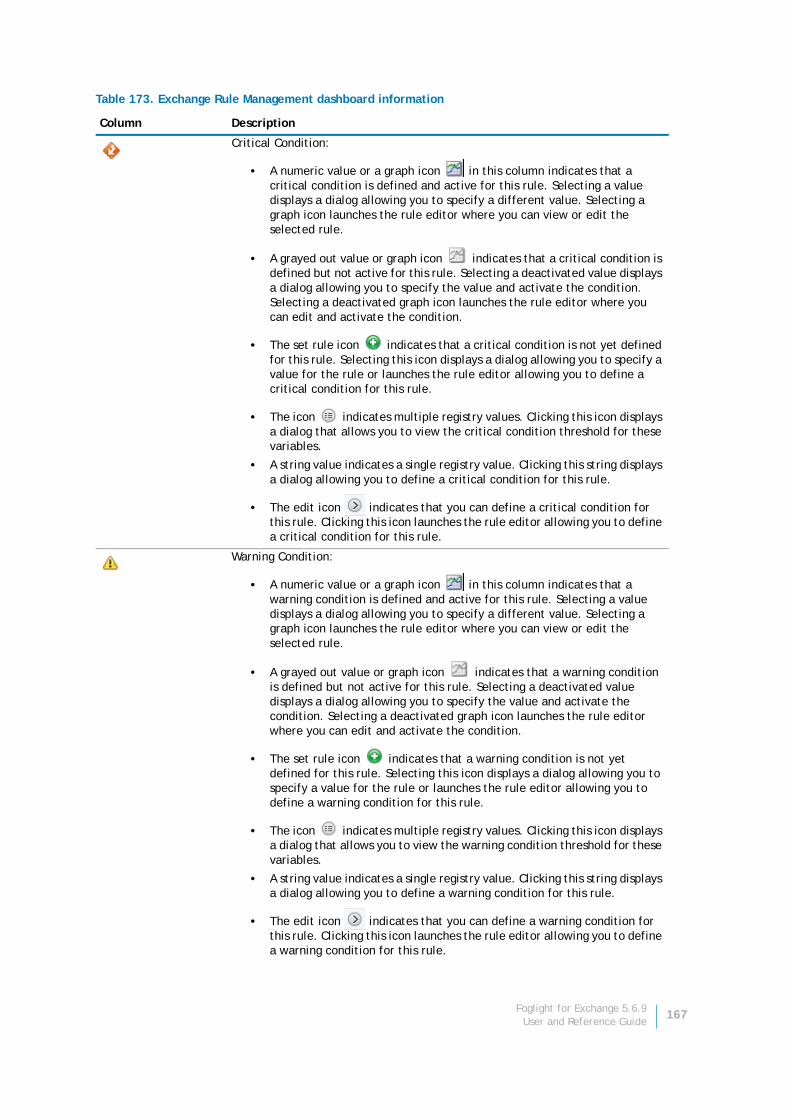
Critical Condition:
• A numeric value or a graph icon in this column indicates that a critical condition is defined and active for this rule. Selecting a value displays a dialog allowing you to specify a different value. Selecting a graph icon launches the rule editor where you can view or edit the selected rule.
• A grayed out value or graph icon indicates that a critical condition is defined but not active for this rule. Selecting a deactivated value displays a dialog allowing you to specify the value and activate the condition. Selecting a deactivated graph icon launches the rule editor where you can edit and activate the condition.
• The set rule icon indicates that a critical condition is not yet defined for this rule. Selecting this icon displays a dialog allowing you to specify a value for the rule or launches the rule editor allowing you to define a critical condition for this rule.
• The icon indicates multiple registry values. Clicking this icon displays a dialog that allows you to view the critical condition threshold for these variables.
• A string value indicates a single registry value. Clicking this string displays a dialog allowing you to define a critical condition for this rule.
• The edit icon indicates that you can define a critical condition for this rule. Clicking this icon launches the rule editor allowing you to define a critical condition for this rule.
Warning Condition:
• A numeric value or a graph icon in this column indicates that a warning condition is defined and active for this rule. Selecting a value displays a dialog allowing you to specify a different value. Selecting a graph icon launches the rule editor where you can view or edit the selected rule.
• A grayed out value or graph icon indicates that a warning condition is defined but not active for this rule. Selecting a deactivated value displays a dialog allowing you to specify the value and activate the condition. Selecting a deactivated graph icon launches the rule editor where you can edit and activate the condition.
• The set rule icon indicates that a warning condition is not yet defined for this rule. Selecting this icon displays a dialog allowing you to specify a value for the rule or launches the rule editor allowing you to define a warning condition for this rule.
• The icon indicates multiple registry values. Clicking this icon displays a dialog that allows you to view the warning condition threshold for these variables.
• A string value indicates a single registry value. Clicking this string displays a dialog allowing you to define a warning condition for this rule.
• The edit icon indicates that you can define a warning condition for this rule. Clicking this icon launches the rule editor allowing you to define a warning condition for this rule.
Table 173. Exchange Rule Management dashboard information
Column Description
Foglight for Exchange 5.6.9User and Reference Guide
167
Managing Foglight for Exchange rulesIn addition to viewing the Foglight for Exchange rules, you can edit alarm thresholds, enable/disable rules, and filter rules Exchange version using the Exchange Rule Management dashboard.
To disable a rule:
1 Locate the rule to be disabled and click the icon in the corresponding Enabled column.
2 On the confirmation dialog, select Yes.
To edit the condition of a rule:
1 Select the rule in the Rule column or its corresponding graph icon in the Fatal, Critical or Warning columns.
2 On the Edit Rule view, edit the conditions, alarms, actions, schedules, behavior or rule variables as required. After making your edits, select Save All.
For more detailed information on editing rules, see the Foglight Administration and Configuration Help.
To edit the alarm threshold assigned to a rule:
1 Select the numeric value in the Fatal, Critical or Warning columns.
2 On the Threshold dialog, enter the new value and select Update.
Alarms Indicates the number of outstanding alarms for each rule.
Selecting the number in this column displays the alarms popup. From the alarm list on this popup:
• Clicking the alarm message, time or severity icon for an individual alarm displays the Alarm Details dialog from which you can acknowledge or clear the alarm.
• Selecting the Info icon displays the Metrics and Troubleshooting dialog.
• Selecting a server allows you to view the performance metrics in the Exchange Explorer or Quick View.
Available In Indicates the Exchange version in which the rule is available.
Description Provides a brief description of the rule.
NOTE: To disable multiple rules, select the corresponding check boxes to the left of the rules to be disabled and select the Disable Rule toolbar button.
NOTE: Hovering the cursor over a numeric value or graph icon will display the current condition that is defined.
NOTE: To define a condition for a rule, select the set rule icon in the corresponding Fatal, Critical or Warning columns.
NOTE: In the browser interface, open the Help tab in the action panel. Navigate to Using Foglight > Administration and Configuration Help > Tuning Foglight for Optimal Performance > Using Foglight Rules to Report on Bottlenecks. Scroll to the bottom of that page to find a list of reference topics including procedures explaining how to perform a variety of tasks related to rules.
Table 173. Exchange Rule Management dashboard information
Column Description
Foglight for Exchange 5.6.9User and Reference Guide
168
To activate/deactivate a condition for a rule:
1 Select the deactivated value or graph icon in the corresponding Fatal, Critical or Warning columns.
• If you selected a deactivated value, on the Threshold dialog, select the Activate check box and if desired modify the threshold value displayed. Select Update.
• If you selected a deactivated graph icon, on the Edit Rule view, select the Activate check box on the Conditions, Alarms & Actions tab. If necessary, edit the conditions, alarms, actions, schedules, behavior or rule variables as required. After activating and/or editing the condition, select Save All.
2 To deactivate a condition, select the rule, active value or chart icon in the corresponding Fatal, Critical or Warning columns.
• If you selected a value, on the Threshold dialog, clear the Activate check box. Select Update.
• If you selected a rule or a graph icon, on the Edit Rule view, clear the Activate check box on the Conditions, Alarms & Actions tab. After deactivating the condition, select Save All.
To filter rules by Exchange version:
• To display the rules available only in certain Exchange version(s), select the Filter check box(es) corresponding to that (those) version(s): 2007, 2010, and 2013.
• To display the rules that are not available in certain Exchange version(s), select the Filter check box(es) corresponding to that (those) version(s): 2007, 2010, and 2013, and also select the Not In check box.
Rules referenceFoglight allows you to create flexible rules that can be applied to complex, interrelated data from multiple sources within your distributed system. You can associate several different actions with a rule, configure a rule so that it does not fire repeatedly, and associate a rule with schedules to define when it should and should not be evaluated.
Different types of data can be used in rules, including registry variables, raw metrics, derived metrics, and topology object properties.
There are two types of rules in Foglight: simple rules and multiple-severity rules. A simple rule has a single condition, and can be in one of three states: Fire, Undefined, or Normal. A multiple-severity rule can have up to five severity levels: Undefined, Fatal, Critical, Warning, and Normal.
Rule conditions are regularly evaluated against monitoring data (metrics and topology object properties collected from your monitored environment and transformed into a standard format). Therefore, the state of the rule can change if the data changes. For example, if a set of monitoring data matches a simple rule’s condition, the rule enters the Fire state. If the next set does not match the condition, the rule exits the Fire state and enters the Normal state.
A rule condition is a type of expression that can be true or false. When it evaluates to true, the rule is said to fire, causing any actions that are associated with the rule or severity level to be performed. You can configure a rule to perform one or more actions upon entering or exiting each state. When a multiple-severity rule fires, an alarm also appears in Foglight.
Foglight for Exchange includes several Exchange monitoring rules. In addition, this cartridge uses some of the Host Monitoring rules.
For more information, see the Foglight Administration and Configuration Guide or online help.
NOTE: The host monitoring rules are only used if Foglight for Exchange is collecting the host metrics, as specified on the agent’s properties page. If the host metrics are being collected by Foglight for VMware or Foglight for Hyper-V, the host monitoring rules defined for the selected cartridge will be used instead.
Foglight for Exchange 5.6.9User and Reference Guide
169
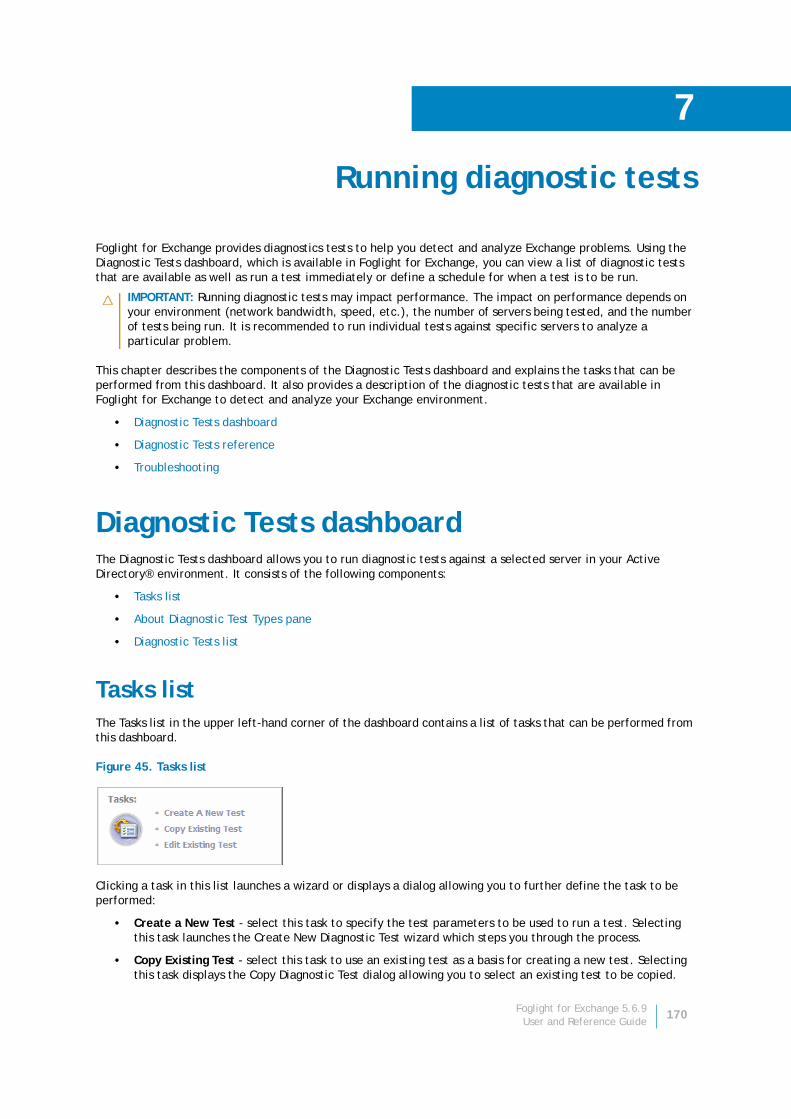
7
Running diagnostic tests
Foglight for Exchange provides diagnostics tests to help you detect and analyze Exchange problems. Using the Diagnostic Tests dashboard, which is available in Foglight for Exchange, you can view a list of diagnostic tests that are available as well as run a test immediately or define a schedule for when a test is to be run.
This chapter describes the components of the Diagnostic Tests dashboard and explains the tasks that can be performed from this dashboard. It also provides a description of the diagnostic tests that are available in Foglight for Exchange to detect and analyze your Exchange environment.
• Diagnostic Tests dashboard
• Diagnostic Tests reference
• Troubleshooting
Diagnostic Tests dashboardThe Diagnostic Tests dashboard allows you to run diagnostic tests against a selected server in your Active Directory® environment. It consists of the following components:
• Tasks list
• About Diagnostic Test Types pane
• Diagnostic Tests list
Tasks listThe Tasks list in the upper left-hand corner of the dashboard contains a list of tasks that can be performed from this dashboard.
Figure 45. Tasks list
Clicking a task in this list launches a wizard or displays a dialog allowing you to further define the task to be performed:
• Create a New Test - select this task to specify the test parameters to be used to run a test. Selecting this task launches the Create New Diagnostic Test wizard which steps you through the process.
• Copy Existing Test - select this task to use an existing test as a basis for creating a new test. Selecting this task displays the Copy Diagnostic Test dialog allowing you to select an existing test to be copied.
IMPORTANT: Running diagnostic tests may impact performance. The impact on performance depends on your environment (network bandwidth, speed, etc.), the number of servers being tested, and the number of tests being run. It is recommended to run individual tests against specific servers to analyze a particular problem.
Foglight for Exchange 5.6.9User and Reference Guide
170

Once you select a test to be copied, the Create New Diagnostic Test wizard is launched allowing you to modify the test parameters as required.
• Edit Existing Test - select this task to modify the test parameters of an existing test. Selecting this task displays the Edit Diagnostic Test dialog allowing you to select an existing test to be modified. After selecting the test to be edited, the Edit Diagnostic Test wizard is launched allowing you to modify the test as required.
Create New Diagnostic TestThe Create New Diagnostic Test wizard allows you to select the type of test to be run and to specify the test input and the servers the test is to be run against. It also allows you to specify when the test is to be run.
To create a new test:
1 Select the Create a New Test task in the task list at the top of the dashboard to launch the Create New Diagnostic Test wizard.
2 On the Create New Test page, enter the following information:
• Diagnostic Test Name - enter a descriptive name for the test to be run
• Test Type - select the type of test to be run
• Test Input - enter the test input as required
3 On the Test Targets page, select the Select Targets button. On the Select Targets dialog, select one or more servers and select OK.
4 On the Test Execution Schedule page, select one of the following options to define how often the test is to be run:
• Run Once - select to run the test one time when the Finish button is selected.
• Run Periodically - select to run the test multiple times during a day. Enter how often the test is to be run (every nn minutes). To specify a start and end time, select the Use execution window check box and use the calendar controls to specify the start and end time.
• Run Once Each Day - select to run the test every day at the specified time. Use the calendar control to specify the time.
5 Select Finish to initiate the test run and close the wizard.
The new test appears in the Diagnostic Tests list on the Diagnostic Tests dashboard. To view the test’s results, select the selection icon to the left of the test in this list.
For more information about the controls and information requested on the wizard, see Create New Diagnostic Test Wizard.
Copy Existing Test
To copy an existing test:
1 Select the Copy Existing Test task in the task list.
2 On the Copy Diagnostic Test dialog, select the test to be copied and select the Copy button.
3 On the Create New Diagnostic Tests dialog, modify the following information as appropriate:
• On the first page, enter a new name for the test, select the type of test to be run and enter any test inputs.
NOTE: You can also select all the servers in a domain or a site, by using the View by options at the top of the dialog and selecting either a domain or site from the displayed list.
NOTE: A test should not be re-run within 10 minutes. If you select to re-run the test within this 10 minute interval, the Test Run Frequency Warning message will be displayed.
Foglight for Exchange 5.6.9User and Reference Guide
171
• On the second page, select the Select Servers button to select the servers on which the test is to be run.
• On the last page, select when the test is to be run.
4 Select Finish to save your selections and close the wizard.
5 The new test appears in the Diagnostic Tests list on the Diagnostic Tests dashboard.
Edit Existing Test
To edit an existing test:
1 Select the Edit Existing Test task in the task list.
2 Select the test to be modified from the Edit Diagnostic Test dialog and select Edit to launch the Edit Diagnostic Test wizard.
3 Modify the settings as appropriate:
• On the first page of the wizard, you can modify the test input parameters.
• On the second page of the wizard, you can select a different set of servers.
• On the last page of the wizard, you can select a different run schedule.
4 When complete, select the Finish button to save your selections and close the wizard.
Create New Diagnostic Test Wizard
The Create New Diagnostic Test wizard includes several pages and requires the following information:
• Create New Test: From this page, provide a name for the new test, select the test type and enter the test input.
• Diagnostic Test Name: Enter a descriptive name for the diagnostic test.
• Test Type: Select the type of test to be run. When you select a test type, a description of the test appears to the right of the test type options. In addition, any required test parameters that must be defined is displayed in the Test Input section at the bottom of the page.
• Test Input: Depending on the type of test selected, this pane displays the test parameters that must be defined.
• Execution Timeout (seconds) - By default, the execution timeout is set to 15 seconds. To change this setting, enter a different value.
• Destination Email Address - When the External Mailbox test type of selected, enter the email address of the external mailbox to be tested.
• Test Targets: From this page, select the target servers on which the test is be run.
• Select Targets: Selecting this button displays the Select Targets dialog that lists all the servers containing the Mailbox role.
Use the View by option at the top of the dialog to display the available servers. Depending on this setting, you can select one or more servers, all servers in a domain or all servers in a site.
• View by Servers - allows you to select one or more individual servers or all servers.
• View by Sites - allows you to select one or more individual servers or a site to include all servers in that site
• View by Domains - allows you to select one or more individual servers or a domain to include all servers in that domain.
NOTE: You can also select a test from the Diagnostic Test list and click the Edit toolbar button at the top of the test list to launch the Edit Diagnostic Test wizard.
Foglight for Exchange 5.6.9User and Reference Guide
172
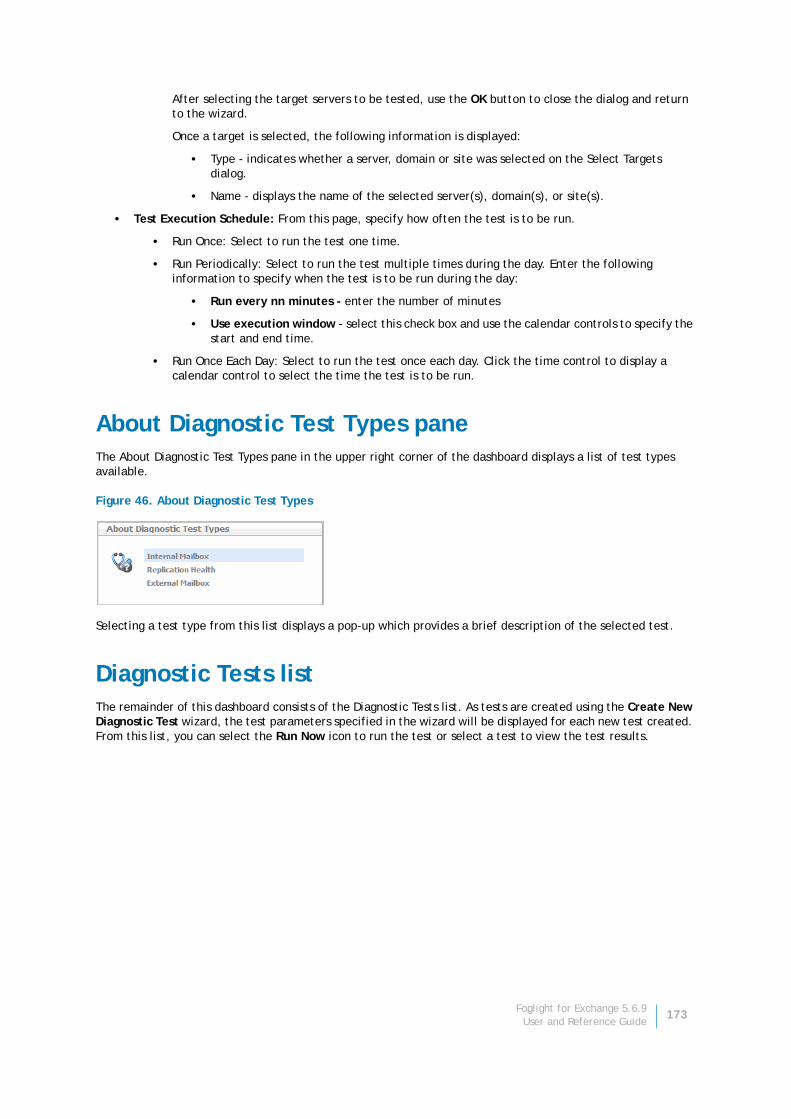
After selecting the target servers to be tested, use the OK button to close the dialog and return to the wizard.
Once a target is selected, the following information is displayed:
• Type - indicates whether a server, domain or site was selected on the Select Targets dialog.
• Name - displays the name of the selected server(s), domain(s), or site(s).
• Test Execution Schedule: From this page, specify how often the test is to be run.
• Run Once: Select to run the test one time.
• Run Periodically: Select to run the test multiple times during the day. Enter the following information to specify when the test is to be run during the day:
• Run every nn minutes - enter the number of minutes
• Use execution window - select this check box and use the calendar controls to specify the start and end time.
• Run Once Each Day: Select to run the test once each day. Click the time control to display a calendar control to select the time the test is to be run.
About Diagnostic Test Types paneThe About Diagnostic Test Types pane in the upper right corner of the dashboard displays a list of test types available.
Figure 46. About Diagnostic Test Types
Selecting a test type from this list displays a pop-up which provides a brief description of the selected test.
Diagnostic Tests listThe remainder of this dashboard consists of the Diagnostic Tests list. As tests are created using the Create New Diagnostic Test wizard, the test parameters specified in the wizard will be displayed for each new test created. From this list, you can select the Run Now icon to run the test or select a test to view the test results.
Foglight for Exchange 5.6.9User and Reference Guide
173
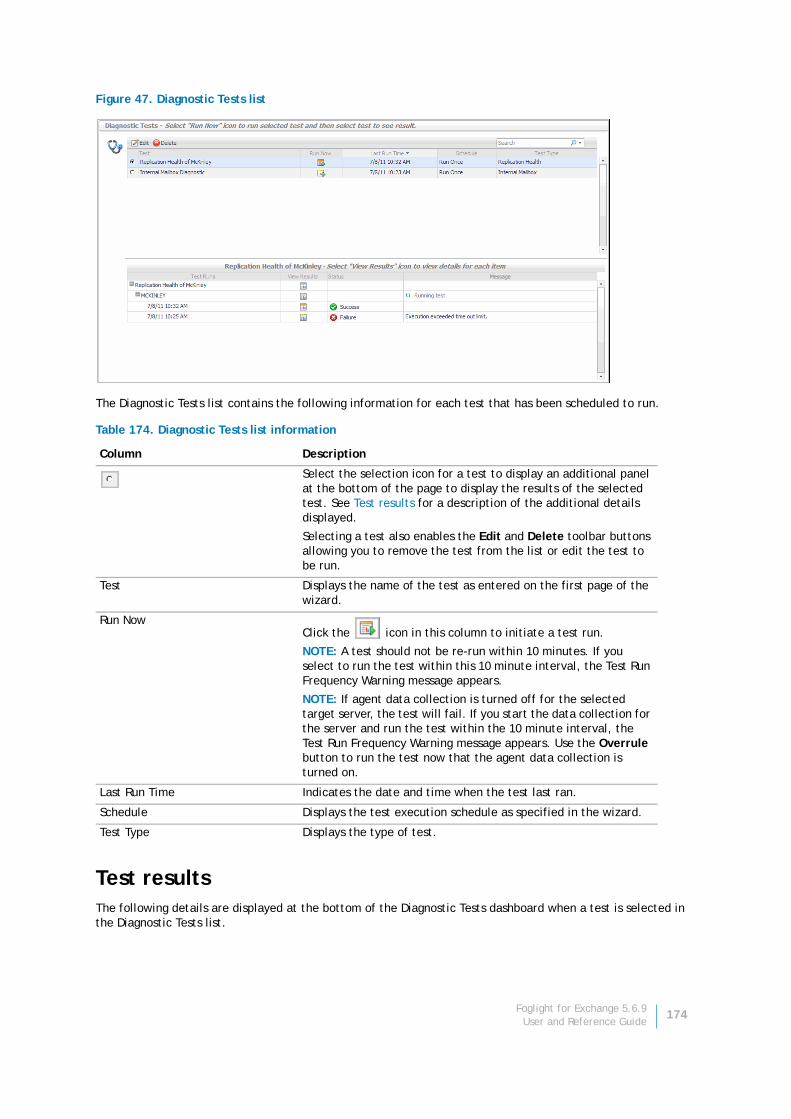
Figure 47. Diagnostic Tests list
The Diagnostic Tests list contains the following information for each test that has been scheduled to run.
Test results The following details are displayed at the bottom of the Diagnostic Tests dashboard when a test is selected in the Diagnostic Tests list.
Table 174. Diagnostic Tests list information
Column Description
Select the selection icon for a test to display an additional panel at the bottom of the page to display the results of the selected test. See Test results for a description of the additional details displayed.
Selecting a test also enables the Edit and Delete toolbar buttons allowing you to remove the test from the list or edit the test to be run.
Test Displays the name of the test as entered on the first page of the wizard.
Run NowClick the icon in this column to initiate a test run.
NOTE: A test should not be re-run within 10 minutes. If you select to run the test within this 10 minute interval, the Test Run Frequency Warning message appears.
NOTE: If agent data collection is turned off for the selected target server, the test will fail. If you start the data collection for the server and run the test within the 10 minute interval, the Test Run Frequency Warning message appears. Use the Overrule button to run the test now that the agent data collection is turned on.
Last Run Time Indicates the date and time when the test last ran.
Schedule Displays the test execution schedule as specified in the wizard.
Test Type Displays the type of test.
Foglight for Exchange 5.6.9User and Reference Guide
174

Diagnostic Tests referenceThe following types of diagnostic tests are provided with Foglight for Exchange:
• Internal Mailbox
• Remote Forest Mailbox
• Replication Health
Internal MailboxThe Internal Mailbox diagnostic tests whether mail can be successfully sent from and delivered to the System Mailbox on each target server.
To run this test enter the execution timeout value.
Table 175. Test results
Column Description
Test Name The name of the selected test is displayed across the top of this pane.
Test Runs Displays the servers selected to be tested and the dates and times when the test was run. Select the expansion button to the left of a test to display a list of the test runs that have been performed against each server.
View ResultsClick the icon in this column to view the detailed test results.
• Test - clicking the icon for a test displays results for the entire test, including all servers and all test runs.
• Server - clicking the icon for a server displays results for all runs for the selected server.
• Test Run - clicking the icon for a test run displays results for the selected test run on that server.
Status Displays the overall status of each test run. The following state indicators are used to illustrate the status:
• Success (Green) - indicates the test completed successfully
• Failed (Red) - indicates that the test failed
Message Displays progress messages generated during a test run.
NOTE: When selecting the target servers to be tested, be sure to select servers that are within the same Exchange organization. If you select servers that are in different organizations, you will encounter communication errors. In addition, it is recommended to select only a few target servers (10 or less) to run this test against. That is because when running this test against 10 servers, the test will run 10 times for each of those 10 servers.
Table 176. Internal Mailbox
Test Input Description
Execution Timeout (seconds) By default, the execution timeout is set to 15 seconds. To change this setting, enter a different value.
Foglight for Exchange 5.6.9User and Reference Guide
175

Remote Forest MailboxThe Remote Forest Mailbox diagnostic tests whether mail can be successfully sent from each target server and delivered to the specified remote forest mailbox.
To run this test enter the execution time-out value and the email address of a remote forest mailbox.
Replication HealthThe Replication Health diagnostic tests all aspects of replication, cluster services, and storage group replication replay status to provide a complete overview of the replication system.
To run this test enter the execution time out value.
Depending on the Exchange version, this diagnostic returns results for the following tests:
Exchange Server 2007 tests• PassiveNodeUp. Checks if the passive node in the cluster is up.
• ClusterNetwork. Checks that cluster-managed networks are healthy on all nodes in the local cluster.
• QuorumGroup. Checks that the quorum or default cluster group for the local cluster is healthy.
• FileShareQuorum. Checks that the file share configured for the file share witness (FSW) for cluster continuous replication (CCR) can be reached.
• CmsGroup. Checks that the clustered mailbox server (CMS) possibly owned by the local cluster node is healthy.
• NodePaused. Checks if the possible owner nodes of clustered mailbox servers are in a Paused state.
• DnsRegistrationStatus. Checks if Network Name resources that require DNS registration have completed it successfully.
• ReplayService. Checks if the Microsoft® Exchange Replication service is running.
• DBMountedFailover. Checks if there are any databases on clustered mailbox servers in a cluster continuous replication environment that are dismounted because of a failover.
• SGCopySuspended. Checks if there are any storage group copies in the ‘Suspended’ state.
• SGCopyFailed. Checks if there are any storage group copies in the ‘Failed’ state.
• SGInitializing. Checks if there are any storage group copies in the ‘Initializing’ state.
• SGCopyQueueLength. Checks if there are any passive copies of storage groups with a copy queue length above the warning or failure thresholds.
• SGReplayQueueLength. Checks if there are any storage groups with replay queue lengths greater than the warning or failure thresholds.
Table 177. Remote Forest Mailbox
Test Input Description
Execution Time-out (seconds) By default, the execution time out is set to 120 seconds. To change this setting, enter a different value.
Destination Email Address Enter the email address of the remote forest mailbox to be tested.
Table 178. Replication Health
Test Input Description
Execution Time-out (seconds) By default, the execution time-out is set to 15 seconds. To change this setting, enter a different value.
Foglight for Exchange 5.6.9User and Reference Guide
176
Exchange Server 2010 tests• ClusterService. Checks if the cluster service is healthy.
• ReplayService. Checks if the Microsoft® Exchange Replication service is running.
• ActiveManager. Check if the Active Manager is running and has a valid role.
• TasksRpcListener. Checks that the Tasks RPC Listener is running and is responding to remote requests.
• TcpListener. Checks that the TCP Listener is running and is responding to requests.
• DagMembersUp. Verifies that the members of a database availability group are up and running.
• ClusterNetwork. Checks that the networks are healthy.
• QuorumGroup. Checks that the quorum and witness for the database availability group is healthy.
• FileShareQuorun. Verifies that the path used for the file share witness can be reached.
• DBCopySuspended. Checks if any database copies are in the ‘Suspended’ state.
• DBCopyFailed. Checks if any database copies are in the ‘Failed’ state.
• DBInitializing. Checks if any database copies are in the ‘Initializing’ state.
• DBDisconnected. Checks if any database copies are in ‘DisconnectedAndHealthy’ state.
• DBLogCopyKeepingUp. Verifies that log copying and inspection for the database copy is keeping up with log generation on the source server.
• DBLogReplayKeepinUp. Verifies that the log replay is keeping up with log copying and inspection.
TroubleshootingThe configuration steps described in this section may be required in order to successfully run diagnostic tests.
• Configuring the agent to log on as a service
Configuring the agent to log on as a serviceMonitoring agent accounts must be assigned the Log on as a service policy, otherwise the data collection is disabled and results in the following error:
The remote service is not running, so data collection that depends on this service will not be available. Check that the agent account has the Log on as a Service right.
This error may be generated if the monitoring agent uses an account that does not have permissions granted to use this policy, or if the ..\Windows\RemoteCommandService.exe file or the Quest Remote Command Service are corrupted or missing.
Permissions to access this policy can be granted using the Group Policy Management Editor in the monitored environment.
To configure the agent to log on as a service:
1 Start the Group Policy Management Editor. In the Control Panel, click Administrative Tools > Group Policy Management.
2 In the Group Policy Management Editor window that appears, in the left pane, click Default Domain Policy > Computer Configuration > Windows Settings > Security Settings > Local Policies > User Rights Assignment.
3 In the right pane, locate the Log on as a service policy.
Foglight for Exchange 5.6.9User and Reference Guide
177
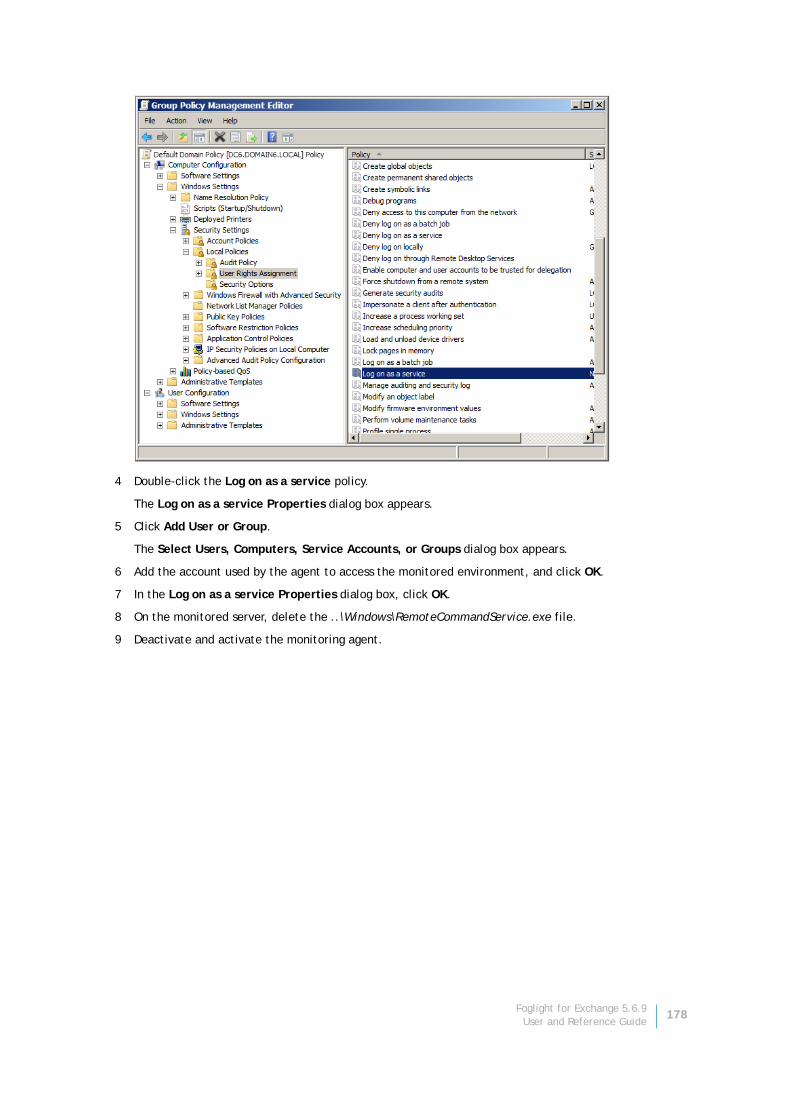
4 Double-click the Log on as a service policy.
The Log on as a service Properties dialog box appears.
5 Click Add User or Group.
The Select Users, Computers, Service Accounts, or Groups dialog box appears.
6 Add the account used by the agent to access the monitored environment, and click OK.
7 In the Log on as a service Properties dialog box, click OK.
8 On the monitored server, delete the ..\Windows\RemoteCommandService.exe file.
9 Deactivate and activate the monitoring agent.
Foglight for Exchange 5.6.9User and Reference Guide
178
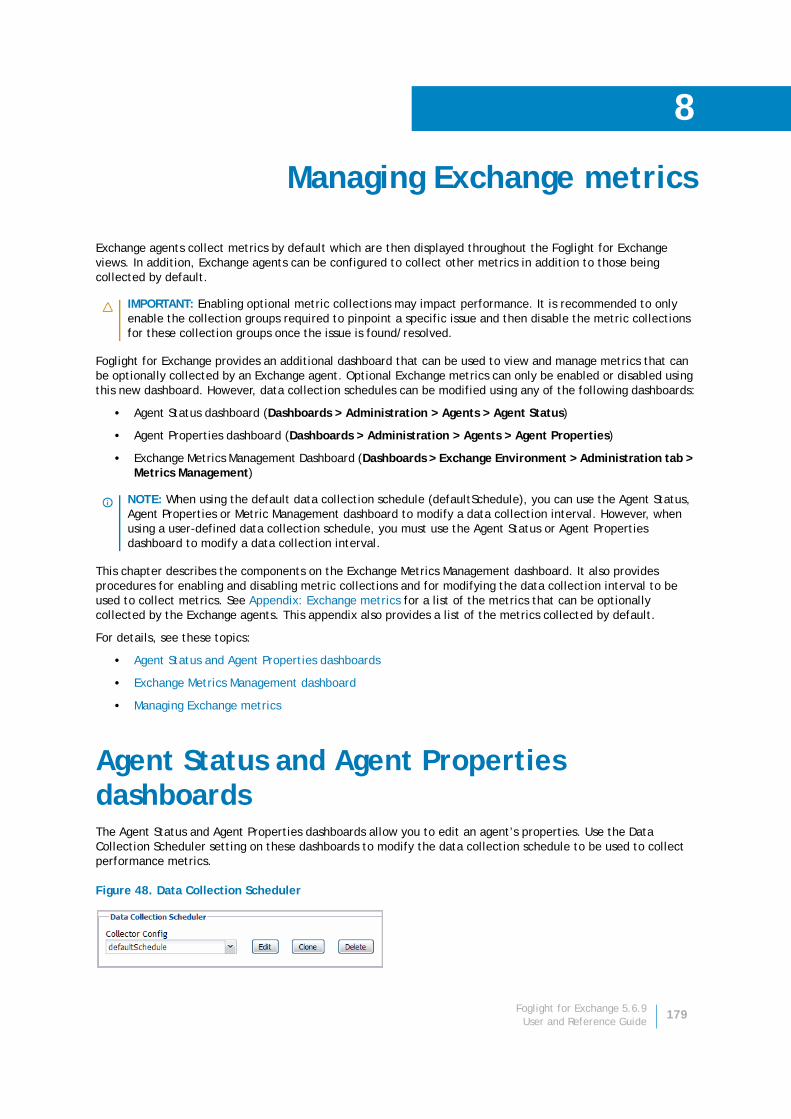
8
Managing Exchange metrics
Exchange agents collect metrics by default which are then displayed throughout the Foglight for Exchange views. In addition, Exchange agents can be configured to collect other metrics in addition to those being collected by default.
Foglight for Exchange provides an additional dashboard that can be used to view and manage metrics that can be optionally collected by an Exchange agent. Optional Exchange metrics can only be enabled or disabled using this new dashboard. However, data collection schedules can be modified using any of the following dashboards:
• Agent Status dashboard (Dashboards > Administration > Agents > Agent Status)
• Agent Properties dashboard (Dashboards > Administration > Agents > Agent Properties)
• Exchange Metrics Management Dashboard (Dashboards > Exchange Environment > Administration tab > Metrics Management)
This chapter describes the components on the Exchange Metrics Management dashboard. It also provides procedures for enabling and disabling metric collections and for modifying the data collection interval to be used to collect metrics. See Appendix: Exchange metrics for a list of the metrics that can be optionally collected by the Exchange agents. This appendix also provides a list of the metrics collected by default.
For details, see these topics:
• Agent Status and Agent Properties dashboards
• Exchange Metrics Management dashboard
• Managing Exchange metrics
Agent Status and Agent Properties dashboardsThe Agent Status and Agent Properties dashboards allow you to edit an agent’s properties. Use the Data Collection Scheduler setting on these dashboards to modify the data collection schedule to be used to collect performance metrics.
Figure 48. Data Collection Scheduler
IMPORTANT: Enabling optional metric collections may impact performance. It is recommended to only enable the collection groups required to pinpoint a specific issue and then disable the metric collections for these collection groups once the issue is found/resolved.
NOTE: When using the default data collection schedule (defaultSchedule), you can use the Agent Status, Agent Properties or Metric Management dashboard to modify a data collection interval. However, when using a user-defined data collection schedule, you must use the Agent Status or Agent Properties dashboard to modify a data collection interval.
Foglight for Exchange 5.6.9User and Reference Guide
179
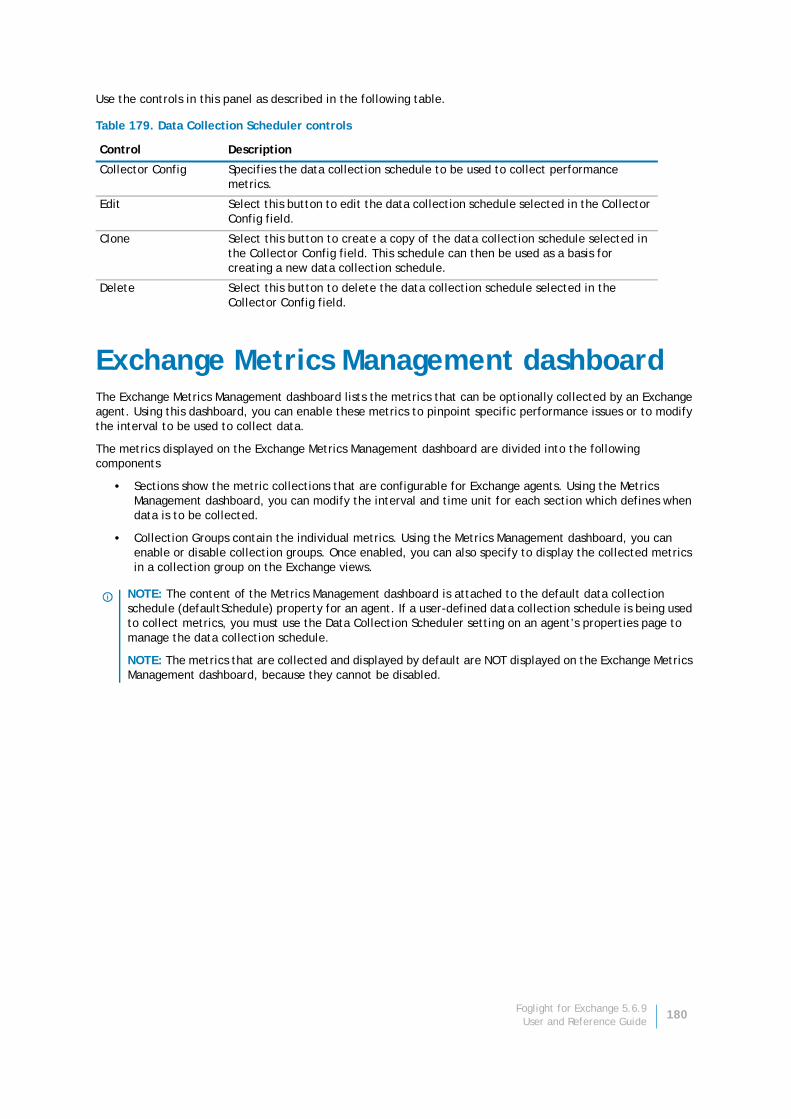
Use the controls in this panel as described in the following table.
Exchange Metrics Management dashboardThe Exchange Metrics Management dashboard lists the metrics that can be optionally collected by an Exchange agent. Using this dashboard, you can enable these metrics to pinpoint specific performance issues or to modify the interval to be used to collect data.
The metrics displayed on the Exchange Metrics Management dashboard are divided into the following components
• Sections show the metric collections that are configurable for Exchange agents. Using the Metrics Management dashboard, you can modify the interval and time unit for each section which defines when data is to be collected.
• Collection Groups contain the individual metrics. Using the Metrics Management dashboard, you can enable or disable collection groups. Once enabled, you can also specify to display the collected metrics in a collection group on the Exchange views.
Table 179. Data Collection Scheduler controls
Control Description
Collector Config Specifies the data collection schedule to be used to collect performance metrics.
Edit Select this button to edit the data collection schedule selected in the Collector Config field.
Clone Select this button to create a copy of the data collection schedule selected in the Collector Config field. This schedule can then be used as a basis for creating a new data collection schedule.
Delete Select this button to delete the data collection schedule selected in the Collector Config field.
NOTE: The content of the Metrics Management dashboard is attached to the default data collection schedule (defaultSchedule) property for an agent. If a user-defined data collection schedule is being used to collect metrics, you must use the Data Collection Scheduler setting on an agent’s properties page to manage the data collection schedule.
NOTE: The metrics that are collected and displayed by default are NOT displayed on the Exchange Metrics Management dashboard, because they cannot be disabled.
Foglight for Exchange 5.6.9User and Reference Guide
180
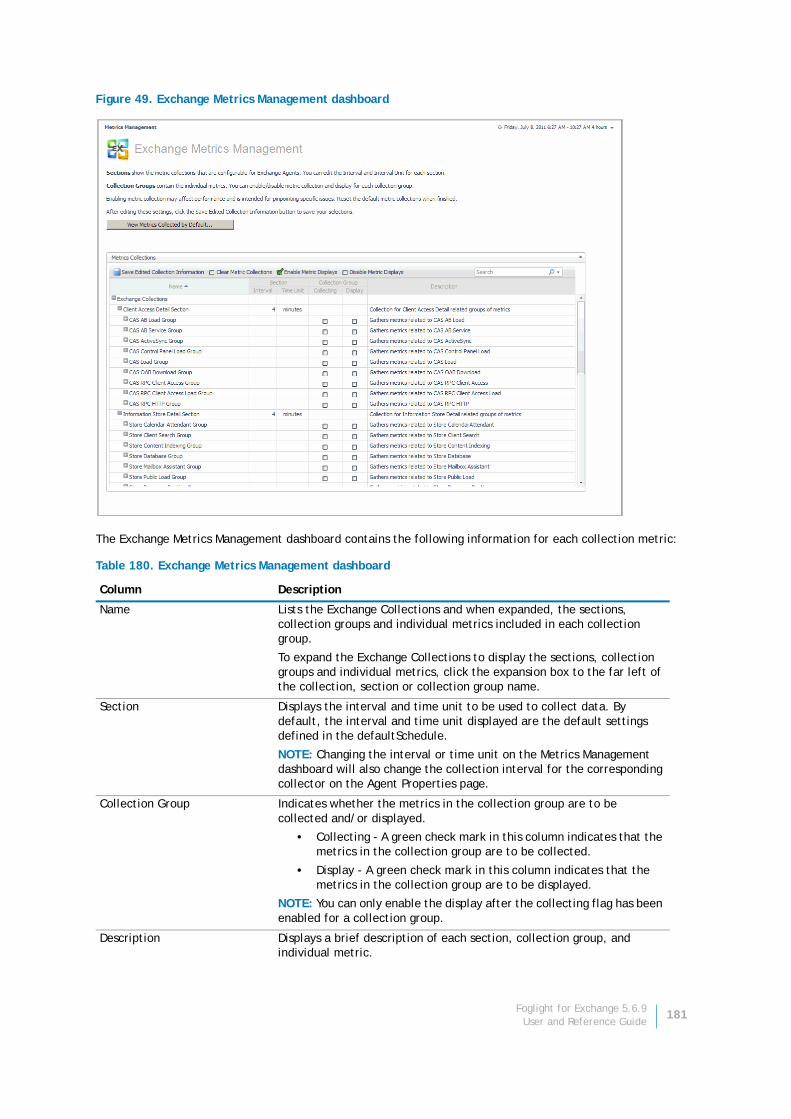
Figure 49. Exchange Metrics Management dashboard
The Exchange Metrics Management dashboard contains the following information for each collection metric:
Table 180. Exchange Metrics Management dashboard
Column Description
Name Lists the Exchange Collections and when expanded, the sections, collection groups and individual metrics included in each collection group.
To expand the Exchange Collections to display the sections, collection groups and individual metrics, click the expansion box to the far left of the collection, section or collection group name.
Section Displays the interval and time unit to be used to collect data. By default, the interval and time unit displayed are the default settings defined in the defaultSchedule.
NOTE: Changing the interval or time unit on the Metrics Management dashboard will also change the collection interval for the corresponding collector on the Agent Properties page.
Collection Group Indicates whether the metrics in the collection group are to be collected and/or displayed.
• Collecting - A green check mark in this column indicates that the metrics in the collection group are to be collected.
• Display - A green check mark in this column indicates that the metrics in the collection group are to be displayed.
NOTE: You can only enable the display after the collecting flag has been enabled for a collection group.
Description Displays a brief description of each section, collection group, and individual metric.
Foglight for Exchange 5.6.9User and Reference Guide
181
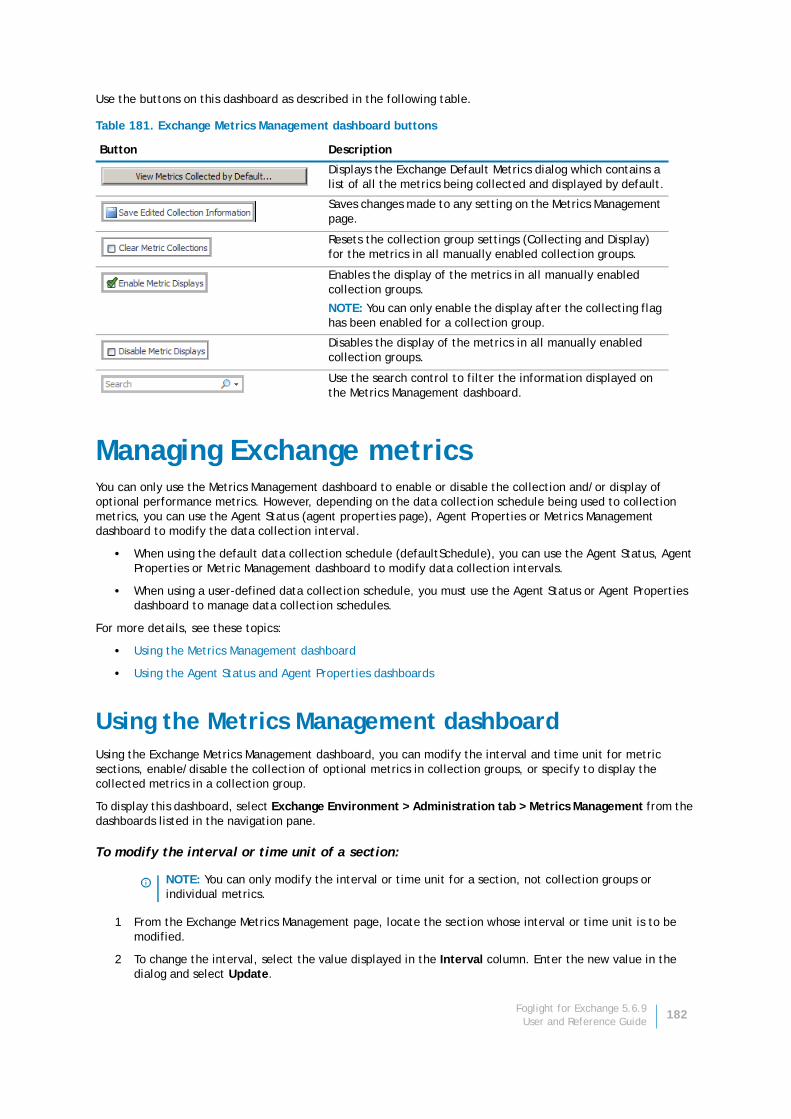
Use the buttons on this dashboard as described in the following table.
Managing Exchange metricsYou can only use the Metrics Management dashboard to enable or disable the collection and/or display of optional performance metrics. However, depending on the data collection schedule being used to collection metrics, you can use the Agent Status (agent properties page), Agent Properties or Metrics Management dashboard to modify the data collection interval.
• When using the default data collection schedule (defaultSchedule), you can use the Agent Status, Agent Properties or Metric Management dashboard to modify data collection intervals.
• When using a user-defined data collection schedule, you must use the Agent Status or Agent Properties dashboard to manage data collection schedules.
For more details, see these topics:
• Using the Metrics Management dashboard
• Using the Agent Status and Agent Properties dashboards
Using the Metrics Management dashboardUsing the Exchange Metrics Management dashboard, you can modify the interval and time unit for metric sections, enable/disable the collection of optional metrics in collection groups, or specify to display the collected metrics in a collection group.
To display this dashboard, select Exchange Environment > Administration tab > Metrics Management from the dashboards listed in the navigation pane.
To modify the interval or time unit of a section:
1 From the Exchange Metrics Management page, locate the section whose interval or time unit is to be modified.
2 To change the interval, select the value displayed in the Interval column. Enter the new value in the dialog and select Update.
Table 181. Exchange Metrics Management dashboard buttons
Button Description
Displays the Exchange Default Metrics dialog which contains a list of all the metrics being collected and displayed by default.
Saves changes made to any setting on the Metrics Management page.
Resets the collection group settings (Collecting and Display) for the metrics in all manually enabled collection groups.
Enables the display of the metrics in all manually enabled collection groups.
NOTE: You can only enable the display after the collecting flag has been enabled for a collection group.
Disables the display of the metrics in all manually enabled collection groups.
Use the search control to filter the information displayed on the Metrics Management dashboard.
NOTE: You can only modify the interval or time unit for a section, not collection groups or individual metrics.
Foglight for Exchange 5.6.9User and Reference Guide
182
3 To change the time unit, select the value displayed in the Time Unit column. Select the new time unit (days, hours or minutes) in the dialog and select Update.
4 Select the Save Edited Collection Information toolbar button to save your selections.
To enable the collecting or display of optional metrics:
1 From the Exchange Metrics Management page, locate the collection group to be enabled.
2 Click the check box in the corresponding Collection Group | Collecting cell.
3 Select the check box in the metric’s collection dialog and select Update.
A green check mark is displayed in the Collection Group | Collecting column on the Metrics Management page.
Once the collecting of a collection group is enabled, you can then enable the display of these metrics.
4 Click the check box in the corresponding Collection Group | Display column.
5 Select the check box in the metric’s display dialog and select Update.
A green check mark is displayed in the Collection Group | Display column back on the Metrics Management page.
6 Select the Save Edited Collection Information toolbar button to save your selections.
7 On the Save dialog, click Save to confirm that you want to save your selection.
8 A Save Collections dialog appears informing you that your selection(s) have been saved. Click the close button in the upper right-hand corner to close the dialog and return to the Exchange Metrics Management dashboard.
To disable the collecting or display of optional metrics:
1 From the Exchange Metrics Management page, locate the collection group to be disabled.
2 Click the enabled check box (contains a green check mark) in the corresponding Collection Group column (Collecting or Display).
3 Clear the check box on the dialog and select Update.
The green check mark is cleared from the selected column back on the Metrics Management page.
4 Select the Save Edited Collection Information toolbar button to save your selections.
5 On the Save dialog, click Save to confirm that you want disable the selected metric collection.
6 A Save Collections dialog appears informing you that your selection(s) have been saved. Click the close button in the upper right-hand corner to close the dialog and return to the Exchange Metrics Management dashboard.
To display the metrics being collected by default:
1 From the Exchange Metrics Management page, select the View Metrics Collected by Default button.
NOTE: Modifying the interval or time unit using the Metrics Management page also modifies the collection interval for the corresponding collector in the defaultSchedule (Agent Properties page).
NOTE: You can only enable a collection group, not individual metrics within a collection group.
NOTE: Enabling metrics may affect performance. It is recommended that you only enable metrics in order to pinpoint a specific issue and to then reset the default metric collections when finished.
NOTE: If you enabled the collecting of multiple collection groups and want to enable the display of all these metrics, you can use the Enable Metric Display toolbar button instead of enabling them all individually.
NOTE: To disable the collection and display of all previously enabled collection groups, use the Clear Metric Collections toolbar button.
Foglight for Exchange 5.6.9User and Reference Guide
183
2 The Active Directory Default Metrics dialog appears which lists the metrics that are being collected and displayed by default.
3 To close this dialog, select the close button in the upper right-hand corner of the dialog.
Using the Agent Status and Agent Properties dashboardsOn the agent’s properties page, you can use the Data Collection Scheduler setting to define the data collection schedule to be used or to modify a data collection interval.
To display an agent’s properties page, use one of the following methods:
• From the navigation panel, navigate to Dashboards > Administration > Agents > Agent Status. On the Agent Status dashboard, select an agent from the list and click Edit Properties. The Agent Status dashboard refreshes, showing the current properties for the selected agent instance.
• From the navigation panel, navigate to Dashboards > Administration > Agents > Agent Properties. On the Agent Properties dashboard, select an agent. The Properties panel is displayed, showing the current properties for the selected agent instance.
To modify the data collection interval:
1 Open the agent’s properties page.
2 The defaultSchedule in the Data Collection Scheduler panel defines the default collection intervals being used to collect metrics. To change one or more collection intervals in the default data collection schedule, select the defaultSchedule and click Edit.
The Collector Config dialog appears, which lists all of the collectors and their current settings.
• To edit a collection interval, double-click the Default Collection Interval cell of the collector to be changed, and enter a different value.
• After editing the collection interval, select Save Changes.
• Click the close button in the upper right corner to close the dialog.
3 Back on the Agent Status/Agent Properties dashboard, select Save to save your selections.
4 Back on the Agent Status/Agent Properties dashboard, select Save to save your selections.
For more information on using these dashboards to edit an agent’s properties, see the Foglight Administration and Configuration Guide or online help.
NOTE: Metrics being collected and displayed by default cannot be disabled using the Metrics Management dashboard.
NOTE: If accessing this page through the Agent Status dashboard, select Modify the properties for all ExchangeAgent agents to activate the properties on the page.
NOTE: A zero value means that the collector is turned off and is not collecting data.
NOTE: Advanced users can add custom collectors using the developers kit. See the Foglight online help for details.
Foglight for Exchange 5.6.9User and Reference Guide
184
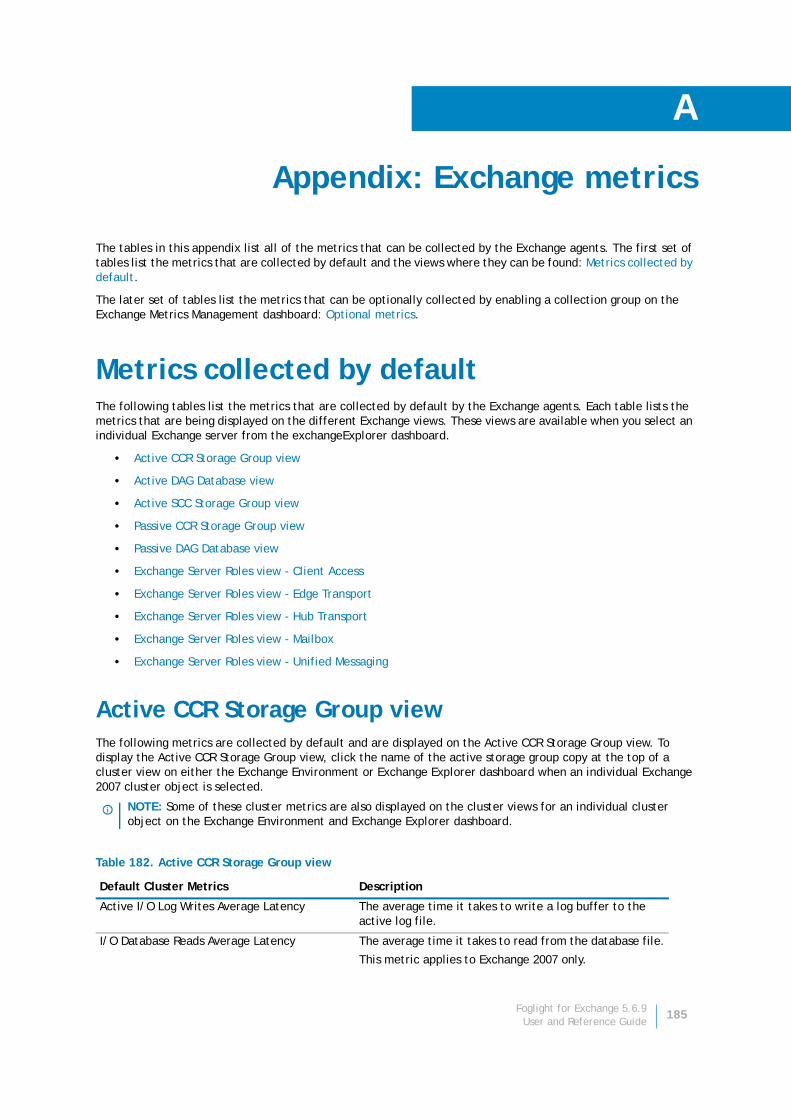
A
Appendix: Exchange metrics
The tables in this appendix list all of the metrics that can be collected by the Exchange agents. The first set of tables list the metrics that are collected by default and the views where they can be found: Metrics collected by default.
The later set of tables list the metrics that can be optionally collected by enabling a collection group on the Exchange Metrics Management dashboard: Optional metrics.
Metrics collected by defaultThe following tables list the metrics that are collected by default by the Exchange agents. Each table lists the metrics that are being displayed on the different Exchange views. These views are available when you select an individual Exchange server from the exchangeExplorer dashboard.
• Active CCR Storage Group view
• Active DAG Database view
• Active SCC Storage Group view
• Passive CCR Storage Group view
• Passive DAG Database view
• Exchange Server Roles view - Client Access
• Exchange Server Roles view - Edge Transport
• Exchange Server Roles view - Hub Transport
• Exchange Server Roles view - Mailbox
• Exchange Server Roles view - Unified Messaging
Active CCR Storage Group viewThe following metrics are collected by default and are displayed on the Active CCR Storage Group view. To display the Active CCR Storage Group view, click the name of the active storage group copy at the top of a cluster view on either the Exchange Environment or Exchange Explorer dashboard when an individual Exchange 2007 cluster object is selected.
NOTE: Some of these cluster metrics are also displayed on the cluster views for an individual cluster object on the Exchange Environment and Exchange Explorer dashboard.
Table 182. Active CCR Storage Group view
Default Cluster Metrics Description
Active I/O Log Writes Average Latency The average time it takes to write a log buffer to the active log file.
I/O Database Reads Average Latency The average time it takes to read from the database file.
This metric applies to Exchange 2007 only.
Foglight for Exchange 5.6.9User and Reference Guide
185

Active DAG Database viewThe following metrics are collected by default and are displayed on the Active DAG Database view. To display the Active DAG Database view, click the name of the active database copy at the top of a cluster view on either the Exchange Environment or Exchange Explorer dashboard when an individual Exchange 2010 cluster object is selected.
I/O Database Writes Average Latency The average time it takes to write to the database file.
This metric applies to Exchange 2007 only.
I/O Log Threads Waiting The number of threads waiting for their data to be written to the log to complete an update of the database.
Log Record Stalls/sec The number of log records that cannot be added tot he log buffers per second because the log buffers are full.
NOTE: Some of these cluster metrics are also displayed on the cluster views for an individual cluster object on the Exchange Environment and Exchange Explorer dashboard.
Table 183. Active DAG Database view
Default Cluster Metrics Description
Activation Suspended Indicates whether activation on the mailbox database copy is suspended.
NOTE: This metric applies to Exchange 2010 only.
Active I/O Log Writes Average Latency The average time to write a log buffer to the active log file.
Average Log Copy Latency ms The average time, in milliseconds, to copy data from a log file.
NOTE: This metric applies to Exchange 2010 only.
Copy Queue Length The number of transaction log files waiting to be copied to the passive copy log file folder.
Disconnected Indicates whether a mailbox database copy is in a state of Disconnected on the specified DAG member.
NOTE: This metric applies to Exchange 2010 only.
Failed Indicates whether the copy is in a condition where it can successfully replicate and replay log files.
Failed Suspended Indicates whether the failed and suspended states have been sent simultaneously by the system because a failure was detected and resolution of the failure explicitly requires administrator intervention.
NOTE: This metric applies to Exchange 2010 only.
I/O Database Reads (Attached) Average Latency
The average time it takes to read from the database file.
NOTE: This metric applies to Exchange 2010 only.
I/O Database Reads (Recovery) Average Latency
The average time it takes to read from the database file.
NOTE: This metric applies to Exchange 2010 only.
I/O Database Writes (Attached) Average Latency
The average time it takes to write to the database file.
NOTE: This metric applies to Exchange 2010 only.
I/O Database Writes (Recovery) Average Latency
The average time it takes to write to the database file.
NOTE: This metric applies to Exchange 2010 only.
Table 182. Active CCR Storage Group view
Default Cluster Metrics Description
Foglight for Exchange 5.6.9User and Reference Guide
186
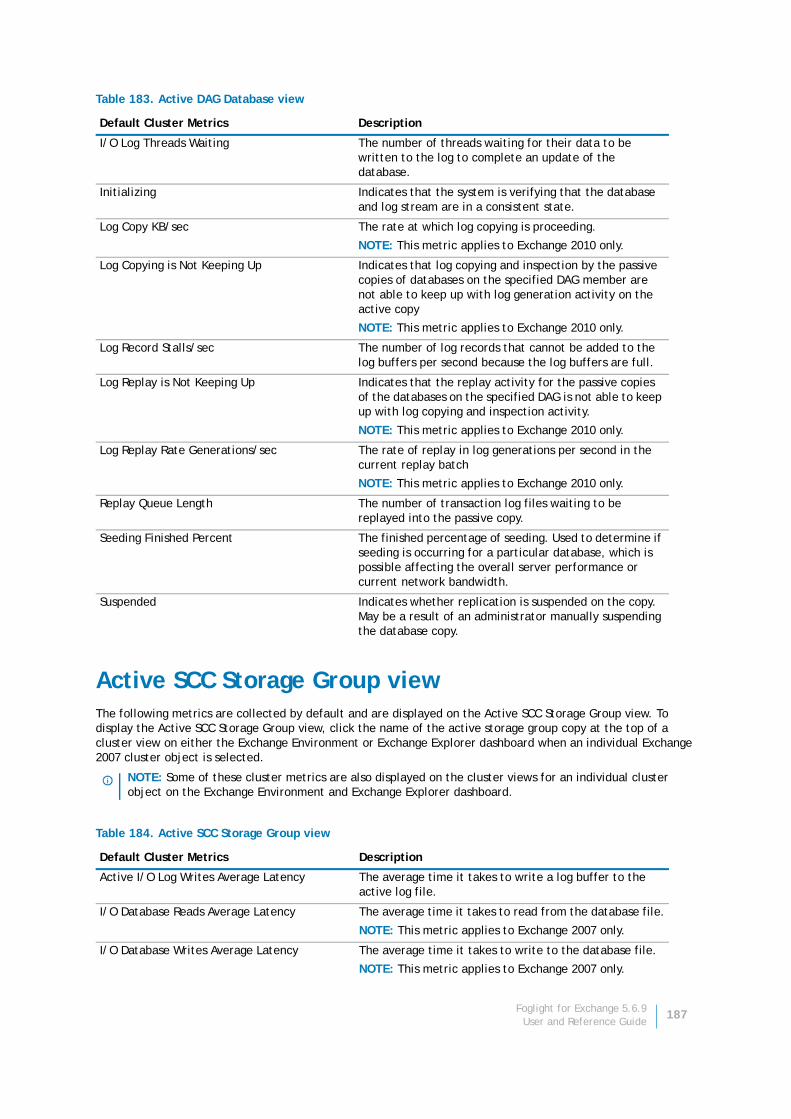
Active SCC Storage Group viewThe following metrics are collected by default and are displayed on the Active SCC Storage Group view. To display the Active SCC Storage Group view, click the name of the active storage group copy at the top of a cluster view on either the Exchange Environment or Exchange Explorer dashboard when an individual Exchange 2007 cluster object is selected.
I/O Log Threads Waiting The number of threads waiting for their data to be written to the log to complete an update of the database.
Initializing Indicates that the system is verifying that the database and log stream are in a consistent state.
Log Copy KB/sec The rate at which log copying is proceeding.
NOTE: This metric applies to Exchange 2010 only.
Log Copying is Not Keeping Up Indicates that log copying and inspection by the passive copies of databases on the specified DAG member are not able to keep up with log generation activity on the active copy
NOTE: This metric applies to Exchange 2010 only.
Log Record Stalls/sec The number of log records that cannot be added to the log buffers per second because the log buffers are full.
Log Replay is Not Keeping Up Indicates that the replay activity for the passive copies of the databases on the specified DAG is not able to keep up with log copying and inspection activity.
NOTE: This metric applies to Exchange 2010 only.
Log Replay Rate Generations/sec The rate of replay in log generations per second in the current replay batch
NOTE: This metric applies to Exchange 2010 only.
Replay Queue Length The number of transaction log files waiting to be replayed into the passive copy.
Seeding Finished Percent The finished percentage of seeding. Used to determine if seeding is occurring for a particular database, which is possible affecting the overall server performance or current network bandwidth.
Suspended Indicates whether replication is suspended on the copy. May be a result of an administrator manually suspending the database copy.
NOTE: Some of these cluster metrics are also displayed on the cluster views for an individual cluster object on the Exchange Environment and Exchange Explorer dashboard.
Table 184. Active SCC Storage Group view
Default Cluster Metrics Description
Active I/O Log Writes Average Latency The average time it takes to write a log buffer to the active log file.
I/O Database Reads Average Latency The average time it takes to read from the database file.
NOTE: This metric applies to Exchange 2007 only.
I/O Database Writes Average Latency The average time it takes to write to the database file.
NOTE: This metric applies to Exchange 2007 only.
Table 183. Active DAG Database view
Default Cluster Metrics Description
Foglight for Exchange 5.6.9User and Reference Guide
187
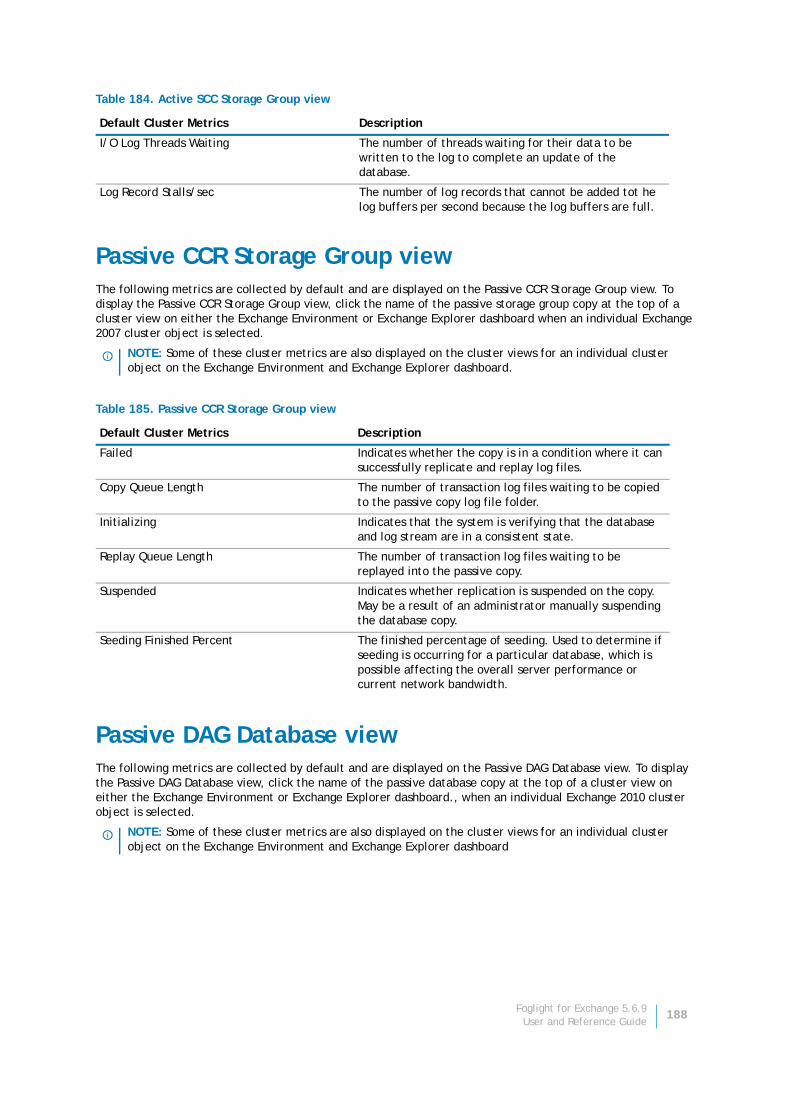
Passive CCR Storage Group viewThe following metrics are collected by default and are displayed on the Passive CCR Storage Group view. To display the Passive CCR Storage Group view, click the name of the passive storage group copy at the top of a cluster view on either the Exchange Environment or Exchange Explorer dashboard when an individual Exchange 2007 cluster object is selected.
Passive DAG Database viewThe following metrics are collected by default and are displayed on the Passive DAG Database view. To display the Passive DAG Database view, click the name of the passive database copy at the top of a cluster view on either the Exchange Environment or Exchange Explorer dashboard., when an individual Exchange 2010 cluster object is selected.
I/O Log Threads Waiting The number of threads waiting for their data to be written to the log to complete an update of the database.
Log Record Stalls/sec The number of log records that cannot be added tot he log buffers per second because the log buffers are full.
NOTE: Some of these cluster metrics are also displayed on the cluster views for an individual cluster object on the Exchange Environment and Exchange Explorer dashboard.
Table 185. Passive CCR Storage Group view
Default Cluster Metrics Description
Failed Indicates whether the copy is in a condition where it can successfully replicate and replay log files.
Copy Queue Length The number of transaction log files waiting to be copied to the passive copy log file folder.
Initializing Indicates that the system is verifying that the database and log stream are in a consistent state.
Replay Queue Length The number of transaction log files waiting to be replayed into the passive copy.
Suspended Indicates whether replication is suspended on the copy. May be a result of an administrator manually suspending the database copy.
Seeding Finished Percent The finished percentage of seeding. Used to determine if seeding is occurring for a particular database, which is possible affecting the overall server performance or current network bandwidth.
NOTE: Some of these cluster metrics are also displayed on the cluster views for an individual cluster object on the Exchange Environment and Exchange Explorer dashboard
Table 184. Active SCC Storage Group view
Default Cluster Metrics Description
Foglight for Exchange 5.6.9User and Reference Guide
188
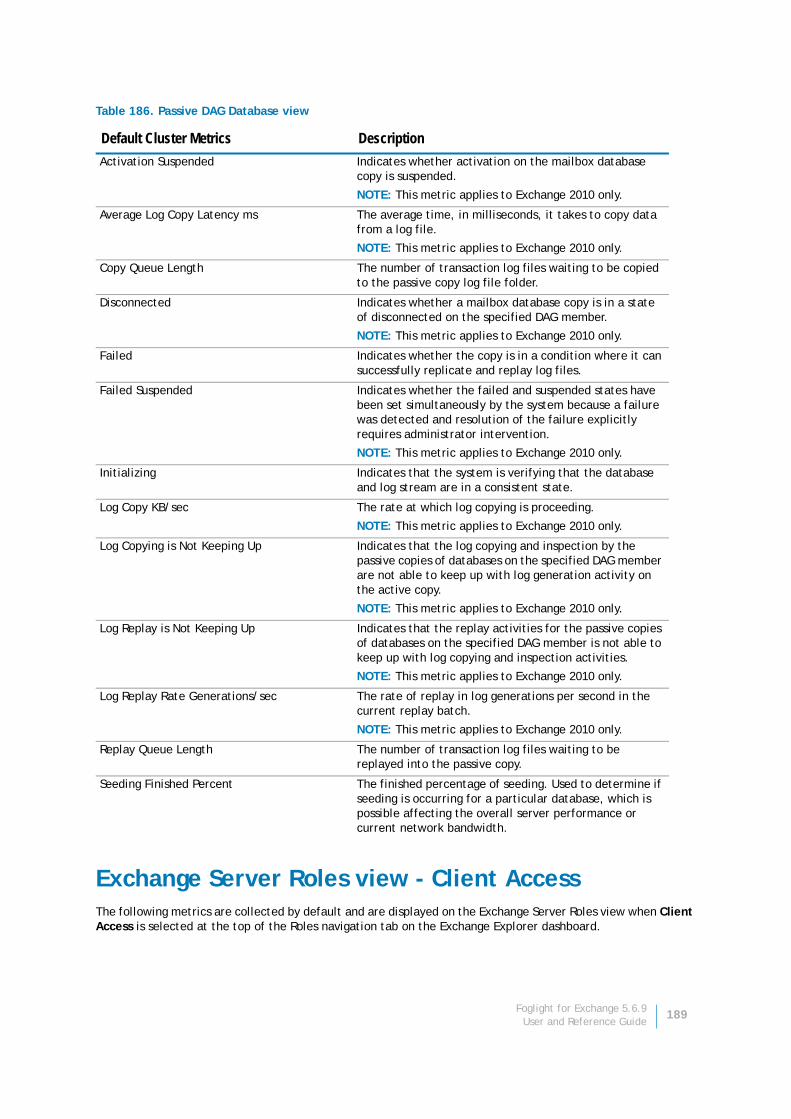
Exchange Server Roles view - Client AccessThe following metrics are collected by default and are displayed on the Exchange Server Roles view when Client Access is selected at the top of the Roles navigation tab on the Exchange Explorer dashboard.
Table 186. Passive DAG Database view
Default Cluster Metrics DescriptionActivation Suspended Indicates whether activation on the mailbox database
copy is suspended.
NOTE: This metric applies to Exchange 2010 only.
Average Log Copy Latency ms The average time, in milliseconds, it takes to copy data from a log file.
NOTE: This metric applies to Exchange 2010 only.
Copy Queue Length The number of transaction log files waiting to be copied to the passive copy log file folder.
Disconnected Indicates whether a mailbox database copy is in a state of disconnected on the specified DAG member.
NOTE: This metric applies to Exchange 2010 only.
Failed Indicates whether the copy is in a condition where it can successfully replicate and replay log files.
Failed Suspended Indicates whether the failed and suspended states have been set simultaneously by the system because a failure was detected and resolution of the failure explicitly requires administrator intervention.
NOTE: This metric applies to Exchange 2010 only.
Initializing Indicates that the system is verifying that the database and log stream are in a consistent state.
Log Copy KB/sec The rate at which log copying is proceeding.
NOTE: This metric applies to Exchange 2010 only.
Log Copying is Not Keeping Up Indicates that the log copying and inspection by the passive copies of databases on the specified DAG member are not able to keep up with log generation activity on the active copy.
NOTE: This metric applies to Exchange 2010 only.
Log Replay is Not Keeping Up Indicates that the replay activities for the passive copies of databases on the specified DAG member is not able to keep up with log copying and inspection activities.
NOTE: This metric applies to Exchange 2010 only.
Log Replay Rate Generations/sec The rate of replay in log generations per second in the current replay batch.
NOTE: This metric applies to Exchange 2010 only.
Replay Queue Length The number of transaction log files waiting to be replayed into the passive copy.
Seeding Finished Percent The finished percentage of seeding. Used to determine if seeding is occurring for a particular database, which is possible affecting the overall server performance or current network bandwidth.
Foglight for Exchange 5.6.9User and Reference Guide
189

Exchange Server Roles view - Edge TransportThe following metrics are collected by default and are displayed on the Exchange Server Roles view when Edge Transport is selected at the top of the Roles navigation tab on the Exchange Explorer dashboard.
Table 187. Exchange Server Roles view - Client Access
View/Client Access Metrics Description
IIS Health View
Connection Attempts/sec The rate at which connections to the web service are being attempted.
HTTP Connections The current number of connections established with the web service.
ISAPI Extension Requests/sec The rate at which Internet Server API (ISAPI) extension requests are received by the web service.
Other Request Methods/sec The rate at which HTTP requests are being made.
Outlook Web Access View
ASP.NET Requests The the number of current ASP.Net® requests.
Availability Requests/sec The number of availability requests serviced per second.
Average Response Time The average time that elapsed during an OWA request.
Average Search Time The average time that elapsed while waiting for a search to complete.
Current Unique Users The number of unique users who are currently logged on to Outlook Web Access.
Current Users The number of users who are currently logged on to Outlook Web Access.
OWA Logons/sec The number of Outlook Web Access user sessions that are created per second.
Outlook Web App Requests/sec The number of Outlook Web Access requests made per second.
Peak Number of OWA Users The largest number of users that were simultaneously connected to Outlook Web Access since the process was last restarted.
Requests in Application Queue The number of ASP.Net® application requests in the application queue.
Web Services Requests/sec The number of web service requests processed each second.
Table 188. Exchange Server Roles view - Edge Transport
View/Edge Transport Metrics Description
Agents View
Average Agent Processing Time The average agent processing time per event.
Sender ID Agent DNS Queries/sec The number of DNS queries performed by the Sender ID Agent per second.
SMTP Receive View
Average Bytes Per Message The average number of bytes for each inbound message.
Messages Received/sec The number of messages received by the SMTP server per second.
Transport DC Connectivity View
Foglight for Exchange 5.6.9User and Reference Guide
190

Domain Controllers LDAP Read Time The time it takes to send an LDAP read request to the specified domain controller and receive a response.
Domain Controllers LDAP Search Time The time it takes to send an LDAP search request and receive a response.
LDAP Searches/sec The number of LDAP search requests issued per second.
LDAP Searches Timed Out/min The number of LDAP searches that returned LDAP_Timeout during the last minute.
Long Running LDAP Operations/min The number of LDAP operations on the domain controller that took longer than the specified threshold.
Processes LDAP Read Time The time it takes to send an LDAP read request to the specified domain controller and receive a response.
Processes LDAP Search Time The time it takes to send an LDAP search request and receive a response.
Transport Load View
Items Completed Delivery/sec The rate at which messages completed delivery per second since the server was started.
Messages Completed Delivery/sec The number of messages that are delivered per second.
Messages Queued for Delivery/sec The number of messages that have been queued for delivery per second.
Messages Submitted/sec The number of messages that have been queued in the Submission queue per second.
SMTP Messages Sent/sec The number of messages sent by the SMTP send connector each second.
Submission Queue Length The number of messages in the submission queue.
Transport Mail Database View
I/O Database Reads/sec The rate at which bytes are read from the database.
I/O Database Writes/sec The rate at which bytes are written to the database.
I/O Log Reads/sec The rate at which bytes are read from the log.
I/O Log Writes/sec The rate at which bytes are written to the log.
Log Generation Checkpoint Depth The amount of work in the log file count that needs to be redone or undone to the database files if the process fails.
Log Record Stalls/sec The number of log records that cannot be added to the log buffers per second because the log buffers are full.
Log Threads Waiting The number of threads waiting for their data to be written to the log to complete an update of the database.
Total Database Cache Size MB The amount of system memory being used by the database cache manager to hold commonly used information from the database files to prevent file operations.
Version Buckets Allocated The total number of version buckets allocated.
Transport Queues View
Active Remote Delivery Queue Length The number of messages waiting to be delivered to a remote server.
Aggregate Delivery Queue Length (All Queues) The number of messages queued for delivery in all queues.
Largest Delivery Queue Length The number of items currently in the largest delivery queue.
Table 188. Exchange Server Roles view - Edge Transport
View/Edge Transport Metrics Description
Foglight for Exchange 5.6.9User and Reference Guide
191
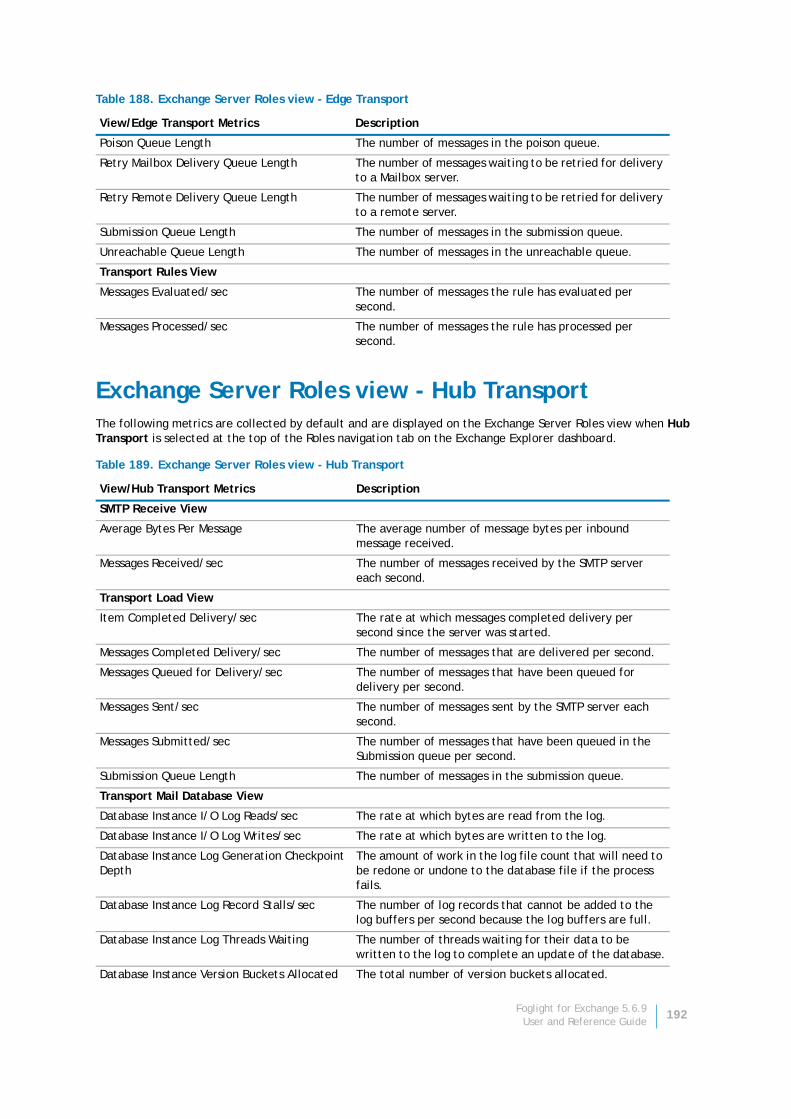
Exchange Server Roles view - Hub TransportThe following metrics are collected by default and are displayed on the Exchange Server Roles view when Hub Transport is selected at the top of the Roles navigation tab on the Exchange Explorer dashboard.
Poison Queue Length The number of messages in the poison queue.
Retry Mailbox Delivery Queue Length The number of messages waiting to be retried for delivery to a Mailbox server.
Retry Remote Delivery Queue Length The number of messages waiting to be retried for delivery to a remote server.
Submission Queue Length The number of messages in the submission queue.
Unreachable Queue Length The number of messages in the unreachable queue.
Transport Rules View
Messages Evaluated/sec The number of messages the rule has evaluated per second.
Messages Processed/sec The number of messages the rule has processed per second.
Table 189. Exchange Server Roles view - Hub Transport
View/Hub Transport Metrics Description
SMTP Receive View
Average Bytes Per Message The average number of message bytes per inbound message received.
Messages Received/sec The number of messages received by the SMTP server each second.
Transport Load View
Item Completed Delivery/sec The rate at which messages completed delivery per second since the server was started.
Messages Completed Delivery/sec The number of messages that are delivered per second.
Messages Queued for Delivery/sec The number of messages that have been queued for delivery per second.
Messages Sent/sec The number of messages sent by the SMTP server each second.
Messages Submitted/sec The number of messages that have been queued in the Submission queue per second.
Submission Queue Length The number of messages in the submission queue.
Transport Mail Database View
Database Instance I/O Log Reads/sec The rate at which bytes are read from the log.
Database Instance I/O Log Writes/sec The rate at which bytes are written to the log.
Database Instance Log Generation Checkpoint Depth
The amount of work in the log file count that will need to be redone or undone to the database file if the process fails.
Database Instance Log Record Stalls/sec The number of log records that cannot be added to the log buffers per second because the log buffers are full.
Database Instance Log Threads Waiting The number of threads waiting for their data to be written to the log to complete an update of the database.
Database Instance Version Buckets Allocated The total number of version buckets allocated.
Table 188. Exchange Server Roles view - Edge Transport
View/Edge Transport Metrics Description
Foglight for Exchange 5.6.9User and Reference Guide
192
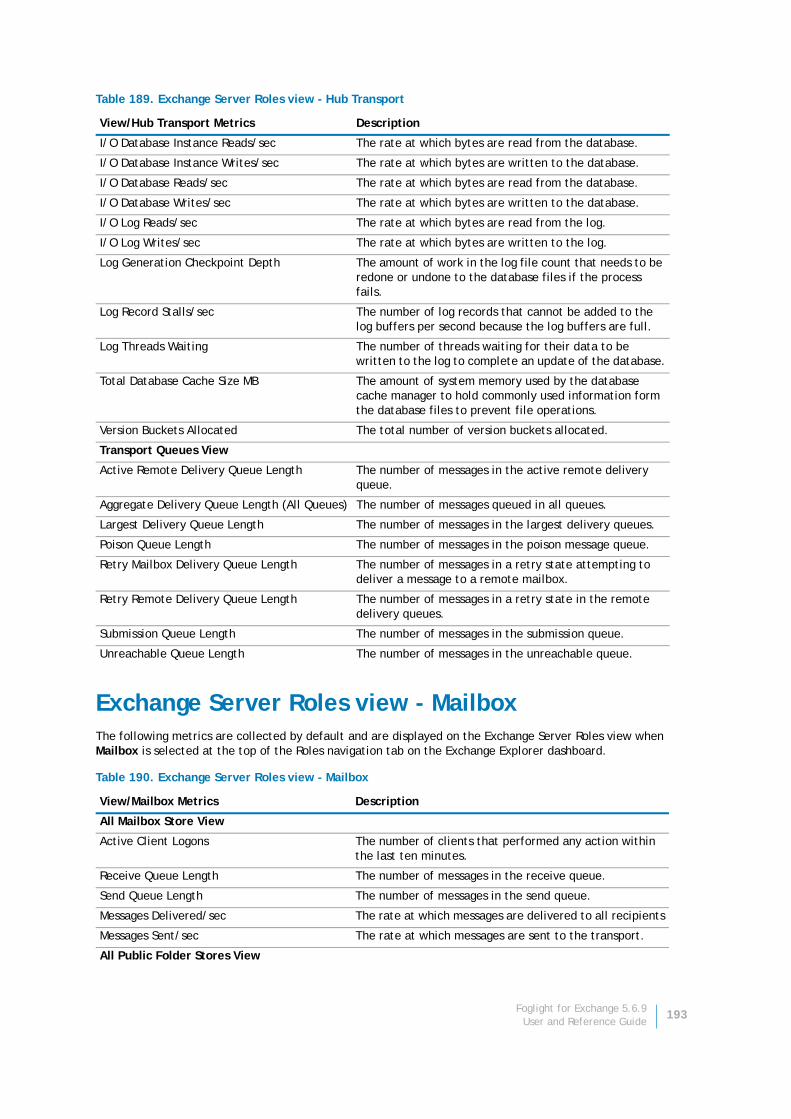
Exchange Server Roles view - MailboxThe following metrics are collected by default and are displayed on the Exchange Server Roles view when Mailbox is selected at the top of the Roles navigation tab on the Exchange Explorer dashboard.
I/O Database Instance Reads/sec The rate at which bytes are read from the database.
I/O Database Instance Writes/sec The rate at which bytes are written to the database.
I/O Database Reads/sec The rate at which bytes are read from the database.
I/O Database Writes/sec The rate at which bytes are written to the database.
I/O Log Reads/sec The rate at which bytes are read from the log.
I/O Log Writes/sec The rate at which bytes are written to the log.
Log Generation Checkpoint Depth The amount of work in the log file count that needs to be redone or undone to the database files if the process fails.
Log Record Stalls/sec The number of log records that cannot be added to the log buffers per second because the log buffers are full.
Log Threads Waiting The number of threads waiting for their data to be written to the log to complete an update of the database.
Total Database Cache Size MB The amount of system memory used by the database cache manager to hold commonly used information form the database files to prevent file operations.
Version Buckets Allocated The total number of version buckets allocated.
Transport Queues View
Active Remote Delivery Queue Length The number of messages in the active remote delivery queue.
Aggregate Delivery Queue Length (All Queues) The number of messages queued in all queues.
Largest Delivery Queue Length The number of messages in the largest delivery queues.
Poison Queue Length The number of messages in the poison message queue.
Retry Mailbox Delivery Queue Length The number of messages in a retry state attempting to deliver a message to a remote mailbox.
Retry Remote Delivery Queue Length The number of messages in a retry state in the remote delivery queues.
Submission Queue Length The number of messages in the submission queue.
Unreachable Queue Length The number of messages in the unreachable queue.
Table 190. Exchange Server Roles view - Mailbox
View/Mailbox Metrics Description
All Mailbox Store View
Active Client Logons The number of clients that performed any action within the last ten minutes.
Receive Queue Length The number of messages in the receive queue.
Send Queue Length The number of messages in the send queue.
Messages Delivered/sec The rate at which messages are delivered to all recipients
Messages Sent/sec The rate at which messages are sent to the transport.
All Public Folder Stores View
Table 189. Exchange Server Roles view - Hub Transport
View/Hub Transport Metrics Description
Foglight for Exchange 5.6.9User and Reference Guide
193

Active Client Logons The number of clients that performed any action within the last ten minutes.
Messages Delivered/sec The rate at which messages are delivered to all recipients.
Messages Sent/sec The rate at which messages are sent to the transport.
Public Folder Send Queue Size The number of messages in the send queue.
Receive Queue Size The number of messages in the public store’s receive queue.
NOTE: This metric applies to Exchange 2007 only.
Cluster Replication View
I/O Log Writes Average Latency The average time it takes to write a log buffer to the active log file
Log Record Stalls/sec The number of log records that cannot be added to the log buffer per second because the log buffers are full.
Log Threads Waiting The number of threads waiting for their data to be written to the log to complete an update of the database.
Information Store View
Client Instance RPC Average Latency The RPC latency averaged for all operations in the last 1,024 packets.
Client Instance RPC Operations/sec The current number of RPC operations that are occurring per second.
Database Cache Percent Hit The percentage of database file page requests that fulfilled the database cache without causing a file operation.
Database Page Fault Stalls/sec The rate at which the database file page requests require the database cache manager to allocate a new page from the database cache.
Directory Access LDAP Reads/sec The current rate at which LDAP reads occur while processing requests for the client.
Directory Access LDAP Searches/sec The current rate at which LDAP searches occur while processing requests for the client.
IS Database Cache Size MB The amount of system memory used by the database cache manager to hold commonly used information from the database files to prevent file operations.
Jet Log Records/sec The rate at which database log records are generated while processing requests for the client.
Jet Pages Read/sec The rate at which database pages are read from disk while processing requests for the client.
Log Record Stalls/sec The number of log records that cannot be added to the log buffer per second because the log buffers are full.
Log Threads Waiting The number of threads waiting for their data to be written to the log to complete an update of the database.
RPC Averaged Latency The RPC latency averaged for the past 1,024 packets for a particular client protocol.
RPC Client Backoff /sec The rate at which the server notifies the client to back off.
RPC Number of Slow Packets The number of RPC packets in the past 1,024 packets that have latencies longer than two seconds.
RPC Operations/sec The rate at which RPC operations occur.
Table 190. Exchange Server Roles view - Mailbox
View/Mailbox Metrics Description
Foglight for Exchange 5.6.9User and Reference Guide
194

RPC Requests The number of client requests that are currently being processed by the information store.
RPCs Failed Server Too Busy/sec The client-reported rate at which failed RPCs are encountered with the server too busy ROC error.
Version Buckets Allocated The total number of version buckets allocated.
NOTE: This metric applies to Exchange 2007 only.
Storage Groups and Stores View
NOTE: Applies to Exchange Server 2007.
I/O Database Reads Average Latency The average length of time per database read operation.
I/O Database Writes Average Latency The average length of time per database write operation.
Public Folder Send Queue Size The number of messages in the send queue.
Storage Group Log Generation Checkpoint Depth
The amount of work in the log file count that will need to be redone or undone to the database files if the process fails.
Stores View
NOTE: Applies to Exchange Server 2010
Active Client Logons The number of clients that performed any action within the last ten minutes.
Average Delivery Time Metric The average time between the submission of a message to the mailbox store and the delivery to all local recipients for the last ten messages.
Client Logons The number of clients (including system processes) currently logged on.
Inbound Messages The number of Mailbox Store inbound messages.
I/O Database Reads Average Latency The average length of time per database read operation.
I/O Database Writes Average Latency The average length of time per database write operation.
Logon Operations/sec The rate of logon requests in the mailbox store.
Mailbox Store Messages Queued for Submission
The number of currently submitted messages that are not yet processed by the transport layer
Mailbox Store Send Queue Size The number of messages in the send queue.
Messages Delivered/sec The rate at which messages are delivered to all recipients.
Messages Sent/sec The rate at which messages are sent to the transport.
Messages Submitted/sec The rate at which messages are submitted by clients.
Outbound Messages The number of Mailbox store outbound messages.
Public Folder Messages Queued for Submission The number of currently submitted messages that are not yet processed by the transport layer.
Public Folder Send Queue Size The number of messages in the send queue.
Receive Queue Size The number of messages in the receive queue.
Storage Group Log Generation Checkpoint Depth
The amount of work in the log file count that will need to be redone or undone to the database files if the process fails.
Store Transport
Failed Submissions/sec The number of failed submissions per second.
Successful Submissions/sec The current submission rate.
Table 190. Exchange Server Roles view - Mailbox
View/Mailbox Metrics Description
Foglight for Exchange 5.6.9User and Reference Guide
195
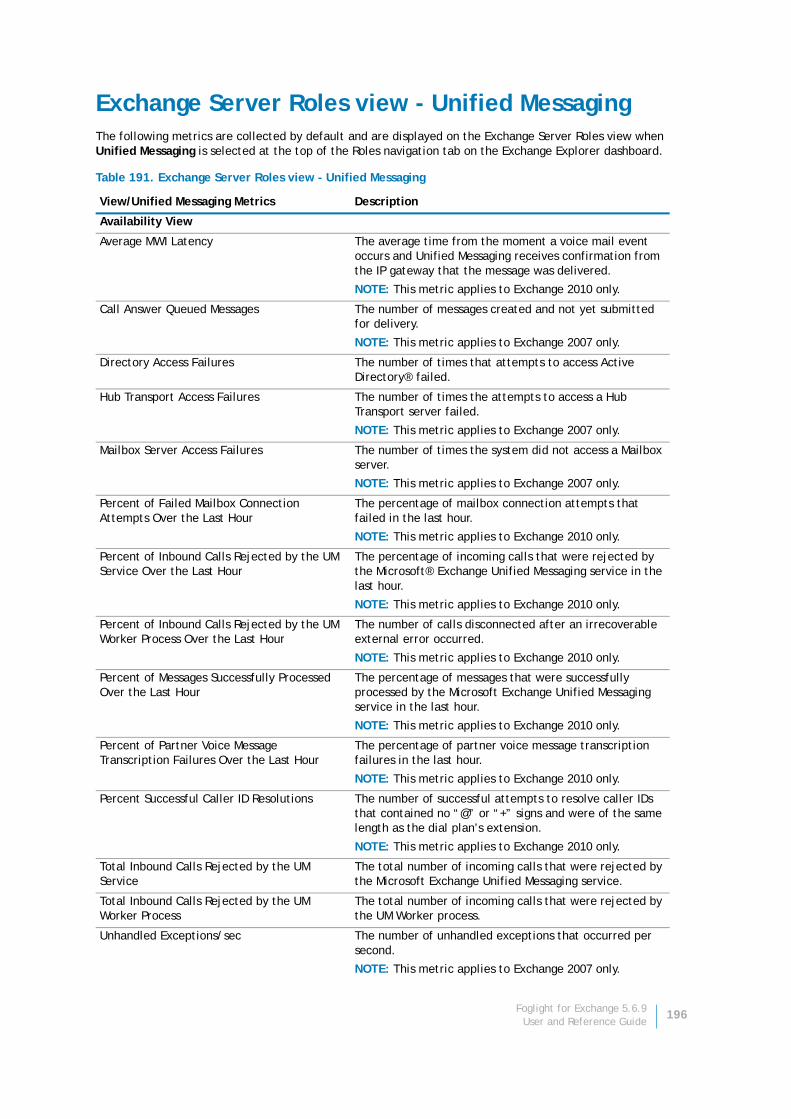
Exchange Server Roles view - Unified MessagingThe following metrics are collected by default and are displayed on the Exchange Server Roles view when Unified Messaging is selected at the top of the Roles navigation tab on the Exchange Explorer dashboard.
Table 191. Exchange Server Roles view - Unified Messaging
View/Unified Messaging Metrics Description
Availability View
Average MWI Latency The average time from the moment a voice mail event occurs and Unified Messaging receives confirmation from the IP gateway that the message was delivered.
NOTE: This metric applies to Exchange 2010 only.
Call Answer Queued Messages The number of messages created and not yet submitted for delivery.
NOTE: This metric applies to Exchange 2007 only.
Directory Access Failures The number of times that attempts to access Active Directory® failed.
Hub Transport Access Failures The number of times the attempts to access a Hub Transport server failed.
NOTE: This metric applies to Exchange 2007 only.
Mailbox Server Access Failures The number of times the system did not access a Mailbox server.
NOTE: This metric applies to Exchange 2007 only.
Percent of Failed Mailbox Connection Attempts Over the Last Hour
The percentage of mailbox connection attempts that failed in the last hour.
NOTE: This metric applies to Exchange 2010 only.
Percent of Inbound Calls Rejected by the UM Service Over the Last Hour
The percentage of incoming calls that were rejected by the Microsoft® Exchange Unified Messaging service in the last hour.
NOTE: This metric applies to Exchange 2010 only.
Percent of Inbound Calls Rejected by the UM Worker Process Over the Last Hour
The number of calls disconnected after an irrecoverable external error occurred.
NOTE: This metric applies to Exchange 2010 only.
Percent of Messages Successfully Processed Over the Last Hour
The percentage of messages that were successfully processed by the Microsoft Exchange Unified Messaging service in the last hour.
NOTE: This metric applies to Exchange 2010 only.
Percent of Partner Voice Message Transcription Failures Over the Last Hour
The percentage of partner voice message transcription failures in the last hour.
NOTE: This metric applies to Exchange 2010 only.
Percent Successful Caller ID Resolutions The number of successful attempts to resolve caller IDs that contained no “@” or “+” signs and were of the same length as the dial plan’s extension.
NOTE: This metric applies to Exchange 2010 only.
Total Inbound Calls Rejected by the UM Service
The total number of incoming calls that were rejected by the Microsoft Exchange Unified Messaging service.
Total Inbound Calls Rejected by the UM Worker Process
The total number of incoming calls that were rejected by the UM Worker process.
Unhandled Exceptions/sec The number of unhandled exceptions that occurred per second.
NOTE: This metric applies to Exchange 2007 only.
Foglight for Exchange 5.6.9User and Reference Guide
196
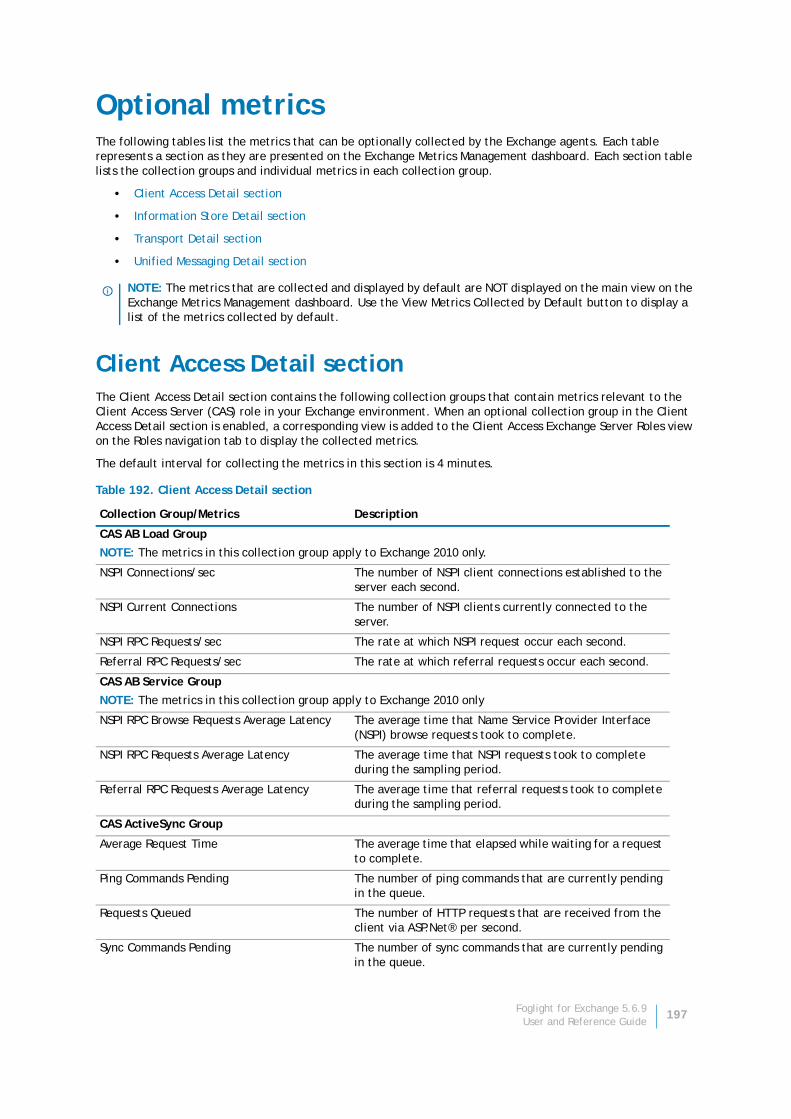
Optional metricsThe following tables list the metrics that can be optionally collected by the Exchange agents. Each table represents a section as they are presented on the Exchange Metrics Management dashboard. Each section table lists the collection groups and individual metrics in each collection group.
• Client Access Detail section
• Information Store Detail section
• Transport Detail section
• Unified Messaging Detail section
Client Access Detail sectionThe Client Access Detail section contains the following collection groups that contain metrics relevant to the Client Access Server (CAS) role in your Exchange environment. When an optional collection group in the Client Access Detail section is enabled, a corresponding view is added to the Client Access Exchange Server Roles view on the Roles navigation tab to display the collected metrics.
The default interval for collecting the metrics in this section is 4 minutes.
NOTE: The metrics that are collected and displayed by default are NOT displayed on the main view on the Exchange Metrics Management dashboard. Use the View Metrics Collected by Default button to display a list of the metrics collected by default.
Table 192. Client Access Detail section
Collection Group/Metrics Description
CAS AB Load Group
NOTE: The metrics in this collection group apply to Exchange 2010 only.
NSPI Connections/sec The number of NSPI client connections established to the server each second.
NSPI Current Connections The number of NSPI clients currently connected to the server.
NSPI RPC Requests/sec The rate at which NSPI request occur each second.
Referral RPC Requests/sec The rate at which referral requests occur each second.
CAS AB Service Group
NOTE: The metrics in this collection group apply to Exchange 2010 only
NSPI RPC Browse Requests Average Latency The average time that Name Service Provider Interface (NSPI) browse requests took to complete.
NSPI RPC Requests Average Latency The average time that NSPI requests took to complete during the sampling period.
Referral RPC Requests Average Latency The average time that referral requests took to complete during the sampling period.
CAS ActiveSync Group
Average Request Time The average time that elapsed while waiting for a request to complete.
Ping Commands Pending The number of ping commands that are currently pending in the queue.
Requests Queued The number of HTTP requests that are received from the client via ASP.Net® per second.
Sync Commands Pending The number of sync commands that are currently pending in the queue.
Foglight for Exchange 5.6.9User and Reference Guide
197
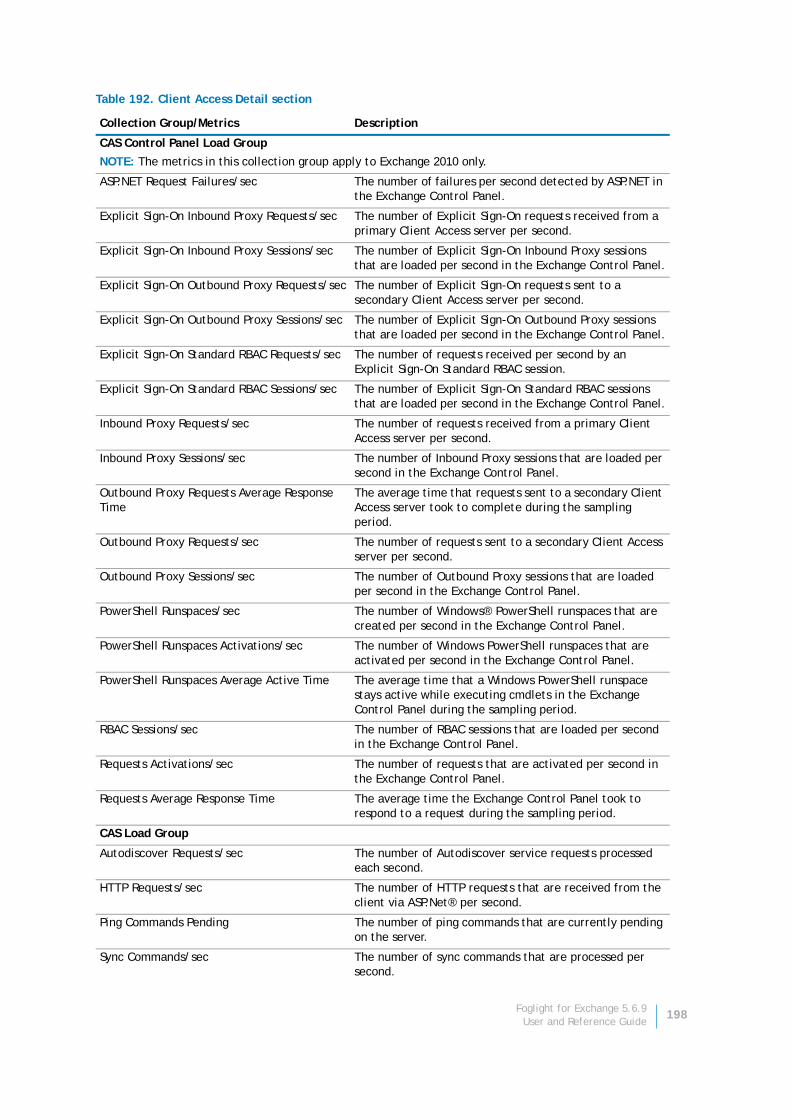
CAS Control Panel Load Group
NOTE: The metrics in this collection group apply to Exchange 2010 only.
ASP.NET Request Failures/sec The number of failures per second detected by ASP.NET in the Exchange Control Panel.
Explicit Sign-On Inbound Proxy Requests/sec The number of Explicit Sign-On requests received from a primary Client Access server per second.
Explicit Sign-On Inbound Proxy Sessions/sec The number of Explicit Sign-On Inbound Proxy sessions that are loaded per second in the Exchange Control Panel.
Explicit Sign-On Outbound Proxy Requests/sec The number of Explicit Sign-On requests sent to a secondary Client Access server per second.
Explicit Sign-On Outbound Proxy Sessions/sec The number of Explicit Sign-On Outbound Proxy sessions that are loaded per second in the Exchange Control Panel.
Explicit Sign-On Standard RBAC Requests/sec The number of requests received per second by an Explicit Sign-On Standard RBAC session.
Explicit Sign-On Standard RBAC Sessions/sec The number of Explicit Sign-On Standard RBAC sessions that are loaded per second in the Exchange Control Panel.
Inbound Proxy Requests/sec The number of requests received from a primary Client Access server per second.
Inbound Proxy Sessions/sec The number of Inbound Proxy sessions that are loaded per second in the Exchange Control Panel.
Outbound Proxy Requests Average Response Time
The average time that requests sent to a secondary Client Access server took to complete during the sampling period.
Outbound Proxy Requests/sec The number of requests sent to a secondary Client Access server per second.
Outbound Proxy Sessions/sec The number of Outbound Proxy sessions that are loaded per second in the Exchange Control Panel.
PowerShell Runspaces/sec The number of Windows® PowerShell runspaces that are created per second in the Exchange Control Panel.
PowerShell Runspaces Activations/sec The number of Windows PowerShell runspaces that are activated per second in the Exchange Control Panel.
PowerShell Runspaces Average Active Time The average time that a Windows PowerShell runspace stays active while executing cmdlets in the Exchange Control Panel during the sampling period.
RBAC Sessions/sec The number of RBAC sessions that are loaded per second in the Exchange Control Panel.
Requests Activations/sec The number of requests that are activated per second in the Exchange Control Panel.
Requests Average Response Time The average time the Exchange Control Panel took to respond to a request during the sampling period.
CAS Load Group
Autodiscover Requests/sec The number of Autodiscover service requests processed each second.
HTTP Requests/sec The number of HTTP requests that are received from the client via ASP.Net® per second.
Ping Commands Pending The number of ping commands that are currently pending on the server.
Sync Commands/sec The number of sync commands that are processed per second.
Table 192. Client Access Detail section
Collection Group/Metrics Description
Foglight for Exchange 5.6.9User and Reference Guide
198
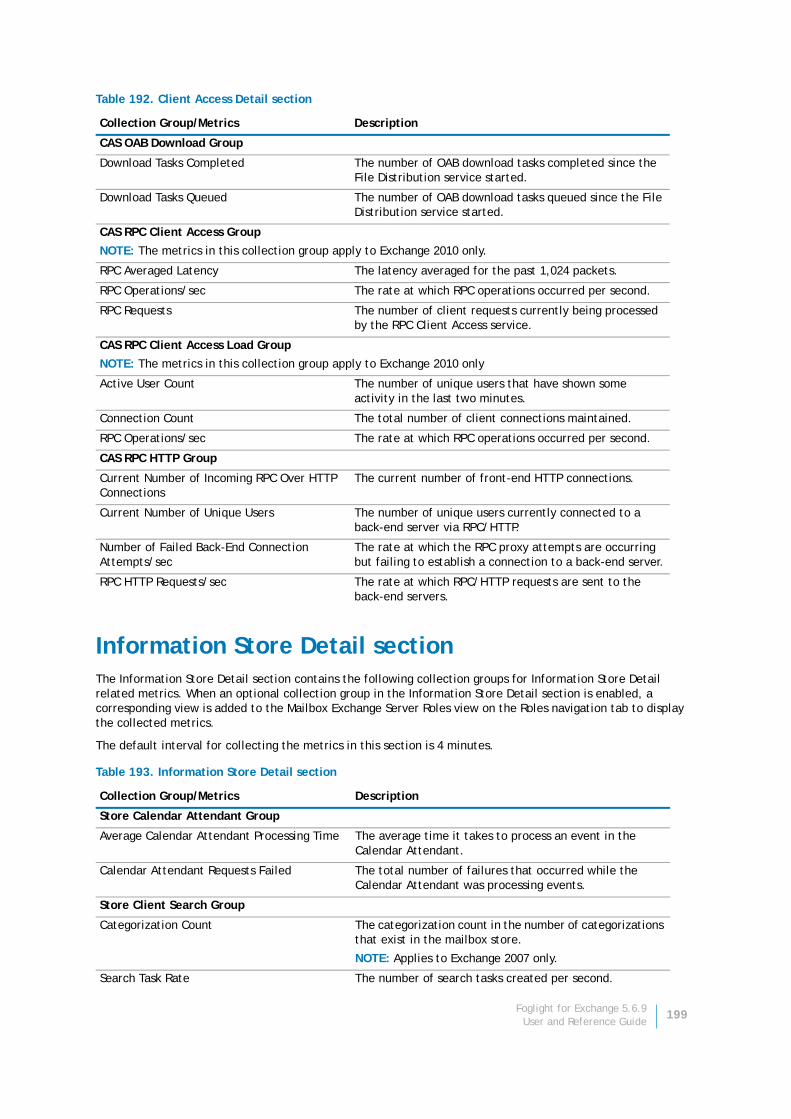
Information Store Detail sectionThe Information Store Detail section contains the following collection groups for Information Store Detail related metrics. When an optional collection group in the Information Store Detail section is enabled, a corresponding view is added to the Mailbox Exchange Server Roles view on the Roles navigation tab to display the collected metrics.
The default interval for collecting the metrics in this section is 4 minutes.
CAS OAB Download Group
Download Tasks Completed The number of OAB download tasks completed since the File Distribution service started.
Download Tasks Queued The number of OAB download tasks queued since the File Distribution service started.
CAS RPC Client Access Group
NOTE: The metrics in this collection group apply to Exchange 2010 only.
RPC Averaged Latency The latency averaged for the past 1,024 packets.
RPC Operations/sec The rate at which RPC operations occurred per second.
RPC Requests The number of client requests currently being processed by the RPC Client Access service.
CAS RPC Client Access Load Group
NOTE: The metrics in this collection group apply to Exchange 2010 only
Active User Count The number of unique users that have shown some activity in the last two minutes.
Connection Count The total number of client connections maintained.
RPC Operations/sec The rate at which RPC operations occurred per second.
CAS RPC HTTP Group
Current Number of Incoming RPC Over HTTP Connections
The current number of front-end HTTP connections.
Current Number of Unique Users The number of unique users currently connected to a back-end server via RPC/HTTP.
Number of Failed Back-End Connection Attempts/sec
The rate at which the RPC proxy attempts are occurring but failing to establish a connection to a back-end server.
RPC HTTP Requests/sec The rate at which RPC/HTTP requests are sent to the back-end servers.
Table 193. Information Store Detail section
Collection Group/Metrics Description
Store Calendar Attendant Group
Average Calendar Attendant Processing Time The average time it takes to process an event in the Calendar Attendant.
Calendar Attendant Requests Failed The total number of failures that occurred while the Calendar Attendant was processing events.
Store Client Search Group
Categorization Count The categorization count in the number of categorizations that exist in the mailbox store.
NOTE: Applies to Exchange 2007 only.
Search Task Rate The number of search tasks created per second.
Table 192. Client Access Detail section
Collection Group/Metrics Description
Foglight for Exchange 5.6.9User and Reference Guide
199

Slow Findrow Rate The rate at which the slower Findrow needs to be used in the mailbox store.
Slow QP Threads The number of query processor threads currently running queries that are not optimized.
Slow Search Threads The number of search threads currently running queries that are not optimized.
Store Content Indexing Group
Average Document Indexing Time The average of how long it takes to index documents.
Full Crawl Mode Status Indicates if a full crawl is occurring for any specified database.
Recent Average Latency of RPCs Used to Obtain Content
The average latency of the most recent RPCs to the Microsoft® Exchange Information Store service.
Throttling Delay Value The total time a worker thread sleeps before it retrieves a document from the Microsoft Exchange Information Store service.
Store Database Group
Log Bytes Write/sec The rate at which bytes are written to the log.
Store Mailbox Assistant Group
Average Event Processing Time in Seconds The average processing time of the selected events.
Events in Queue The number of events in the in-memory queue waiting to be processed by the assistants.
Events Polled/sec The number of events polled per second.
Mailboxes Processed/sec The rate at which mailboxes are processed by time-based assistants per second.
Store Public Load Group
Replication Receive Queue Size The number of replication messages waiting to be processed.
Store Resource Booking Group
Average Resource Booking Processing Time The average time to process an event in the Resource Booking Attendant.
Resource Booking Requests Failed The total number of failures that occurred while the Resource Booking Attendant was processing events.
Store RPC Client Throttling Group
Client RPCs Failed Server Too Busy The client-reported rate of failed RPCs due to Server Too Busy ROC error.
Store Transport Group
Hub Servers in Retry The number of Hub Transport servers in retry mode.
ROP Requests Outstanding The total number of outstanding remote operations (ROP) requests.
RPC Latency Average ms The average latency of RPC requests.
RPC Requests Failed Percent The percentage of failed requests in the total number of RPC requests.
RPC Requests Outstanding The total number of outstanding RPC requests.
RPC Requests Sent/sec The current rate of initiated RPC requests per second.
RPC Slow Requests Latency Average ms The average latency of slow RPC requests.
RPC Slow Requests Percent The percentage of slow RPC requests among all RPC requests.
Table 193. Information Store Detail section
Collection Group/Metrics Description
Foglight for Exchange 5.6.9User and Reference Guide
200
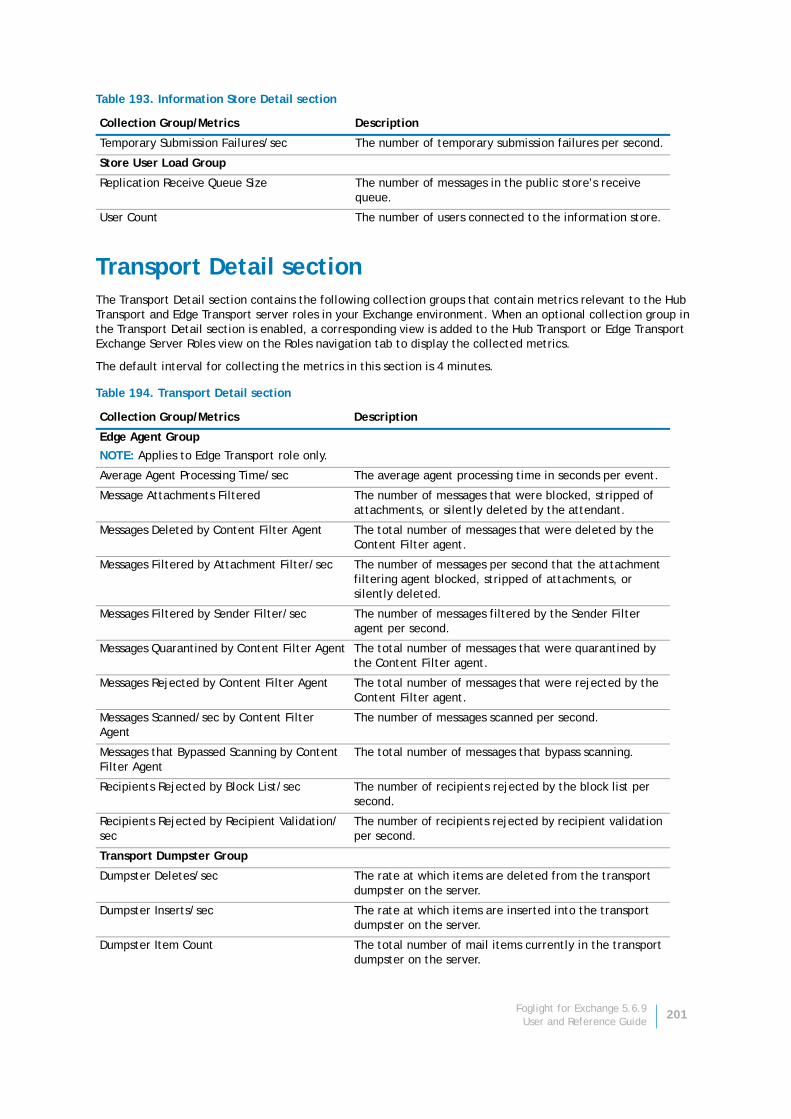
Transport Detail sectionThe Transport Detail section contains the following collection groups that contain metrics relevant to the Hub Transport and Edge Transport server roles in your Exchange environment. When an optional collection group in the Transport Detail section is enabled, a corresponding view is added to the Hub Transport or Edge Transport Exchange Server Roles view on the Roles navigation tab to display the collected metrics.
The default interval for collecting the metrics in this section is 4 minutes.
Temporary Submission Failures/sec The number of temporary submission failures per second.
Store User Load Group
Replication Receive Queue Size The number of messages in the public store’s receive queue.
User Count The number of users connected to the information store.
Table 194. Transport Detail section
Collection Group/Metrics Description
Edge Agent Group
NOTE: Applies to Edge Transport role only.
Average Agent Processing Time/sec The average agent processing time in seconds per event.
Message Attachments Filtered The number of messages that were blocked, stripped of attachments, or silently deleted by the attendant.
Messages Deleted by Content Filter Agent The total number of messages that were deleted by the Content Filter agent.
Messages Filtered by Attachment Filter/sec The number of messages per second that the attachment filtering agent blocked, stripped of attachments, or silently deleted.
Messages Filtered by Sender Filter/sec The number of messages filtered by the Sender Filter agent per second.
Messages Quarantined by Content Filter Agent The total number of messages that were quarantined by the Content Filter agent.
Messages Rejected by Content Filter Agent The total number of messages that were rejected by the Content Filter agent.
Messages Scanned/sec by Content Filter Agent
The number of messages scanned per second.
Messages that Bypassed Scanning by Content Filter Agent
The total number of messages that bypass scanning.
Recipients Rejected by Block List/sec The number of recipients rejected by the block list per second.
Recipients Rejected by Recipient Validation/sec
The number of recipients rejected by recipient validation per second.
Transport Dumpster Group
Dumpster Deletes/sec The rate at which items are deleted from the transport dumpster on the server.
Dumpster Inserts/sec The rate at which items are inserted into the transport dumpster on the server.
Dumpster Item Count The total number of mail items currently in the transport dumpster on the server.
Table 193. Information Store Detail section
Collection Group/Metrics Description
Foglight for Exchange 5.6.9User and Reference Guide
201
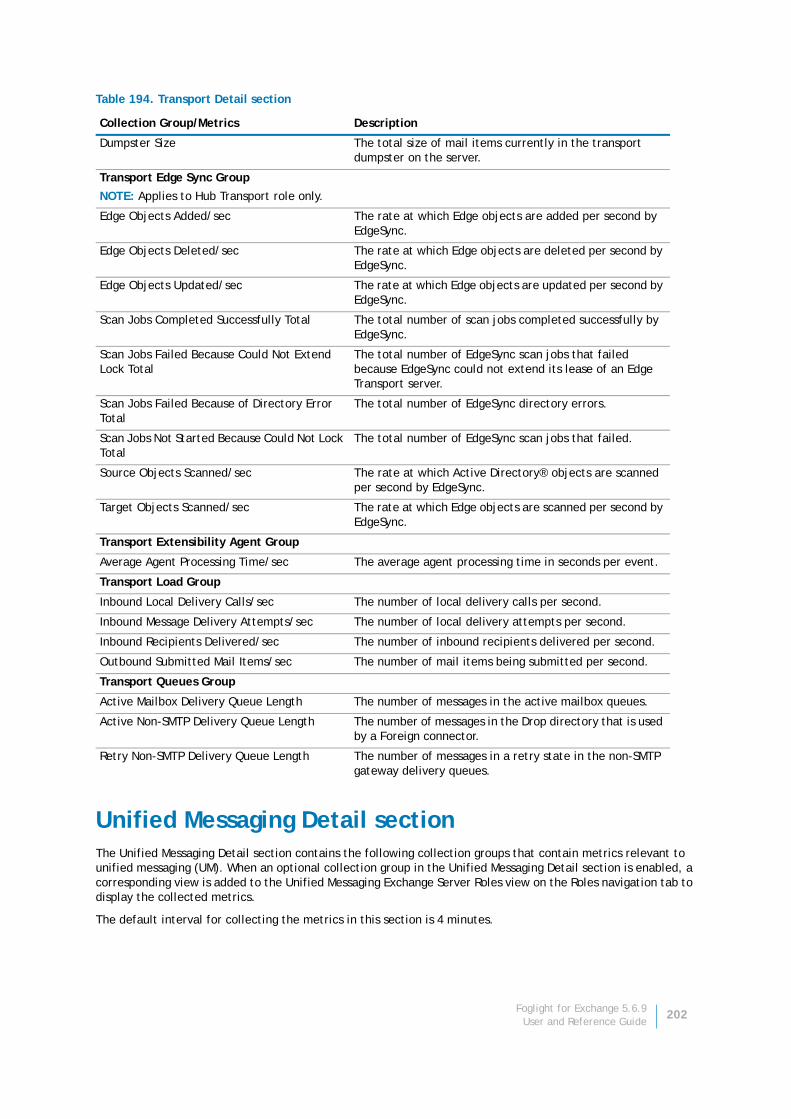
Unified Messaging Detail sectionThe Unified Messaging Detail section contains the following collection groups that contain metrics relevant to unified messaging (UM). When an optional collection group in the Unified Messaging Detail section is enabled, a corresponding view is added to the Unified Messaging Exchange Server Roles view on the Roles navigation tab to display the collected metrics.
The default interval for collecting the metrics in this section is 4 minutes.
Dumpster Size The total size of mail items currently in the transport dumpster on the server.
Transport Edge Sync Group
NOTE: Applies to Hub Transport role only.
Edge Objects Added/sec The rate at which Edge objects are added per second by EdgeSync.
Edge Objects Deleted/sec The rate at which Edge objects are deleted per second by EdgeSync.
Edge Objects Updated/sec The rate at which Edge objects are updated per second by EdgeSync.
Scan Jobs Completed Successfully Total The total number of scan jobs completed successfully by EdgeSync.
Scan Jobs Failed Because Could Not Extend Lock Total
The total number of EdgeSync scan jobs that failed because EdgeSync could not extend its lease of an Edge Transport server.
Scan Jobs Failed Because of Directory Error Total
The total number of EdgeSync directory errors.
Scan Jobs Not Started Because Could Not Lock Total
The total number of EdgeSync scan jobs that failed.
Source Objects Scanned/sec The rate at which Active Directory® objects are scanned per second by EdgeSync.
Target Objects Scanned/sec The rate at which Edge objects are scanned per second by EdgeSync.
Transport Extensibility Agent Group
Average Agent Processing Time/sec The average agent processing time in seconds per event.
Transport Load Group
Inbound Local Delivery Calls/sec The number of local delivery calls per second.
Inbound Message Delivery Attempts/sec The number of local delivery attempts per second.
Inbound Recipients Delivered/sec The number of inbound recipients delivered per second.
Outbound Submitted Mail Items/sec The number of mail items being submitted per second.
Transport Queues Group
Active Mailbox Delivery Queue Length The number of messages in the active mailbox queues.
Active Non-SMTP Delivery Queue Length The number of messages in the Drop directory that is used by a Foreign connector.
Retry Non-SMTP Delivery Queue Length The number of messages in a retry state in the non-SMTP gateway delivery queues.
Table 194. Transport Detail section
Collection Group/Metrics Description
Foglight for Exchange 5.6.9User and Reference Guide
202
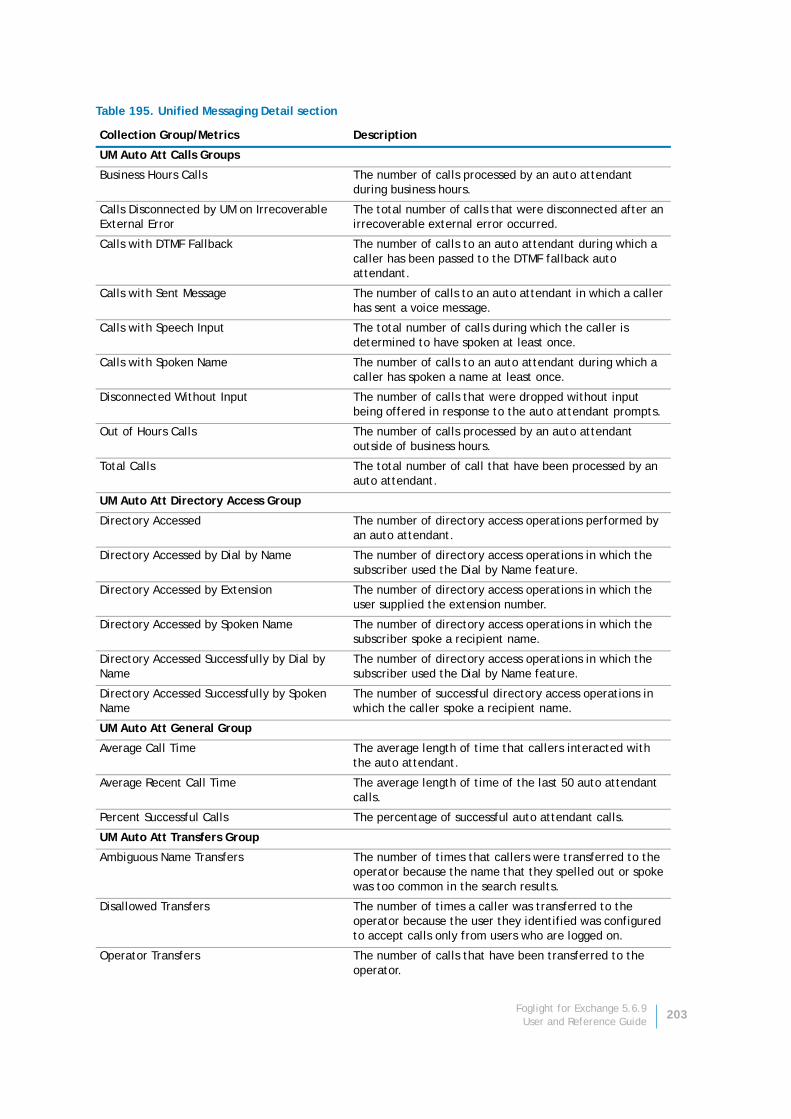
Table 195. Unified Messaging Detail section
Collection Group/Metrics Description
UM Auto Att Calls Groups
Business Hours Calls The number of calls processed by an auto attendant during business hours.
Calls Disconnected by UM on Irrecoverable External Error
The total number of calls that were disconnected after an irrecoverable external error occurred.
Calls with DTMF Fallback The number of calls to an auto attendant during which a caller has been passed to the DTMF fallback auto attendant.
Calls with Sent Message The number of calls to an auto attendant in which a caller has sent a voice message.
Calls with Speech Input The total number of calls during which the caller is determined to have spoken at least once.
Calls with Spoken Name The number of calls to an auto attendant during which a caller has spoken a name at least once.
Disconnected Without Input The number of calls that were dropped without input being offered in response to the auto attendant prompts.
Out of Hours Calls The number of calls processed by an auto attendant outside of business hours.
Total Calls The total number of call that have been processed by an auto attendant.
UM Auto Att Directory Access Group
Directory Accessed The number of directory access operations performed by an auto attendant.
Directory Accessed by Dial by Name The number of directory access operations in which the subscriber used the Dial by Name feature.
Directory Accessed by Extension The number of directory access operations in which the user supplied the extension number.
Directory Accessed by Spoken Name The number of directory access operations in which the subscriber spoke a recipient name.
Directory Accessed Successfully by Dial by Name
The number of directory access operations in which the subscriber used the Dial by Name feature.
Directory Accessed Successfully by Spoken Name
The number of successful directory access operations in which the caller spoke a recipient name.
UM Auto Att General Group
Average Call Time The average length of time that callers interacted with the auto attendant.
Average Recent Call Time The average length of time of the last 50 auto attendant calls.
Percent Successful Calls The percentage of successful auto attendant calls.
UM Auto Att Transfers Group
Ambiguous Name Transfers The number of times that callers were transferred to the operator because the name that they spelled out or spoke was too common in the search results.
Disallowed Transfers The number of times a caller was transferred to the operator because the user they identified was configured to accept calls only from users who are logged on.
Operator Transfers The number of calls that have been transferred to the operator.
Foglight for Exchange 5.6.9User and Reference Guide
203
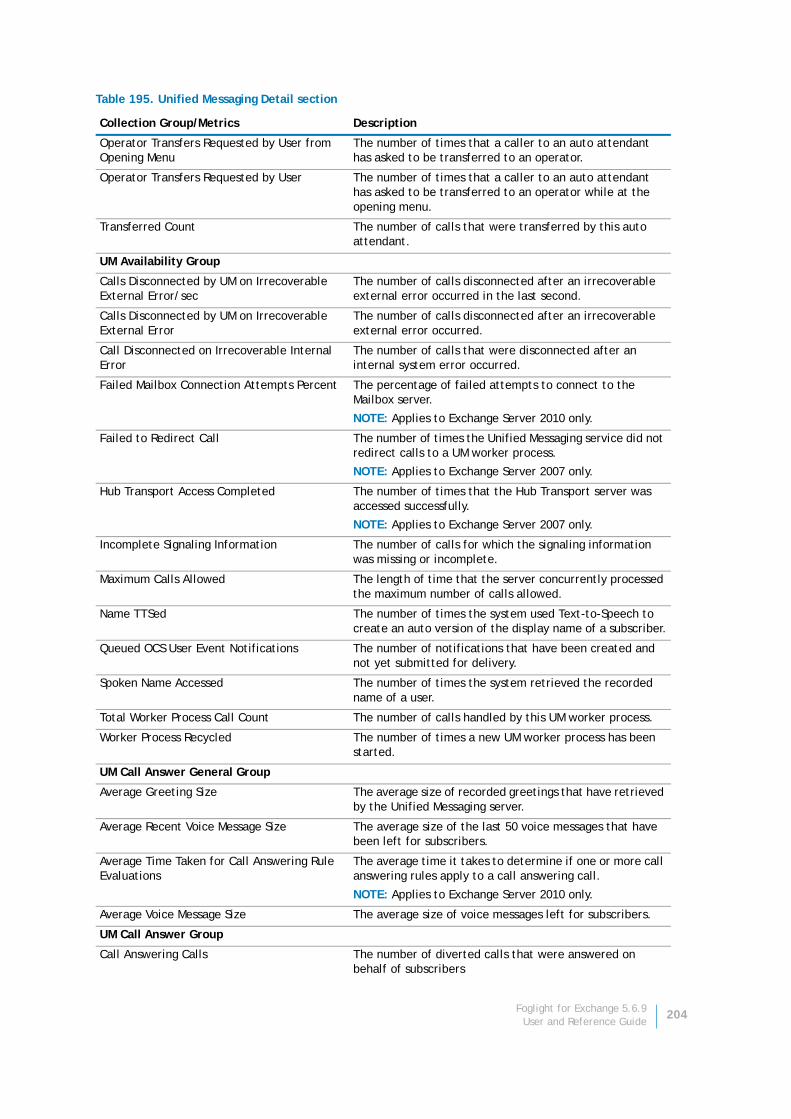
Operator Transfers Requested by User from Opening Menu
The number of times that a caller to an auto attendant has asked to be transferred to an operator.
Operator Transfers Requested by User The number of times that a caller to an auto attendant has asked to be transferred to an operator while at the opening menu.
Transferred Count The number of calls that were transferred by this auto attendant.
UM Availability Group
Calls Disconnected by UM on Irrecoverable External Error/sec
The number of calls disconnected after an irrecoverable external error occurred in the last second.
Calls Disconnected by UM on Irrecoverable External Error
The number of calls disconnected after an irrecoverable external error occurred.
Call Disconnected on Irrecoverable Internal Error
The number of calls that were disconnected after an internal system error occurred.
Failed Mailbox Connection Attempts Percent The percentage of failed attempts to connect to the Mailbox server.
NOTE: Applies to Exchange Server 2010 only.
Failed to Redirect Call The number of times the Unified Messaging service did not redirect calls to a UM worker process.
NOTE: Applies to Exchange Server 2007 only.
Hub Transport Access Completed The number of times that the Hub Transport server was accessed successfully.
NOTE: Applies to Exchange Server 2007 only.
Incomplete Signaling Information The number of calls for which the signaling information was missing or incomplete.
Maximum Calls Allowed The length of time that the server concurrently processed the maximum number of calls allowed.
Name TTSed The number of times the system used Text-to-Speech to create an auto version of the display name of a subscriber.
Queued OCS User Event Notifications The number of notifications that have been created and not yet submitted for delivery.
Spoken Name Accessed The number of times the system retrieved the recorded name of a user.
Total Worker Process Call Count The number of calls handled by this UM worker process.
Worker Process Recycled The number of times a new UM worker process has been started.
UM Call Answer General Group
Average Greeting Size The average size of recorded greetings that have retrieved by the Unified Messaging server.
Average Recent Voice Message Size The average size of the last 50 voice messages that have been left for subscribers.
Average Time Taken for Call Answering Rule Evaluations
The average time it takes to determine if one or more call answering rules apply to a call answering call.
NOTE: Applies to Exchange Server 2010 only.
Average Voice Message Size The average size of voice messages left for subscribers.
UM Call Answer Group
Call Answering Calls The number of diverted calls that were answered on behalf of subscribers
Table 195. Unified Messaging Detail section
Collection Group/Metrics Description
Foglight for Exchange 5.6.9User and Reference Guide
204
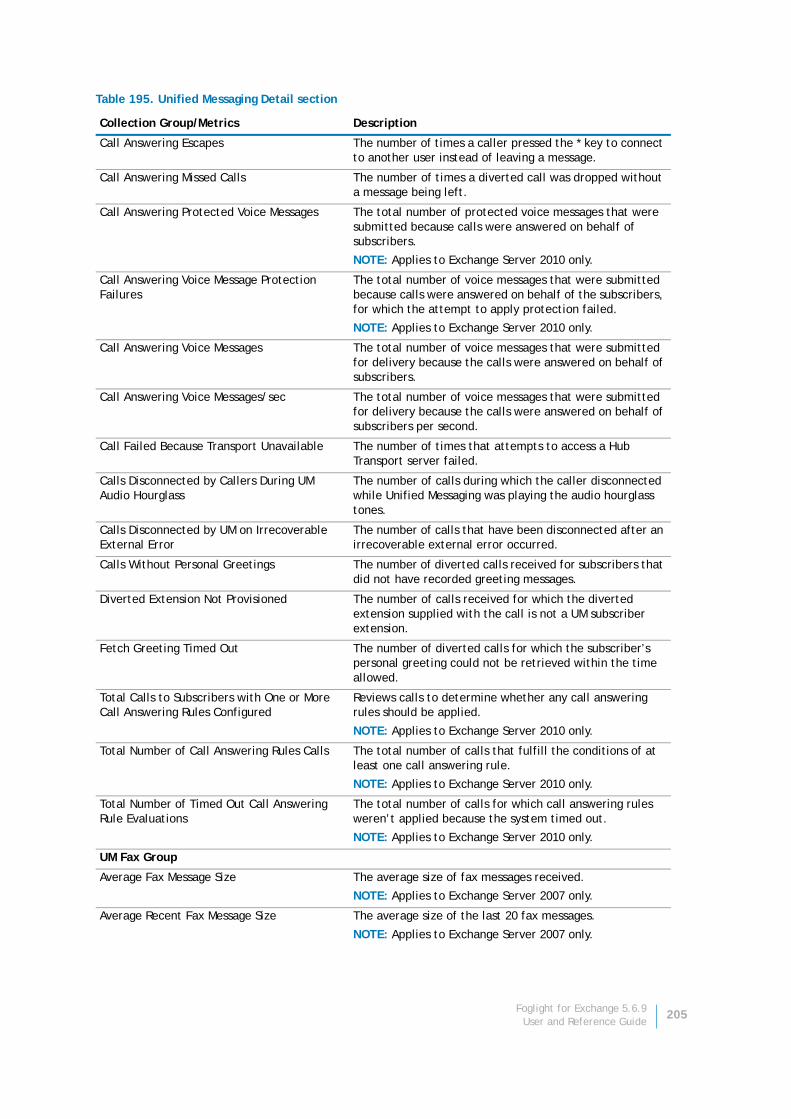
Call Answering Escapes The number of times a caller pressed the * key to connect to another user instead of leaving a message.
Call Answering Missed Calls The number of times a diverted call was dropped without a message being left.
Call Answering Protected Voice Messages The total number of protected voice messages that were submitted because calls were answered on behalf of subscribers.
NOTE: Applies to Exchange Server 2010 only.
Call Answering Voice Message Protection Failures
The total number of voice messages that were submitted because calls were answered on behalf of the subscribers, for which the attempt to apply protection failed.
NOTE: Applies to Exchange Server 2010 only.
Call Answering Voice Messages The total number of voice messages that were submitted for delivery because the calls were answered on behalf of subscribers.
Call Answering Voice Messages/sec The total number of voice messages that were submitted for delivery because the calls were answered on behalf of subscribers per second.
Call Failed Because Transport Unavailable The number of times that attempts to access a Hub Transport server failed.
Calls Disconnected by Callers During UM Audio Hourglass
The number of calls during which the caller disconnected while Unified Messaging was playing the audio hourglass tones.
Calls Disconnected by UM on Irrecoverable External Error
The number of calls that have been disconnected after an irrecoverable external error occurred.
Calls Without Personal Greetings The number of diverted calls received for subscribers that did not have recorded greeting messages.
Diverted Extension Not Provisioned The number of calls received for which the diverted extension supplied with the call is not a UM subscriber extension.
Fetch Greeting Timed Out The number of diverted calls for which the subscriber’s personal greeting could not be retrieved within the time allowed.
Total Calls to Subscribers with One or More Call Answering Rules Configured
Reviews calls to determine whether any call answering rules should be applied.
NOTE: Applies to Exchange Server 2010 only.
Total Number of Call Answering Rules Calls The total number of calls that fulfill the conditions of at least one call answering rule.
NOTE: Applies to Exchange Server 2010 only.
Total Number of Timed Out Call Answering Rule Evaluations
The total number of calls for which call answering rules weren’t applied because the system timed out.
NOTE: Applies to Exchange Server 2010 only.
UM Fax Group
Average Fax Message Size The average size of fax messages received.
NOTE: Applies to Exchange Server 2007 only.
Average Recent Fax Message Size The average size of the last 20 fax messages.
NOTE: Applies to Exchange Server 2007 only.
Table 195. Unified Messaging Detail section
Collection Group/Metrics Description
Foglight for Exchange 5.6.9User and Reference Guide
205
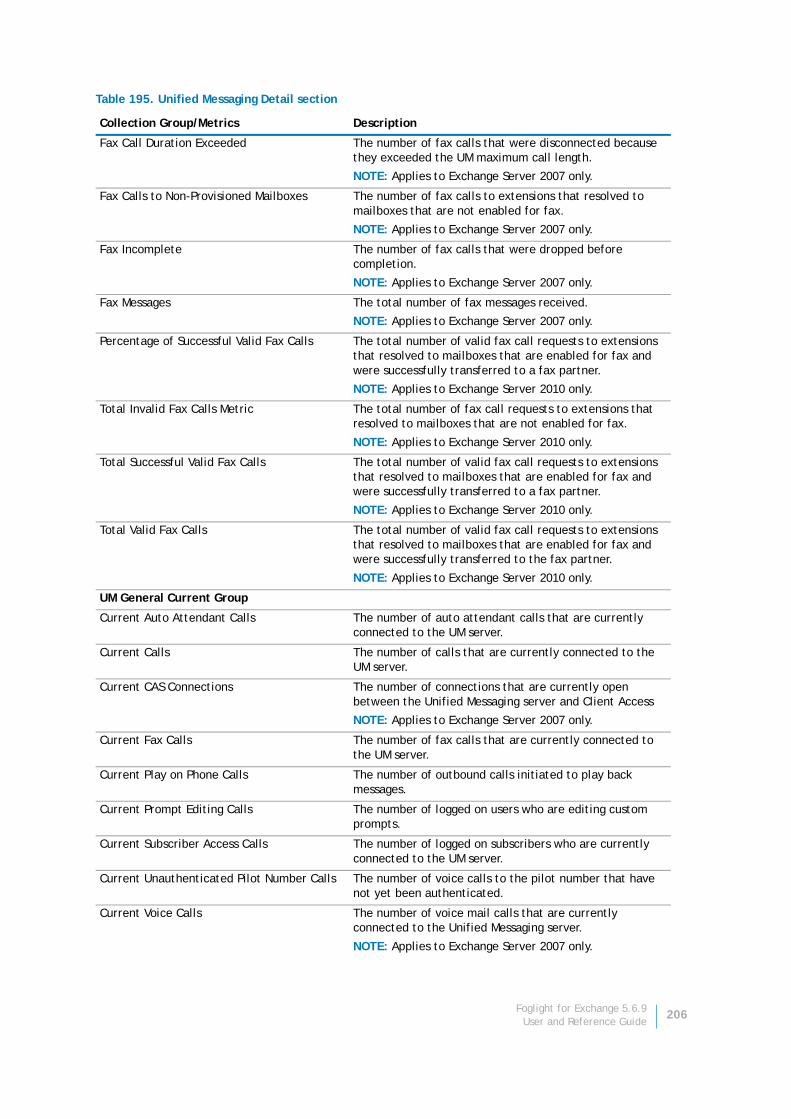
Fax Call Duration Exceeded The number of fax calls that were disconnected because they exceeded the UM maximum call length.
NOTE: Applies to Exchange Server 2007 only.
Fax Calls to Non-Provisioned Mailboxes The number of fax calls to extensions that resolved to mailboxes that are not enabled for fax.
NOTE: Applies to Exchange Server 2007 only.
Fax Incomplete The number of fax calls that were dropped before completion.
NOTE: Applies to Exchange Server 2007 only.
Fax Messages The total number of fax messages received.
NOTE: Applies to Exchange Server 2007 only.
Percentage of Successful Valid Fax Calls The total number of valid fax call requests to extensions that resolved to mailboxes that are enabled for fax and were successfully transferred to a fax partner.
NOTE: Applies to Exchange Server 2010 only.
Total Invalid Fax Calls Metric The total number of fax call requests to extensions that resolved to mailboxes that are not enabled for fax.
NOTE: Applies to Exchange Server 2010 only.
Total Successful Valid Fax Calls The total number of valid fax call requests to extensions that resolved to mailboxes that are enabled for fax and were successfully transferred to a fax partner.
NOTE: Applies to Exchange Server 2010 only.
Total Valid Fax Calls The total number of valid fax call requests to extensions that resolved to mailboxes that are enabled for fax and were successfully transferred to the fax partner.
NOTE: Applies to Exchange Server 2010 only.
UM General Current Group
Current Auto Attendant Calls The number of auto attendant calls that are currently connected to the UM server.
Current Calls The number of calls that are currently connected to the UM server.
Current CAS Connections The number of connections that are currently open between the Unified Messaging server and Client Access
NOTE: Applies to Exchange Server 2007 only.
Current Fax Calls The number of fax calls that are currently connected to the UM server.
Current Play on Phone Calls The number of outbound calls initiated to play back messages.
Current Prompt Editing Calls The number of logged on users who are editing custom prompts.
Current Subscriber Access Calls The number of logged on subscribers who are currently connected to the UM server.
Current Unauthenticated Pilot Number Calls The number of voice calls to the pilot number that have not yet been authenticated.
Current Voice Calls The number of voice mail calls that are currently connected to the Unified Messaging server.
NOTE: Applies to Exchange Server 2007 only.
Table 195. Unified Messaging Detail section
Collection Group/Metrics Description
Foglight for Exchange 5.6.9User and Reference Guide
206
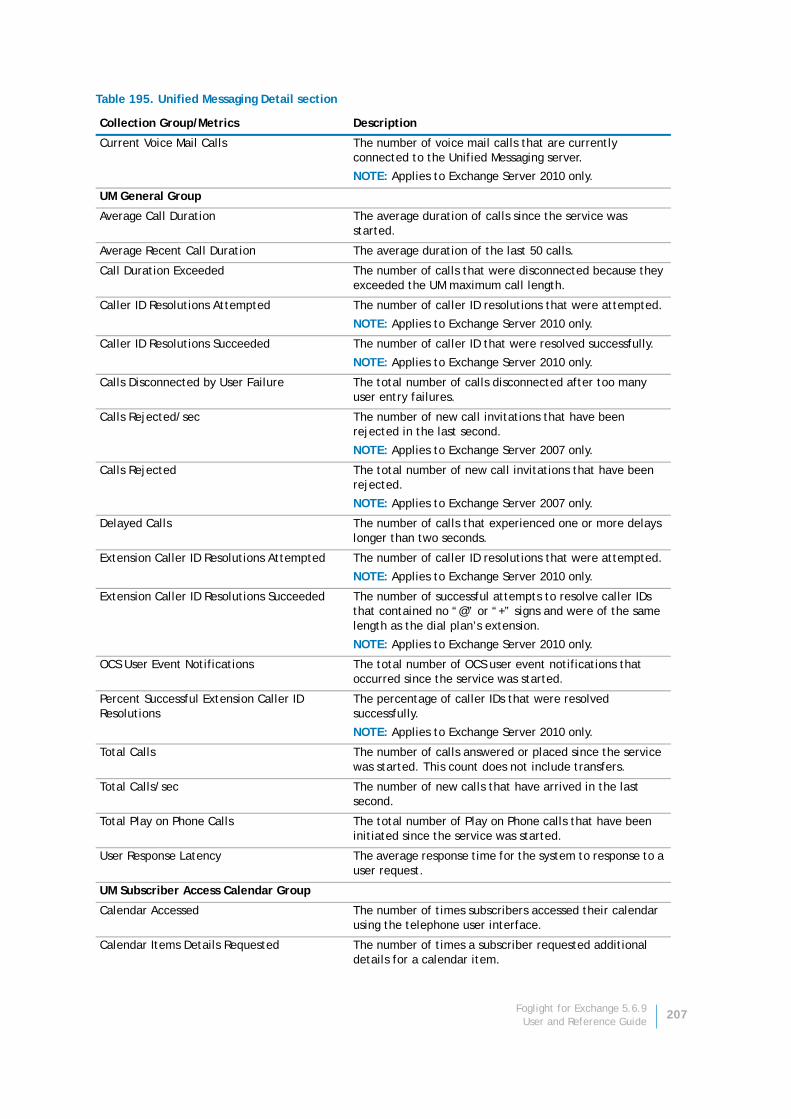
Current Voice Mail Calls The number of voice mail calls that are currently connected to the Unified Messaging server.
NOTE: Applies to Exchange Server 2010 only.
UM General Group
Average Call Duration The average duration of calls since the service was started.
Average Recent Call Duration The average duration of the last 50 calls.
Call Duration Exceeded The number of calls that were disconnected because they exceeded the UM maximum call length.
Caller ID Resolutions Attempted The number of caller ID resolutions that were attempted.
NOTE: Applies to Exchange Server 2010 only.
Caller ID Resolutions Succeeded The number of caller ID that were resolved successfully.
NOTE: Applies to Exchange Server 2010 only.
Calls Disconnected by User Failure The total number of calls disconnected after too many user entry failures.
Calls Rejected/sec The number of new call invitations that have been rejected in the last second.
NOTE: Applies to Exchange Server 2007 only.
Calls Rejected The total number of new call invitations that have been rejected.
NOTE: Applies to Exchange Server 2007 only.
Delayed Calls The number of calls that experienced one or more delays longer than two seconds.
Extension Caller ID Resolutions Attempted The number of caller ID resolutions that were attempted.
NOTE: Applies to Exchange Server 2010 only.
Extension Caller ID Resolutions Succeeded The number of successful attempts to resolve caller IDs that contained no “@” or “+” signs and were of the same length as the dial plan’s extension.
NOTE: Applies to Exchange Server 2010 only.
OCS User Event Notifications The total number of OCS user event notifications that occurred since the service was started.
Percent Successful Extension Caller ID Resolutions
The percentage of caller IDs that were resolved successfully.
NOTE: Applies to Exchange Server 2010 only.
Total Calls The number of calls answered or placed since the service was started. This count does not include transfers.
Total Calls/sec The number of new calls that have arrived in the last second.
Total Play on Phone Calls The total number of Play on Phone calls that have been initiated since the service was started.
User Response Latency The average response time for the system to response to a user request.
UM Subscriber Access Calendar Group
Calendar Accessed The number of times subscribers accessed their calendar using the telephone user interface.
Calendar Items Details Requested The number of times a subscriber requested additional details for a calendar item.
Table 195. Unified Messaging Detail section
Collection Group/Metrics Description
Foglight for Exchange 5.6.9User and Reference Guide
207
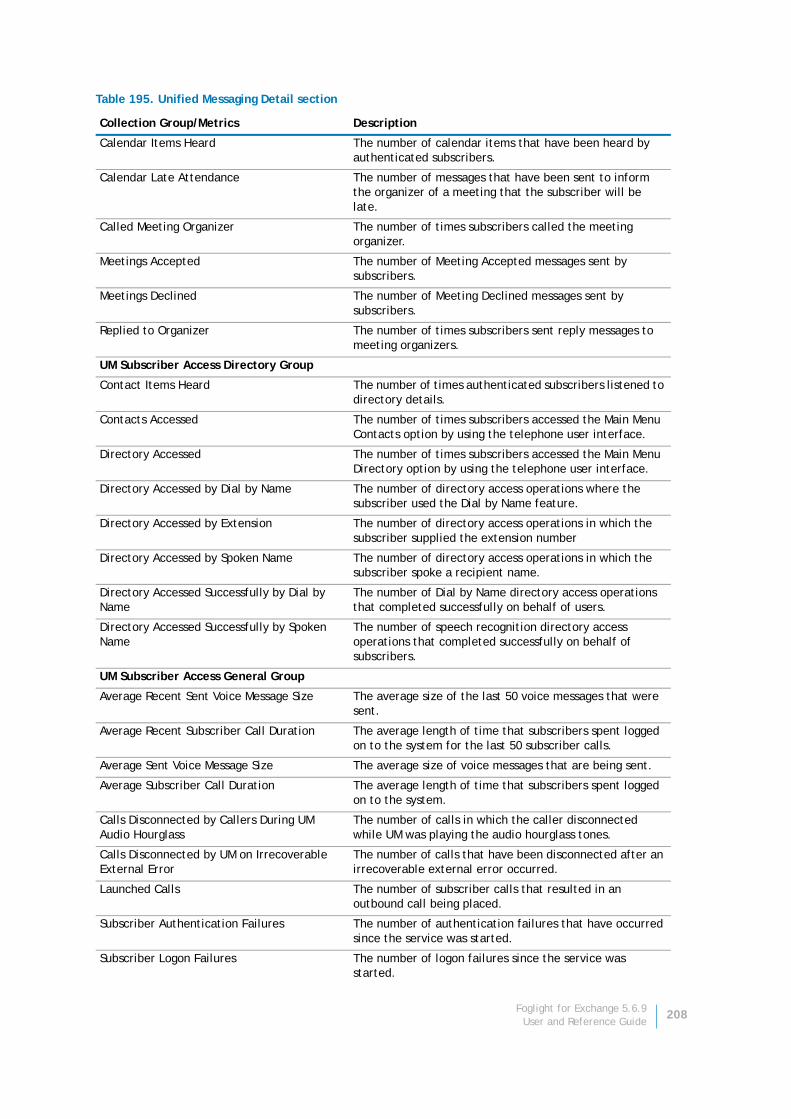
Calendar Items Heard The number of calendar items that have been heard by authenticated subscribers.
Calendar Late Attendance The number of messages that have been sent to inform the organizer of a meeting that the subscriber will be late.
Called Meeting Organizer The number of times subscribers called the meeting organizer.
Meetings Accepted The number of Meeting Accepted messages sent by subscribers.
Meetings Declined The number of Meeting Declined messages sent by subscribers.
Replied to Organizer The number of times subscribers sent reply messages to meeting organizers.
UM Subscriber Access Directory Group
Contact Items Heard The number of times authenticated subscribers listened to directory details.
Contacts Accessed The number of times subscribers accessed the Main Menu Contacts option by using the telephone user interface.
Directory Accessed The number of times subscribers accessed the Main Menu Directory option by using the telephone user interface.
Directory Accessed by Dial by Name The number of directory access operations where the subscriber used the Dial by Name feature.
Directory Accessed by Extension The number of directory access operations in which the subscriber supplied the extension number
Directory Accessed by Spoken Name The number of directory access operations in which the subscriber spoke a recipient name.
Directory Accessed Successfully by Dial by Name
The number of Dial by Name directory access operations that completed successfully on behalf of users.
Directory Accessed Successfully by Spoken Name
The number of speech recognition directory access operations that completed successfully on behalf of subscribers.
UM Subscriber Access General Group
Average Recent Sent Voice Message Size The average size of the last 50 voice messages that were sent.
Average Recent Subscriber Call Duration The average length of time that subscribers spent logged on to the system for the last 50 subscriber calls.
Average Sent Voice Message Size The average size of voice messages that are being sent.
Average Subscriber Call Duration The average length of time that subscribers spent logged on to the system.
Calls Disconnected by Callers During UM Audio Hourglass
The number of calls in which the caller disconnected while UM was playing the audio hourglass tones.
Calls Disconnected by UM on Irrecoverable External Error
The number of calls that have been disconnected after an irrecoverable external error occurred.
Launched Calls The number of subscriber calls that resulted in an outbound call being placed.
Subscriber Authentication Failures The number of authentication failures that have occurred since the service was started.
Subscriber Logon Failures The number of logon failures since the service was started.
Table 195. Unified Messaging Detail section
Collection Group/Metrics Description
Foglight for Exchange 5.6.9User and Reference Guide
208
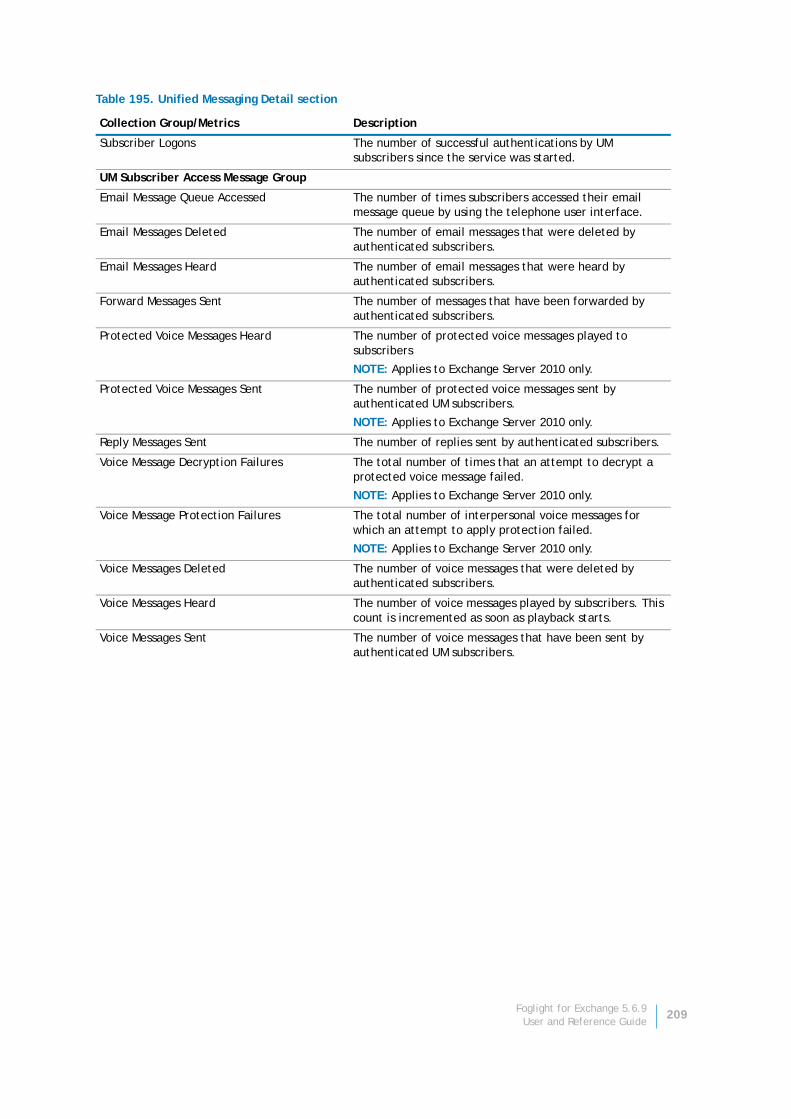
Subscriber Logons The number of successful authentications by UM subscribers since the service was started.
UM Subscriber Access Message Group
Email Message Queue Accessed The number of times subscribers accessed their email message queue by using the telephone user interface.
Email Messages Deleted The number of email messages that were deleted by authenticated subscribers.
Email Messages Heard The number of email messages that were heard by authenticated subscribers.
Forward Messages Sent The number of messages that have been forwarded by authenticated subscribers.
Protected Voice Messages Heard The number of protected voice messages played to subscribers
NOTE: Applies to Exchange Server 2010 only.
Protected Voice Messages Sent The number of protected voice messages sent by authenticated UM subscribers.
NOTE: Applies to Exchange Server 2010 only.
Reply Messages Sent The number of replies sent by authenticated subscribers.
Voice Message Decryption Failures The total number of times that an attempt to decrypt a protected voice message failed.
NOTE: Applies to Exchange Server 2010 only.
Voice Message Protection Failures The total number of interpersonal voice messages for which an attempt to apply protection failed.
NOTE: Applies to Exchange Server 2010 only.
Voice Messages Deleted The number of voice messages that were deleted by authenticated subscribers.
Voice Messages Heard The number of voice messages played by subscribers. This count is incremented as soon as playback starts.
Voice Messages Sent The number of voice messages that have been sent by authenticated UM subscribers.
Table 195. Unified Messaging Detail section
Collection Group/Metrics Description
Foglight for Exchange 5.6.9User and Reference Guide
209
About Dell
Dell listens to customers and delivers worldwide innovative technology, business solutions and services they trust and value. For more information, visit www.software.dell.com.
Contacting DellTechnical support: Online support
Product questions and sales: (800) 306-9329
Email: [email protected]
Technical support resourcesTechnical support is available to customers who have purchased Dell software with a valid maintenance contract and to customers who have trial versions. To access the Support Portal, go to https://support.software.dell.com/.
The Support Portal provides self-help tools you can use to solve problems quickly and independently, 24 hours a day, 365 days a year. In addition, the portal provides direct access to product support engineers through an online Service Request system.
The site enables you to:
• Create, update, and manage Service Requests (cases)
• View Knowledge Base articles
• Obtain product notifications
• Download software. For trial software, go to Trial Downloads.
• View how-to videos
• Engage in community discussions
• Chat with a support engineer
Foglight for Exchange 5.6.9User and Reference Guide
210