Embed Size (px)
Citation preview
Rapport annuel 2011
GARI SA. Banking establishment with a capital of
12,954,500,000 CFA Francs Registered office : Lomé - TOGO
Fonds de Garantie des Investissements Privés en Afrique de l’Ouest (Fonds GARI)
ANNUAL REPORT 2011
Financial year ending in 2011
2
CONTENTS
Pages
1. Mission of GARI: Objectives and terms of intervention. ....................................................... 3
1.1 General objectives ................................................................................................................... 3
1.2. Main terms and conditions for investment. ......................................................................... 4
2. Establishment, Shareholdership and Operations ..................................................................... 5
2.1. Establishment ......................................................................................................................... 5
2.2. Development and distribution of commercial equity ......................................................... 5
2.3. Operation ................................................................................................................................ 7
2.3.1. Board of Directors........................................................................................................... 7
2.3.2. Security Commission ...................................................................................................... 7
2.3.3. Auditor ............................................................................................................................. 8
2.3.4. General Management ..................................................................................................... 8
2.3.5. Internal Organisation ..................................................................................................... 8
3. Activities ....................................................................................................................................... 8
3.1. Security activities … ………………………………………………… …………… … ..8
3.2. Investment activities .. ………………………………………………… ………… ……14
3.3. Other activities …...………………………………………………… ……………… …14
4. Financial situation ...................................................................................................................... 15
4.1. Balance sheet situation as at 31.12.2011 ............................................................................ 15
4.1.1. Asset situation ……...…….. ……………………………………… ………… ………15
4.1.2. Liability situation ..………. ……………………………………… …………… … …16
4.2. Non balance sheet commitments as at 31.12.2011 ............................................................ 17
4.3. Profit and loss account as at 31.12.2011 ............................................................................ 19
4.3.1. Products …. ……………………………………………………… …… ……………19
4.3.2. Costs …….. ……………….………………………………………...… ………………19
5. Regulatory and internal prudential standards ........................................................................ 20
6. Notes on accounts for the financial year ending 31 December 2011 ..................................... 25
Appendices :........................................................................................................................................
3
1. Mission of GARI: objectives and terms of intervention.
1.1 General objectives
The main objective of Fonds GARI is to assist in development of the private sector, through providing financial support to investments in this sector. This support shall take the form of mid- and long-term credit securities pledged to banks and financial institutions, and securities on funding undertaken by private companies involved in the Economic Community of West African States (CEDEAO). Securities cover a fraction of mid- and long-term funding implemented for these companies. The provisions of such external securities, of good quality and in cash, should be considered in light of the difficulties which are confronted by banks during the pledging of « typical » intrinsic securities. These, which may comprise the primary amount of resources used to cover risks concerned, are often depreciated not only by sluggish development of or the inexistence of a secondary market for equipment and a mortgage market for property, but also by administrative, legal, and cultural consequences which the pledge thereof comes up against in matters remaining to be completed. Banking legislation applicable grants to the involvement of any securities, including those by Fonds GARI, a significant coefficient in calculation of the solvency ratio. Use of these instruments includes, therefore, a multiplier effect on the volume of credits which credit establishments can distribute, to equivalent own funds. Amongst the objectives of GARI is that of not contributing towards the increasing cost of credits. Any trend in this regard would run contrary to its primary aim of supporting private investments and those investments which implement it. Therefore, the cost of services is calculated at its lowest amount, included in the risk margin typically applied by banking institutions for funding transactions of this nature, whilst taking due account of competition. The correlation between this provision resided in the considerable efforts made by GARI founders in initial capitalisation and provisions. Out of a concern for effectiveness, it is necessary to offer banks and financial institutions an easy to access tool which is not overly official, and sufficiently open to its area of activities, as well as sectors and types of transactions eligible. GARI has outlined a series of internal measures and management requirements intended to sustainably preserve its ability to invest and to ensure its financial balance. Its actions are undertaken over the long-term, and in this perspective, GARI makes all best efforts to retain and consolidate its resources, which are a basis for its financial capability of contracting new commitments as well as its ability, at the appropriate time, to honour its signature. This concern has led it to adopt a series of measures to cap amounts provided intended to preserve its ability to invest and to protect its financial balance, whether this concerns the total amount of its outstanding amounts being less than or equal to five (5) times the total amount of net resources, or the caps applied to individual risks (by bank, country or signature) as defined in a prudent manner. In addition to these objectives of solvency and requirements, it is also important to combine the principles concerning selecting risks and the flexibility of management resources.
4
1.2. Main terms and conditions for investment.
The first rule for investment by the Fonds is not to favour the transfer of any preponderant portion of the risk, so as to reduce the responsibility of the banking partner, but to offer a balanced division. This division is characterised by a maximum limited security quota of 60% of total support, by the distribution, in the event of any incident, of the product of any securities and by the delegation given to banks for advance examination of files.
GARI does not interfere in relations between the bank and its client. Its involvement is not aimed at reducing the contribution of securities by the issuer, and consequently, its involvement in the project. It is aimed at being involved for the issue of all typical securities which do not allow the bank to subscribe a risk which it deems to be healthy, under sufficient safety conditions.
It results from these considerations that GARI examines and analyses risks which are submitted thereunto from its own information, examination reports and critical opinions of the lender.
Of course, due professional diligence made in examining the funding, in addition to its implementation, monitoring or recovery, shall be the object of an express commitment by the beneficiary of the security, with this commitment being an integral part of the notice of security and its acceptance. Notice to GARI shall replace the security agreement and will be flexible in terms of its management, without however leading to this document losing any of its power since it refers to rules of funding by the institution, which are an integral part thereof. Similarly, the Fonds retains its entitlement to undertake ad hoc audits, at any time, and notably during the issue of the security. Upon expiry of the secured funding term, an advance payment on compensation equal to 85% of the residual secured capital is paid to the beneficiary establishment. In the case of transactions raising funds, compensation is immediate and covers the entire outstanding amount in capital and interests. Eligible transactions are relatively wide ranging: company establishment, modernisation, improvement of productivity, extension of production capacities, transfer of ownership, reorganisation, privatisation, etc. These transactions should be initiated by companies in the private sector or public sector operating in the following economic sectors: agriculture, manufacturing industry, agro-industry, fishing, mining, forestry, tourism, building and public works, transportation, hotel management, commercial and professional real-estate, production services. GARI, in its role as a funding contributor and facilitator, provides support in all sectors which are permitted by law and respects money laundering and terrorism prevention legislation. Secured funding should be for a term between 2 and 15 years, with the Fonds limiting cover to 10 years. The minimum amount of secured credits should be, aside for any exception, equal to the counter value of 50 million CFA Francs. Finally, the cost of securities is today constituted by a plat commission received up front, and a security commission calculated on secured amounts outstanding and called upon quarterly. As at 31 December 2011, the conditions for involvement of Fonds for bank loans corresponded to the application of a commission rate equal to 1.5% of the total amount of security issues, and a security commission of between 1.5% to 2.5% per annum. When concerning securities for fund raising transactions, the conditions consist of the application of a flat rate commission of 0.5% to 1% on the total secured amount and a variable security commission rate of at least 1% on secured outstanding amounts.
5
2. Establishment, Shareholdership and Operations
2.1. Establishment
Fonds GARI was established on 21 December 1994, in the form of a Limited Company incorporated in the Togo and entered on the Lomé Trade and Companies Register on 19 January 1995. It was registered as a financial establishment on 3 July 1995, subject to provisions of the Banking Code in force in the UEMOA. The Fonds began to actually trade in September 1995. It completed its sixteenth financial year on 31 December 2011. By virtue of a Domiciliation Agreement with the Togolese Republic, Fonds GARI has the status of an International Association.
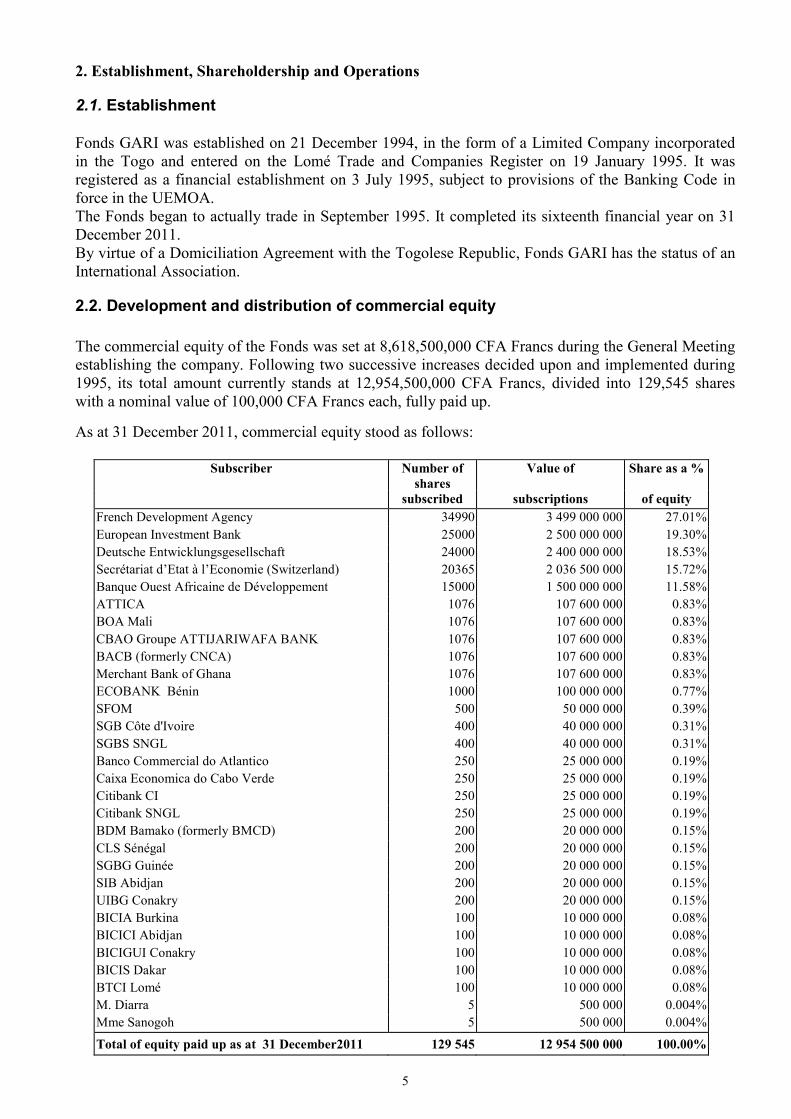
2.2. Development and distribution of commercial equity
The commercial equity of the Fonds was set at 8,618,500,000 CFA Francs during the General Meeting establishing the company. Following two successive increases decided upon and implemented during 1995, its total amount currently stands at 12,954,500,000 CFA Francs, divided into 129,545 shares with a nominal value of 100,000 CFA Francs each, fully paid up.
As at 31 December 2011, commercial equity stood as follows:
Subscriber Number of shares
Value of Share as a %
subscribed subscriptions of equity
French Development Agency 34990 3 499 000 000 27.01%
European Investment Bank 25000 2 500 000 000 19.30%
Deutsche Entwicklungsgesellschaft 24000 2 400 000 000 18.53%
Secrétariat d’Etat à l’Economie (Switzerland) 20365 2 036 500 000 15.72%
Banque Ouest Africaine de Développement 15000 1 500 000 000 11.58%
ATTICA 1076 107 600 000 0.83%
BOA Mali 1076 107 600 000 0.83%
CBAO Groupe ATTIJARIWAFA BANK 1076 107 600 000 0.83%
BACB (formerly CNCA) 1076 107 600 000 0.83%
Merchant Bank of Ghana 1076 107 600 000 0.83%
ECOBANK Bénin 1000 100 000 000 0.77%
SFOM 500 50 000 000 0.39%
SGB Côte d'Ivoire 400 40 000 000 0.31%
SGBS SNGL 400 40 000 000 0.31%
Banco Commercial do Atlantico 250 25 000 000 0.19%
Caixa Economica do Cabo Verde 250 25 000 000 0.19%
Citibank CI 250 25 000 000 0.19%
Citibank SNGL 250 25 000 000 0.19%
BDM Bamako (formerly BMCD) 200 20 000 000 0.15%
CLS Sénégal 200 20 000 000 0.15%
SGBG Guinée 200 20 000 000 0.15%
SIB Abidjan 200 20 000 000 0.15%
UIBG Conakry 200 20 000 000 0.15%
BICIA Burkina 100 10 000 000 0.08%
BICICI Abidjan 100 10 000 000 0.08%
BICIGUI Conakry 100 10 000 000 0.08%
BICIS Dakar 100 10 000 000 0.08%
BTCI Lomé 100 10 000 000 0.08%
M. Diarra 5 500 000 0.004%
Mme Sanogoh 5 500 000 0.004%
Total of equity paid up as at 31 December2011 129 545 12 954 500 000 100.00%
6
Funds resulting from the commercial equity were consolidated in December 1996 with a contribution from the European Development Fund of a total of 3.8 million ECU, equating to a total of 2,470,570,000 CFA Francs. In this regard, GARI had, pursuant to the objectives outlined at the time of its establishment, a budget for initial funds of over 15 billion CFA Francs.
7
2.3. Operation
2.3.1. Board of Directors.
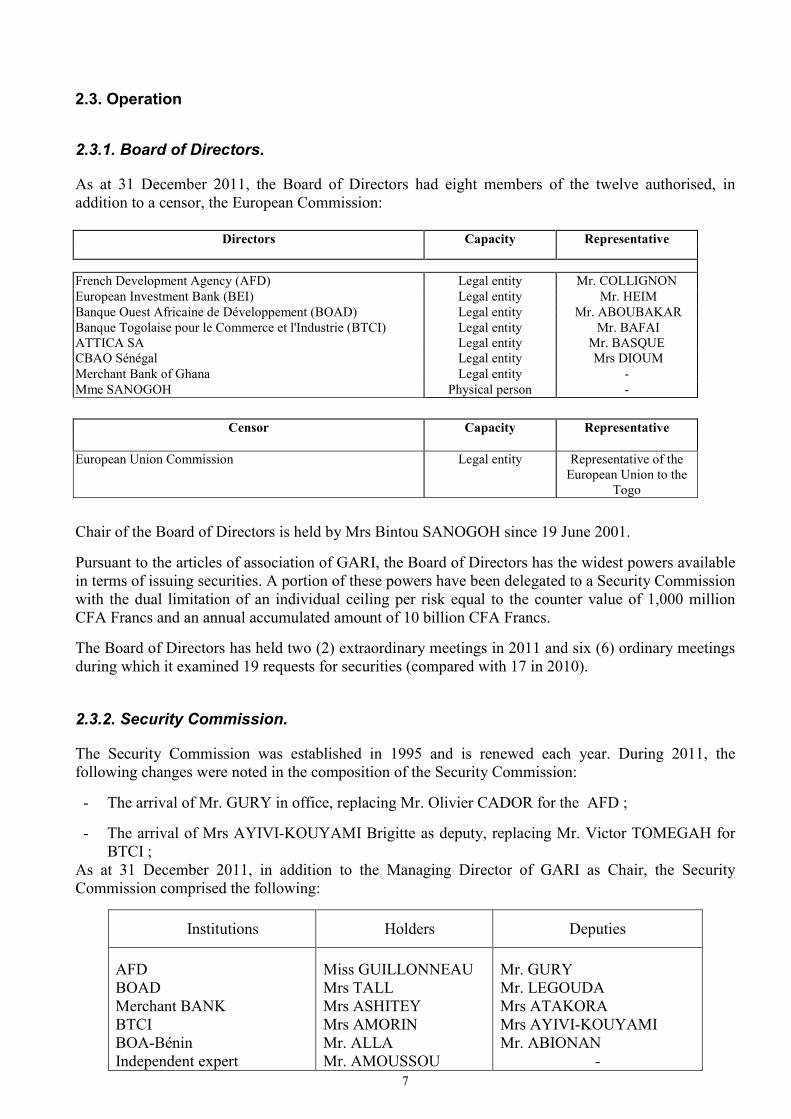
As at 31 December 2011, the Board of Directors had eight members of the twelve authorised, in addition to a censor, the European Commission:
Directors Capacity Representative
French Development Agency (AFD) Legal entity Mr. COLLIGNON European Investment Bank (BEI) Legal entity Mr. HEIM Banque Ouest Africaine de Développement (BOAD) Legal entity Mr. ABOUBAKAR Banque Togolaise pour le Commerce et l'Industrie (BTCI) ATTICA SA
Legal entity Legal entity
Mr. BAFAI Mr. BASQUE
CBAO Sénégal Legal entity Mrs DIOUM Merchant Bank of Ghana Legal entity - Mme SANOGOH Physical person -
Censor Capacity Representative
European Union Commission Legal entity Representative of the European Union to the
Togo
Chair of the Board of Directors is held by Mrs Bintou SANOGOH since 19 June 2001.
Pursuant to the articles of association of GARI, the Board of Directors has the widest powers available in terms of issuing securities. A portion of these powers have been delegated to a Security Commission with the dual limitation of an individual ceiling per risk equal to the counter value of 1,000 million CFA Francs and an annual accumulated amount of 10 billion CFA Francs.
The Board of Directors has held two (2) extraordinary meetings in 2011 and six (6) ordinary meetings during which it examined 19 requests for securities (compared with 17 in 2010).
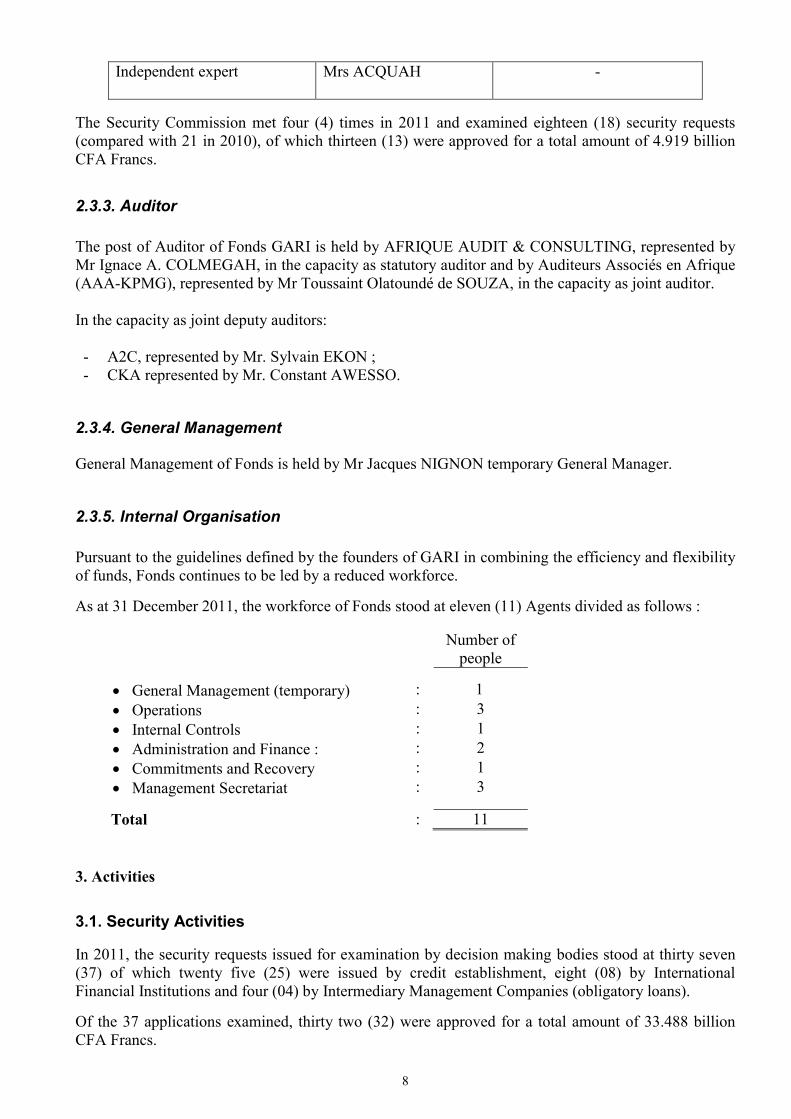
2.3.2. Security Commission.
The Security Commission was established in 1995 and is renewed each year. During 2011, the following changes were noted in the composition of the Security Commission:
- The arrival of Mr. GURY in office, replacing Mr. Olivier CADOR for the AFD ;
- The arrival of Mrs AYIVI-KOUYAMI Brigitte as deputy, replacing Mr. Victor TOMEGAH for BTCI ;
As at 31 December 2011, in addition to the Managing Director of GARI as Chair, the Security Commission comprised the following:
Institutions Holders Deputies
AFD BOAD Merchant BANK BTCI BOA-Bénin Independent expert
Miss GUILLONNEAU Mrs TALL Mrs ASHITEY Mrs AMORIN Mr. ALLA Mr. AMOUSSOU
Mr. GURY Mr. LEGOUDA Mrs ATAKORA Mrs AYIVI-KOUYAMI Mr. ABIONAN
-
8
Independent expert
Mrs ACQUAH -
The Security Commission met four (4) times in 2011 and examined eighteen (18) security requests (compared with 21 in 2010), of which thirteen (13) were approved for a total amount of 4.919 billion CFA Francs.
2.3.3. Auditor
The post of Auditor of Fonds GARI is held by AFRIQUE AUDIT & CONSULTING, represented by Mr Ignace A. COLMEGAH, in the capacity as statutory auditor and by Auditeurs Associés en Afrique (AAA-KPMG), represented by Mr Toussaint Olatoundé de SOUZA, in the capacity as joint auditor. In the capacity as joint deputy auditors: - A2C, represented by Mr. Sylvain EKON ; - CKA represented by Mr. Constant AWESSO.
2.3.4. General Management
General Management of Fonds is held by Mr Jacques NIGNON temporary General Manager.
2.3.5. Internal Organisation
Pursuant to the guidelines defined by the founders of GARI in combining the efficiency and flexibility of funds, Fonds continues to be led by a reduced workforce.
As at 31 December 2011, the workforce of Fonds stood at eleven (11) Agents divided as follows :
Number of people
General Management (temporary) : 1
Operations : 3
Internal Controls : 1
Administration and Finance : : 2
Commitments and Recovery : 1
Management Secretariat : 3
Total : 11
3. Activities
3.1. Security Activities
In 2011, the security requests issued for examination by decision making bodies stood at thirty seven (37) of which twenty five (25) were issued by credit establishment, eight (08) by International Financial Institutions and four (04) by Intermediary Management Companies (obligatory loans).
Of the 37 applications examined, thirty two (32) were approved for a total amount of 33.488 billion CFA Francs.
9
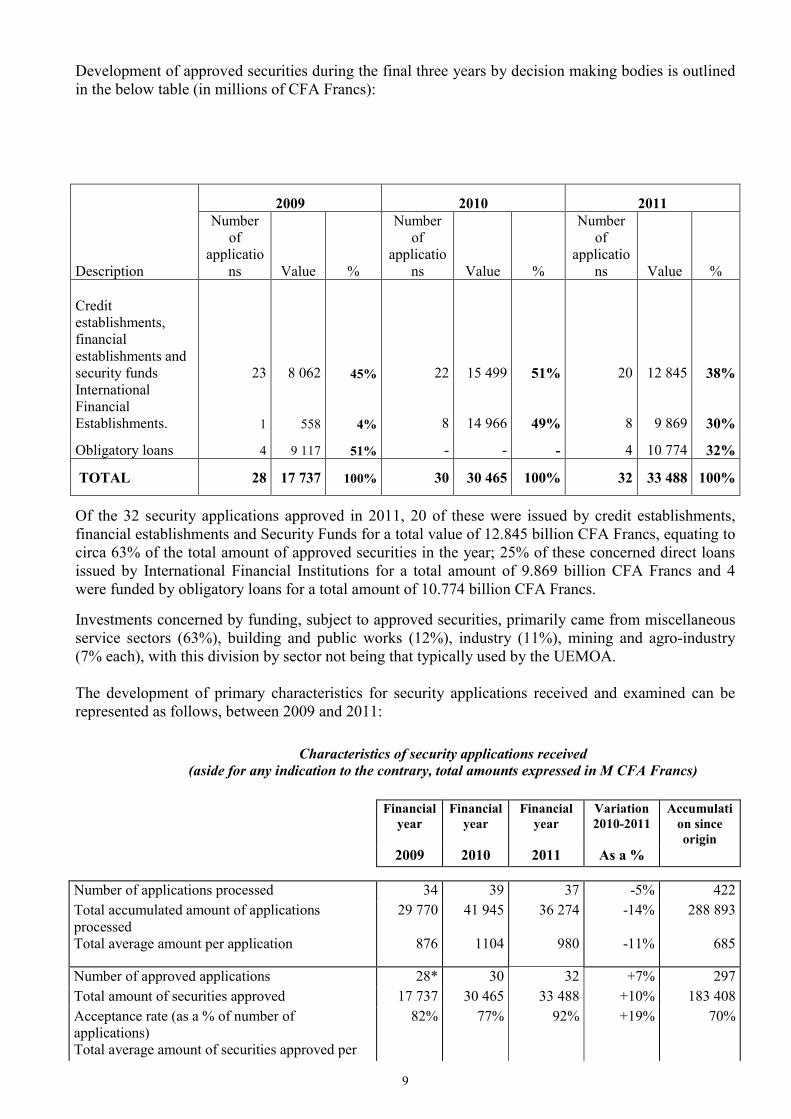
Development of approved securities during the final three years by decision making bodies is outlined in the below table (in millions of CFA Francs):
2009 2010 2011
Description
Number of
applications Value %
Number of
applications Value %
Number of
applications Value %
Credit establishments, financial establishments and security funds 23 8 062 45% 22 15 499 51% 20 12 845 38% International Financial Establishments. 1 558 4% 8 14 966 49% 8 9 869 30%
Obligatory loans 4 9 117 51% - - - 4 10 774 32%
TOTAL 28 17 737 100% 30 30 465 100% 32 33 488 100%
Of the 32 security applications approved in 2011, 20 of these were issued by credit establishments, financial establishments and Security Funds for a total value of 12.845 billion CFA Francs, equating to circa 63% of the total amount of approved securities in the year; 25% of these concerned direct loans issued by International Financial Institutions for a total amount of 9.869 billion CFA Francs and 4 were funded by obligatory loans for a total amount of 10.774 billion CFA Francs.
Investments concerned by funding, subject to approved securities, primarily came from miscellaneous service sectors (63%), building and public works (12%), industry (11%), mining and agro-industry (7% each), with this division by sector not being that typically used by the UEMOA. The development of primary characteristics for security applications received and examined can be represented as follows, between 2009 and 2011:
Characteristics of security applications received (aside for any indication to the contrary, total amounts expressed in M CFA Francs)
Financial year
Financial year
Financial year
Variation 2010-2011
Accumulation since origin
2009 2010 2011 As a %
Number of applications processed 34 39 37 -5% 422
Total accumulated amount of applications processed
29 770 41 945 36 274 -14% 288 893
Total average amount per application 876 1104 980 -11% 685
Number of approved applications 28* 30 32 +7% 297
Total amount of securities approved 17 737 30 465 33 488 +10% 183 408
Acceptance rate (as a % of number of applications)
82% 77% 92% +19% 70%
Total average amount of securities approved per
10
application
633 1 015 1 046 +3% 618
Total amount of funding corresponding to
securities issued 43 530 58 487 83 551 +43% 495 918
Average quota secured as a % 41% 52% 40% -23% +37%
Total amount of investments
concerned 84 264 224 733 192 136 -15%% 1 533 170
Average term of securities (months) 57 63 69 +8% 69
Average deferred term of secured credits (months) 18 11 11 - 10
Securities issued
Number of applications 14 17 21 + 23 % -
Total 10 049 12 172 21 030 + 73 % -
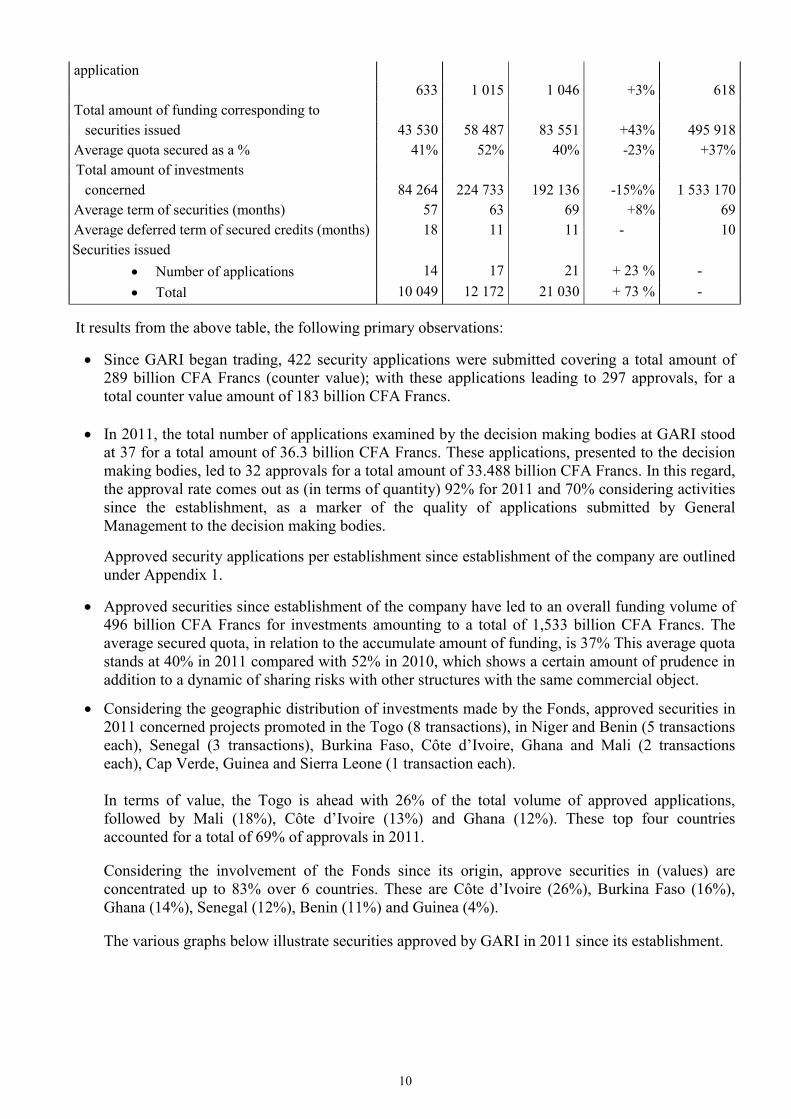
It results from the above table, the following primary observations:
Since GARI began trading, 422 security applications were submitted covering a total amount of 289 billion CFA Francs (counter value); with these applications leading to 297 approvals, for a total counter value amount of 183 billion CFA Francs.
In 2011, the total number of applications examined by the decision making bodies at GARI stood at 37 for a total amount of 36.3 billion CFA Francs. These applications, presented to the decision making bodies, led to 32 approvals for a total amount of 33.488 billion CFA Francs. In this regard, the approval rate comes out as (in terms of quantity) 92% for 2011 and 70% considering activities since the establishment, as a marker of the quality of applications submitted by General Management to the decision making bodies.
Approved security applications per establishment since establishment of the company are outlined under Appendix 1.
Approved securities since establishment of the company have led to an overall funding volume of 496 billion CFA Francs for investments amounting to a total of 1,533 billion CFA Francs. The average secured quota, in relation to the accumulate amount of funding, is 37% This average quota stands at 40% in 2011 compared with 52% in 2010, which shows a certain amount of prudence in addition to a dynamic of sharing risks with other structures with the same commercial object.
Considering the geographic distribution of investments made by the Fonds, approved securities in 2011 concerned projects promoted in the Togo (8 transactions), in Niger and Benin (5 transactions each), Senegal (3 transactions), Burkina Faso, Côte d’Ivoire, Ghana and Mali (2 transactions each), Cap Verde, Guinea and Sierra Leone (1 transaction each).
In terms of value, the Togo is ahead with 26% of the total volume of approved applications, followed by Mali (18%), Côte d’Ivoire (13%) and Ghana (12%). These top four countries accounted for a total of 69% of approvals in 2011.
Considering the involvement of the Fonds since its origin, approve securities in (values) are concentrated up to 83% over 6 countries. These are Côte d’Ivoire (26%), Burkina Faso (16%), Ghana (14%), Senegal (12%), Benin (11%) and Guinea (4%).
The various graphs below illustrate securities approved by GARI in 2011 since its establishment.

11
DISTRIBUTION OF SECURITY APPROVALS PER COUNTRY IN 2011 (Value)
DISTRIBUTION OF SECURITY APPROVALS PER COUNTRY SINCE ESTABLISHMENT (Value)
Approved securities per country in 2011 in addition to the overview since establishment are presented under Appendix 2.
1During this year, 21 applications coming from 2010 and 2011 approvals were implemented for a value of 25 billion CFA Francs (19 billion in 2010).
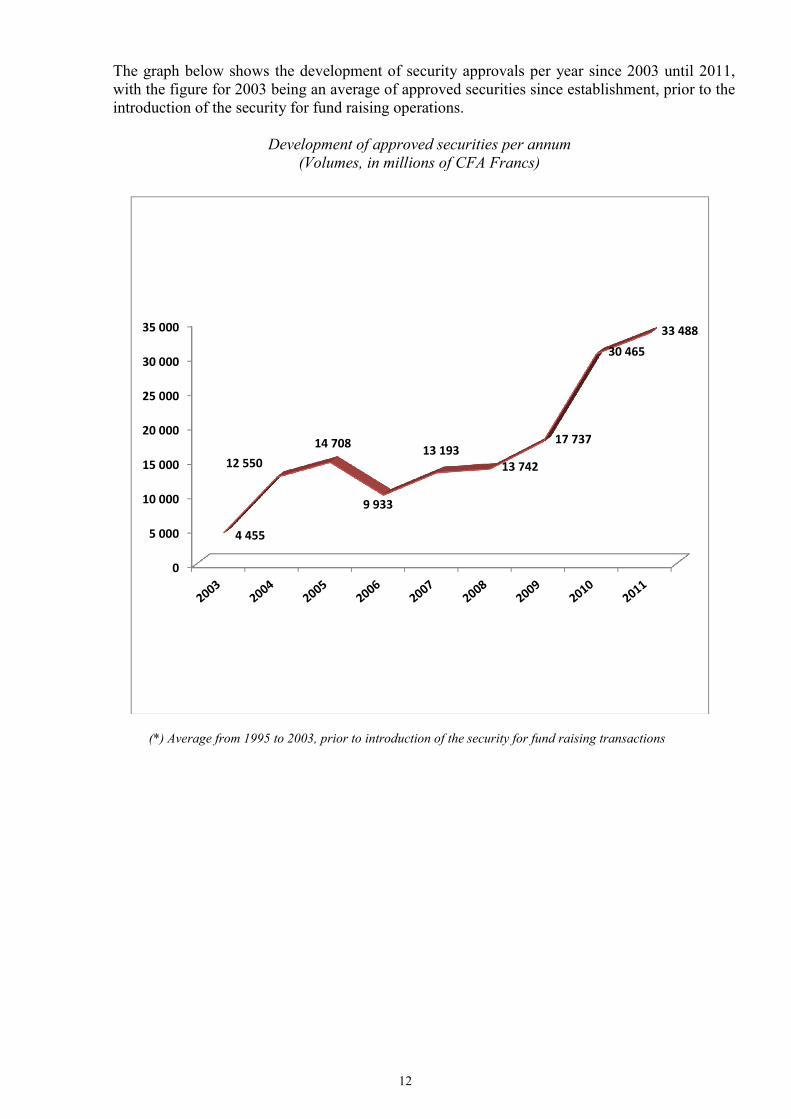
The volume of approved securities in 2011 stands at 33.488 billion CFA Francs compared with 30.4 billion in 2010, equating to a progression of 7%.
1 The Board of Directors opted to designate under the title of "issued securities" those securities actually implemented.
BENIN6%
BURKINA2%
CAP VERT1%
COTE D'IVOIRE
13%GAMBIE
0%
GHANA12%
GUINEE5%
MALI19%
NIGER6%
NIGERIA0%
SENEGAL9%
SIERRA LEONE1%
TOGO26%
BENIN8% BURKINA
9%
CAP VERT1%
COTE D'IVOIRE
28%GAMBIE
0%GHANA
14%
GUINEE3%
MALI9%
NIGER5%
NIGERIA2%
SENEGAL11%
SIERRA LEONE
0%
TOGO10%
12
The graph below shows the development of security approvals per year since 2003 until 2011, with the figure for 2003 being an average of approved securities since establishment, prior to the introduction of the security for fund raising operations.
Development of approved securities per annum
(Volumes, in millions of CFA Francs)
(*) Average from 1995 to 2003, prior to introduction of the security for fund raising transactions
0
5 000
10 000
15 000
20 000
25 000
30 000
35 000
4 455
12 550
14 708
9 933
13 19313 742
17 737
30 465
33 488

13
Approved securities in 2011 (33.488 billion CFA Francs) covers the total amount approved since establishment at 183.408 billion CFA Francs for 297 applications. These figures are distributed as follows, per category of beneficiaries:
Number of applications
Total (in millions of CFA Francs)
Fonds GARI has the strategy of avoiding an overconcentration of its portfolio in order to limit the effect which its overall activities may have on the socio political and economic situation in a given country. It is in this regard that by virtue of internal management prudential standards, the accumulated commitments of GARI in a given country cannot exceed a rate of 10 to 20% 15% of its intervention capability, depending on the country.
As at 31 December 2011, distribution of outstanding amounts per country of portfolio commitments of GARI is presented as follows: Côte d’Ivoire (32%), Ghana and Mali (11% each), Senegal (9%), Burkina Faso and Benin (8% each), Niger (7%).
OUTSTANDING AMOUNT OF ACTUAL COMMITMENTS PER COUNTRY AS AT 31/12/2011
020406080
100120140160180200 182
50
21 14
0
10 000
20 000
30 000
40 000
50 000
60 000
70 000
80 000 73 005
38 090 38 257
4 784
BENIN8%
BURKINA8%
CAP VERT1%
COTE D'IVOIRE
32%GAMBIE1%
GHANA11%
GUINEE4%
MALI11%
NIGER7%
NIGERIA5%
SENEGAL9%
TOGO3%
14
3.2. Investment activities
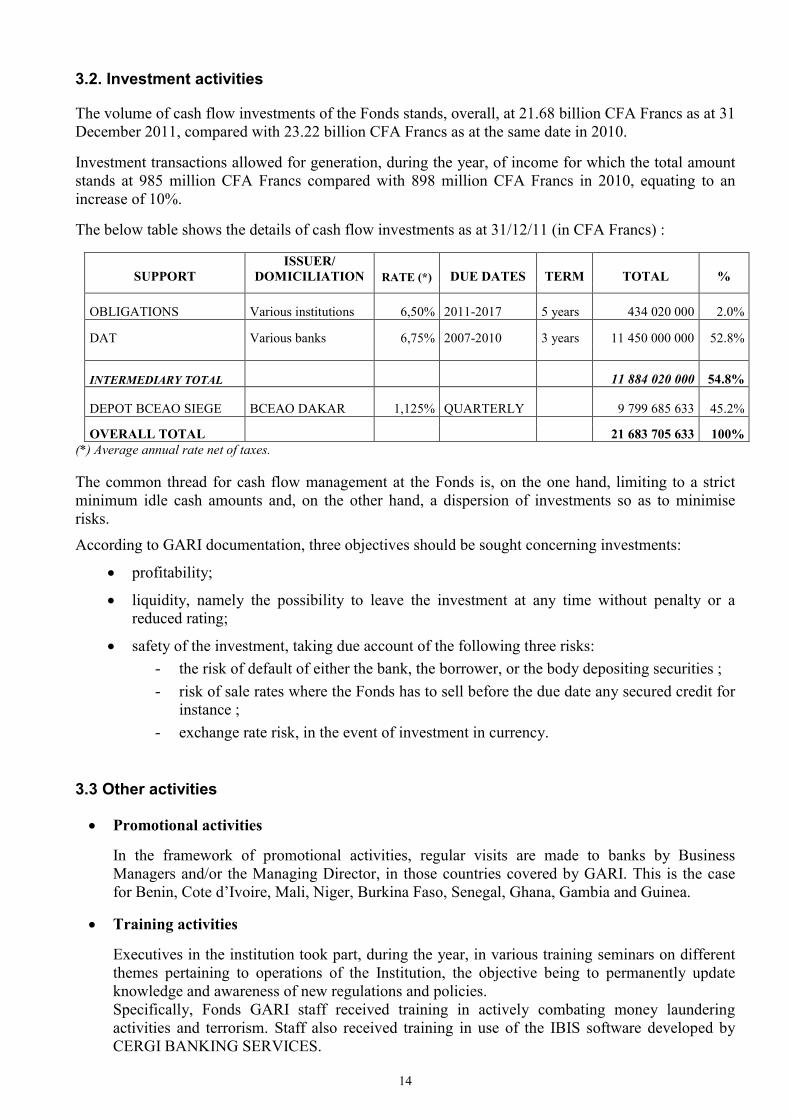
The volume of cash flow investments of the Fonds stands, overall, at 21.68 billion CFA Francs as at 31 December 2011, compared with 23.22 billion CFA Francs as at the same date in 2010.
Investment transactions allowed for generation, during the year, of income for which the total amount stands at 985 million CFA Francs compared with 898 million CFA Francs in 2010, equating to an increase of 10%.
The below table shows the details of cash flow investments as at 31/12/11 (in CFA Francs) :
SUPPORT ISSUER/
DOMICILIATION RATE (*) DUE DATES TERM TOTAL %
OBLIGATIONS Various institutions 6,50% 2011-2017 5 years 434 020 000 2.0%
DAT Various banks 6,75% 2007-2010 3 years 11 450 000 000 52.8%
INTERMEDIARY TOTAL 11 884 020 000 54.8%
DEPOT BCEAO SIEGE BCEAO DAKAR 1,125% QUARTERLY 9 799 685 633 45.2%
OVERALL TOTAL 21 683 705 633 100% (*) Average annual rate net of taxes.
The common thread for cash flow management at the Fonds is, on the one hand, limiting to a strict minimum idle cash amounts and, on the other hand, a dispersion of investments so as to minimise risks.
According to GARI documentation, three objectives should be sought concerning investments:
profitability;
liquidity, namely the possibility to leave the investment at any time without penalty or a reduced rating;
safety of the investment, taking due account of the following three risks:
- the risk of default of either the bank, the borrower, or the body depositing securities ;
- risk of sale rates where the Fonds has to sell before the due date any secured credit for instance ;
- exchange rate risk, in the event of investment in currency.
3.3 Other activities
Promotional activities
In the framework of promotional activities, regular visits are made to banks by Business Managers and/or the Managing Director, in those countries covered by GARI. This is the case for Benin, Cote d’Ivoire, Mali, Niger, Burkina Faso, Senegal, Ghana, Gambia and Guinea.
Training activities
Executives in the institution took part, during the year, in various training seminars on different themes pertaining to operations of the Institution, the objective being to permanently update knowledge and awareness of new regulations and policies. Specifically, Fonds GARI staff received training in actively combating money laundering activities and terrorism. Staff also received training in use of the IBIS software developed by CERGI BANKING SERVICES.
15
4. Financial situation
The balance sheet and profit and loss account, in addition to non balance sheet commitments as at 31 December 2011 are indicated under Appendix 3.
4.1 Balance sheet situation as at 31 December 2011
The balance sheet total as at 31 December 2011 stood at 27.101 billion CFA Francs, up by 1,076 million, a total of 4%, compared to the previous financial year which stood at 26.028 billion CFA Francs.
4.1.1 Asset situation.
The asset situation includes cash flow accounts, accounts for various miscellaneous transactions, and fixed assets.
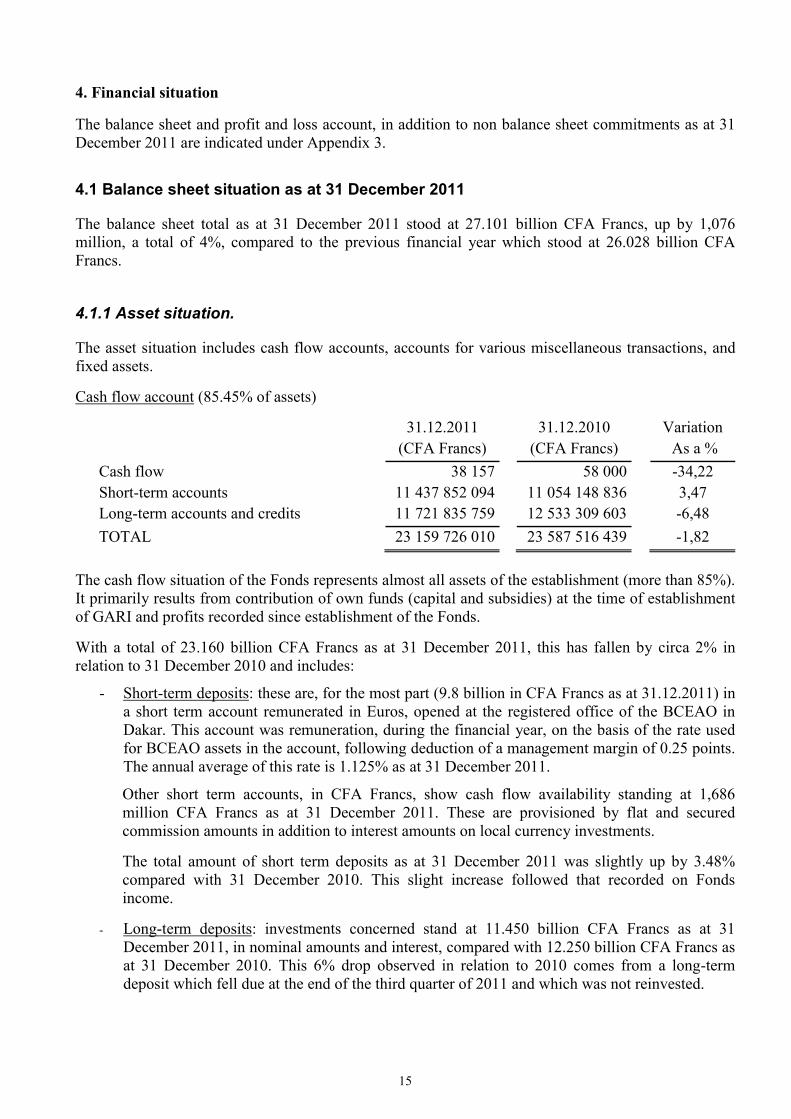
Cash flow account (85.45% of assets)
31.12.2011 31.12.2010 Variation
(CFA Francs) (CFA Francs) As a %
Cash flow 38 157 58 000 -34,22
Short-term accounts 11 437 852 094 11 054 148 836 3,47
Long-term accounts and credits 11 721 835 759 12 533 309 603 -6,48
TOTAL 23 159 726 010 23 587 516 439 -1,82
The cash flow situation of the Fonds represents almost all assets of the establishment (more than 85%). It primarily results from contribution of own funds (capital and subsidies) at the time of establishment of GARI and profits recorded since establishment of the Fonds.
With a total of 23.160 billion CFA Francs as at 31 December 2011, this has fallen by circa 2% in relation to 31 December 2010 and includes:
- Short-term deposits: these are, for the most part (9.8 billion in CFA Francs as at 31.12.2011) in a short term account remunerated in Euros, opened at the registered office of the BCEAO in Dakar. This account was remuneration, during the financial year, on the basis of the rate used for BCEAO assets in the account, following deduction of a management margin of 0.25 points. The annual average of this rate is 1.125% as at 31 December 2011.
Other short term accounts, in CFA Francs, show cash flow availability standing at 1,686 million CFA Francs as at 31 December 2011. These are provisioned by flat and secured commission amounts in addition to interest amounts on local currency investments.
The total amount of short term deposits as at 31 December 2011 was slightly up by 3.48% compared with 31 December 2010. This slight increase followed that recorded on Fonds income.
- Long-term deposits: investments concerned stand at 11.450 billion CFA Francs as at 31 December 2011, in nominal amounts and interest, compared with 12.250 billion CFA Francs as at 31 December 2010. This 6% drop observed in relation to 2010 comes from a long-term deposit which fell due at the end of the third quarter of 2011 and which was not reinvested.
16
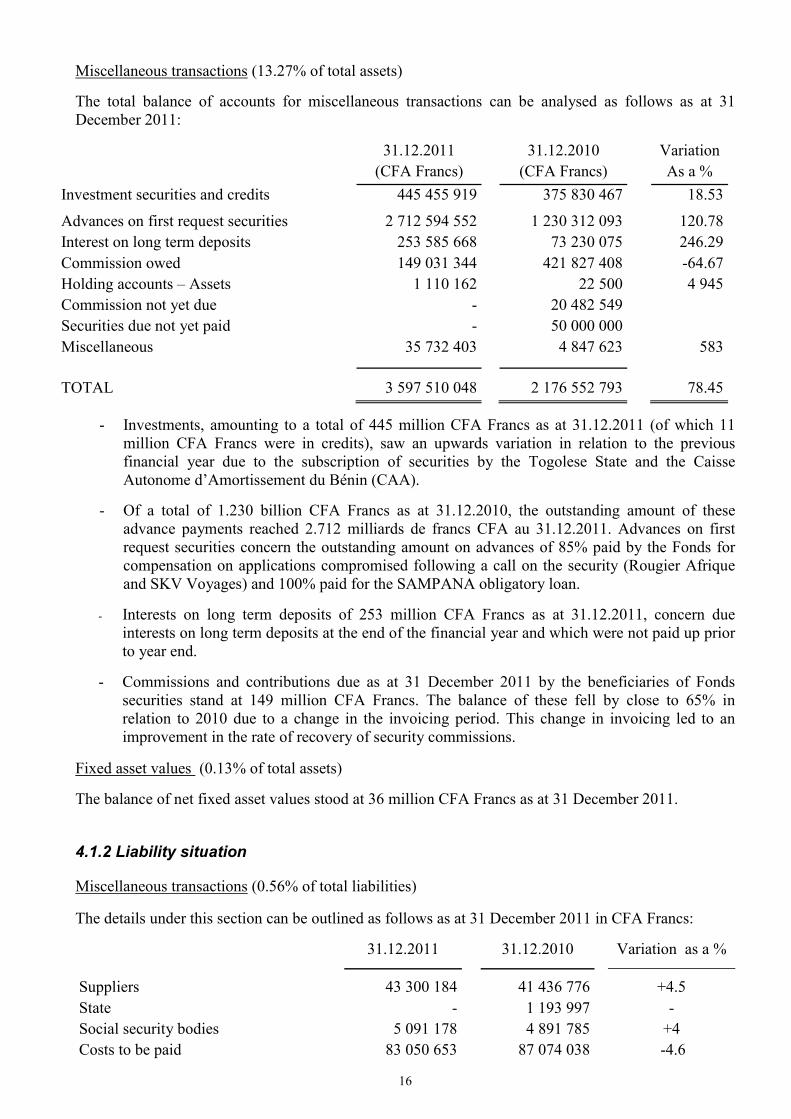
Miscellaneous transactions (13.27% of total assets)
The total balance of accounts for miscellaneous transactions can be analysed as follows as at 31 December 2011:
31.12.2011 31.12.2010 Variation
(CFA Francs) (CFA Francs) As a %
Investment securities and credits 445 455 919 375 830 467 18.53
Advances on first request securities 2 712 594 552 1 230 312 093 120.78
Interest on long term deposits 253 585 668 73 230 075 246.29
Commission owed 149 031 344 421 827 408 -64.67
Holding accounts – Assets 1 110 162 22 500 4 945
Commission not yet due - 20 482 549
Securities due not yet paid - 50 000 000
Miscellaneous 35 732 403 4 847 623 583
TOTAL 3 597 510 048 2 176 552 793 78.45
- Investments, amounting to a total of 445 million CFA Francs as at 31.12.2011 (of which 11 million CFA Francs were in credits), saw an upwards variation in relation to the previous financial year due to the subscription of securities by the Togolese State and the Caisse Autonome d’Amortissement du Bénin (CAA).
- Of a total of 1.230 billion CFA Francs as at 31.12.2010, the outstanding amount of these advance payments reached 2.712 milliards de francs CFA au 31.12.2011. Advances on first request securities concern the outstanding amount on advances of 85% paid by the Fonds for compensation on applications compromised following a call on the security (Rougier Afrique and SKV Voyages) and 100% paid for the SAMPANA obligatory loan.
- Interests on long term deposits of 253 million CFA Francs as at 31.12.2011, concern due interests on long term deposits at the end of the financial year and which were not paid up prior to year end.
- Commissions and contributions due as at 31 December 2011 by the beneficiaries of Fonds securities stand at 149 million CFA Francs. The balance of these fell by close to 65% in relation to 2010 due to a change in the invoicing period. This change in invoicing led to an improvement in the rate of recovery of security commissions.
Fixed asset values (0.13% of total assets)
The balance of net fixed asset values stood at 36 million CFA Francs as at 31 December 2011.
4.1.2 Liability situation
Miscellaneous transactions (0.56% of total liabilities)
The details under this section can be outlined as follows as at 31 December 2011 in CFA Francs:
31.12.2011 31.12.2010 Variation as a %
Suppliers 43 300 184 41 436 776 +4.5
State - 1 193 997 -
Social security bodies 5 091 178 4 891 785 +4
Costs to be paid 83 050 653 87 074 038 -4.6
17
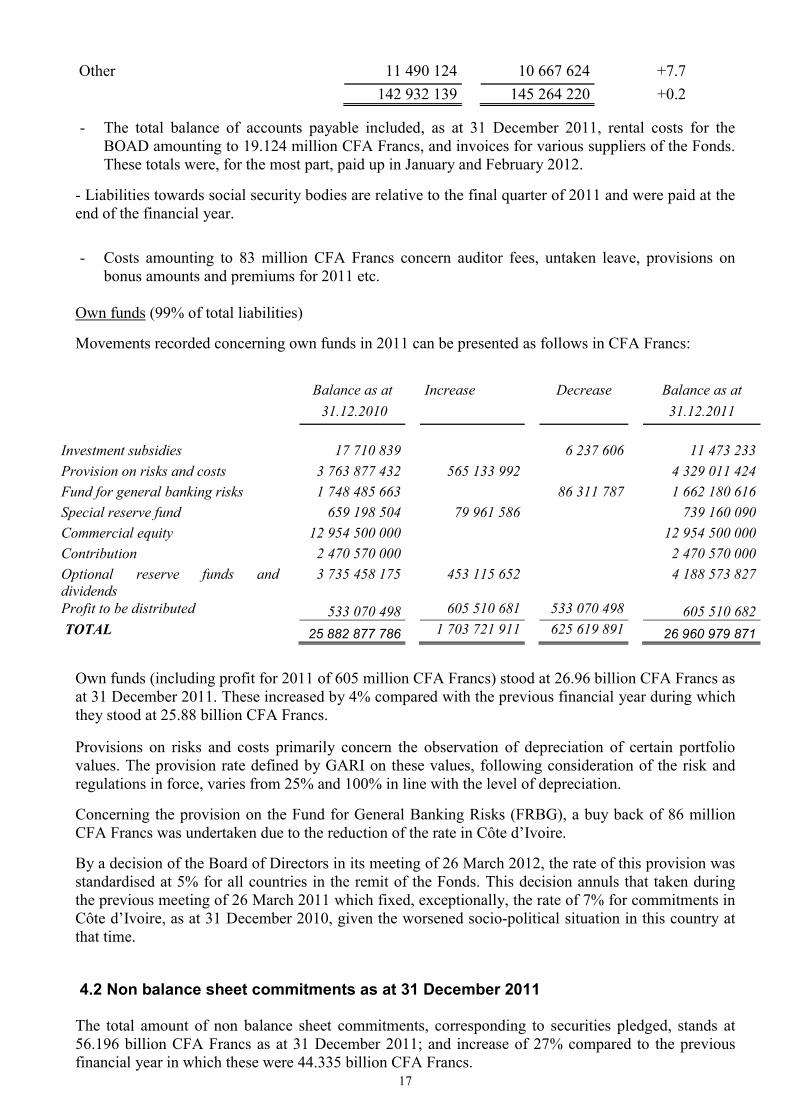
Other 11 490 124 10 667 624 +7.7
142 932 139 145 264 220 +0.2
- The total balance of accounts payable included, as at 31 December 2011, rental costs for the BOAD amounting to 19.124 million CFA Francs, and invoices for various suppliers of the Fonds. These totals were, for the most part, paid up in January and February 2012.
- Liabilities towards social security bodies are relative to the final quarter of 2011 and were paid at the end of the financial year.
- Costs amounting to 83 million CFA Francs concern auditor fees, untaken leave, provisions on bonus amounts and premiums for 2011 etc.
Own funds (99% of total liabilities)
Movements recorded concerning own funds in 2011 can be presented as follows in CFA Francs:
Balance as at Increase Decrease Balance as at
31.12.2010 31.12.2011
Investment subsidies 17 710 839 6 237 606 11 473 233
Provision on risks and costs 3 763 877 432 565 133 992 4 329 011 424
Fund for general banking risks 1 748 485 663 86 311 787 1 662 180 616
Special reserve fund 659 198 504 79 961 586 739 160 090
Commercial equity 12 954 500 000 12 954 500 000
Contribution 2 470 570 000 2 470 570 000
Optional reserve funds and dividends
3 735 458 175 453 115 652 4 188 573 827
Profit to be distributed 533 070 498 605 510 681 533 070 498 605 510 682 TOTAL 25 882 877 786 1 703 721 911 625 619 891 26 960 979 871
Own funds (including profit for 2011 of 605 million CFA Francs) stood at 26.96 billion CFA Francs as at 31 December 2011. These increased by 4% compared with the previous financial year during which they stood at 25.88 billion CFA Francs.
Provisions on risks and costs primarily concern the observation of depreciation of certain portfolio values. The provision rate defined by GARI on these values, following consideration of the risk and regulations in force, varies from 25% and 100% in line with the level of depreciation.
Concerning the provision on the Fund for General Banking Risks (FRBG), a buy back of 86 million CFA Francs was undertaken due to the reduction of the rate in Côte d’Ivoire.
By a decision of the Board of Directors in its meeting of 26 March 2012, the rate of this provision was standardised at 5% for all countries in the remit of the Fonds. This decision annuls that taken during the previous meeting of 26 March 2011 which fixed, exceptionally, the rate of 7% for commitments in Côte d’Ivoire, as at 31 December 2010, given the worsened socio-political situation in this country at that time.
4.2 Non balance sheet commitments as at 31 December 2011
The total amount of non balance sheet commitments, corresponding to securities pledged, stands at 56.196 billion CFA Francs as at 31 December 2011; and increase of 27% compared to the previous financial year in which these were 44.335 billion CFA Francs.
18
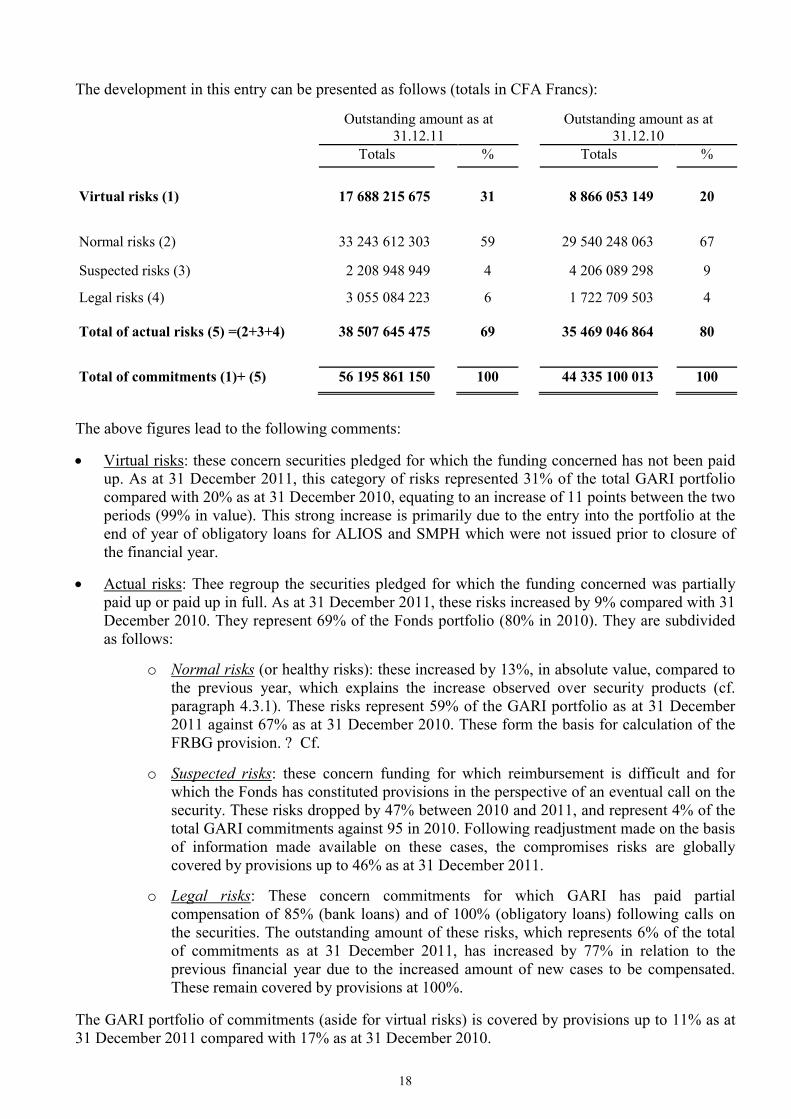
The development in this entry can be presented as follows (totals in CFA Francs):
Outstanding amount as at 31.12.11
Outstanding amount as at 31.12.10
Totals % Totals %
Virtual risks (1) 17 688 215 675 31 8 866 053 149 20
Normal risks (2) 33 243 612 303 59 29 540 248 063 67
Suspected risks (3) 2 208 948 949 4 4 206 089 298 9
Legal risks (4) 3 055 084 223 6 1 722 709 503 4
Total of actual risks (5) =(2+3+4) 38 507 645 475 69 35 469 046 864 80
Total of commitments (1)+ (5) 56 195 861 150 100 44 335 100 013 100
The above figures lead to the following comments:
Virtual risks: these concern securities pledged for which the funding concerned has not been paid up. As at 31 December 2011, this category of risks represented 31% of the total GARI portfolio compared with 20% as at 31 December 2010, equating to an increase of 11 points between the two periods (99% in value). This strong increase is primarily due to the entry into the portfolio at the end of year of obligatory loans for ALIOS and SMPH which were not issued prior to closure of the financial year.
Actual risks: Thee regroup the securities pledged for which the funding concerned was partially paid up or paid up in full. As at 31 December 2011, these risks increased by 9% compared with 31 December 2010. They represent 69% of the Fonds portfolio (80% in 2010). They are subdivided as follows:
o Normal risks (or healthy risks): these increased by 13%, in absolute value, compared to the previous year, which explains the increase observed over security products (cf. paragraph 4.3.1). These risks represent 59% of the GARI portfolio as at 31 December 2011 against 67% as at 31 December 2010. These form the basis for calculation of the FRBG provision. ? Cf.
o Suspected risks: these concern funding for which reimbursement is difficult and for which the Fonds has constituted provisions in the perspective of an eventual call on the security. These risks dropped by 47% between 2010 and 2011, and represent 4% of the total GARI commitments against 95 in 2010. Following readjustment made on the basis of information made available on these cases, the compromises risks are globally covered by provisions up to 46% as at 31 December 2011.
o Legal risks: These concern commitments for which GARI has paid partial compensation of 85% (bank loans) and of 100% (obligatory loans) following calls on the securities. The outstanding amount of these risks, which represents 6% of the total of commitments as at 31 December 2011, has increased by 77% in relation to the previous financial year due to the increased amount of new cases to be compensated. These remain covered by provisions at 100%.
The GARI portfolio of commitments (aside for virtual risks) is covered by provisions up to 11% as at 31 December 2011 compared with 17% as at 31 December 2010.
19
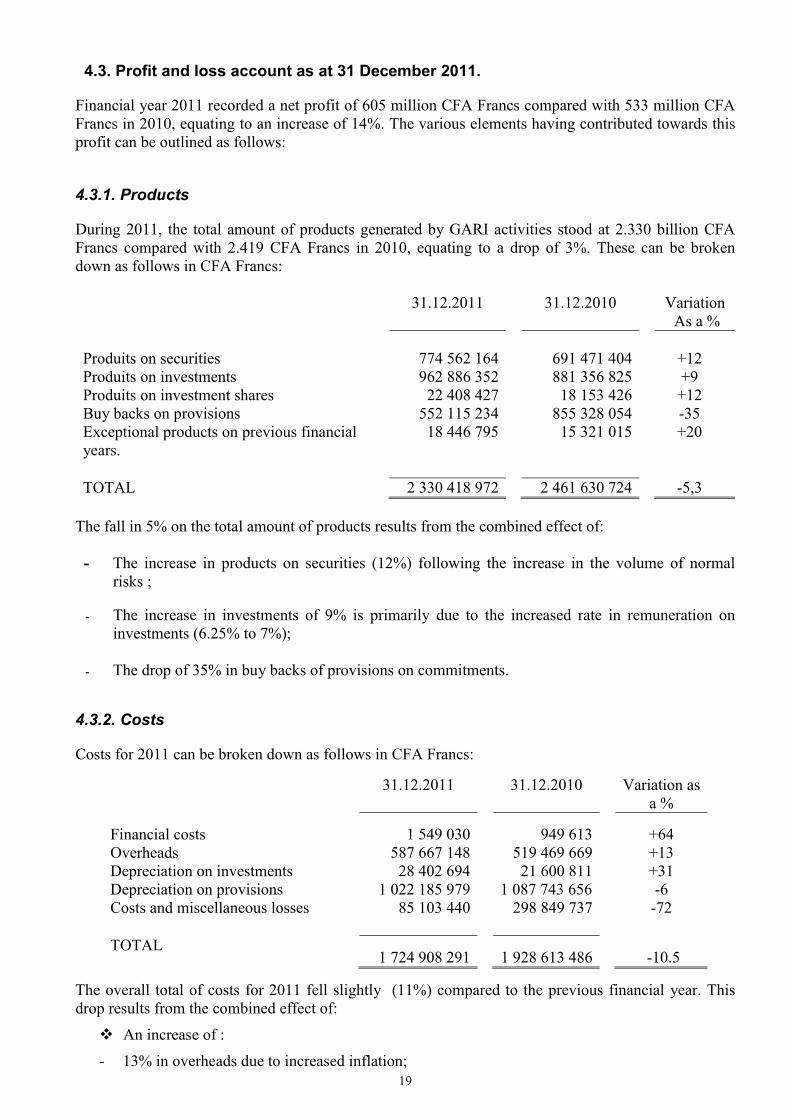
4.3. Profit and loss account as at 31 December 2011.
Financial year 2011 recorded a net profit of 605 million CFA Francs compared with 533 million CFA Francs in 2010, equating to an increase of 14%. The various elements having contributed towards this profit can be outlined as follows:
4.3.1. Products
During 2011, the total amount of products generated by GARI activities stood at 2.330 billion CFA Francs compared with 2.419 CFA Francs in 2010, equating to a drop of 3%. These can be broken down as follows in CFA Francs: 31.12.2011 31.12.2010 Variation
As a % Produits on securities
774 562 164
691 471 404
+12
Produits on investments 962 886 352 881 356 825 +9 Produits on investment shares 22 408 427 18 153 426 +12 Buy backs on provisions 552 115 234 855 328 054 -35 Exceptional products on previous financial years.
18 446 795 15 321 015 +20
TOTAL 2 330 418 972 2 461 630 724 -5,3
The fall in 5% on the total amount of products results from the combined effect of:
- The increase in products on securities (12%) following the increase in the volume of normal risks ;
- The increase in investments of 9% is primarily due to the increased rate in remuneration on investments (6.25% to 7%);
- The drop of 35% in buy backs of provisions on commitments.
4.3.2. Costs
Costs for 2011 can be broken down as follows in CFA Francs:
31.12.2011 31.12.2010 Variation as a %
Financial costs
1 549 030
949 613
+64 Overheads 587 667 148 519 469 669 +13 Depreciation on investments 28 402 694 21 600 811 +31 Depreciation on provisions 1 022 185 979 1 087 743 656 -6 Costs and miscellaneous losses 85 103 440 298 849 737 -72 TOTAL
1 724 908 291
1 928 613 486
-10.5
The overall total of costs for 2011 fell slightly (11%) compared to the previous financial year. This drop results from the combined effect of:
An increase of :
- 13% in overheads due to increased inflation;
20
- 64% of financial costs.
A drop of:
- 72% of losses and miscellaneous costs in relation to 2010 since this entry, in 2010, had witnessed a loss on liabilities of 285 million CFA Francs;
- 6% of depreciation on provisions on compromised commitments.
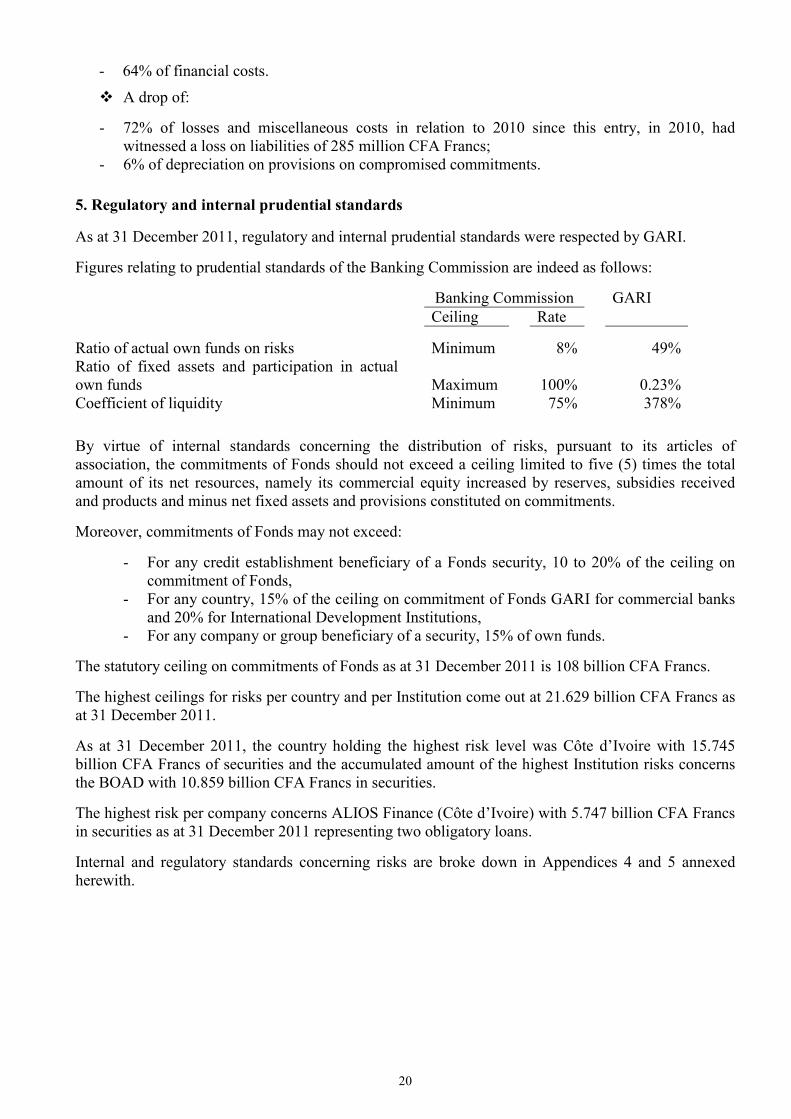
5. Regulatory and internal prudential standards
As at 31 December 2011, regulatory and internal prudential standards were respected by GARI.
Figures relating to prudential standards of the Banking Commission are indeed as follows:
Banking Commission GARI Ceiling Rate
Ratio of actual own funds on risks Minimum 8% 49% Ratio of fixed assets and participation in actual own funds
Maximum 100% 0.23%
Coefficient of liquidity Minimum 75% 378%
By virtue of internal standards concerning the distribution of risks, pursuant to its articles of association, the commitments of Fonds should not exceed a ceiling limited to five (5) times the total amount of its net resources, namely its commercial equity increased by reserves, subsidies received and products and minus net fixed assets and provisions constituted on commitments.
Moreover, commitments of Fonds may not exceed:
- For any credit establishment beneficiary of a Fonds security, 10 to 20% of the ceiling on commitment of Fonds,
- For any country, 15% of the ceiling on commitment of Fonds GARI for commercial banks and 20% for International Development Institutions,
- For any company or group beneficiary of a security, 15% of own funds.
The statutory ceiling on commitments of Fonds as at 31 December 2011 is 108 billion CFA Francs.
The highest ceilings for risks per country and per Institution come out at 21.629 billion CFA Francs as at 31 December 2011.
As at 31 December 2011, the country holding the highest risk level was Côte d’Ivoire with 15.745 billion CFA Francs of securities and the accumulated amount of the highest Institution risks concerns the BOAD with 10.859 billion CFA Francs in securities.
The highest risk per company concerns ALIOS Finance (Côte d’Ivoire) with 5.747 billion CFA Francs in securities as at 31 December 2011 representing two obligatory loans.
Internal and regulatory standards concerning risks are broke down in Appendices 4 and 5 annexed herewith.

Rap gestion
APPENDICES

Rap gestion
Appendix 1 APPROVAL OF SECURITIES PER ESTABLISHMENT SINCE CREATION UNTIL 31/12/2011
INSTITUTIONS NUMBER % TOTAL % AFRICAINE DE BOURSE 1 0.34% 1 500 0.81%
AIB 1 0.34% 54 0.03%
ATLANTIQUE FINANCE 3 1.01% 6 200 3.36%
BACI 4 1.35% 800 0.43%
BABF 2 0.67% 619 0.34%
BATG 2 0.67% 1 875 1.02%
ARIZ (Fonds) 2 0.67% 2287 1.24%
BCA Cap Vert 2 0.67% 385 0.21%
BCB 1 0.34% 100 0.05%
BCI 1 0.34% 25 0.01%
BEI 1 0.34% 1 300 0.70%
BIA Cap Vert 1 0.34% 524 0.28%
BIA NIGER 5 1.68% 1 148 0.62%
BIA TOGO 8 2.69% 1 888 1.02%
BIAO CI 4 1.35% 3 463 1.88%
BIBE BENIN 1 0.34% 563 0.30%
BIB BURKINA 2 0.67% 342 0.19%
BICIA BURKINA 3 1.01% 585 0.32%
BICI BOURSE 6 2.02% 11 186 6.06%
BICICI 6 2.02% 1949 1.06%
BICIM 1 0.34% 153 0.08%
BICIS 6 2.02% 2 071 1.12%
BIG 2 0.67% 210 0.11%
BIS 2 0.67% 720 0.39%
BNI 1 0.34% 51 0.03%
BOA (GROUPE) 27 9.09% 8 310 4.50%
BOAD 30 10.10% 32 617 17.67%
BPEC 2 0.67% 950 0.51%
BURKINA BAIL 3 1.01% 375 0.20%
BIDC 9 3.03% 11 480 6.22%
BIO INVEST 4 1.35% 1080 0.59%
BSIC BENIN 2 0.67% 1 145 0.62%
BSIC MALI 1 0.34% 133 0.07%
BSIC NIGER 1 0.34% 60 0.03%
BTCI 1 0.34% 162 0.09%
BTD 3 1.01% 626 0.34%
CAA 2 0.67% 281 0.15%
CBAO 12 4.04% 7 364 3.99%
CGF BOURSE 3 1.01% 4 987 2.70%
CITIBANK 1 0.34% 1 400 0.76%
CLS 2 0.67% 205 0.11%
CNCA BURKINA 1 0.34% 119 0.06%
COBACI 6 2.02% 710 0.38%
CONTINENTAL BK 3 1.01% 1 250 0.68%
CONTINENTAL BK BENIN 1 0.34% 563 0.30%
CORIS BANK 5 1.68% 2 689 1.46%
CIM 1 0.34% 879 0.48%
DEG 1 0.34% 805 0.44%
DIAMOND BANK 1 0.34% 300 0.16%
ECOBANK ( GROUPE) 28 9.43% 11 037 5.98%
EIC 2 0.67% 2 500 1.35%
EDC 1 0.34% 1 125 0.61%
EQUIPBAIL BURKINA 1 0.34% 150 0.08%
EQUIPBAIL MALI 1 0.34% 126 0.07%
MERCHANT BANK 8 2.69% 14 916 8.08%
OIKOCREDIT 2 0.67% 267 0.14%
OMNIFINANCE 2 0.67% 345 0.19%
ORABANK BANK (GROUPE) 4 1.35% 2063 1.12%
PROPARCO 17 5.72% 8 554 4.63%
SGB (GROUPE) 10 3.37% 2 838 1.54%
SGI TOGO 2 0.67% 3 816 2.07%
SGI MALI 3 1.01% 6 943 3.76%
SIB 2 0.67% 300 0.16%
SOAGA 1 0.34% 3 000 1.63%
SOFIGIB 1 0.34% 30 0.02%
SONIBANK 2 0.67% 781 0.42%
SSB 1 0.34% 875 0.47%
STANDARD CHART BK 1 0.34% 3 000 1.63%
TANYO/SAFHI 11 3.70% 2467 1.34%
UIBG 6 2.02% 730 0.40%
UTB 1 0.34% 252 0.14%
TOTAL 297 100.00% 184 603 100.00%
2
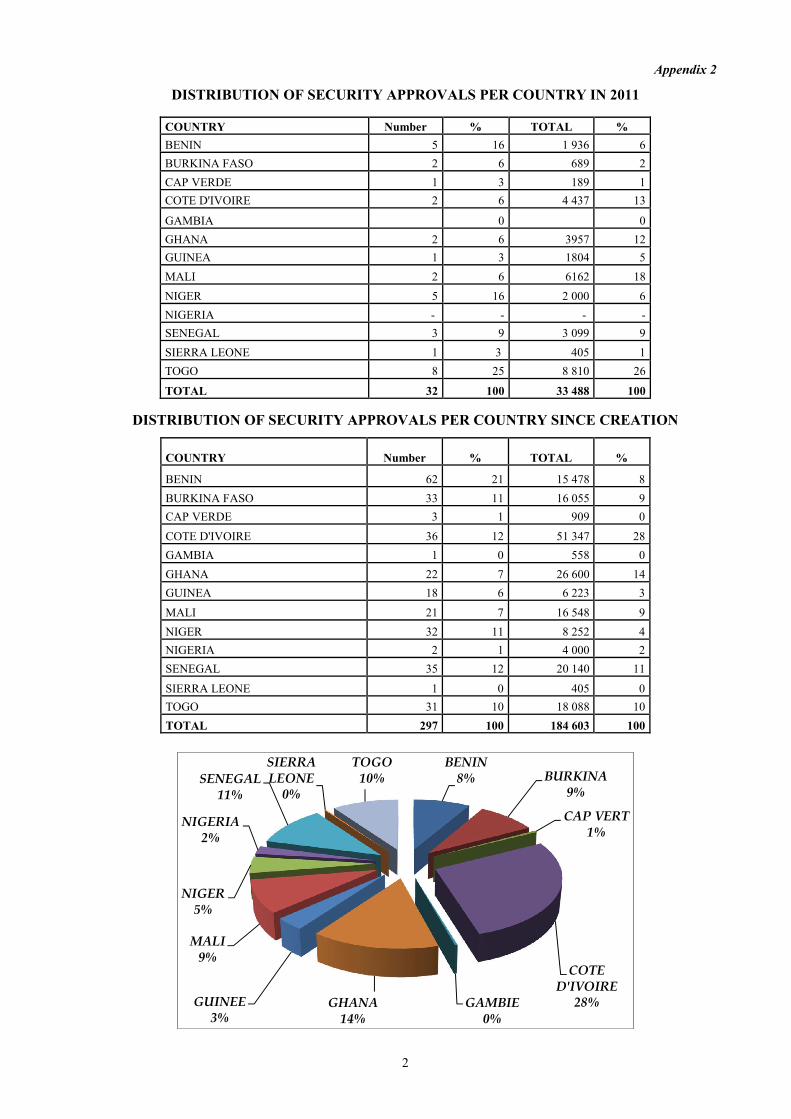
Appendix 2
DISTRIBUTION OF SECURITY APPROVALS PER COUNTRY IN 2011
COUNTRY Number % TOTAL %
BENIN 5 16 1 936 6
BURKINA FASO 2 6 689 2
CAP VERDE 1 3 189 1
COTE D'IVOIRE 2 6 4 437 13
GAMBIA 0 0
GHANA 2 6 3957 12
GUINEA 1 3 1804 5
MALI 2 6 6162 18
NIGER 5 16 2 000 6
NIGERIA - - - -
SENEGAL 3 9 3 099 9
SIERRA LEONE 1 3 405 1
TOGO 8 25 8 810 26
TOTAL 32 100 33 488 100
DISTRIBUTION OF SECURITY APPROVALS PER COUNTRY SINCE CREATION
COUNTRY Number % TOTAL %
BENIN 62 21 15 478 8
BURKINA FASO 33 11 16 055 9
CAP VERDE 3 1 909 0
COTE D'IVOIRE 36 12 51 347 28
GAMBIA 1 0 558 0
GHANA 22 7 26 600 14
GUINEA 18 6 6 223 3
MALI 21 7 16 548 9
NIGER 32 11 8 252 4
NIGERIA 2 1 4 000 2
SENEGAL 35 12 20 140 11
SIERRA LEONE 1 0 405 0
TOGO 31 10 18 088 10
TOTAL 297 100 184 603 100
BENIN8% BURKINA
9%
CAP VERT1%
COTE D'IVOIRE
28%GAMBIE0%
GHANA14%
GUINEE3%
MALI9%
NIGER5%
NIGERIA2%
SENEGAL11%
SIERRA LEONE
0%
TOGO10%