Embed Size (px)
Citation preview
NEWS News media Information 202 / 418-0500TTY 202 / 418-2555
Fax-On-Demand 202 / 418-2830Internet: http://www.fcc.gov
ftp.fcc.govFederal Communications Commission445 12th Street, S.W.Washington, D. C. 20554This is an unofficial announcement of Commission action. Release of the full text of a Commission orderconstitutes official action. See MCI v. FCC. 515 F 2d 385 (D.C. Circ 1974).
FOR IMMEDIATE RELEASE NEWS MEDIA CONTACT:February 27, 2002 Mike Balmoris at (202) 418-0253
Email: [email protected]
FEDERAL COMMUNICATIONS COMMISSION RELEASES DATA ONLOCAL TELEPHONE COMPETITION
New Entrant Switched Access Lines Climbed to 17.3 Million as of June 30, 2001
Washington, D.C. – The Federal Communications Commission (FCC) todayreleased summary statistics of its latest data on local telephone service competition in theUnited States. Telecommunications service providers file data on lines in service to end-user customers and state-specific mobile wireless telephone subscribership twice a yearin the Commission’s local competition and broadband data gathering program (FCCForm 477).
Statistics released today summarize FCC Form 477 filings made by qualifyingproviders on September 1, 2001, and reflect data as of June 30, 2001. Revenueinformation about all segments of the telecommunications industry is submitted pursuantto the Commission’s consolidated Telecommunications Reporting Worksheet (FCC Form499-A). The revenue statistics reflect data for the year 2000.
Noteworthy data include:
§ Competitive local exchange carriers (CLECs) reported 17.3 million (or 9.0%)of the approximately 192 million nationwide switched access lines in serviceat the end of June 2001, compared to 14.9 million (or 7.7% of nationwidelines) at the end of the preceding year. This represents a 16% growth inCLEC market size during the first six months of 2001.
§ About 55% of reported CLEC switched access lines served medium and largebusiness, institutional, and government customers. By contrast, a reported23% of incumbent local exchange carrier (ILEC) lines served such customers.
§ CLECs served 5.5% of the residential and small business market, compared to4.5% for the six-month period of January 2001-June 2001, or 3.2% for theyear ago period.
§ CLECs reported providing about one-third of switched access lines over theirown local loop facilities, 23% by means of resold ILEC services, and 44%over acquired unbundled network element (UNE) loops. ILECs reportedproviding almost 8 million UNE loops to other carriers, of which about 3.2million were provided without switching and about 4.8 million with switching
§ At least one CLEC was serving local telephone service end-user customers in60% of the nation’s zip codes at the end of June 2001. Just over 90% ofUnited States households reside in these zip codes. CLECs reportedcustomers in the District of Columbia, in Puerto Rico, and in all states exceptDelaware.
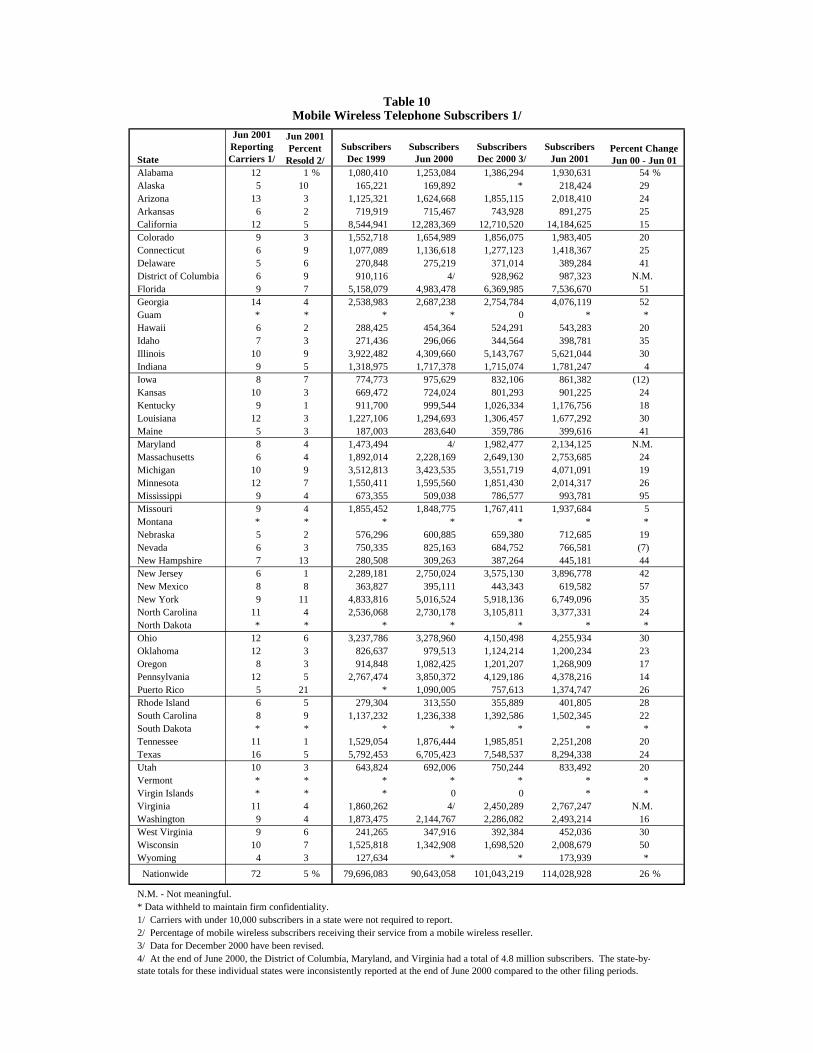
§ The 72 providers of mobile wireless telephone services that reported data as ofJune 30, 2001 served about 114 million subscribers.
§ Local service revenues reported by competitors to the ILECs increased by70% between 1999 and 2000 -- from $6.3 billion to $10.7 billion. The shareof local service revenues claimed by competitors rose from 5.8% in 1999 to8.9% in 2000.
The Commission is currently looking to provide a greater examination of datafrom various platform providers – such as wireless, satellite and cable – and itssubsequent Local Competition Reports will include data from these multiple platformproviders.
As additional information becomes available, it will be routinely posted on theCommission’s Internet site.
The statistical summary is available in the FCC’s Reference Information Center,Courtyard Level, 445 12th Street, S.W. Copies may be purchased from theCommission’s duplicating contractor, Qualex International, Portals II, 445 12th Street,S.W., Room CY-B402, Washington, D.C., telephone 202-863-2893, facsimile 202-863-2898, or via e-mail [email protected]. The statistical summary can also be downloadedfrom the FCC-State Link Internet site at www.fcc.gov/ccb/stats.
Common Carrier contacts: Industry Analysis Division at (202) 418-0940; TTY (202)418-0484.
Local Telephone Competition:Status as of June 30, 2001
Industry Analysis DivisionCommon Carrier Bureau
February 2002
This report is available for reference in the FCC’s Information Center at 445 12th Street, S.W., CourtyardLevel. Copies may be purchased by calling Qualex International, Portals II, 445 12th Street SW, RoomCY-B402, Washington, DC 20554, telephone 202-863-2893, facsimile 202-863-2898, or via [email protected]. The report can also be downloaded from the FCC-State Link Internet site atwww.fcc.gov/ccb/stats.

1
Local Telephone Competition: Status as of June 30, 2001
We present here summary statistics of the latest data on local telephone service competition in theUnited States as reported in the Commission’s local competition and broadband data gathering program(FCC Form 477). The summary statistics provide a snapshot of local telephone service competitionbased on switched access lines in service and state-specific mobile wireless telephone subscribership asof June 30, 2001.1 We also summarize evidence of competition based on annual local telephoneservice revenues through the year 2000.2
Based on the latest information now available, readers can draw the following broad conclusions:
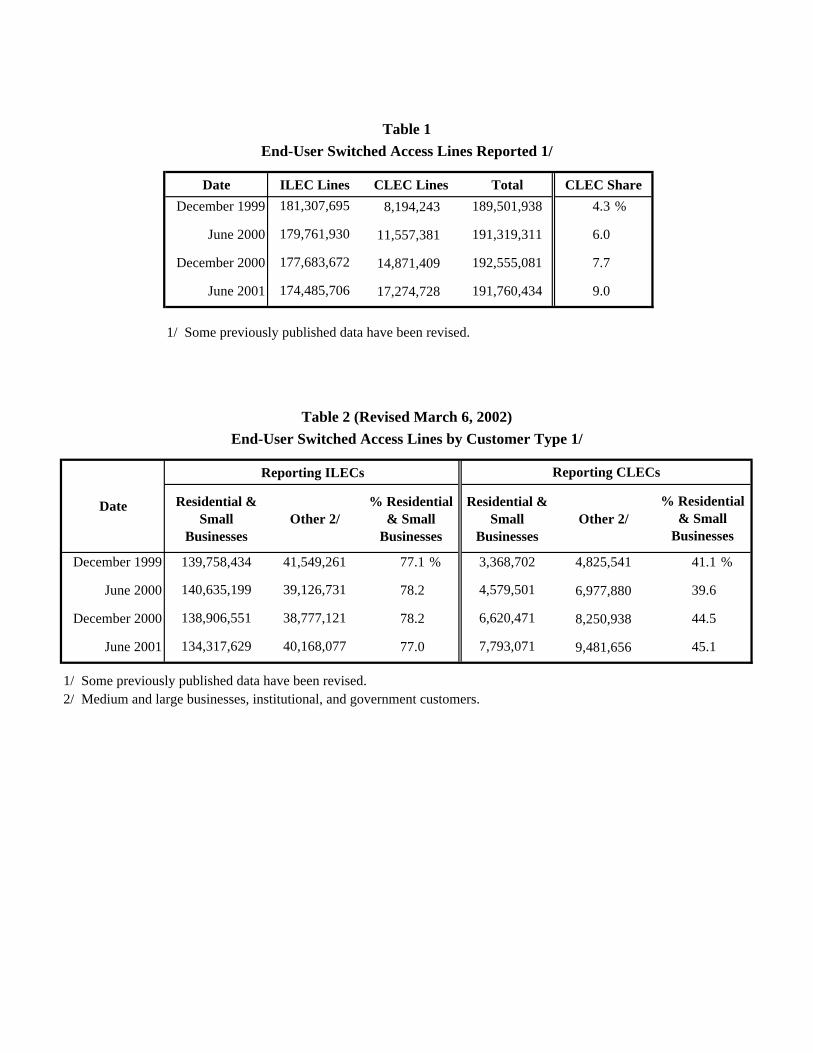
• Competitive local exchange carriers (CLECs) reported 17.3 million (or 9.0%) of the approximately192 million nationwide switched access lines in service at the end of June 2001, compared to 14.9million (or 7.7% of nationwide lines) at the end of the preceding year. This represents a 16%growth in CLEC market size during the first six months of 2001. See Table 1.
• About 55% of reported CLEC switched access lines serve medium and large business, institutional,and government customers. By contrast, a reported 23% of incumbent local exchange carrier(ILEC) local telephone lines served such customers. See Table 2.
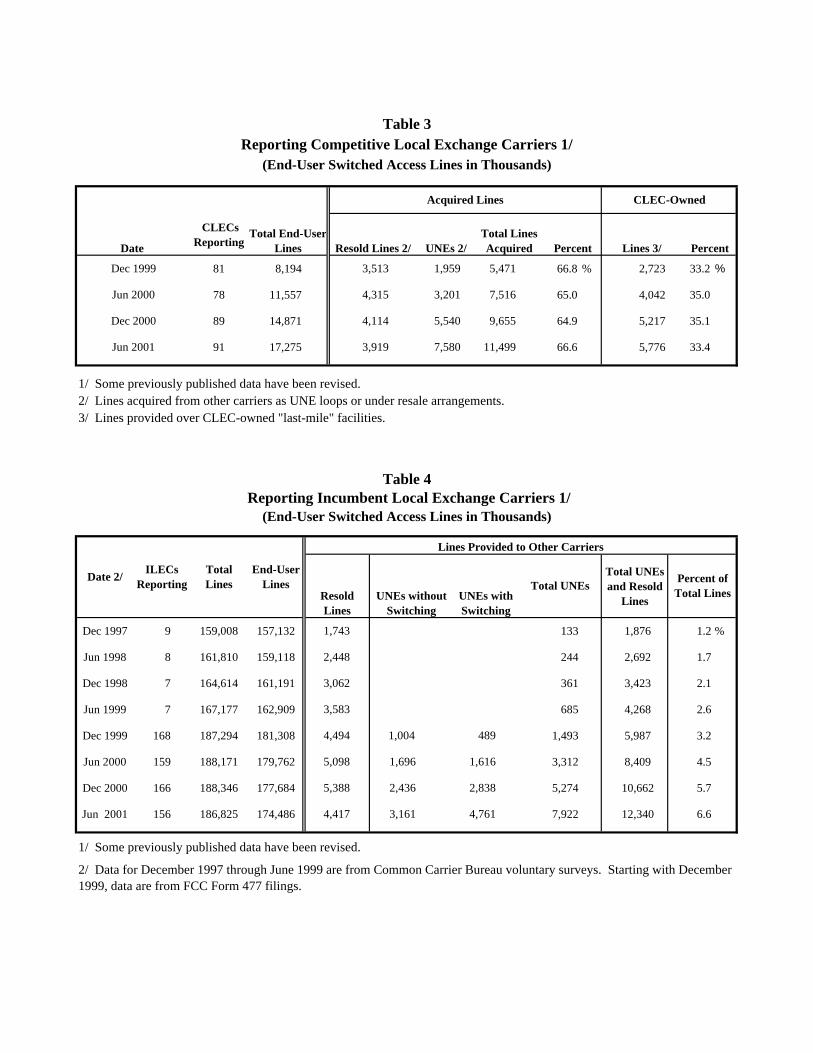
• CLECs reported providing about one-third of switched access lines over their own local loopfacilities.3 To serve the remainder, CLECs resell the services of other carriers or use unbundled
1 Qualifying carriers reported data for June 30, 2001 in filings due on September 1, 2001. (Qualificationstatus is determined separately for each state. If a carrier has at least 10,000 local telephone lines inservice in a state, it must file local telephone data for that state.) Earlier FCC Form 477 filings reporteddata as of December 31, 1999, June 30, 2000, and December 31, 2000. See Federal CommunicationsCommission, Common Carrier Bureau, Industry Analysis Division, Local Telephone Competition at theNew Millennium (rel. Aug. 2000), Local Telephone Competition: Status as of June 30, 2000 (rel.Dec. 2000), and Local Telephone Competition: Status as of December 31, 2000 (rel. May 2001)available at www.fcc.gov/ccb/stats. During this data gathering program, qualifying service providers willfile FCC Form 477 each year on March 1 (reporting data for the preceding December 31) and September1 (reporting data for June 30 of the same year). An updated FCC Form 477, and Instructions for thatparticular form, for each specific round of the data collection may be downloaded from the FCC Formswebsite at www.fcc.gov/formpage.html. FCC Form 477 replaced a previous, voluntary data gatheringprogram which was administered by the Common Carrier Bureau. See Local Competition andBroadband Reporting, CC Docket No. 99-301, Notice of Proposed Rulemaking, 14 FCC Rcd 18106 (rel.Oct. 22, 1999).
2 Revenue information about all segments of the telecommunications industry is submitted pursuant tothe Commission’s consolidated Telecommunications Reporting Worksheet (FCC Form 499-A), which isalso available from the FCC Forms website at www.fcc.gov/formpage.html.
3 A reporting carrier should own the “last mile” of wire, cable, or optical fiber that connects to the end-user premises (or have obtained radio spectrum for the equivalent fixed wireless facility) if it reportsproviding the local telephone line over its own facilities. In general, local exchange and exchange accesslines provisioned over facilities (other than dark fiber) and services obtained from another carrier are notthe reporting carrier’s “own facilities” for purposes of FCC Form 477, irrespective of whether those(continued….)

2
network element (UNE) loops that they lease from other carriers.4 See Table 3.
• In the course of our four data collections to date, the percentage of CLEC switched access linesreported to be provisioned by reselling services has declined steadily (to 23% at the end of June2001) and the percentage provisioned over UNE loops has grown (to 44%).
• ILECs reported providing about 4.4 million lines to other carriers on a resale basis at the end ofJune 2001, compared to about 5.4 million lines at the end of the preceding year. By contrast, thenumber of UNE loops that ILECs reported providing to other carriers increased by 50%, to a totalof almost 8 million.5 See Table 4.
• UNE loops provided with ILEC switching (which includes the so-called UNE-Platform) haveincreased faster than UNE loops provided without switching.6
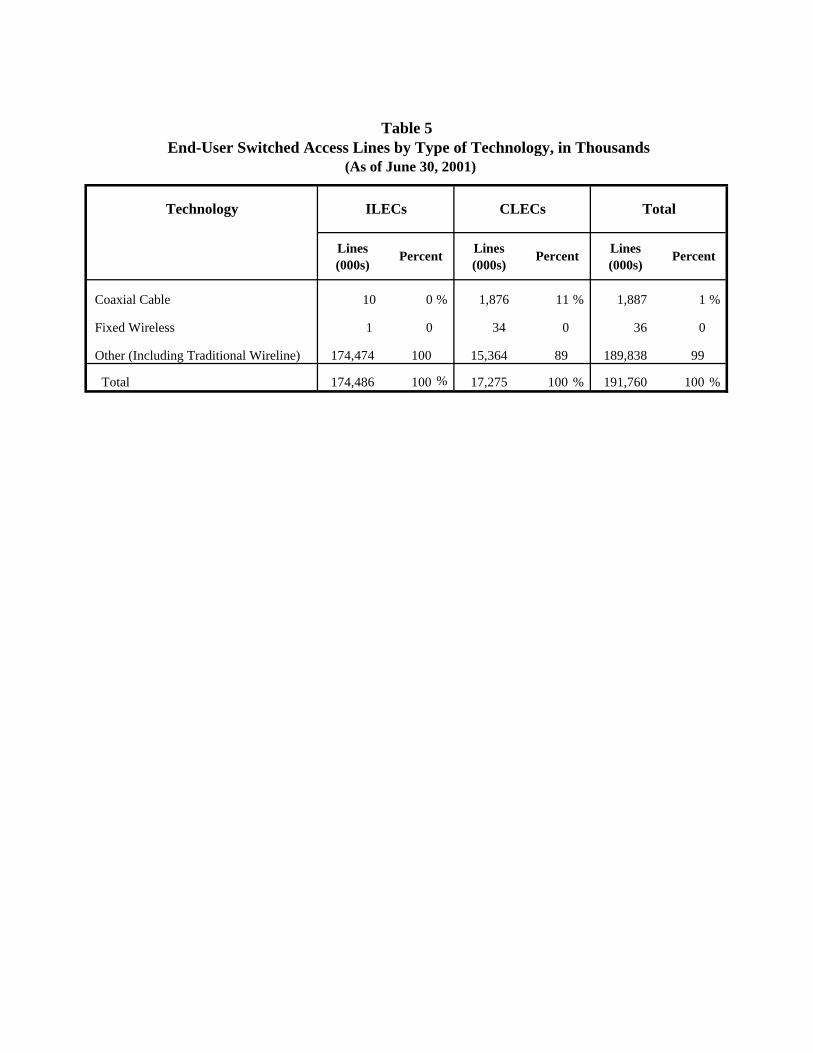
• About 1% of nationwide local telephone lines in service at the end of June 2001, or about 1.9million lines, terminated at the end-user customer’s premises over coaxial cable facilities. Less than1% of lines terminated over fixed wireless facilities. See Table 5.
• The Commission’s data collection program provides information about CLEC local telephoneservice lines (and the CLEC share of total local telephone service lines) in individual states.
(Continued from previous page) facilities or services are obtained under interconnection arrangements, under tariff, or by other means. Inparticular, owning the switch that provides dialtone (and other services) over a UNE loop leased fromanother carrier does not qualify a line as being provisioned over the reporting carrier’s own facilities. Webelieve the reports of at least some CLECs are not consistent with these directions, and we expect suchproviders to report data more accurately as they gain experience with the program. We also expect thatthere may be some need for further clarification and adjustment of the reporting system. The Commissionhas accepted comments on whether modifications should be made to FCC Form 477. See LocalCompetition and Broadband Deployment, CC Docket No. 99-301, Second Notice of ProposedRulemaking 16 FCC Rcd 2072 (rel. Jan. 19, 2001).
4 UNE loops, as we use the term here, include UNE loops leased from an ILEC on a stand-alone basisand also UNE loops leased in combination with UNE switching or with any other unbundled networkelement. For definitions of the various unbundled network elements, see Implementation of the LocalCompetition Provisions of the Telecommunications Act of 1996, CC Docket 96-98, Third Report andOrder and Fourth Further Notice of Proposed Rulemaking, 15 FCC Rcd 3696, 3932-3952 (rel. Nov. 5,1999).
5 The numbers reported by ILECs may be slightly understated because smaller carriers are not requiredto report data. However, as the reporting ILECs account for about 98% of all ILEC lines, theunderstatement should not be large. (All ILECs, whether or not they normally report to the FCC, providedata on the number of telephone lines served to the National Exchange Carrier Association for use inconjunction with the Commission’s universal service mechanism.) We are less certain about the extent towhich comparable lines as reported by CLECs are understated as a result of the state-specific reportingthreshold, but we expect such understatement to be larger, on a percentage basis, than for ILECs.
6 The reported number of UNE loops provided without ILEC switching includes UNE loops tounaffiliated DSL service providers.
3
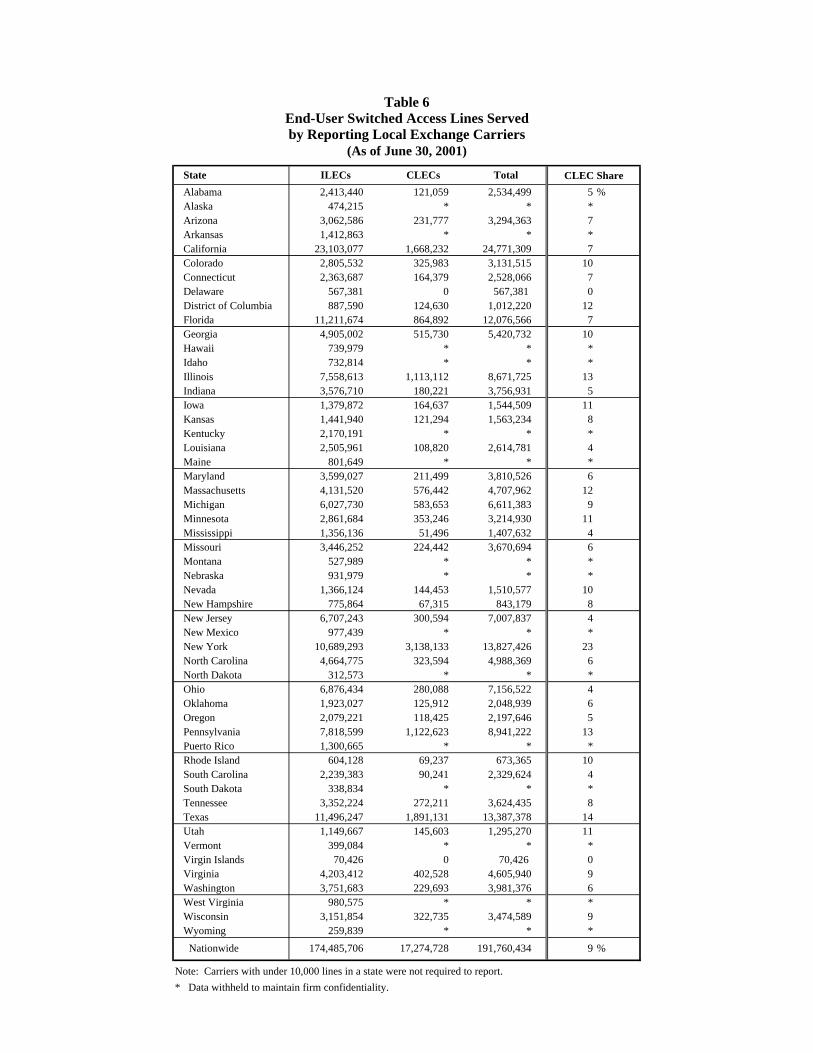
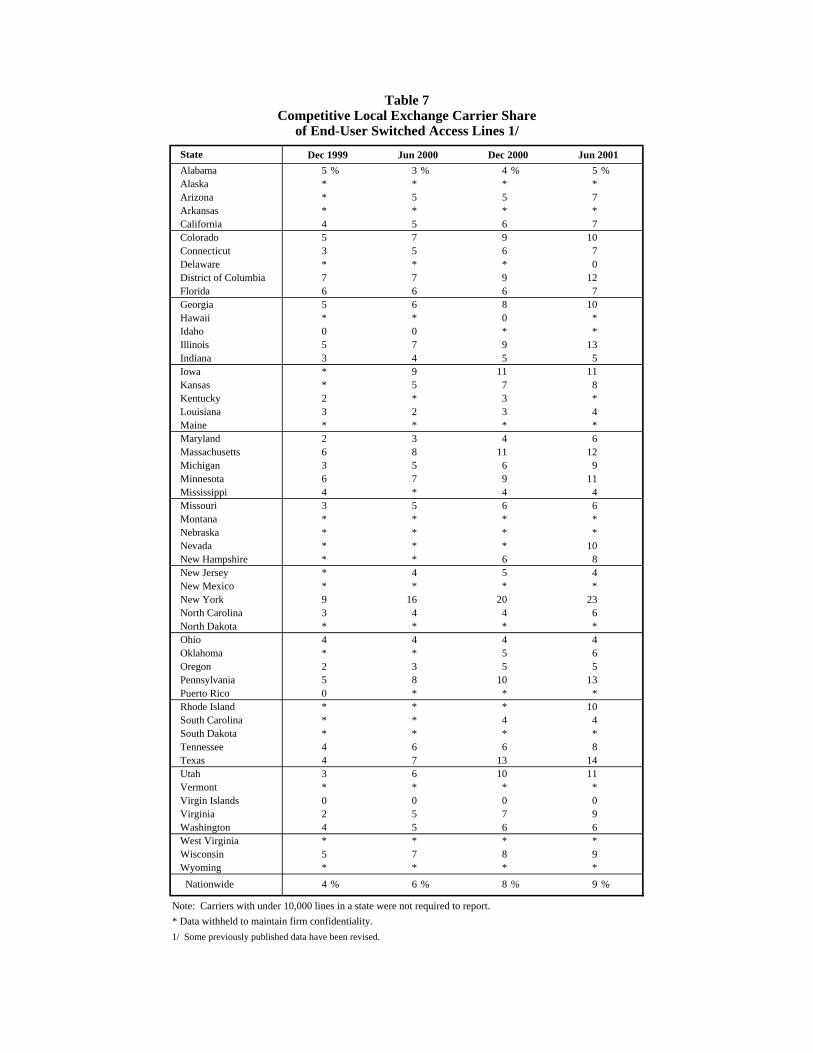
Relatively large numbers of CLEC lines are associated with the more populous states.7 Withrespect to the calculated CLEC share of switched access lines in service, however, relatively largevalues are reported for some less populous states, such as Iowa, Minnesota, and Utah, as well asfor some more populous states, such as New York and Texas. See Tables 6 and 7.
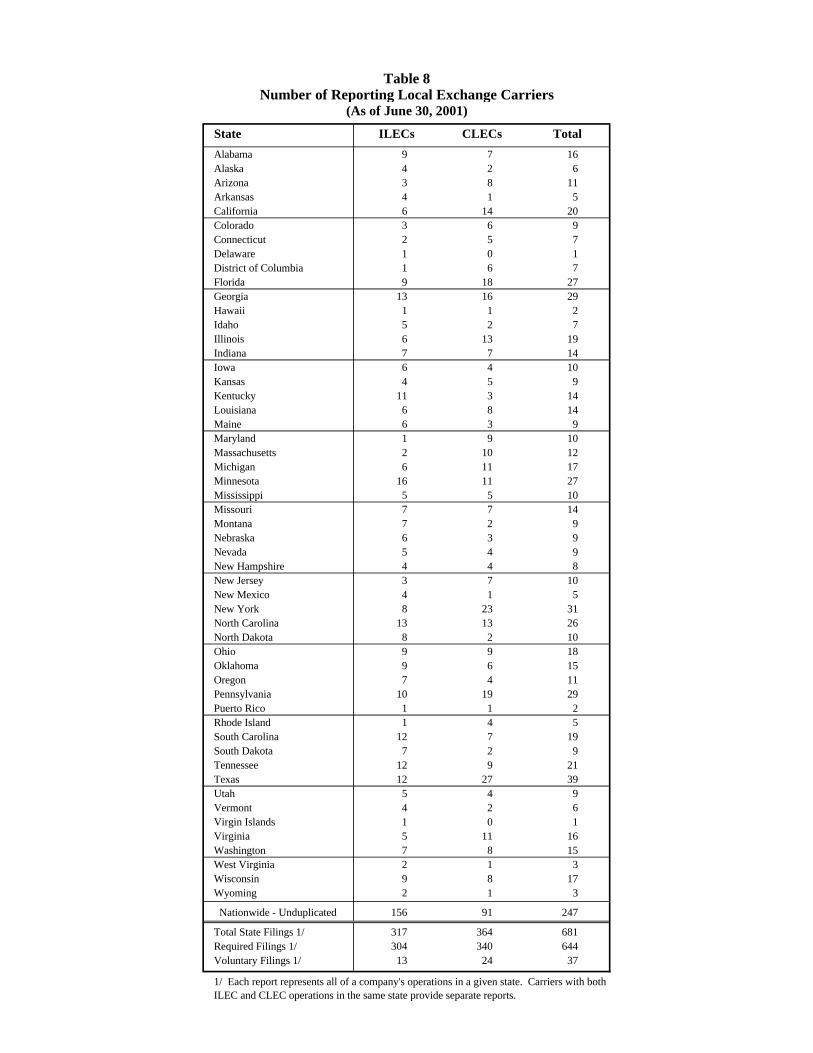
• At least one CLEC reported switched access lines in service in the District of Columbia, in PuertoRico, and in all states except Delaware.8 Four or more CLECs reported serving customers in 35states and the District of Columbia. See Table 8.
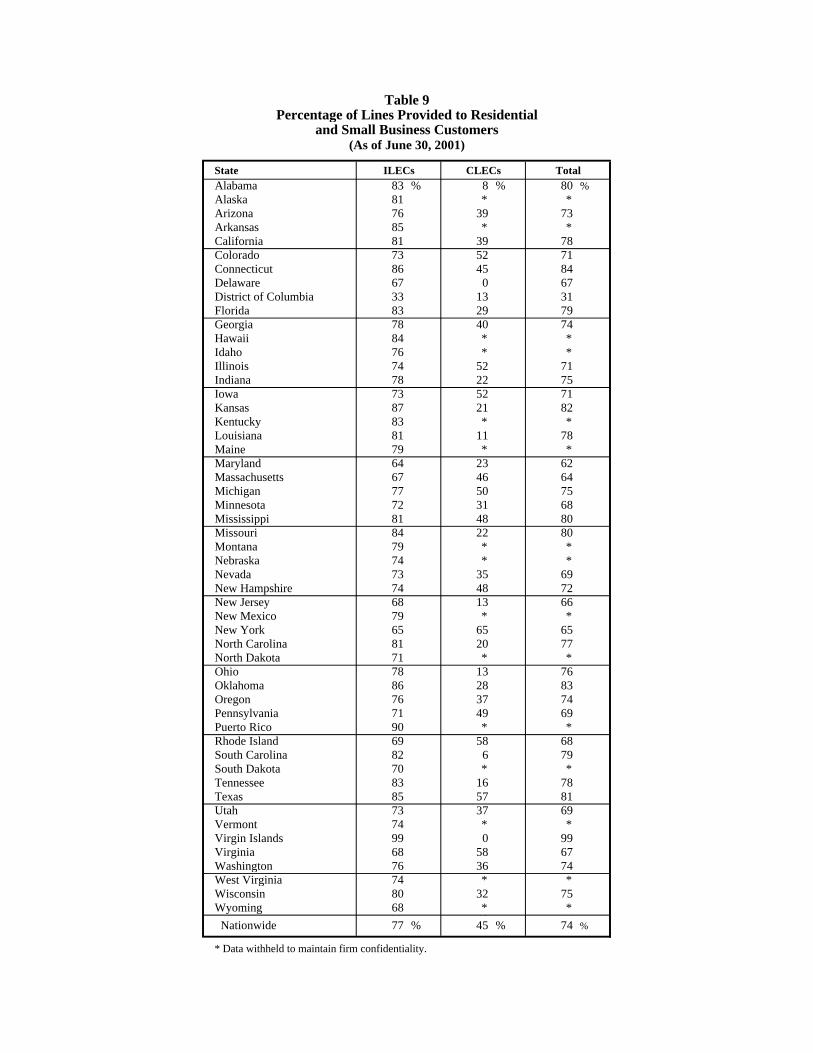
• The percentage of CLEC switched access lines reported to serve residential and small businesscustomers varies among the states, and is generally lower than the corresponding ILEC percentage.9
See Table 9.
• By comparison to the roughly 192 million fixed-facility10 switched access lines in service, the 72providers of mobile wireless telephone services that reported information served about 114 millionsubscribers as of the end of June 2001.11 About 5% of these subscribers received their service viaa mobile telephone service reseller. See Table 10.
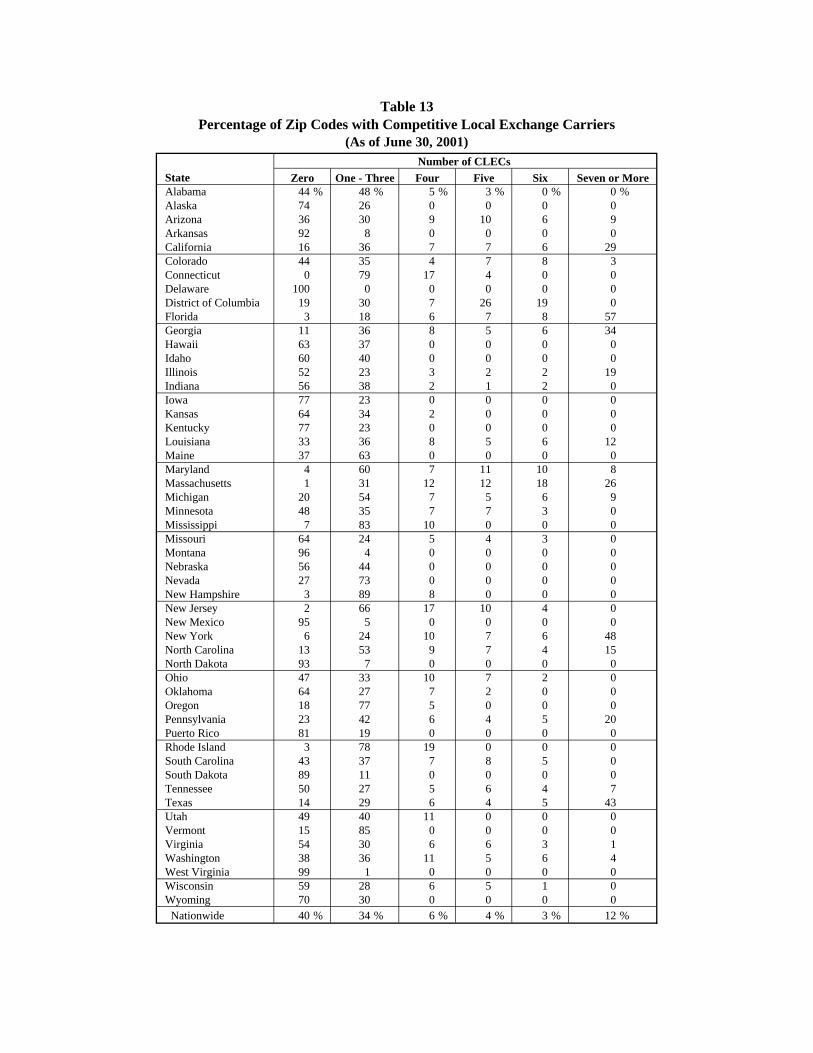
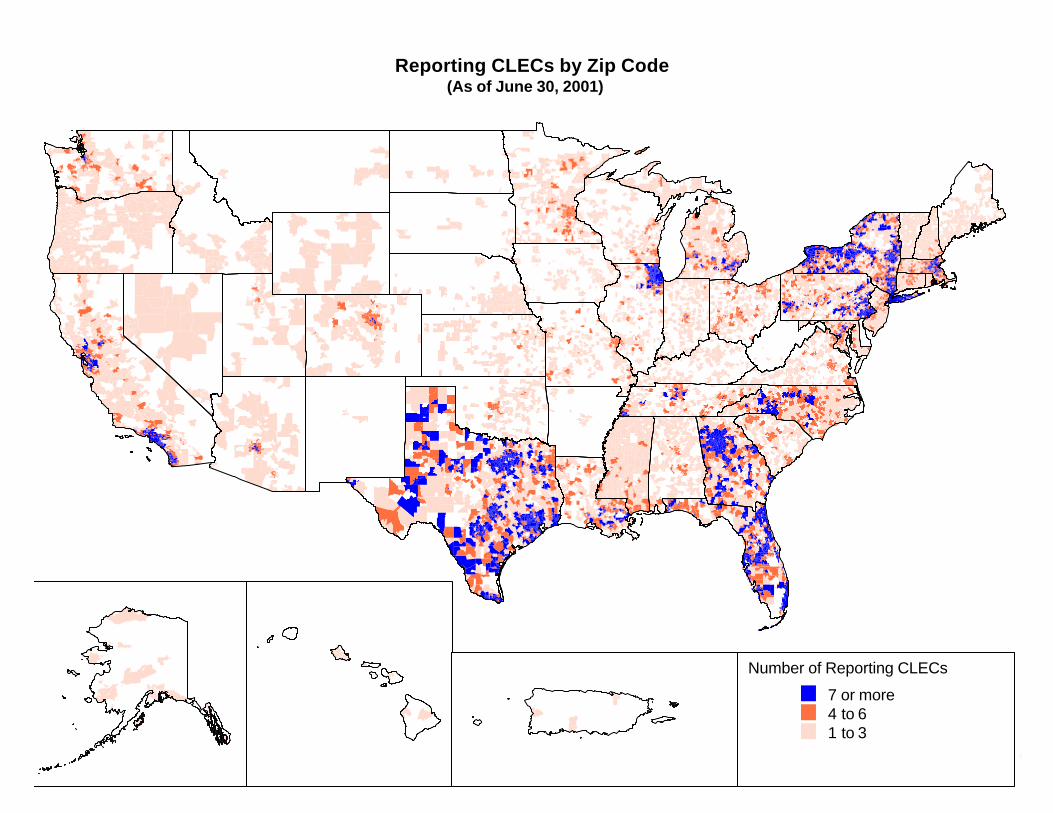
• The Commission’s data collection program requires CLECs and ILECs to identify each zip code inwhich the carrier provides local telephone service to at least one end-user customer.12 As of June30, 2001, at least one CLEC was serving customers in 60% of the nation’s zip codes. Just over90% of United States households reside in these zip codes. Moreover, multiple carriers reportproviding local telephone service in the major population centers of the country. See Table 11,Table 12, and the map that follows Table 13.
7 The first and second largest numbers of CLEC lines are reported for New York and Texas which are,respectively, the third and second most populous states. The most populous state, California, has the thirdlargest number of CLEC lines reported.
8 Under Section 3(40) of the Communications Act the term state “includes the District of Columbia andthe Territories and possessions.” 47 U.S.C. § 153(40). We note that carriers that have fewer than 10,000local telephone lines in service in a state are not required to report those lines on FCC Form 477, but mayfile the data on a voluntary basis. There were 13 voluntary ILEC filings and 24 voluntary CLEC filings ofstate-specific data as of June 30, 2001. In the course of our four data collections to date, the number ofvoluntary ILEC filings has varied between 7 and 13, and the number of voluntary CLEC filings has variedbetween 24 and 53.
9 The smallest difference occurs in New York (65.3% for ILECs and 64.6% for CLECs).
10 That is, voice telephone lines provided by means of wireline or fixed wireless technology.
11 Facilities-based providers with fewer than 10,000 mobile wireless telephone service subscribers in astate (measured by revenue-generating handsets in service) are not required to report. A facilities-basedmobile wireless telephone service provider serves subscribers using spectrum licenses that it has obtainedor manages.
12 CLECs and ILECs are required to report, for states in which they have at least 10,000 local telephonelines in service, lists of zip codes where they have subscribers. Providers of mobile wireless telephoneservice do not report zip codes.
4
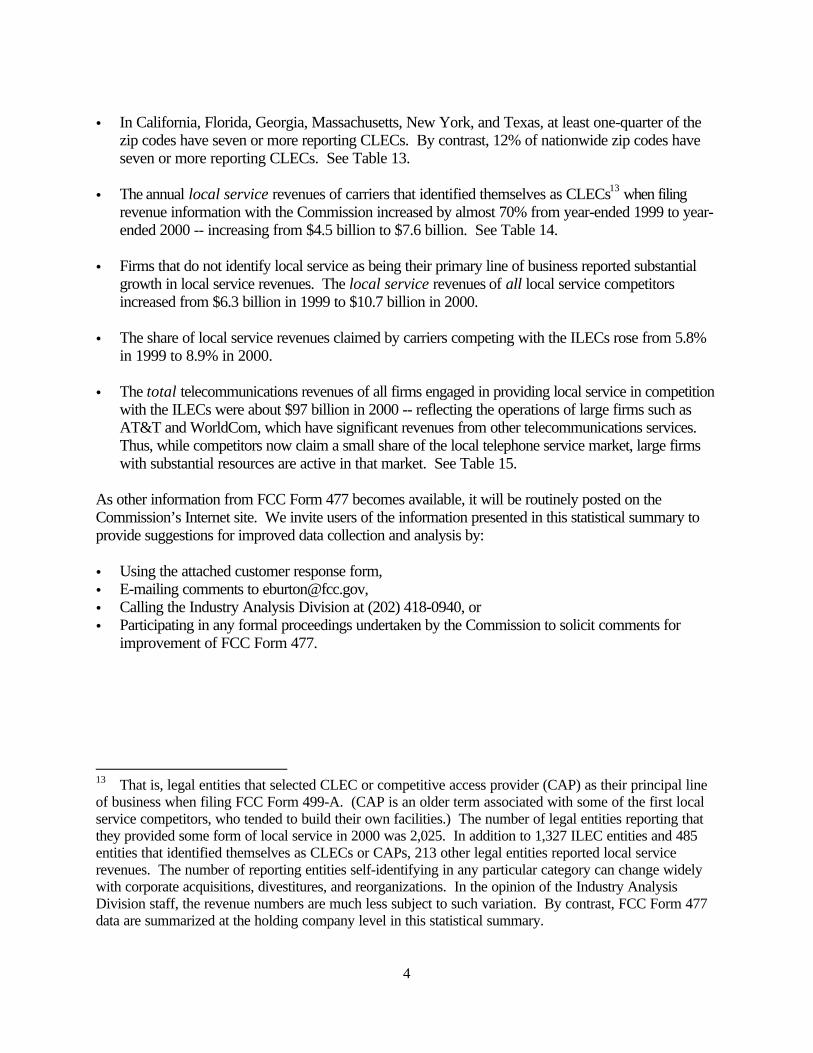
• In California, Florida, Georgia, Massachusetts, New York, and Texas, at least one-quarter of thezip codes have seven or more reporting CLECs. By contrast, 12% of nationwide zip codes haveseven or more reporting CLECs. See Table 13.
• The annual local service revenues of carriers that identified themselves as CLECs13 when filingrevenue information with the Commission increased by almost 70% from year-ended 1999 to year-ended 2000 -- increasing from $4.5 billion to $7.6 billion. See Table 14.
• Firms that do not identify local service as being their primary line of business reported substantialgrowth in local service revenues. The local service revenues of all local service competitorsincreased from $6.3 billion in 1999 to $10.7 billion in 2000.
• The share of local service revenues claimed by carriers competing with the ILECs rose from 5.8%in 1999 to 8.9% in 2000.
• The total telecommunications revenues of all firms engaged in providing local service in competitionwith the ILECs were about $97 billion in 2000 -- reflecting the operations of large firms such asAT&T and WorldCom, which have significant revenues from other telecommunications services. Thus, while competitors now claim a small share of the local telephone service market, large firmswith substantial resources are active in that market. See Table 15.
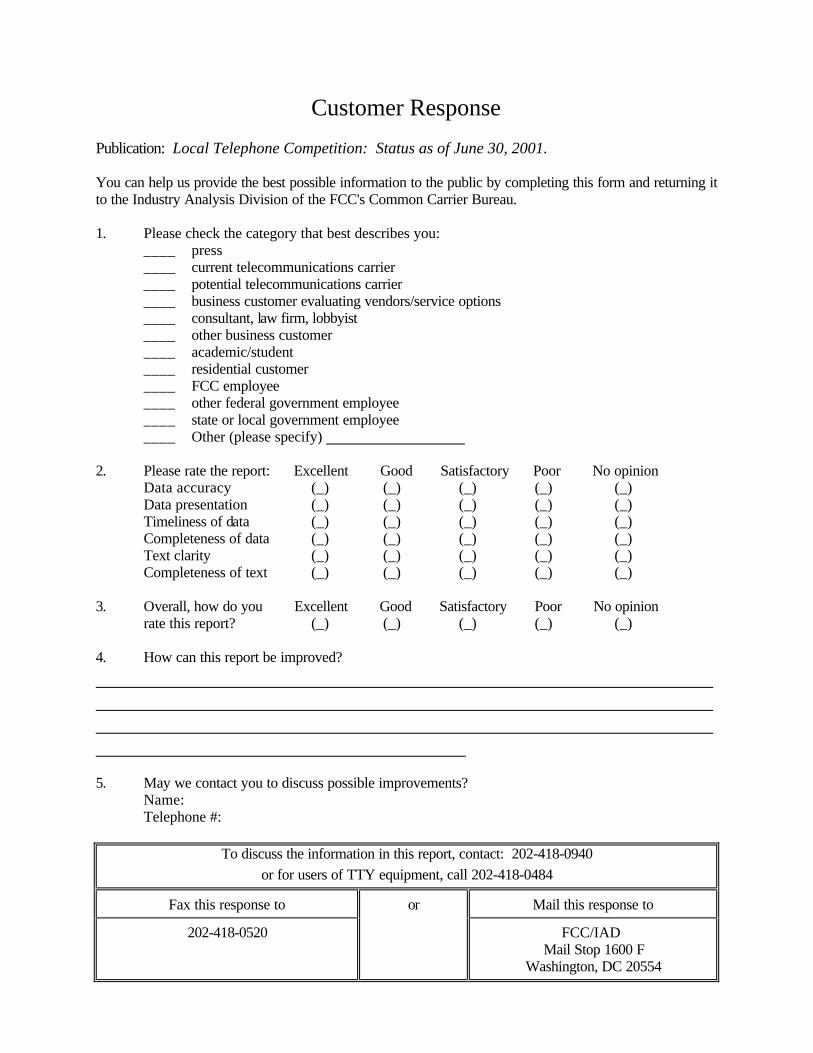
As other information from FCC Form 477 becomes available, it will be routinely posted on theCommission’s Internet site. We invite users of the information presented in this statistical summary toprovide suggestions for improved data collection and analysis by:
• Using the attached customer response form,• E-mailing comments to [email protected],• Calling the Industry Analysis Division at (202) 418-0940, or• Participating in any formal proceedings undertaken by the Commission to solicit comments for
improvement of FCC Form 477.
13 That is, legal entities that selected CLEC or competitive access provider (CAP) as their principal lineof business when filing FCC Form 499-A. (CAP is an older term associated with some of the first localservice competitors, who tended to build their own facilities.) The number of legal entities reporting thatthey provided some form of local service in 2000 was 2,025. In addition to 1,327 ILEC entities and 485entities that identified themselves as CLECs or CAPs, 213 other legal entities reported local servicerevenues. The number of reporting entities self-identifying in any particular category can change widelywith corporate acquisitions, divestitures, and reorganizations. In the opinion of the Industry AnalysisDivision staff, the revenue numbers are much less subject to such variation. By contrast, FCC Form 477data are summarized at the holding company level in this statistical summary.
Date ILEC Lines CLEC Lines Total CLEC Share
December 1999 181,307,695 189,501,938 4.3 %
June 2000 179,761,930 191,319,311 6.0
December 2000 177,683,672 192,555,081 7.7
June 2001 174,485,706 191,760,434 9.0
1/ Some previously published data have been revised.
Reporting ILECs
Residential & Small
BusinessesOther 2/
% Residential & Small
Businesses
Residential & Small
BusinessesOther 2/
December 1999 139,758,434 41,549,261 77.1 % 3,368,702 4,825,541 41.1 %
June 2000 140,635,199 39,126,731 78.2 4,579,501 39.6
December 2000 138,906,551 38,777,121 78.2 6,620,471 44.5
June 2001 134,317,629 40,168,077 77.0 7,793,071 45.1
1/ Some previously published data have been revised.2/ Medium and large businesses, institutional, and government customers.
Table 1
End-User Switched Access Lines Reported 1/
Date % Residential & Small
Businesses
Reporting CLECs
Table 2 (Revised March 6, 2002)
End-User Switched Access Lines by Customer Type 1/
8,194,243
9,481,656
6,977,880
8,250,938
11,557,381
17,274,728
14,871,409
CLECs Reporting
81 8,194 66.8 % 2,723 33.2 %
78 11,557 65.0 4,042 35.0
89 14,871 64.9 5,217 35.1
91 17,275 66.6 5,776 33.4
1/ Some previously published data have been revised.2/ Lines acquired from other carriers as UNE loops or under resale arrangements.3/ Lines provided over CLEC-owned "last-mile" facilities.
Lines Provided to Other Carriers
Total UNEs and Resold
Lines
Dec 1997 9 159,008 157,132 133 1,876 1.2 %
Jun 1998 8 161,810 159,118 244 2,692 1.7
Dec 1998 7 164,614 161,191 361 3,423 2.1
Jun 1999 7 167,177 162,909 685 4,268 2.6
Dec 1999 168 187,294 181,308 1,493 5,987 3.2
Jun 2000 159 188,171 179,762 3,312 8,409 4.5
Dec 2000 166 188,346 177,684 5,274 10,662 5.7
Jun 2001 156 186,825 174,486 7,922 12,340 6.6
1/ Some previously published data have been revised.
Reporting Incumbent Local Exchange Carriers 1/(End-User Switched Access Lines in Thousands)
Table 3Reporting Competitive Local Exchange Carriers 1/
(End-User Switched Access Lines in Thousands)
Acquired Lines CLEC-Owned
1,959
Jun 2001
2/ Data for December 1997 through June 1999 are from Common Carrier Bureau voluntary surveys. Starting with December 1999, data are from FCC Form 477 filings.
Percent of Total Lines
Table 4
Date 2/ILECs
ReportingUNEs without
SwitchingResold Lines
Total Lines
End-User Lines
UNEs with Switching
UNEs 2/Date Resold Lines 2/
Dec 1999
Jun 2000
Dec 2000
Total End-User Lines
3,513
4,315
Total UNEs
3,201
5,540
PercentPercent
5,471
7,516
9,655
Lines 3/Total Lines Acquired
4,114
3,919
2,448
1,743
7,580 11,499
4,761
4,494
5,098
5,388
4,417
1,004
1,696
2,436
3,161
2,838
3,062
3,583
489
1,616
Lines (000s)
Lines (000s)
Lines (000s)
10 0 % 1,876 11 % 1,887 1 %
1 0 34 0 36 0
174,474 100 15,364 89 189,838 99
Total 174,486 100 % 17,275 100 % 191,760 100 %
Fixed Wireless
Percent
Other (Including Traditional Wireline)
Percent Percent
Coaxial Cable
TotalILECsTechnology CLECs
Table 5 End-User Switched Access Lines by Type of Technology, in Thousands
(As of June 30, 2001)
State ILECs CLECs Total
Alabama 2,413,440 121,059 2,534,499 5 %Alaska 474,215 * * *Arizona 3,062,586 231,777 3,294,363 7Arkansas 1,412,863 * * *California 23,103,077 1,668,232 24,771,309 7Colorado 2,805,532 325,983 3,131,515 10Connecticut 2,363,687 164,379 2,528,066 7Delaware 567,381 0 567,381 0District of Columbia 887,590 124,630 1,012,220 12Florida 11,211,674 864,892 12,076,566 7Georgia 4,905,002 515,730 5,420,732 10Hawaii 739,979 * * *Idaho 732,814 * * *Illinois 7,558,613 1,113,112 8,671,725 13Indiana 3,576,710 180,221 3,756,931 5Iowa 1,379,872 164,637 1,544,509 11Kansas 1,441,940 121,294 1,563,234 8Kentucky 2,170,191 * * *Louisiana 2,505,961 108,820 2,614,781 4Maine 801,649 * * *Maryland 3,599,027 211,499 3,810,526 6Massachusetts 4,131,520 576,442 4,707,962 12Michigan 6,027,730 583,653 6,611,383 9Minnesota 2,861,684 353,246 3,214,930 11Mississippi 1,356,136 51,496 1,407,632 4Missouri 3,446,252 224,442 3,670,694 6Montana 527,989 * * *Nebraska 931,979 * * *Nevada 1,366,124 144,453 1,510,577 10New Hampshire 775,864 67,315 843,179 8New Jersey 6,707,243 300,594 7,007,837 4New Mexico 977,439 * * *New York 10,689,293 3,138,133 13,827,426 23North Carolina 4,664,775 323,594 4,988,369 6North Dakota 312,573 * * *Ohio 6,876,434 280,088 7,156,522 4Oklahoma 1,923,027 125,912 2,048,939 6Oregon 2,079,221 118,425 2,197,646 5Pennsylvania 7,818,599 1,122,623 8,941,222 13Puerto Rico 1,300,665 * * *Rhode Island 604,128 69,237 673,365 10South Carolina 2,239,383 90,241 2,329,624 4South Dakota 338,834 * * *Tennessee 3,352,224 272,211 3,624,435 8Texas 11,496,247 1,891,131 13,387,378 14Utah 1,149,667 145,603 1,295,270 11Vermont 399,084 * * *Virgin Islands 70,426 0 70,426 0Virginia 4,203,412 402,528 4,605,940 9Washington 3,751,683 229,693 3,981,376 6West Virginia 980,575 * * *Wisconsin 3,151,854 322,735 3,474,589 9Wyoming 259,839 * * *
Nationwide 174,485,706 17,274,728 191,760,434 9 %
Note: Carriers with under 10,000 lines in a state were not required to report.
* Data withheld to maintain firm confidentiality.
CLEC Share
Table 6End-User Switched Access Lines Served
(As of June 30, 2001)by Reporting Local Exchange Carriers
State
Alabama 5 % 3 % 4 % 5 %Alaska * * * *Arizona * 5 5 7Arkansas * * * *California 4 5 6 7Colorado 5 7 9 10Connecticut 3 5 6 7Delaware * * * 0District of Columbia 7 7 9 12Florida 6 6 6 7Georgia 5 6 8 10Hawaii * * 0 *Idaho 0 0 * *Illinois 5 7 9 13Indiana 3 4 5 5Iowa * 9 11 11Kansas * 5 7 8Kentucky 2 * 3 *Louisiana 3 2 3 4Maine * * * *Maryland 2 3 4 6Massachusetts 6 8 11 12Michigan 3 5 6 9Minnesota 6 7 9 11Mississippi 4 * 4 4Missouri 3 5 6 6Montana * * * *Nebraska * * * *Nevada * * * 10New Hampshire * * 6 8New Jersey * 4 5 4New Mexico * * * *New York 9 16 20 23North Carolina 3 4 4 6North Dakota * * * *Ohio 4 4 4 4Oklahoma * * 5 6Oregon 2 3 5 5Pennsylvania 5 8 10 13Puerto Rico 0 * * *Rhode Island * * * 10South Carolina * * 4 4South Dakota * * * *Tennessee 4 6 6 8Texas 4 7 13 14Utah 3 6 10 11Vermont * * * *Virgin Islands 0 0 0 0Virginia 2 5 7 9Washington 4 5 6 6West Virginia * * * *Wisconsin 5 7 8 9Wyoming * * * *
Nationwide 4 % 6 % 8 % 9 %
Note: Carriers with under 10,000 lines in a state were not required to report.
* Data withheld to maintain firm confidentiality.
1/ Some previously published data have been revised.
Jun 2001
Table 7Competitive Local Exchange Carrier Share
Dec 1999 Jun 2000 Dec 2000
of End-User Switched Access Lines 1/
State ILECs CLECs Total
Alabama 9 7 16 Alaska 4 2 6 Arizona 3 8 11 Arkansas 4 1 5 California 6 14 20 Colorado 3 6 9 Connecticut 2 5 7 Delaware 1 0 1 District of Columbia 1 6 7 Florida 9 18 27 Georgia 13 16 29 Hawaii 1 1 2 Idaho 5 2 7 Illinois 6 13 19 Indiana 7 7 14 Iowa 6 4 10 Kansas 4 5 9 Kentucky 11 3 14 Louisiana 6 8 14 Maine 6 3 9 Maryland 1 9 10 Massachusetts 2 10 12 Michigan 6 11 17 Minnesota 16 11 27 Mississippi 5 5 10 Missouri 7 7 14 Montana 7 2 9 Nebraska 6 3 9 Nevada 5 4 9 New Hampshire 4 4 8 New Jersey 3 7 10 New Mexico 4 1 5 New York 8 23 31 North Carolina 13 13 26 North Dakota 8 2 10 Ohio 9 9 18 Oklahoma 9 6 15 Oregon 7 4 11 Pennsylvania 10 19 29 Puerto Rico 1 1 2 Rhode Island 1 4 5 South Carolina 12 7 19 South Dakota 7 2 9 Tennessee 12 9 21 Texas 12 27 39 Utah 5 4 9 Vermont 4 2 6 Virgin Islands 1 0 1 Virginia 5 11 16 Washington 7 8 15 West Virginia 2 1 3 Wisconsin 9 8 17 Wyoming 2 1 3
Nationwide - Unduplicated 156 91 247 155 Total State Filings 1/ 317 364 681 Required Filings 1/ 304 340 644 Voluntary Filings 1/ 13 24 37
1/ Each report represents all of a company's operations in a given state. Carriers with both ILEC and CLEC operations in the same state provide separate reports.
Table 8Number of Reporting Local Exchange Carriers
(As of June 30, 2001)
StateAlabama 83 % 8 % 80 %Alaska 81 * *Arizona 76 39 73 Arkansas 85 * *California 81 39 78 Colorado 73 52 71 Connecticut 86 45 84 Delaware 67 0 67 District of Columbia 33 13 31 Florida 83 29 79 Georgia 78 40 74 Hawaii 84 * *Idaho 76 * *Illinois 74 52 71 Indiana 78 22 75 Iowa 73 52 71 Kansas 87 21 82 Kentucky 83 * *Louisiana 81 11 78 Maine 79 * *Maryland 64 23 62 Massachusetts 67 46 64 Michigan 77 50 75 Minnesota 72 31 68 Mississippi 81 48 80 Missouri 84 22 80 Montana 79 * *Nebraska 74 * *Nevada 73 35 69 New Hampshire 74 48 72 New Jersey 68 13 66 New Mexico 79 * *New York 65 65 65 North Carolina 81 20 77 North Dakota 71 * *Ohio 78 13 76 Oklahoma 86 28 83 Oregon 76 37 74 Pennsylvania 71 49 69 Puerto Rico 90 * *Rhode Island 69 58 68 South Carolina 82 6 79 South Dakota 70 * *Tennessee 83 16 78 Texas 85 57 81 Utah 73 37 69 Vermont 74 * *Virgin Islands 99 0 99 Virginia 68 58 67 Washington 76 36 74 West Virginia 74 * *Wisconsin 80 32 75 Wyoming 68 * *77 46 74 Nationwide 77 % 45 % 74 %
* Data withheld to maintain firm confidentiality.
ILECs CLECs
Table 9Percentage of Lines Provided to Residential
and Small Business Customers(As of June 30, 2001)
Total
State
Jun 2001 Reporting Carriers 1/
Subscribers Dec 1999
Subscribers Jun 2000
Subscribers Dec 2000 3/
Subscribers Jun 2001
Alabama 12 1 % 1,080,410 1,253,084 1,386,294 1,930,631 54 %Alaska 5 10 165,221 169,892 * 218,424 29Arizona 13 3 1,125,321 1,624,668 1,855,115 2,018,410 24Arkansas 6 2 719,919 715,467 743,928 891,275 25California 12 5 8,544,941 12,283,369 12,710,520 14,184,625 15Colorado 9 3 1,552,718 1,654,989 1,856,075 1,983,405 20Connecticut 6 9 1,077,089 1,136,618 1,277,123 1,418,367 25Delaware 5 6 270,848 275,219 371,014 389,284 41District of Columbia 6 9 910,116 4/ 928,962 987,323 N.M.Florida 9 7 5,158,079 4,983,478 6,369,985 7,536,670 51Georgia 14 4 2,538,983 2,687,238 2,754,784 4,076,119 52Guam * * * * 0 * *Hawaii 6 2 288,425 454,364 524,291 543,283 20Idaho 7 3 271,436 296,066 344,564 398,781 35Illinois 10 9 3,922,482 4,309,660 5,143,767 5,621,044 30Indiana 9 5 1,318,975 1,717,378 1,715,074 1,781,247 4Iowa 8 7 774,773 975,629 832,106 861,382 (12)Kansas 10 3 669,472 724,024 801,293 901,225 24Kentucky 9 1 911,700 999,544 1,026,334 1,176,756 18Louisiana 12 3 1,227,106 1,294,693 1,306,457 1,677,292 30Maine 5 3 187,003 283,640 359,786 399,616 41Maryland 8 4 1,473,494 4/ 1,982,477 2,134,125 N.M.Massachusetts 6 4 1,892,014 2,228,169 2,649,130 2,753,685 24Michigan 10 9 3,512,813 3,423,535 3,551,719 4,071,091 19Minnesota 12 7 1,550,411 1,595,560 1,851,430 2,014,317 26Mississippi 9 4 673,355 509,038 786,577 993,781 95Missouri 9 4 1,855,452 1,848,775 1,767,411 1,937,684 5Montana * * * * * * *Nebraska 5 2 576,296 600,885 659,380 712,685 19Nevada 6 3 750,335 825,163 684,752 766,581 (7)New Hampshire 7 13 280,508 309,263 387,264 445,181 44New Jersey 6 1 2,289,181 2,750,024 3,575,130 3,896,778 42New Mexico 8 8 363,827 395,111 443,343 619,582 57New York 9 11 4,833,816 5,016,524 5,918,136 6,749,096 35North Carolina 11 4 2,536,068 2,730,178 3,105,811 3,377,331 24North Dakota * * * * * * *Ohio 12 6 3,237,786 3,278,960 4,150,498 4,255,934 30Oklahoma 12 3 826,637 979,513 1,124,214 1,200,234 23Oregon 8 3 914,848 1,082,425 1,201,207 1,268,909 17Pennsylvania 12 5 2,767,474 3,850,372 4,129,186 4,378,216 14Puerto Rico 5 21 * 1,090,005 757,613 1,374,747 26Rhode Island 6 5 279,304 313,550 355,889 401,805 28South Carolina 8 9 1,137,232 1,236,338 1,392,586 1,502,345 22South Dakota * * * * * * *Tennessee 11 1 1,529,054 1,876,444 1,985,851 2,251,208 20Texas 16 5 5,792,453 6,705,423 7,548,537 8,294,338 24Utah 10 3 643,824 692,006 750,244 833,492 20Vermont * * * * * * *Virgin Islands * * * 0 0 * *Virginia 11 4 1,860,262 4/ 2,450,289 2,767,247 N.M.Washington 9 4 1,873,475 2,144,767 2,286,082 2,493,214 16West Virginia 9 6 241,265 347,916 392,384 452,036 30Wisconsin 10 7 1,525,818 1,342,908 1,698,520 2,008,679 50Wyoming 4 3 127,634 * * 173,939 *
Nationwide 72 5 % 79,696,083 90,643,058 101,043,219 114,028,928 26 %
N.M. - Not meaningful.* Data withheld to maintain firm confidentiality.1/ Carriers with under 10,000 subscribers in a state were not required to report.2/ Percentage of mobile wireless subscribers receiving their service from a mobile wireless reseller.3/ Data for December 2000 have been revised.4/ At the end of June 2000, the District of Columbia, Maryland, and Virginia had a total of 4.8 million subscribers. The state-by-state totals for these individual states were inconsistently reported at the end of June 2000 compared to the other filing periods.
Jun 2001 Percent
Resold 2/Percent Change Jun 00 - Jun 01
Table 10Mobile Wireless Telephone Subscribers 1/

Number of CLECs 0 46.6 % 40.0 % 1 19.7 16.3 2 9.1 9.9 3 6.9 8.2 4 5.0 5.6 5 3.9 4.1 6 2.4 3.3 7 1.6 2.6 8 1.2 2.2 9 1.1 1.7
10 or More 2.5 5.9
1/ Data for June 2000 have been revised.
Households Percentage
14,961,004 14.5 % 9.5 %
13,916,596 13.5 9.012,347,623 11.9 8.812,926,647 12.5 11.511,440,264 11.1 10.19,885,363 9.6 8.76,604,080 6.4 7.64,448,655 4.3 6.03,824,159 3.7 5.63,865,944 3.7 4.5
10 2,910,477 2.8 4.3 11 2,614,329 2.5 3.7 12 1,398,600 1.4 3.2 13 762,738 0.7 2.6 14 630,526 0.6 1.6 15 306,073 0.3 1.0 16 247,495 0.2 0.8 17 166,946 0.2 0.5 18 111,027 0.1 0.5
> 18 10,121 0.0 0.6
1/ Data for June 2000 have been revised.
Source: Demographic Power Pack, Current Year Update (2000), MapInfo Corporation.
Households in Zip Codes with Competitive Local Exchange Carriers
June 2001
8 9
3 4
7
5 6
2
0 1
Households
11,917,810
9,868,758 9,263,142 9,049,456
10,404,061 9,013,244 7,817,760 6,237,933
PercentageNumber of CLECs
with Competitive Local Exchange Carriers
Table 11Percentage of Zip Codes
June 2000 1/ June 2001
June 2000 1/
Table 12
5,746,855 4,661,435 4,408,375 3,786,700 3,300,413 2,671,838 1,667,014 1,073,135
815,304 490,565 530,607 654,262
State Alabama 44 % 48 % 5 % 3 % 0 % 0 %Alaska 74 26 0 0 0 0Arizona 36 30 9 10 6 9Arkansas 92 8 0 0 0 0California 16 36 7 7 6 29Colorado 44 35 4 7 8 3Connecticut 0 79 17 4 0 0Delaware 100 0 0 0 0 0District of Columbia 19 30 7 26 19 0Florida 3 18 6 7 8 57Georgia 11 36 8 5 6 34Hawaii 63 37 0 0 0 0Idaho 60 40 0 0 0 0Illinois 52 23 3 2 2 19Indiana 56 38 2 1 2 0Iowa 77 23 0 0 0 0Kansas 64 34 2 0 0 0Kentucky 77 23 0 0 0 0Louisiana 33 36 8 5 6 12Maine 37 63 0 0 0 0Maryland 4 60 7 11 10 8Massachusetts 1 31 12 12 18 26Michigan 20 54 7 5 6 9Minnesota 48 35 7 7 3 0Mississippi 7 83 10 0 0 0Missouri 64 24 5 4 3 0Montana 96 4 0 0 0 0Nebraska 56 44 0 0 0 0Nevada 27 73 0 0 0 0New Hampshire 3 89 8 0 0 0New Jersey 2 66 17 10 4 0New Mexico 95 5 0 0 0 0New York 6 24 10 7 6 48North Carolina 13 53 9 7 4 15North Dakota 93 7 0 0 0 0Ohio 47 33 10 7 2 0Oklahoma 64 27 7 2 0 0Oregon 18 77 5 0 0 0Pennsylvania 23 42 6 4 5 20Puerto Rico 81 19 0 0 0 0Rhode Island 3 78 19 0 0 0South Carolina 43 37 7 8 5 0South Dakota 89 11 0 0 0 0Tennessee 50 27 5 6 4 7Texas 14 29 6 4 5 43Utah 49 40 11 0 0 0Vermont 15 85 0 0 0 0Virginia 54 30 6 6 3 1Washington 38 36 11 5 6 4West Virginia 99 1 0 0 0 0Wisconsin 59 28 6 5 1 0Wyoming 70 30 0 0 0 0 Nationwide 40 % 34 % 6 % 4 % 3 % 12 %
Zero One - Three Six
Table 13Percentage of Zip Codes with Competitive Local Exchange Carriers
(As of June 30, 2001)Number of CLECs
Seven or MoreFour Five
Reporting CLECs by Zip Code(As of June 30, 2001)
Number of Reporting CLECs
7 or more4 to 61 to 3
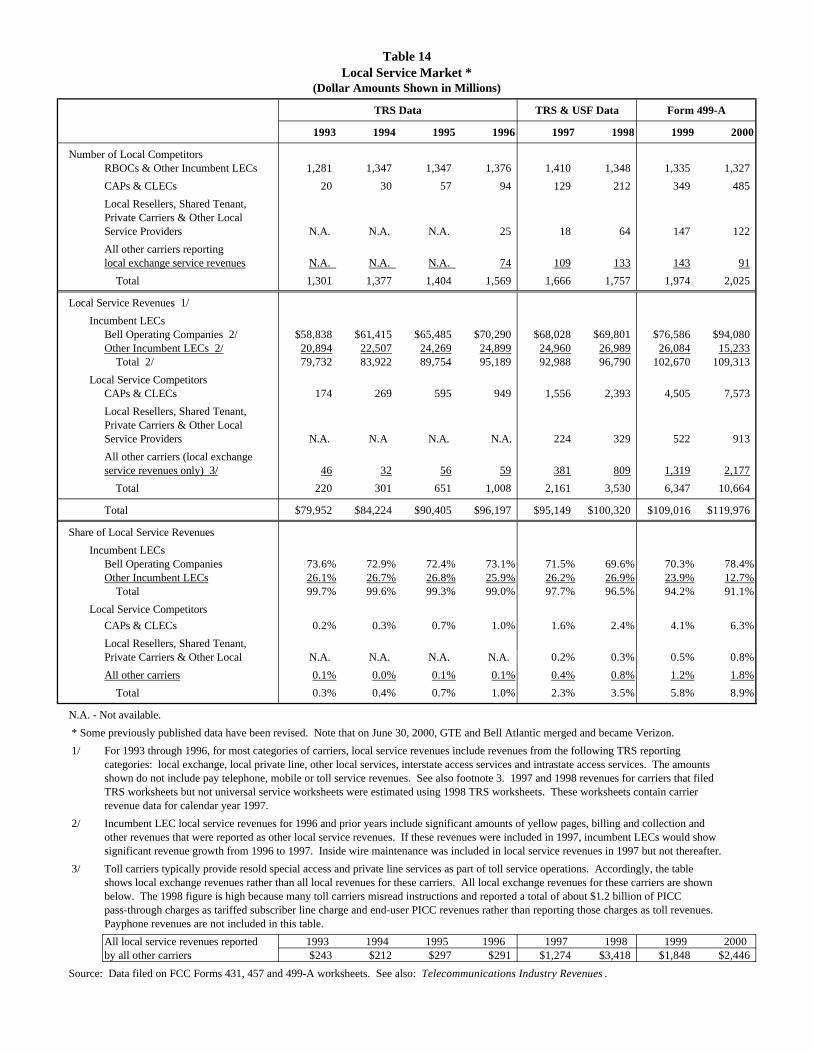
Table 14Local Service Market *
(Dollar Amounts Shown in Millions)
TRS Data TRS & USF Data Form 499-A
1993 1994 1995 1996 1997 1998 1999 2000
Number of Local CompetitorsRBOCs & Other Incumbent LECs 1,281 1,347 1,347 1,376 1,410 1,348 1,335 1,327
CAPs & CLECs 20 30 57 94 129 212 349 485
Local Resellers, Shared Tenant,Private Carriers & Other LocalService Providers N.A. N.A. N.A. 25 18 64 147 122
All other carriers reporting local exchange service revenues N.A. N.A. N.A. 74 109 133 143 91
Total 1,301 1,377 1,404 1,569 1,666 1,757 1,974 2,025
Local Service Revenues 1/
Incumbent LECsBell Operating Companies 2/ $58,838 $61,415 $65,485 $70,290 $68,028 $69,801 $76,586 $94,080Other Incumbent LECs 2/ 20,894 22,507 24,269 24,899 24,960 26,989 26,084 15,233 Total 2/ 79,732 83,922 89,754 95,189 92,988 96,790 102,670 109,313
Local Service CompetitorsCAPs & CLECs 174 269 595 949 1,556 2,393 4,505 7,573
Local Resellers, Shared Tenant,Private Carriers & Other LocalService Providers N.A. N.A N.A. N.A. 224 329 522 913
All other carriers (local exchangeservice revenues only) 3/ 46 32 56 59 381 809 1,319 2,177
Total 220 301 651 1,008 2,161 3,530 6,347 10,664
Total $79,952 $84,224 $90,405 $96,197 $95,149 $100,320 $109,016 $119,976
Share of Local Service Revenues
Incumbent LECsBell Operating Companies 73.6% 72.9% 72.4% 73.1% 71.5% 69.6% 70.3% 78.4%Other Incumbent LECs 26.1% 26.7% 26.8% 25.9% 26.2% 26.9% 23.9% 12.7% Total 99.7% 99.6% 99.3% 99.0% 97.7% 96.5% 94.2% 91.1%
Local Service Competitors
CAPs & CLECs 0.2% 0.3% 0.7% 1.0% 1.6% 2.4% 4.1% 6.3%
Local Resellers, Shared Tenant,Private Carriers & Other Local N.A. N.A. N.A. N.A. 0.2% 0.3% 0.5% 0.8%
All other carriers 0.1% 0.0% 0.1% 0.1% 0.4% 0.8% 1.2% 1.8%
Total 0.3% 0.4% 0.7% 1.0% 2.3% 3.5% 5.8% 8.9%
N.A. - Not available.
* Some previously published data have been revised. Note that on June 30, 2000, GTE and Bell Atlantic merged and became Verizon.
1/ For 1993 through 1996, for most categories of carriers, local service revenues include revenues from the following TRS reporting categories: local exchange, local private line, other local services, interstate access services and intrastate access services. The amounts shown do not include pay telephone, mobile or toll service revenues. See also footnote 3. 1997 and 1998 revenues for carriers that filed TRS worksheets but not universal service worksheets were estimated using 1998 TRS worksheets. These worksheets contain carrier revenue data for calendar year 1997.
2/ Incumbent LEC local service revenues for 1996 and prior years include significant amounts of yellow pages, billing and collection and other revenues that were reported as other local service revenues. If these revenues were included in 1997, incumbent LECs would show significant revenue growth from 1996 to 1997. Inside wire maintenance was included in local service revenues in 1997 but not thereafter.
3/ Toll carriers typically provide resold special access and private line services as part of toll service operations. Accordingly, the table shows local exchange revenues rather than all local revenues for these carriers. All local exchange revenues for these carriers are shown below. The 1998 figure is high because many toll carriers misread instructions and reported a total of about $1.2 billion of PICC pass-through charges as tariffed subscriber line charge and end-user PICC revenues rather than reporting those charges as toll revenues. Payphone revenues are not included in this table.
All local service revenues reported 1993 1994 1995 1996 1997 1998 1999 2000by all other carriers $243 $212 $297 $291 $1,274 $3,418 $1,848 $2,446
Source: Data filed on FCC Forms 431, 457 and 499-A worksheets. See also: Telecommunications Industry Revenues .
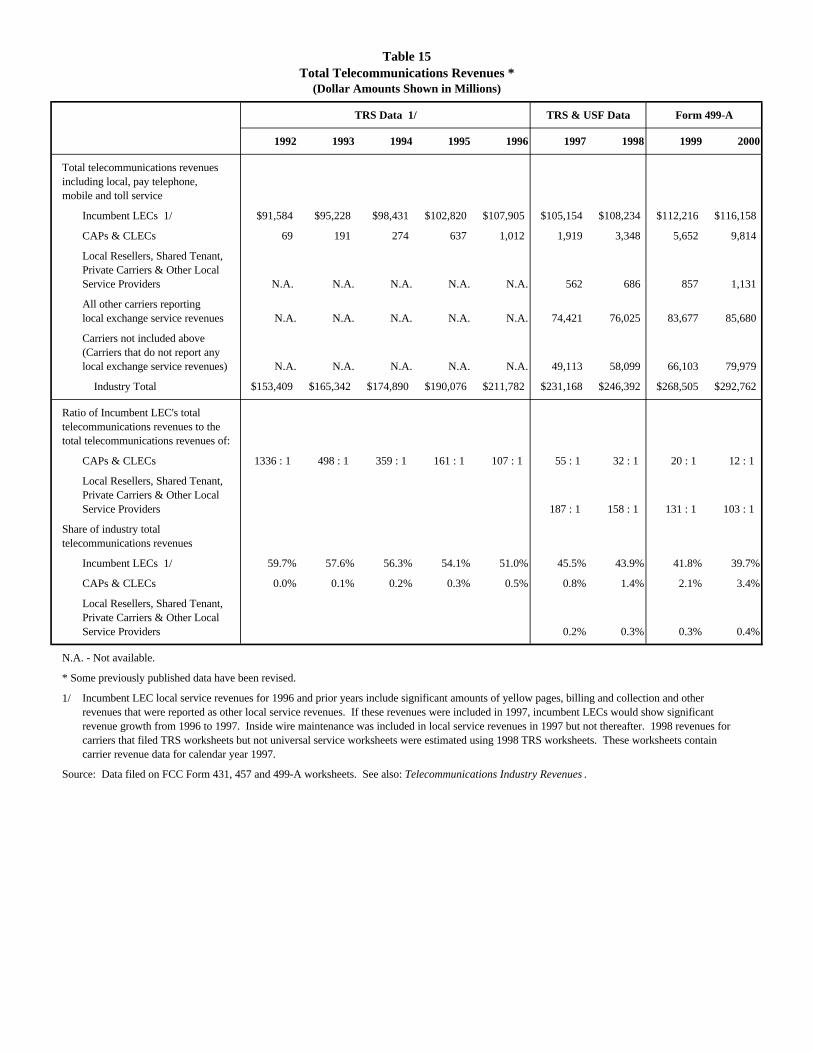
Table 15Total Telecommunications Revenues *
(Dollar Amounts Shown in Millions)
TRS Data 1/ TRS & USF Data Form 499-A
1992 1993 1994 1995 1996 1997 1998 1999 2000
Total telecommunications revenues including local, pay telephone, mobile and toll service
Incumbent LECs 1/ $91,584 $95,228 $98,431 $102,820 $107,905 $105,154 $108,234 $112,216 $116,158
CAPs & CLECs 69 191 274 637 1,012 1,919 3,348 5,652 9,814
Local Resellers, Shared Tenant,Private Carriers & Other Local Service Providers N.A. N.A. N.A. N.A. N.A. 562 686 857 1,131
All other carriers reporting local exchange service revenues N.A. N.A. N.A. N.A. N.A. 74,421 76,025 83,677 85,680
Carriers not included above(Carriers that do not report anylocal exchange service revenues) N.A. N.A. N.A. N.A. N.A. 49,113 58,099 66,103 79,979
Industry Total $153,409 $165,342 $174,890 $190,076 $211,782 $231,168 $246,392 $268,505 $292,762
Ratio of Incumbent LEC's total telecommunications revenues to thetotal telecommunications revenues of:
CAPs & CLECs 1336 : 1 498 : 1 359 : 1 161 : 1 107 : 1 55 : 1 32 : 1 20 : 1 12 : 1
Local Resellers, Shared Tenant,Private Carriers & Other Local Service Providers 187 : 1 158 : 1 131 : 1 103 : 1
Share of industry total telecommunications revenues
Incumbent LECs 1/ 59.7% 57.6% 56.3% 54.1% 51.0% 45.5% 43.9% 41.8% 39.7%
CAPs & CLECs 0.0% 0.1% 0.2% 0.3% 0.5% 0.8% 1.4% 2.1% 3.4%
Local Resellers, Shared Tenant,Private Carriers & Other Local Service Providers 0.2% 0.3% 0.3% 0.4%
N.A. - Not available.
* Some previously published data have been revised.
1/ Incumbent LEC local service revenues for 1996 and prior years include significant amounts of yellow pages, billing and collection and other revenues that were reported as other local service revenues. If these revenues were included in 1997, incumbent LECs would show significant revenue growth from 1996 to 1997. Inside wire maintenance was included in local service revenues in 1997 but not thereafter. 1998 revenues forcarriers that filed TRS worksheets but not universal service worksheets were estimated using 1998 TRS worksheets. These worksheets contain carrier revenue data for calendar year 1997.
Source: Data filed on FCC Form 431, 457 and 499-A worksheets. See also: Telecommunications Industry Revenues .
Customer Response
Publication: Local Telephone Competition: Status as of June 30, 2001.
You can help us provide the best possible information to the public by completing this form and returning itto the Industry Analysis Division of the FCC's Common Carrier Bureau.
1. Please check the category that best describes you:____ press____ current telecommunications carrier____ potential telecommunications carrier____ business customer evaluating vendors/service options____ consultant, law firm, lobbyist____ other business customer____ academic/student____ residential customer____ FCC employee____ other federal government employee____ state or local government employee____ Other (please specify)
2. Please rate the report: Excellent Good Satisfactory Poor No opinionData accuracy (_) (_) (_) (_) (_)Data presentation (_) (_) (_) (_) (_)Timeliness of data (_) (_) (_) (_) (_)Completeness of data (_) (_) (_) (_) (_)Text clarity (_) (_) (_) (_) (_)Completeness of text (_) (_) (_) (_) (_)
3. Overall, how do you Excellent Good Satisfactory Poor No opinionrate this report? (_) (_) (_) (_) (_)
4. How can this report be improved?
5. May we contact you to discuss possible improvements?Name:Telephone #:
To discuss the information in this report, contact: 202-418-0940or for users of TTY equipment, call 202-418-0484
Fax this response to or Mail this response to
202-418-0520 FCC/IAD Mail Stop 1600 F
Washington, DC 20554


![FOR IMMEDIATE RELEASE Contact: Sara Sciammacco; [email protected]](https://img.pdfslide.net/doc/110x75/613d0f56736caf36b758d673/for-immediate-release-contact-sara-sciammacco-emailprotected.jpg)