Embed Size (px)
Citation preview
CONTACT:
Debra McConnell
Global Communications FOR IMMEDIATE RELEASE
(508) 390-2323 Wednesday, August 18, 2021
THE TJX COMPANIES, INC. REPORTS ABOVE-PLAN Q2 FY22 SALES AND PROFIT RESULTS;
Q2 FY22 OVERALL OPEN-ONLY COMP STORE SALES INCREASED 20% VERSUS Q2 FY20
Q2 FY22 overall open-only comp store sales increased 20% over Q2 FY20
Q2 FY22 net sales were $12.1 billion, an increase of 23% compared to Q2 FY20
Q2 FY22 total segment profit grew by $336 million to $1.5 billion, a 29% increase compared to Q2 FY20
Q2 FY22 diluted earnings per share were $.64, which includes a debt extinguishment charge of $.15 per share,
compared to earnings per share of $.62 in Q2 FY20
The Company estimates that temporary store closures for approximately 3% of the second quarter, primarily
stores in Canada, Europe, and Australia, negatively impacted Q2 FY22 sales by approximately $300 million to
$350 million, pretax profit margin by an estimated 0.6 percentage points, and EPS by approximately $.05 to $.07
(see below)
Returned $614 million to shareholders in the second quarter through share repurchases and dividends
Increased range for expected full year FY22 share repurchases by $250 million to $1.25 billion to $1.50 billion
Sales are very strong to start Q3 FY22, with overall open-only comp store sales up mid-teens over Q3 FY20
Framingham, MA -- The TJX Companies, Inc. (NYSE: TJX), the leading off-price apparel and home fashions
retailer in the U.S. and worldwide, today announced sales and operating results for the second quarter ended July 31,
2021. Net sales for the second quarter of Fiscal 2022 were $12.1 billion, an increase of 81% versus the second quarter
of Fiscal 2021 in which stores were closed for approximately 31% of the quarter due to the COVID-19 global pandemic
(see table below). Net sales for the second quarter of Fiscal 2022 increased 23% versus the second quarter of Fiscal
2020. Overall open-only comp store sales (defined below) increased 20% compared to the second quarter of Fiscal
2020. Net income for the second quarter was $786 million. Second quarter diluted earnings per share were $.64, which
includes a debt extinguishment charge (described below) of $.15 per share, versus $.62 per share in the second quarter
of Fiscal 2020. The Company estimates that temporary store closures for approximately 3% of the second quarter
negatively impacted earnings per share by about $.05 to $.07, based on the Company’s estimates of profit dollars on
lost sales of approximately $300 million to $350 million (see below).
For the first half of Fiscal 2022, net sales were $22.2 billion, an increase of 100% versus the first half of Fiscal
2021 in which stores were closed for approximately 41% of the first half of the year due to the COVID-19 global
pandemic (see table below). Net sales for the first half of Fiscal 2022 increased 16% versus the first half of Fiscal 2020.
Overall open-only comp store sales increased 18% compared to the first half of Fiscal 2020. Net income for the first
half of Fiscal 2022 was $1.3 billion. For the first half of Fiscal 2022, diluted earnings per share were $1.08, which
includes a second quarter debt extinguishment charge of $.15 per share. The Company estimates that temporary store
closures for approximately 8% of the first half of Fiscal 2022 negatively impacted earnings per share by about $.26 to
$.31, based on the Company’s estimates of profit dollars on lost sales of approximately $1.40 billion to $1.55 billion
(see below).
-MORE-
THE TJX COMPANIES, INC. REPORTS ABOVE-PLAN Q2 FY22 SALES AND PROFIT RESULTS;
Q2 FY22 OVERALL OPEN-ONLY COMP STORE SALES INCREASED 20% VERSUS Q2 FY20
Wednesday, August 18, 2021
Page 2
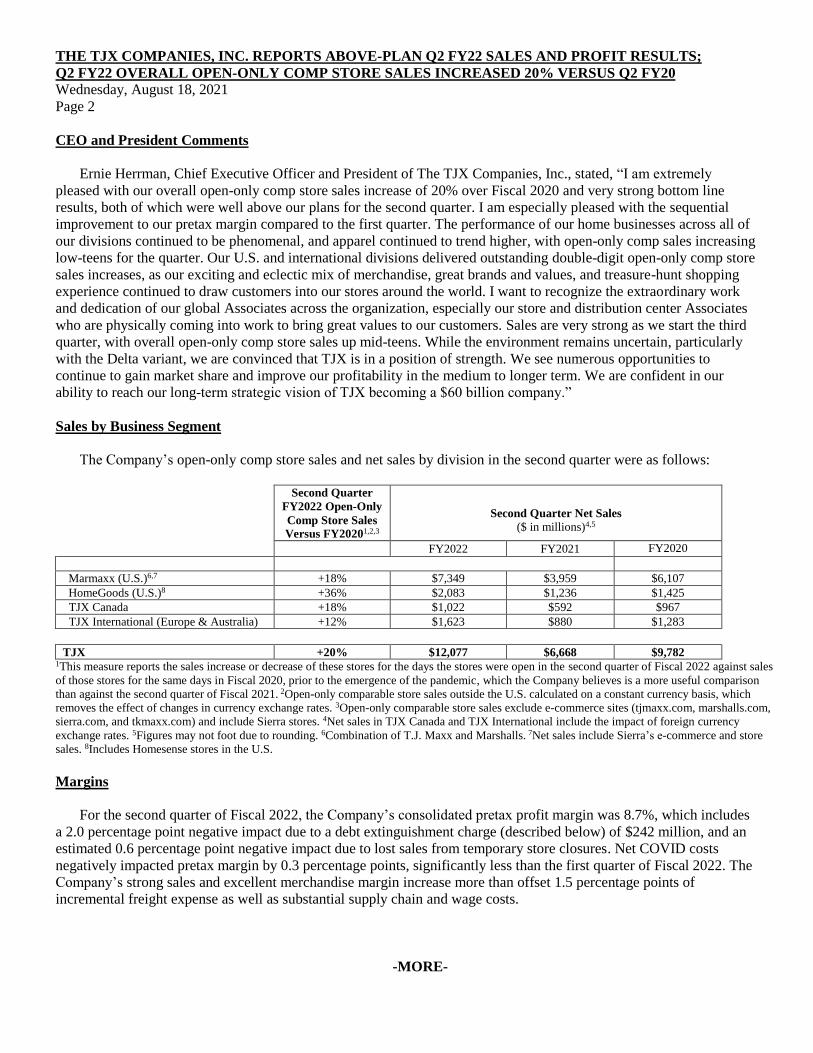
CEO and President Comments
Ernie Herrman, Chief Executive Officer and President of The TJX Companies, Inc., stated, “I am extremely
pleased with our overall open-only comp store sales increase of 20% over Fiscal 2020 and very strong bottom line
results, both of which were well above our plans for the second quarter. I am especially pleased with the sequential
improvement to our pretax margin compared to the first quarter. The performance of our home businesses across all of
our divisions continued to be phenomenal, and apparel continued to trend higher, with open-only comp sales increasing
low-teens for the quarter. Our U.S. and international divisions delivered outstanding double-digit open-only comp store
sales increases, as our exciting and eclectic mix of merchandise, great brands and values, and treasure-hunt shopping
experience continued to draw customers into our stores around the world. I want to recognize the extraordinary work
and dedication of our global Associates across the organization, especially our store and distribution center Associates
who are physically coming into work to bring great values to our customers. Sales are very strong as we start the third
quarter, with overall open-only comp store sales up mid-teens. While the environment remains uncertain, particularly
with the Delta variant, we are convinced that TJX is in a position of strength. We see numerous opportunities to
continue to gain market share and improve our profitability in the medium to longer term. We are confident in our
ability to reach our long-term strategic vision of TJX becoming a $60 billion company.”
Sales by Business Segment
The Company’s open-only comp store sales and net sales by division in the second quarter were as follows:
Second Quarter
FY2022 Open-Only
Comp Store Sales
Versus FY20201,2,3
Second Quarter Net Sales
($ in millions)4,5
FY2022 FY2021 FY2020
Marmaxx (U.S.)6,7 +18% $7,349 $3,959 $6,107
HomeGoods (U.S.)8 +36% $2,083 $1,236 $1,425
TJX Canada +18% $1,022 $592 $967
TJX International (Europe & Australia) +12% $1,623 $880 $1,283
TJX +20% $12,077 $6,668 $9,782 1This measure reports the sales increase or decrease of these stores for the days the stores were open in the second quarter of Fiscal 2022 against sales
of those stores for the same days in Fiscal 2020, prior to the emergence of the pandemic, which the Company believes is a more useful comparison
than against the second quarter of Fiscal 2021. 2Open-only comparable store sales outside the U.S. calculated on a constant currency basis, which
removes the effect of changes in currency exchange rates. 3Open-only comparable store sales exclude e-commerce sites (tjmaxx.com, marshalls.com,
sierra.com, and tkmaxx.com) and include Sierra stores. 4Net sales in TJX Canada and TJX International include the impact of foreign currency
exchange rates. 5Figures may not foot due to rounding. 6Combination of T.J. Maxx and Marshalls. 7Net sales include Sierra’s e-commerce and store
sales. 8Includes Homesense stores in the U.S.
Margins
For the second quarter of Fiscal 2022, the Company’s consolidated pretax profit margin was 8.7%, which includes
a 2.0 percentage point negative impact due to a debt extinguishment charge (described below) of $242 million, and an
estimated 0.6 percentage point negative impact due to lost sales from temporary store closures. Net COVID costs
negatively impacted pretax margin by 0.3 percentage points, significantly less than the first quarter of Fiscal 2022. The
Company’s strong sales and excellent merchandise margin increase more than offset 1.5 percentage points of
incremental freight expense as well as substantial supply chain and wage costs.
-MORE-

THE TJX COMPANIES, INC. REPORTS ABOVE-PLAN Q2 FY22 SALES AND PROFIT RESULTS;
Q2 FY22 OVERALL OPEN-ONLY COMP STORE SALES INCREASED 20% VERSUS Q2 FY20
Wednesday, August 18, 2021
Page 3
Inventory
Total inventories as of July 31, 2021 were $5.1 billion, compared with $5.1 billion at the end of the second quarter
of Fiscal 2020. Overall product availability in the marketplace remains excellent and the Company is well positioned to
deliver a fresh assortment of merchandise to its stores and e-commerce sites for the back-to-school shopping season and
throughout the fall.
Cash and Shareholder Distributions
During the second quarter of Fiscal 2022, the Company generated $1.4 billion of operating cash flow and ended the
quarter with $7.1 billion of cash. During the second quarter, the Company returned a total of $614 million to
shareholders. The Company repurchased a total of $300 million of TJX stock, retiring 4.6 million shares. The Company
now expects to repurchase approximately $1.25 billion to $1.50 billion of TJX stock in Fiscal 2022, an increase of $250
million versus its prior plan. The Company may adjust this amount up or down depending on various factors. The
Company also declared a quarterly dividend of $.26 per share in the second quarter of Fiscal 2022 and paid $314
million in shareholder dividends. The Company expects to declare a similar dividend in the third quarter of Fiscal 2022,
subject to Board approval.
Redemption of Senior Notes and Debt Extinguishment Charge
On June 4, 2021, the Company completed make-whole calls for its $1.25 billion principal outstanding, 3.50%
Notes due April 15, 2025, and its $750 million principal outstanding, 3.75% Notes due April 15, 2027. As a result of
these redemptions prior to their scheduled maturities, the Company recorded a pre-tax debt extinguishment charge of
$242 million in the second quarter of Fiscal 2022. Since the beginning of Fiscal 2022, the Company has reduced its
outstanding debt by $2.75 billion and reduced its annualized interest expense by more than $90 million.
Impact of Temporary Store Closures
The Company’s results for the second quarter of Fiscal 2022 were negatively impacted by the temporary closure of
some of its stores due to the COVID-19 global pandemic. Although the Company’s stores in the U.S. were open for the
entire second quarter, stores in Canada were closed for approximately 22% of the second quarter, stores in Europe were
closed for approximately 2% of the quarter, and stores in Australia were closed for about 18% of the quarter. In total,
the Company had stores closed for approximately 3% of the second quarter due to the COVID-19 global pandemic (see
table below). The Company estimates that these closures may have resulted in approximately $300 million to $350
million in lost sales during the second quarter of Fiscal 2022. This range of estimated lost sales assumes all Canadian,
European, and Australian stores operated at similar open-only comp store sales trends as the first and second quarter of
Fiscal 2022. Based on management’s estimate of profit dollars on this range of lost sales, the Company estimates that
second quarter Fiscal 2022 earnings per share were negatively impacted by approximately $.05 to $.07. At the end of
the second quarter, 4,649 of the Company’s 4,665 stores were open.
The Company’s results for the first half of Fiscal 2022 were negatively impacted by the temporary closure of some
of its stores due to the COVID-19 global pandemic. Although the Company’s stores in the U.S. were open for the first
half of Fiscal 2022, stores in Europe were closed for approximately 39% of the first half, stores in Canada were closed
for about 24% of the first half, and stores in Australia were closed for approximately 10% of the first half. In total, the
Company had stores closed for approximately 8% of the first half of Fiscal 2022 due to the COVID-19 global pandemic
(see table below). The Company estimates that these closures may have resulted in approximately $1.40 billion to $1.55
billion in lost sales during the first half of Fiscal 2022. Based on management’s estimate of profit dollars on this range
of lost sales, the Company estimates that first half Fiscal 2022 earnings per share were negatively impacted by
approximately $.26 to $.31.
-MORE-
THE TJX COMPANIES, INC. REPORTS ABOVE-PLAN Q2 FY22 SALES AND PROFIT RESULTS;
Q2 FY22 OVERALL OPEN-ONLY COMP STORE SALES INCREASED 20% VERSUS Q2 FY20
Wednesday, August 18, 2021
Page 4
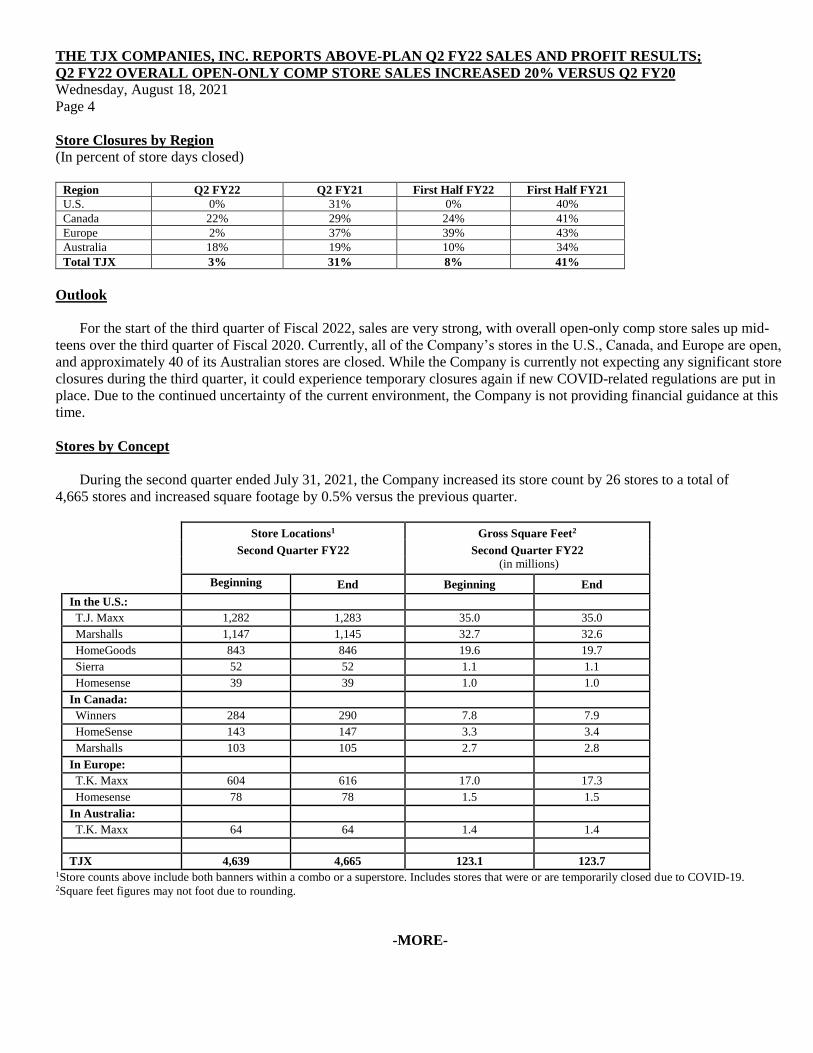
Store Closures by Region
(In percent of store days closed)
Region Q2 FY22 Q2 FY21 First Half FY22 First Half FY21
U.S. 0% 31% 0% 40%
Canada 22% 29% 24% 41%
Europe 2% 37% 39% 43%
Australia 18% 19% 10% 34%
Total TJX 3% 31% 8% 41%
Outlook
For the start of the third quarter of Fiscal 2022, sales are very strong, with overall open-only comp store sales up mid-
teens over the third quarter of Fiscal 2020. Currently, all of the Company’s stores in the U.S., Canada, and Europe are open,
and approximately 40 of its Australian stores are closed. While the Company is currently not expecting any significant store
closures during the third quarter, it could experience temporary closures again if new COVID-related regulations are put in
place. Due to the continued uncertainty of the current environment, the Company is not providing financial guidance at this
time.
Stores by Concept
During the second quarter ended July 31, 2021, the Company increased its store count by 26 stores to a total of
4,665 stores and increased square footage by 0.5% versus the previous quarter.
Store Locations1 Gross Square Feet2
Second Quarter FY22 Second Quarter FY22
(in millions)
Beginning End Beginning End
In the U.S.:
T.J. Maxx 1,282 1,283 35.0 35.0
Marshalls 1,147 1,145 32.7 32.6
HomeGoods 843 846 19.6 19.7
Sierra 52 52 1.1 1.1
Homesense 39 39 1.0 1.0
In Canada:
Winners 284 290 7.8 7.9
HomeSense 143 147 3.3 3.4
Marshalls 103 105 2.7 2.8
In Europe:
T.K. Maxx 604 616 17.0 17.3
Homesense 78 78 1.5 1.5
In Australia:
T.K. Maxx 64 64 1.4 1.4
TJX 4,639 4,665 123.1 123.7 1Store counts above include both banners within a combo or a superstore. Includes stores that were or are temporarily closed due to COVID-19. 2Square feet figures may not foot due to rounding.
-MORE-
THE TJX COMPANIES, INC. REPORTS ABOVE-PLAN Q2 FY22 SALES AND PROFIT RESULTS;
Q2 FY22 OVERALL OPEN-ONLY COMP STORE SALES INCREASED 20% VERSUS Q2 FY20
Wednesday, August 18, 2021
Page 5
Fiscal 2022 Open-Only Comp Store Sales
Due to the temporary closing of stores as a result of the COVID-19 global pandemic, the Company’s historical
definition of comp store sales is not applicable for the second quarter and first half of Fiscal 2022. In order to provide a
performance indicator for its stores, the Company has been temporarily reporting a new sales measure: open-only comp
store sales. The Company’s open-only comp store sales calculation includes stores initially classified as comp stores at
the beginning of Fiscal 2021. This measure reports the sales increase or decrease of these stores for the days the stores
were open in the second quarter and first half of Fiscal 2022 against sales for the same days in Fiscal 2020, prior to the
emergence of the global pandemic.
About The TJX Companies, Inc.
The TJX Companies, Inc. is the leading off-price retailer of apparel and home fashions in the U.S. and worldwide.
As of July 31, 2021, the end of the Company’s second quarter, the Company operated a total of 4,665 stores in nine
countries, the United States, Canada, the United Kingdom, Ireland, Germany, Poland, Austria, the Netherlands, and
Australia, and four e-commerce sites. These include 1,283 T.J. Maxx, 1,145 Marshalls, 846 HomeGoods, 52 Sierra,
and 39 Homesense stores, as well as tjmaxx.com, marshalls.com, and sierra.com, in the United States; 290 Winners,
147 HomeSense, and 105 Marshalls stores in Canada; 616 T.K. Maxx and 78 Homesense stores, as well as
tkmaxx.com, in Europe; and 64 T.K. Maxx stores in Australia. TJX’s press releases and financial information are
available at TJX.com.
Second Quarter Fiscal 2022 Earnings Conference Call
At 11:00 a.m. ET today, Ernie Herrman, Chief Executive Officer and President of TJX, will hold a conference call
to discuss the Company’s second quarter Fiscal 2022 results, operations, and business trends. A real-time webcast of
the call will be available to the public at TJX.com. A replay of the call will also be available by dialing (866) 367-5577
(U.S. only) or (203) 369-0233 through Wednesday, August 25, 2021, or at TJX.com.
Important Information at Website
Archived versions of the Company’s conference calls are available in the Investors section of TJX.com after they
are no longer available by telephone, as are reconciliations of non-GAAP financial measures to GAAP financial
measures and other financial information. The Company routinely posts information that may be important to investors
in the Investors section at TJX.com. The Company encourages investors to consult that section of its website regularly.
Forward-looking Statement
SAFE HARBOR STATEMENT UNDER THE PRIVATE SECURITIES LITIGATION REFORM ACT OF 1995: Various statements made in
this release are forward-looking and involve a number of risks and uncertainties. All statements that address activities, events or developments
that we intend, expect or believe may occur in the future are forward-looking statements. The following are some of the factors that could cause
actual results to differ materially from the forward-looking statements: the ongoing COVID-19 pandemic and associated containment and
remediation efforts; execution of buying strategy and inventory management; various marketing efforts; customer trends and preferences;
competition; operational and business expansion; management of large size and scale; merchandise sourcing and transport; labor costs and
workforce challenges; personnel recruitment, training and retention; data security and maintenance and development of information technology
systems; corporate and retail banner reputation; cash flow; expanding international operations; fluctuations in quarterly operating results and
market expectations; mergers, acquisitions, or business investments and divestitures, closings or business consolidations; real estate activities;
inventory or asset loss; economic conditions and consumer spending; market instability; serious disruptions or catastrophic events;
disproportionate impact of disruptions in the second half of the fiscal year; commodity availability and pricing; adverse or unseasonable weather;
fluctuations in currency exchange rates; compliance with laws, regulations and orders and changes in laws, regulations and applicable accounting
standards; outcomes of litigation, legal proceedings and other legal or regulatory matters; quality, safety and other issues with our merchandise;
tax matters; and other factors that may be described in our filings with the Securities and Exchange Commission. We do not undertake to publicly
update or revise our forward-looking statements even if experience or future changes make it clear that any projected results expressed or implied
in such statements will not be realized.
-MORE-
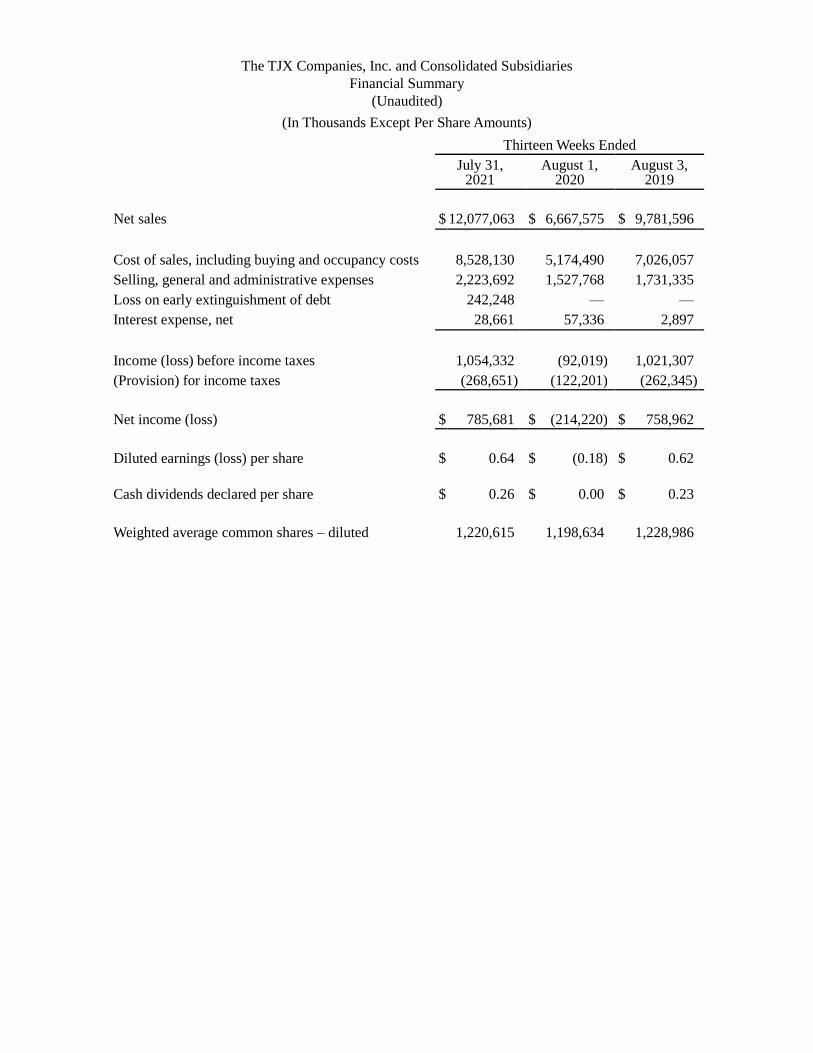
The TJX Companies, Inc. and Consolidated Subsidiaries
Financial Summary
(Unaudited)
(In Thousands Except Per Share Amounts)
Thirteen Weeks Ended
July 31,
2021 August 1,
2020 August 3,
2019
Net sales $ 12,077,063 $ 6,667,575 $ 9,781,596
Cost of sales, including buying and occupancy costs 8,528,130 5,174,490 7,026,057
Selling, general and administrative expenses 2,223,692 1,527,768 1,731,335
Loss on early extinguishment of debt 242,248 — —
Interest expense, net 28,661 57,336 2,897
Income (loss) before income taxes 1,054,332 (92,019) 1,021,307
(Provision) for income taxes (268,651) (122,201) (262,345)
Net income (loss) $ 785,681 $ (214,220) $ 758,962 Diluted earnings (loss) per share $ 0.64 $ (0.18) $ 0.62 Cash dividends declared per share $ 0.26 $ 0.00 $ 0.23 Weighted average common shares – diluted 1,220,615 1,198,634 1,228,986
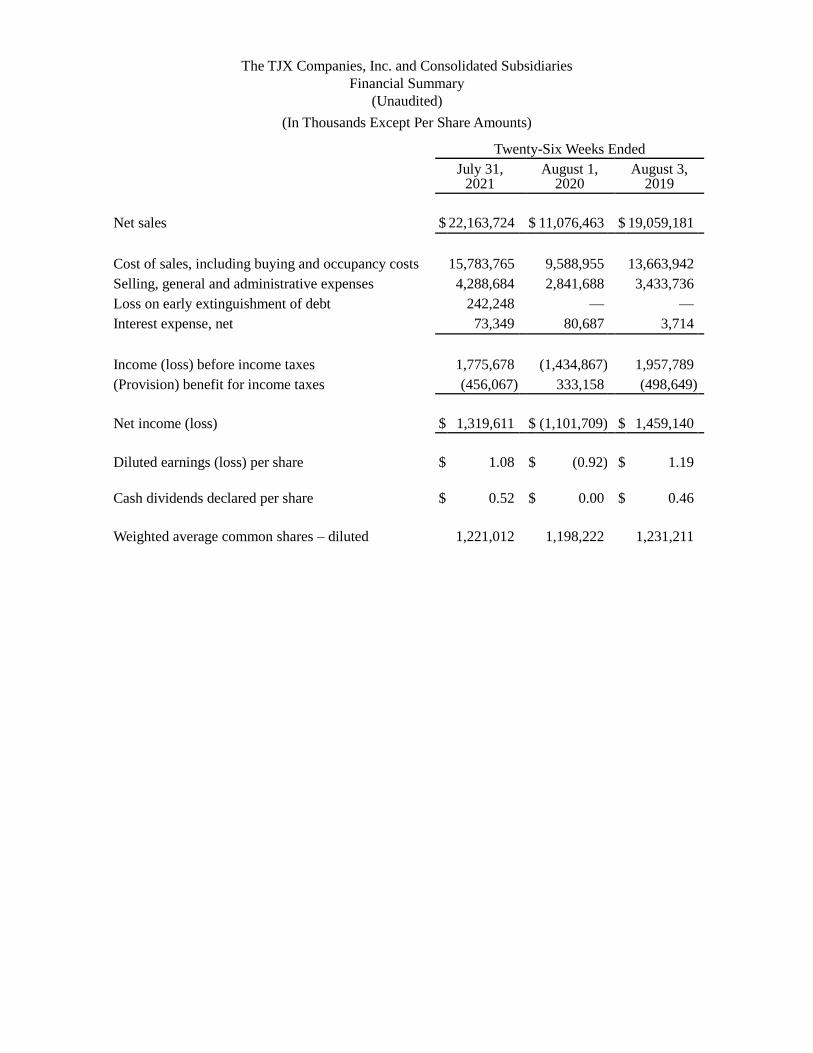
The TJX Companies, Inc. and Consolidated Subsidiaries
Financial Summary
(Unaudited)
(In Thousands Except Per Share Amounts)
Twenty-Six Weeks Ended
July 31,
2021 August 1,
2020 August 3,
2019
Net sales $ 22,163,724 $ 11,076,463 $ 19,059,181
Cost of sales, including buying and occupancy costs 15,783,765 9,588,955 13,663,942
Selling, general and administrative expenses 4,288,684 2,841,688 3,433,736
Loss on early extinguishment of debt 242,248 — —
Interest expense, net 73,349 80,687 3,714
Income (loss) before income taxes 1,775,678 (1,434,867) 1,957,789
(Provision) benefit for income taxes (456,067) 333,158 (498,649)
Net income (loss) $ 1,319,611 $ (1,101,709) $ 1,459,140
Diluted earnings (loss) per share $ 1.08 $ (0.92) $ 1.19
Cash dividends declared per share $ 0.52 $ 0.00 $ 0.46
Weighted average common shares – diluted 1,221,012 1,198,222 1,231,211
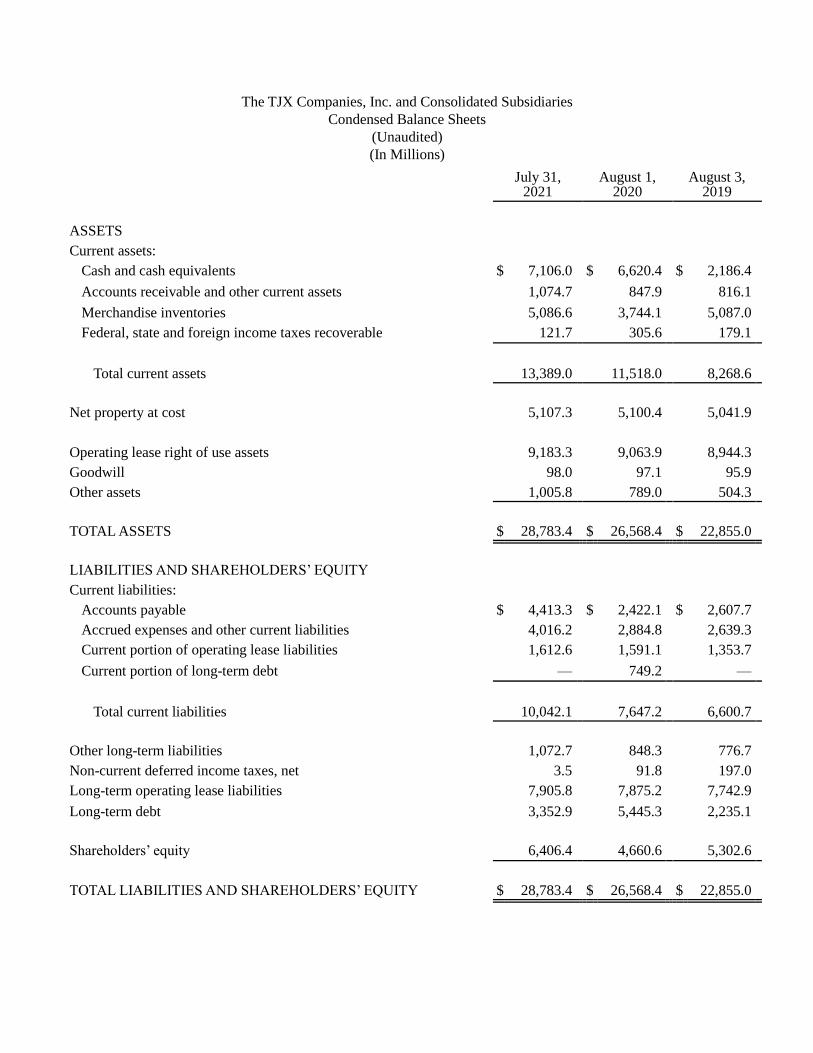
The TJX Companies, Inc. and Consolidated Subsidiaries
Condensed Balance Sheets
(Unaudited)
(In Millions)
July 31,
2021 August 1,
2020 August 3,
2019
ASSETS
Current assets:
Cash and cash equivalents $ 7,106.0 $ 6,620.4 $ 2,186.4
Accounts receivable and other current assets 1,074.7 847.9 816.1
Merchandise inventories 5,086.6 3,744.1 5,087.0
Federal, state and foreign income taxes recoverable 121.7 305.6 179.1
Total current assets 13,389.0 11,518.0 8,268.6
Net property at cost 5,107.3 5,100.4 5,041.9
Operating lease right of use assets 9,183.3 9,063.9 8,944.3
Goodwill 98.0 97.1 95.9
Other assets 1,005.8 789.0 504.3
TOTAL ASSETS $ 28,783.4 $ 26,568.4 $ 22,855.0
LIABILITIES AND SHAREHOLDERS’ EQUITY
Current liabilities:
Accounts payable $ 4,413.3 $ 2,422.1 $ 2,607.7
Accrued expenses and other current liabilities 4,016.2 2,884.8 2,639.3
Current portion of operating lease liabilities 1,612.6 1,591.1 1,353.7
Current portion of long-term debt — 749.2 —
Total current liabilities 10,042.1 7,647.2 6,600.7
Other long-term liabilities 1,072.7 848.3 776.7
Non-current deferred income taxes, net 3.5 91.8 197.0
Long-term operating lease liabilities 7,905.8 7,875.2 7,742.9
Long-term debt 3,352.9 5,445.3 2,235.1
Shareholders’ equity 6,406.4 4,660.6 5,302.6
TOTAL LIABILITIES AND SHAREHOLDERS’ EQUITY $ 28,783.4 $ 26,568.4 $ 22,855.0
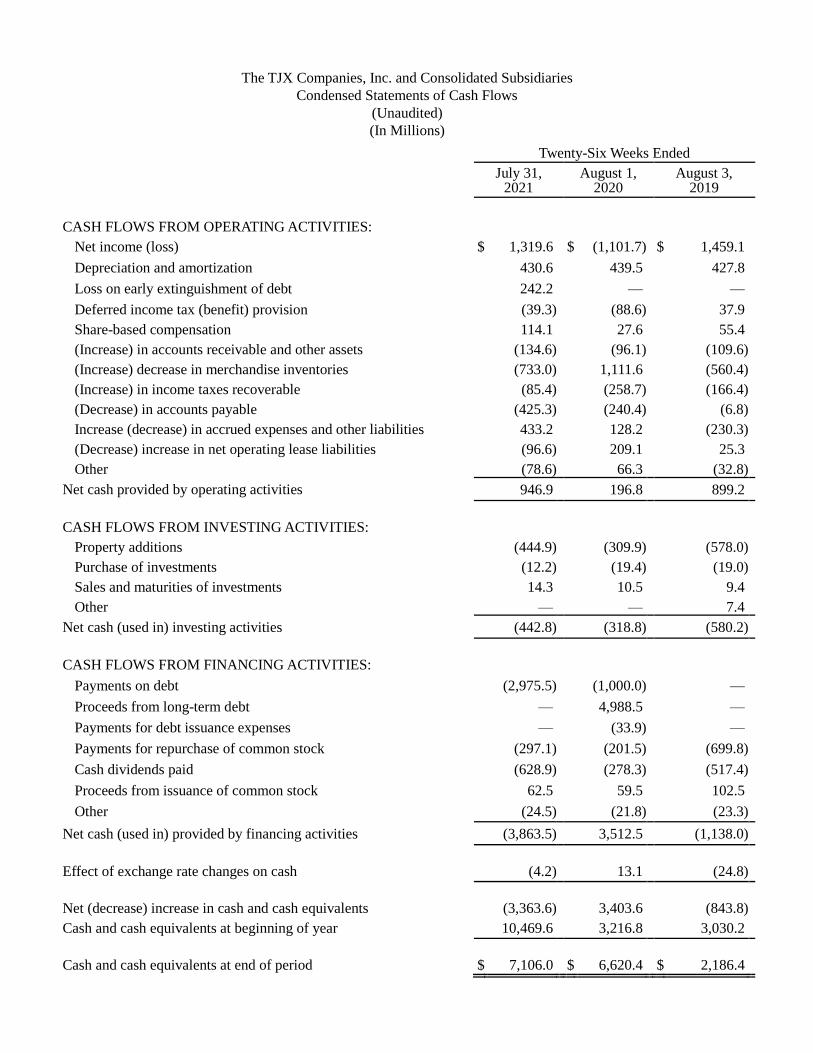
The TJX Companies, Inc. and Consolidated Subsidiaries
Condensed Statements of Cash Flows
(Unaudited)
(In Millions)
Twenty-Six Weeks Ended
July 31,
2021 August 1,
2020 August 3,
2019
CASH FLOWS FROM OPERATING ACTIVITIES:
Net income (loss) $ 1,319.6 $ (1,101.7) $ 1,459.1
Depreciation and amortization 430.6 439.5 427.8
Loss on early extinguishment of debt 242.2 — —
Deferred income tax (benefit) provision (39.3) (88.6) 37.9
Share-based compensation 114.1 27.6 55.4
(Increase) in accounts receivable and other assets (134.6) (96.1) (109.6)
(Increase) decrease in merchandise inventories (733.0) 1,111.6 (560.4)
(Increase) in income taxes recoverable (85.4) (258.7) (166.4)
(Decrease) in accounts payable (425.3) (240.4) (6.8)
Increase (decrease) in accrued expenses and other liabilities 433.2 128.2 (230.3)
(Decrease) increase in net operating lease liabilities (96.6) 209.1 25.3
Other (78.6) 66.3 (32.8)
Net cash provided by operating activities 946.9 196.8 899.2
CASH FLOWS FROM INVESTING ACTIVITIES:
Property additions (444.9) (309.9) (578.0)
Purchase of investments (12.2) (19.4) (19.0)
Sales and maturities of investments 14.3 10.5 9.4
Other — — 7.4
Net cash (used in) investing activities (442.8) (318.8) (580.2)
CASH FLOWS FROM FINANCING ACTIVITIES:
Payments on debt (2,975.5) (1,000.0) —
Proceeds from long-term debt — 4,988.5 —
Payments for debt issuance expenses — (33.9) —
Payments for repurchase of common stock (297.1) (201.5) (699.8)
Cash dividends paid (628.9) (278.3) (517.4)
Proceeds from issuance of common stock 62.5 59.5 102.5
Other (24.5) (21.8) (23.3)
Net cash (used in) provided by financing activities (3,863.5) 3,512.5 (1,138.0)
Effect of exchange rate changes on cash (4.2) 13.1 (24.8)
Net (decrease) increase in cash and cash equivalents (3,363.6) 3,403.6 (843.8)
Cash and cash equivalents at beginning of year 10,469.6 3,216.8 3,030.2
Cash and cash equivalents at end of period $ 7,106.0 $ 6,620.4 $ 2,186.4
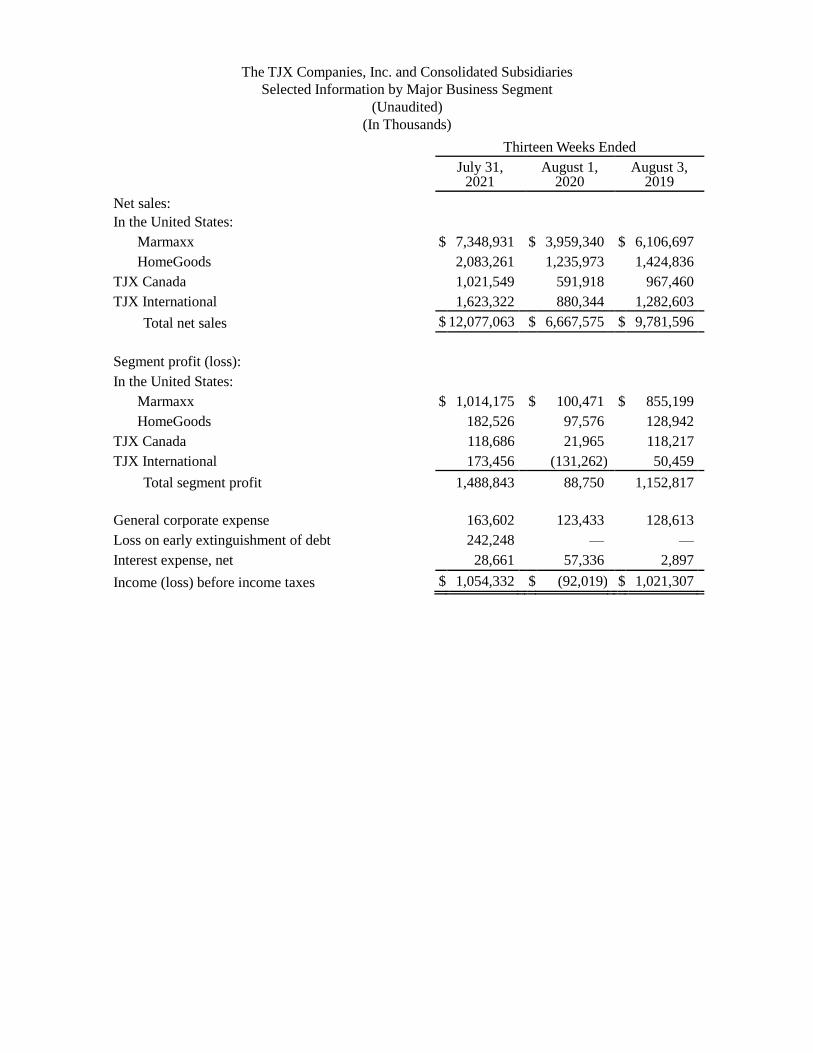
The TJX Companies, Inc. and Consolidated Subsidiaries
Selected Information by Major Business Segment
(Unaudited)
(In Thousands)
Thirteen Weeks Ended
July 31,
2021 August 1,
2020 August 3,
2019
Net sales:
In the United States:
Marmaxx $ 7,348,931 $ 3,959,340 $ 6,106,697
HomeGoods 2,083,261 1,235,973 1,424,836
TJX Canada 1,021,549 591,918 967,460
TJX International 1,623,322 880,344 1,282,603
Total net sales $ 12,077,063 $ 6,667,575 $ 9,781,596
Segment profit (loss):
In the United States:
Marmaxx $ 1,014,175 $ 100,471 $ 855,199
HomeGoods 182,526 97,576 128,942
TJX Canada 118,686 21,965 118,217
TJX International 173,456 (131,262) 50,459
Total segment profit 1,488,843 88,750 1,152,817 General corporate expense 163,602 123,433 128,613
Loss on early extinguishment of debt 242,248 — —
Interest expense, net 28,661 57,336 2,897
Income (loss) before income taxes $ 1,054,332 $ (92,019) $ 1,021,307
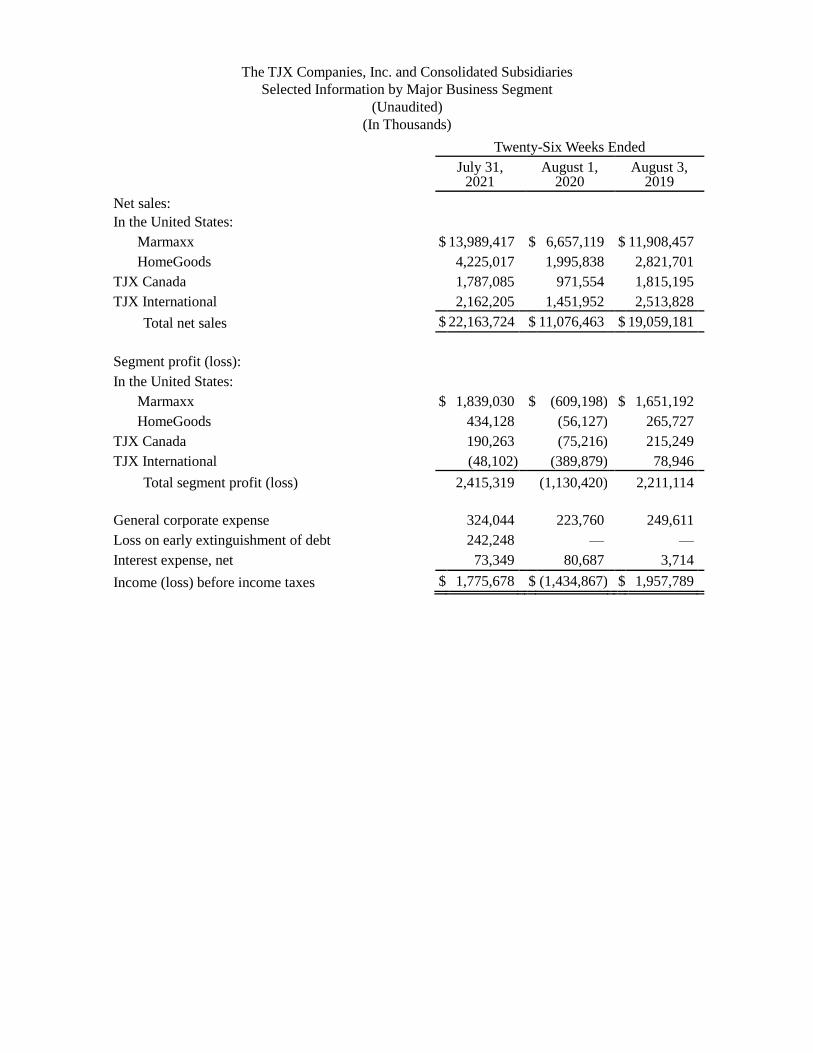
The TJX Companies, Inc. and Consolidated Subsidiaries
Selected Information by Major Business Segment
(Unaudited)
(In Thousands)
Twenty-Six Weeks Ended
July 31,
2021 August 1,
2020 August 3,
2019
Net sales:
In the United States:
Marmaxx $ 13,989,417 $ 6,657,119 $ 11,908,457
HomeGoods 4,225,017 1,995,838 2,821,701
TJX Canada 1,787,085 971,554 1,815,195
TJX International 2,162,205 1,451,952 2,513,828
Total net sales $ 22,163,724 $ 11,076,463 $ 19,059,181
Segment profit (loss):
In the United States:
Marmaxx $ 1,839,030 $ (609,198) $ 1,651,192
HomeGoods 434,128 (56,127) 265,727
TJX Canada 190,263 (75,216) 215,249
TJX International (48,102) (389,879) 78,946
Total segment profit (loss) 2,415,319 (1,130,420) 2,211,114
General corporate expense 324,044 223,760 249,611
Loss on early extinguishment of debt 242,248 — —
Interest expense, net 73,349 80,687 3,714
Income (loss) before income taxes $ 1,775,678 $ (1,434,867) $ 1,957,789
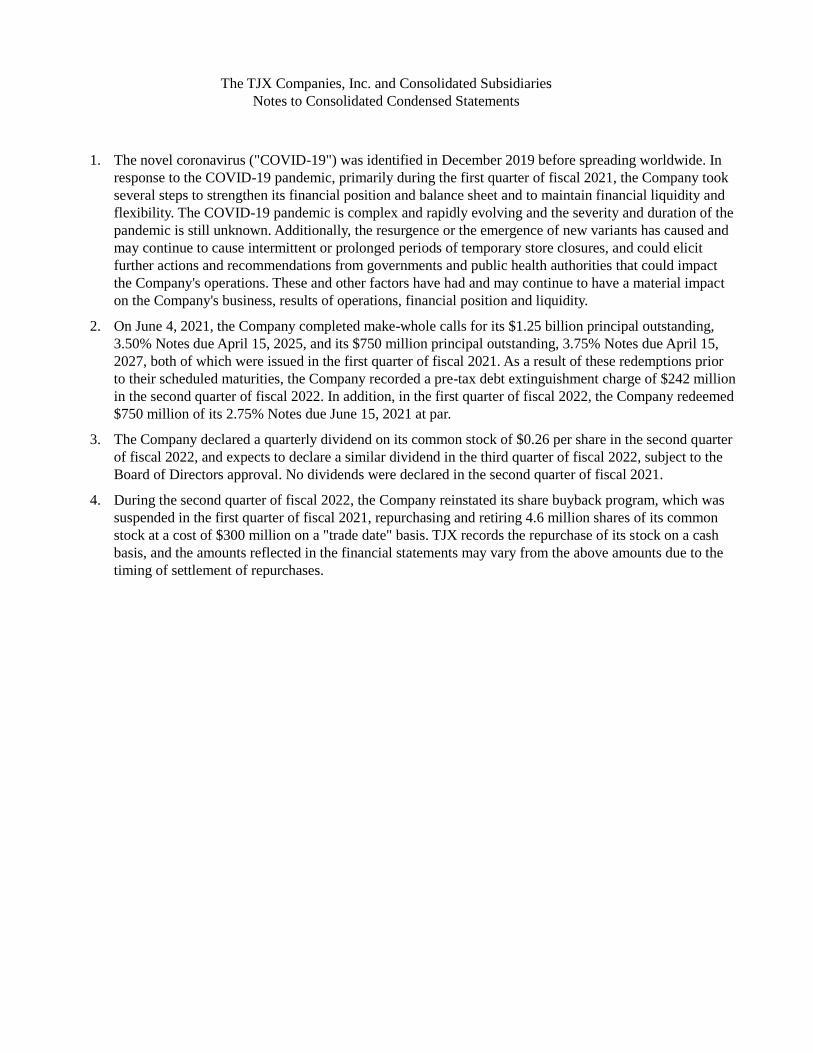
The TJX Companies, Inc. and Consolidated Subsidiaries
Notes to Consolidated Condensed Statements
1. The novel coronavirus ("COVID-19") was identified in December 2019 before spreading worldwide. In
response to the COVID-19 pandemic, primarily during the first quarter of fiscal 2021, the Company took
several steps to strengthen its financial position and balance sheet and to maintain financial liquidity and
flexibility. The COVID-19 pandemic is complex and rapidly evolving and the severity and duration of the
pandemic is still unknown. Additionally, the resurgence or the emergence of new variants has caused and
may continue to cause intermittent or prolonged periods of temporary store closures, and could elicit
further actions and recommendations from governments and public health authorities that could impact
the Company's operations. These and other factors have had and may continue to have a material impact
on the Company's business, results of operations, financial position and liquidity.
2. On June 4, 2021, the Company completed make-whole calls for its $1.25 billion principal outstanding,
3.50% Notes due April 15, 2025, and its $750 million principal outstanding, 3.75% Notes due April 15,
2027, both of which were issued in the first quarter of fiscal 2021. As a result of these redemptions prior
to their scheduled maturities, the Company recorded a pre-tax debt extinguishment charge of $242 million
in the second quarter of fiscal 2022. In addition, in the first quarter of fiscal 2022, the Company redeemed
$750 million of its 2.75% Notes due June 15, 2021 at par.
3. The Company declared a quarterly dividend on its common stock of $0.26 per share in the second quarter
of fiscal 2022, and expects to declare a similar dividend in the third quarter of fiscal 2022, subject to the
Board of Directors approval. No dividends were declared in the second quarter of fiscal 2021.
4. During the second quarter of fiscal 2022, the Company reinstated its share buyback program, which was
suspended in the first quarter of fiscal 2021, repurchasing and retiring 4.6 million shares of its common
stock at a cost of $300 million on a "trade date" basis. TJX records the repurchase of its stock on a cash
basis, and the amounts reflected in the financial statements may vary from the above amounts due to the
timing of settlement of repurchases.