Embed Size (px)
DESCRIPTION
Â
Citation preview

Forest
ecosystems in
the transition
to a green
economy and
the role oF
redd+ in the
united republic
oF tanzania

reproductionThis publication may be reproduced in whole or in part and in any form for educational or non-profit services without special permission from the copyright holder, provided acknowledgement of the source is made. UNEP would appreciate receiving a copy of any publication that uses this publication as a source. No use of this publication may be made for resale or any other commercial purpose whatsoever without prior permission in writing from the United Nations Environment Programme. Applications for such permission, with a statement of the purpose and extent of the reproduction, should be addressed to the Director, DCPI, UNEP, P.O. Box 30552, Nairobi 00100, Kenya. The use of information from this document for publicity or advertising is not permitted.
disclaimersMention of a commercial company or product in this document does not imply endorsement by UNEP. Trademark names and symbols are used in an editorial fashion with no intention on infringement on trademark or copyright laws. The designations employed and the presentation of material in this publication do not imply the expression of any opinion whatsoever on the part of UNEP concerning the legal status of any country, territory or city or its authorities, or concerning the delimitation of its frontiers and boundaries.
We regret any errors or omissions that may have been unwittingly made.
This work has been designed and implemented under the direction of Dr. Pushpam Kumar, Chief, Ecosystem Services Economics Unit, UNEP
Authors: Babatunde Abidoye1, Eric Mungatana1, Linda Mahlalela1, Thabo Sacolo1 and Folaranmi Babalola1
Edited by: Ivo Mulder (UNEP) and Beth Mbote (UNEP)
1Centre for Environmental Economics and Policy in Africa (CEEPA), University of Pretoria
Cover photo: Ngorongoro crater © Jessica Bethke/Shutterstock
acknowledgementThe authors wish to thank the Ministry of Natural Resources and Tourism, United Republic of Tanzania, notably Mr. Juma Mgoo and Mr. Evarist Nashanda for their contributions, support and guidance throughout this study. We would also like to thank Prof. Rashid Hassan, (Centre for Environmental Economics and Policy in Africa (CEEPA), University of Pretoria), for his support in developing the work.
The authors would also like to acknowledge Dr. Pushpam Kumar and Mr. Tim Christophersen (UNEP) for their oversight and support for this project. We would like to thank the reviewers who provided detailed feedback on the report: Unai Pascual, (Basque Centre for Climate Change (BC3), Spain), Priscilla Cooke, (Pacific Lutheran University, USA), Niklas Hagelberg, (UNEP), Stephen Gitonga, UN REDD Programme, (UNEP), Paulo Nunes (UNEP), Suzannah Goss and Soren Dalsgaard, (Royal Norwegian Embassy, Tanzania).
We would also like to thank the many stakeholders in Dar es Salaam, Tanzania, who provided critical guidance at the outset of the study at an inception meeting in Dar es Salaam in July, 2013, and who offered critical feedback on the results in July, 2014.
This publication was produced in partnership with the United Nations Collaborative Programme on Reducing Emissions from Deforestation and Forest Degradation in Developing Countries (UN-REDD Programme), which harnesses the technical capacities of FAO, UNDP and UNEP to support the REDD+ readiness and implementation capacities of developing countries. More information available at www.un-redd.org
This study was implemented by the Ecosystem Services Economics Unit, Division of Environmental Policy Implementation (DEPI), United Nations Environment Programme (UNEP).
Job Number: DEP/1929/NAISBN: 978-92-807-3470-6
Layout and printing: UNON, Publishing Services Section, Nairobi, ISO 14001:2004-certified.
D1 No.: 15-01965/200 copies
UNEP promotes environmentally sound practices
globally and in its own activities. This report is printed on paper from sustainable
forests. The paper is chlorine free and the inks vegetable-based. Our distribution policy aims
to reduce UNEP’s carbon footprint.
Published by the United Nations Environment Programme (UNEP), 2015Copyright © UNEP 2015

Forest ecosystems in the transition to a green economy and the role oF redd+ in the united republic oF tanzania
Foreword
executive summary
acronyms and abbreviations
o1. introduction and background
o2. Forest ecosystem services included in the
valuation study
o3. intersectoral linkages and value added
by the forestry and hunting sector
o4. Value of the catchment forests of the
united republic of tanzania
o5. towards a sustainable forestry
management in the united republic of
tanzania
o6. references
appendices 53
51
46
39
16
19
12
11
06
05
table of contents

Ngorongoro crater © Jessica Bethke/Shutterstock

ForewordGoods and services provided by ecosystems, including forests, are consistently undervalued in standard economic indicators such as gross domestic product (GDP). As a result, forests and other ecosystems are degraded and used unsustainably, which impacts many groups in society, not least the rural poor, who often depend on timber and other ecosystem goods and services for their livelihoods. A growing recognition is developing, of the urgent need for action to halt the degradation and loss of this natural capital.
One of the key policy recommendations of the Millennium Ecosystem Assessment was to integrate sustainable ecosystem management in national policies, plans and programmes to ensure human well-being, while acknowledging that all sectors of the economy benefit directly and indirectly from nature in terms of added value through links with other sectors. The adoption of the outcome document during the UN Conference on Sustainable Development (Rio+20) further reiterated the need to better account for natural capital and critical ecosystem services towards a transition to a Green Economy.
The System of Environmental-Economic Accounting – Experimental Ecosystem Accounting (SEEA – EEA) of the United Nations, published in 2013, provides an important first step in the development of a statistical framework for ecosystem accounting. The SEEA-EEA framework was used for this report to assess how deforestation affects the economy of Tanzania, both by looking at the limited ecosystem goods and services currently reflected in GDP and by looking at the effects on the economy if the full suite of forest ecosystem services are taken into account. Based on current available data (NAFOMA 2014), the results show that current deforestation levels are unsustainable from a macro-economic point of view. The effect on the economy is stronger if degradation of currently unaccounted for ecosystem services – such as water provisioning for agriculture, hydropower, domestic and industrial, water for environment and non-wood forest products – are integrated in the country’s national accounts.
This work is part of a range of activities offered by the UN-REDD programme to support the Government of Tanzania by enabling it to build the economic case for sustainable management and conservation of the country’s forest ecosystems as part of REDD+ implementation. The analysis provides insight for the National Bureau of Statistics, the Ministry of Finance and President’s Office Planning Commission on how to start accounting for Tanzania’s natural capital and how this can be linked to the country’s national accounts.
The findings show that investment in the forestry sector has a disproportionately positive impact on the incomes of rural households in comparison to stimulating output from other sectors, meaning that investment in forestry could contribute to alleviating poverty. Taking these findings together, this report presents a solid case for Tanzania to integrate REDD+ policies into key economic sectors such as energy, agriculture, livestock, industries, transport and water to address the drivers of deforestation and forest degradation while identifying how the implementation of REDD+ can be part of Tanzania’s broader economic and development strategy, as the country plans to move towards REDD+ results-based actions that could lead to results-based payments and then towards Green Economy pathways to sustainable development and poverty eradication in Tanzania.
Juma S. MgooTanzania Forest Services
Ministry of Natural Resources and TourismJuly 2015
Achim SteinerUNEP Executive Director
United Nations Under-Secretary General
5

executive summary
Key messages
• ThemainobjectiveofthisstudyistoassesswhetherthereisaneconomicrationaleforthereductionofdeforestationintheUnitedRepublicofTanzania,bycalculatingtheeconomiccostsandbenefitsbasedoncurrentlevelsofdeforestation. The study is part of a range of activities offered by the UN-REDD Programme in support of the Tanzanian Government. REDD+1 is a concept designed to reward developing countries for their verified reductions or removals of forest carbon emissions compared to a forest reference level or forest reference emission level that complies with the relevant safeguards.
• The Tanzanian mainland is estimated to have a total of 48 million hectares (ha) of forest, which is 51 per cent of the total area, with woodlands occupying about 90 per cent of the total forest area and the remainder being shared by mangrove forests, montane forests, small patches of coastal forests, and plantations of softwood and hardwood. Annual deforestation on the Tanzanian mainland is estimated by the National Forest Monitoring and Assessment (NAFORMA, 2014) at 372,816 ha between 1995 and 2010.
• A cost-benefit analysis revealed that the present value of net economic losses fromdeforestationtotheTanzanianeconomyoverthenext20years(2013–2033)isTSh273billion(US$171million).This analysis only included those provisioning forest ecosystem services that are captured by the system of national accounts and which can therefore be reflected in the gross domestic product (GDP). A discount rate of 5 per cent was used, which is the rate that the Bank of Tanzania uses in analysing long-term investments. This means that based on available data, it makes economicsensetoreducedeforestationandimplementpoliciesandmeasuresthattacklethedirectandunderlyingdriversofdeforestation.2
• A second scenario analysis using data from Catchment Forest Reserves took into account the economic effect of deforestation not only on timber resources, but also on other provisioning services, including non-timber forest products, regulating services such as water provisioning for domestic use and livestock, and supporting services such as biodiversity. The presentvalueofnetlossesfromdeforestationtotheTanzanianeconomyintheperiod2013–2033amounts toTSh5,588billion (US$3.5billion). This shows that thepresentvalueofnetlossesareanorderofmagnitudehigherwhentakingintoaccounttheeffectofdeforestationonthefullrangeofforestecosystemservices.
• Lastly, additional analysis also highlighted that investmentsintheforestrysectorleadtocomparativelyhigherincomeforruralpopulationsthanthesameinvestmentsinthesec-torsofagricultureandwood,paperandprinting.Hence, investments in the forestry sector could potentially also be beneficial from the perspective of poverty alleviation.
• These findings highlight that it is economically interesting for the United Republic of Tanzania to invest in conserving its forests, and therefore present a case for the Government to tackle the direct and underlying drivers of deforestation and transition, moving towards an economic model that stimulates sustainable use and conservation of forest ecosystems by implementing REDD+. In that sense, this report provides further rationale for efforts to accelerate the implementation of the REDD+ National Strategy and Action Plan.
1 “REDD” and “REDD+” refer to the mechanism called “Reducing emissions from deforestation and forest degradation in developing countries”, which emerged in 2008, building in the roles of conservation and sustainable management of forests, forest restoration and reforestation. REDD+ is an enhanced version of the mechanism.
2 It should be noted however, that the cost-benefit analysis does not take into consideration the potential alternative income from activities after land is deforested (e.g. agriculture).
6

introduction
The United Republic of Tanzania is one of the 60 partner countries of the UN-REDD Programme and one of the 21 countries with a national programme (as of May 2015). The United Republic of Tanzania has made progress in a range of areas that are part of the Warsaw Framework for REDD+, or the so-called “REDD+ Rulebook”. The valuation of the country’s forest ecosystems and their contribution to its economy was one of the activities that continued after its national programme closed in 2013 as part of the UN-REDD support for national actions.
The country is highly biodiverse and is renowned for the richness of its wildlife. Approximately 38 per cent of the country’s mainland is set aside in protected areas for conservation. The Tanzanian mainland is estimated to have a total of 48 million ha of forest, which is 51 per cent of the total area, with woodlands occupying about 90 per cent of the total forest area and the remainder being shared by mangrove forests, montane forests, small patches of coastal forests, and plantations of softwood and hardwood (NAFORMA, 2014).
Forests provide a range of ecosystem services, of which some can be reflected in market prices, such as timber and derivative products like paper. Other services that are also important for the economy, such as the ability of forest soils to purify water for domestic and industrial use, regulate run-off to support hydroelectric power generation, sequester carbon, etc., are usually quantified using shadow prices as opposed to market prices (see figure 1 for an overview of some ecosystem services that forests provide to the Tanzanian economy and society). The current contribution of the forestry sector to the country’s gross domestic product (GDP)3 is 3 per cent (National Bureau of Statistics, Ministry of Finance 2013).
Deforestation in the United Republic of Tanzania is driven by the expansion of agricultural activities, including through shifting cultivation, wildfires, lack of clearly defined boundaries, illegal logging, livestock grazing, unsustainable charcoal production for domestic and industrial use, lack of systematic management, introduction of alien and invasive species, etc. These driving forces are depreciating the country’s natural capital or stock of forest ecosystem assets, because, as forests disappear, so may the benefits that these provide in terms of regulating water run-off, reducing soil erosion, capturing and sequestering carbon, etc. Deforestation rates range from 130,000 to 500,000 ha per annum (FRA, 2010), with different sources setting the rate at 142,720 ha in 2013 (GFW, 2015) and 372,816 ha per annum between 1995 and 2010 (NAFORMA, 2014). The NAFORMA figure has been used for the analysis in this study.
The primary goal of this study is to provide an insight into the economic costs and benefits of deforestation in the United Republic of Tanzania. The analysis focuses both
3 The contribution was 3.10 per cent at 1992 prices and 2.70 per cent at 2001 prices.
on the specific effect of deforestation on the GDP of the forestry sector, and also on the impact of deforestation on the broader economy. One way to look at this is as follows: If deforestation affects the water cycle it will have a negative impact on the value added of the hydropower or energy sector if energy generation is impaired. In a similar fashion, agriculture can be affected if deforestation increases soil erosion or impairs the irrigation system. This can lead to higher costs (e.g. additional fertlizers) or lower yields (due to poorer soil quality). In that way, this analysis provides a broader perspective of deforestation on the economy. The System of National Accounts (SNA) is used by governments around the world for macroeconomic policy making and defines how GDP is calculated.
As a second step, the report gives policy makers in the Tanzanian Forest Service (TFS), the National Bureau of Statistics (NBS), the Ministry of Finance and Economic Affairs, the Ministry of Natural Resources and Tourism and other public and private stakeholders in th United Republic of Tanzania more visibility about the important roles that the forest sector plays in supporting the welfare of households across the country and its direct and indirect contribution to the economy in terms of added value through interlinkages with other sectors. In doing so, the study provides the rationale for the United Republic of Tanzania to move ahead with the implementation of REDD+ through actions, policies and measures that could generate results-based payments.
Costs and benefits of deforestation for the tanzanian economy
1. MonetarycostsandbenefitsofdeforestationcapturedbytheSystemofNationalAccounts
The first scenario analysed how the monetary benefits that society obtains from cutting down forests (in terms of obtaining useful provisioning services such as timber) compare to the monetary costs to the economy of the lost value added of the forestry sector. In doing so the interlinkages that the forestry sector has with other sectors were taken into account by using an input-output analysis and social accounting matrices. The social accounting matrix is an extension of an input-output table, which, in addition to income and expenditure flows of industries and their outputs which are captured by input-output tables, contains detailed information that captures all transfers and real transactions between industries and institutions in the economy. The values presented below can be directly captured by the SNA4.
1. Benefits of deforestation: The benefits are one-off financial benefits from provisioning services (mainly
4 The analysis assumed that deforestation levels, which on average were 372,816 ha per year between 1995 and 2010 (NAFORMA, 2014), would remain constant for the next 20 years: 2013–2033. A discount rate of 5 per cent was used, which is the rate that the Bank of Tanzania uses in analysing long-term investments (see Sanga and Mungatana, forthcoming).
7 FOREST ECOSYSTEMS IN THE TRANSITION TO A GREEN ECONOMY AND THE ROLE OF REDD+ IN THE UNITED REPUBLIC OF TANZANIA

timber). These are TSh 29,233 per hectare per year (2013). Based on deforestation levels of 372,816 ha per year, the discounted benefits over the period 2013–2033 are estimated at TSh 147 billion (US$ 92 million).
2. Costsof deforestation: There are two types of costs. First, once a hectare of forest has been cut down that same hectare does not contribute any more to the value added of the forestry sector the following year. Second, there are multiplier effects as investments in the forestry sector contribute to the value added of other sectors in the country. In other words, deforestation will reduce this positive indirect effect on other sectors. Combining these two costs results in total costs of TSh 83,771 per hectare per year (2013). Based on deforestation rates of 372,816 ha per year, the discountedcostsfortheperiod2013to2033amounttoatotalcostofTSh420billion(US$ 263 million).
2. Visualizing the economic costs and benefits ofdeforestationonthebroadereconomy
The second scenario assessed how the one-time monetary benefits that society obtained from deforestation compared to the monetary costs of lost provisioning, regulating and supporting ecosystem services. The analysis is based on data from catchment forest reserves (CFRs) issued by the Ministry of Natural Resources and Tourism (MNRT, 2003). The CFRs in the survey covered 677,203 ha and are found in Morogoro, Tanga, Kilimanjaro and Arusha. The survey includes services produced by the forestry sector that supports value added in other sectors (e.g. agriculture, tourism, energy) such as:
• Provisioning services (timber-related): timber, poles, firewood, withies
• Provisioning services (non-timber forest products): wild fruits, traditional medicines, wild vegetables, bushmeat, mushrooms, ropes
• Other provisioning, cultural and regulating (intermediate) services: water provisioning for domestic use and livestock, water for irrigation, water for electricity generation (hydropower), fisheries, prevention of soil erosion and tourism.
The benefits of managing CFRs on a sustainable basis, extracting timber resources, non-timber forest products, and intermediate services, amount to TSh 1 million per hectare per year. The decision to cut down a hectare of forest in the CFRs has costs and benefits. There are ‘one-off’ benefits in terms of the economic value of timber forest products of about TSh 102,993 per hectare. The costs can be computed as lost timber (after a hectare is cut down it does not deliver any timber-related products from the next year onwards), non-timber forest products and regulating and supporting services, which on an aggregate basis are TSh 1 million per hectare. Discounting the costs and benefits for the next 20 years leads to net benefits of TSh38billion(US$ 24 million) and net costs of TSh 5,627 billion (US$ 3.5 billion), see figure 2.
This shows that when taking into account the full range of forest ecosystem services, it is even more economically unattractive to continue current deforestation rates. Please note some of the costs are compatible with the SNA and reflected in GDP through lower value added of other sectors such as agriculture, tourism and energy. For example, more irregular water availability due to deforestation can impact agricultural output, or lead to higher costs for hydro-electric utilities. The UN-REDD Programme has also emphasized the importance of recognizing the multiple benefits that forest ecosystems provide (UNEP, 2014). Other costs such as effects on biodiversity, carbon sequestration and other non-use values are not compatible with the SNA and hence not reflected in the GDP.
*Based on CBA with 5% discount rate (used by National Bank of Tanzania);assuming constant deforestation rates. Underlying analysis conducted using IO table in combination with Social Accounting Matrices
Present value of net benefits/costs of deforestation (million dollars)captured by the System of National Accounts* between 2013–2033
TShs 147 billion(USD 92 million)
TShs 420 billion(USD 263million)
Bene
fits
Cost
s
Figure 1. Present value of net benefits and costs of deforestation captured by the System of National Accounts (SNA) between 2013 and 2033
In conclusion, the present value of net losses fromdeforestationtotheTanzanianeconomyamountstoTSh273 billion (US$ 171 million), as shown in figure 1. This means that deforestation is economically unattractive purely from the perspective of the forestry sector-related contribution to GDP (see boxes 1 and 2).
Box 1. Brief note of clarification on the cost-benefit analysisIn this analysis the amount of land that is removed from forestry and transferred to an alternative use, such as agriculture, does not enter as a sector in the input-output matrix. Additional policy-scenario analysis can be carried out to assess this marginal income impact generated from deforested land through alternative land use. This exercise is beyond the scope of the present report.
8

policy implications
Following these results, the Tanzanian economy would benefit from reducing deforestation and increasing the conservation and sustainable use of forest ecosystem services. Suggestions are provided for different government ministries and agencies, regarding how they could strengthen the integration of forest ecosystem services in their policies and decision-making procedures.
Suggestions for the National Bureau of Statistics (NBS)and the Ministry of Finance and Economic Affairs: The marketable outputs provided by forests are captured by the SNA and reflected in the GDP, whereas the majority of non-marketable outputs are not captured at all. However, restricting the attention of decision-makers exclusively to the share of the forests’ contribution to the country’s GDP presents a skewed picture of its true contribution. Given that the present value of the marketable forest goods and services shows a net loss for the Tanzanian economy, a recommendation for the NBS and the Ministry of Finance and Economic Affairs could be to start assessing how the value of the country’s natural capital can be linked to its national accounts, for example by developing an inclusive wealth account that includes the value of the natural capital in addition to social, manufactured and other types of capital. In that way changes in the forest stock and other natural capital assets can be tracked on a periodic basis.
The use of forests in many developing countries is usually undervalued (e.g. Roe and Elliot, 2010). In addition, the income from forests to households is typically stated as income, which is likely to understate the true income because of the prevalence of informal markets. In the United Republic of Tanzania for example, forests are a source of income for a significant number of households or consumed as a complement to other goods. For instance, in
order to prepare food in many communities, wood provides the cooking energy. However, data on these activities are typically not available at the national level. This results in undervaluing the contribution of the forestry sector to the economy. The study by Agrawal et al. (2012) highlights that in many developing countries non-industrial economic contributions of forests are typically unavailable and in many cases are three to ten times higher than that collected in national accounts. The analysis presented in this study, however, shows that indeed the net non-market benefits and losses of forest ecosystems are ten times as large as the marketed losses.
A natural capital account that is part of a country’s inclusive wealth account and which is linked to its existing system of national accounts can inform the Ministry of Finance and Economic Affairs and the NBS when it develops or adapts policies to stimulate economic growth. The United Nations system of environmental-economic accounting and experimental ecosystem accounting (UN SEEAEEA, 2013) provides three ways in which ecosystem accounting information may be used to augment the economic accounts of the SNA:
A. The compilation of balance sheets that compare the values of ecosystem assets with value of produced assets, financial assets (and liabilities), and other economic assets. This approach also brings into consideration an approach described in the literature as wealth accounting;
B. The compilation of a sequence of economic accounts taking into account ecosystem services and other ecosystem flows, especially ecosystem degradation;
C. The derivation of aggregate measures of economic activity, such as income and saving, that are adjusted for ecosystem degradation.
Suggestions for theTFS: Deforestation has a net negative impact on the economy from the perspective of the forestry sector and fails to take into account potential alternative income from other sectors (see box 1). These results could therefore be used to advocate the provision of additional domestic resources to tackle the driving forces behind deforestation. In addition, this study looked at how deforestation affects the revenues of the TFS itself. Monetary benefits for the TFS from managing forests can include receipts, licences and other miscellaneous payments such as forestry royalties and fees. The costs are expenditures for forest management. At current prices, the present value of net losses for the TFS from deforestation between 2013 and 2033 are estimated at TSh 2,063 million (US$ 1.3 million). This means that, from the point of view of the TFS deforestation has a negative effect on its net income.
Suggestions for the Ministry of Natural Resources andTourismandthePlanningCommission
The project also measured the effect on household income assuming a scenario whereby a plan would be implemented to increase output in the following sectors by 10 per cent
Present value of net benefits and costs of deforestationpartly captured by the System of National Accounts between 2013–2033
TShs 38 billion(USD 24 million)
TShs 5,627 billion(USD 3.5 million)
Bene
fits
Cost
s
Please note that part of the costs are compatible with the SNA and hence reflected in GDP, but not in the forestry sector but in other sectors. This concerns effects of deforestation on providing water for domestic use and livestock, preventing soil erosion, etc. If deforestation affects these services this can lead to lower value added of sectors such as agriculture, tourism and energy. Other forest ecosystem services that are affected because of deforestation, such as biodiversity and non-use values, are not compatible with the SNA and hence not reflected in GDP.
Figure 2. Present value of net benefits and costs of deforestation in CFRs between 2013 and 2033
9 FOREST ECOSYSTEMS IN THE TRANSITION TO A GREEN ECONOMY AND THE ROLE OF REDD+ IN THE UNITED REPUBLIC OF TANZANIA

within five years due to increased demand5: first, forests and hunting; second, agriculture; and third, wood, paper and printing. Four types of households were identified: first, rural poor; second, rural non-poor; third, urban poor; and fourth, urban non-poor. The effect of this simulation was measured both in terms of direct effects on household income if the Government decided to invest in the forestry, agriculture or wood, paper and printing sectors, but also the indirect effect. The indirect impact considers the relationship with other sectors of the economy, for example, increasing the output of the agricultural sector will have an impact on all sectors that have an economic relationship with it (seed supply, fertilizer supply, irrigation water supply, transportation, etc). Increased demand will spur economic growth in the interdependent sectors, which will ultimately be reflected in the welfare of households.
The analysis revealed that such an equal increase in output in these three sectors increased household welfare for both the rural poor and non-poor more in the forestry sector, than in agriculture and wood paper printing (see table 1 and figure 5).
Table 1. Effect on household income from a targeted 10 per cent increase in supply of the forestry, agriculture and wood and paper sectors over the next five years
Forestry andhunting
Agriculture Wood paperprinting
Rural poor Direct 19% 18% 6%
Indirect 33% 32% 27%
Total 52% 50% 33%
Ruralnon-poor
Direct 61% 57% 44%
Indirect 126% 122% 106%
Total 187% 179% 150%
This provides a rationale for the Ministry of Natural Resources and Tourism (MNRT) to stimulate output of the forestry and hunting sector in the interest of poverty alleviation. This is because investments in the forestry sector leads to comparatively higher income for rural populations than equal investments in the agricultural and wood paper printing sectors.
Taking all analyses into account, this report provides motiva-tions for the Government of Tanzania to accelerate REDD+ readiness and move towards implementation of the Nation-al REDD+ Strategy (2013). In doing so, Tanzania would take an important step to transition to a Green Economy.
5 Both direct (final demand) and indirect effects (supporting production activities in other sectors) were taken into account.
Box 2. Use of the Computable General Equilibrium (CGE) model for the United Republic of TanzaniaCGE models are a standard tool of empirical analysis, and are widely used to analyse the aggregate welfare and distributional impacts of policies whose effects may be transmitted through multiple markets, or contain menus of different tax, subsidy, quota or transfer instruments. The social accounting matrix for the United Republic of Tanzania was developed by the International Food Policy Research Institute following the framework presented in the study by Lofgren et al., 2002. Both the single-country static and dynamic versions of the Partnership for Economic Policy standard CGE models were designed for country-level studies adapted to the Tanzanian national economy. The model is implemented in the General Algebraic Modelling System (GAMS) and is solved using the continuous optimization solver CONOPT.
10

acronyms and abbreviations
CES Constant Elasticity of Substitutions
CET Constant Elasticity of Transformation
CFR Catchment Forest Reserves
CGE Computable General Equilibrium
CIFOR Center for International Forestry Research
FAO Food and Agriculture Organization of the United Nations
GAMS General Algebraic Modelling System
GDP Gross Domestic Product
ICRAF International Centre for Research in Agroforestry
MNRT Ministry of Natural Resources and Tourism
NAFORMA National Forestry Resources Monitoring and Assessment of Tanzania
NBS National Bureau of Statistics
NORAD Norwegian Agency for Development Cooperation
PEP Partnership for Economic Policy
REDD+ Reducing Emissions from Deforestation and forest Degradation Conservation, Enhancement of Carbon Stocks and Sustainable Management of Forests
SNA System of National Accounts
TFS Tanzania Forest Services
TEEB The Economics of Ecosystems and Biodiversity
UN SEEA EEA United Nations System of Environmental-Economic Accounting and Experimental Ecosystem Accounting
UNDP United Nations Development Programme
UNEP United Nations Environment Programme
UN-REDD United Nations Collaborative Programme on Reducing Emissions from Deforestation and Forest Degradation in Developing Countries
11 FOREST ECOSYSTEMS IN THE TRANSITION TO A GREEN ECONOMY AND THE ROLE OF REDD+ IN THE UNITED REPUBLIC OF TANZANIA

o1introduction and background
One of the key objectives of economic research studies such as this is to generate the factual evidence that policy requires to build a strong business case, which, in the present instance, is for a transformation in forest planning, management and monitoring, in particular to navigate towards a low-carbon development path and a green economy (see for example, UNEP, 2013). NAFORMA (2014: 13) reports that the Tanzanian mainland is estimated to have a total of 48.1 million ha of forests, which is 51 per cent of the total area. Woodlands occupy 44 million hectares or 91 per cent of the total forest area. NAFORMA categorizes the ownership and management of this forest estate into the following land ownership regimes:
(a) Central government land, which is administered by central government agencies such as the TFS or parastatals such as Tanzania National Parks;
(b) Local government land, which is administered by local government authorities and includes forest reserves decentralized to local government authorities in the 1970s;
(c) Village land, which is held and administered collectively by village residents under customary law and the Village Land Act, chapter 114;
(d) Private land, a category that covers all tenure right types giving individual or collective occupancy rights within village, general or government lands (customary right of occupancy, granted right of occupancy, leasehold, and residential licence);
(e) General land, which includes land which is not reserved, not occupied or unused forest land;
(f) Unknown category.
Villages are the main owners of forests and woodlands in the Tanzanian mainland with a 45.7 per cent share, leaving
a huge share of the forest estate without official protection status and subject to open access exploitation and heavy pressure (Division of Environment, 2013; see also the forest classification adopted by Ngaga 2011). The management and development of this vast forest estate is guided by a recently reformulated National Forest Policy, which led to a new Forest Act (2002).
The critical socioeconomic importance of forestry to the development aspirations of Tanzania has been extensively demonstrated in current literature. To cite a few illuminating examples, the Statistical Abstract (2012) reports that the 2001 GDP share of forestry and hunting was 3.10 per cent at 1992 prices and 2.70 per cent at 2001 prices (National Bureau of Statistics, Ministry of Finance 2013). The Tanzanian Ministry of Natural Resources and Tourism (MNRT 2000) reports that the country’s world famous wildlife and game reserves include 1.6 million ha managed as catchment forests. The Tanzanian Ministry of Natural Resources and Tourism (2000) reports that about 70 per cent of the total forest area of the United Republic of Tanzania is suitable for the production of wood products, with a potential sustained yield of around 16.7 million cubic metres per year (0.7 m3/ha/yr). The Tanzanian Ministry of Natural Resources and Tourism (2000) demonstrates the substantial provisioning services of miombo woodlands, and the forward linkages associated with the primary forest industry. Independently, Ngaga (1998) illuminates the shortcomings of conventional measures of economic performance in capturing the true contribution of forestry to social welfare in the United Republic of Tanzania. Kahyarara, Mbowe and Kimweri (2002) demonstrate the importance of forestry in sustaining rural livelihoods. Kaale (2001) illustrates the huge socioeconomic importance of mangrove forests, while the important role of the sector in generating rural and urban employment is demonstrated by the Tanzanian Ministry of Natural Resources and Tourism (1998), Ngaga (1998) and FBD (2000).
Recent studies have, however, brought into sharp public focus the many critical constraints threatening the performance, ecosystem services delivery and sustainable development objectives of this critically vital sector. There exist enormous proximate threats to gazetted forests emanating from a number of sources, including shifting cultivation, wildfires, lack of clearly defined boundaries, illegal logging, expansion of agricultural activities, livestock grazing, unsustainable charcoal production for domestic and industrial use, lack of systematic management, insufficient revenue collection, inadequate infrastructure development, settlement and resettlement, and the introduction of alien and invasive species (see for example Division of Environment 2009, MNRT 2000 and FBD 2000), and population pressure. There is evidence of declining capacity of inter-connected industries that depend on the forestry sector for primary inputs. The study by Ngaga et al. (1998) shows that the total installed wood processing capacity of forest-based industries fell from 900,000 m³/yr of round wood in 1992 to 710,000 m³/yr in 1998, attributed to obsolete technology, low investment, poor financing and weak market development. In 2000, the Tanzanian Ministry of Natural Resources and Tourism reported that almost all plywood industries in the country were operating below full
12

capacity and generating abundant wastes in production (with some sawmills operating below 35 per cent recovery rate), as a consequence of their very old and poorly maintained machinery. The cumulative effect of all these constraints is the increased deforestation rate currently being witnessed in the country (e.g. see the evidence presented in VPO 1998 and FAO 2010) threatening future sustainability prospects.
This report is motivated by the hypothesis that the increasing threats faced by the forestry sector could be attributed to the economic characteristics of its outputs. The sector supplies marketable and non-marketable outputs, with the former being captured within the current system of national accounts (SNA), while a huge proportion of the latter is not captured at all.6 The report acknowledges that there are credible economic, intuitional and historical reasons explaining why the sector’s non-market benefits typically have provided little incentive for investment and sustainable management. The marketable benefits which are visible and
6 This issue is explored in greater detail in chapter 2 of this report.
captured in current GDP often present a more compelling case to policymakers. However, restricting the decision-maker’s attention to the sector’s benefits which are captured by the market and shown only by the GDP share of forestry presents a skewed picture of its true contribution. As will be shown in this report, the well-being of households and the performance of the rest of the economy is intricately linked with the performance of the forestry sector, with the result that losing a country’s forest sector goes well beyond losing the sector’s GDP share. Consequently, beyond making an attempt to demonstrate the non-market values of forestry, the primary goal of this report is to give more visibility to the important role of forestry in supporting the welfare of households and performance of the rest of the economy using data that is currently reported in the SNA.
Guided by these observations and in response to the demonstrated need for sustainable forest management in the United Republic of Tanzania, this study was designed to address three key objectives. First, the study used state-of-the-art tools: input-output analysis and social accounting matrix analysis from economics to demonstrate the importance of the sector to the macroeconomy of the United Republic of Tanzania beyond what is reported
Image 1. Waterfall-Kilimanjaro
The country’s world famous wildlife and game reserves in Tanzania include 1.6 million ha managed as catchment forests
Phot
o cr
edit:
© C
IFOR
13 FOREST ECOSYSTEMS IN THE TRANSITION TO A GREEN ECONOMY AND THE ROLE OF REDD+ IN THE UNITED REPUBLIC OF TANZANIA

in the SNA. This analysis will provide the factual evidence required to demonstrate that, in the absence of sustainable forest management, many important welfare-generating upstream and downstream production sectors will fail to perform (i.e. the impacts of failure in the forestry sector goes well beyond losses in the GDP share of forestry).
The output from the first objective then feeds into the second objective, which seeks to answer the question: how do the monetary benefits that society obtains from cutting down its forests (in terms of obtaining useful provisioning forest ecosystem services) compare to the monetary costs of the loss of the value added by forestry to the macroeconomy in the immediate future and long term? This report considers the evidence to be generated in response to the first and second objectives as the main contribution (or value added) of this research to forestry in the United Republic of Tanzania.
In the third objective, the study seeks to answer the question: how do the one-time monetary benefits that society obtains from cutting down its forests (in terms of obtaining useful provisioning forest ecosystem services) compare to the monetary costs of the lost intermediate ecosystem services? This report acknowledges that answering this question necessarily involves imputing monetary values to benefits from forests that are not typically reflected in market economics, a procedure that is not equally accepted across all disciplines. The objective here, however, is simply to make the point that, among many other advantages, non-market valuation facilitates making trade-offs explicit (e.g. see TEEB 2010). But since the unit which the analyst chooses for valuation should ideally not change the nature of the decision, the results of the economic valuation per se should not detract readers of opposing views.7
This report also acknowledges that the ideal approach to the third objective would have been through implementing our own empirical research studies (primary data collection).8 Published studies were used to address the third objective. In the final objective, the study uses a stakeholder engagement process to explore how the United Republic of Tanzania could attract internal and external resources to support sustainable forest management based on the acknowledged benefits that forests provide to the local, national and global economy. Such funding could be used to identify and prioritize investments, policy instruments and institutional arrangements to support a low-carbon development path and the transition to a green economy.
This report is structured as follows. Chapter 2 looks at the stakeholder engagement process followed to identify the ecosystem services that were included in the study. Since it
7 Prof. Sir Partha Dasgupta eloquently articulated this point during the International Conference on Valuation and Accounting for Natural Capital for Green Economy held in Nairobi, on 3 and 4 December 2013.
8 “Best” in the sense of giving the analyst the opportunity to assess the validity and reliability of the resulting welfare estimates.
is hardly feasible to account for all forest ecosystem services within the constraints of a single economic valuation study, stakeholders were chosen based on the importance of their forest ecosystem services that were prioritized for this project. In chapter 3 the intersectoral linkages were evaluated using economy-wide models (input-output analysis and social accounting matrices) with a view to demonstrating the critical importance of the forestry sector to the macroeconomy of the United Republic of Tanzania. Results from chapter 3 provide the rationale for investing in sustainable forestry in the United Republic of Tanzania based on data reported in the current SNA. In chapter 4 some key results are used from the report “Resource economic analysis of catchment forest reserves in Tanzania” (MNRT 2003), on a recommendation from the stakeholder engagement process reported in chapter 2, arriving at the conclusion that the value of intermediate benefits that society receives from catchment forests is significantly larger than that of their provisioning benefits. The results reported in chapter 4 provide additional economic rationale for sustainable forest management in the United Republic of Tanzania based on data that are not currently captured in the SNA. In view of the key conclusions of chapters 3 and 4, and the potential opportunities provided by internal and external sources of support, chapter 5 uses a stakeholder engagement process again to identify and prioritize investments, policy instruments and institutional arrangements that could in principle be used to support a low carbon development path and a green economy transition in the United Republic of Tanzania. References and appendices appear in the last sections of this report.
14

Image 2. Lorry with large pieces of wood
Phot
o cr
edit:
© C
IFOR
Illegal logging a major threat to gazetted forests
15 FOREST ECOSYSTEMS IN THE TRANSITION TO A GREEN ECONOMY AND THE ROLE OF REDD+ IN THE UNITED REPUBLIC OF TANZANIA

2.1introductionThis chapter introduces the concept of ecosystem services, and identifies and explains which ecosystem services are included in the present valuation study.
2.2ecosystem servicesAccording to the System of Environmental-Economic Accounting 2012–Experimental Ecosystem Accounting (SEEA Experimental Ecosystem Accounting), ecosystem services are most usefully considered in the context of a chain of flows that connect ecosystems with human well-being (figure 3).
Starting with the notion of well-being at the level of both the individual and society, the SEEA Experimental Ecosystem Accounting recognizes that well-being is influenced by the receipt of benefits. In the context of ecosystem accounting, such benefits comprise:
• The products supplied by economic units (e.g., food, water, clothing, shelter, recreation, etc.). These are referred to as “SNA benefits” since the measurement boundary is defined by the production boundary used to measure gross domestic product (GDP) in the System of National Accounts – or SNA;
• The benefits accruing to individuals that are not produced by economic units (e.g., clean air). These benefits are referred to as “non-SNA benefits”, reflecting the fact that the receipt of these benefits by individuals is not the result of an economic production process defined within the System of National Accounts.
o2Forest ecosystem services included in the valuation study
Figure 3. Stylized model of flows related to ecosystem services Source: Adapted from SEEA Experimental Ecosystem Accounting.
16

It follows that, under the SEEA Experimental Ecosystem Accounting, ecosystem services are considered to be “the contributions of ecosystems to benefits used in economic and other human activity”, as defined in the SEEA glossary,9 a definition that excludes some flows that are categorized as ecosystem services in other contexts. In particular, these include flows within and between ecosystems that form part of continuing ecosystem processes, commonly referred to as “supporting services” (see the Millennium Ecosystem Services Assessment (2005)). This is the definition and classification of ecosystem services that will be employed in the present report.
2.3 provisioning and intermediate forest ecosystem services selected for inclusion in this studyThe ecosystem services identified for inclusion in this study were selected on the basis of two stakeholder consultations. The first was held on 4 June 2013, between the Centre for Environmental Economics and Policy in Africa and the Tanzania Forest Services, the institution formally tasked with coordinating this research project given its role as chief custodian of forests in the United Republic of Tanzania. In the meeting the Tanzania Forest Services highlighted the important connection that exists between effective forest management and the performance of the following sectors in the United Republic of Tanzania: rural and urban households, forestry, domestic and industrial water supply, rain-fed and irrigated agriculture, livestock and inland fisheries, domestic energy supply, hydroelectric power generation, tourism, wildlife and beekeeping.
Consensus emerged from the meeting that the current study should generate an improved understanding of the role of better-managed forests in the macro-economy of the United Republic of Tanzania by considering the listed ecosystem services. It also emerged from the meeting that the Tanzanian Ministry of Natural Resources and Tourism, through the Ministry’s Forestry and Beekeeping Division and with assistance from, among others, the Norwegian Agency for Development Cooperation (NORAD), had prepared a major research study in 2003 entitled “Resource economic analysis of catchment forest reserves in Tanzania” (hereinafter referred to as the 2003 MNRT study). This study estimated monetary values for the following forest ecosystem goods and services of relevance to the current study: timber and timber-related values, non-timber forest products, water (domestic and livestock use, irrigation,
9 SEEA (2012), p. 155.
electricity and fisheries), measures for erosion protection, tourism, carbon sequestration, biodiversity, option values and non-use values.
The second consultation took place at a stakeholders’ workshop in Dar es Salaam on 17 July 2013, and was attended by representatives of six government ministries (Natural Resources and Tourism, Agriculture, Energy and Mining, Water, Livestock Development, and Fisheries and Works), two public institutions (National Bureau of Statistics and the National Environmental Management Council), the Sokoine University of Agriculture, and four international organizations – the United Nations Environment Programme (UNEP), the United Nations Development Programme (UNDP), the International Centre for Research in Agroforestry (ICRAF), and the Food and Agriculture Organization of the United Nations (FAO). There was consensus at the second stakeholders’ meeting of the importance of a study that provided a better understanding of the importance of forests to the macro-economy of the United Republic of Tanzania. Stakeholders at that meeting also concluded that any forest valuation work to be delivered under the current study should add value to what is currently known from the 2003 MNRT study.
17 FOREST ECOSYSTEMS IN THE TRANSITION TO A GREEN ECONOMY AND THE ROLE OF REDD+ IN THE UNITED REPUBLIC OF TANZANIA

Figure 4. Schematic landscape illustration of ecosystem services in the United Republic of Tanzania
Kilimanjaro
TANZANIA
forestry
domestic and industrial water supply
rain fed and irrigated agriculture
domestic energy supply
hydroelectric power generation
tourism
wildlife and beekeeping
livestock and inland fisheries
erosion protection function
domestic and livestock use of water
Schematic landscape illustration of ecosystem services in the United Republic of Tanzania
18

3.1 introductionThe forestry sector provides both use and non-use values for the economy, as indicated in chapter 2. The use values can be estimated using market mechanisms and can be observed through the activities of households, private enterprises and the government. In the present chapter, we evaluate the importance of the forestry sector by looking at its linkage with other sectors of the economy and investigate the value which it adds using input-output analysis and social accounting matrices. The input-output model is based on an analysis of inter-industry transactions and examines how industries use the products of other industries as inputs for their own products. One of the main advantages of the input-output model is that its analysis of inter-industry transactions can be used to estimate the economic impacts of any changes to the economy.
The social accounting matrices are an extension of the input-output tables. In addition to the income and expenditure flows of industries and their outputs, as captured in the input-output tables, the social accounting matrices contain detailed information on different institutions. The matrices thus incorporate institutional and structural details that capture all transfers and real transactions between industries and institutions in the economy. Since the social accounting matrices incorporate the input-output table, they provide a comprehensive economy-wide database with an internally consistent set of accounts for production, income and expenditures.
Data were available for the input-output table of the United Republic of Tanzania for the years 2000–2010 and these were used in the computation of the social accounting matrices, which then served as the major data source for analysing inter-industry linkages. The 2001 social accounting matrices were disaggregated into 17 activities or sectors, with the following codes: agriculture (AAGRIC), forestry and hunting (AFOREST), wood, paper and printing(AWOODP), livestock and fisheries (ALIVES), mining (AMINE), food processing (AFOOD), textiles (ACLOTH), other manufacturing (AOTHM), machinery and equipment (AEQUIP), utilities (AUTIL), construction (ACONST), trade (ATRAD), hotels and restaurants (AHOTEL), transport and communications (ATRANS), real estate (AESTAT), public administration (AADMIN) and private services (APRIVS). Labour was divided into subsistence labour (FSUB), child labour (LCHILD), female adult labour (LFEMALE) and male adult labour (LMALE). Capital was differentiated into agricultural capital (CAPAG) and non-agricultural capital (CAPNAG). The matrices included one kind of land (LAND) and firms or enterprises (ENTR). Households vary by location and poverty status, namely: rural poor households (RURPOOR), rural non-poor households (RURNPOOR), urban poor households (URBPOOR) and urban non-poor households (URBNPOOR). Government activities were divided into government expenditure (GOV) and five different kinds of taxes direct tax on domestic institutions (DIRTAX), import tariffs (IMPTAX), value added tax (VATAX), indirect or sales taxes (INDTAX) and factor taxes (FACTAX). Lastly, savings and investment (S-I) represent the capital account, while the rest of the world (ROW) is modelled as a single sector. The framework set out below is based on that prepared by Parra and Wodon (2009).
3.2contribution of forestry and hunting, and the wood, paper and printing sectors to value addition
Keymessagesforanalystsandpolicymakers
Using the data on intersectoral transactions captured in the social accounting matrices for the United Republic of Tanzania, chapter 3 demonstrates the following:
• Each hectare of forest that is left standing boosts the contribution to the GDP of the forestry and hunting sector. Thus, in 2001, forestry and hunting contributed TSh 296.7 billion to the GDP in 2001of the United Republic of Tanzania, which translates into TSh. 6,168 per ha per year (2001) equivalent to TSh 29,233.84 per ha per year (2013).
o3intersectoral linkages and value added by the forestry and hunting sector
19 FOREST ECOSYSTEMS IN THE TRANSITION TO A GREEN ECONOMY AND THE ROLE OF REDD+ IN THE UNITED REPUBLIC OF TANZANIA

• For each hectare of forest that is cut down, there are two consequences: first, the cleared hectare will no longer contribute to the current GDP, which is estimated at TSh 6,168 per ha per year (2001); and, second, the potential value added by forestry to other sectors of the Tanzanian economy – in terms of income and valued added taxes – to a total quantity estimated in the present study at TSh 10,599 per ha per year (2001) will be lost. Accordingly, clearing a hectare of forest translates into a total loss of TSh 16,767 per ha per year (2001) in terms of direct losses and losses incurred by other sectors, which is equivalent to TSh 83,771.70 per ha per year (2013).
• An increase in the consumption of the forestry sector by households resulted in an increase in GDP, household income, wage rates and composite commodity prices.
These predictions are clearly of importance in informing forest policy: in the interests of improving the welfare of rural poor, rural non-poor, urban poor and urban non-poor households, forest policies should encourage growth in sectors that make use of forestry as an input in their production.
Side box: “REDD+10 and the green economy share an agenda of promoting economic growth and development, with an eye to investing in natural capital and ecosystem services, and a focus on alleviating poverty and social inequities. REDD+ planning spurs the transformative changes in governance, ways of thinking and approaches needed to switch from an unsustainable course of business-as-usual to one that leads to economic growth and social equity”11.
“Value added” is defined as the sum of factor incomes and value added taxes. In this section we consider the question: “What is the contribution of the 17 industries modelled in the social accounting matrices to aggregate GDP?” Table 2 presents the contribution to GDP by sector (in descending order), highlighting the value added by the sectors of forestry and hunting, and that of wood, paper and printing.
10 “REDD+” refers to an enhanced version of the mechanism called “Reducing emissions from deforestation and forest degradation in developing countries”, or “REDD”, which emerged in 2008, building in the ideas of conserving and sustainably managing forests, forest restoration and reforestation.
11 Newsletter of the UN-REDD Programme, issue No. 39, June–July 2013
Agriculture (AAGRIC) is the major contributor (TSh 3,224 billion), while forestry and hunting (AFOREST), and wood, paper and printing (WOODP) contribute TSh 296 billion (eighth overall) and Tsh. 72 billion (sixteenth overall), respectively. These sectors, which are the two sectors of central interest to this study, make up 3.5 per cent of the GDP of the United Republic of Tanzania. This result is based on current measures of economic performance; other sectors contribute more to the national income by several orders of magnitude (for example, the contribution of agriculture is more than ten times that of forestry and hunting).
The remaining sections of the present chapter will explore the critical role played by the forestry and hunting sector in the macro-economy of the United Republic of Tanzania by carrying out the following analyses: multiplier (section 3.3), forward and backward linkages (section 3.4), structural path (section 3.5), sectoral growth and price impacts (section 3.6), exogenous demand shocks (section 3.7), exogenous price shocks (section 3.8), simulating data to capture household demand for forestry output that is not presently captured in the system of national accounts (section 3.9), and finally the cost-benefit of deforestation based on the representation of forestry in the system of national accounts of the United Republic of Tanzania (section 3.10).
3.3 multiplier analysis, sectoral growth and price impactsWe begin here by assuming that the Tanzanian Planning Commission proposes a policy that would result in increased activity (or an increased supply of goods and services) from the forestry and hunting (AFOREST), agriculture (AAGRIC), and wood, paper and (AWOODP) sectors by the same proportional amount (e.g., a targeted 10 per cent supply increase in each sector within the next five years). 12Many factors could potentially drive such an increase in supply, including increased exogenous demand,13 and options for making each of these policies operational could include increasing the annual budgetary allocation for each sector.
12 The mean exchange rate in 2001 was 876.71 Tanzanian shillings to the dollar.
13 Technically, an increase is exogenous if it comes from outside the system being modelled. To give a practical example, increased demand by the rest of the world for carbon sequestration services (or habitat protection services) provided byTanzanian forests would present an exogenous increase for output from the forestry and hunting sector. Another way to think about it is that theTanzanian Planning Commission could aim to increase the output from forestry and hunting by 10 per cent over the next five years as a policy target (presumably to increase availability of goods and services to consumers from the sector).
20

In this section multiplier analysis14 is employed to assess whether household incomes would increase or decrease as a result of these proposals; thus, it considers the question: “Would households benefit from or be hindered by the individual proposals?”
14 A multiplier in economics is a factor of proportionality that measures how much an endogenous variable changes in response to an exogenous variable. The multiplier will not only provide information on whether the endogenous variable in question relatively increases or decreases (i.e., the direction of change), it will also provide information on the relative magnitude of the change (the size of the increase or decrease). This section will demonstrate the value of the multiplier analysis to policies affecting forestry and hunting sector in the United Republic of Tanzania.
As noted above in this chapter: the present report distinguishes between four types of households: first, rural poor (RURPOOR); second, rural non-poor (RURNPOOR); third, urban poor (URBPOOR); and, fourth, urban non-poor (URBNPOOR). It follows that, by answering the above question, the analysis will make it easier to predict how the proposed policies would affect welfare distribution across households. In the present report, the multipliers are presented in absolute values and in what might be termed “elasticity values”.15 The report will further deconstruct the multipliers into transfer, open-loop and closed-loop effects to facilitate a better understanding of their policy
15 The economic notion of “elasticity”, as used in the present report, refers to the degree of responsiveness of a sector to a change in other determinants and variables.
Table 2. Value added (in billions of Tanzanian shillings and United States dollars)12
Activity Value added in TSh billion Value added in US$ billion12
Agriculture (AAGRIC) 3 224.0 3.68
Real estate (AESTAT) 1 879.3 2.14
Food processing (APFOOD) 1 347.7 1.54
Public administration (AADMIN) 653.3 0.75
Livestock and fishery (ALIVES) 622.2 0.71
Construction (ACONST) 582.0 0.66
Textiles (ACLOTH) 305.8 0.35
Forestry and hunting (AFOREST) 296.7 0.34
Other manufacturing (AOTHM) 263.4 0.30
Hotels and restaurants (AHOTEL) 259.6 0.30
Trade (ATRADE) 253.6 0.29
Transport and communications (ATRANS) 238.9 0.27
Private services (APRIVS) 224.8 0.26
Utilities (AUTILI) 112.0 0.13
Machinery and equipment (AEQUIP) 75.7 0.09
Wood, paper and printing (AWOODP) 72.0 0.08
Mining (AMININ) 21.1 0.02
Aggregate TSh 10 432 billion US$ 11.90 billion
Source: Author’s computation
21 FOREST ECOSYSTEMS IN THE TRANSITION TO A GREEN ECONOMY AND THE ROLE OF REDD+ IN THE UNITED REPUBLIC OF TANZANIA

significance.16 Transfer effects are designed to capture the impact of the proposed policies, based on transfers within the group of accounts. Open and closed-loop effects are also called direct and indirect effects, respectively. The direct effect of the forestry and hunting sector, for example, focuses on the sector’s impact on final demand, i.e., the goods and services supplied by the sector and directly consumed as final products, such as the direct gathering of firewood by households for domestic energy supply. The indirect effect of the forestry and hunting sector includes output that helps support the production activities of other sectors in the economy. The forestry and hunting sector, for example, indirectly contributes to the value added in the electricity generation sector.
3.3.1impacts of exogenous increases on households
Using the constructed model, an analyst can sequentially assess the impact of a unit increase in each of the activities or sectors on the rest of the economy. The full analysis for all activities is presented in annex I. Table 3 abstracts data from annex I to highlight the key results which are relevant to forest policy analysis.
16 The issue of deconstruction, and its value to the formulation of policy, is explored further in section 3.3.2 below.
Based on the multiplier analysis (table 3), it may be predicted that a one-unit exogenous increase in the demand for forestry and hunting will lead to increases of 0.5 units in the income for the rural poor, 1.9 in income for the rural non-poor, 0.1 in the income for the urban poor and 0.7 in the income for the urban non-poor. By comparison, the impacts of a similar increase on the exogenous demand for output in agriculture on the one hand, and the wood, paper and printing industries on the other, are given in columns 3 and 4. To give a more practical interpretation to the multipliers reported in table 1, let us assume an annual income of the rural poor in the United Republic of Tanzania of TSh 250,000, of the rural non-poor of TSh 600,000, of the urban poor of TSh 300,000 and of the urban non-poor of TSh 900,000. We can use the multipliers of table 3 to derive the predictions of table 4.
Thus, if the Planning Commission were to increase output from the forestry and hunting sector by a small percentage within the next five years as postulated, the model predicts that the annual income of the rural poor would increase from TSh 250,000 to TSh 380,825, of the rural non-poor from TSh 600,000 to TSh 1,721,640, of the urban poor from TSh 300,000 to TSh 326,040 and of the urban non-poor from TSh 900,000 to TSh 1,540,890. The analyst can use the predictions from table 4 to address two questions of policy interest. First, which of the three sectors of investment
Table 3. Predicted impacts of exogenous increases on changes in household welfare (multipliers)
Impact of exogenous demand on incomes of: Exogenous increase in demand for output from:
Forestry and hunting* Agriculture* Wood, paper and printing*
Rural poor households 0.52 0.50 0.33
Rural non-poor households 1.87 1.79 1.50
Urban poor households 0.09 0.09 0.11
Urban non-poor households 0.71 0.72 0.78
Source: Author’s computation
Values have been rounded off*
Table 4. Predicted impacts of exogenous increases on household welfare (Tanzanian shillings)
Household sector Hypothesized currentannual income (TSh)
Estimated total income (TSh) after an exogenous increase in the demandfor output from:
Forestry and hunting Agriculture Wood, paper and printing
Rural poor 250 000 380 825 373 775 333 675
Rural non-poor 60 000 1 721 460 1 074 060 1 498 200
Urban poor 300 000 326 040 326 640 334 170
Urban non-poor 900 000 1 540 890 1 548 990 1 597 770
Source: Author’s computation
22
would bring the greatest benefit to the poor? Second, what would be the likely impact of the chosen investment on the welfare of the rural poor, rural non-poor, urban poor and urban non-poor before and after the policy is implemented? According to the predictions of table 4:
• Increasing the exogenous demand for output from the forestry and hunting sector has a larger impact on the incomes of the rural poor and non-poor compared to similar increases in the demand for output from the agriculture and wood, paper and printing sectors. It follows that adopting such a policy would benefit the rural poor and non-poor much more than adopting similar policies in the agriculture or wood, paper and printing sectors.
• The model predicts that such a policy would enhance the welfare of the rural poor and non-poor. The Ministry of Natural Resources and Tourism could potentially use these predictions to argue for additional funding support to the sector in the interests of poverty alleviation. The ministry could also use this prediction to seek pro-poor donor funding for rural development and forest conservation.
• In all cases, the model predicts that the rural non-poor consistently gain much more than the rural poor. The Government should thus consider supporting complementary investments designed to reduce incidences of overall rural poverty, such as the provision of safer drinking water to save time and effort spent collecting water, the improvement of sanitation to reduce vulnerability to diseases, educational programmes to facilitate more efficient use of resources through environmental awareness, etc. It is clear from the predictions that investments in forestry should be viewed as a single ingredient in an overall rural development strategy.
Lastly, it may be seen from the data in annex I that:
• Of all the production sectors in the United Republic of Tanzania captured in the analysis, an exogenous increase in demand for forestry and hunting has had the largest impact on household incomes (rural poor and non-poor, urban poor and non-poor).
• If the government target is growth in rural incomes, implementing policies that increase the output from the forestry and hunting sector appears to be most promising (of all sectors).
3.3.2 deconstructing the multiplier
The preceding analysis derived quantitative estimates of the total impact (referred to as multipliers) of a unit increase in the sectors of forestry and hunting, agriculture, and wood, paper and printing on the welfare of rural poor, rural non-poor, urban poor and urban non-poor households. The objective of this section is to deconstruct these multipliers into three kinds of effects: transfer, open-loop (or direct), and closed-loop (or indirect). It was stated earlier that the transfer effect is designed to capture the impact of the exogenous increases based on transfers within the group of accounts. Since the results presented in annex II show very minimal transfer effects on most activities in the United Republic of Tanzania, the rest of the analysis will concentrate on the open and closed-loop effects. A logical question would then be: “What is the value added by deconstructing the multipliers into open and closed-loop effects?” Value is added because an understanding of the relative strengths of the two sources of impact helps answer the following policy-relevant question: “Which particular activities – both direct and indirect – will help uplift the welfare of the rural poor, and should forest policy encourage investments that enhance the operation of the direct effect or the indirect effect?”
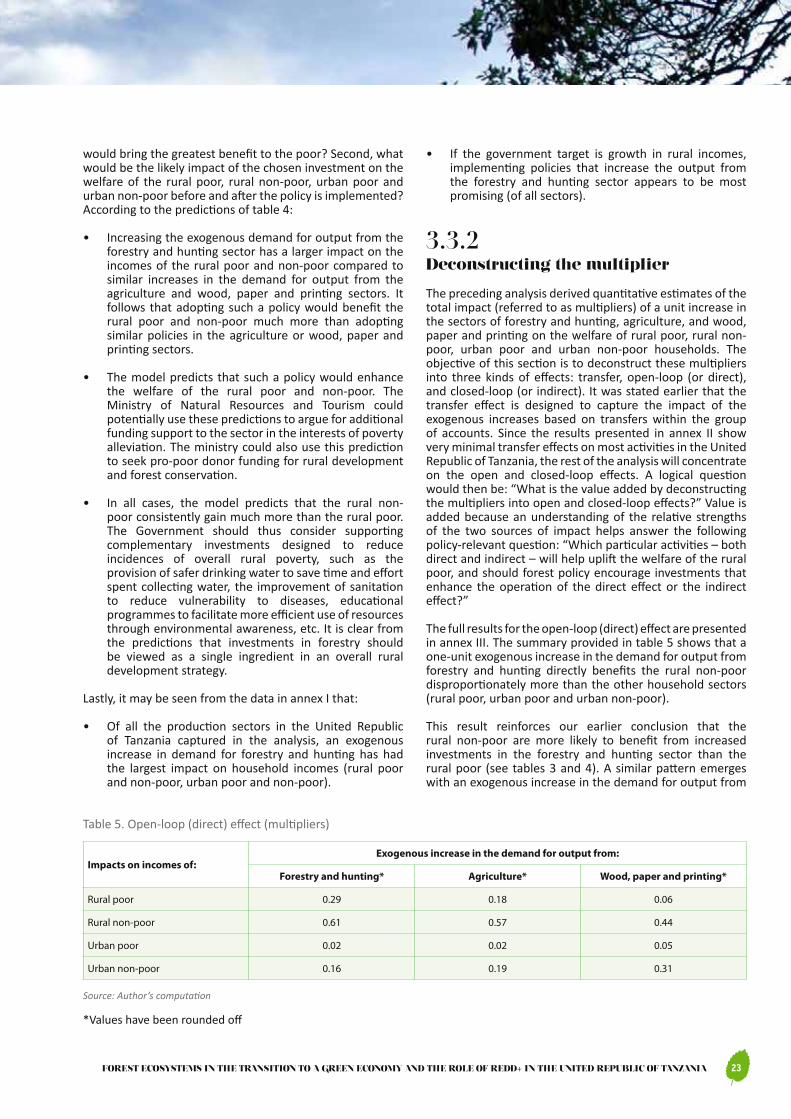
The full results for the open-loop (direct) effect are presented in annex III. The summary provided in table 5 shows that a one-unit exogenous increase in the demand for output from forestry and hunting directly benefits the rural non-poor disproportionately more than the other household sectors (rural poor, urban poor and urban non-poor).
This result reinforces our earlier conclusion that the rural non-poor are more likely to benefit from increased investments in the forestry and hunting sector than the rural poor (see tables 3 and 4). A similar pattern emerges with an exogenous increase in the demand for output from
Table 5. Open-loop (direct) effect (multipliers)
Impacts on incomes of:Exogenous increase in the demand for output from:
Forestry and hunting* Agriculture* Wood, paper and printing*
Rural poor 0.29 0.18 0.06
Rural non-poor 0.61 0.57 0.44
Urban poor 0.02 0.02 0.05
Urban non-poor 0.16 0.19 0.31
Source: Author’s computation
*Values have been rounded off
23 FOREST ECOSYSTEMS IN THE TRANSITION TO A GREEN ECONOMY AND THE ROLE OF REDD+ IN THE UNITED REPUBLIC OF TANZANIA

Table 6. Open-loop (direct) effect (Tanzanian shillings)
Household sector Hypothesized currentannual income (TSh)
Total income (TSh) after an exogenous increase in the demand for output from:
Forestry and hunting Agriculture Wood-paper printing
Rural poor 250 000 298 700 294 325 264 950
Rural non-poor 600 000 966 120 942 720 861 900
Urban poor 300 000 304 500 305 730 315 750
Urban non-poor 900 000 1 045 080 1 068 390 1 176 120
Source: Author’s computation
Table 7. Closed-loop (indirect) effect (multipliers)
Impacts on incomes of: Exogenous increase in the demand of output from:
Forestry and hunting* Agriculture* Wood, paper and printing*
Rural poor 0.33 0.32 0.27
Rural non-poor 1.26 1.22 1.06
Urban poor 0.07 0.07 0.06
Urban non-poor 0.55 0.53 0.47
Source: Author’s computation
Values have been rounded off*
the agriculture (column 3) and the wood, paper and printing sectors (column 4). Table 5 further shows that exogenous increases in the demand for output from forestry and hunting have much larger direct impacts on the welfare of rural areas (rural poor and rural non-poor) compared to similar increases in the demand for output from the agriculture or the wood-paper printing sectors. To give a more practical interpretation to the multipliers reported in table 5, table 6 uses the approach of table 4 to demonstrate the magnitude of the direct effect.
With the exception of the rural non-poor, the model predicts that, for the direct impacts studied, the absolute increases in income might not amount to much (table 6). Thus for example, by increasing demand for output from forestry and hunting, the annual income of the rural poor increases by TSh 48,700 (equivalent to TSh 4,058 or US$ 2.4 per month). A similar exogenous increase in demand for output from agriculture translates into an annual increase of TSh 44,325 (TSh 3,694 or US$ 2.2 per month) in the income of the rural poor, while a similar exogenous increase in the demand for output from wood, paper and printing translates into an annual increase of TSh 14,950 (TSh 1,246 or US$ 0.8 per month) in the income of the rural poor.
The full results for the closed-loop (indirect) effect are presented in annex IV. As the indirect impact of a sector takes into consideration its relationship with, for example, other sectors of the economy, an exogenous increase in the demand for output from agriculture will have an impact on all sectors with which it has an economic relationship
(seed supply, fertilizer supply, irrigation water supply, fruit processing and packaging, transportation, energy supply, water supply, labour supply, etc.). This means that the increased demand will spur economic growth in the interdependent sectors, which will ultimately be reflected in the welfare of households. This section seeks to answer the question: how will this sectoral input affect the annual incomes of the household sectors (rural poor, rural non-poor, urban poor and urban non-poor)? The answer to this question is presented in table 7 in terms of multipliers and in table 8 in terms of Tanzanian shillings (following the approach of table 4).
A comparison of tables 6 and 8 will show that the indirect impact is much stronger than the direct. Thus, by increasing demand for output from the forestry and hunting sector as postulated, the annual income of the rural poor increases by TSh 82,150 (TSh 6,846 or US$ 4 per month), an increase of almost 70 per cent over the outcome predicted by the direct effect. A similar exogenous increase in the demand for output supplied by the agriculture sector translates into an annual increase of TSh 79,450 (TSh 6,621 or US$ 4 per month) in the income of the rural poor, an increase of almost 80 per cent over the outcome predicted by the direct effect. Finally a similar exogenous increase in the demand for output supplied by the wood, paper and printing sector translates into an annual increase of TSh 68,725 (TSh 5,727 or US$ 3.4 per month) in the income of the rural poor, an increase of almost 360 per cent over the outcome predicted by the direct effect.
24

F - Forestry & Hunting
A - Agriculture INDIRECT
DIRECTW - World Paper Printing
Urban non - poor
0%
100%
Impa
ct P
erc
ent
age
F A W
Urban poor
0%
100%
F A W
Rural non - poor
0%
100%
F A W
Rural POOR
0%
100%
F A W
E�ect on household income from a targeted 10 per cent increase in supply of the forestry, agriculture and wood paper printing sectors over the next 5 years"
55% 53%
126%
7 %
33 %
29 %
32 %
18 %27 % 6%
2 %7 %
2 % 6 %
5 %
61 %
122%
57 %
106%
44%
47%
16 % 19 % 31 %
Impa
ct P
erc
ent
age
Impa
ct P
erc
ent
age
Impa
ct P
erc
ent
age
Figure 5. Effect on household income from a targeted 10 per cent increase in supply of the forestry, agriculture and wood paper sectors over the next 5 years
25 FOREST ECOSYSTEMS IN THE TRANSITION TO A GREEN ECONOMY AND THE ROLE OF REDD+ IN THE UNITED REPUBLIC OF TANZANIA

The value of these predictions in informing forest policy could be summarized as follows: in the interests of improving the welfare of rural poor, rural non-poor, urban poor and urban non-poor households, forest policy should encourage growth in sectors that make use of forestry as an input in their production. The analyses in section 3.4 (on forward and backward linkages) and section 3.7 (on exogenous demand shocks) will shed more light on how this policy recommendation could be operationalized. Lastly, table 9 shows the percentage of the total multiplier resulting from the direct and indirect effects in the forestry and hunting sector. The full total multiplier for the wood, paper and printing sector is presented in annex V.
3.3.3. multipliers in terms of elasticity
In the first part of the multiplier analysis the report answered the question: “What is the total predicted impact on household welfare of a unit exogenous increase in the demand for output from the sectors forestry and hunting, agriculture, and wood-paper printing?” In the next step the total impact in terms of open and closed-loop effects was deconstructed to ascertain which of the two effects was stronger. In the present analysis, the study continues
to suggest the same exogenous increases from the same sectors.
In addition to the questions already addressed, the Tanzanian Planning Commission may need to know the degree of responsiveness of income of a particular household category to a percentage increase in the demand of a sector – in other words, to answer the question: “What will a targeted 1 percentage point change in forestry lead to in terms of household income?” An analysis of multipliers in terms of elasticity provides the answer. The elasticity formula takes into consideration the current size of the sectors as captured by their incomes. As it is based on forestry output accounting, this may not give the full picture, in view of the size of other sectors such as agriculture. It is nonetheless a useful tool and it addresses an interesting question. In economics, elasticity measures how responsive an economic variable is to a change in another variable. An elasticity value greater than 1 implies that household income is elastic (i.e., more responsive). If the elasticity lies between 0 and 1, it means that household income is inelastic (i.e., not responsive). The full results of the elasticity analysis are presented in annex V and summarized below, in table 10.
The summary presented in table 10 predicts that household incomes are most responsive to exogenous increases in the demand for output from the agriculture sector (it is the only
Table 8. Closed-loop (indirect) effect (Tanzanian shillings)
Household sector Hypothesized currentannual income (TSh)
Total income (TSh) after an exogenous increase in demand for output from:
Forestry and hunting Agriculture Wood, paper and printing
Rural poor 250 000 332 150 329 450 318 725
Rural non-poor 600 000 1 355 340 1 331 340 1 236 360
Urban poor 300 000 321 540 320 910 318 420
Urban non-poor 900 000 1 395 810 1 380 690 1 321 650
Source: Author’s computation
Table 9. Percentage deconstruction of the multiplier effect of increases in the forestry and hunting sector on households in the United Republic of Tanzania
Household sector
Deconstruction of the multiplier effect from a unit increase in the forestry and huntingsector
Open-loop effect (%) Closed-loop effect (%)
Impacts on incomes of the rural poor 37.22 62.78
Impacts on incomes of the rural non-poor 32.65 67.35
Impacts on incomes of the urban poor 17.27 82.73
Impacts on incomes of the urban non-poor 22.64 77.36
Source: Author’s computation
26

Figure 6. Classification of activities, according to the size of their forward and backward linkages
1
2
3 4
5
6 7
8 9 10 11
12 13
14
15
16 17
0.01
0.51
1.01
1.51
2.01
2.51
3.01
0.63 0.73 0.83 0.93 1.03 1.13 1.23 1.33
Forw
ard Link
ages
Backward Linkages
Backward and Forward Linkages, Tanzania 2001
Forward Oriented
Backward Oriented
Key
Weak Sectors
sector with elasticity values greater than 1 and one of the largest based on income size), which leads to the conclusion that, although increased investments in the forestry and hunting sector have a greater relative impact on household welfare (rural poor, rural non-poor, urban poor and urban non-poor), household incomes are more responsive to investments in the agriculture sector given its current size. Given the same income levels (output) as agriculture, however, household incomes will be more responsive to investments in forestry and hunting than agriculture.
3.4 Forward and backward linkagesThis section focuses specifically on the economic relationships that exist between the forestry and hunting sector and other productive sectors in the economy, by studying forward and backward linkages. Forward linkages
Table 10. Multipliers as elasticity values
Impacts on incomes of:Exogenous increase in the demand of output from:
Forestry and hunting* Agriculture* Wood, paper and printing*
Rural poor 0.16 1.65 0.05
Rural non-poor 0.13 1.33 0.05
Urban poor 0.09 1 0.06
Urban non-poor 0.09 1 0.05
Source: Author’s computation
*Values have been rounded off
1 = AAGRIC (agriculture), 2 = ALIVES (livestock and fisheries), 3 = AFOREST (forestry and hunting), 4 = AMININ (mining), 5 = AFOOD (food processing), 6 = ACLOTH (textiles), 7 = AOTHM (other manufacturing), 8 = AWOODP (wood, paper and printing), 9 = AEQUIP (machinery and equipment), 10 = AUTILI (utilities), 11 = ACONST (construction), 12 = ATRADE (trade), 13 = AHOTEL (hotels and restaurants), 14 = ATRANS (transport and communications), 15 = AESTAT (real estate), 16 = AADMIN (public administration) and 17 = APRIVS (private services).
27 FOREST ECOSYSTEMS IN THE TRANSITION TO A GREEN ECONOMY AND THE ROLE OF REDD+ IN THE UNITED REPUBLIC OF TANZANIA
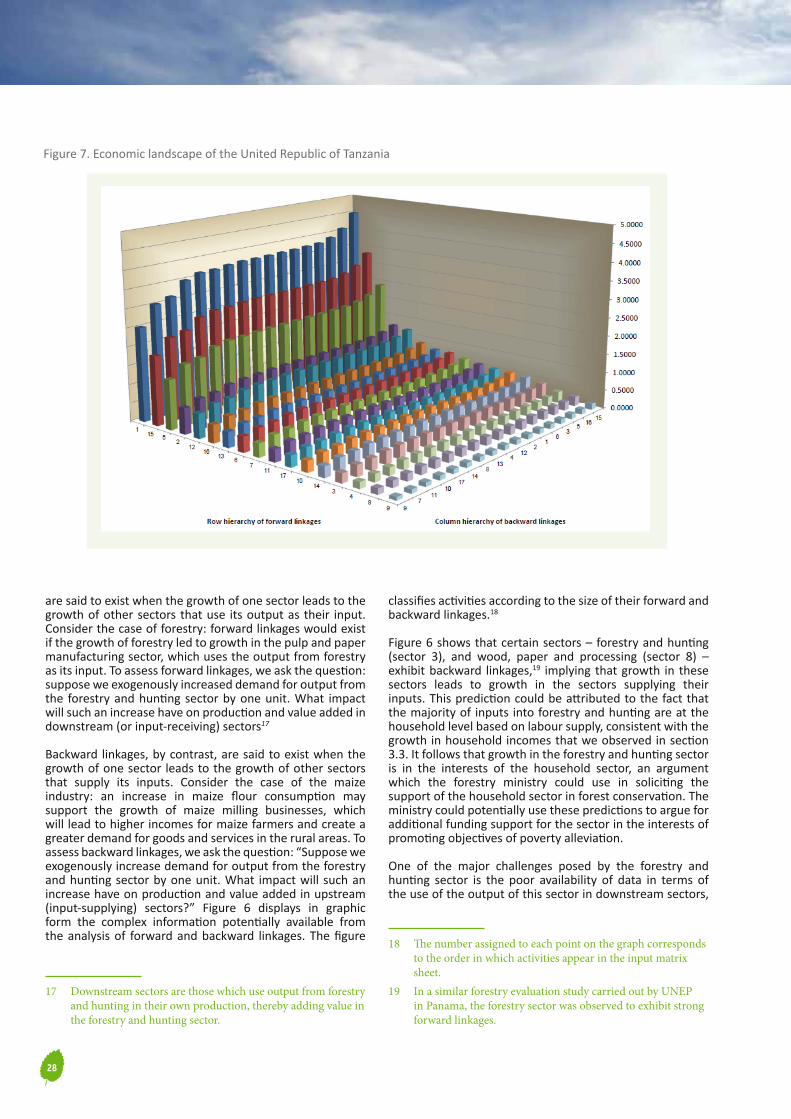
are said to exist when the growth of one sector leads to the growth of other sectors that use its output as their input. Consider the case of forestry: forward linkages would exist if the growth of forestry led to growth in the pulp and paper manufacturing sector, which uses the output from forestry as its input. To assess forward linkages, we ask the question: suppose we exogenously increased demand for output from the forestry and hunting sector by one unit. What impact will such an increase have on production and value added in downstream (or input-receiving) sectors17
Backward linkages, by contrast, are said to exist when the growth of one sector leads to the growth of other sectors that supply its inputs. Consider the case of the maize industry: an increase in maize flour consumption may support the growth of maize milling businesses, which will lead to higher incomes for maize farmers and create a greater demand for goods and services in the rural areas. To assess backward linkages, we ask the question: “Suppose we exogenously increase demand for output from the forestry and hunting sector by one unit. What impact will such an increase have on production and value added in upstream (input-supplying) sectors?” Figure 6 displays in graphic form the complex information potentially available from the analysis of forward and backward linkages. The figure
17 Downstream sectors are those which use output from forestry and hunting in their own production, thereby adding value in the forestry and hunting sector.
classifies activities according to the size of their forward and backward linkages.18
Figure 6 shows that certain sectors – forestry and hunting (sector 3), and wood, paper and processing (sector 8) – exhibit backward linkages,19 implying that growth in these sectors leads to growth in the sectors supplying their inputs. This prediction could be attributed to the fact that the majority of inputs into forestry and hunting are at the household level based on labour supply, consistent with the growth in household incomes that we observed in section 3.3. It follows that growth in the forestry and hunting sector is in the interests of the household sector, an argument which the forestry ministry could use in soliciting the support of the household sector in forest conservation. The ministry could potentially use these predictions to argue for additional funding support for the sector in the interests of promoting objectives of poverty alleviation.
One of the major challenges posed by the forestry and hunting sector is the poor availability of data in terms of the use of the output of this sector in downstream sectors,
18 The number assigned to each point on the graph corresponds to the order in which activities appear in the input matrix sheet.
19 In a similar forestry evaluation study carried out by UNEP in Panama, the forestry sector was observed to exhibit strong forward linkages.
Figure 7. Economic landscape of the United Republic of Tanzania
28

which may explain the observed lack of forward linkages. It is worth noting that the following sectors are considered key on account of simultaneously exhibiting strong forward and backward linkages: agriculture (AAGRIC, activity 1), food processing (AFOOD, activity 5), and real estate (AESTAT, activity 15). The following sectors are considered weak on account of simultaneously exhibiting weak forward and backward linkages: other manufacturing (AOTHM, activity 7), equipment (AEQUIP, activity 9) and construction (ACONST, activity 11).
For an even better picture of the economic interlinkages, we now present the economic landscape of the United Republic of Tanzania in figure 7. Economic landscapes enable us to visualize, in a simple picture, complex relations in the economy, and also those between individual sectors and the economy as a whole. The axes of the economic landscapes are the sectors or agents involved in the productive processes, while the heights are the values resulting from the transactions and interactions, either directly or indirectly. The heights could include, for example, values of production, value added, imports and number of people employed. In presenting the economic landscape of the United Republic of Tanzania, the report identifies sectors based on the first order change in the sum of all cells of the inverse matrix caused by changes in the technical coefficients.20
Our results show that the forestry and hunting sector (AFOREST, activity 3) ranks fourth of all the country’s industries, based on the backward linkage hierarchy, and behind those of food processing (AFOOD, activity 5), public administration (AADMIN, activity 16) and real estate (AESTAT, activity 15), which supports our interpretation of the results based on our analysis of figure 6.
3.5structural path analysisIt is important for policymakers to know the path through which the value of increased activity in a sector passes to households and other agents in the economy. This helps them see in detail how the effect of a change in a sector unfolds before getting to the final household type. The objective of this section is to apply structural path analysis to the social accounting matrices framework, to identify the path through which influence of a particular sector is transmitted.21 In section 3.3, we highlighted the fact that a one-unit exogenous increase in the demand for forestry and hunting leads to increases of 0.5 units in the income of the
20 This is similar to the multiplier product matrix – also known as first order intensity field of influence.
21 In a framework of the social accounting matrices type, one production activity can influence another through the intermediate effects on factors and institutions (households) which are considered exogenous in the input-output framework (Defourny and Thorbecke, 1984).
rural poor; 1.9 units in the income of the rural non-poor; 0.1 units in the income of the urban poor; and 0.7 units in the income of the urban non-poor.
This impact, however, has a channel through which it passes before reaching these agents. Structural analysis seeks to evaluate which other agents are affected before the final increase of 0.5 units for the rural poor. That is, while we know that a shock in the forestry sector has a final impact on the rural poor, we need to ascertain which other sectors or accounts were affected before the final impact on the rural poor. Thus, we consider how an exogenous increase in forestry and hunting (AFOREST) affects different household agents. In other words, we endeavour to answer the question: “Does the increase of 0.5 units for the rural poor affect only this group or does it first have an impact on the urban rich before trickling down to the rural poor?”
Starting with the influence of forestry on the rural poor, we find that 54.5 per cent of the multiplier travels through the path connecting forestry to the rural poor directly. At the same time, 5.1 per cent of the multiplier travels through the rural non-poor, onward to subsistence labour, then to agriculture, before influencing the rural poor. This makes sense, given the level of communal living and dependence in many African countries. In the case of the rural non-poor, the majority (74.5 per cent) of the multiplier travels directly to the rural non-poor, while a mere 2.1 per cent travels through livestock consumption to the rural non-poor.
3.6 sectoral growth and price impactsLet us suppose that we exogenously increased the demand for output from each of the sectors sequentially by an equal amount (say, an equal increase of 1 per cent). Policymakers might be interested in the answer to the following question: “What would be the impact of such sequential increases on aggregate GDP in absolute terms and in terms of elasticity values?” As expected, some sectors would have a huge impact on GDP in absolute value while the impact of others would be relatively small. In addition, GDP might be elastic in response to the growth of some sectors and inelastic in response to the growth of others. Figure 8 shows the productivity of each sector by evaluating each sector’s impact on aggregate GDP based on an equal level of shock on all the sectors.
Figure 8 gives a powerful message: increasing the output of the forestry and hunting sector by 1 percentage point has the second highest impact on aggregate GDP, after that of the real estate sector. The importance of this prediction for macroeconomic policy planning in the United Republic of Tanzania should be self-evident: the performance of aggregate GDP in that country is intimately linked with the well-being of the forestry and hunting sector. The model predicts that it is in the interests of GDP growth in the United Republic of Tanzania that adequate investments are
29 FOREST ECOSYSTEMS IN THE TRANSITION TO A GREEN ECONOMY AND THE ROLE OF REDD+ IN THE UNITED REPUBLIC OF TANZANIA

made to sustain a healthy and vibrant forestry and hunting sector. In terms of elasticity, (defined as the percentage change in aggregate GDP caused by a 1 percentage point change in the sector’s production (i.e., in its supply), the forestry and hunting sector has one of the lowest elasticity values. In conclusion, the model predicts that increases in output from the forestry and hunting sector would have a huge impact on the GDP of the United Republic of Tanzania. To reiterate, and as noted in figure 8, the following sectors have a comparatively large impact on GDP: real estate, agriculture and food processing, and they are identified as key sectors in figure 6.
3.7exogenous demand shocksSection 3.3 considered the impact on the incomes of the rural poor, rural non-poor, urban poor and urban non-poor households of an exogenous demand shock on the forestry and hunting sector. This section considers the impact of a similar exogenous demand shock on all the other production sectors in the economy. Policymakers may wish to know by how much the GDP of other production sectors in the economy would increase or decrease as a result of a 10 per
cent exogenous demand shock on the forestry and hunting sector. Table 11 provides the answer to this question.
Table 11 predicts that the incomes of all sectors respond positively to an exogenous increase in the demand for output from the forestry and hunting sector. It follows from this prediction that a vibrant and healthy forestry and hunting sector is in the business interests of all production sectors that have an economic relationship with the forestry and hunting sectors. Table 11 further predicts that the forestry input is more important to the performance of some sectors than to that of others. Thus, the model predicts that, as a result of this shock, there would be an increase in GDP in absolute value by at least TSh 1 billion (US$ 600,000) in the following sectors: agriculture, real estate, food processing, livestock, trade, textiles, hotels and restaurants, other manufacturing and public administration. In fact, the GDP of agriculture increases by a staggering TSh 11 billion (US$ 7 million) as a result of the shock. These are sectors that must have a direct interest in the performance of the forestry and hunting sector because, if it underperforms, it will directly affect their bottom lines. The minister responsible for forest resources and their sustainable management can use this evidence to argue for the support of these interdependent sectors in sustainable forestry. The most compelling aspect of this prediction is that it is not based on some contentious economic valuation methodology, but on actual data on intersectoral transactions, as collected in the social accounting matrices for the United Republic of Tanzania.
Figure 8. Sectoral growth impact and GDP elasticity: shock of 1 per cent on aggregate GDP
0.00
0.10
0.20
0.30
0.40
0.50
0.60
0.00
1.00
2.00
3.00
4.00
5.00
6.00
7.00
CEST
AT
CFORE
ST
CLIV
ES2
CADM
IN
CAGR
IC
CFOOD
CHOTE
L
CUTI
LI
CCONST
CTRA
DE
CPRI
VS
CCLO
TH
CMIN
IN
CWOODP
CTRA
NS
COTH
M2
CEQUIP
GDP
elas)city
Percen
tage cha
nge of GDP
Percentage change of GDP GDP elasKcity
30

3.8exogenous price shocksSuppose there is a 10 per cent exogenous price shock on the sectors of forestry and hunting, and of wood, paper and printing. Policymakers may wish to know the impact of the price shocks on the welfare of households (i.e., on the incomes of the rural poor, rural non-poor, urban poor and urban non-poor households). The answer to this question is provided in table 12, which predicts that households fare better with an exogenous increase in the price of output from the wood, paper and printing sector, compared to the forestry and hunting sector, a result consistent with the
conclusions drawn from the comparison of the impacts of the direct and indirect multiplier on households.
Policymakers may further wish to know whether the GDP of other production sectors in the economy would increase or decrease as a result of the price shocks. The results of this analysis are summarized in table 13, which predicts that a price shock on the forestry and hunting sector generally leads to increases in income in all the sectors, and this echoes our earlier conclusion that increased activity in the forestry and hunting sector is in the business interests of most, if not all sectors. The sectors that would benefit the most from such a policy are: wood, paper and printing; agriculture; public administration; real estate; food processing; and livestock and fisheries. Since these sectors benefit the most
Table 13. Effects on the forestry and hunting, and wood, paper and printing sectors of a 10 per cent price shock
Activity GDP before price
shock(TSh billion)
Forestry and hunting sector Wood, paper and printing sector
Absolute change in GDP after priceshock (TSh billion)
Percentage change in GDP after price
shock*
Absolute change in GDP after priceshock (TSh billion)
Percentage change in GDP after price
shock*
Wood, paper and printing(AWOODP)
144.86 257.59 1.78 332.66 2.30
Forestry and hunting(AFOREST)
300.53 94.91 0.32 79.91 0.27
Livestock and fisheries(ALIVES)
629.72 107.05 0.17 164.99 0.26
Construction(ACONST)
769.60 94.35 0.12 701.41 0.91
Public administration(AADMIN)
1 585.08 189.42 0.12 1 300.08 0.82
Private services(APRIVS)
401.92 47.75 0.12 334.92 0.83
Other manufacturing(AOTHM)
381.80 35.20 0.09 174.41 0.46
Real estate(AESTAT)
2 032.60 186.19 0.09 1 061.02 0.52
Utilities(AUTILI)
216.43 17.03 0.08 93.91 0.43
Food processing(AFOOD)
1 570.49 123.44 0.08 483.87 0.31
Hotels and restaurants(AHOTEL)
453.81 35.49 0.08 155.29 0.34
Transport and communications(ATRANS)
684.59 52.99 0.08 279.45 0.41
Textiles(ACLOTH)
412.33 30.59 0.07 144.44 0.35
Trade(ATRADE)
1 013.36 72.66 0.07 339.88 0.34
Agriculture(AAGRIC)
3 223.96 228.90 0.07 880.14 0.27
Mining(AMININ)
128.2 8.49 0.07 34.81 0.27
Machinery and equipment(AEQUIP)
115.04 5.37 0.05 24.86 0.22
Source: Author’s computation
*Values have been rounded off
31 FOREST ECOSYSTEMS IN THE TRANSITION TO A GREEN ECONOMY AND THE ROLE OF REDD+ IN THE UNITED REPUBLIC OF TANZANIA
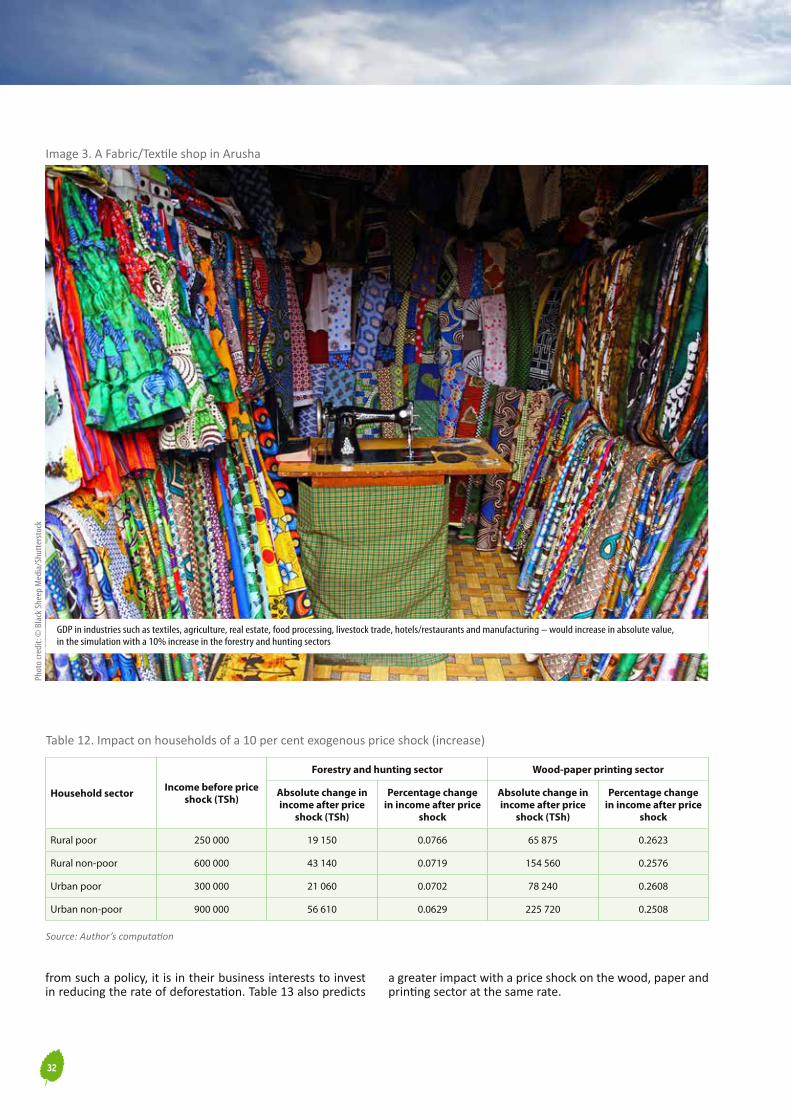
Image 3. A Fabric/Textile shop in Arusha
Phot
o cr
edit:
© B
lack
She
ep M
edia
/Shu
tters
tock
GDP in industries such as textiles, agriculture, real estate, food processing, livestock trade, hotels/restaurants and manufacturing – would increase in absolute value,in the simulation with a 10% increase in the forestry and hunting sectors
Table 12. Impact on households of a 10 per cent exogenous price shock (increase)
Household sector Income before priceshock (TSh)
Forestry and hunting sector Wood-paper printing sector
Absolute change in income after price
shock (TSh)
Percentage change in income after price
shock
Absolute change in income after price
shock (TSh)
Percentage change in income after price
shock
Rural poor 250 000 19 150 0.0766 65 875 0.2623
Rural non-poor 600 000 43 140 0.0719 154 560 0.2576
Urban poor 300 000 21 060 0.0702 78 240 0.2608
Urban non-poor 900 000 56 610 0.0629 225 720 0.2508
Source: Author’s computation
from such a policy, it is in their business interests to invest in reducing the rate of deforestation. Table 13 also predicts
a greater impact with a price shock on the wood, paper and printing sector at the same rate.
32

3.9simulating data to capture higher household demand for forestry outputThe use of forests in many developing countries is usually undervalued by the relevant ministries and managed sustainably in a pluralist and intersectoral manner (see, for example, Roe and Elliot (2010); Hassan and Mungatana (2013), chapter 5). In the United Republic of Tanzania for example, forests are a source of income for some households
or consumed as a supplement to other goods. For instance, in many communities, wood is the source of fuel for cooking food. Data on these activities, however, are typically not available at the national level. As a result, the contribution of the forestry sector to the economy is undervalued, an issue that was briefly highlighted in section 3.4.
The study by Agrawal et al. (2012) observes that in many developing countries the non-industrial economic contributions of forests are typically unrecorded and in many cases between three and ten times higher than the revenues collected in national accounts. One way of dealing with this issue and analysing the situation as it would have appeared if the data had been adequately captured is to use a computable general equilibrium (CGE) model. Consequently, in this section we use a CGE analysis to model the contribution of the forestry and hunting
Table 13. Effects on the forestry and hunting, and wood, paper and printing sectors of a 10 per cent price shock
Activity GDP before price
shock(TSh billion)
Forestry and hunting sector Wood, paper and printing sector
Absolute change in GDP after priceshock (TSh billion)
Percentage change in GDP after price
shock*
Absolute change in GDP after priceshock (TSh billion)
Percentage change in GDP after price
shock*
Wood, paper and printing(AWOODP)
144.86 257.59 1.78 332.66 2.30
Forestry and hunting(AFOREST)
300.53 94.91 0.32 79.91 0.27
Livestock and fisheries(ALIVES)
629.72 107.05 0.17 164.99 0.26
Construction(ACONST)
769.60 94.35 0.12 701.41 0.91
Public administration(AADMIN)
1 585.08 189.42 0.12 1 300.08 0.82
Private services(APRIVS)
401.92 47.75 0.12 334.92 0.83
Other manufacturing(AOTHM)
381.80 35.20 0.09 174.41 0.46
Real estate(AESTAT)
2 032.60 186.19 0.09 1 061.02 0.52
Utilities(AUTILI)
216.43 17.03 0.08 93.91 0.43
Food processing(AFOOD)
1 570.49 123.44 0.08 483.87 0.31
Hotels and restaurants(AHOTEL)
453.81 35.49 0.08 155.29 0.34
Transport and communications(ATRANS)
684.59 52.99 0.08 279.45 0.41
Textiles(ACLOTH)
412.33 30.59 0.07 144.44 0.35
Trade(ATRADE)
1 013.36 72.66 0.07 339.88 0.34
Agriculture(AAGRIC)
3 223.96 228.90 0.07 880.14 0.27
Mining(AMININ)
128.2 8.49 0.07 34.81 0.27
Machinery and equipment(AEQUIP)
115.04 5.37 0.05 24.86 0.22
Source: Author’s computation
*Values have been rounded off
33 FOREST ECOSYSTEMS IN THE TRANSITION TO A GREEN ECONOMY AND THE ROLE OF REDD+ IN THE UNITED REPUBLIC OF TANZANIA

sector, by simulating an increase in the use of the forestry sector greater than that currently reported in the national accounts. We highlight below our key findings, with the full analysis presented in annex XII. If household consumption of the forestry sector is factored into the calculations, in order to capture the contribution of this sector to household demand, the resulting figures show a 0.6 percentage point increase in GDP at market prices, a 0.8 percentage point increase in the consumer price index, and a 0.6 percentage point increase in the GDP deflator. As expected, total income increased for all household types that experienced the shock (table 14). The impact is highest, however, on non-poor rural households with a non-educated household head (a 1.16 percentage point increase in total income). This is followed by households that are in the rural areas below the food poverty line. Capital income increases by about the same rate for all the households but labour income varies by household type. In practical terms, this exercise tells us that if household consumption of the forestry sector were to be appropriately recorded and captured, the sector would show a higher contribution to GDP at market prices and demonstrate that it contributes more to the income of households in the rural area and to the less educated urban non-poor.
Wages increase between 0.028 and 1.53 percentage points in all industries that are based on this scenario (table 11). With increased consumption by households of forestry commodities, labour becomes significantly more expensive
in the meat-processing and dairy-products industry (1.53 percentage point increase). This is as a result of the linkage between this sector and that of forestry and hunting. The wage rate in the forestry and hunting sector also becomes higher with an increase of 1.27 percentage points. There is no significant impact on the price of labour in the utilities and manufacturing sectors, however.
The value added by each industry changes based on the demand from (shock to) the system due to growing consumption in the forestry and hunting sector (table 23). The maize-growing sector has the highest increase in value added, at 1.84 percentage points, followed by that of the manufacturing of basic and industrial chemicals. The wood, paper and printing industry will also experience a reduction in value added by about 0.39 percentage points. Thus, an increase in the consumption by households of forestry and hunting sector commodities will affect the cashew nuts and coffee industries the most, with about 1.19 and 1.08 percentage point decreases in their value added. There will also be an increase in many agricultural prices, the highest increase taking place in cassava (table 25). Little or no change was observed in the prices of utilities, manufacturing and construction. In summary, an increase in the consumption of the forestry sector by households resulted in increases in GDP, household income, wage rate and composite commodity price. The value added of the majority of the industries is negative as a result of this demand-driven simulation.
Table 14. Percentage change in household income
Household type Total income* Capital income* Labour income*
Rural (below food poverty line) 1.09 0.94 1.22
Rural (between food and basic needs poverty lines) 1.07 0.94 1.24
Rural (non-poor – head with no education) 1.16 0.94 1.39
Rural (non-poor – head not finished primary school) 1.03 0.94 1.14
Rural (non-poor – head not finished secondary school) 0.58 0.94 0.94
Rural (non-poor – head finished secondary school) 0.21 0.94 0.22
Urban (below food poverty line) 0.30 0.94 0.67
Urban (between food and basic needs poverty lines) 0.17 0.94 0.63
Urban (non-poor – head with no education) 0.30 0.94 0.99
Urban (non-poor – head not finished primary school) 0.39 0.94 0.74
Urban (non-poor – head not finished secondary school) 0.29 0.94 0.57
Urban (non-poor – head finished secondary school) 0.32 0.94 0.23
Values have been rounded off*
Source: Author’s computation.
34

3.10 cost-benefit analysis of deforestation based on the representation of the forestry sector in the national accounts of the united republic of tanzaniaTable 11 shows that a 10 per cent increase in demand activity in the forestry sector induces an increase of TSh 50 billion (2001) in forestry GDP per year. In chapter 1 it was reported that the United Republic of Tanzania has a total
area of 48.1 million ha of its land surface under forestry. Thus a hypothesized 10 per cent increase in the land area under forestry amounts to 4,810,000 ha (i.e. 52,910,000 ha - 48,100,000 ha = 4,810,000 ha). It follows that the TSh 50 billion increase in GDP following the 10 per cent increase in activity translates to TSh 10,599 per hectare per year (2001).
• Recent estimates of deforestation show that the United Republic of Tanzania loses 372,816 ha of forest annually. For the purposes of the following argumentation, we assume this rate of deforestation continues for the next 20 years (2013–2033). The question addressed in this section is: how do the one-time monetary benefits that the United Republic of Tanzania obtains from cutting down its forests (in terms of useful provisioning forest ecosystem services) compare to the monetary benefits lost through the loss of the value added by forestry to the country’s macroeconomy? Stated otherwise, based on current national income accounting conventions, what does the United Republic of Tanzania stand to gain and lose from continued deforestation in the next 20 years?
Image 4. Coffee beans drying at Gibbs Farm, Tanzania
Phot
o cr
edit:
© Er
ni/S
hutte
rsto
ck
In a simulation for this report, an increase in the consumption by households of forestry and hunting sector commodities will affect the cashew nuts and coffeeindustries the most, with about 1.19 and 1.08 percentage point decreases in their value added
35 FOREST ECOSYSTEMS IN THE TRANSITION TO A GREEN ECONOMY AND THE ROLE OF REDD+ IN THE UNITED REPUBLIC OF TANZANIA

• If a hectare of forest is left standing, it contributes to current forestry and hunting GDP whose value is captured by the Tanzanian NBS. It may be seen from table 2 that forestry and hunting contributed TSh 297 billion to the country’s GDP in 2001, which translates to TSh 6,168 per hectare per year (2001), equivalent to Tsh 29,234 per hectare per year (2013).
• The intersectoral linkages analysis shows that cutting down a hectare of forest has two impacts. To begin with, the cut hectare will not contribute to current GDP, meaning the TSh 6,168 per hectare per year (2001) mentioned in the preceding paragraph will be lost. In addition, forestry adds value in other sectors of the Tanzanian economy, the magnitude of which was estimated in table 11. It follows that the cut hectare will also not match the value added, estimated at TSh 10,599 per hectare per year (2001). In conclusion, cutting a hectare of forest translates to a total loss of TSh 16,767
per hectare per year (2001). This is equivalent to Tsh 83,772 per hectare per year (2013).
• It should be clear from this simple calculation that, at a given point in time (e.g. in 2001), the cost of cutting a hectare of forest is at least 70 per cent more than the benefits (i.e. the net benefits of deforestation to the Tanzanian economy are negative).
For the purposes, however, of providing information and making policy choices that have an impact on the forestry sector, a much more pertinent question would be: what are the economy-wide magnitudes of the costs and benefits if the current rate of deforestation continues for the next 20 years? Are the net benefits of such a small magnitude as to justify their being ignored by development policy? Or are they of such a colossal amount that they necessitate the immediate attention of policymakers?
Table 15. Cost and benefit analysis of deforestation based on the representation of forestry in the Tanzanian SNA
Year Time Discountfactor
Area deforested
annually (ha)
Undiscounted Discounted
Benefits(million TSh)
Costs(million TSh)
Net Benefits(million TSh)
Benefits(million TSh)
Costs(million TSh)
Net Benefits(million TSh)
2013 0 1.0000 372 816 10 898.84 31 231.43 -20 332.59 10 898.84 31 231.43 -20 332.59
2014 1 0.9524 372 816 10 898.84 31 231.43 -20 332.59 10 379.85 29 744.22 -19 364.37
2015 2 0.9070 372 816 10 898.84 31 231.43 -20 332.59 9 885.57 28 327.83 -18 442.26
2016 3 0.8638 372 816 10 898.84 31 231.43 -20 332.59 9 414.83 26 978.88 -17 564.05
2017 4 0.8227 372 816 10 898.84 31 231.43 -20 332.59 8 966.50 25 694.17 -16 727.67
2018 5 0.7835 372 816 10 898.84 31 231.43 -20 332.59 8 539.53 24 470.64 -15 931.11
2019 6 0.7462 372 816 10 898.84 31 231.43 -20 332.59 8 132.88 23 305.37 -15 172.49
2020 7 0.7107 372 816 10 898.84 31 231.43 -20 332.59 7 745.60 22 195.59 -14 449.99
2021 8 0.6768 372 816 10 898.84 31 231.43 -20 332.59 7 376.77 21 138.66 -13 761.90
2022 9 0.6446 372 816 10 898.84 31 231.43 -20 332.59 7 025.49 20 132.06 -13 106.57
2023 10 0.6139 372 816 10 898.84 31 231.43 -20 332.59 6 690.94 19 173.39 -12 482.45
2024 11 0.5847 372 816 10 898.84 31 231.43 -20 332.59 6 372.33 18 260.37 -11 888.04
2025 12 0.5568 372 816 10 898.84 31 231.43 -20 332.59 6 068.88 17 390.83 -11 321.95
2026 13 0.5303 372 816 10 898.84 31 231.43 -20 332.59 5 779.89 16 562.69 -10 782.81
2027 14 0.5051 372 816 10 898.84 31 231.43 -20 332.59 5 504.66 15 773.99 -10 269.34
2028 15 0.4810 372 816 10 898.84 31 231.43 -20 332.59 5 242.53 15 022.85 -9 780.32
2029 16 0.4581 372 816 10 898.84 31 231.43 -20 332.59 4 992.89 14 307.48 -9 314.59
2030 17 0.4363 372 816 10 898.84 31 231.43 -20 332.59 4 755.13 13 626.17 -8 871.04
2031 18 0.4155 372 816 10 898.84 31 231.43 -20 332.59 4 528.69 12 977.30 -8 448.61
2032 19 0.3957 372 816 10 898.84 31 231.43 -20 332.59 4 313.04 12 359.34 -8 046.30
2033 20 0.3769 372 816 10 898.84 31 231.43 -20 332.59 4 107.66 11 770.80 -7 663.14
Source: Author’s computation
36
To answer this question, a cost-benefit analysis was conducted of deforestation as presented in table 15, using a discount rate of 5 per cent, the rate used by the Bank of Tanzania in analysing long-term investments (see Sanga and Mungatana, forthcoming).
The analysis shows that the presentvalueofbenefitstotheTanzanian economy from deforestation amounts to TSh147billion(US$92million)fortheperiod2013-2033. The presentvalueofcostsfromdeforestationtotheTanzanianeconomy amounts to TSh 420 billion (US$ 263 million). The presentvalueofnetlossesfromdeforestationtotheTanzaniaeconomy from this scenario thereforeamountsTSh273billion(US$171million)fortheperiod2013-2033. These are potential real (as opposed to hypothetical) losses to be experienced by production sectors that have economic linkages with the forestry sector, which according to table 11 include both public and private production units. Such losses will have potential implications for their net profits.
The question is whether net losses of TSh 273 billion for the period 2013-2033 are of a magnitude that warrants the attention of these production units. Stated otherwise, are the potential net losses of TSh 273 billion colossal enough to spur the private and public sector into action to protect forests in the United Republic of Tanzania? Another way to ask this question would be: suppose the United Republic of Tanzania had TSh 273 billion (US$ 171 million) today for investment. What would be the economic impact of this investment for the next 20 years? It should be noted that the potential net losses of TSh 273 billion are likely to represent a lower limit, considering that, with population growth among other drivers, the rate of deforestation is likely to increase (and not remain constant as we have assumed here). These calculations are based on statistics that are currently captured in social accounting matrix and do not include the non-marketed values of forest ecosystems. These values will be discussed in the next chapter.
3.11impact of deforestation on projected net revenues for the tanzania Forest services agencyIn this section we ask: what is the impact of the current rate of deforestation on the projected revenues of the TFS? In section 3.10, we used our constructed model to answer this question from an economy-wide perspective. Considering the available revenue and expenditure projections, however, we deemed it advisable to extend the analysis to the TFS.
• If a hectare of forest is left standing, it contributes to the TFS current and future revenues. According to its business plan, the TFS was estimated to have collected TSh 68,173,076,760 in 2013 and 2014 from various receipts, licenses and other miscellaneous payments such as forestry royalties and fees.
• Chapter 1 of this report states that forests in the United Republic of Tanzania cover a total area of 48,100,000 ha. For the purposes of making the case, it is assumed these hectares are managed by the TFS. It follows that the estimated total revenue of TSh 68,173,076,760 translates to TSh 1,417 per hectare per year (2013).
• If a hectare of forest is cut (e.g. through unlicensed deforestation), it will not contribute at least TSh 1,417 per year to TFS revenues22 which allows us to conclude that unlicensed deforestation costs the TFS at least TSh 1,417 per hectare per year (2013) in terms of uncollected revenues.
• The TFS business plan estimates a total budget of TSh 48,388,792,482 for the 2013 and 2014 financial year. Following the methodology developed above, we can infer that TFS spends at least TSh 1,006 per ha per year (2013) to manage a hectare of forest.
• If a hectare of forest is cut (e.g. through unlicensed deforestation), it saves the TFS at least TSh 1,006 per year in terms of expenditure not made, which allows us to conclude that the benefits to the TFS of unlicensed deforestation amount to at least TSh 1,006 per hectare per year (2013) in terms of saved expenditure.
The following assumptions were additionally made to analyse the impact of deforestation on the TFS revenue stream:
• The current rate of deforestation (372,816 hectares per year) will continue for the next 20 years.
• The TFS projected revenues and expenditures will remain constant at the 2013 and 2014 level for the next 20 years.
The results reported in table 16 assume a discount rate of 5 per cent.
The analysis shows that the present value of benefits to TFS from deforestation amounts to TSh 5 billion (US$ 3 million). The present value of costs from deforestation to TFS amounts to TSh 7 billion (US$ 4 million). The present value of net losses from deforestation to TFS from this scenario thus amount to TSh 2 billion (US$ 1 million). Several conclusions can be drawn from table 16.
• At the given assumptions, deforestation reduces the revenues of TFS by at least TSh 355,591,007 per annum. Given the above projected TFS revenues and expenditures, this amounts to a revenue loss of 0.5 per cent per annum.
• The question however is whether the annual revenue losses of at least TSh 355,591,007 per annum are
22 We are using “at least Tshs. 1,417.32” advisedly because the value of a hectare of forest goes beyond the monetary returns captured by the TFS (see chapter 4 of this report).
37 FOREST ECOSYSTEMS IN THE TRANSITION TO A GREEN ECONOMY AND THE ROLE OF REDD+ IN THE UNITED REPUBLIC OF TANZANIA

Table 16. Impact of deforestation on the projected revenues of the TFS
Year Time Discountfactor
Area deforested
annually (ha)
Undiscounted Discounted
Benefits(million TSh)
Costs(million TSh)
Net Benefits(million TSh)
Benefits(million TSh)
Costs(million TSh)
Net Benefits(million TSh)
2013 0 1.0000 372,816 375.05 528.28 -153.23 375.05 528.28 -153.23
2014 1 0.9524 372,816 375.05 528.28 -153.23 357.19 503.12 -145.93
2015 2 0.9070 372,816 375.05 528.28 -153.23 340.18 479.17 -138.98
2016 3 0.8638 372,816 375.05 528.28 -153.23 323.98 456.35 -132.36
2017 4 0.8227 372,816 375.05 528.28 -153.23 308.56 434.62 -126.06
2018 5 0.7835 372,816 375.05 528.28 -153.23 293.86 413.92 -120.06
2019 6 0.7462 372,816 375.05 528.28 -153.23 279.87 394.21 -114.34
2020 7 0.7107 372,816 375.05 528.28 -153.23 266.54 375.44 -108.90
2021 8 0.6768 372,816 375.05 528.28 -153.23 253.85 357.56 -103.71
2022 9 0.6446 372,816 375.05 528.28 -153.23 241.76 340.53 -98.77
2023 10 0.6139 372,816 375.05 528.28 -153.23 230.25 324.32 -94.07
2024 11 0.5847 372,816 375.05 528.28 -153.23 219.29 308.87 -89.59
2025 12 0.5568 372,816 375.05 528.28 -153.23 208.84 294.17 -85.32
2026 13 0.5303 372,816 375.05 528.28 -153.23 198.90 280.16 -81.26
2027 14 0.5051 372,816 375.05 528.28 -153.23 189.43 266.82 -77.39
2028 15 0.4810 372,816 375.05 528.28 -153.23 180.41 254.11 -73.70
2029 16 0.4581 372,816 375.05 528.28 -153.23 171.82 242.01 -70.20
2030 17 0.4363 372,816 375.05 528.28 -153.23 163.63 230.49 -66.85
2031 18 0.4155 372,816 375.05 528.28 -153.23 155.84 219.51 -63.67
2032 19 0.3957 372,816 375.05 528.28 -153.23 148.42 209.06 -60.64
2033 20 0.3769 372,816 375.05 528.28 -153.23 141.35 199.10 -57.75
Source: Author’s computation
significant enough to compel the TFS to take action against deforestation in its private business interest. To answer this question, we refer to the summary of budget estimates for plantations provided in the TFS 2013 and 2014 business plan according to which it costs TSh 223 million per annum to manage the West Kilimanjaro plantation, TSh 83 million per annum to manage the Rubya plantation, TSh 22 million per annum to manage the Kiwira plantation, and TSh 137 million
per annum to manage the Kawatire plantation. The revenue TFS loses at the current rate of deforestation is large enough to fund the annual activities of the West Kilimanjaro plantation. Alternatively, it is large enough to annually fund the combined activities of Rubya, Kiwira and Kawatire plantations. The TFS is best positioned to advise on whether these losses are small enough to ignore taking action against the current rate of deforestation.
38
o4Value of the catchment forests of the united republic of tanzania
4.1introduction
Keymessagesforpolicyanalysts
Based on quantitative and qualitative research methods, chapter 4 reveals the following:
• Every hectare of catchment forest left standing and managed under a sustainable regime has the potential to contribute to the provision of timber forest products (table 17), non-timber forest products (table 18) and intermediate services (table 19) ad infinitum.
• The total area of catchment forest reserves covered in the survey informing the 2003 MNRT study was 677,203 ha; accordingly, the benefits of managing these reserves in a sustainable manner amounts to approximately TSh 1.1 million per ha per annum (2013).
• Based on consideration of the non-market benefits provided by CFRs, it is economically efficient for Tanzania to conserve its CFRs, as shown by the cost-benefit analysis in table 20.
• There are huge potential returns from investing in sustainable forestry management at the national and global levels. The challenge for forest policy is to make this potential operational – converting the intangible benefits into tangible benefits – and to make the business case for sustainable forestry management in a more emphatic manner. The evidence for sustainable forestry management based on non-market values only serves to strengthen an already compelling case.
“The increased efficiencies created by sustainable forest management for the forestry and hunting sector result in increased synergies for REDD+ and a green economy.”
Section 3.10 shows that it is economically efficient for the United Republic of Tanzania to invest in conserving its forests. This conclusion was arrived at in its entirety by analysing the contribution of the forestry and hunting sector to the country’s macroeconomy, as captured in the current system of national accounts; the system that governments the world over use for macroeconomic
policymaking. Chapter 3 thus demonstrates that the case for forest conservation built on market arguments is compelling. It is generally known, however, that forests provide many additional market and non-market benefits. The present chapter uses analysis based on the catchment forests of the United Republic of Tanzania to demonstrate that the case for forest conservation in this country can be
39 FOREST ECOSYSTEMS IN THE TRANSITION TO A GREEN ECONOMY AND THE ROLE OF REDD+ IN THE UNITED REPUBLIC OF TANZANIA

made even stronger by taking into consideration the non-market benefits that they provide.
There are a number of reasons that informed the authors’ decision to use the catchment forests of the United Republic of Tanzania for assessing non-market values. All the valuation work presented in the present report is based on analysing existing information (as was the case in chapter 3). Much more compelling, however, was the research teams’ realization that the Tanzanian Government, through its Ministry of Natural Resources and Tourism, had commissioned a study in 2002 entitled “Resource economic analysis of catchment forest reserves in Tanzania”, whose primary objective was to “generate useful information (facts, data and trends) about the total economic value and the role of catchment forests in the national economy”. The study – the 2003 MNRT study described in section 2.3 above – is best suited for the purpose of market and non-market valuation, particularly because the primary data upon which it was based was collected in 2002. Given that the cost-benefit analysis in section 3.10 was based on a 2001 social accounting matrix, the dataset used in section 3.10 and that used for the 2003 MNRT study should be fully comparable unless there is evidence of structural change between 2001 and 2002. To the best of the authors’ knowledge, no such evidence exists.
According to the 2003 MNRT study, catchment forest reserves make up 13 per cent of the total forest area in the United Republic of Tanzania and are managed under the central government. The 2003 MNRT study focused on the four regions where such reserves are found: Morogoro, Tanga, Kilimanjaro and Arusha. It estimates that the catchment forest reserves provided monetary value in annual benefits through three groups of ecosystem services: timber forest products, non-timber forest products, and the intermediate inputs that the reserves provide to other sectors of the economy. Timber forest products were defined to include the harvest of timber, poles, firewood and withies23 from catchment forest reserves. Non-timber forest products were defined to include the harvest of wild fruits, wild vegetables, mushrooms, honey, traditional medicine, bushmeat, ropes, fodder and stimulants from the reserves. Intermediate inputs were defined to include the role of catchment forest reserves in providing water for domestic and livestock consumption, in carbon sequestration, in underpinning biodiversity and option values, and in generating non-use values, such as those of religious, cultural or symbolic
23 Withies are strong flexible twigs that are used for making ropes and in some places for thatching
Phot
o cr
edit:
© C
IFOR
Image 5. People collecting water
Catchment forest reserves provide water for domestic and livestock consumption
40

significance*. Intermediate inputs were also defined to include the role provided by catchment forest reserves in supporting production in the sectors of irrigation, electricity, fisheries and tourism. In this section, we will briefly outline the data and methods that were used to compile the 2003 MNRT study and present the key results that we need from the study to conduct a cost-benefit analysis of deforestation based on the non-market benefits provided by catchment forest reserves.
4.2 data and methodsThe valuation reported in the 2003 MNRT study was based on primary and secondary data. Primary data were collected from 160 households in villages surrounding catchment forest reserves, using interviews with key stakeholders and with experts (such as park managers, district forest personnel and community project managers). Checklists with detailed quantitative questions were used to interview the following key stakeholders: village elders and managers
of forest reserves, water providers, electricity companies, national parks and agriculture. The household questionnaire was used to estimate the use of goods and services from catchment forest reserves which provide direct benefits to households: both the quantities collected and prices. These data were augmented by secondary information collected from the literature. The study made a host of assumptions in deriving total values, including those required to extrapolate values from the sample to the population, and to estimate average household sizes, proportions of goods or services households obtained from catchment forest reserves, and the quantity of intermediate services that would disappear per year if the reserves were destroyed, and so on. All assumptions used in the valuation are detailed in the 2003 MNRT study.
4.3 resultsThe total area under catchment forest reserves covered in the survey for the 2003 MNRT study amounted to
Table 17. Values for timber forest products (provisioning services) taken from catchment forest reserves (2002 TSh per annum)
Product Morogoro Kilimanjaro Tanga Arusha Total
Timber 9 397 906 225 200 000 641100 000 25 857 706 901 555 612
Poles 615 845 665 924 944 241 9 764 466 2 427 376 500 3 977 930 872
Firewood 3 256 836 254 2 270 944 553 991 054 008 2 758 230 419 9 277 065 234
Withies 89 349 442 55 334 906 69 179 765 337 830 750 551 694 863
Total 14 708 246 581
Source: Author’s computation
Table 18. Values for non-timber forest products, provisioning services, taken from catchment forest reserves (2002 TSh per annum)
Product Morogoro Kilimanjaro Tanga Arusha Total
Wild fruits 477 414 458 6 741 864 45 756 573 529 912 895
Wild vegetables 939 393 280 785 637 914 145 511 898 1 870 543 092
Mushrooms 21 483 650 21 483 650
Bushmeat 98 466 732 3 064 712 13 980 940 115 512 384
Ropes 33 472 568 9 731 750 43 204 318
Honey 171 885 422 43 920 434 215 805 856
Fodder 18 394 268 216 3 618 133 680 3 302 433 216 25 314 835 112
Traditional medicines 1 618 159 76 515 655 96 633 384 129 334 179 304 101 377
Stimulants 292 147 440 292 147 440
Total 28 707 546 124
Source: Author’s computation
* (through community governance by elders which is known as Mpanga cha Kijiji)
41 FOREST ECOSYSTEMS IN THE TRANSITION TO A GREEN ECONOMY AND THE ROLE OF REDD+ IN THE UNITED REPUBLIC OF TANZANIA

An overview of the value of forest ecosystem services in the CFRs in the United Republic of Tanzania as highlighted in figure above. It is based on household questionnaires, literature research, interviews with experts, and also on market prices for timber, electricity generated for each plant and information about other products and services (based on MNRT, 2003).
Figure 9. Overview value of ecosystem services in 4 areas in Tanzania (TSh/year)
Arusha
Tanga
Morogoro
Kilimanjaro
TANZANIA
0
0.5 Billion
1 Billion
1,5 Billion
2 Billion
2,5 Billion
3 Billion
3,5 Billion
Morogoro Kilimanjaro Tanga Arusha
Timber forest products
Non-timber forest products
TimberPOLES
FIREWOODWithis
Soil erosion Fruits, vegetables, mushrooms, etcTourism
Water provisioning for domestic use and livestock
Kilimanjaro Tanga Arusha
0
5 Billion
10 Billion
15 Billion
20 Billion
25 Billion
30 Billion
KilimanjaroMorogoro Tanga Arusha
Morogoro0
2 Billion
4 Billion
6 Billion
8 Billion
10 Billion
12 Billion
irrigation 92,900,000
National Totals
Electricity 56,538,551,335Fisheries 289,500,000
Overview value of ecosystem services in 4 areas in Tanzania (TSh/year)
Non-use values 1,834,210,000
Carbon sequestration 50,872,507,000Biodiversity and option values 4,035,262,000
Other forest ecosystem services
42

Table 19. Values for intermediate services (all ecosystem service excluding timber and non-timber forest products) provided by catchment forest reserves (2002 TSh per annum)
Service Morogoro Kilimanjaro Tanga Arusha Total
Providing water fordomestic use and livestock 139 764 000 434 688 000 290 250 000 1 310 000 000 2 174 702 000
Irrigation 92 900 000
Electricity 56 538 551 335
Fisheries 289 500 000
Soil erosion 498 168 000 535 951 763 590 969 250 245 038 500 1 870 127 513
Tourism 100 000 25 326 000 1 162 407 000 1 187 833 000
Carbon sequestration 50 872 507 000
Biodiversity and option values 4 035 262 000
Non-use values 1 834 210 000
Total 118 895 592 848
677,203 ha, distributed as follows: Morogoro – 385,352 ha, Kilimanjaro – 115,203 ha, Tanga – 84,005 and Arusha – 92,643. Tables 17–19 provide a summary of the annual values estimated for the three groups of goods and services.
4.4 Cost benefit analysis of deforestation based on the non-market benefits provided by catchment forest reservesAs shown in section 3.10, the United Republic of Tanzania loses 372,816 ha of forest annually through deforestation. In the following arguments, it is assumed that this rate of deforestation will continue for the next 20 years (2013–2033). The question addressed in this section is: what are the economy-wide benefits and costs of deforestation to the United Republic of Tanzania based on analysing the benefits provided by CFRs that are not captured within the current SNA? To answer this question, we proceed as follows:
• If a hectare of catchment forest is left standing and managed under a sustainable regime, it has the potential to provide timber forest products (table 17), non-timber forest products (table 18) and intermediate services (table 19) ad infinitum. For argument’s sake, we assume the annual values reported in tables 17–19, whose sum of TSh 162 billion (2002) represent annual sustainable values. The total area of CFRs is 677,202 ha (MNRT 2003). This leads us to conclude that the benefits
of managing CFRs on a sustainable basis amount to TSh 239,679 per ha per annum (2002), which translatestoTSh1,135,909perhaperannum(2013).
• The decision to cut down a hectare of catchment forest has costs and benefits. Benefits are defined by the value of timber forest products that would accrue to the economy at the date of cutting the forest (t = 0). Table 17 shows that this value would amount to TSh 14.71 billion, which translates to TSh 21,719 per ha (2002) or TSh 102,933 per ha per annum (2013). This is a one-off benefit enjoyed at t = 0. The cost of this decision is computed as follows. At t = 0 when the forest is cut, society will lose the value of non-timber forest products (table 17) and the value of intermediate services (table 19), which amounts to TSh 217,960 per ha (2002) or TSh1,032,976perhaperannum(2013). Beginning with t = 1, the cost will amount to the value of lost timber forest products (table 17), the value of lost non-timber forest products (table 18) and the value of lost intermediate services (table 19) ad infinitum, which translates to TSh 239,679 per ha (2002) orTSh1,135,909perhaperannum(2013).
Following the assumptions and procedures of section 3.10, table 20 presents the costs and benefits analysis of the decision to deforest.
The analysis shows that the present value of thebenefitsfrom deforestation to the macroeconomy amount toapproximately TSh 38 billion (about US$ 24 million) fortheperiod2013-2033. The present value of the costsfromdeforestationtothemacroeconomyamountstoTSh5,627billion (about US$ 3.5 billion) for the period 2013-2033. The present value of the netlossesfromdeforestationfromthisscenariothereforeamountsTShs5,588billion(aboutUS$3.5billion)fortheperiod2013-2033. The results from this analysis are also clear: basedonconsiderationofthe
43 FOREST ECOSYSTEMS IN THE TRANSITION TO A GREEN ECONOMY AND THE ROLE OF REDD+ IN THE UNITED REPUBLIC OF TANZANIA

non-marketbenefitsprovidedbyCFRs, it iseconomicallyefficient for theUnitedRepublicofTanzania toconserveitsCFRs.
There are a number of caveats that accompany the interpretation of the net losses of TShs 5,588 billion for the period 2013-2033. To begin with, as opposed to the cost and benefit analysis of section 3.10, where costs and benefits were computed based on real or actual or tangible transactions captured by the Tanzanian social accounting matrix, the analysis in this section is not reflected in the SNA. The costs and benefits considered in this section are not tangible; they were computed after making assumptions about the behaviour of private enterprises and individuals using the goods and services supplied by CRS in consumption and production, and after applying specialized economic valuation techniques. We can only argue that given the model assumptions and if one accepts the economic approach to non-market valuation, then the net losses from deforestation amounts to approximately TShs5,588billionfor the period 2013-2033.
4.5 Key insights provided by the valuation of forest ecosystem services in the united republic of tanzaniaThe following conclusions can be drawn based on the analysis set out in this report:
• Investing in sustainable forestry in the United Republic of Tanzania has important positive implications for rural poverty alleviation.
Table 20. Cost and benefit analysis of deforestation based on the non-market benefits provided by CFRs
Year Time Discountfactor
Area deforested
annually (ha)
Undiscounted Discounted
Benefits(million TSh)
Costs(million TSh)
Net Benefits(million TSh)
Benefits(million TSh)
Costs(million TSh)
Net Benefits(million TSh)
2013 0 1.0000 372 816 38 375.15 349 145.41 -310 770.27 38 375.15 349 145.41 -310 770.27
2014 1 0.9524 372 816 - 423 485.10 -423 485.10 - 403 319.14 -403 319.14
2015 2 0.9070 372 816 - 423 485.10 -423 485.10 - 384 113.47 -384 113.47
2016 3 0.8638 372 816 - 423 485.10 -423 485.10 - 365 822.35 -365 822.35
2017 4 0.8227 372 816 - 423 485.10 -423 485.10 - 348 402.24 -348 402.24
2018 5 0.7835 372 816 - 423 485.10 -423 485.10 - 331 811.66 -331 811.66
2019 6 0.7462 372 816 - 423 485.10 - 423 485.10 - 316 011.10 -316 011.10
2020 7 0.7107 372 816 - 423 485.10 -423 485.10 - 300 962.96 -300 962.96
2021 8 0.6768 372 816 - 423 485.10 -423 485.10 - 286 631.39 -286 631.39
2022 9 0.6446 372 816 - 423 485.10 -423 485.10 - 272 982.27 -272 982.27
2023 10 0.6139 372 816 - 423 485.10 -423 485.10 - 259 983.12 -259 983.12
2024 11 0.5847 372 816 - 423 485.10 -423 485.10 - 247 602.97 -247 602.97
2025 12 0.5568 372 816 - 423 485.10 -423 485.10 - 235 812.35 -235 812.35
2026 13 0.5303 372 816 - 423 485.10 -423 485.10 - 224 583.19 -224 583.19
2027 14 0.5051 372 816 - 423 485.10 -423 485.10 - 213 888.95 -213 888.95
2028 15 0.4810 372 816 - 423 485.10 -423 485.10 - 203 703.57 -203 703.57
2029 16 0.4581 372 816 - 423 485.10 -423 485.10 - 194 003.40 -194 003.40
2030 17 0.4363 372 816 - 423 485.10 -423 485.10 - 184 765.15 -184 765.15
2031 18 0.4155 372 816 - 423 485.10 -423 485.10 - 175 966.81 -175 966.81
2032 19 0.3957 372 816 - 423 485.10 -423 485.10 - 167 587.43 -167 587.43
2033 20 0.3769 372 816 - 423 485.10 -423 485.10 - 159 607.08 -159 607.08
Source: Author’s computation
44

• The costs and benefits analysis based on the representation of forestry in the SNA (table 15) makes the case for sustainable forestry in the United Republic of Tanzania. If it is indeed true that the country’s market economy stands to lose at least TSh 420 billion in the next 20 years at the current rates of deforestation under the business-as-usual scenario, then there necessarily exists evidence for investing in forest conservation. The Tanzanian minister responsible for forest resourcescanusethisquantitativeevidencetoargueformorebudgetarysupporttoforestryfrompublicandprivatesources.
• The cost and benefit analysis based on the benefits supplied by CFRs which are mostly non-market (table 20) makes the case for sustainable forestry in the United Republic of Tanzania even more robust. This report acknowledges in chapter 1, however, the weaknesses of the non-market valuation argument for sustainable forestry, including some disciplines which are averse to the monetary valuation of non-market benefits, and the fact that non-market monetary values are not recognized by the SNA (and do not count for
measures of economic performance). In responding to the first weakness, we find it very unlikely that the social desirability for sustainable forestry would change because of a preference for an alternative metric for the valuation of non-market forest goods and services (e.g. religion, culture, aesthetics, etc.). Our response to the second weakness is that non-market values make the case for sustainable forestry stronger. There exists compelling evidence to build a necessary case for sustainable forestry based on the market benefits argument. The evidence for sustainable forestry based on non-market values only serves to strengthen an already compelling case. Inour view,whathasbeenmissingisanefforttopackageandpresentthecaseforsustainableforestrybasedonintersectorallinkagesinaway that decision-makers (especially fromoutsideeconomics)wouldfindusefulforpolicyanalysis.
Tables 17–20- suggest that huge potential may be reaped from investing in sustainable forestry at the national and global levels. The challenge for forest policy is to make this potential operational (converting the intangible benefits into tangible benefits), an issue addressed in chapter 5.
45 FOREST ECOSYSTEMS IN THE TRANSITION TO A GREEN ECONOMY AND THE ROLE OF REDD+ IN THE UNITED REPUBLIC OF TANZANIA

As shown in chapter 3, the forestry and hunting sector has emerged as that with the greatest predicted impact on increasing the levels of household incomes (rural poor and non-poor, and urban poor and non-poor). Investing in and expanding this sector could be an important component of a poverty alleviation strategy. It was further predicted that the GDP of all production sectors responded positively to increased activity in the forestry and hunting sector, leading to the conclusion that keeping this sector healthy and vibrant is in the business interests of all production sectors sharing an economic relationship with it, including those of agriculture, real estate, food processing, livestock, trade, textiles, hotels and restaurants, other manufacturing sectors and public administration.
It was further shown that the levels of monetary losses attributed to the current rate of deforestation are large enough to compel the Tanzania Forest Services to take action to avert deforestation, not only in the interests of business but also in view of the socioeconomic role that this sector plays in the country’s economy. For example, it was shown that the revenue lost to the Tanzania Forest Services through deforestation would be sufficient for it to fund the annual budget of the West Kilimanjaro plantation, or equivalent to the combined annual budgets of the plantations of Rubya, Kiwira and Kawatire.
o5towards a sustainable forestry management in the united republic of tanzaniaFigure 10. Sustainable forestry management in the United Republic of Tanzania
46

Lastly, chapter 4 showed that, beyond providing local and national benefits, the Tanzanian forests provide global benefits. It is against the backdrop described in that chapter that a second stakeholder workshop was organized to identify: first, policy options for sustainable forest management in the United Republic of Tanzania; second, potential roles of the household sector in supporting sustainable forestry in the United Republic of Tanzania; third, potential roles of the private sector in supporting sustainable forestry in the United Republic of Tanzania; and, fourth, the potential role of REDD+ investments in the transition to a green economy in the United Republic of Tanzania.
5.1 policy options for sustainable forest management in the united republic of tanzaniaThe workshop observed that a critical constraint on sustainable forest management was the lack of effective implementation and enforcement of existing forest policy and laws, a situation that must be addressed forthwith. It was earlier observed that the agricultural expansion and demand for rural energy fuelled by population growth
are major proximate driving forces behind deforestation. Accordingly, in the interests of sustainable forest management there is a need to integrate forestry with agricultural development, within multiple land-use models, and to provide affordable alternatives to firewood and charcoal as sources of household energy, in particular in the rural areas. Other aspects considered important in a strategy for sustainable forest management include:
• Investment in an effective forest extension education programme, which should ideally be targeted at informing household and production sectors of the important roles that forestry plays in social welfare and in supporting economy-wide income generation;
• Investment in providing improved and alternative sources of livelihood for communities that depend on forest resources, for a greater share of their sustenance;
• Investment in the establishment of plantations to meet current and future demand for forest products, in particular fuelwood and timber construction materials;
• Involvement of local communities in forest management and conservation;
• Collaboration between the forestry department and other production sectors in the economy to expand the current acreage of forests;
• Development of a strong policy on the legal protection of forests, in combination with the proper demarcation of forest boundaries to prevent encroachment into existing forest areas;
Image 6. Raking over coals
Phot
o Cr
edit:
© C
IFOR
Need to provide affordable alternatives to charcoal as sources of household energy
47 FOREST ECOSYSTEMS IN THE TRANSITION TO A GREEN ECONOMY AND THE ROLE OF REDD+ IN THE UNITED REPUBLIC OF TANZANIA
• Regulation and control of trade in forest products to ensure that such trade is sustainable;
• Appropriate sharing between different stakeholders of the benefits and proceeds of sustainable forest management;
• Provision of adequate funding in the annual national budget for forest management, taking into consideration the need for strengthened and integrated land-use planning;
• Recruitment of adequate personnel as forest guards to patrol and to safeguard best practices;
• Awareness-raising to forge a strong linkage between the private and public sectors to ensure a robust approach to sustainable forest management and protection;
• Sharing of experience and knowledge from different countries, for example though science-policy workshops;
• Development of a framework for understanding the consequences of land-use decisions for biodiversity and ecosystem services related to hunting and forestry;
• Improvement of data quality through continuous monitoring, a requisite for REDD+ readiness.
5.2 potential roles of the household sector in supporting sustainable forestry in the united republic of tanzaniaGiven the demonstrated importance of the forestry and hunting sector to household welfare, the following strategies were suggested to motivate increased household involvement in sustainable forestry:
• Providing incentives for households to plant trees, especially on farms and in villages, through the adoption of conservation agriculture and other agroforestry practices;
• Involving households in the protection and management of forests under the control of the Tanzania Forest
Services by encouraging their participation in the implementation of forest policy;
• Assisting households to identify alternative and diversified income generating activities to divert them from the extraction of forest resources;
• Assisting households to use improved and alternative domestic energy sources to reduce the impact of fuelwood extraction and charcoal burning.
5.3potential roles of the private sector in supporting sustainable forestry in the united republic of tanzania• Given the demonstrated importance of the forestry
and hunting sector to supporting economy-wide production, the following strategies were suggested to motivate increased private sector involvement in sustainable forestry:
• Providing necessary facilities and incentives to support the establishment of plantations, afforestation, and tree-planting programmes at household and national levels;
• Supporting investments in campaigns to raise public awareness of the values of forests and what households and production sectors stand to lose if forests disappear;
• Supporting advocacy and lobbying toward policy formulation and the implementation of the national forest policy;
• Supporting capacity-building at a local level by investing in research, education and training;
• Investing in improved energy technology;
• Investing in empowering rural communities on alternative livelihoods to those which are forest-dependent;
• Investing in efficient wood-processing technology and machinery to reduce wastage in the processing of forest products.
48

5.4potential roles of redd+ investments in a green economy transformation in the united republic of tanzaniaThe REDD+ scheme was designed to provide countries with incentives to reduce emissions from deforestation and forest degradation and encourage them to adopt a sustainable forest management approach-and by so doing enhance their stocks of forest carbon. This report has already shown that, even without REDD+ results-based payments or finance, it makes economic and financial sense for the United Republic of Tanzania to expand the current forest estate in the interests of maximising national welfare. In recognition of the global values of the country’s forests,
however, international resources such as REDD+ could augment forest management and conservation at a national level through:
• Providing financial support through results-based payments or finance;
• Providing technical assistance and training;
• Supporting in-country efforts designed to create awareness of international agreements and treaties that encourage sustainable forestry management;
• Supporting in-country advocacy efforts and efforts designed to motivate better forest policy formulation;
• Support the dissemination of research findings from the United Republic of Tanzania that demonstrate the global values of Tanzanian forests;
• Convincing developed countries to support efforts towards sustainable forest management in developing countries like the United Republic of Tanzania;
Image 7. Market place in East Africa
Phot
o cr
edit:
© A
leks
anda
r Tod
orov
ic/Sh
utte
rsto
ck
Lifting the poor out of poverty with a vibrant green economy – agroforestry products for sale
49 FOREST ECOSYSTEMS IN THE TRANSITION TO A GREEN ECONOMY AND THE ROLE OF REDD+ IN THE UNITED REPUBLIC OF TANZANIA

• Supporting poverty alleviation programmes in the overall rural development strategy of the United Republic of Tanzania.
It can be concluded that REDD+ investments would make an important contribution to a green economy transformation in the United Republic of Tanzania. They would achieve this by supporting investments that reduce household dependence on forests and increase household participation in forest management and conservation, by encouraging strategies that increase the contribution of the private and public sectors in forest conservation and management and by conducting activities that promote greater participation of the international community in supporting forest conservation and management efforts in the United Republic of Tanzania.
Let us leave the last word on this topic with Achim Steiner, Executive Director of the United Nations Environment Programme: “The ecosystem services provided by tropical forests are estimated at around US$ 6,120 per hectare per year. Despite this clear macroeconomic case, the total yearly forest loss averages 13 million ha per year – equivalent to the surface of a football field being destroyed every three seconds. … The true value of forests comes to life when national and local decision-making processes are directed towards natural capital investment, supporting livelihoods and achieving sustainable economic growth.”24
24 Foreword to: Building Natural Capital: How REDD+ Can Support a Green Economy, Report of the International Resource Panel, United Nations Environment Programme, Nairobi, 2014.
50

Agrawal, A.A., A.P. Hastings, M.T.J. Johnson, J.L. Maron, and J. Salminen (2012). Insect herbivores drive real-time ecological and evolutionary change in plant populations. Science 338, 113–116.
Agrawal, Aun, Ben Cashore, Rebecca Hardin, Gill Shepherd, Catherin Benson and Daniel Miller (2013). Economic Contributions of Forests. Background Paper 1, United Nations Forum on Forests, tenth session, Istanbul, Turkey, http://www.un.org/esa/forests/pdf/.session_documents/unff10/EcoContrForests.pdf.
Arrow, K. J.; Debreu, G. (1954). Existence of an equilibrium for a competitive economy. Econometrica 22 (3): 265–290.
Banerjee, O., and J. Alavalapati (2009). A computable general equilibrium analysis of forest concessions in Brazil, Forest Policy and Economics, 11, pp. 244–252.
Cattaneo, A., 2002. Balancing agricultural development and deforestation in the Brazilian Amazon. International Food Policy Research Institute Research Report 129. IFPRI, Washington, D.C.
Dee, Philippa S. (1991). Modeling Steady-State Forestry in a Computable General Equilibrium Context. National Centre for Development Studies, The Australian National University, Working paper No. 91/8.
Defourny, Jacques, and Erik Thorbecke (1984). Structural path analysis and multiplier decomposition within a social accounting matrix framework, The Economic Journal, 94, pp. 111–136.
Division of Environment (2009). Fourth national report on implementation of the Convention on Biological Diversity. Division of Environment, United Republic of Tanzania, Dar es Salaam, 2009, 80 pp.
Division of Environment (2013). National Strategy for Reduced Emissions from Deforestation and Forest Degradation (REDD+). Division of Environment, Vice-President’s Office, United Republic of Tanzania, Dar es Salaam, 2013, 73 pp
Dufournaud, C.M., M. Jerrett, J.T. Quinn, V. Maclaren, 2000. Economy-wide effects of forest policies: a general
equilibrium assessment from Vietnam. Land Economics 76 (1), 15–27.
FAO (2010). Global Forest Resources Assessment 2010. Country Report, United Republic of Tanzania. Food and Agriculture Organization of the United Nations, Rome, 2010, 56 pp.
FBD (2000). Forestry for Poverty Reduction and Economic Growth: National Forest Programme Formulation in Tanzania (draft). Forestry and Beekeeping Division, United Republic of Tanzania, Dar es Salaam, 2000.
FRA (2010). Global Forest Resources Assessments. Food and Agriculture Organization of the United Nations, Rome.
Hassan and Mungatana (eds.) (2013). Implementing Environmental Accounts. Case Studies from Eastern and Southern Africa. Springer.
Kaale, B.K. (2001). Forest Landscape Restoration. United Republic of Tanzania Country Report, IUCN/WWF, 2001, 53 pp.
Kahyarara, G., W. Mbowe and O. Kimweri (2002). Poverty and Deforestation around the Gazetted Forests of the Coastal Belt of Tanzania, Research on Poverty Alleviation, Research Report.
Lofgren, H., R. Harris, S. Robinson (2002). A standard computable general equilibrium (CGE) model in GAMS, Microcomputers in Policy Research 5, International Food Policy Research Institute, Washington, D.C.
Millennium Ecosystem Services Assessment (2005). Ecosystem and Human Well-being. World Health Organization, Geneva, 2005.
MNRT (1998). National Forest Policy. Ministry of Natural Resources and Tourism, United Republic of Tanzania, Dar es Salaam, 1990, 59 pp.
MNRT (2000). Forestry Outlook Studies in Africa (FOSA). Ministry of Natural Resources and Tourism, United Republic of Tanzania, Dar es Salaam, 2000, 36 pp.
NAFROMA (2014). The National Forest Resources Monitoring and Assessment 2009–2014. Tanzania Forest Service Agency, United Republic of Tanzania, Dar es Salaam, 2014.
National Bureau of Statistics, Ministry of Finance (2013). National Accounts of Tanzania Mainland 2001–2012. United Republic of Tanzania, Dar es Salaam.
National Forest Programme in Tanzania (2001). National Forest Programme in Tanzania 2001–2010. Forestry and Beekeeping Division, Ministry of Natural Resources and Tourism, United Republic of Tanzania, Dar es Salaam, 2001, 111 pp.
NBS (National Bureau of Statistics) (2002) Household Budget Survey 2000/01. NBS: Dar es Salaam
o6references
51 FOREST ECOSYSTEMS IN THE TRANSITION TO A GREEN ECONOMY AND THE ROLE OF REDD+ IN THE UNITED REPUBLIC OF TANZANIA

Ngaga, Y.M. (1998). “Analysis of production and trade in forestry products of Tanzania”,
Ngaga, Y.M., (2011). “Forest plantations and woodlots in Tanzania”. African Forest Forum, Nairobi, 2011, 80 pp.
Parra, Juan Carlos, and Quentin Wodon (2009). SimSIP SAM: A Tool for the Analysis of Input-Output Tables and Social Accounting Matrices, version 1.1. World Bank, Washington, D.C., 2009.
Resource Economic Analysis of Catchment Forest Reserves in Tanzania (2003). Ministry of Natural Resources and Tourism, Forestry and Beekeeping Division, United Republic of Tanzania, Dar es Salaam, 2003
Roe and Elliot (2010).The Earthscan Reader in Poverty and Biodiversity Conservation, Earthscan, London.
SEEA (2012): System of Environmental-Economic Accounting: Central Framework.
SEEA EEA (2013). SEEA Experimental Ecosystem Accounting. <https://unstats.un.org/unsd/envaccounting/eea_white_cover.pdf>
TEEB (2010). Mainstreaming the economics of nature – a synthesis of the approach, conclusions and recommendations of TEEB.
Thompson, W.A., Van Kooten, G.C., Vertinsky, I.,1997. Assessing timber and non-timber values in forestry using a general equilibrium framework. Critical Reviews in Environmental Science and Technology 27, 351–364.
Thurlow, J., and P. Wobst (2003) Poverty focused social accounting matrices for Tanzania, IFPRI Discussion Paper No. 112, International Food Policy Research Institute, Washington, D.C.
United Nations Environment Programme (UNEP) (2013). Annual Report Spotlights Action on Key Environmental Issues.
United Nations Environment Programme (UNEP) (2014). Year Book – Emerging Issues in our Global Environment.
VPO (1998). Tanzania Country Study on Biological Diversity. Vice-President’s Office, United Republic of Tanzania, Dar es Salaam, 1998, 163 pp.
52

annex i
multiplier analysis, sectoral growth and price impact
Receipts/Payments1 2 3 4 5 6 7 8
AAGRIC ALIVES AFOREST AMININ AFOOD ACLOTH AOTHM AWOODP
Commodities16 CADMIN 0.1063 0.1064 0.1096 0.1030 0.1041 0.1065 0.0819 0.1018
17 CPRIVS 0.0993 0.0987 0.1174 0.1114 0.1040 0.1175 0.0939 0.1125
Labour
1 FSUB 1.0692 0.8093 1.2736 0.6225 0.9453 0.6911 0.4603 0.6882
2 LCHILD 0.0128 0.0246 0.0092 0.0089 0.0114 0.0098 0.0061 0.0079
3 FEMLAB 0.3954 0.3700 0.3634 0.2295 0.3251 0.3747 0.1744 0.2410
4 MALELAB 0.4673 0.6248 0.4551 0.3482 0.4489 0.5525 0.3895 0.4742
Capital1 CAPAG 0.4409 0.5438 0.4077 0.2423 0.3486 0.2726 0.1768 0.2519
2 CAPNAG 0.5587 0.5467 0.5446 1.3897 0.7035 0.8927 0.8500 1.0090
Land 1 LAND 0.1889 0.2329 0.1747 0.1038 0.1493 0.1168 0.0757 0.1079
Enterprises 1 ENTR 0.5538 0.5419 0.5398 1.3775 0.6973 0.8849 0.8426 1.0002
Households
1 RURPOOR 0.4951 0.4917 0.5233 0.3123 0.4274 0.3577 0.2385 0.3347
2 RURNPOOR 1.7901 1.7730 1.8691 1.5548 1.6469 1.5623 1.1300 1.4970
3 URBPOOR 0.0888 0.0919 0.0868 0.1412 0.0950 0.1114 0.0931 0.1139
4 URBNPOOR 0.7211 0.7558 0.7121 0.8596 0.7184 0.8243 0.6219 0.7753
53 FOREST ECOSYSTEMS IN THE TRANSITION TO A GREEN ECONOMY AND THE ROLE OF REDD+ IN THE UNITED REPUBLIC OF TANZANIA

annex ii
transfer effect
Transfer effects
Activities
1 2 3 4 5 6 7 8
AAGRIC ALIVES AFOREST AMININ AFOOD ACLOTH AOTHM AWOODP
Activities
1 AAGRIC 0.0733 0.0431 0.0012 0.0018 0.4948 0.1845 0.0018 0.0009
2 ALIVES 0.0034 0.0021 0.0002 0.0017 0.0779 0.0034 0.0008 0.0005
3 AFOREST 0.0003 0.0098 0.0236 0.0004 0.0015 0.0012 0.0045 0.1650
4 AMININ 0.0012 0.0029 0.0003 0.0149 0.0039 0.0036 0.0960 0.0030
5 AFOOD 0.0001 0.0030 0.0002 0.0009 0.0220 0.0004 0.0005 0.0004
6 ACLOTH 0.0054 0.0065 0.0000 0.0006 0.0035 0.0299 0.0043 0.0003
7 AOTHM 0.0104 0.0048 0.0014 0.0104 0.0093 0.0104 0.1449 0.0057
8 AWOODP 0.0018 0.0009 0.0008 0.0026 0.0050 0.0078 0.0187 0.1346
9 AEQUIP 0.0004 0.0015 0.0002 0.0022 0.0015 0.0011 0.0016 0.0010
10 AUTILI 0.0058 0.0035 0.0007 0.0389 0.0148 0.0841 0.1294 0.0764
11 ACONST 0.0031 0.0033 0.0011 0.0090 0.0258 0.0322 0.0324 0.0285
12 ATRADE 0.0496 0.0343 0.0158 0.0220 0.1065 0.0996 0.0984 0.0829
13 AHOTEL 0.0021 0.0018 0.0019 0.0027 0.0042 0.0056 0.0067 0.0053
14 ATRANS 0.0137 0.0067 0.0105 0.0126 0.0171 0.0207 0.0297 0.0212
15 AESTAT 0.0087 0.0062 0.0082 0.0279 0.0242 0.0369 0.0478 0.0447
16 AADMIN 0.0033 0.0023 0.0039 0.0039 0.0071 0.0085 0.0099 0.0085
17 APRIVS 0.0039 0.0025 0.0167 0.0160 0.0120 0.0219 0.0222 0.0214
Commodities
1 CAGRIC 0.0855 0.0502 0.0014 0.0021 0.5768 0.2151 0.0021 0.0010
2 CLIVES 0.0035 0.0022 0.0002 0.0018 0.0804 0.0035 0.0008 0.0005
3 CFOREST 0.0003 0.0102 0.0246 0.0004 0.0016 0.0012 0.0047 0.1719
4 CMININ 0.0014 0.0035 0.0003 0.0181 0.0047 0.0043 0.1169 0.0036
5 CFOOD 0.0002 0.0035 0.0002 0.0010 0.0263 0.0005 0.0006 0.0005
6 CCLOTH 0.0079 0.0094 0.0000 0.0008 0.0051 0.0437 0.0063 0.0005
7 COTHM 0.0283 0.0131 0.0037 0.0285 0.0255 0.0284 0.3950 0.0156
8 CWOODP 0.0027 0.0014 0.0013 0.0040 0.0078 0.0121 0.0289 0.2078
9 CEQUIP 0.0023 0.0090 0.0012 0.0136 0.0094 0.0068 0.0098 0.0063
10 CUTILI 0.0058 0.0035 0.0007 0.0389 0.0148 0.0841 0.1294 0.0764
11 CCONST 0.0031 0.0033 0.0011 0.0090 0.0259 0.0323 0.0325 0.0286
12 CTRADE 0.0496 0.0343 0.0158 0.0220 0.1065 0.0996 0.0984 0.0829
13 CHOTEL 0.0021 0.0018 0.0019 0.0027 0.0042 0.0056 0.0067 0.0053
14 CTRANS 0.0216 0.0106 0.0166 0.0198 0.0269 0.0325 0.0467 0.0333
15 CESTAT 0.0087 0.0062 0.0082 0.0279 0.0242 0.0369 0.0478 0.0447
16 CADMIN 0.0033 0.0023 0.0040 0.0040 0.0071 0.0086 0.0100 0.0086
17 CPRIVS 0.0048 0.0031 0.0206 0.0197 0.0148 0.0271 0.0274 0.0264
54
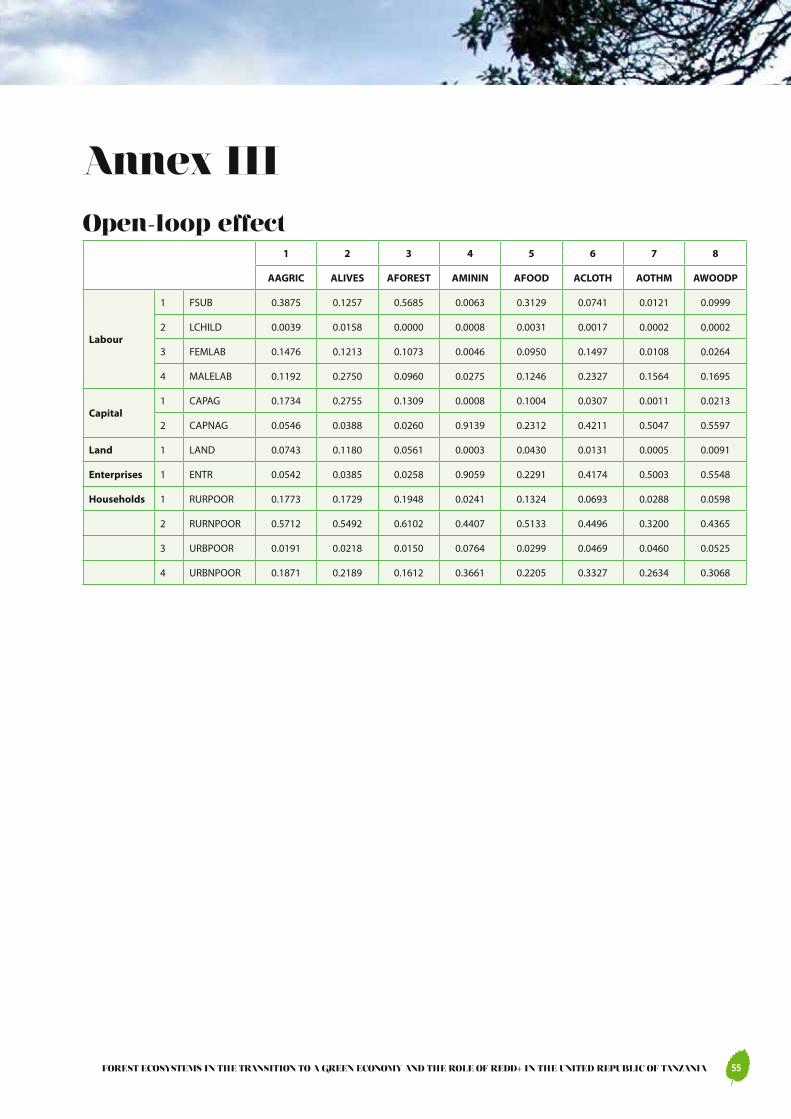
annex iii
open-loop effect1 2 3 4 5 6 7 8
AAGRIC ALIVES AFOREST AMININ AFOOD ACLOTH AOTHM AWOODP
Labour
1 FSUB 0.3875 0.1257 0.5685 0.0063 0.3129 0.0741 0.0121 0.0999
2 LCHILD 0.0039 0.0158 0.0000 0.0008 0.0031 0.0017 0.0002 0.0002
3 FEMLAB 0.1476 0.1213 0.1073 0.0046 0.0950 0.1497 0.0108 0.0264
4 MALELAB 0.1192 0.2750 0.0960 0.0275 0.1246 0.2327 0.1564 0.1695
Capital1 CAPAG 0.1734 0.2755 0.1309 0.0008 0.1004 0.0307 0.0011 0.0213
2 CAPNAG 0.0546 0.0388 0.0260 0.9139 0.2312 0.4211 0.5047 0.5597
Land 1 LAND 0.0743 0.1180 0.0561 0.0003 0.0430 0.0131 0.0005 0.0091
Enterprises 1 ENTR 0.0542 0.0385 0.0258 0.9059 0.2291 0.4174 0.5003 0.5548
Households 1 RURPOOR 0.1773 0.1729 0.1948 0.0241 0.1324 0.0693 0.0288 0.0598
2 RURNPOOR 0.5712 0.5492 0.6102 0.4407 0.5133 0.4496 0.3200 0.4365
3 URBPOOR 0.0191 0.0218 0.0150 0.0764 0.0299 0.0469 0.0460 0.0525
4 URBNPOOR 0.1871 0.2189 0.1612 0.3661 0.2205 0.3327 0.2634 0.3068
55 FOREST ECOSYSTEMS IN THE TRANSITION TO A GREEN ECONOMY AND THE ROLE OF REDD+ IN THE UNITED REPUBLIC OF TANZANIA
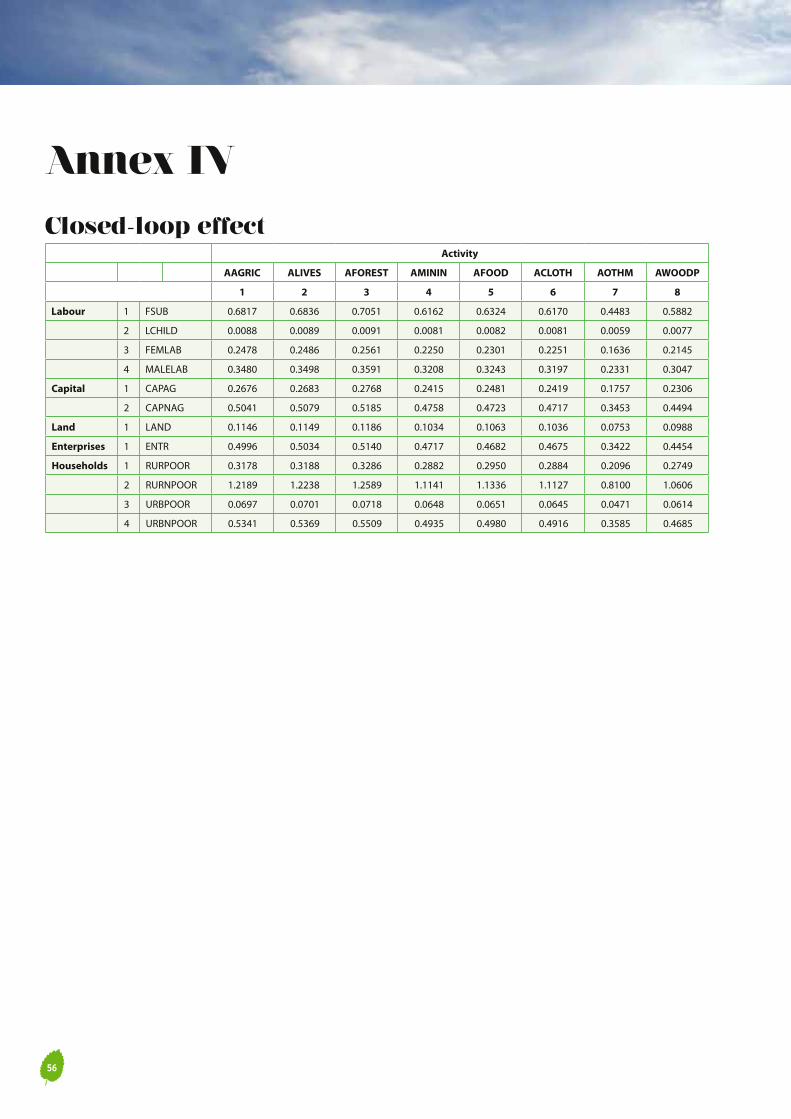
annex iV
closed-loop effectActivity
AAGRIC ALIVES AFOREST AMININ AFOOD ACLOTH AOTHM AWOODP
1 2 3 4 5 6 7 8
Labour 1 FSUB 0.6817 0.6836 0.7051 0.6162 0.6324 0.6170 0.4483 0.5882
2 LCHILD 0.0088 0.0089 0.0091 0.0081 0.0082 0.0081 0.0059 0.0077
3 FEMLAB 0.2478 0.2486 0.2561 0.2250 0.2301 0.2251 0.1636 0.2145
4 MALELAB 0.3480 0.3498 0.3591 0.3208 0.3243 0.3197 0.2331 0.3047
Capital 1 CAPAG 0.2676 0.2683 0.2768 0.2415 0.2481 0.2419 0.1757 0.2306
2 CAPNAG 0.5041 0.5079 0.5185 0.4758 0.4723 0.4717 0.3453 0.4494
Land 1 LAND 0.1146 0.1149 0.1186 0.1034 0.1063 0.1036 0.0753 0.0988
Enterprises 1 ENTR 0.4996 0.5034 0.5140 0.4717 0.4682 0.4675 0.3422 0.4454
Households 1 RURPOOR 0.3178 0.3188 0.3286 0.2882 0.2950 0.2884 0.2096 0.2749
2 RURNPOOR 1.2189 1.2238 1.2589 1.1141 1.1336 1.1127 0.8100 1.0606
3 URBPOOR 0.0697 0.0701 0.0718 0.0648 0.0651 0.0645 0.0471 0.0614
4 URBNPOOR 0.5341 0.5369 0.5509 0.4935 0.4980 0.4916 0.3585 0.4685
56

annex V
multiplier table for the united republic of tanzaniaReceipts /Payments Activities
1 2 3 4 5 6 7 8
AAGRIC ALIVES AFOREST AMININ AFOOD ACLOTH AOTHM AWOODP
Activities 1 AAGRIC 2.2285 1.2001 1.1976 1.0343 1.5637 1.2213 0.7535 0.9893
2 ALIVES 0.2805 1.2809 0.2857 0.2600 0.3368 0.2599 0.1883 0.2451
3 AFOREST 0.0637 0.0728 1.0897 0.0532 0.0592 0.0552 0.0432 0.2165
4 AMININ 0.0260 0.0278 0.0258 1.0380 0.0270 0.0265 0.1127 0.0249
5 AFOOD 0.5980 0.6053 0.6153 0.5665 1.5824 0.5600 0.4105 0.5339
6 ACLOTH 0.1614 0.1632 0.1611 0.1436 0.1487 1.1728 0.1083 0.1364
7 AOTHM 0.1304 0.1256 0.1250 0.1229 0.1216 0.1220 1.2265 0.1121
8 AWOODP 0.0177 0.0170 0.0172 0.0176 0.0200 0.0227 0.0296 1.1488
9 AEQUIP 0.0084 0.0095 0.0085 0.0099 0.0091 0.0086 0.0071 0.0082
10 AUTILI 0.0759 0.0741 0.0728 0.1052 0.0805 0.1497 0.1775 0.1389
11 ACONST 0.0820 0.0827 0.0825 0.0826 0.0995 0.1053 0.0858 0.0982
12 ATRADE 0.2656 0.2516 0.2383 0.2236 0.3083 0.2999 0.2447 0.2737
13 AHOTEL 0.1322 0.1335 0.1351 0.1296 0.1270 0.1307 0.0987 0.1243
14 ATRANS 0.0907 0.0846 0.0893 0.0876 0.0898 0.0946 0.0840 0.0915
15 AESTAT 0.7283 0.7296 0.7504 0.6941 0.6954 0.7001 0.5317 0.6769
16 AADMIN 0.1052 0.1052 0.1084 0.1019 0.1029 0.1054 0.0810 0.1007
17 APRIVS 0.0804 0.0799 0.0951 0.0902 0.0842 0.0951 0.0760 0.0911
Commodities 1 CAGRIC 0.9051 0.8754 0.8452 0.7733 1.3442 0.9790 0.5613 0.7295
2 CLIVES 0.2634 0.2639 0.2675 0.2470 0.3238 0.2463 0.1786 0.2320
3 CFOREST 0.0071 0.0170 0.0316 0.0066 0.0079 0.0074 0.0092 0.1778
4 CMININ 0.0316 0.0339 0.0315 0.0463 0.0329 0.0323 0.1373 0.0303
5 CFOOD 0.6632 0.6723 0.6814 0.6355 0.6495 0.6263 0.4601 0.5972
6 CCLOTH 0.2358 0.2384 0.2354 0.2098 0.2172 0.2524 0.1582 0.1993
7 COTHM 0.3556 0.3424 0.3408 0.3350 0.3316 0.3327 0.6175 0.3056
8 CWOODP 0.0273 0.0262 0.0266 0.0271 0.0308 0.0350 0.0457 0.2296
9 CEQUIP 0.0520 0.0591 0.0524 0.0611 0.0561 0.0536 0.0441 0.0509
57 FOREST ECOSYSTEMS IN THE TRANSITION TO A GREEN ECONOMY AND THE ROLE OF REDD+ IN THE UNITED REPUBLIC OF TANZANIA
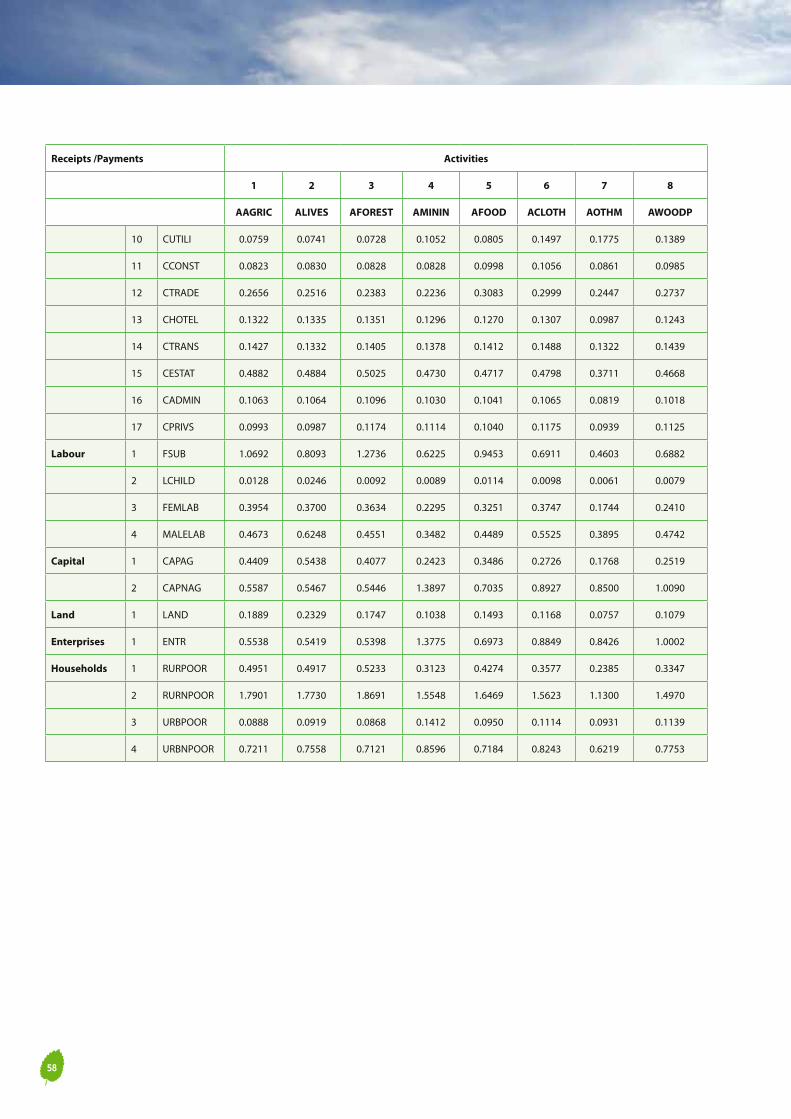
Receipts /Payments Activities
1 2 3 4 5 6 7 8
AAGRIC ALIVES AFOREST AMININ AFOOD ACLOTH AOTHM AWOODP
10 CUTILI 0.0759 0.0741 0.0728 0.1052 0.0805 0.1497 0.1775 0.1389
11 CCONST 0.0823 0.0830 0.0828 0.0828 0.0998 0.1056 0.0861 0.0985
12 CTRADE 0.2656 0.2516 0.2383 0.2236 0.3083 0.2999 0.2447 0.2737
13 CHOTEL 0.1322 0.1335 0.1351 0.1296 0.1270 0.1307 0.0987 0.1243
14 CTRANS 0.1427 0.1332 0.1405 0.1378 0.1412 0.1488 0.1322 0.1439
15 CESTAT 0.4882 0.4884 0.5025 0.4730 0.4717 0.4798 0.3711 0.4668
16 CADMIN 0.1063 0.1064 0.1096 0.1030 0.1041 0.1065 0.0819 0.1018
17 CPRIVS 0.0993 0.0987 0.1174 0.1114 0.1040 0.1175 0.0939 0.1125
Labour 1 FSUB 1.0692 0.8093 1.2736 0.6225 0.9453 0.6911 0.4603 0.6882
2 LCHILD 0.0128 0.0246 0.0092 0.0089 0.0114 0.0098 0.0061 0.0079
3 FEMLAB 0.3954 0.3700 0.3634 0.2295 0.3251 0.3747 0.1744 0.2410
4 MALELAB 0.4673 0.6248 0.4551 0.3482 0.4489 0.5525 0.3895 0.4742
Capital 1 CAPAG 0.4409 0.5438 0.4077 0.2423 0.3486 0.2726 0.1768 0.2519
2 CAPNAG 0.5587 0.5467 0.5446 1.3897 0.7035 0.8927 0.8500 1.0090
Land 1 LAND 0.1889 0.2329 0.1747 0.1038 0.1493 0.1168 0.0757 0.1079
Enterprises 1 ENTR 0.5538 0.5419 0.5398 1.3775 0.6973 0.8849 0.8426 1.0002
Households 1 RURPOOR 0.4951 0.4917 0.5233 0.3123 0.4274 0.3577 0.2385 0.3347
2 RURNPOOR 1.7901 1.7730 1.8691 1.5548 1.6469 1.5623 1.1300 1.4970
3 URBPOOR 0.0888 0.0919 0.0868 0.1412 0.0950 0.1114 0.0931 0.1139
4 URBNPOOR 0.7211 0.7558 0.7121 0.8596 0.7184 0.8243 0.6219 0.7753
58

annex Vi
multipliers as elasticityActivity
AAGRIC ALIVES AFOREST AMININ AFOOD ACLOTH AOTHM AWOODP
1 2 3 4 5 6 7 8
Labour 1 FSUB 1.7687 0.2612 0.1974 0.0409 0.7617 0.1462 0.0900 0.0520
2 LCHILD 1.7831 0.6706 0.1197 0.0492 0.7728 0.1747 0.1000 0.0501
3 FEMLAB 1.5207 0.2776 0.1309 0.0351 0.6091 0.1843 0.0793 0.0423
4 MALELAB 1.0393 0.2711 0.0948 0.0308 0.4864 0.1572 0.1024 0.0482
Capital 1 CAPAG 1.9628 0.4723 0.1700 0.0429 0.7559 0.1552 0.0930 0.0512
2 CAPNAG 0.7872 0.1503 0.0719 0.0779 0.4828 0.1609 0.1416 0.0649
Land 1 LAND 1.9628 0.4723 0.1700 0.0429 0.7559 0.1552 0.0930 0.0512
Enterprises 1 ENTR 0.7872 0.1503 0.0719 0.0779 0.4828 0.1609 0.1416 0.0649
Households 1 RURPOOR 1.6472 0.3192 0.1631 0.0413 0.6927 0.1522 0.0938 0.0509
2 RURNPOOR 1.3311 0.2572 0.1302 0.0460 0.5966 0.1486 0.0993 0.0508
3 URBPOOR 1.0046 0.2028 0.0920 0.0635 0.5235 0.1611 0.1245 0.0589
4 URBNPOOR 1.0030 0.2051 0.0928 0.0475 0.4867 0.1466 0.1023 0.0493
59 FOREST ECOSYSTEMS IN THE TRANSITION TO A GREEN ECONOMY AND THE ROLE OF REDD+ IN THE UNITED REPUBLIC OF TANZANIA

annex Vii
structural path (fixed origin "Forest" and fixed destination "rurpoor"): multiplier decomposition and structural path analysis
Multiplier decomposition and structural path analysis
Multiplier decomposition
Origin Destination Accountingmultiplier Transfer effects Open-loop
effects Closed-loop
effects
AFOREST RURPOOR 0.5233 0.0000 0.1948 0.3286
Structural path analysis
Origin Destination Globalinfluence Elementary paths Direct
influence Path
multiplier Total
influence Overall total
(in %)
AFOREST RURPOOR 0.5233 AFOREST / FSUB / RURPOOR 0.1229 1.9816 0.2435 46.5272
AFOREST / CAPAG / RURPOOR 0.0354 1.6423 0.0581 11.1105
AFOREST / LAND / RURPOOR 0.0151 1.5296 0.0231 4.4187
AFOREST / MALELAB / RURPOOR 0.0080 1.7686 0.0142 2.7177
AFOREST / FEMLAB / RURPOOR 0.0072 1.6718 0.0120 2.2902
AFOREST / FSUB / RURNPOOR /AAGRIC / CAPAG / RURPOOR 0.0029 3.1518 0.0091 1.7325
60

annex Viii
structural path (fixed origin "Forest" and fixed destination "rurnpoor"): multiplier decomposition and structural path analysis
Multiplier decomposition and structural path analysis
Multiplier decomposition
Origin Destination Accountingmultiplier
Transfer effects Open-loopeffects
Closed-loopeffects
AFOREST RURNPOOR 1.8691 0.0000 0.6102 1.2589
Structural path analysis
Origin Destination Globalinfluence
Elementary paths Directinfluence
Pathmultiplier
Totalinfluence
Overall total(in %)
AFOREST RURNPOOR 1.8691 AFOREST / FSUB / RURNPOOR 0.3741 2.5993 0.9723 52.0182
AFOREST / CAPAG / RURNPOOR 0.0823 2.4734 0.2036 10.8925
AFOREST/FEMLAB / RURNPOOR 0.0460 2.4984 0.1149 6.1485
AFOREST/MALELAB/RURNPOOR 0.0417 2.5556 0.1066 5.7049
AFOREST/MALELAB/RURNPOO 0.0355 2.4148 0.0857 4.5844
61 FOREST ECOSYSTEMS IN THE TRANSITION TO A GREEN ECONOMY AND THE ROLE OF REDD+ IN THE UNITED REPUBLIC OF TANZANIA

annex iX
structural path (fixed origin "Forest" and fixed destination "urbpoor"): multiplier decomposition and structural path analysis
Multiplier decomposition and structural path analysis
Multiplier decomposition
Origin Destination Accountingmultiplier Transfer effects Open-loop
effects Closed-loop effects
AFOREST URBPOOR 0.0868 0.0000 0.0150 0.0718
Structural path analysis
Origin Destination Globalinfluence Elementary paths Direct
influence Path
multiplier Total
influenceOverall total
(in %)
AFOREST URBPOOR 0.0868 AFOREST / FSUB / URBPOOR 0.0039 1.8671 0.0073 8.4230
AFOREST / FEMLAB / URBPOOR 0.0035 1.4045 0.0049 5.6385
AFOREST / MALELAB / URBPOOR 0.0022 1.5119 0.0033 3.8301
AFOREST / CAPAG / URBPOOR 0.0018 1.4460 0.0027 3.0624
AFOREST / CTRADE / ATRADE /CAPNAG / ENTR / URBPOOR 0.0008 1.6967 0.0013 1.5473
AFOREST / LAND / URBPOOR 0.0009 1.2863 0.0012 1.3271
AFOREST / FSUB / RURNPOOR/ AAGRIC / FEMLAB / URBPOOR 0.0003 3.1913 0.0009 1.0844
62

annex X
structural path (fixed origin "aWWodp" and fixed destination "urbnpoor"): – multiplier decomposition and structural path analysis Multiplier decomposition and structuralpath analysis
Multiplier decomposition
Origin Destination Accountingmultiplier Transfer effects Open-loop
effects Closed-loop
effects
AFOREST URBNPOOR 0.7121 0.0000 0.1612 0.5509
Structural path analysis
Origin Destination Globalinfluence Elementary paths Direct
influence Path
multiplier Total
influence Overall
total (in %)
AFOREST URBNPOOR 0.7121 AFOREST / FSUB / URBNPOOR 0.0526 2.2872 0.1204 16.9091
AFOREST / FEMLAB / URBNPOOR 0.0460 1.7653 0.0812 11.4095
AFOREST / MALELAB / URBNPOOR 0.0355 1.8361 0.0652 9.1571
AFOREST / FSUB / RURNPOOR / AAGRIC/ FEMLAB / URBNPOOR 0.0039 3.4972 0.0136 1.9131
AFOREST / CAPAG / URBNPOOR 0.0072 1.8983 0.0136 1.9094
AFOREST / FSUB / RURNPOOR / AAGRIC/ MALELAB / URBNPOOR 0.0027 3.5152 0.0093 1.3115
AFOREST / FSUB / RURNPOOR / CLIVES2/ ALIVES2 / MALELAB / URBNPOOR 0.0024 3.1921 0.0076 1.0711
AFOREST / FSUB / RURNPOOR / CAGRIC/ AAGRIC / FEMLAB / URBNPOOR 0.0022 3.5053 0.0076 1.0703
AFOREST / CTRADE / ATRADE / CAPNAG/ ENTR / URBNPOOR 0.0037 1.9740 0.0073 1.0242
63 FOREST ECOSYSTEMS IN THE TRANSITION TO A GREEN ECONOMY AND THE ROLE OF REDD+ IN THE UNITED REPUBLIC OF TANZANIA

annex Xi
economic case: simulating data to capture higher household demand for forestry outputAs noted in section 3.9 above, there is a lack of data in developing countries on household demand for the forestry sector (see also the earlier discussion, in section 3.4, on forward and backward linkages). The study by Agrawal et al. (2013) notes that in many developing countries the non-industrial economic contributions of forests typically go unrecorded, while in many cases they are from three to ten times higher than the revenues collected in national accounts. One way of dealing with this issue and recreating the situation that would have emerged had the data been adequately captured is to use a computable general equilibrium (CGE) model. In the present annex, we aim to model the economy of the United Republic of Tanzania and look at economy-wide changes that would occur if there were higher household demand for output from the hunting and forestry sector. We begin by giving a brief explanation of the CGE models and the social accounting matrix used for the simulation.
overview of cge models
A CGE model is an analytical approach that looks at the economy as a complete system of interdependent components and which recognizes that shocks to (demands on) the system in one sector have ripple effects throughout the system. CGE models are rooted in the input-output framework and are simulations that combine the abstract general equilibrium structure formalized by Arrow, K. J.; Debreu, G. (1954) with realistic economic data in order to solve numerically the levels of supply, demand and price that support equilibrium across a specified set of markets. CGE models are a standard tool of empirical analysis, and are widely used to analyse the aggregate welfare and distributional impacts of policies whose effects may be transmitted through multiple markets, or contain menus of different tax, subsidy, quota or transfer instruments. Examples of their use may be found in areas as diverse as fiscal reform and development planning, international trade and increasingly, environmental regulation.
Applications of CGE models in forestry have also been increasing with time. Dee (1991) developed a CGE model in a study to evaluate the impact of increasing the minimum harvest age of trees and valuations on stumpage and discount rates in Indonesia. Thompson et al. (1997) valued the importance of non-timber in forest management options using a CGE model. Dufournaud et al. (2000, p.15) analysed the impact on economic activities of the
increase in royalties and export taxes of the forest sector. Banerjee and Alavalapati (2009) also used a CGE model to evaluate the short-term socioeconomic and environmental implications of implementing forest concessions in Brazil. Some research has also been carried out to evaluate the impact of deforestation. For example, Cattaneo (2002, p. 36) included a deforestation sector in a CGE model, linking it to agricultural land and the return to arable land.
social accounting matrix for the united republic of tanzania
The 2001 social accounting matrix for the United Republic of Tanzania was developed by the International Food Policy Research Institute, following the framework presented in Lofgren et al. (2002). With this structure, “activities” are distinguished from “commodities”, with flows valued at producers’ prices in the activity accounts and at market prices in the commodity accounts. The commodities are activity outputs, either exported or sold domestically, and imports. This activity-commodity separation is preferred since it permits activities to produce multiple commodities while any commodity may be produced by multiple activities (for example, activities for small-scale and large-scale maize production may both produce the same maize commodity). In the activity columns, payments are made to commodities (intermediate demand), factors of production (the value added element comprising operating surplus and compensation of employees), and also producer tax accounts. In the commodity columns, payments are made to domestic activities, the rest of the world, and various tax accounts (for domestic and import taxes). This treatment provides the data needed to model imports as perfect or imperfect substitutes vis-à-vis domestic production.25
Marketing and trade margins are also exclusively captured in light of transactions (trade and transportation) costs. The government is disaggregated into a core government account and different tax collection accounts, one for each type of tax. A public administration sector is created to capture payments from the government to factors (for the labour services provided by government employees). The domestic non-government institutions consist of households and enterprises, and allow for a distinction between home and marketed consumption between households. The enterprises earn factor incomes (a reflection of ownership of capital or land) and may also receive transfers from other institutions. Their incomes are used for corporate taxes, enterprise savings, and transfers to other institutions.
The compilation of the social accounting matrix made use of major data sources at both the macro and micro levels. Micro-based data include the results of the 2000–2001 household budget survey (NBS, 2002) and the 2000–2001 labour force survey (NBS, 2002). Furthermore, the 2000 social accounting matrix was compiled solely with data from that year, except those for the intermediate demand structure, for which the 1992 input-output table was
25 This description of the social accounting matrix follows Thurlow and Wobst (2003).)
64

used. The 2001 matrix has 43 production sectors with 21 in agriculture. The remaining sectors are split between 1 mining, 13 manufacturing activities, 2 activities in the rest of the secondary sector, and 6 in the tertiary sector. The same disaggregation applies for commodities. There are three marketing margins accounting for export, import, and domestic sales transaction costs. Factors are also highly disaggregated. The disaggregation of labour is largely based on gender and education. Households are separated into rural and urban and according to household income and level of education of the head of the household.
model
The model used in this study is the partnership for economic policy (PEP) standard CGE model. We use both the static [PEP-1-1 (SINGLE-COUNTRY, STATIC VERSION)] and dynamic [PEP-1-t (SINGLE-COUNTRY, RECURSIVE DYNAMIC VERSION)] CGE to model the Tanzanian economy (Decaluwé et al. (2012)). Both the single-country static and dynamic versions of the PEP standard CGE model were designed for country-level studies adapted to the Tanzanian national economy. The model is implemented in the general algebraic modelling system (GAMS) and is solved using the CONOPT solver. Though details of this model can be found in Decaluwé et al. (2012), the basic structure is presented here. The PEP-1-1 model is a single period, single country static CGE model that captures interactions between households, producers, government and the rest of the world. The model also allows for each industry to produce more than one product and for transfers between agents. The model does not, however, allow for industries that rely solely on intermediate consumption or those with no value added. Before we describe the model itself, the social accounting matrix for the United Republic of Tanzania had to be built to reflect the different agents and interactions as presented in the model. Accounts are grouped into five main categories: factors of production, institutions (or agents), commodities, industries and accumulation.
production
Firms operate in a perfectly competitive environment in which they maximize profits subject to a nested intermediate consumption aggregate and value added. Firms produce output subject to the technology available to them, the prices of goods and factors with no control on the prices. The PEP-1-1 model assumes a Leontief production function combining value added and total intermediate consumption in fixed shares. That is, human resources cannot be substituted for tangible inputs and equipment. The production of value added, on the other hand, follows a constant elasticity of substitution (CES) production technology combining composite labour and capital, which are themselves combined using the CES technology. Thus, the model allows for different types of labour and capital up to the point where the value of the marginal product of each is equal to its price. Finally, the intermediate consumption aggregate is made up of various products that are assumed to be strictly complementary with no substitution.
income and savings
Different types of agents are modelled in the PEP-1-1. These agents are broadly categorized into households, businesses, government and the rest of the world. The model allows for different types of households that receive a fixed share of the earnings of each type of labour and total capital income. Household savings are also a linear function of the disposable income of the firm, allowing for a difference in the marginal and average propensity to save. Businesses are modelled to earn income from capital and also to transfer from other agents with savings deduced as the residual from disposable income of the business when transfers to other agents are removed. Government income and savings are derived from taxes on all the other agents, including household and businesses and their production activities. The rest of the world receives payments for the goods supplied (imports) and the return on investments in the domestic economy.
demand
Demand for goods and services in the economy (imported or domestically produced) is made up of consumption by all agents in the economy, including the government. The utility function of the household is assumed to be of the Stone-Geary form, with a minimum level of consumption of each commodity necessary for subsistence. Households maximize utility subject to budget constraints. Investment demand captures gross fixed-capital formation separately from changes in inventories, and there is an inverse relationship between quantity demanded for investment purposes and the purchase price of the commodity. Government demand is also modelled similarly and intermediate demand and on them and their margins are also taken into consideration.
producer supplies of products and international trade
A constant elasticity of transformation (CET) function is assumed for the production of goods and services, representing how easily the product mix can be adjusted in response to price changes. This output is shared among domestic and international markets with the goal of maximizing total revenue. Thus the producer’s supply behaviour is also nested by the CET functions with aggregate output, a function of individual output and the final supply distributed between domestic and exports market.
prices
Prices of domestic and exported outputs are all a function of the assumptions of the functional forms assumed earlier. The price weights are deduced from the ratio of the quantities in volume to the volume in aggregates. For example, the unit cost of an industry’s output is a weighted sum of the prices of value added and of the intermediate consumption aggregate. Price indices are also modelled using the GDP deflator, consumer price index, investment price index and the public expenditure price index. Lastly, the model also captures GDP both at basic prices and market prices.
65 FOREST ECOSYSTEMS IN THE TRANSITION TO A GREEN ECONOMY AND THE ROLE OF REDD+ IN THE UNITED REPUBLIC OF TANZANIA

simulation design and key findings
simulation design
Forest use in many developing countries is usually under-reported. In many African countries, including the United Republic of Tanzania, forests are a source of income for some households or relied upon as a complement to other goods. For instance, in order to prepare food in many communities, wood is the source of fuel. Data on these activities, however, are typically not available at the national level. This often results to under-reporting the contribution of the forestry sector to the economy. We therefore seek to model the contribution of the forestry sector by simulating an increase in the use of the forestry sector to a level higher than that currently reported in the national accounts.
Key findings
If the contribution of the forest sector to household demand is captured as a consequence of shocks to household consumption of the products of that sector, the results show: a 0.60 percentage point increase in the GDP at market prices, a 0.77 percentage point increase in consumer price index, and a 0.62 percentage point increase in the GDP deflator. As expected, total income increased for all household types in the United Republic of Tanzania as a consequence of the shock (table 219). The impact is highest, however, on non-poor rural households with a non-educated household head (1.16 percentage point increase in total income). This is followed by households that are in the rural areas below the food poverty line. Capital income
increases by about the same rate for all the households but labour income varied by household type.
Wages increased between 0.028 and 1.53 percentage points in all industries based on this scenario (table 23). With increased consumption by households of forestry commodities, labour becomes significantly more expensive in the meat-processing and dairy-products industry (1.53 percentage point increase). This is as a result of the links between this sector and that of forestry and hunting. The wage rate in the forestry and hunting sector also rises, by 1.27 percentage points. There is no significant impact on the price of labour in the utilities and manufacturing sectors though.
The value added by each industry changes based on the shock to the system of increased consumption in the forestry sector (table 24). The expanded maize sector has the highest increase in value added, at 1.84 percentage points, followed by the basic and industrial chemicals manufacturing sector. The wood, paper and printing industry will also experience a reduction in value added, by about 0.39 percentage points. Thus, an increase in the consumption of households of the forestry sector will hurt the cashew nuts and coffee industry the most, with decreases of approximately 1.19 and 1.08 percentage points, respectively, in value added.
There was an increase in many of the agricultural prices, with the highest increase occurring in that of cassava (table 25). There was little or no change in the prices of utilities, manufacturing and construction. In summary, an increase in the consumption of the forestry sector by households resulted in an increase in GDP, household income, wage rate and composite commodity price. The value added of the majority of the industries is negative as a result of this shock.
Table 23. Detailed results from the experiment
Summary of results of the experiment
Impact on households
Account Before shock After shock Percentage change
RURPOOR 969.08 970.89 0.19
RURNPOOR 4 335.67 4 342.10 0.15
URBPOOR 285.04 285.34 0.10
URBNPOOR 2 317.93 2 320.39 0.11
Total 7 907.73 7 918.72 0.14
66

Table 23. Percentage change in the wage rate
Industry Percentage change Industry Percentage change
Processing of meat and dairy products 1.5294 Growing of cashew nuts 0.4884
Growing of cassava 1.4489 Hotels and restaurants 0.4396
Real estate 1.4398 Growing of sisal fibre 0.4373
Growing of sorghum or millets 1.3735 Grain milling 0.3643
Growing of maize 1.3733 Textile and leather products 0.3131
Hunting and forestry 1.2734 Wholesale and retail trade 0.2176
Growing of other roots and tubes 1.2713 Growing of wheat 0.2127
Growing of other crops 1.1968 Rubber plastic and other manufacturing 0.1724
Growing of fruits and vegetables 1.1491 Mining and quarrying 0.1594
Growing of beans 1.1072 Business and other services 0.1584
Growing of oil seeds 1.0421 Manufacture of all equipment 0.1525
Growing of paddy 0.9453 Construction 0.1034
Operation of poultry and livestock 0.9171 Wood-paper printing 0.1003
Processed food 0.8744 Iron steel and metal products 0.0955
Growing of other cereals 0.8642 Manufacture of basic and industrial chemicals 0.0610
Growing of sugar 0.6661 Manufacture of fertilizers and pesticides 0.0610
Growing of coffee 0.6606 Glass and cement 0.0564
Beverages and tobacco products 0.6188 Utilities 0.0553
Growing of tea 0.5564 Petroleum refineries 0.0447
Fishing and fish farms 0.5337 Public administration, health and education 0.0413
Growing of cotton 0.5237 Transport and communication 0.0285
Growing of tobacco 0.5060
67 FOREST ECOSYSTEMS IN THE TRANSITION TO A GREEN ECONOMY AND THE ROLE OF REDD+ IN THE UNITED REPUBLIC OF TANZANIA

Table 24. Percentage change in value added
Industry Percentage change Industry Percentage change
Growing of maize 1.8367 Operation of poultry and livestock -0.1950
Manufacture of basic and industrial chemicals 0.4288 Wholesale and retail trade -0.1975
Petroleum refineries 0.3175 Growing of paddy -0.2094
Growing of sisal fibre 0.1778 Growing of other roots and tubes -0.2348
Textile and leather products 0.1778 Iron steel and metal products -0.2352
Hotels and restaurants 0.0739 Processing of meat and dairy products -0.2524
Utilities 0.0647 Growing of fruits and vegetables -0.2747
Beverages and tobacco products 0.0417 Growing of cassava -0.2917
Processed food -0.0133 Hunting and forestry -0.3065
Rubber plastic and other manufacturing -0.0188 Mining and quarrying -0.3182
Growing of cotton -0.0433 Growing of tea -0.3640
Growing of sorghum or millet -0.0595 Growing of tobacco -0.3804
Growing of other cereals -0.0677 Wood-paper printing -0.3859
Public administration health and education -0.0812 Manufacture of fertilizers and pesticides -0.4121
Business and other services -0.0882 Growing of wheat -0.4306
Transport and communication -0.0925 Glass and cement -0.4438
Real estate -0.1171 Growing of sugar -0.4789
Grain milling -0.1408 Manufacture of all equipment -0.5680
Growing of oil seeds -0.1536 Construction -0.6458
Growing of other crops -0.1624 Growing of coffee -1.0801
Growing of beans -0.1633 Growing of cashew nuts -1.1909
Fishing and fish farms -0.1690
68

Table 25. Percentage change in composite commodity price
Industry Percentage change Industry Percentage change
Growing of cassava 1.3500 Processed food 0.3218
Growing of maize 1.1592 Beverages and tobacco products 0.3083
Growing of other roots and tubes 1.1405 Hotels and restaurants 0.2660
Hunting and forestry 1.1214 Growing of wheat 0.2097
Growing of sorghum or millet 1.0266 Textile and leather products 0.1506
Growing of other crops 1.0260 Wood-paper printing 0.1264
Processing of meat and dairy products 1.0028 Public administration, health and education 0.0960
Growing of coffee 0.9994 Business and other services 0.0759
Growing of fruits and vegetables 0.9876 Construction 0.0532
Growing of beans 0.9702 Utilities 0.0244
Growing of oil seeds 0.9037 Wholesale and retail trade 0.0200
Operation of poultry and livestock 0.8609 Rubber plastic and other manufacturing 0.0137
Real estate 0.7607 Manufacture of basic and industrial chemicals 0.0117
Growing of paddy 0.7456 Iron steel and metal products 0.0073
Grain milling 0.7431 Transport and communication 0.0067
Fishing and fish farms 0.7102 Glass and cement 0.0036
Growing of other cereals 0.6975 Growing of cashew nuts 0.0010
Growing of tobacco 0.5727 Petroleum refineries 0.0005
Growing of tea 0.5339 Manufacture of all equipment -0.0011
Growing of sugar 0.4731 Mining and quarrying -0.0248
Growing of cotton 0.4519 Manufacture of fertilizers and pesticides -0.2912
Growing of sisal fibre 0.3335
69 FOREST ECOSYSTEMS IN THE TRANSITION TO A GREEN ECONOMY AND THE ROLE OF REDD+ IN THE UNITED REPUBLIC OF TANZANIA

Forest ecosystems in the transition to a green economy and the role oF redd+ in the united republic oF tanzania