Embed Size (px)
Citation preview
�
T H E E C O N O M I C S O F E C O S Y S T E M SAND B IOD IVERS I TYTEEB for National and International Policy Makers
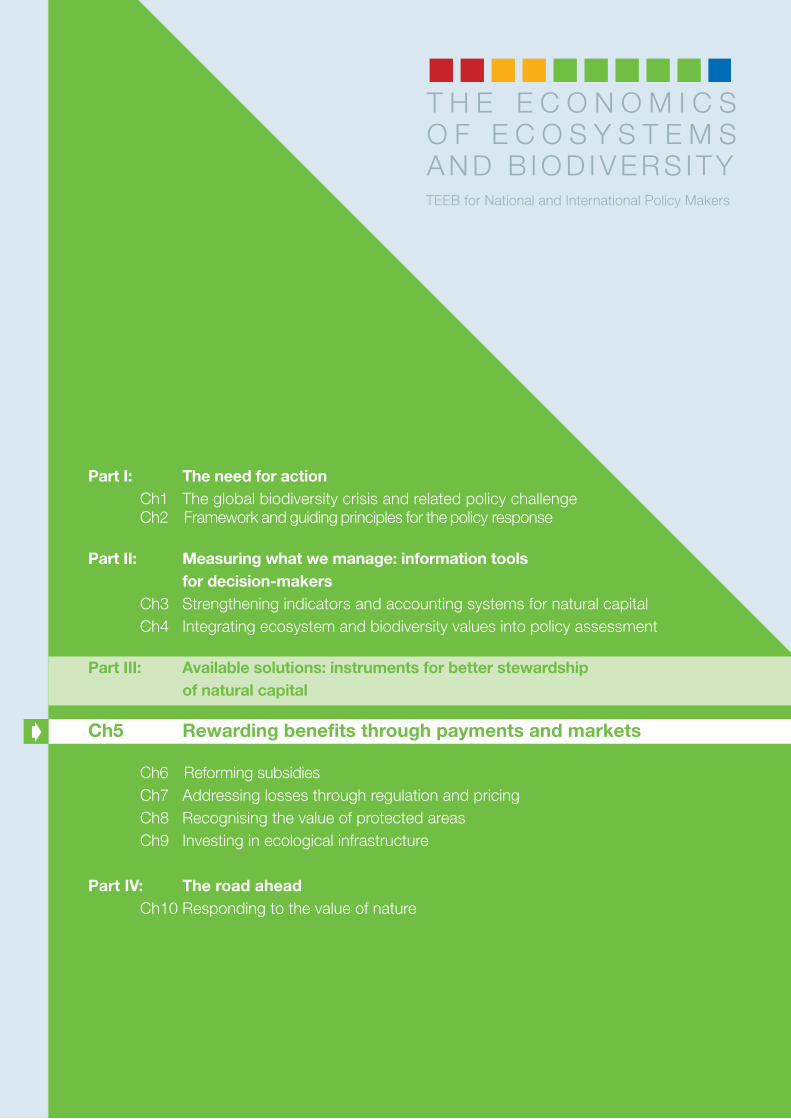
Part I: The need for actionCh1 The global biodiversity crisis and related policy challengeCh2 Framework and guiding principles for the policy response
Part II: Measuring what we manage: information tools for decision-makers
Ch3 Strengthening indicators and accounting systems for natural capitalCh4 Integrating ecosystem and biodiversity values into policy assessment
Part III: Available solutions: instruments for better stewardship of natural capital
Ch5 Rewarding benefits through payments and markets
Ch6 Reforming subsidiesCh7 Addressing losses through regulation and pricingCh8 Recognising the value of protected areasCh9 Investing in ecological infrastructure
Part IV: The road aheadCh10 Responding to the value of nature
TEEB for Policy Makers TeamTEEB for Policy Makers Coordinator: Patrick ten Brink (IEEP)
TEEB for Policy Makers Core Team: Bernd Hansjuergens (UFZ), Sylvia Kaplan (BMU, Germany), Katia Karousakis (OECD),Marianne Kettunen (IEEP), Markus Lehmann (SCBD), Meriem Bouamrane (UNESCO), Helen Mountford (OECD), Alice Ruhweza
(Katoomba Group, Uganda), Mark Schauer (UNEP), Christoph Schröter-Schlaack (UFZ), Benjamin Simmons (UNEP), Alexandra Vakrou
(European Commission), Stefan van der Esch (VROM, The Netherlands), James Vause (Defra, United Kingdom), Madhu Verma
(IIFM, India), Jean-Louis Weber (EEA), Stephen White (European Commission) and Heidi Wittmer (UFZ).
TEEB Study Leader: Pavan Sukhdev (UNEP)
TEEB communications: Georgina Langdale (UNEP)
Chapter 5: Rewarding benefits through payments and markets
Chapter Coordinator: Patrick ten Brink (Institute for European Environmental Policy – IEEP)
Lead authors:5.1 Patrick ten Brink, Samuela Bassi, Joshua Bishop, Celia A. Harvey, Alice Ruhweza, Madhu Varma
and Sheila Wertz-Kanounnikoff 5.2 Katia Karousakis, Stefan van der Esch, Bernd Hansjürgens, Celia Harvey, Patrick ten Brink,
Mandar Trivedi and Alexandra Vakrou 5.3 Anil Markandya and Paulo A.L.D. Nunes 5.4 Irene Ring 5.5 Andrew J. McConville, Joshua Bishop, Katherine McCoy, Patrick ten Brink and Alexandra Vakrou5.6 Stefan van der Esch and Samuela Bassi
Contributing authors*: James Boyd, Ingo Bräuer, Naoya Furuta, Pablo Gutman, Sarah Hodgkinson, Markus Lehmann, Burkhard Schweppe-Kraft, Pavan Sukhdev, Kaavya Varma
Editing and language check: Clare Shine
Acknowledgements*: for comments and help by Barbara Akwagyiram, Arild Angelsen, Viviane André,Jonathan Armstrong, Giles Atkinson, Ivan Bond, Joana Chiavari, Bas Clabbers, Tamsin Cooper, JoanaChiavari, Chris Cox, Florian Eppink, Sonja Gantioler, Pablo Gutman, Sarah Hernandez, David Huberman,Mikkel Kallesoe, Sylvia Kaplan, Marianne Kettunen,Chris Knight, Eimear Nic Lughadha, Alaistair Morrison,Hylton Murray, Valerie Preston, Walter Reid, Ewald Rametsteiner, Carmen Richerzhagen, Mark Schauer,Burkhard Schweppe-Kraft, Bambi Semroc, Monique Simmonds, Benjamin Simmons, Paul Smith, LeilaSuvantola, Monique Symmonds, Giuliana Torta, Graham Tucker, Andreas Tveteraas, Jean-Louis Weber,Steve White, Sven Wunder, and many others.
Disclaimer: The views expressed in this chapter are purely those of the authors and may not in any circumstances
be regarded as stating an official position of the organisations involved.
Citation: TEEB – The Economics of Ecosystems and Biodiversity for National and International Policy Makers (2009).
URL: www.teebweb.org
* Contributors above not repeated here
Table of Contents
Key Messages of Chapter 5 25.1 Payments for ecosystem services (PES) 6
5.1.1 What do we mean by PES? 65.1.2 Principles and architecture of PES 75.1.3 Applications, benefits and lessons learnt 115.1.4 Opportunities and challenges 155.1.5 Moving forward on PES design and implementation 17
5.2 International PES: REDD and beyond 225.2.1 The rationale for international engagement 225.2.2 Designing REDD with biodiversity co-benefits 225.2.3 Marketing additional benefits alongside REDD 295.2.4 International payments for global ecosystem services 29
5.3 The economics of Access and Benefit Sharing (ABS) 345.3.1 The value of genetic resources 345.3.2 Adding value through more efficient bioprospecting 365.3.3 Equitable sharing of benefits derived from genetic resources 385.3.4 Towards an international regime on ABS 39
5.4 Tax and compensation mechanisms to reward stewardship 405.4.1 Using public levies to stimulate conservation 405.4.2 Greening intergovernmental fiscal transfers 425.4.3 Compensating land users for wildlife damage 44
5.5 Developing markets for green goods and services 455.5.1 Sectoral support for biodiversity-friendly products and services 455.5.2 Barriers to the success of certified products 505.5.3 Expanding the reach of biodiversity-friendly products 52
5.6 Green Public Procurement (GPP) 565.6.1 Objectives and take-up of GPP policies 565.6.2 GPP standards, criteria and costing 575.6.3 Tackling constraints on GPP implementation 59
References 65
THE ECONOMICS OF ECOSYSTEMS AND BIODIVERSITYTEEB for National and International Policy Makers
Chapter 5Rewarding benefits through payments
and markets
T E E B F O R N A T I O N A L A N D I N T E R N A T I O N A L P O L I C Y M A K E R S - C H A P T E R 5 : P A G E 1
R E W A R D I N G B E N E F I T S T H R O U G H P A Y M E N T S A N D M A R K E T S
Key Messages of Chapter 5
As highlighted throughout this report, the value of biodiversity and ecosystem services is not (fully) recognisedby markets: degradation and loss result from decision making that ignores or understates the local and globalbenefits provided by ecosystems. We urgently need new policy frameworks that reward the provisionof ecosystem services and promote the greening of supply chains.
This chapter focuses on innovative tools to reward ecosystem benefits efficiently and equitably through directpayments and tax incentives or by stimulating markets for products and services that have reduced environ-mental impact. These tools can be combined with instruments and approaches discussed in other chaptersof this report. Effective policy mixes in each country will depend on national context and priorities.
National and international payments for ecosystem services (PES)
PES schemes that compensate those who maintain or enhance the flow of ecosystem services have alreadydemonstrated their potential. In a global context of stagnant funding for biodiversity conservation, PES offerconsiderable potential to raise new funds for biodiversity or to use existing funding more efficiently. Both thepublic and private sectors can play a role in establishing PES in different contexts. PES have proven to be ahighly flexible tool, providing both direct and indirect rewards for various ecosystem services and biodiversityconservation at a range of different scales.
At an international scale, one of the most significant PES opportunities on the table is REDD (ReducingEmissions from Deforestation and Forest Degradation in developing countries), which is being negotiatedas part of the post-2012 climate change regime under the United Nations Framework Convention on ClimateChange. Recent proposals for ‘REDD-Plus’ would offer incentives for forest conservation, sustainable forestmanagement and enhancement of existing forest carbon stocks. Deforestation is estimated to account forup to 17% of global greenhouse gas (GHG) emissions: an agreement on such a mechanism could make asignificant contribution to addressing global climate change and also provide substantial biodiversity benefitsif designed and implemented with due consideration to the wide range of values of nature.
Recommendation: Promote PES demonstration activities and capacity building to develop theknowledge base, reduce transaction costs and scale up successful initiatives. Further efforts are needed to confirm where, in what form, and under what conditions PES work best for biodiversity, and to improve their targeting, monitoring and governance. PES should be designed to ensure additionality (i.e. going beyond ‘business as usual’) and to minimise leakage (i.e. displacement of damaging activities elsewhere). Spatial analysis – including data on economic costs and benefits – can help to map areas thatare most important for providing ecosystem services, as well as the distribution of providers and beneficiaries,in order to identify synergies and priorities for both policy makers and private investors. Due engagement of local populations in the design and implementation of PES can be a critical factor in the success of the instrument.
Recommendation: Support an international agreement on a REDD-Plus mechanism as part of theglobal climate regime, while ensuring that other ecosystem services besides climate mitigation aretaken into account. Depending on how REDD-Plus is designed and implemented, it could not only provideincentives for reducing emissions from deforestation and degradation but also secure biodiversity and otherbenefits at international, national and local levels. Appropriate safeguards should be formulated to reducepotential adverse impacts on biodiversity and to respect the rights and needs of indigenous and local com-munities, without making the rules so onerous that investors are unduly discouraged.
T E E B F O R N A T I O N A L A N D I N T E R N A T I O N A L P O L I C Y M A K E R S - C H A P T E R 5 : P A G E 2
T E E B F O R N A T I O N A L A N D I N T E R N A T I O N A L P O L I C Y M A K E R S - C H A P T E R 5 : P A G E 3
R E W A R D I N G B E N E F I T S T H R O U G H P A Y M E N T S A N D M A R K E T S
Recommendation: Contribute to emerging international initiatives to support direct investment inbiodiversity public goods and natural capital across a wider array of ecosystems, such as the proposedGreen Development Mechanism.
Access and benefit sharing for genetic resources (ABS)
ABS-related activities straddle payment schemes and market-based rewards. Historically, host countries havebenefited little from the development and commercialisation of products based on genetic resources sourcedfrom their territory. A fairer and more efficient regime is needed that can establish clear rights for local people,encourage the conservation of genetic resources in situ and facilitate discoveries and their application acrossa range of sectors.
Recommendation: Successfully conclude negotiations under the CBD on the international regimefor more efficient and equitable sharing of the benefits arising out of the utilisation of genetic resources. A premium is needed for traditional local knowledge that leads to successful commercialisationbased on genetic resources, together with better screening, contractual and dispute resolution proceduresto minimise transaction costs. Investing in local capacity for documenting and assessing the state and valueof biodiversity will be critical to successful initiatives.
Tax-based mechanisms and public compensation mechanism
Private and public efforts at a local level to conserve nature lead to national benefits that merit due incentiveand payment schemes. The use of tax breaks and other compensation mechanisms offer an important‘thanks’ and incentives for efforts. Similarly, transfers of tax revenues across regions can help give additionalsupport to regions in recognition of biodiversity-rich areas or pro-biodiversity activities that create nationalpublic goods.
Recommendation: Make more systematic use of opportunities to provide tax exemptions for activities that integrate ecological concerns and promote conservation. Tax breaks can provide power-ful incentives for private actors to donate land or to engage in long-term stewardship agreements. Intergo-vernmental fiscal transfers can likewise provide positive incentives to public agencies at various levels:ecological (e.g. protected area) criteria can be used when allocating tax revenues to lower government levelsand hence address financing gaps and needs on the ground.
Recommendation: Damage caused by protected wildlife to local people needs to be recognised asa significant and legitimate concern. Public compensation programmes that account for such damageare necessary but should also aim to promote a more positive perspective that rewards the presence andprotection of wildlife.
Green markets and fiscal incentives
The recent expansion of markets for biodiversity-friendly products and services – including forestry, fisheriesand agriculture, tourism and other sectors – reflects a combination of market push (supply-side) initiatives byproducers and market pull (demand-side) changes in the preferences of consumers, business and govern-ments, expressed via their purchasing decisions. Markets that take ecosystems into account can stimulatethe adoption of new production and processing methods that are cleaner, greener and more equitable, whilehelping to ensure the continued provision of scarce ecosystem services. Governments play an important roleby providing an enabling framework that can incentivise these markets, including innovative tax and fiscalpolicies.
T E E B F O R N A T I O N A L A N D I N T E R N A T I O N A L P O L I C Y M A K E R S - C H A P T E R 5 : P A G E 4
R E W A R D I N G B E N E F I T S T H R O U G H P A Y M E N T S A N D M A R K E T S
Recommendation: Help producers prepare for new market opportunities as consumers and publicprocurement policies stimulate demand for biodiversity-friendly products and services. Policy makerscan support the development of robust process and performance standards and verification systems thatexplicitly include biodiversity conservation, including both mandatory and voluntary schemes. Public businessadvisory and support programmes should be geared to help companies meet the needs of new markets forgreen products and services.
Recommendation: Cooperative measures should be put in place to support developing countries’production and export sectors, to enable them to participate effectively in the development and implementation of new market standards. Targeted support of this kind can be an important part of international development aid, offering synergies between biodiversity, development and poverty reduction,particularly if local rights, traditions and livelihoods are taken into account.
T E E B F O R N A T I O N A L A N D I N T E R N A T I O N A L P O L I C Y M A K E R S - C H A P T E R 5 : P A G E 5
R E W A R D I N G B E N E F I T S T H R O U G H P A Y M E N T S A N D M A R K E T S
Biodiversity provides a range of ecosystem services1
that benefit people locally, nationally and internationally.The provision of these services stems directly from natural processes, although management interventionsare often required to maintain, develop or protect them.Many are not priced or are underpriced in the marketswhich means that existing economic signals may notreflect the true value of natural capital.
Chapter 5 focuses on payment and market-basedtools to reward private and public actors who maintainthe flow of services that benefit society. 5.1 explainshow schemes delivering payments for ecosystem ser-vices (PES) actually work, drawing on lessons learntfrom existing programmes and setting out indicatorsfor improved design and implementation. 5.2 focuseson international PES, in particular the proposed REDD(Reducing Emissions from Deforestation and ForestDegradation) mechanism being developed under theUN Framework Convention on Climate Change, and
also considers emerging initiatives to reward a widerrange of biodiversity-related services across all ecosys-tems.
5.3 assesses the strengths and weaknesses of currentreward structures for Access and Benefit Sharing forgenetic resources (ABS) that are being addressedthrough negotiations for an international ABS regimewithin the Convention on Biological Diversity. 5.4discusses how land, property and income tax regimescould be used more systematically to encourage private and public actors to commit to long-term conservation and how compensation payments can beshifted towards a more positive focus.
Lastly, the scope to stimulate and better target marketsupply and demand for goods and services producedwith lower environmental impact are discussed in 5.5(eco-labelling and certification schemes) and 5.6(Green Public Procurement (GPP) policies).
“We never know the worth of water 'til the well is dry”.English proverb
Rewarding benefits through payments and markets5
T E E B F O R N A T I O N A L A N D I N T E R N A T I O N A L P O L I C Y M A K E R S - C H A P T E R 5 : P A G E 6
R E W A R D I N G B E N E F I T S T H R O U G H P A Y M E N T S A N D M A R K E T S
“Men do not value a good deed unless it brings a reward”
Ovid, B.C. 43 – 18 A.D., Roman Poet
This section describes how governments or private entities can provide payments to resource ownersand users to protect natural ecosystems or to adaptproduction practices that ensure the continued provision of ecosystem services (5.1.1). It explains the basic principles and architecture of PES schemes(5.1.2) and provides concrete examples with lessonslearnt to date (5.1.3). Remaining constraints and new opportunities are assessed (5.1.4) before settingout practical steps for improving PES design and implementation (5.1.5).
5.1.1 WHAT DO WE MEAN BY PES?
PES is a generic name for a variety of arrange-ments through which the beneficiaries of ecosystem services pay the providers of thoseservices (Gutman 2006). The term covers paymentsfor sustainable management of water resourcesand/or agricultural land, biodiversity conservationand storage and/or sequestration of carbon in biomass. This section outlines their role and scope:case examples are explored in more detail in Section5.1.3.
PES typically involve payments to ensure the provisionof a specific service. They are used for managing forest
PAYMENTS FOR ECOSYSTEM SERVICES (PES)5.1
and agricultural land to ensure water quality for nearbycities, such as New York (Catskills-Delaware waters-hed) and Saltillo city, Mexico (Zapalinamé mountains),to cleanse coastal waters in Sweden (Zanderson et al.2009) and to protect groundwaters in many Europeancountries and parts of Japan (see Box 5.3 and, forother examples, Porras et al. 2008). Carbon seques-tration via farm management is rewarded in New Zea-land and via forest management in Costa Rica andUganda. Farming practices that maintain other ecosys-tem services are rewarded through agri-environmentpayments in the EU and the US (Wunder et al. 2009;Baylis et al. 2004; Zanderson et al. 2009; see alsoChapter 6). PES are also used to tackle external threatsthat could undermine service provision e.g. for removalof invasive alien species through South Africa’s Wor-king for Water Programme (see Box 5.6).
Other PES schemes focus on the provision of multipleservices from a given area. Costa Rica’s well-known programme (Pagos por Servicios Ambientales) supportsa bundle of four services (see Box 5.2; Pagiola 2008;Wunder and Wertz-Kanounnikoff 2009). PES schemesto combine improved groundwater quality with increasedbiodiversity are found in e.g. Germany (see Box 5.5) andBolivia (Los Negros watershed, see Asquith et al. 2008).PES schemes primarily for biodiversity conservation in-clude the Bushtender programme (Victoria, Australia2)and the US Conservation Reserve Programme3.
PES are highly flexible and can be established bydifferent actors. Some schemes are managed by
PES can be defined as voluntary transactions where a well-defined ecosystem service (ES) (or land-use likely to secure that service) is ‘bought’ by at least one ES buyer from at least one ES provider, if and onlyif the ES provider secures ES provision (conditionality).
Source: adapted from Wunder 2005
Box 5.1: Definition of PES
T E E B F O R N A T I O N A L A N D I N T E R N A T I O N A L P O L I C Y M A K E R S - C H A P T E R 5 : P A G E 7
R E W A R D I N G B E N E F I T S T H R O U G H P A Y M E N T S A N D M A R K E T S
as hydroelectric power companies, irrigation authorities,water companies or aquaculture operations – may alsobe willing to pay to secure services that underpin theirbusinesses. Private beneficiaries who make PES con-tracts with providers can thus internalise (some) environ-mental externalities on a purely voluntary basis.
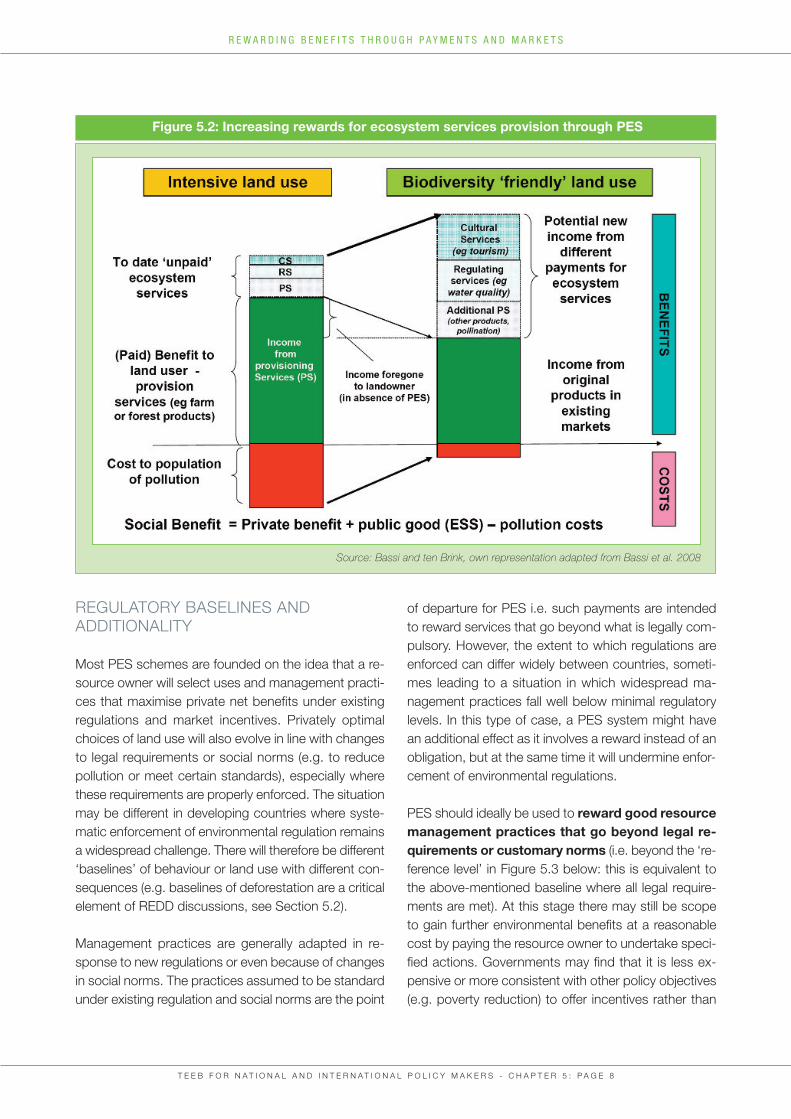
PES are intended to change the economics of eco-system management and can support biodiver-sity-friendly practices that benefit society as awhole (see Figure 5.2). In a situation where trade-offsexist between private and societal benefits from landuses, PES can tip the balance and render conservation-focused land uses more privately profitable with benefitsfor both the private land user and for society. In the absence of PES, the landowner would not choose thesocial optimum – unless other instruments such as re-gulation or incentives are in place (e.g. tax concessions,see Section 5.4) or social and cultural norms, customsor considerations lead to a social optimum without theneed for payment. Care is needed to ensure that the in-strument is socially compatible.
Care is also needed in their design as not all PES protect or conserve biodiversity. A focus on maximisingthe provision of just one service may have negative im-pacts on the provision of other ecosystem services iftrade-offs are involved e.g. PES that promote exoticspecies plantations for rapid carbon sequestration atthe expense of more diverse natural grasslands, which foster higher biodiversity.
national governments, as in Costa Rica, Ecuador, Me-xico, China, EU Member States and the US. Others areestablished by water companies or water-user asso-ciations, as in the Catskills where PES is used to meetfederal water quality standards for New York City andin Bolivia, Ecuador and Mexico. PES can also be purelyprivate arrangements, whereby companies that rely onspecific ecosystem services pay the relevant providers(e.g. payments to farmers by Perrier-Vittel in France:see Box 5.4). NGOs can also play an important role inPES e.g. by collaborating with the municipal watercompany in Quito (Wunder et al. 2009).
PES can be applied at different scales, ranging fromthe very local (e.g. 496 hectares in an upper watershedin northern Ecuador) to much larger scales (e.g. 4.9million hectares of sloping farmland reforested in China(Bennett 2008; see also Chapter 9).
5.1.2 PRINCIPLES AND ARCHITECTURE OF PES
RATIONALE FOR INVESTING IN PES
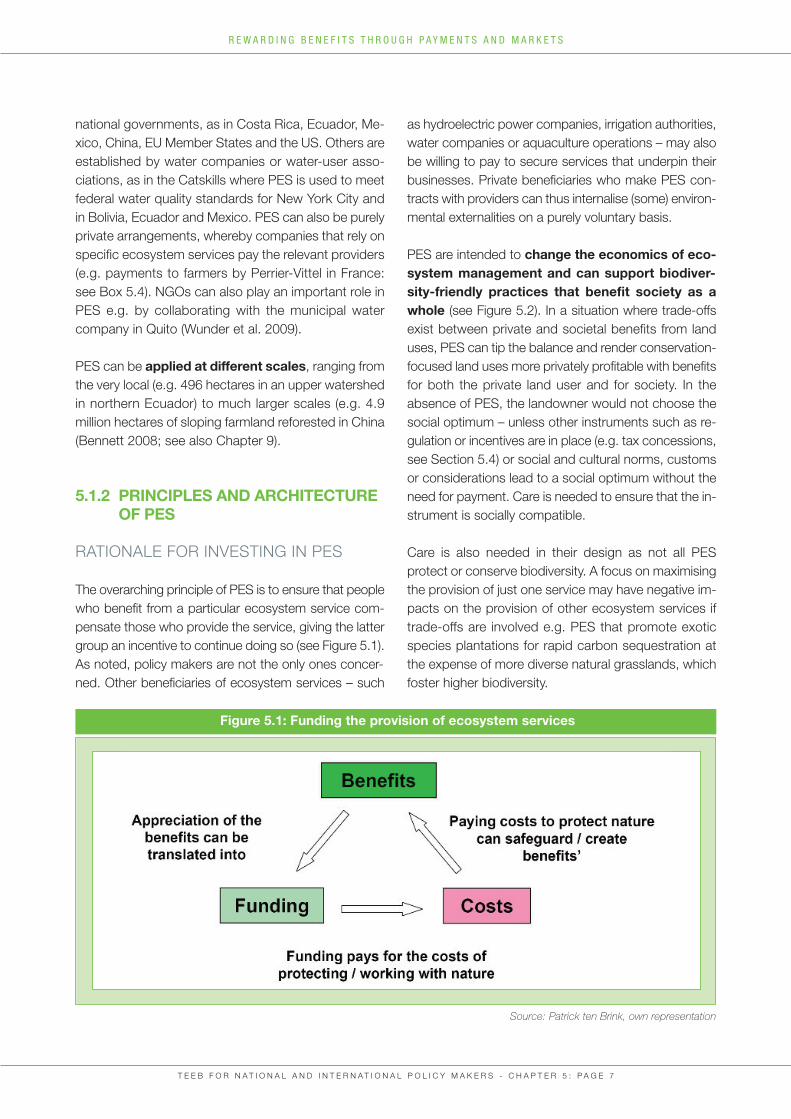
The overarching principle of PES is to ensure that peoplewho benefit from a particular ecosystem service com-pensate those who provide the service, giving the lattergroup an incentive to continue doing so (see Figure 5.1).As noted, policy makers are not the only ones concer-ned. Other beneficiaries of ecosystem services – such
Figure 5.1: Funding the provision of ecosystem services
Source: Patrick ten Brink, own representation
REGULATORY BASELINES AND ADDITIONALITY
Most PES schemes are founded on the idea that a re-source owner will select uses and management practi-ces that maximise private net benefits under existingregulations and market incentives. Privately optimalchoices of land use will also evolve in line with changesto legal requirements or social norms (e.g. to reducepollution or meet certain standards), especially wherethese requirements are properly enforced. The situationmay be different in developing countries where syste-matic enforcement of environmental regulation remainsa widespread challenge. There will therefore be different‘baselines’ of behaviour or land use with different con-sequences (e.g. baselines of deforestation are a criticalelement of REDD discussions, see Section 5.2).
Management practices are generally adapted in re-sponse to new regulations or even because of changesin social norms. The practices assumed to be standardunder existing regulation and social norms are the point
T E E B F O R N A T I O N A L A N D I N T E R N A T I O N A L P O L I C Y M A K E R S - C H A P T E R 5 : P A G E 8
R E W A R D I N G B E N E F I T S T H R O U G H P A Y M E N T S A N D M A R K E T S
of departure for PES i.e. such payments are intendedto reward services that go beyond what is legally com-pulsory. However, the extent to which regulations areenforced can differ widely between countries, someti-mes leading to a situation in which widespread ma-nagement practices fall well below minimal regulatorylevels. In this type of case, a PES system might havean additional effect as it involves a reward instead of anobligation, but at the same time it will undermine enfor-cement of environmental regulations.
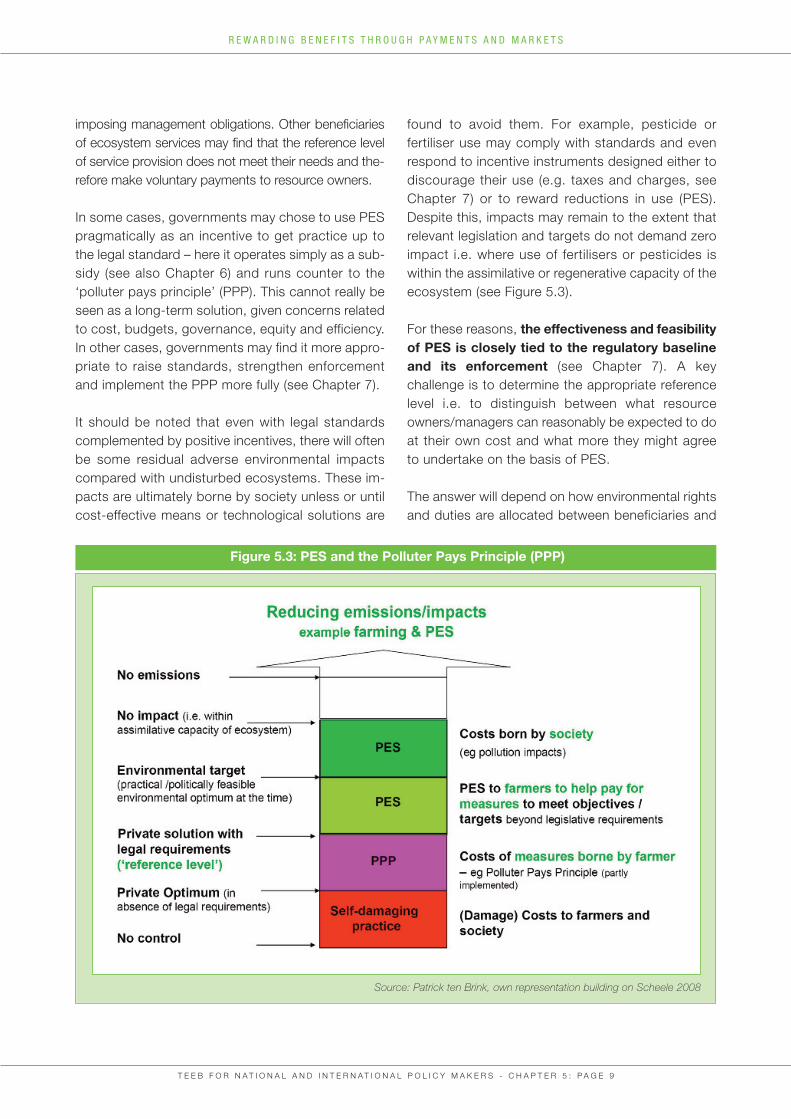
PES should ideally be used to reward good resourcemanagement practices that go beyond legal re-quirements or customary norms (i.e. beyond the ‘re-ference level’ in Figure 5.3 below: this is equivalent tothe above-mentioned baseline where all legal require-ments are met). At this stage there may still be scopeto gain further environmental benefits at a reasonablecost by paying the resource owner to undertake speci-fied actions. Governments may find that it is less ex-pensive or more consistent with other policy objectives(e.g. poverty reduction) to offer incentives rather than
Figure 5.2: Increasing rewards for ecosystem services provision through PES
Source: Bassi and ten Brink, own representation adapted from Bassi et al. 2008
T E E B F O R N A T I O N A L A N D I N T E R N A T I O N A L P O L I C Y M A K E R S - C H A P T E R 5 : P A G E 9
R E W A R D I N G B E N E F I T S T H R O U G H P A Y M E N T S A N D M A R K E T S
imposing management obligations. Other beneficiariesof ecosystem services may find that the reference levelof service provision does not meet their needs and the-refore make voluntary payments to resource owners.
In some cases, governments may chose to use PESpragmatically as an incentive to get practice up tothe legal standard – here it operates simply as a sub-sidy (see also Chapter 6) and runs counter to the‘polluter pays principle’ (PPP). This cannot really beseen as a long-term solution, given concerns relatedto cost, budgets, governance, equity and efficiency.In other cases, governments may find it more appro-priate to raise standards, strengthen enforcementand implement the PPP more fully (see Chapter 7).
It should be noted that even with legal standardscomplemented by positive incentives, there will oftenbe some residual adverse environmental impactscompared with undisturbed ecosystems. These im-pacts are ultimately borne by society unless or untilcost-effective means or technological solutions are
found to avoid them. For example, pesticide or fertiliser use may comply with standards and evenrespond to incentive instruments designed either todiscourage their use (e.g. taxes and charges, seeChapter 7) or to reward reductions in use (PES). Despite this, impacts may remain to the extent thatrelevant legislation and targets do not demand zeroimpact i.e. where use of fertilisers or pesticides iswithin the assimilative or regenerative capacity of theecosystem (see Figure 5.3).
For these reasons, the effectiveness and feasibilityof PES is closely tied to the regulatory baselineand its enforcement (see Chapter 7). A key challenge is to determine the appropriate referencelevel i.e. to distinguish between what resourceowners/managers can reasonably be expected to doat their own cost and what more they might agreeto undertake on the basis of PES.
The answer will depend on how environmental rightsand duties are allocated between beneficiaries and
Figure 5.3: PES and the Polluter Pays Principle (PPP)
Source: Patrick ten Brink, own representation building on Scheele 2008
providers, whether formally or through de factoestablished practices. This varies between differentlegal systems and social contexts. Where downst-ream populations assert a right to clean water, it maybe considered that upstream landowners shouldbear the costs of reducing pollution in accordancewith the polluter pays principle. Conversely, if thoselandowners enjoy unencumbered rights to managetheir land as they see fit, the burden of persuadingthem to modify their practices may fall on service be-neficiaries (Johnstone and Bishop 2007)4.
PES are sometimes criticised as a ‘second best’ solu-tion by those who believe that beneficiaries have a rightto enjoy ecosystem services that would have been available in the absence of damaging activities (i.e. freepublic goods delivered by nature); based on this argu-ment, PES is less ethically satisfactory than strengthe-ning the law to make polluters pay. Others suggest thatPES is often just a disguised subsidy to encouragecompliance with existing laws and can unfairly burdenthe public purse (where governments finance PES). Inresponse to such concerns, the justification for PES isthat it can be more cost-effective than strict enforce-ment, more progressive (where providers are relativelypoor land users), and/or that it secures additional bene-
fits beyond the minimum legal requirements. PES canalso be seen as a temporary measure to motivate theadoption of new management practices and technolo-gies which may eventually become economically justifi-able in their own right (Johnstone, N. and Bishop, J.2007).
Defining reference levels in terms of business-as-usualscenarios (BAU) carries a risk that resource ownersexaggerate the level of environmental threat in order towin more payments for conservation5. This risk is parti-cularly relevant in the case of REDD (e.g. overstatingthe rate of deforestation that would occur in a BAU sce-nario without payments: see Section 5.2 below).
THE STRUCTURE OF PES
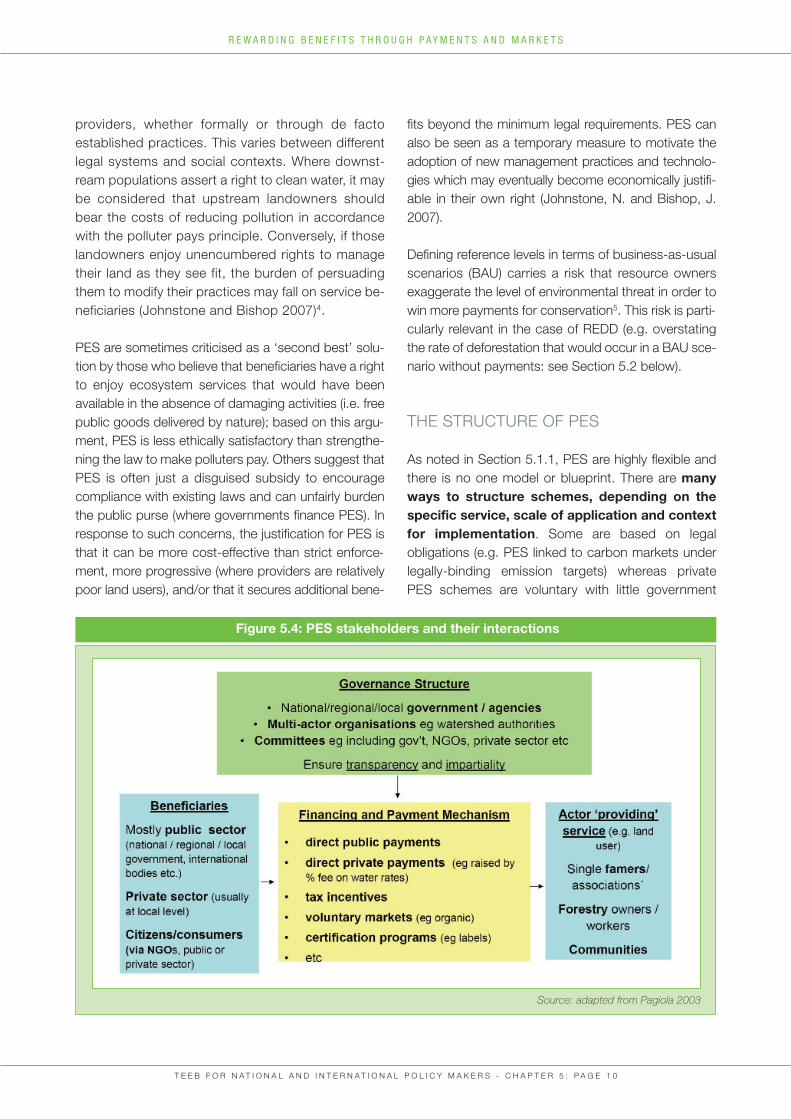
As noted in Section 5.1.1, PES are highly flexible andthere is no one model or blueprint. There are manyways to structure schemes, depending on thespecific service, scale of application and contextfor implementation. Some are based on legal obligations (e.g. PES linked to carbon markets underlegally-binding emission targets) whereas private PES schemes are voluntary with little government
T E E B F O R N A T I O N A L A N D I N T E R N A T I O N A L P O L I C Y M A K E R S - C H A P T E R 5 : P A G E 1 0
R E W A R D I N G B E N E F I T S T H R O U G H P A Y M E N T S A N D M A R K E T S
Figure 5.4: PES stakeholders and their interactions
Source: adapted from Pagiola 2003
involvement. Sources and mechanisms for paymentsvary as do the providers (e.g. communities, farmers,forest owners, agribusinesses, timber companies) andthe beneficiaries. Figure 5.4 provides a generic outlineof the basic structure for most PES.
5.1.3 APPLICATIONS, BENEFITS AND LESSONS LEARNT
APPLICATION OF PES TO DIFFERENTCONTEXTS
PES can be implemented at different geographic scales, depending on the nature of the beneficiaries, theproviders and the spatial relationship between them.
If a site provides a service that is mainly useful locally(e.g. pollination of crops), then a local PES makes sense.
If it provides national benefits (e.g. pest control), then itis arguably for national government to initiate the appro-priate PES or to use legal measures to secure a publicgood or service. Provision of global benefits (e.g. as inthe case of biodiversity and carbon services) may requirean internationally coordinated approach (see Section 5.2below on REDD).
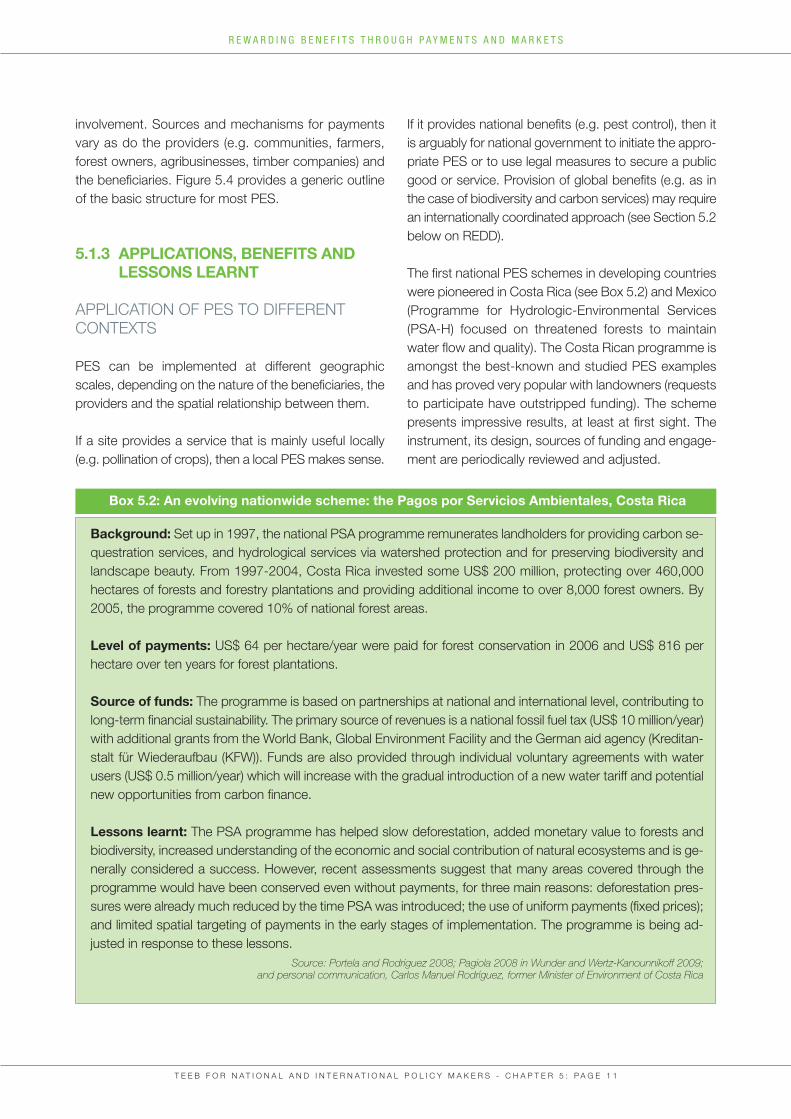
The first national PES schemes in developing countrieswere pioneered in Costa Rica (see Box 5.2) and Mexico(Programme for Hydrologic-Environmental Services(PSA-H) focused on threatened forests to maintainwater flow and quality). The Costa Rican programme isamongst the best-known and studied PES examplesand has proved very popular with landowners (requeststo participate have outstripped funding). The schemepresents impressive results, at least at first sight. Theinstrument, its design, sources of funding and engage-ment are periodically reviewed and adjusted.
T E E B F O R N A T I O N A L A N D I N T E R N A T I O N A L P O L I C Y M A K E R S - C H A P T E R 5 : P A G E 1 1
R E W A R D I N G B E N E F I T S T H R O U G H P A Y M E N T S A N D M A R K E T S
Box 5.2: An evolving nationwide scheme: the Pagos por Servicios Ambientales, Costa Rica
Background: Set up in 1997, the national PSA programme remunerates landholders for providing carbon se-questration services, and hydrological services via watershed protection and for preserving biodiversity andlandscape beauty. From 1997-2004, Costa Rica invested some US$ 200 million, protecting over 460,000hectares of forests and forestry plantations and providing additional income to over 8,000 forest owners. By2005, the programme covered 10% of national forest areas.
Level of payments: US$ 64 per hectare/year were paid for forest conservation in 2006 and US$ 816 perhectare over ten years for forest plantations.
Source of funds: The programme is based on partnerships at national and international level, contributing tolong-term financial sustainability. The primary source of revenues is a national fossil fuel tax (US$ 10 million/year)with additional grants from the World Bank, Global Environment Facility and the German aid agency (Kreditan-stalt für Wiederaufbau (KFW)). Funds are also provided through individual voluntary agreements with waterusers (US$ 0.5 million/year) which will increase with the gradual introduction of a new water tariff and potentialnew opportunities from carbon finance.
Lessons learnt: The PSA programme has helped slow deforestation, added monetary value to forests andbiodiversity, increased understanding of the economic and social contribution of natural ecosystems and is ge-nerally considered a success. However, recent assessments suggest that many areas covered through theprogramme would have been conserved even without payments, for three main reasons: deforestation pres-sures were already much reduced by the time PSA was introduced; the use of uniform payments (fixed prices);and limited spatial targeting of payments in the early stages of implementation. The programme is being ad-justed in response to these lessons.
Source: Portela and Rodriguez 2008; Pagiola 2008 in Wunder and Wertz-Kanounnikoff 2009; and personal communication, Carlos Manuel Rodríguez, former Minister of Environment of Costa Rica
PES schemes can also be piloted at local level andsubsequently rolled out on a wider scale. In Japan, thecombination of serious forest degradation and the fin-dings of a national valuation of forest ecosystem ser-vices shifted the policy landscape. The resultingestimates of monetary values helped generate sufficientpolitical support for changing local tax systems in overhalf of the country’s prefectures (see Box 5.3 and alsoChapter 4 on the importance of valuation).
The issue of regulatory baselines and additionalecosystem benefits comes up in two cases relatedto improving groundwater quality, involving both pri-
vate and public beneficiaries. In the Vittel bottledwater case (Box 5.4) and agricultural payments inGermany (see Box 5.5) existing regulations were notstringent enough to prevent pollution of groundwaterswith nitrates and pesticides or to make the polluterspay for avoidance. In response to product quality andcost concerns (Vittel) and broader health and biodiver-sity concerns (both cases), a pragmatic approach wasadopted. These agreements can be characterised asPES, as regards provision of public goods through in-creased biodiversity, or as a subsidy for environmentalservices with regard to the contribution to reducedpollution (see Chapter 6).
T E E B F O R N A T I O N A L A N D I N T E R N A T I O N A L P O L I C Y M A K E R S - C H A P T E R 5 : P A G E 1 2
R E W A R D I N G B E N E F I T S T H R O U G H P A Y M E N T S A N D M A R K E T S
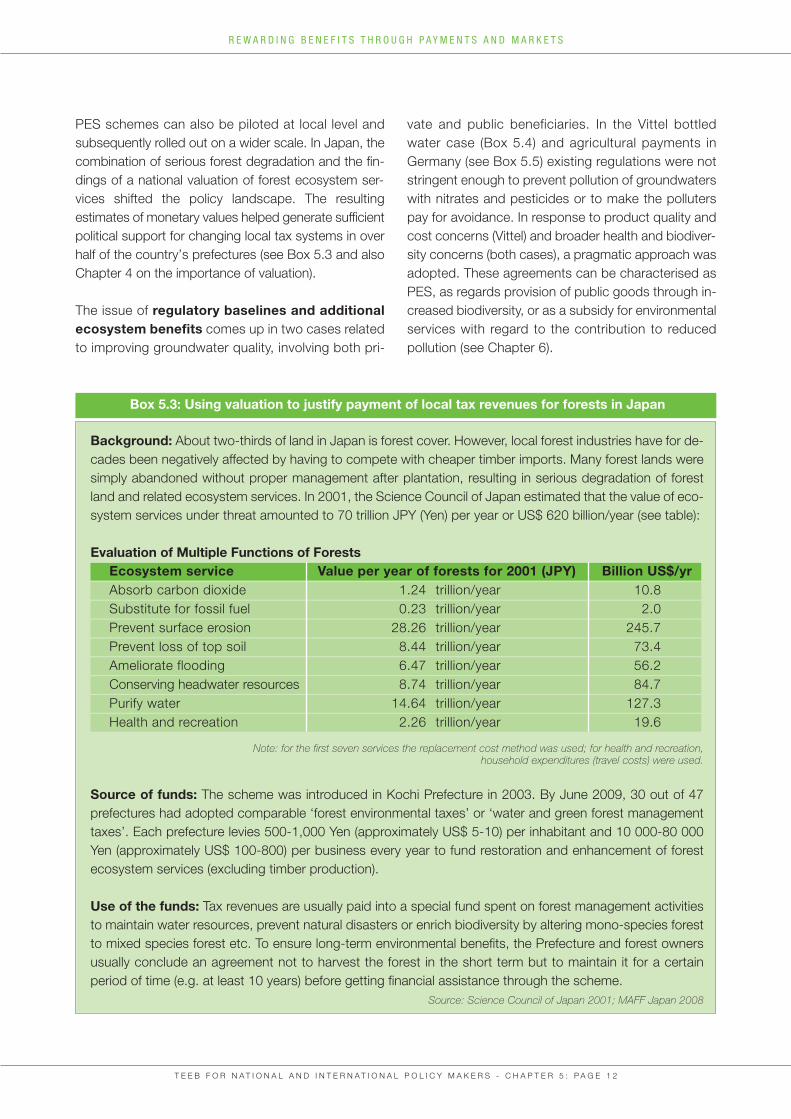
Box 5.3: Using valuation to justify payment of local tax revenues for forests in Japan
Background: About two-thirds of land in Japan is forest cover. However, local forest industries have for de-cades been negatively affected by having to compete with cheaper timber imports. Many forest lands weresimply abandoned without proper management after plantation, resulting in serious degradation of forestland and related ecosystem services. In 2001, the Science Council of Japan estimated that the value of eco-system services under threat amounted to 70 trillion JPY (Yen) per year or US$ 620 billion/year (see table):
Evaluation of Multiple Functions of ForestsEcosystem service Value per year of forests for 2001 (JPY) Billion US$/yrAbsorb carbon dioxide 1.24 trillion/year 10.8Substitute for fossil fuel 0.23 trillion/year 2.0Prevent surface erosion 28.26 trillion/year 245.7Prevent loss of top soil 8.44 trillion/year 73.4Ameliorate flooding 6.47 trillion/year 56.2Conserving headwater resources 8.74 trillion/year 84.7Purify water 14.64 trillion/year 127.3Health and recreation 2.26 trillion/year 19.6
Note: for the first seven services the replacement cost method was used; for health and recreation, household expenditures (travel costs) were used.
Source of funds: The scheme was introduced in Kochi Prefecture in 2003. By June 2009, 30 out of 47prefectures had adopted comparable ‘forest environmental taxes’ or ‘water and green forest managementtaxes’. Each prefecture levies 500-1,000 Yen (approximately US$ 5-10) per inhabitant and 10 000-80 000Yen (approximately US$ 100-800) per business every year to fund restoration and enhancement of forestecosystem services (excluding timber production).
Use of the funds: Tax revenues are usually paid into a special fund spent on forest management activitiesto maintain water resources, prevent natural disasters or enrich biodiversity by altering mono-species forestto mixed species forest etc. To ensure long-term environmental benefits, the Prefecture and forest ownersusually conclude an agreement not to harvest the forest in the short term but to maintain it for a certainperiod of time (e.g. at least 10 years) before getting financial assistance through the scheme.
Source: Science Council of Japan 2001; MAFF Japan 2008
T E E B F O R N A T I O N A L A N D I N T E R N A T I O N A L P O L I C Y M A K E R S - C H A P T E R 5 : P A G E 1 3
R E W A R D I N G B E N E F I T S T H R O U G H P A Y M E N T S A N D M A R K E T S
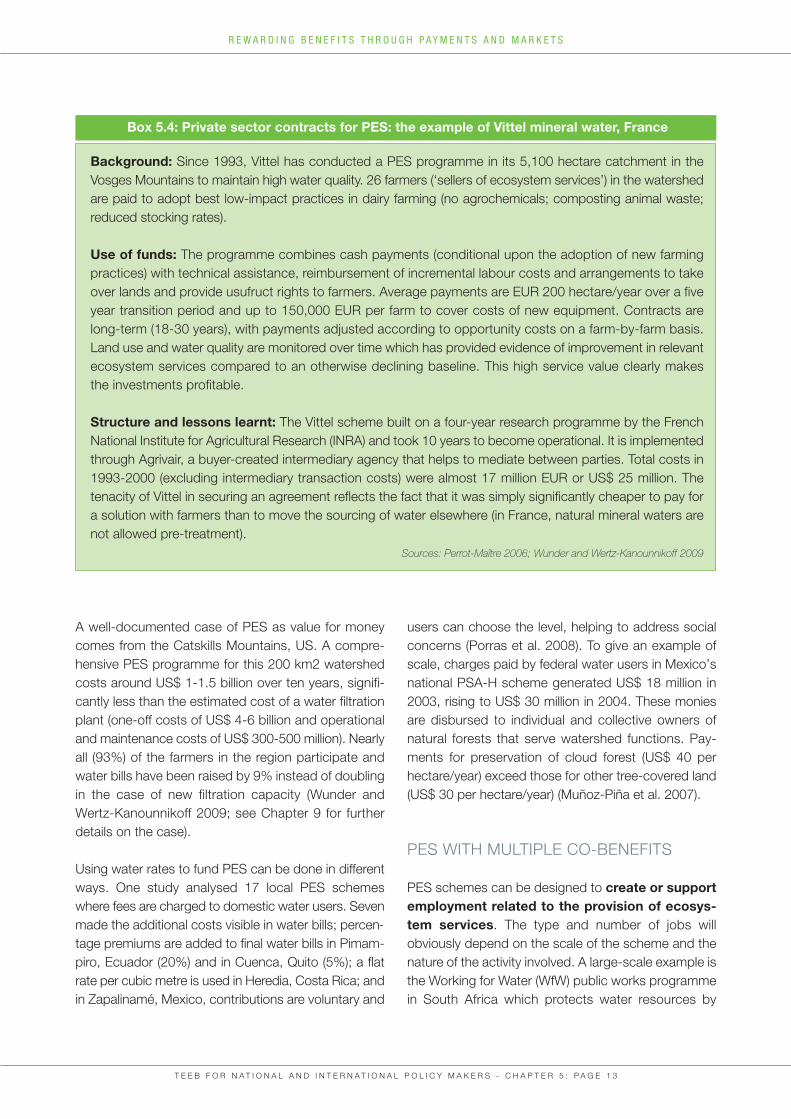
Box 5.4: Private sector contracts for PES: the example of Vittel mineral water, France
Background: Since 1993, Vittel has conducted a PES programme in its 5,100 hectare catchment in theVosges Mountains to maintain high water quality. 26 farmers (‘sellers of ecosystem services’) in the watershedare paid to adopt best low-impact practices in dairy farming (no agrochemicals; composting animal waste; reduced stocking rates).
Use of funds: The programme combines cash payments (conditional upon the adoption of new farmingpractices) with technical assistance, reimbursement of incremental labour costs and arrangements to takeover lands and provide usufruct rights to farmers. Average payments are EUR 200 hectare/year over a fiveyear transition period and up to 150,000 EUR per farm to cover costs of new equipment. Contracts arelong-term (18-30 years), with payments adjusted according to opportunity costs on a farm-by-farm basis.Land use and water quality are monitored over time which has provided evidence of improvement in relevantecosystem services compared to an otherwise declining baseline. This high service value clearly makes the investments profitable.
Structure and lessons learnt: The Vittel scheme built on a four-year research programme by the FrenchNational Institute for Agricultural Research (INRA) and took 10 years to become operational. It is implementedthrough Agrivair, a buyer-created intermediary agency that helps to mediate between parties. Total costs in1993-2000 (excluding intermediary transaction costs) were almost 17 million EUR or US$ 25 million. The tenacity of Vittel in securing an agreement reflects the fact that it was simply significantly cheaper to pay fora solution with farmers than to move the sourcing of water elsewhere (in France, natural mineral waters arenot allowed pre-treatment).
Sources: Perrot-Maître 2006; Wunder and Wertz-Kanounnikoff 2009
A well-documented case of PES as value for moneycomes from the Catskills Mountains, US. A compre-hensive PES programme for this 200 km2 watershedcosts around US$ 1-1.5 billion over ten years, signifi-cantly less than the estimated cost of a water filtrationplant (one-off costs of US$ 4-6 billion and operationaland maintenance costs of US$ 300-500 million). Nearlyall (93%) of the farmers in the region participate andwater bills have been raised by 9% instead of doublingin the case of new filtration capacity (Wunder andWertz-Kanounnikoff 2009; see Chapter 9 for furtherdetails on the case).
Using water rates to fund PES can be done in differentways. One study analysed 17 local PES schemeswhere fees are charged to domestic water users. Sevenmade the additional costs visible in water bills; percen-tage premiums are added to final water bills in Pimam-piro, Ecuador (20%) and in Cuenca, Quito (5%); a flatrate per cubic metre is used in Heredia, Costa Rica; andin Zapalinamé, Mexico, contributions are voluntary and
users can choose the level, helping to address socialconcerns (Porras et al. 2008). To give an example ofscale, charges paid by federal water users in Mexico’snational PSA-H scheme generated US$ 18 million in2003, rising to US$ 30 million in 2004. These moniesare disbursed to individual and collective owners of natural forests that serve watershed functions. Pay-ments for preservation of cloud forest (US$ 40 perhectare/year) exceed those for other tree-covered land(US$ 30 per hectare/year) (Muñoz-Piña et al. 2007).
PES WITH MULTIPLE CO-BENEFITS
PES schemes can be designed to create or supportemployment related to the provision of ecosys-tem services. The type and number of jobs will obviously depend on the scale of the scheme and thenature of the activity involved. A large-scale example isthe Working for Water (WfW) public works programmein South Africa which protects water resources by
T E E B F O R N A T I O N A L A N D I N T E R N A T I O N A L P O L I C Y M A K E R S - C H A P T E R 5 : P A G E 1 4
R E W A R D I N G B E N E F I T S T H R O U G H P A Y M E N T S A N D M A R K E T S
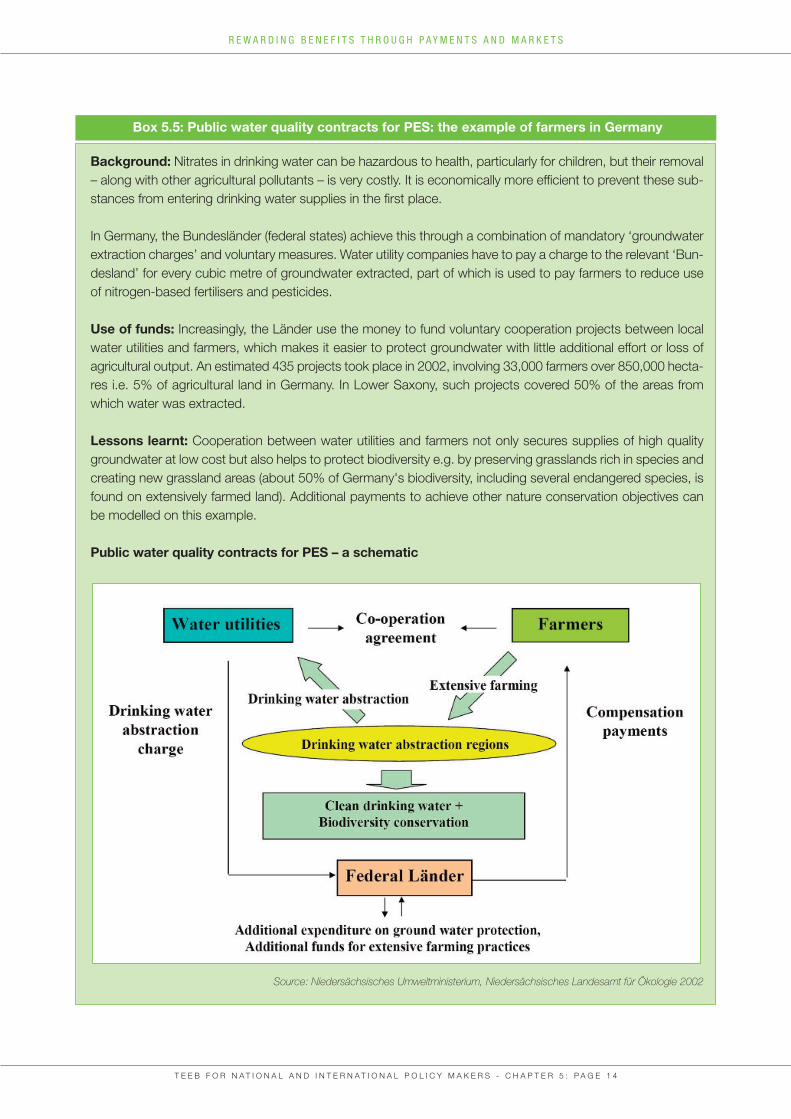
Box 5.5: Public water quality contracts for PES: the example of farmers in Germany
Background: Nitrates in drinking water can be hazardous to health, particularly for children, but their removal– along with other agricultural pollutants – is very costly. It is economically more efficient to prevent these sub-stances from entering drinking water supplies in the first place.
In Germany, the Bundesländer (federal states) achieve this through a combination of mandatory ‘groundwaterextraction charges’ and voluntary measures. Water utility companies have to pay a charge to the relevant ‘Bun-desland’ for every cubic metre of groundwater extracted, part of which is used to pay farmers to reduce useof nitrogen-based fertilisers and pesticides.
Use of funds: Increasingly, the Länder use the money to fund voluntary cooperation projects between localwater utilities and farmers, which makes it easier to protect groundwater with little additional effort or loss ofagricultural output. An estimated 435 projects took place in 2002, involving 33,000 farmers over 850,000 hecta-res i.e. 5% of agricultural land in Germany. In Lower Saxony, such projects covered 50% of the areas fromwhich water was extracted.
Lessons learnt: Cooperation between water utilities and farmers not only secures supplies of high qualitygroundwater at low cost but also helps to protect biodiversity e.g. by preserving grasslands rich in species andcreating new grassland areas (about 50% of Germany's biodiversity, including several endangered species, isfound on extensively farmed land). Additional payments to achieve other nature conservation objectives canbe modelled on this example.
Public water quality contracts for PES – a schematic
Source: Niedersächsisches Umweltministerium, Niedersächsisches Landesamt für Ökologie 2002
eliminating the spread of invasive plants. WfW hasmore than 300 projects in all nine South African pro-vinces. It has employed around 20,000 people peryear, 52% of them women6, and also provided skillstraining, health and HIV/AIDS education to participants.WfW is best understood as a PES-like programme asit does not make payments to landowners for continu-ous service provision but instead consists of ‘land-owner’ (the municipal government) contracting workersto manage public land sustainably (Wunder et al. 2008;see Box 5.6).
On the other hand, some PES schemes can reducerural employment if land is completely taken out of pro-duction or dedicated to less labour-intensive manage-ment practices to secure environmental benefits. Whilesuch a strategy has been applied in EU and US agri-environmental programmes with few negative equityimpacts, this could pose problems in developing coun-try contexts e.g. for landless households that rely onselling labour to farmers as a source of cash income(Zilberman et al. 2006).
The Socio Bosque Programme in Ecuador is a recentambitious PES scheme that aims to combine protectionfor a wider set of ecosystem services with poverty con-cerns and addressing climate change (see Box 5.7). Thisis of interest because payments for carbon storage andsequestration are expected to be a major driver of PESin the coming years. If targeted at areas of high biodi-versity value, ecosystem service provision and potentialfor poverty alleviation, they can offer major win-win opportunities (see also Section 5.2 on REDD).
In some cases PES involve non-monetary benefitsrather than a monetary reward. For example, protectedarea managers are increasingly exploring collaborativemanagement models to reduce tension across parkboundaries and better integrate protected areas intobroader regional development. In Kulekhani, Nepal,local PES-like schemes to regulate water or reduceerosion provide communities with development assis-tance in the form of medical services and education,rather than cash payments. In east and southernAfrica, communities living near protected areas are so-metimes granted limited access to the ecosystem inreturn for supporting conservation action. However, theeffectiveness of such indirect approaches may bequestioned (Ferraro and Kiss 2002).
5.1.4 OPPORTUNITIES AND CHALLENGES
PES can help make the value of ecosystem ser-vices more explicit and thus modify and potenti-ally reverse incentives for resource users toover-exploit or convert them. In some cases, de-mand for such services is currently low but may be-come more important in the future in response toincreased scarcity of the service being provided (e.g.due to population growth or loss of other areas provi-ding similar services). To determine whether PES couldhelp secure future benefits, we need to assess thelevel of ecosystem service provision and how thiscould change in the future and affect demand.
Voluntariness is a key feature of PES (see Box 5.1) alt-hough legal/regulatory underpinning is essential if theirfull potential is to be realised. There is potential toscale up existing PES (from local initiatives to national
T E E B F O R N A T I O N A L A N D I N T E R N A T I O N A L P O L I C Y M A K E R S - C H A P T E R 5 : P A G E 1 5
R E W A R D I N G B E N E F I T S T H R O U G H P A Y M E N T S A N D M A R K E T S
Box 5.6: Local environment and employmentgains via the Working for Water Programme
In 1999, the South African municipality of Her-manus responded to a water shortage by intro-ducing a block rate tariff system to reduce waterdemand. A significant percentage of revenuescollected were paid to WfW to clear invasivealien plants in the mountain catchment of the re-servoir supplying Hermanus with water, in orderto restore natural fire regimes, the productive potential of land, biodiversity and hydrologicalfunctioning.
The formal agreement between the municipalityand WfW continued until 2001, by which time theproject had treated 3,387 hectares of land, crea-ted 91 person years of employment and preven-ted losses estimated at between 1.1-1.6 millionm³ of water per year. Contracting costs were R2.7million and the estimated total cost R4.9 million(including project management costs and otheroverheads).
Source: Turpie et al. 2008
coverage), to implement PES in more countries, tomake PES more efficient and to address issues of per-manence. To date, however, not many PES schemeshave been effectively expanded.
PES involving the private sector offer the potential toraise additional finance and thus complement publicconservation funding. As public and private PES may operate differently, it is important to explore the relative benefits of voluntary and regulatory
approaches. While private actors can play a role inPES, the willingness to pay of existing beneficiaries isoften not sufficient to cover start-up or operating costs.This may be due to ‘free rider’ problems or to a lack ofknowledge of the full benefits provided by ecosystems.In such cases, governments may need to provide extraincentives or find alternative solutions. One such solu-tion might be to make a scheme obligatory once a cer-tain percentage of beneficiaries agrees to it, mitigatingthe free-rider problem.
T E E B F O R N A T I O N A L A N D I N T E R N A T I O N A L P O L I C Y M A K E R S - C H A P T E R 5 : P A G E 1 6
R E W A R D I N G B E N E F I T S T H R O U G H P A Y M E N T S A N D M A R K E T S
Box 5.7: Large-scale PES to alleviate poverty and reduce deforestation in Ecuador
Ecuador has about 10 million hectares of native forest cover but its deforestation rate is one of the hig-hest in South America (around 200,000 hectares lost each year). This leads to emission of about 55million tons of CO2 and also entails a huge loss of ecosystem services and subsistence for local people.
In 2008, pursuant to its National Development Plan, the government of Ecuador designed and approvedthe Programa Socio Bosque (Forest Partners Programme) to combine development and conservationobjectives and directly benefit poor farmers and indigenous communities. The mechanism consists ofa direct payment per hectare of native forest per year to landowners on condition that theyconserve (part of) their forest. Participation is voluntary and compliance will be monitored on a regularbasis through interpretation of satellite images and field visits. Specific programme goals over the firstsix years are to:
• protect over 4 million hectares of forest to conserve globally important biodiversity, protect soils and water and mitigate natural disasters;
• reduce greenhouse gas emissions from deforestation and forest degradation as an integral part of the national REDD strategy (PES measures will be supported by stronger enforcement of illegal logging and a national reforestation plan); and
• increase income and protect human capital in the poorest rural areas of the country with a total number of beneficiaries of about 1 million people.
Criteria to prioritise areas for implementation are being finalised and may include: high deforestationthreat; high value for ecosystem services (carbon storage, water protection and biodiversity); and highlevels of poverty.
Progress to date: The first contracts were signed in December 2008, benefiting about 15,000 peopleand covering 180,000 hectares of forest. In 2009, the scale of implementation increased: by May 2009,another 8000 beneficiaries had been registered, representing an additional 140,000 hectares. A dedi-cated trust fund has been established to assure long-term financial sustainability and transparent useof resources. The government intends to complement its own resources with support from internationalcooperation and through national and international PES schemes and carbon markets.
Sources: Marcela Aguiñaga*, Manuel Bravo*, Tannya Lozada*, Free de Koning** and Luis Suárez*** Ministerio del Ambiente del Ecuador** Conservación Internacional Ecuador
Background information available at: http://www.ambiente.gov.ec/contenido.php?cd=278
PES schemes face several constraints. They requiresignificant investments in information and capacity buil-ding. Priorities include mapping the supply and demandof ecosystem services, understanding current and expected future use of resources, engaging relevantstakeholders, supporting certification schemes and training administrators.
High transaction costs create a barrier to developingPES and reduce their cost-effectiveness. Dependingon the value of the ecosystems concerned, there maybe a justification for states (or international agencies)to subsidise start-up or transaction costs to facilitateprogress e.g. by paying for mapping ecosystem ser-vices or for stakeholder participation processes.
PES are not appropriate everywhere. They can beparticularly difficult to implement where resource tenureor use rights are insufficiently defined or enforced e.g.in the high seas and some mangroves, coral reefs, floodplains and forests without clear ownership. Where institutional capacity and transparency are lacking orwhere resource access and ownership are in dispute,PES ‘buyers’ have little incentive to participate becausethey have few guarantees that the activities paid for willactually be implemented – or even that a legitimate service provider can be identified.
PES design and implementation can also be compro-mised where there is unequal bargaining power bet-ween stakeholders (i.e. imbalance between serviceproviders and beneficiaries). This can affect who is in-cluded in the scheme, the way the money is shared,the rate of payment and the conditions set for serviceprovision and access (see Figure 5.5 below).
In some cases, a PES targeting a single service will not besufficient to halt its degradation or loss as the payment willbe less than the opportunity costs of a range of alternativeresource uses. However, PES schemes can be part of abroader mix of policy instruments that addresses the fullrange of ecosystem services from an area.
More generally, the proper sequencing of measuresis important for achieving effective and coherent poli-cies. Introducing payment schemes without the prior orsimultaneous removal or reform of policies with adverseconsequences on ecosystems and biodiversity will lead
to incoherent and wasteful policy packages. This hasbeen repeatedly underlined by the Organization for Eco-nomic Development and Co-operation (OECD), in parti-cular with regard to environmentally harmful subsidies(see Chapter 6).
The ability to quantify, monetise and communicatethe values of ecosystem services to key stakehol-ders – from politicians to industry to local communities– can help build support (see Box 5.3 above). However,the lack of a biophysical assessment and economic va-luation of an ecosystem service need not preclude PES(Wunder 2007). Some of the most valuable servicesmay be those that are most difficult to measure. Insome cases, precise quantification of the service wouldbe prohibitive (e.g. for small watershed schemes). Inthese cases, arguments based on the precautionaryprinciple may be enough to justify starting PES, alt-hough economic valuation should be used as and whennew information becomes available to adjust paymentlevels, targeting or conditions.
5.1.5 MOVING FORWARD ON PES DESIGN AND IMPLEMENTATION
Experience to date has underlined the importance ofcareful preparation to ensure that PES schemesare effective and appropriate for local conditions.Information on the social, economic and ecologicalcontext and the legal and institutional context needs tobe taken into account. Ideally, PES should be targeted,understandable, fair, cost-effective, accountable, enfor-ceable, coordinated with other instruments and respon-sive to community needs. In practice, the reality can bevery different.
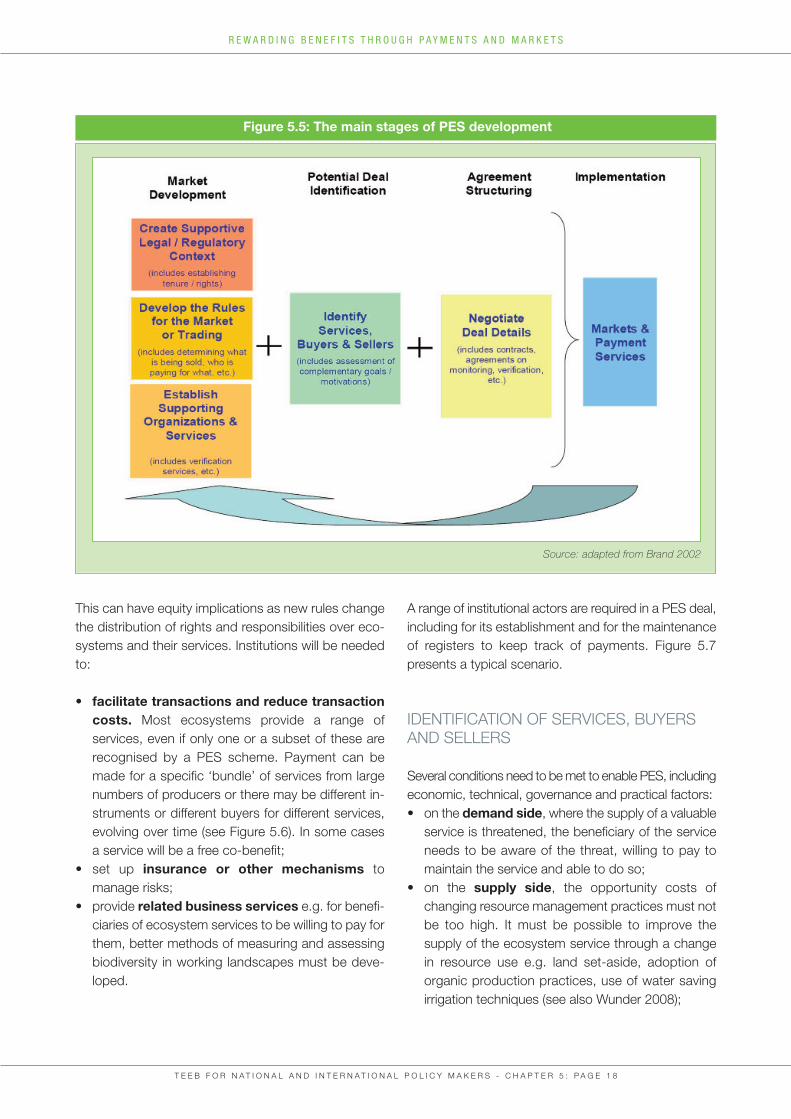
Key steps for PES development include identifying ser-vices and stakeholders, setting the baseline, negotiatingthe deal and implementing the scheme (see Figure 5.5)as well as monitoring and enforcement.
SUPPORTIVE LEGAL AND INSTITUTIONALCONTEXT
PES schemes require rules and institutions to functioneffectively, including mechanisms to enforce contracts.
T E E B F O R N A T I O N A L A N D I N T E R N A T I O N A L P O L I C Y M A K E R S - C H A P T E R 5 : P A G E 1 7
R E W A R D I N G B E N E F I T S T H R O U G H P A Y M E N T S A N D M A R K E T S
This can have equity implications as new rules changethe distribution of rights and responsibilities over eco-systems and their services. Institutions will be neededto:
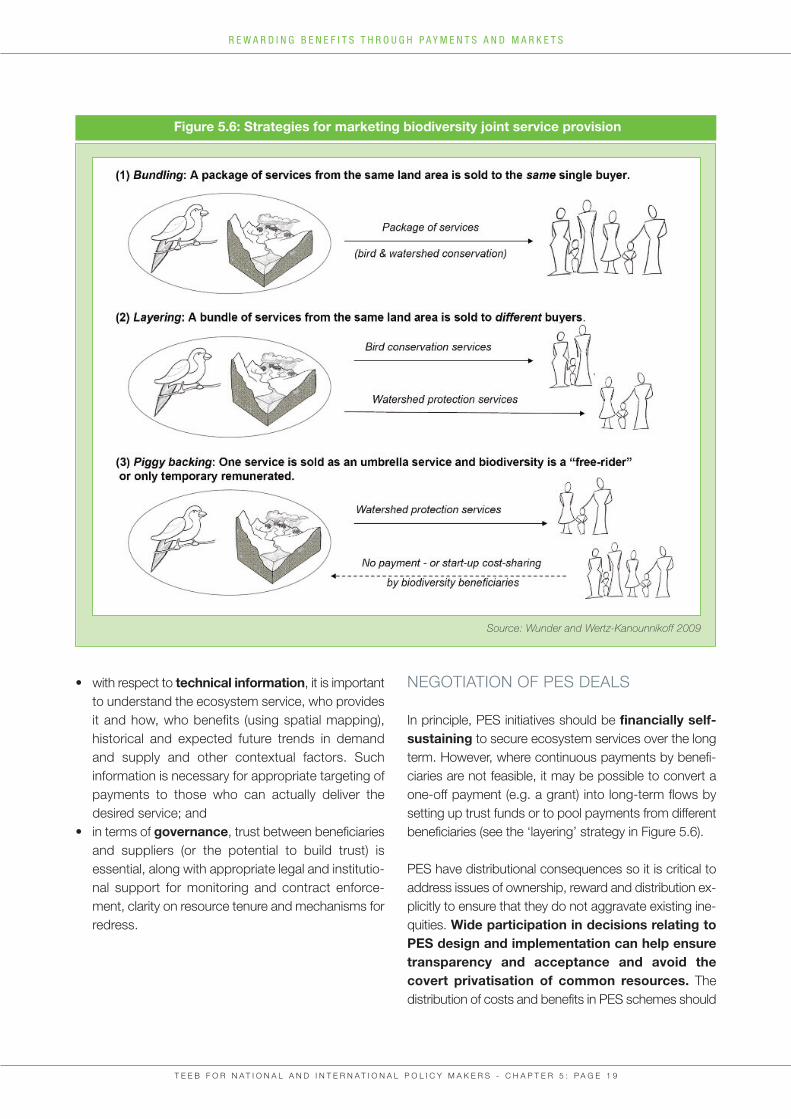
• facilitate transactions and reduce transaction costs. Most ecosystems provide a range of services, even if only one or a subset of these are recognised by a PES scheme. Payment can be made for a specific ‘bundle’ of services from large numbers of producers or there may be different in-struments or different buyers for different services, evolving over time (see Figure 5.6). In some cases a service will be a free co-benefit;
• set up insurance or other mechanisms to manage risks;
• provide related business services e.g. for benefi-ciaries of ecosystem services to be willing to pay for them, better methods of measuring and assessing biodiversity in working landscapes must be deve-loped.
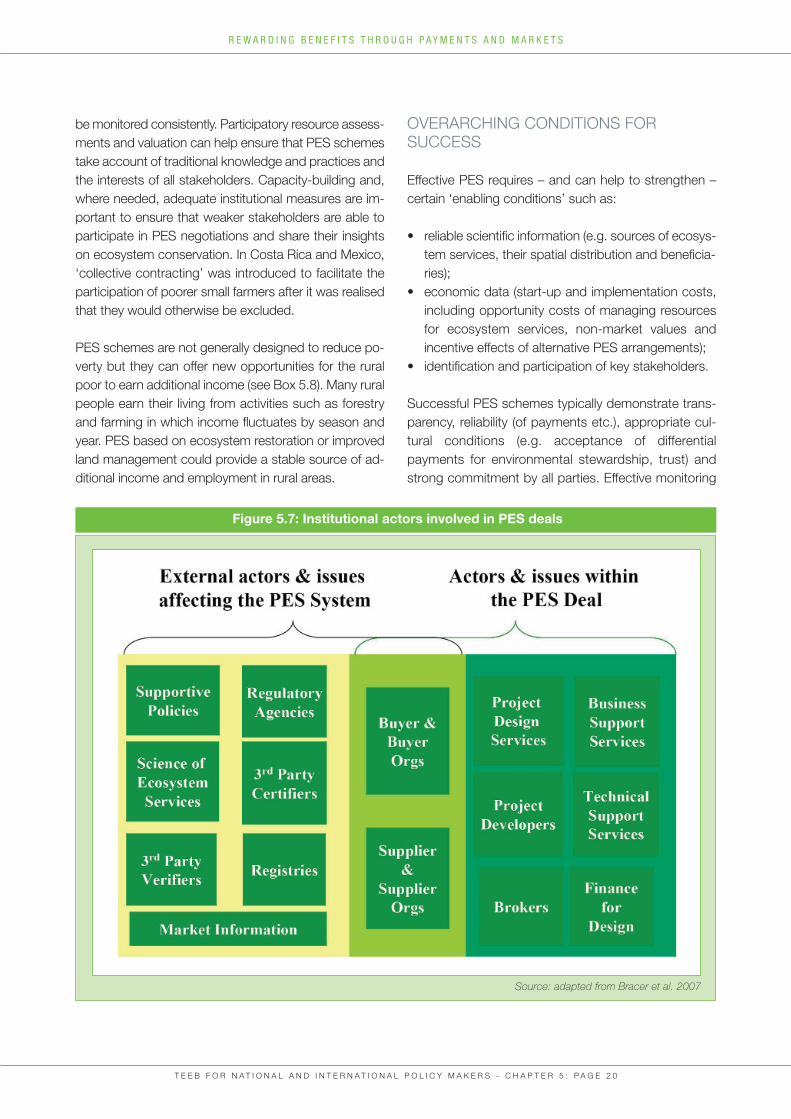
A range of institutional actors are required in a PES deal,including for its establishment and for the maintenanceof registers to keep track of payments. Figure 5.7 presents a typical scenario.
IDENTIFICATION OF SERVICES, BUYERSAND SELLERS
Several conditions need to be met to enable PES, includingeconomic, technical, governance and practical factors: • on the demand side, where the supply of a valuable service is threatened, the beneficiary of the service needs to be aware of the threat, willing to pay to maintain the service and able to do so;
• on the supply side, the opportunity costs of changing resource management practices must not be too high. It must be possible to improve the supply of the ecosystem service through a change in resource use e.g. land set-aside, adoption of organic production practices, use of water saving irrigation techniques (see also Wunder 2008);
T E E B F O R N A T I O N A L A N D I N T E R N A T I O N A L P O L I C Y M A K E R S - C H A P T E R 5 : P A G E 1 8
R E W A R D I N G B E N E F I T S T H R O U G H P A Y M E N T S A N D M A R K E T S
Figure 5.5: The main stages of PES development
Source: adapted from Brand 2002
• with respect to technical information, it is important to understand the ecosystem service, who provides it and how, who benefits (using spatial mapping), historical and expected future trends in demand and supply and other contextual factors. Such information is necessary for appropriate targeting of payments to those who can actually deliver the desired service; and
• in terms of governance, trust between beneficiaries and suppliers (or the potential to build trust) is essential, along with appropriate legal and institutio-nal support for monitoring and contract enforce-ment, clarity on resource tenure and mechanisms for redress.
NEGOTIATION OF PES DEALS
In principle, PES initiatives should be financially self-sustaining to secure ecosystem services over the longterm. However, where continuous payments by benefi-ciaries are not feasible, it may be possible to convert aone-off payment (e.g. a grant) into long-term flows bysetting up trust funds or to pool payments from differentbeneficiaries (see the ‘layering’ strategy in Figure 5.6).
PES have distributional consequences so it is critical toaddress issues of ownership, reward and distribution ex-plicitly to ensure that they do not aggravate existing ine-quities. Wide participation in decisions relating toPES design and implementation can help ensuretransparency and acceptance and avoid the covert privatisation of common resources. The distribution of costs and benefits in PES schemes should
T E E B F O R N A T I O N A L A N D I N T E R N A T I O N A L P O L I C Y M A K E R S - C H A P T E R 5 : P A G E 1 9
R E W A R D I N G B E N E F I T S T H R O U G H P A Y M E N T S A N D M A R K E T S
Figure 5.6: Strategies for marketing biodiversity joint service provision
Source: Wunder and Wertz-Kanounnikoff 2009
T E E B F O R N A T I O N A L A N D I N T E R N A T I O N A L P O L I C Y M A K E R S - C H A P T E R 5 : P A G E 2 0
R E W A R D I N G B E N E F I T S T H R O U G H P A Y M E N T S A N D M A R K E T S
be monitored consistently. Participatory resource assess-ments and valuation can help ensure that PES schemestake account of traditional knowledge and practices andthe interests of all stakeholders. Capacity-building and,where needed, adequate institutional measures are im-portant to ensure that weaker stakeholders are able toparticipate in PES negotiations and share their insightson ecosystem conservation. In Costa Rica and Mexico,‘collective contracting’ was introduced to facilitate theparticipation of poorer small farmers after it was realisedthat they would otherwise be excluded.
PES schemes are not generally designed to reduce po-verty but they can offer new opportunities for the ruralpoor to earn additional income (see Box 5.8). Many ruralpeople earn their living from activities such as forestryand farming in which income fluctuates by season andyear. PES based on ecosystem restoration or improvedland management could provide a stable source of ad-ditional income and employment in rural areas.
OVERARCHING CONDITIONS FOR SUCCESS
Effective PES requires – and can help to strengthen –certain ‘enabling conditions’ such as:
• reliable scientific information (e.g. sources of ecosys-tem services, their spatial distribution and beneficia-ries);
• economic data (start-up and implementation costs, including opportunity costs of managing resources for ecosystem services, non-market values and incentive effects of alternative PES arrangements);
• identification and participation of key stakeholders.
Successful PES schemes typically demonstrate trans-parency, reliability (of payments etc.), appropriate cul-tural conditions (e.g. acceptance of differentialpayments for environmental stewardship, trust) andstrong commitment by all parties. Effective monitoring
Figure 5.7: Institutional actors involved in PES deals
Source: adapted from Bracer et al. 2007
and enforcement is critical to ensure delivery of the in-tended services and their measurement. Paymentsmust be clearly linked to service provision and may bewithdrawn if resource users abandon managementpractices associated with the service. Monitoring dataon the quality and quantity of site services can help im-prove the targeting of payments or make other refine-ments (see also Chapter 3).
As noted, PES will not work everywhere. It may be diffi-cult to secure sufficient support for PES in situationswhere competing (destructive) resource uses are highlylucrative. Weak governance, unclear resource tenureand high transaction costs can also be major barriers.
As with any innovation, a critical step is to secure sup-port from leaders at various levels who can communi-cate the importance of ecosystem services and thepotential of PES to both providers and beneficiaries.There is also a need for careful analysis and effectivecommunication of experiences, both positive and ne-gative, to replicate and scale up successful initiatives.
T E E B F O R N A T I O N A L A N D I N T E R N A T I O N A L P O L I C Y M A K E R S - C H A P T E R 5 : P A G E 2 1
R E W A R D I N G B E N E F I T S T H R O U G H P A Y M E N T S A N D M A R K E T S
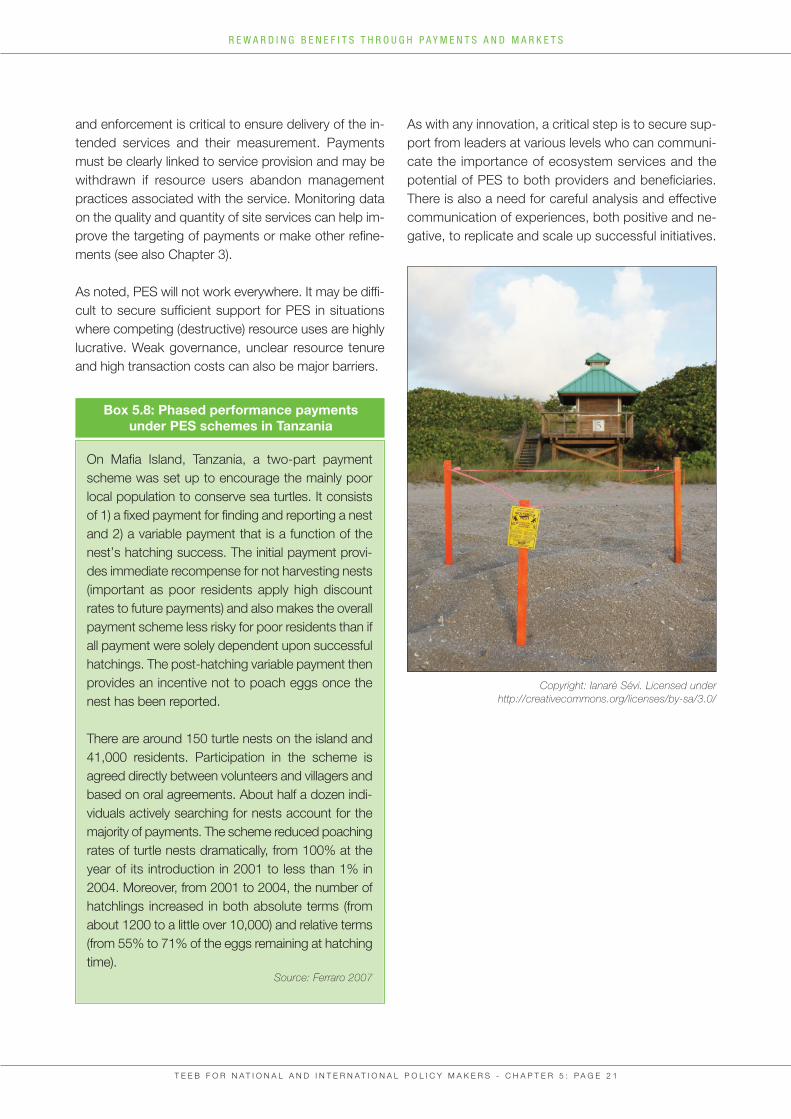
Copyright: Ianaré Sévi. Licensed underhttp://creativecommons.org/licenses/by-sa/3.0/
Box 5.8: Phased performance payments under PES schemes in Tanzania
On Mafia Island, Tanzania, a two-part paymentscheme was set up to encourage the mainly poorlocal population to conserve sea turtles. It consistsof 1) a fixed payment for finding and reporting a nestand 2) a variable payment that is a function of thenest’s hatching success. The initial payment provi-des immediate recompense for not harvesting nests(important as poor residents apply high discountrates to future payments) and also makes the overallpayment scheme less risky for poor residents than ifall payment were solely dependent upon successfulhatchings. The post-hatching variable payment thenprovides an incentive not to poach eggs once thenest has been reported.
There are around 150 turtle nests on the island and41,000 residents. Participation in the scheme isagreed directly between volunteers and villagers andbased on oral agreements. About half a dozen indi-viduals actively searching for nests account for themajority of payments. The scheme reduced poachingrates of turtle nests dramatically, from 100% at theyear of its introduction in 2001 to less than 1% in2004. Moreover, from 2001 to 2004, the number ofhatchlings increased in both absolute terms (fromabout 1200 to a little over 10,000) and relative terms(from 55% to 71% of the eggs remaining at hatchingtime).
Source: Ferraro 2007
T E E B F O R N A T I O N A L A N D I N T E R N A T I O N A L P O L I C Y M A K E R S - C H A P T E R 5 : P A G E 2 2
R E W A R D I N G B E N E F I T S T H R O U G H P A Y M E N T S A N D M A R K E T S
This section outlines the economic, social and environ-mental arguments in favour of international cooperationon payments for ecosystem services of global benefit(5.2.1). It focuses on the content and design optionsfor the proposed mechanism under the United NationsFramework Convention on Climate Change (UNFCCC)for Reducing Emissions from Deforestation and ForestDegradation (REDD) in developing countries, givingparticular consideration to the scope for biodiversityco-benefits alongside carbon benefits (5.2.2). Ways tomarket additional biodiversity benefits alongside REDDare considered in 5.2.3. Finally, 5.2.4 outlines emerginginitiatives for International Payments for EcosystemServices (IPES) specifically focused on biodiversity-related global ecosystem services.
5.2.1 THE RATIONALE FOR INTERNATIONAL ENGAGEMENT
Global biodiversity benefits – including carbon storage,genetic information for bio-industry and pharmaceuti-cals, international hydrological services, wildlife andlandscape beauty - need to be recognised, and costsand benefits fairly shared if we are to halt their degra-dation. Commitment to IPES can help secure re-wards for such benefits. Without this, the decisionfacing many land owners, as well as local and nationalgovernments, will remain tilted against conservationand opportunities to contribute to conserving or main-taining their international public good values will bemissed.
Several instruments can be broadly classified as a formof IPES (OECD 2009), including bioprospecting, con-servation concessions, biodiversity offsets and interna-tional grants. International markets for ‘greener’products and services are also key mechanisms toconserve natural capital but arguably fall outside IPES(see Sections 5.5 and 5.6).
INTERNATIONAL PES: REDD AND BEYOND 5.2 Regional and continental PES schemes - or equivalent cooperation – can be designed to addressecological functions in large transboundary ecosys-tems, such as the Nile, Lake Victoria or the Amazon(see Box 5.9). Collaboration to identify interdependen-cies and recognise service providers and beneficiariesis likely to lead to better solutions than following natio-nal interests alone. The latter may deliver short-termgains for a few but long-term losses for all as naturalcapital erodes.
5.2.2 DESIGNING REDD WITH BIODIVERSITY CO-BENEFITS7
“If a post Kyoto climate agreement fails on avoiding tropical deforestation,
the achievement of overall climatechange goals will become virtually im-possible. The lives and livelihoods ofmillions of people will be put at risk, and the eventual economic cost of combating climate change will be
far higher than it needs to be.”Bharrat Jagdeo, President of Guyana
This section looks at a new international financial mechanism that is proposed to help internalise thecarbon-related ecosystem services provided byforests. Under the auspices of the UNFCCC, Partiesare proposing that a mechanism on Reducing Emis-sions from Deforestation and Forest Degradation(REDD) in developing countries is integrated into the post-2012 climate change regime. Given the im-portant role that forests play in climate change miti-gation and adaptation, as well as in biodiversityprovision, the section considers how biodiversity co-benefits in REDD can be maximised and how po-tentially adverse impacts on biodiversity could beavoided.
Deforestation and forest degradation accounts forabout 17% of global greenhouse gas (GHG) emissions(IPCC 2007c). Successful agreement on a REDD me-chanism could therefore significantly contribute tomeeting the UNFCCC’s ultimate objective, namely “toachieve stabilisation of greenhouse gas concentrationsin the atmosphere at a level that would prevent dange-rous anthropogenic interference with the climate sys-tem” (Article 3) (see Box 5.10).
The actual amount of deforestation/degradation thatcould be avoided – and thus the level of emissions pre-vented or new sequestration capacity gained – will de-pend inter alia on: • the baselines that are set (what area with what
carbon store and what carbon sequestration rate is being lost and at what rate?);
• the incentives behind the loss (who benefits and by how much?); and
• financial mechanisms (discussed below).
It is expected that REDD will have a substantial impacton climate change mitigation because it is estimated tobe a low-cost GHG mitigation option compared to manyother emission abatement options (see Box 5.11). Mo-reover, sustaining forests and high forest biodiversity im-proves both the carbon storage capacity of forests andtheir resilience to future shocks – such as ability to with-stand changes in climatic conditions, pollution and inva-sive alien species.
T E E B F O R N A T I O N A L A N D I N T E R N A T I O N A L P O L I C Y M A K E R S - C H A P T E R 5 : P A G E 2 3
R E W A R D I N G B E N E F I T S T H R O U G H P A Y M E N T S A N D M A R K E T S
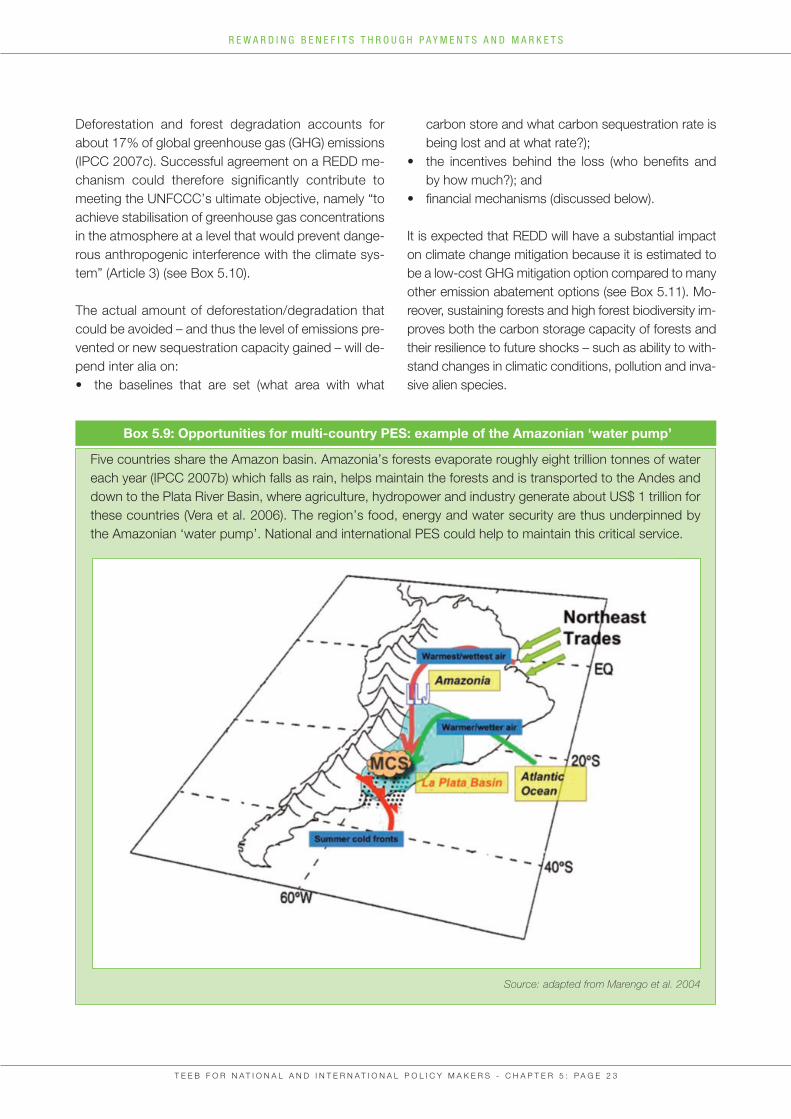
Box 5.9: Opportunities for multi-country PES: example of the Amazonian ‘water pump’
Five countries share the Amazon basin. Amazonia’s forests evaporate roughly eight trillion tonnes of watereach year (IPCC 2007b) which falls as rain, helps maintain the forests and is transported to the Andes anddown to the Plata River Basin, where agriculture, hydropower and industry generate about US$ 1 trillion forthese countries (Vera et al. 2006). The region’s food, energy and water security are thus underpinned bythe Amazonian ‘water pump’. National and international PES could help to maintain this critical service.
Source: adapted from Marengo et al. 2004
Although REDD focuses on carbon emissions, theUNFCCC’s Bali Action Plan recognises that action tosupport REDD “can promote co-benefits and may contribute to achieving the aims and objectives of otherrelevant international conventions and agreements”. A notable example of this potential for synergy con-cerns the Convention on Biological Diversity (CBD) (seeBox 5.11).
INTERNATIONAL REDD DESIGN OPTIONSAND THEIR IMPLICATIONS FOR BIODIVER-SITY
Several outstanding technical and methodological is-sues still need to be resolved through the UNFCCCprocess to ensure that any future REDD mechanism isenvironmentally effective, cost-efficient and equitable(Karousakis and Corfee-Morlot 2007; Angelsen 2008).Key REDD design elements with implications for bio-diversity are outlined below. These relate to scope, baselines/reference levels, different types of financing
T E E B F O R N A T I O N A L A N D I N T E R N A T I O N A L P O L I C Y M A K E R S - C H A P T E R 5 : P A G E 2 4
R E W A R D I N G B E N E F I T S T H R O U G H P A Y M E N T S A N D M A R K E T S
Box 5.10: The evolution of REDD-Plus under the UNFCCC
At the 11th meeting of the Conference of the Parties to the UNFCCC (COP-11, Montreal, 2005), Papua NewGuinea proposed integrating a mechanism to reduce emissions from deforestation into the post-2012 climatechange regime. The proposal received widespread support and a formal process was created to examinethe possibility of positive incentives and policy approaches for REDD.
The Bali Action Plan (Decision 2/CP.13, adopted in December 2007), mandates UNFCCC Parties to nego-tiate a post-2012 instrument that includes financial incentives for forest-based climate change mitigationactions in developing countries. Paragraph 1b(iii) of the Plan specifically calls for
“policy approaches and positive incentives on issues relating to reducing emissions from deforestation andforest degradation in developing countries; and the role of conservation, sustainable management of forestsand enhancement of forest carbon stocks in developing countries”.
At COP-14 (Poznan, 2008), the items on conservation, sustainable management of forests and enhancementof carbon stocks were highlighted as being of equal importance. This gave rise to the latest term within theREDD negotiations, namely REDD-Plus (REDD+).
COP-15 (Copenhagen, December 2009) marks the culmination of the two year process launched in Bali toagree a post-2012 regime, including REDD+. Even if an agreement is reached, the specific design elementsand implementation approaches for REDD+ will probably only be addressed after Copenhagen.
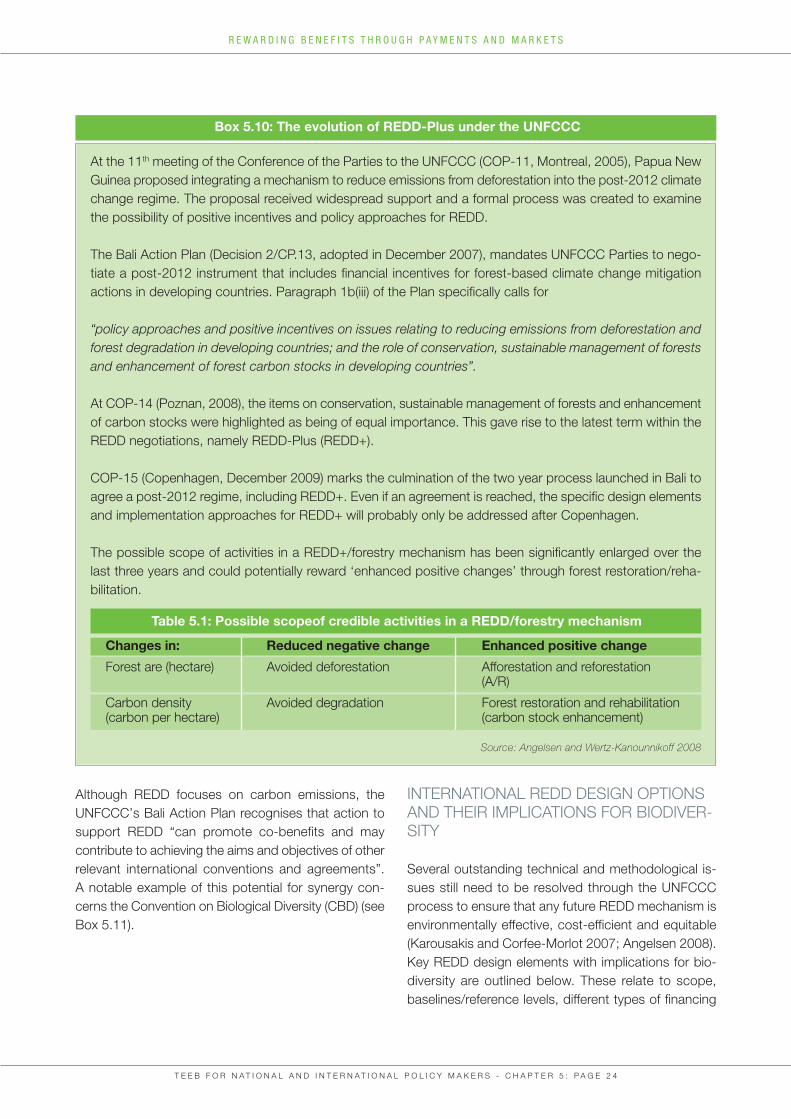
The possible scope of activities in a REDD+/forestry mechanism has been significantly enlarged over thelast three years and could potentially reward ‘enhanced positive changes’ through forest restoration/reha-bilitation.
Changes in: Reduced negative change Enhanced positive change
Forest are (hectare) Avoided deforestation Afforestation and reforestation (A/R)
Carbon density Avoided degradation Forest restoration and rehabilitation (carbon per hectare) (carbon stock enhancement)
Source: Angelsen and Wertz-Kanounnikoff 2008
Table 5.1: Possible scopeof credible activities in a REDD/forestry mechanism
mechanism, monitoring and reporting/verification methodologies (see Parker et al. 2009 for a synopsisof REDD proposals).
SCOPE OF REDD AND REDD-PLUS
A well-designed REDD mechanism that delivers real,measurable and long-term emission reductions from de-forestation and forest degradation is expected to havesignificant positive impacts on biodiversity since a de-cline in deforestation and degradation implies a declinein habitat destruction, landscape fragmentation and bio-diversity loss. At the global scale, Turner et al. (2007)examine how ecosystem services (including climate re-gulation) and biodiversity coincide and conclude that tro-pical forests offer the greatest synergy. These coverabout 7% of the world’s dry land (Lindsey 2007) yet theworld’s forests contain 80 to 90% of terrestrial biodiver-sity (FAO 2000). Targeting national REDD activities atareas combining high carbon stocks and high biodiver-sity can potentially maximise co-benefits (see Figure 5.8on Panama below)8.
A REDD-Plus mechanism could have additionalpositive impacts on biodiversity if achievedthrough appropriate restoration of degraded forestecosystems and landscapes. Afforestation and refo-
restation (A/R)9 activities can provide incentives to rege-nerate forests in deforested areas and increase con-nectivity between forest habitats. However, there is aneed for safeguards to avoid potential negative effects.A/R activities under a future REDD mechanism that re-sulted in monoculture plantations could have adverseimpacts on biodiversity: firstly, there are lower levels ofbiodiversity in monoculture plantations compared tomost natural forest and secondly, the use of alien spe-cies could have additional negative impacts. Conversely,planting mixed native species in appropriate locationscould yield multiple benefits for biodiversity. Plantationscan also reduce pressures on natural forests for the sup-ply of fuel and fibre.
NATIONAL AND SUB-NATIONAL BASELINES/REFERENCE LEVELS
Baselines provide a reference point against which toassess changes in emissions. Various proposals havebeen tabled for how these could be established forREDD at national, sub-national10 and project levels.The accounting level selected has implications for ‘car-bon leakage’ i.e. displacement of anthropogenicemissions from GHG sources to outside the accoun-ting boundary, with deforestation and/or forest degra-dation increasing elsewhere as a result. Such leakage
T E E B F O R N A T I O N A L A N D I N T E R N A T I O N A L P O L I C Y M A K E R S - C H A P T E R 5 : P A G E 2 5
R E W A R D I N G B E N E F I T S T H R O U G H P A Y M E N T S A N D M A R K E T S
Box 5.11: The costs and benefits of reducing GHG emissions from deforestation
Estimated costs of reducing emissions from deforestation vary across studies, depending on models and as-sumptions used. In comparison to GHG mitigation alternatives in other sectors, REDD is estimated to be alow-cost mitigation option (Stern 2006; IPCC 2007c).
Eliasch (2008) estimated that REDD could lead to a halving of deforestation rates by 2030, cutting emissionsby 1.5-2.7 Gt CO2/year and would require US$ 17.2 billion to US$ 33 billion/year. It estimated the long-termnet benefit of this action at US$ 3.7 trillion in present value terms (this accounts only for the benefits of reducedclimate change).
A study from the Woods Hole Research Centre estimates that 94% of Amazon deforestation could be avoidedat a cost of less than US$ 1 per tonne of carbon dioxide (Nepstad et al. 2007). Olsen and Bishop (2009) findthat REDD is competitive with most land uses in the Brazilian Amazon and many land uses in Indonesia at acarbon price of less than US$ 5 per tonne of CO2 equivalent. Kindermann et al. (2008) estimate that a 50%reduction in deforestation in 2005-2030 could provide 1.5-2.7 Gt CO2/year in emission reductions and wouldrequire US$ 17.2 billion to US$ 28 billion/year (see Wertz-Kanounnikoff 2008 for a review of cost studies).
Sources: Stern 2006; IPCC 2007a; Eliasch 2008; Nepstad et al. 2007; Kindermann et al. 2008; Wertz-Kanounnikoff 2008
could have adverse consequences for biodiversity ifdeforestation/degradation were displaced from an areawith low biodiversity value to one with higher value. Ingeneral, national level emissions accounting is betterable to account for international leakage than sub-na-tional and/or project level accounting11.
Another important question about REDD relates to‘additionality’ i.e. achieving emission reductionsthat are additional to what would have occurredunder the business-as-usual scenario and howprotected areas (PAs) are treated within this context.Some high carbon/high biodiversity ecosystems maybe located in legally-defined PAs, giving the impres-sion that the carbon they store is safe and that theywould not offer additional sequestration benefits.While this is true for well-managed PAs, many sitesremain vulnerable to degradation through encroach-ment, poaching and other illegal activities (Levering-ton et al. 2008). This reflects inter alia the significantfinancing gap that exists for many PAs across theworld (see Chapter 8).
Ensuring carbon additionality will depend on whetherand how REDD finance is extended to PAs. About312 Gt of terrestrial carbon is currently stored in theexisting PA network: if lost to the atmosphere, thiswould be equivalent to approximately 23 times thetotal global anthropogenic carbon emissions for 2004(Kapos et al. 2008). Targeting REDD funding at PAsat risk of degradation/deforestation or which have po-tential for improved ecological status – rather than at‘safe’ PAs – could yield both high carbon and biodi-versity benefits.
GROSS VS NET DEFORESTATION RATES
Another issue under negotiation is whether gross or net deforestation rates will be considered when esti-mating emission reductions12. From a climate per-spective, the most relevant figure is what theatmosphere actually experiences (the rationale for usingnet values). However, the use of net rates could hidethe loss of mature (i.e. primary and modified natural)forests and their replacement with areas of new forest,either in situ or elsewhere. This could result in significantlosses in biodiversity (sCBD 2008).
REDD FINANCING
There are three prevailing positions on how REDD financing could be generated13. These have differentimplications for how biodiversity co-benefits could bepromoted and which stakeholders would be involvedin decision-making processes.
Market-based approaches: If REDD were financedvia the regulated international carbon market, creditswould need to be fungible (interchangeable) with exis-ting Assigned Amount Units (AAUs) under the Kyotomarket14. The unit of exchange would be tonnes of carbon equivalents (tCO2e). Demand for credits wouldbe generated by the carbon market which would driveinvestment towards the least-cost mitigation options(subject to any restrictions that governments mightplace on market access for REDD credits). Given theirability to engage the private sector, market-based approaches to REDD are likely to mobilise higher levelsof sustainable and long-term financing, leading to larger areas of conserved forests and larger biodiversityco-benefits.
Fund-based approaches: Another approach is tomobilise REDD finance via inter alia voluntary contri-butions (ODA), auctioning assigned amount units(AAUs) in the carbon market and earmarking (part of)these revenues or revenues from other fees, fines andtaxes. In general, fund-based approaches can be de-signed to disburse REDD finance based on any ob-jectives and criteria established by donor (and host)countries. Whereas carbon market financing is tied to delivering emission reductions, fund-based ap-proaches could be used not only to finance such re-ductions but also to support capacity-building needsin developing countries to make REDD operational.They may also target biodiversity co-benefits or be designed to target biodiversity benefits directly.However, the way in which funds are generated mayhave implications for how they are disbursed (see Ka-rousakis 2009). In general, fund-based approachesare likely to deliver lower volumes of REDD financeover the long-run.
Phased approaches: More recently, a phased approach to REDD finance has been proposed thatcombines market and fund-based approaches. The
T E E B F O R N A T I O N A L A N D I N T E R N A T I O N A L P O L I C Y M A K E R S - C H A P T E R 5 : P A G E 2 6
R E W A R D I N G B E N E F I T S T H R O U G H P A Y M E N T S A N D M A R K E T S
Meridian Institute (2009) suggests three phases entai-ling:• voluntary funding for national REDD strategy
development and capacity building;• implementation of policies and measures proposed
in national REDD strategies, supported by an internationally-binding financial instrument funded by e.g. auctioning AAUs; and
• payment for performance on the basis of quantified forest emission reductions measured against agreed reference levels. This could be financed on a large scale by the sale of REDD units within global carbon markets or by a non-market mechanism.
Pending agreement on a REDD-Plus mechanism, a gro-wing number of international contributions and funds
T E E B F O R N A T I O N A L A N D I N T E R N A T I O N A L P O L I C Y M A K E R S - C H A P T E R 5 : P A G E 2 7
R E W A R D I N G B E N E F I T S T H R O U G H P A Y M E N T S A N D M A R K E T S
Box 5.12: Funding initiatives to address deforestation
National donor activities• the Norway Forest Fund, which has committed US$ 2.8 billion over five years from 2008;• the Japanese Government’s Cool Earth Partnership designed to support adaptation to climate
change and access to clean energy, which includes forest measures; US$ 2 billion per year from a US$ 10 billion fund is allocated for adaptation measures;
• the Australian Deforestation Fund, aimed at reducing deforestation in the Southeast Asia region, with funds of AUS$ 200 million; and
• the German commitment of 500 million EUR/year for biodiversity.Source: adapted from The Prince’s Rainforests Project, http://www.rainforestsos.org/ and
http://www.mofa.go.jp/policy/economy/wef/2008/mechanism.html
Beneficiaries• the Congo Basin Fund, supported by Norway and the UK, with funding of US$ 195 million;• Brazil’s Fund for the protection of the Amazon rainforest has received a commitment for
an initial US$ 130 million from Norway (drawn from the Norwegian Forest Fund).Source: adapted from The Prince’s Rainforests Project, http://www.rainforestsos.org/
Emergency fundingThe Prince's Rainforests Project has proposed an emergency global fund to protect rainforests, financed bya public-private partnership in developed countries which could include issuing Rainforest Bonds. The aimis to raise around £ 10 billion per year. An international working group was formed in April 2009 with G20support to study a range of proposals.
Source: http://www.rainforestsos.org/pages/emergency-package/
Reforestation registered under the UNFCCC Clean Development Mechanism (CDM)Eight forestry projects have been registered under the CDM. The first African project registered is the NileBasin Reforestation Project, undertaken by Uganda’s National Forestry Authority in association with localcommunity organisations. The project in the Rwoho Central Forest Reserve will generate up to 700 localjobs and receive revenues from the World Bank BioCarbon Fund for planting pine and mixed native tree spe-cies on degraded grasslands. It is designed to deliver co-benefits for livelihoods, greater climate resilienceand biodiversity (through reduced pressure on the country’s remaining native forests).
Source: World Bank Press Release No:2010/093/AFR.http://beta.worldbank.org/climatechange/news/uganda-registers-first-forestry-project-africa-reduce-global-warming-emissions
have already been set up to help address deforestation.Sponsors include the World Bank, Norway, Japan, Ger-many, the United Kingdom, Australia, the EuropeanCommission, Brazil and Guyana (see Box 5.12).
MAXIMISING BIODIVERSITY CO-BENEFITSOF REDD AT NATIONAL AND LOCAL LEVEL
As noted, biodiversity co-benefits can be maximised ifREDD activities are implemented in areas of high carbonand high biodiversity benefits. Identifying suitable areasrequires tools to assess where these benefits occur geo-graphically and are spatially correlated. By mappingwhere these benefits overlap, governments and/or private-sector investors can capture two environmental
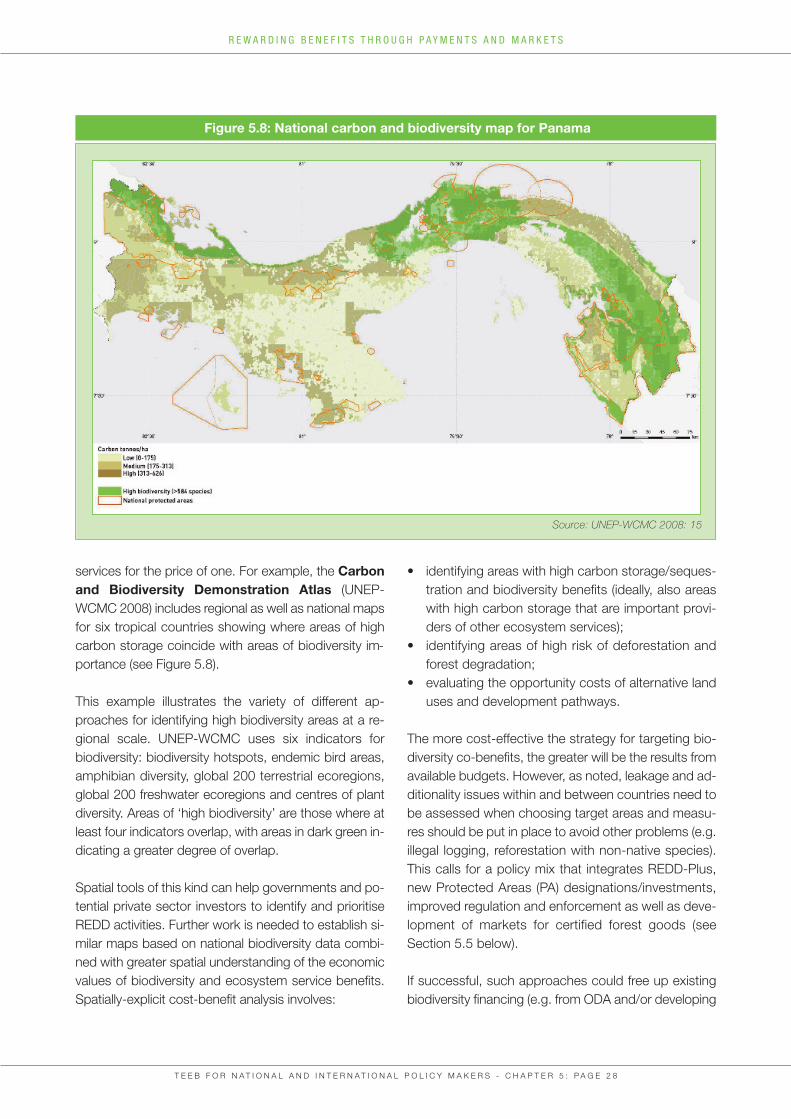
services for the price of one. For example, the Carbonand Biodiversity Demonstration Atlas (UNEP-WCMC 2008) includes regional as well as national mapsfor six tropical countries showing where areas of highcarbon storage coincide with areas of biodiversity im-portance (see Figure 5.8).
This example illustrates the variety of different ap-proaches for identifying high biodiversity areas at a re-gional scale. UNEP-WCMC uses six indicators forbiodiversity: biodiversity hotspots, endemic bird areas,amphibian diversity, global 200 terrestrial ecoregions,global 200 freshwater ecoregions and centres of plantdiversity. Areas of ‘high biodiversity’ are those where atleast four indicators overlap, with areas in dark green in-dicating a greater degree of overlap.
Spatial tools of this kind can help governments and po-tential private sector investors to identify and prioritiseREDD activities. Further work is needed to establish si-milar maps based on national biodiversity data combi-ned with greater spatial understanding of the economicvalues of biodiversity and ecosystem service benefits.Spatially-explicit cost-benefit analysis involves:
• identifying areas with high carbon storage/seques-tration and biodiversity benefits (ideally, also areas with high carbon storage that are important provi-ders of other ecosystem services);
• identifying areas of high risk of deforestation and forest degradation;
• evaluating the opportunity costs of alternative land uses and development pathways.
The more cost-effective the strategy for targeting bio-diversity co-benefits, the greater will be the results fromavailable budgets. However, as noted, leakage and ad-ditionality issues within and between countries need tobe assessed when choosing target areas and measu-res should be put in place to avoid other problems (e.g.illegal logging, reforestation with non-native species).This calls for a policy mix that integrates REDD-Plus,new Protected Areas (PA) designations/investments,improved regulation and enforcement as well as deve-lopment of markets for certified forest goods (seeSection 5.5 below).
If successful, such approaches could free up existingbiodiversity financing (e.g. from ODA and/or developing
T E E B F O R N A T I O N A L A N D I N T E R N A T I O N A L P O L I C Y M A K E R S - C H A P T E R 5 : P A G E 2 8
R E W A R D I N G B E N E F I T S T H R O U G H P A Y M E N T S A N D M A R K E T S
Figure 5.8: National carbon and biodiversity map for Panama
Source: UNEP-WCMC 2008: 15
T E E B F O R N A T I O N A L A N D I N T E R N A T I O N A L P O L I C Y M A K E R S - C H A P T E R 5 : P A G E 2 9
R E W A R D I N G B E N E F I T S T H R O U G H P A Y M E N T S A N D M A R K E T S
country government budgets) currently invested in highcarbon/high biodiversity areas. These sums could thenbe re-directed to target biodiversity conservation inhigh biodiversity/low carbon areas, delivering additionalbenefits.
5.2.3 MARKETING BIODIVERSITY BENEFITS ALONGSIDE REDD
It is possible to go beyond capturing biodiversity co-benefits through REDD to create biodiversity-specificincentives. REDD payments could in theory be layeredwith payments for other forest-related ecosystem ser-vices or for biodiversity benefits directly (see Figure5.6). Measures to address leakage and ensure addi-tionality, discussed above, should also be applied tosuch initiatives.
The UNFCCC Bali Action Plan called for REDD de-monstration activities to obtain practical experienceand share lessons learnt. Such activities are in theearly stages of design and implementation but caneventually contribute to good practice guidance for afuture REDD mechanism15. They provide policy ma-kers with an important opportunity to promote ap-proaches that maximise biodiversity co-benefits inREDD as well as associated monitoring, reporting andverification processes to assess biodiversity perfor-mance over time.
REDD demonstration activities and voluntary agree-ments that can support REDD are already underway.They provide preliminary insights and emphasise theneed to provide alternative livelihoods to communitiesthat depend on forests, improve governance and cla-rify land tenure (see Box 5.13).
Current initiatives that are considering biodiversity inREDD activities include the World Bank Forest CarbonPartnership Facility (FCPF) which has incorporatedbiodiversity considerations in its REDD ReadinessFund. REDD country participants are required to sub-mit a Readiness Preparation Proposals (R-PPs, for-merly named ‘R-Plan’) that includes measures todeliver and monitor multiple benefits as part of nationalREDD strategies, including but not limited to biodiver-sity, poverty reduction and benefit sharing.
The UN-REDD Programme also supports multiple be-nefits through e.g. consultations with pilot countries;spatial analyses of the relationship between carbonstorage, biodiversity and ecosystem services in forests;and the development of tools to assist decision-ma-kers in promoting synergies, addressing conflicts andmanaging trade-offs.
Finally, in the voluntary carbon market, several initiatives already bundle carbon and biodiversity benefits. These take the form of voluntary premiumsfor REDD credits that provide additional biodiversitybenefits16 and include the Climate, Community andBiodiversity Alliance (CCBA), Plan Vivo, CarbonFix,Social Carbon and the California Climate Action Re-gistry (see Karousakis 2009 for further information).For example, the CCBA has established voluntarystandards for forestry projects, including REDD de-monstration activities. The criteria relevant to biodiver-sity are: 1) net positive biodiversity impacts; 2) offsitebiodiversity impacts; and 3) biodiversity impact moni-toring. Projects are audited by independent third partycertifiers and each project is subject to a 21 day publiccomment period.
5.2.4 DIRECT INTERNATIONAL PAYMENTS FOR GLOBAL ECOSYSTEM SERVICES
“The conservation of many ecosystemssuffers from the fact that the costs ofpreservation are borne locally, but itsbenefits are often enjoyed globally”
“A mechanism needs to be devised tocompensate societies that preserve the
global commons.”UNEP Global Green New Deal policy brief, March 2009
“Cui bono?” (Whose benefit?)L. Cassius Longinus Ravilla, Roman censor
This section provides an overview of emerging me-chanisms that specifically address biodiversity as aglobal public good and create incentives for the pre-servation of global ecosystem services.
T E E B F O R N A T I O N A L A N D I N T E R N A T I O N A L P O L I C Y M A K E R S - C H A P T E R 5 : P A G E 3 0
R E W A R D I N G B E N E F I T S T H R O U G H P A Y M E N T S A N D M A R K E T S
Box 5.13: Example of a multiple-benefits REDD project in Madagascar
Background: Less than 15% of Madagascar’s land area remains forested, having lost about half of its forestcover since 1953 with much regional variation (Hanski et al. 2007); for instance, most of the coastal lowlandforests have been cleared. Recently, unprotected natural forest was lost at a rate of 0.65% annually in theperiod 2000-2005 (MEFT; USAID and CI 2009). The Ankeniheny-Mantadia-Zahamena corridor project ineast-central Madagascar is designed to protect some of the last remaining low and mid-elevation primaryrainforest.
Project design and goals: The project targets the delivery of multiple benefits for biodiversity, human live-lihoods and climate change mitigation. It is structured to take advantage of carbon financing from the emer-ging voluntary and compliance markets through the sale of emissions reductions from REDD. Endorsed bythe government in 2004 and developed with NGO support led by Conservation International (CI), the projectprovides for the creation of a new protected area. Its objectives combine protection against deforestationwith reforestation of targeted sites to restore habitat connectivity, enhancing local resource managementcapacity (approximately 315,000 people live in 30 surrounding communes) and endemic species conser-vation.
Project governance and funding: The Environment Ministry acts as project manager, protected area ad-ministrator and ‘vendor’ of the carbon offsets created through REDD and reforestation activities. Communitiesand NGOs are organised into Local Management Units, federated within sectors, and ultimately report tothe Ministry. CI and the World Bank’s BioCarbon Fund (BioCF) provide the technical expertise and financialsupport to access carbon finance mechanisms, including future application of REDD carbon accounting methodology and monitoring emissions reductions.
Because carbon finance is rarely able to cover high start-up and transaction costs in forest carbon projects,the project combined carbon-credit purchase commitments and project support from the BioCF with targetedbiodiversity investments from CI and the government and community development funding through USAIDand the World Bank.
Source: personal communication Olaf Zerbock and James McKinnon, Conservation International
BIODIVERSITY AS A GLOBAL PUBLIC GOOD
As underlined throughout this report, biodiversity andecosystem services provide critical inputs to local andnational societies in terms of production, cultural values and recreational amenity. However, biodiversityis also a global public goodwhich merits internationalcooperation and support for its conservation, restorationand management in its own right.
The supply of public goods usually falls to govern-ment as such goods are by definition non-excludableand non-rival: this makes it hard for business or indi-viduals to profit from producing them. Recognisingbiodiversity as a global public good implies that go-vernments have a role to ensure its international pro-
vision, either by creating conditions for organisations,businesses and individuals to undertake larger-scaleand more effective conservation or by taking on thistask themselves.
There are good reasons for governments to investin natural capital and ecosystem services beyondtheir national borders or to devise internationalpayments for ecosystem services (see also Chap-ters 9 and 8):• global benefits derive from biodiversity and
from local, regional and international ecosystem ser-vices, notably non-use values. These need to be made explicit and reflected in government policies;
• efforts to reduce biodiversity loss will require particular efforts from biodiversity-rich developing
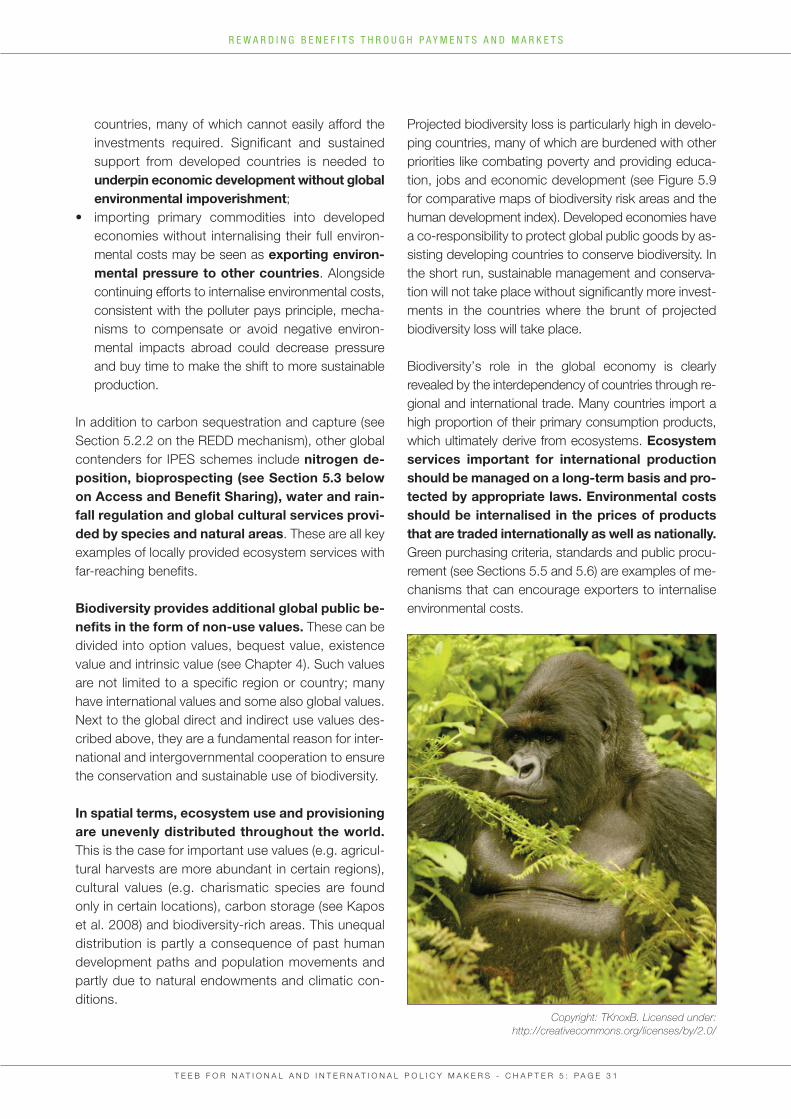
countries, many of which cannot easily afford the investments required. Significant and sustained support from developed countries is needed to underpin economic development without global environmental impoverishment;
• importing primary commodities into developed economies without internalising their full environ-mental costs may be seen as exporting environ-mental pressure to other countries. Alongside continuing efforts to internalise environmental costs, consistent with the polluter pays principle, mecha-nisms to compensate or avoid negative environ-mental impacts abroad could decrease pressure and buy time to make the shift to more sustainable production.
In addition to carbon sequestration and capture (seeSection 5.2.2 on the REDD mechanism), other globalcontenders for IPES schemes include nitrogen de-position, bioprospecting (see Section 5.3 belowon Access and Benefit Sharing), water and rain-fall regulation and global cultural services provi-ded by species and natural areas. These are all keyexamples of locally provided ecosystem services withfar-reaching benefits.
Biodiversity provides additional global public be-nefits in the form of non-use values. These can bedivided into option values, bequest value, existencevalue and intrinsic value (see Chapter 4). Such valuesare not limited to a specific region or country; manyhave international values and some also global values.Next to the global direct and indirect use values des-cribed above, they are a fundamental reason for inter-national and intergovernmental cooperation to ensurethe conservation and sustainable use of biodiversity.
In spatial terms, ecosystem use and provisioningare unevenly distributed throughout the world.This is the case for important use values (e.g. agricul-tural harvests are more abundant in certain regions),cultural values (e.g. charismatic species are foundonly in certain locations), carbon storage (see Kaposet al. 2008) and biodiversity-rich areas. This unequaldistribution is partly a consequence of past humandevelopment paths and population movements andpartly due to natural endowments and climatic con-ditions.
Projected biodiversity loss is particularly high in develo-ping countries, many of which are burdened with otherpriorities like combating poverty and providing educa-tion, jobs and economic development (see Figure 5.9for comparative maps of biodiversity risk areas and thehuman development index). Developed economies havea co-responsibility to protect global public goods by as-sisting developing countries to conserve biodiversity. Inthe short run, sustainable management and conserva-tion will not take place without significantly more invest-ments in the countries where the brunt of projectedbiodiversity loss will take place.
Biodiversity’s role in the global economy is clearly revealed by the interdependency of countries through re-gional and international trade. Many countries import ahigh proportion of their primary consumption products,which ultimately derive from ecosystems. Ecosystemservices important for international productionshould be managed on a long-term basis and pro-tected by appropriate laws. Environmental costsshould be internalised in the prices of productsthat are traded internationally as well as nationally.Green purchasing criteria, standards and public procu-rement (see Sections 5.5 and 5.6) are examples of me-chanisms that can encourage exporters to internaliseenvironmental costs.
T E E B F O R N A T I O N A L A N D I N T E R N A T I O N A L P O L I C Y M A K E R S - C H A P T E R 5 : P A G E 3 1
R E W A R D I N G B E N E F I T S T H R O U G H P A Y M E N T S A N D M A R K E T S
Copyright: TKnoxB. Licensed under: http://creativecommons.org/licenses/by/2.0/
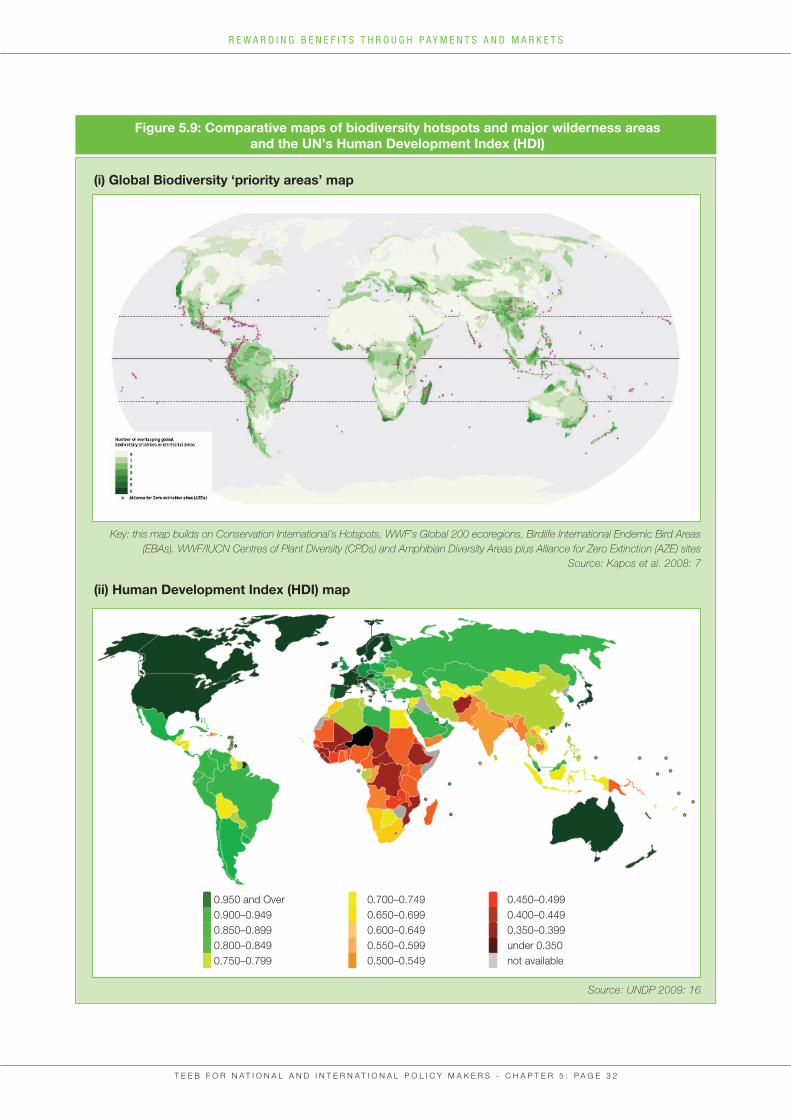
T E E B F O R N A T I O N A L A N D I N T E R N A T I O N A L P O L I C Y M A K E R S - C H A P T E R 5 : P A G E 3 2
R E W A R D I N G B E N E F I T S T H R O U G H P A Y M E N T S A N D M A R K E T S
Figure 5.9: Comparative maps of biodiversity hotspots and major wilderness areas and the UN’s Human Development Index (HDI)
Key: this map builds on Conservation International’s Hotspots, WWF’s Global 200 ecoregions, Birdlife International Endemic Bird Areas(EBAs), WWF/IUCN Centres of Plant Diversity (CPDs) and Amphibian Diversity Areas plus Alliance for Zero Extinction (AZE) sites
Source: Kapos et al. 2008: 7
(i) Global Biodiversity ‘priority areas’ map
(ii) Human Development Index (HDI) map
0.950 and Over 0.900–0.949 0.850–0.8990.800–0.849 0.750–0.799
0.700–0.749 0.650–0.699 0.600–0.649 0.550–0.599 0.500–0.549
0.450–0.499 0.400–0.4490.350–0.399under 0.350not available
Source: UNDP 2009: 16
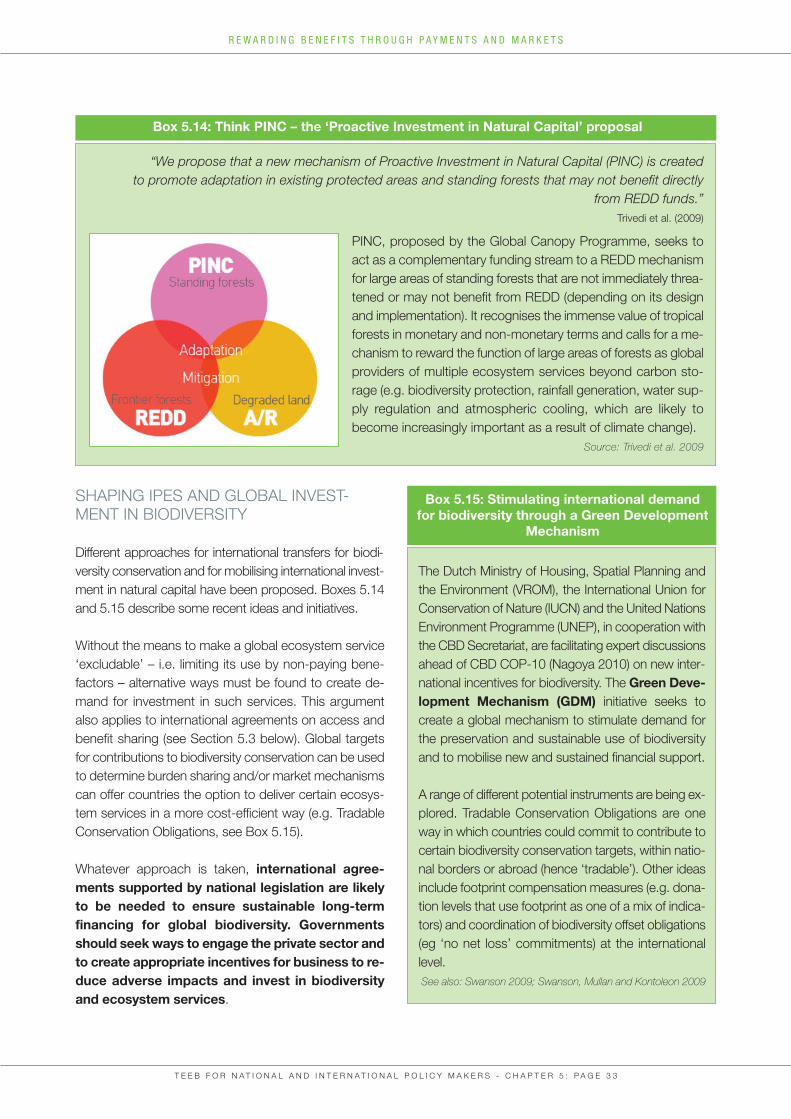
T E E B F O R N A T I O N A L A N D I N T E R N A T I O N A L P O L I C Y M A K E R S - C H A P T E R 5 : P A G E 3 3
R E W A R D I N G B E N E F I T S T H R O U G H P A Y M E N T S A N D M A R K E T S
Box 5.14: Think PINC – the ‘Proactive Investment in Natural Capital’ proposal
“We propose that a new mechanism of Proactive Investment in Natural Capital (PINC) is created to promote adaptation in existing protected areas and standing forests that may not benefit directly
from REDD funds.” Trivedi et al. (2009)
PINC, proposed by the Global Canopy Programme, seeks toact as a complementary funding stream to a REDD mechanismfor large areas of standing forests that are not immediately threa-tened or may not benefit from REDD (depending on its designand implementation). It recognises the immense value of tropicalforests in monetary and non-monetary terms and calls for a me-chanism to reward the function of large areas of forests as globalproviders of multiple ecosystem services beyond carbon sto-rage (e.g. biodiversity protection, rainfall generation, water sup-ply regulation and atmospheric cooling, which are likely tobecome increasingly important as a result of climate change).
Source: Trivedi et al. 2009
SHAPING IPES AND GLOBAL INVEST-MENT IN BIODIVERSITY
Different approaches for international transfers for biodi-versity conservation and for mobilising international invest-ment in natural capital have been proposed. Boxes 5.14and 5.15 describe some recent ideas and initiatives.
Without the means to make a global ecosystem service‘excludable’ – i.e. limiting its use by non-paying bene-factors – alternative ways must be found to create de-mand for investment in such services. This argumentalso applies to international agreements on access andbenefit sharing (see Section 5.3 below). Global targetsfor contributions to biodiversity conservation can be usedto determine burden sharing and/or market mechanismscan offer countries the option to deliver certain ecosys-tem services in a more cost-efficient way (e.g. TradableConservation Obligations, see Box 5.15).
Whatever approach is taken, international agree-ments supported by national legislation are likelyto be needed to ensure sustainable long-term financing for global biodiversity. Governmentsshould seek ways to engage the private sector andto create appropriate incentives for business to re-duce adverse impacts and invest in biodiversityand ecosystem services.
Box 5.15: Stimulating international demand for biodiversity through a Green Development
Mechanism
The Dutch Ministry of Housing, Spatial Planning andthe Environment (VROM), the International Union forConservation of Nature (IUCN) and the United NationsEnvironment Programme (UNEP), in cooperation withthe CBD Secretariat, are facilitating expert discussionsahead of CBD COP-10 (Nagoya 2010) on new inter-national incentives for biodiversity. The Green Deve-lopment Mechanism (GDM) initiative seeks tocreate a global mechanism to stimulate demand forthe preservation and sustainable use of biodiversityand to mobilise new and sustained financial support.
A range of different potential instruments are being ex-plored. Tradable Conservation Obligations are oneway in which countries could commit to contribute tocertain biodiversity conservation targets, within natio-nal borders or abroad (hence ‘tradable’). Other ideasinclude footprint compensation measures (e.g. dona-tion levels that use footprint as one of a mix of indica-tors) and coordination of biodiversity offset obligations(eg ‘no net loss’ commitments) at the internationallevel.See also: Swanson 2009; Swanson, Mullan and Kontoleon 2009
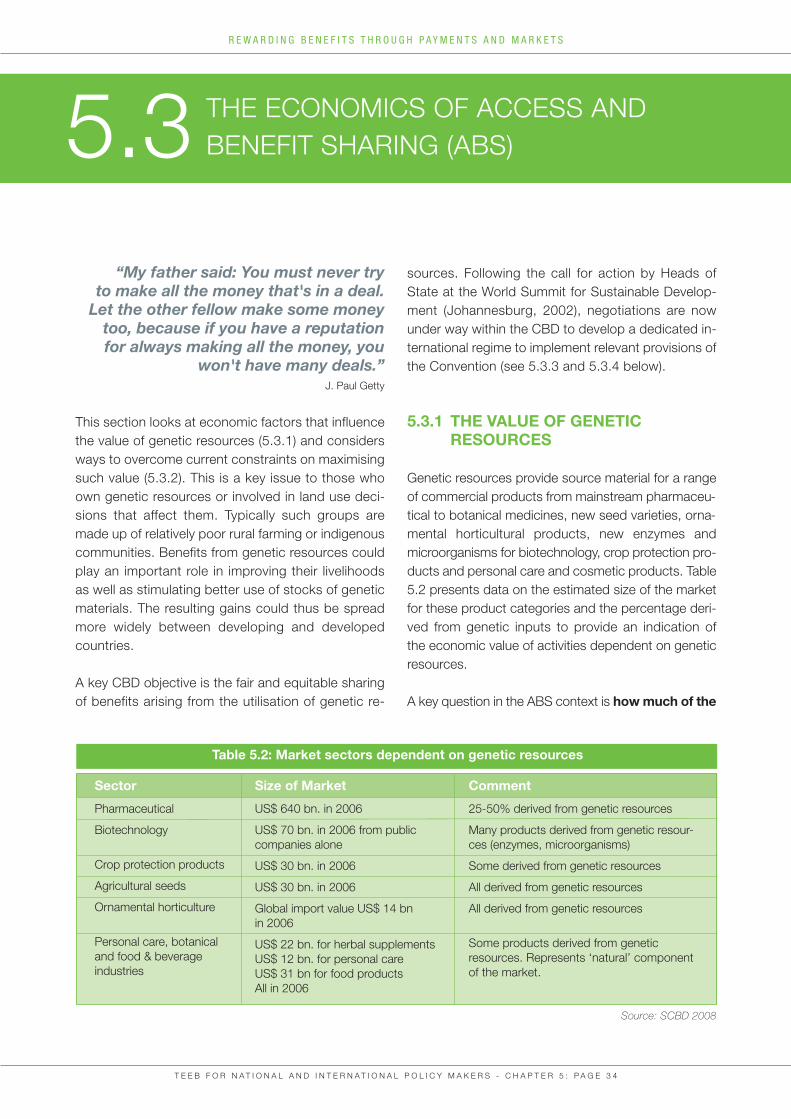
T E E B F O R N A T I O N A L A N D I N T E R N A T I O N A L P O L I C Y M A K E R S - C H A P T E R 5 : P A G E 3 4
R E W A R D I N G B E N E F I T S T H R O U G H P A Y M E N T S A N D M A R K E T S
“My father said: You must never try to make all the money that's in a deal.Let the other fellow make some moneytoo, because if you have a reputation for always making all the money, you
won't have many deals.”J. Paul Getty
This section looks at economic factors that influencethe value of genetic resources (5.3.1) and considersways to overcome current constraints on maximisingsuch value (5.3.2). This is a key issue to those whoown genetic resources or involved in land use deci-sions that affect them. Typically such groups aremade up of relatively poor rural farming or indigenouscommunities. Benefits from genetic resources couldplay an important role in improving their livelihoodsas well as stimulating better use of stocks of geneticmaterials. The resulting gains could thus be spreadmore widely between developing and developedcountries.
A key CBD objective is the fair and equitable sharingof benefits arising from the utilisation of genetic re-
THE ECONOMICS OF ACCESS AND BENEFIT SHARING (ABS)5.3
sources. Following the call for action by Heads ofState at the World Summit for Sustainable Develop-ment (Johannesburg, 2002), negotiations are nowunder way within the CBD to develop a dedicated in-ternational regime to implement relevant provisions ofthe Convention (see 5.3.3 and 5.3.4 below).
5.3.1 THE VALUE OF GENETIC RESOURCES
Genetic resources provide source material for a rangeof commercial products from mainstream pharmaceu-tical to botanical medicines, new seed varieties, orna-mental horticultural products, new enzymes andmicroorganisms for biotechnology, crop protection pro-ducts and personal care and cosmetic products. Table5.2 presents data on the estimated size of the marketfor these product categories and the percentage deri-ved from genetic inputs to provide an indication of the economic value of activities dependent on geneticresources.
A key question in the ABS context is how much of the
Table 5.2: Market sectors dependent on genetic resources
Sector
Pharmaceutical
Biotechnology
Crop protection products
Agricultural seeds
Ornamental horticulture
Personal care, botanical and food & beverage industries
Size of Market
US$ 640 bn. in 2006
US$ 70 bn. in 2006 from publiccompanies alone
US$ 30 bn. in 2006
US$ 30 bn. in 2006
Global import value US$ 14 bn in 2006
US$ 22 bn. for herbal supplementsUS$ 12 bn. for personal careUS$ 31 bn for food productsAll in 2006
Comment
25-50% derived from genetic resources
Many products derived from genetic resour-ces (enzymes, microorganisms)
Some derived from genetic resources
All derived from genetic resources
All derived from genetic resources
Some products derived from genetic resources. Represents ‘natural’ componentof the market.
Source: SCBD 2008
value of final products is attributable to geneticmaterial and how much to other factors of pro-duction (labour, capital, local knowledge et al.)?To answer this, we need to distinguish between:
• what a producer of drugs or other products has to pay to obtain the genetic material; and
• what the material is worth to the producer (i.e. the maximum that a company would pay).
The difference between this maximum paymentand the cost of obtaining the genetic material iscalled its ‘rent’. Questions asked in the literature so-metimes relate to the cost of exploitation and someti-mes to the rent. It is important not to confuse the two.The costs of obtaining genetic material are paid to relevant parties in proportion to their effort whereas therent can go to either party (i.e. the company that usesthe material or the party that provides it). This sharingneeds to be carried out in a way that is fair and equi-table (see Section 5.3.3).
The economic rent is calculated by taking the value ofthe final product and subtracting the costs of develop-ment, production and collecting and classifying the ge-netic material. These calculations are complex asresearch development is an uncertain activity: some re-turn has to be provided to compensate for the riskinessof the venture. Furthermore, since most numbers in-volved are large and the rent is the difference betweenthem, the calculations are obviously affected by evensmall errors in the numbers.
Several estimates of economic rent have been madeto date. To the dismay of those who believe that ge-netic resources are a global resource of high value,these estimates come out rather low. A key earlystudy (Simpson et al. 1996) calculated values of ge-netic resources in 1996 prices at between US$0.2/hectare (California), and US$ 20.6/hectare (Wes-tern Ecuador) and argued that these estimates couldbe on the high side. Other studies making the samepoint include Barbier and Aylward (1996) and Frinn(2003). Reasons identified for values being so low in-cluded the high cost of developing the final goodsand bringing them to market, the long time lagsinvolved and inefficiencies in the systems for exploiting genetic resources.
Subsequent studies have tried to improve on these es-timates. Craft and Simpson (2001) argued that if webase calculations not on the price of final drugs but onthe willingness to pay of those who benefit from lifesa-ving drugs, the rent could be two orders of magnitudehigher than the above estimates. However, this raisesthe question of how (and also whether) to capture hig-her use values. Massive increases in the price of drugswould exclude many poorer users and could hardly bedescribed as a fair division of the benefits of geneticresources.
There are now far more uses of genetic resources thancovered in Simpson et al. (1996) which should increasetheir net value. Finding more effective and cost-efficientways to collect information about and screen geneticmaterials can also increase the rent. Rausser and Small(2000) estimated the possible increase as equal to oneorder of magnitude higher than the estimates in Simp-son et al. (1996). Although Rausser and Small’s esti-mate has in turn been criticised (Costello and Ward2006), there is no doubt that lowering transaction costsshould increase the economic rent (see Section 5.3.2).
For developing countries, one constraint on increa-sing the value of genetic material is the growing im-portance of micro-organisms for which the tropics arenot an especially important source. However, this isnot always the case as companies collecting from na-ture continue to be interested in samples from diverseand extreme environments (sCBD 2008). The need todevelop strong partnerships with providers as a wayof monitoring development of natural product com-pounds is as strong as ever.
Current arrangements for sharing whatever rent existsare not particularly favourable to communities living inthe area where genetic resources are located. Severalagreements made in the 1990s to share the benefitsof products derived from such resources attractedconsiderable attention. Reviews of eight of the mostimportant17 showed that:
• most contained an element of royalty-sharing;• their duration varied from two to eleven years; • some required the bio-prospector to contribute
financially to biodiversity protection in the region; and
T E E B F O R N A T I O N A L A N D I N T E R N A T I O N A L P O L I C Y M A K E R S - C H A P T E R 5 : P A G E 3 5
R E W A R D I N G B E N E F I T S T H R O U G H P A Y M E N T S A N D M A R K E T S
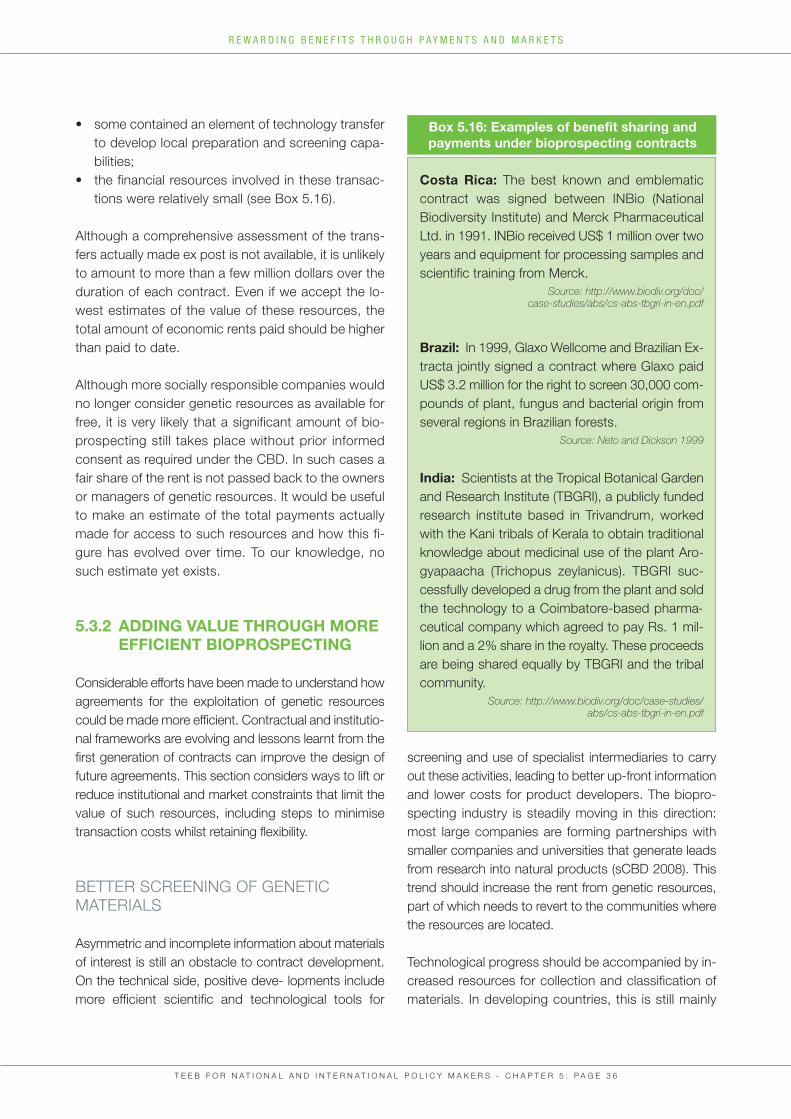
• some contained an element of technology transfer to develop local preparation and screening capa-bilities;
• the financial resources involved in these transac-tions were relatively small (see Box 5.16).
Although a comprehensive assessment of the trans-fers actually made ex post is not available, it is unlikelyto amount to more than a few million dollars over theduration of each contract. Even if we accept the lo-west estimates of the value of these resources, thetotal amount of economic rents paid should be higherthan paid to date.
Although more socially responsible companies wouldno longer consider genetic resources as available forfree, it is very likely that a significant amount of bio-prospecting still takes place without prior informedconsent as required under the CBD. In such cases afair share of the rent is not passed back to the ownersor managers of genetic resources. It would be usefulto make an estimate of the total payments actuallymade for access to such resources and how this fi-gure has evolved over time. To our knowledge, nosuch estimate yet exists.
5.3.2 ADDING VALUE THROUGH MORE EFFICIENT BIOPROSPECTING
Considerable efforts have been made to understand howagreements for the exploitation of genetic resourcescould be made more efficient. Contractual and institutio-nal frameworks are evolving and lessons learnt from thefirst generation of contracts can improve the design offuture agreements. This section considers ways to lift orreduce institutional and market constraints that limit thevalue of such resources, including steps to minimisetransaction costs whilst retaining flexibility.
BETTER SCREENING OF GENETIC MATERIALS
Asymmetric and incomplete information about materialsof interest is still an obstacle to contract development.On the technical side, positive deve- lopments includemore efficient scientific and technological tools for
screening and use of specialist intermediaries to carryout these activities, leading to better up-front informationand lower costs for product developers. The biopro-specting industry is steadily moving in this direction:most large companies are forming partnerships withsmaller companies and universities that generate leadsfrom research into natural products (sCBD 2008). Thistrend should increase the rent from genetic resources,part of which needs to revert to the communities wherethe resources are located.
Technological progress should be accompanied by in-creased resources for collection and classification ofmaterials. In developing countries, this is still mainly
T E E B F O R N A T I O N A L A N D I N T E R N A T I O N A L P O L I C Y M A K E R S - C H A P T E R 5 : P A G E 3 6
R E W A R D I N G B E N E F I T S T H R O U G H P A Y M E N T S A N D M A R K E T S
Box 5.16: Examples of benefit sharing and payments under bioprospecting contracts
Costa Rica: The best known and emblematiccontract was signed between INBio (National Biodiversity Institute) and Merck PharmaceuticalLtd. in 1991. INBio received US$ 1 million over twoyears and equipment for processing samples andscientific training from Merck.
Source: http://www.biodiv.org/doc/case-studies/abs/cs-abs-tbgri-in-en.pdf
Brazil: In 1999, Glaxo Wellcome and Brazilian Ex-tracta jointly signed a contract where Glaxo paidUS$ 3.2 million for the right to screen 30,000 com-pounds of plant, fungus and bacterial origin fromseveral regions in Brazilian forests.
Source: Neto and Dickson 1999
India: Scientists at the Tropical Botanical Gardenand Research Institute (TBGRI), a publicly fundedresearch institute based in Trivandrum, workedwith the Kani tribals of Kerala to obtain traditionalknowledge about medicinal use of the plant Aro-gyapaacha (Trichopus zeylanicus). TBGRI suc-cessfully developed a drug from the plant and soldthe technology to a Coimbatore-based pharma-ceutical company which agreed to pay Rs. 1 mil-lion and a 2% share in the royalty. These proceedsare being shared equally by TBGRI and the tribalcommunity.
Source: http://www.biodiv.org/doc/case-studies/abs/cs-abs-tbgri-in-en.pdf
carried out by relatively inefficient public sector institu-tions strapped for funds. However, such work does nothave to be carried out exclusively by public bodies. Itcould be made a fee-based service involving the pri-vate sector: creation of an intermediary market for suchservices would improve bioprospecting efficiency andincrease the net value of resources.
BETTER USE OF TRADITIONAL KNOWLEDGE
Reliance on traditional knowledge about the properties oflocal plants and other species is currently small andseems to be growing smaller. This may be partly due tothe emphasis in drug development on disease categoriesthat do not feature prominently in traditional medicine andpartly to the increasing role of micro-organisms and dimi-nished role of plants in discovery (sCBD 2008: 106). Ne-vertheless, many researchers believe that suchknowledge can help in new product development but thatthe process is hampered by the lack of appropriate me-chanisms to document and transfer it and to reward in-formation providers18.
It has been argued that recognising intellectual propertyrights (IPRs) for traditional knowledge would increase in-centives to use them to protect genetic resources. Ho-wever, establishing IPRs requires proof of novelty,discovery and innovation – which rules out their applica-tion to genetic resources.
An alternative way to address this issue is through con-tracts that require product developers to share the benefitsin proportion to the information provided and used. Cur-rently we have no mechanism for determining benefit sharein the event of a dispute. One proposal, to get round thisproblem, albeit one with obvious shortcomings, is to offertraditional knowledge owners specific rights recognised bythe courts in countries where the development of relevantmaterials takes place (Sarr and Swanson 2007).
The creation of such rights, if upheld by the competentcourts, could lead to a situation where the ‘North’ offerscontracts that the ‘South’ is likely to accept. However, thedesign and enforcement of such rights could take manyforms – from private international law alone (where the keyissue would be the content of the ABS contract) to moreforceful mechanisms to prove claims (i.e. the proposed
international certification of origin currently under consi-deration in CBD-led negotiations: see Section 5.3.4).Such certification could be voluntary or mandatory andapply not just to traditional knowledge but to genetic re-sources more widely. Reaching agreement within thisrange is still a contentious issue within the negotiations.
IMPROVING CONTRACT DESIGN
Typically, sellers (usually public institutions) supply scree-ned samples, novel compounds and research leads de-rived from their field collections. They are responsible forobtaining permission to access genetic resourcesand/or traditional knowledge, which requires them for-mally or informally to negotiate with source suppliers19
before conducting field collection. Sellers also collabo-rate with companies on development and commerciali-sation of these resources, which may entail separatecontracts or other agreements with private companies.
Buyers20 are usually engaged in industries carrying outresearch and development (R&D) into commercial ap-plications of genetic resources. Although these spanseveral sectors, the pharmaceutical industry undoub-tedly represents the largest market, invests a higherproportion of turnover in R&D than other industries andincurs higher risks in the drug discovery and develop-ment process. Pharmaceutical companies thus play acrucial steering role in driving efficiency gains in biopro-specting contracts.
The most important provisions of genetic resourcecontracts relate to:
• sharing of royalty revenues in cases where the company patents a new discovery (e.g. a medicinal drug) derived from R&D involving the genetic mate-rial sold in the contract;
• transfer of R&D technology and screening capabi-lities to local institutions and/or local capacity-building and training;
• the structure of the financial agreement: in addition to royalties and technology transfer, this includes up-front payments and milestone payments;
• possible financial contribution by the buyer to protect local biodiversity e.g. through partial transfer of the royalty revenues; and
T E E B F O R N A T I O N A L A N D I N T E R N A T I O N A L P O L I C Y M A K E R S - C H A P T E R 5 : P A G E 3 7
R E W A R D I N G B E N E F I T S T H R O U G H P A Y M E N T S A N D M A R K E T S
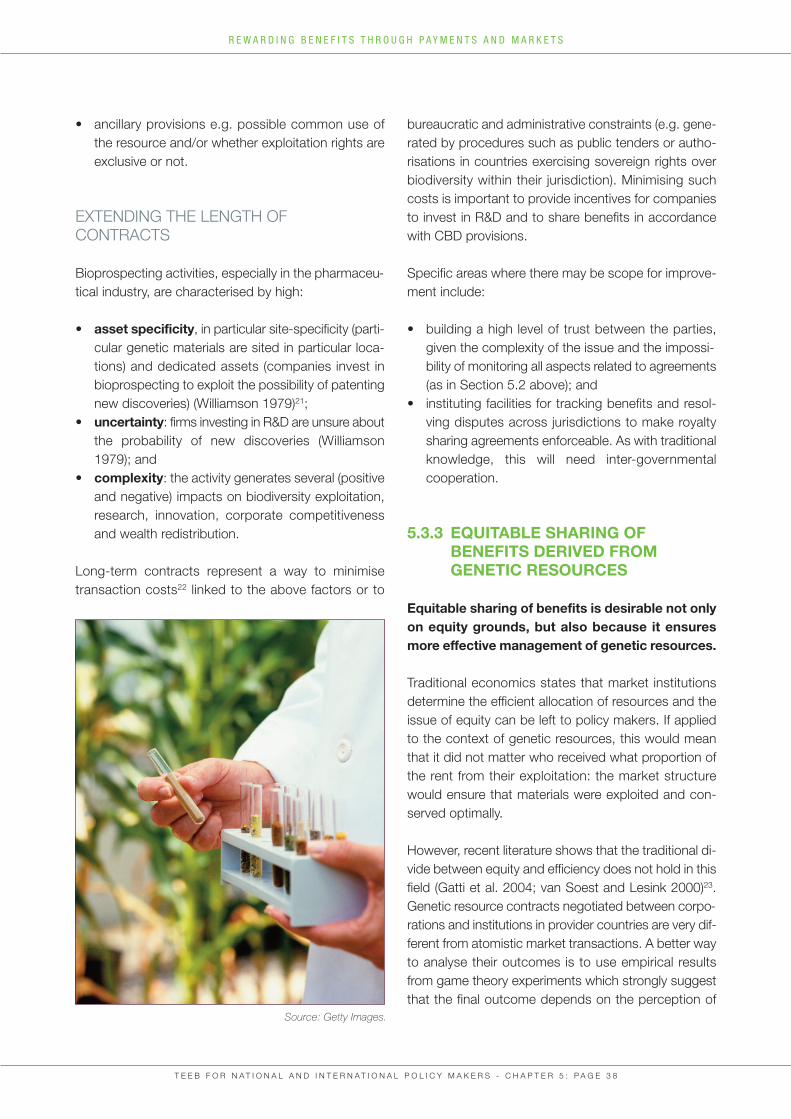
• ancillary provisions e.g. possible common use of the resource and/or whether exploitation rights are exclusive or not.
EXTENDING THE LENGTH OF CONTRACTS
Bioprospecting activities, especially in the pharmaceu-tical industry, are characterised by high:
• asset specificity, in particular site-specificity (parti-cular genetic materials are sited in particular loca-tions) and dedicated assets (companies invest in bioprospecting to exploit the possibility of patenting new discoveries) (Williamson 1979)21;
• uncertainty: firms investing in R&D are unsure about the probability of new discoveries (Williamson 1979); and
• complexity: the activity generates several (positive and negative) impacts on biodiversity exploitation, research, innovation, corporate competitiveness and wealth redistribution.
Long-term contracts represent a way to minimisetransaction costs22 linked to the above factors or to
bureaucratic and administrative constraints (e.g. gene-rated by procedures such as public tenders or autho-risations in countries exercising sovereign rights overbiodiversity within their jurisdiction). Minimising suchcosts is important to provide incentives for companiesto invest in R&D and to share benefits in accordancewith CBD provisions.
Specific areas where there may be scope for improve-ment include:
• building a high level of trust between the parties, given the complexity of the issue and the impossi-bility of monitoring all aspects related to agreements (as in Section 5.2 above); and
• instituting facilities for tracking benefits and resol-ving disputes across jurisdictions to make royalty sharing agreements enforceable. As with traditional knowledge, this will need inter-governmental cooperation.
5.3.3 EQUITABLE SHARING OF BENEFITS DERIVED FROM GENETIC RESOURCES
Equitable sharing of benefits is desirable not onlyon equity grounds, but also because it ensuresmore effective management of genetic resources.
Traditional economics states that market institutionsdetermine the efficient allocation of resources and theissue of equity can be left to policy makers. If appliedto the context of genetic resources, this would meanthat it did not matter who received what proportion ofthe rent from their exploitation: the market structurewould ensure that materials were exploited and con-served optimally.
However, recent literature shows that the traditional di-vide between equity and efficiency does not hold in thisfield (Gatti et al. 2004; van Soest and Lesink 2000)23.Genetic resource contracts negotiated between corpo-rations and institutions in provider countries are very dif-ferent from atomistic market transactions. A better wayto analyse their outcomes is to use empirical resultsfrom game theory experiments which strongly suggestthat the final outcome depends on the perception of
T E E B F O R N A T I O N A L A N D I N T E R N A T I O N A L P O L I C Y M A K E R S - C H A P T E R 5 : P A G E 3 8
R E W A R D I N G B E N E F I T S T H R O U G H P A Y M E N T S A N D M A R K E T S
Source: Getty Images.
fairness by the respective parties. People prefer nodeal to a deal they think is unfair (based on results fromultimatum games where one party offers a contract ona take-it-or-leave-it basis). They may even opt for ‘stra-tegic destruction’ when offered a bad deal (for an ap-plication to TRIPs and biodiversity, see Gatti et al.2004).
The benefits of bioprospecting should thus be sharedin such a way that rural and indigenous communitiesin developing countries (where most genetic materialof interest is located) receive a fair and equitable pro-portion of the value derived from its exploitation. Thiswill not only contribute to improved living standards forthe poor but also increase incentives to conserve re-maining biodiversity.
How can this be done? Suggestions include:
• forming a cartel to negotiate on behalf of all owners of such resources i.e. like the Organization of the Petroleum Exporting Countries (OPEC) on behalf ofglobal oil producers24. Like all cartels, this might succeed in obtaining a higher share of the rent from exploitation of genetic materials but also be unsta-ble with strong incentives to undercut the agreed price (e.g. the price of crude oil has fluctuated since 1974, when the cartel started restricting supply);
• giving providers of genetic resources and associa-ted traditional knowledge specific rights in the courts of countries where such material is develo-ped. As noted above, this is a complex area and the appropriate structure is not self-evident. Well-designed benefit-sharing contracts and/or interna-tionally recognised certificates of origin would clearly be crucial; and
• increasing the share of development undertaken in provider countries e.g. by locating some of the emerging partnerships between large corporations and smaller companies and universities in develo-ping countries and working closely with local source providers.
Finally, we need to recognise that greater transparencyand knowledge about the value derived from geneticmaterials will make it easier for all parties to reach anequitable accord. At present the rent derived from such materials is still somewhat obscure, with some
researchers claiming that overall rent is small. No-onehas really estimated how much goes to each of the par-ties. More research on what the rent is – and how itis being shared at present – should help make thecase for larger transfers to provider countries.
5.3.4 TOWARDS AN INTERNATIONAL REGIME ON ABS
Many of the activities identified above will require coor-dinated international action. From this perspective, thesuccessful conclusion of current negotiations under the CBD for an international ABS regime could makea critical contribution in the following areas:
Short to medium term:• facilitating capacity building and the transfer of
resources where necessary to improve efficiency in genetic resource management e.g. through the establishment of companies that undertake more of the intermediate work related to product deve-lopment (screening, classification, primary investi-gation of materials to discover leads);
• strengthening compliance and monitoring frame-works to ensure fair and equitable sharing of the benefits through the implementation of prior in-formed consent (PIC) and mutually agreed terms (MAT) agreements;
• ensuring that ABS agreements cover all fields of use of genetic resources (i.e. are not focused solely on pharmaceuticals).
Medium to long term:• improving knowledge generation/exchange and
dissemination of pertinent information on e.g. the accurate value of genetic resources; the rent avai-lable to be shared between resource providers and developers; analysis of the link between equitable distribution of rents and their efficient management; and so on.
T E E B F O R N A T I O N A L A N D I N T E R N A T I O N A L P O L I C Y M A K E R S - C H A P T E R 5 : P A G E 3 9
R E W A R D I N G B E N E F I T S T H R O U G H P A Y M E N T S A N D M A R K E T S
T E E B F O R N A T I O N A L A N D I N T E R N A T I O N A L P O L I C Y M A K E R S - C H A P T E R 5 : P A G E 4 0
R E W A R D I N G B E N E F I T S T H R O U G H P A Y M E N T S A N D M A R K E T S
Economic instruments have a central – indeed indis-pensable – role to play in valuing nature’s public ser-vices to society (OECD 1999; Bräuer et al. 2006;Emerton et al. 2006; EC 2007). These services canbe targeted by a range of policy instruments inclu-ding levies (5.4.1), intergovernmental fiscal transfers(5.4.2) and government spending (5.4.3) (Ring 2002).
Fiscal instruments to safeguard ecosystem ser-vices and biodiversity are part of the agenda forecological tax reform (Meyer and Schweppe-Kraft2006; Ring 2008a). Such instruments could be usedmore widely to provide incentives for conservationand to raise funds for conservation (OECD 1999;Emerton et al. 2006: 39). Such tools are also centralto social policy, including the redistribution of wealthand income – making them especially suitable forcombining biodiversity and ecosystem conser-vation with poverty reduction (OECD 2005; WorldBank 2005).
5.4.1 USING PUBLIC LEVIES TO STIMULATE CONSERVATION
As highlighted in this report, the value of biodiver-sity and many ecosystem services cannot al-ways be captured by market mechanisms alone.Economic instruments such as taxes, charges andfees – as well as targeted exemptions from these in-struments – are a crucial element of the policymaker’s toolkit and complement regulation (seeChapter 7), direct payments for services (PES, seeSection 5.1 above) and voluntary approaches fromcertification, informal codes of conduct to non-bin-ding agreements25. Economic instruments can pro-vide strong incentives for more sustainable behaviourby citizens, businesses and even governments them-selves – if they are well-designed and based on rele-vant indicators.
TAX AND COMPENSATION MECHANISMS TO REWARD STEWARDSHIP5.4
Although land, property and income taxes haveconsiderable potential to integrate and rewardecological concerns, they are rarely used for thispurpose. Tax systems can provide a number of opti-ons to reduce existing tax burdens, either throughcredits or exemptions. A tax exemption can functionlike a PES to reward positive conservation efforts: thedifference is that the PES is a direct payment for aservice whereas the exemption is effectively a non-payment (of moneys that would otherwise be due astax). Even if the financial outcome is similar, the in-strument design is different and so, often, is publicperception. Some see tax breaks as a form of ‘thanksfor efforts’ that are preferable to payments for ser-vices rendered, although in economic terms they maybe equivalent.
Tax exemptions or credits can be used to rewardlandowners who undertake biodiversity conservationor agree to forego future development in order to sa-feguard habitats (Boyd et al. 2000). Such exemptionstake many forms and are found in a range of juris-dictions (Shine 2005). Familiar examples include con-servation easements and tax incentives for landdonation for conservation (see Box 5.17).
Tax incentives are not limited to gifts of property orinterests therein. In the Netherlands, for example,savers and investors are exempt from a capital gainstax if they invest in specified green projects or capitalfunds (Box 5.18).
T E E B F O R N A T I O N A L A N D I N T E R N A T I O N A L P O L I C Y M A K E R S - C H A P T E R 5 : P A G E 4 1
R E W A R D I N G B E N E F I T S T H R O U G H P A Y M E N T S A N D M A R K E T S
5.17: Tax incentives for conservation easements and ecological gifts in North America
An easement is a legally binding restriction placed on a piece of property to protect its resources (natural or man-made) by prohibiting specified types of development from taking place on the land. It may be voluntarily sold or donated by the landowner.
United States: The US has long experience of using easements to secure long-term conservation of natural areas.They are currently used by over 1260 local and regional ‘land trusts’ or conservancies, which act as the easements'trustees. By 2000, land trusts had protected over 1 million hectares (nearly 2.6 million acres) through conservationeasements — almost 500% up on 1990. Usage of this type of instrument has continued to grow. By 2005, landtrusts held conservation easements on over 2.5 million hectares (6.2 million acres) and government agencies and national non-profit organisations also had sizable holdings under easement (Land Trust Alliance 2006).
The Nature Conservancy is the largest non-profit holder of conservation easements with 1.3 million hectares (3.2million acres). The Natural Resources Conservation Service (NRCS) funded by the U.S. Department of Agriculturehas responsibility for monitoring, managing, and conducting enforcement activities on approximately 11,000 con-servation easements covering more than 800,000 hectares (2 million acres) (Risman et al. 2007).
Easements can be purchased or donated. Donations have been a big part of the story, motivated by the ability toreduce taxes and claim charitable deductions. Progressive changes in tax codes and development of appraisaltechniques are practical developments that have encouraged their use, whilst easement contracts are fairlyroutine and straightforward to put together. Such instruments have played a role in helping people understandthe public interest in conserving biodiversity values on private property – the whole reason for easements is thatthere are public goods arising from private lands.
Part of the explanation for the popularity of easements in the US is that environmental land use regulations arerelatively weak, governed by municipalities rather than state and federal governments: private property reignssupreme, but landowners may donate or sell the public interests in their land. There may be less need for ea-sements in countries with tighter land use restrictions and highly developed rights of public access e.g. in Eu-ropean countries such as Germany or the UK.
Key questions when designing easement contracts include their duration (perennity), monitoring and enforcementin order to avoid challenges to use/development restrictions arising as properties change hands over generations.
Sources: Boyd et al. 2000; http://www.nature.org/aboutus/howwework/conservationmethods/privatelands/conservationeasements/files/consrvtn_easemnt_sngle72.pdf
Canada: The Ecogift Programme was introduced in 2001. It provides tax benefits to owners of ecologicallysensitive land if they donate it – fully or partially – to specified recipients who take responsibility for its sustai-nable management and conserving natural habitat. The list of possible recipients is strictly defined by legis-lation and includes the Federal Government, provincial or territorial governments, municipalities, municipalor public bodies performing government functions and charities approved by Environment Canada. Thedonor of the land (or the interest in the land) receives tax benefits in return:
• the total value of the ecogift from an individual donor may be used to calculate a non-refundable tax credit;• the value of the gift can be directly deducted from taxable income of a corporate donor;• capital gains are exempt from taxes.
Source: http://www.qc.ec.gc.ca/faune/pde-egp/avantages_e.asp
5.4.2 GREENING INTERGOVERNMEN-TAL FISCAL TRANSFERS
Public spending includes fiscal transfers bet-ween different levels of government – which areoften neglected in conservation strategies. Hugeamounts of tax revenues are redistributed from nationalto sub-national and local governments to provide thelatter with monies to build and maintain schools, hos-pitals and roads and so on. These public finance me-chanisms are critically important for local and regionaldecision-makers (see TEEB D2) but are rarely conside-red in terms of their ecological impact (Ring 2002).
Government spending at local, national and interna-tional levels needs to fully integrate biodiversity con-servation and maintenance of ecosystem services.Integrating such concerns into systems for distribu-ting tax revenues to lower levels of government canencourage decision makers to take more care of na-ture whilst also nurturing their tax base. Currently, ho-wever, tax incentives are mainly directed towardsattracting more businesses, residents and con-struction activities which give rise to land uses thatdestroy or damage natural habitats (see Chapters 6and 7) instead of setting incentives towards conser-vation (see Chapter 8).
Changing the economic signals can create win-win situations. By way of example, many federalauthorities use the area of a municipality or provinceas one criterion for determining fiscal transfers – it isonly a small step to include ‘protected area’ as an ad-ditional criterion for allocating tax revenues. This couldhelp raise funds to address the local managementand conservation objectives of protected areas (seeChapter 8) and reduce their image as a fiscal burdenor obstacle to development. Positive effects will beeven stronger if people living in and around these sitesreceive some of the benefits involved in ecological fiscal transfers: this could help to reduce local oppo-sition to protected areas in some cases.
Decisions to establish protected areas are often takenby higher levels of government with local decision-makers having little influence on site selection. Including protected areas as a criterion for intergo-vernmental fiscal transfers could help to reconcile the
local costs of protected areas with their benefits,which often reach far beyond municipal boundaries.
A few countries have taken steps to introduceecological fiscal transfers to compensate munici-palities for land-use restrictions imposed by pro-tected areas. Since 1992, several states in Brazil haveintroduced ‘conservation units’ (CUs), a protected area-based indicator, for the redistribution of value added taxfrom state level to municipalities (Grieg-Gran 2000). InJanuary 2007, Portugal amended its municipal financelaw to introduce ecological fiscal transfers to rewardmunicipalities for designated EU Natura 2000 sites andother protected areas within their territories (De Meloand Prates 2007).
Using such criteria to redistribute tax revenues betweendifferent levels of government can help realign the in-centives of public actors, as the Brazilian experienceshows (see Box 5.19). However, care should be takento ensure that such transfers are clearly linked to widerbenefits and that higher levels of government do notend up assuming the burden of providing local goodsand services (e.g. sewage disposal) that are normallyprovided by municipalities from their own resources.
As with PES schemes, spatially explicit modellingand GIS tools can help illustrate the potential con-sequences of ecological fiscal transfers at theplanning stage. Fiscal transfer schemes are country-specific and politically sensitive, due to the substantial
T E E B F O R N A T I O N A L A N D I N T E R N A T I O N A L P O L I C Y M A K E R S - C H A P T E R 5 : P A G E 4 2
R E W A R D I N G B E N E F I T S T H R O U G H P A Y M E N T S A N D M A R K E T S
Box 5.18: ‘Green Funds Scheme’ in the Netherlands (Regeling groenprojecten)
The Scheme was set up to encourage projects thathave a positive effect on the environment. The go-vernment offers a tax advantage to ‘green’ saversand investors, while banks can offer loans at lowerinterest rates for projects such as sustainably builthouses, wind farms, developing forests or organicagricultural businesses. In the Dutch tax system,savers and investors normally pay 1.2% capitalgains tax over the amount saved or invested. Ho-wever, green capital is exempt from such tax, up toa maximum of 52,579 EUR per person (2006). Source: http://www.senternovem.nl/greenfundsscheme/index.asp
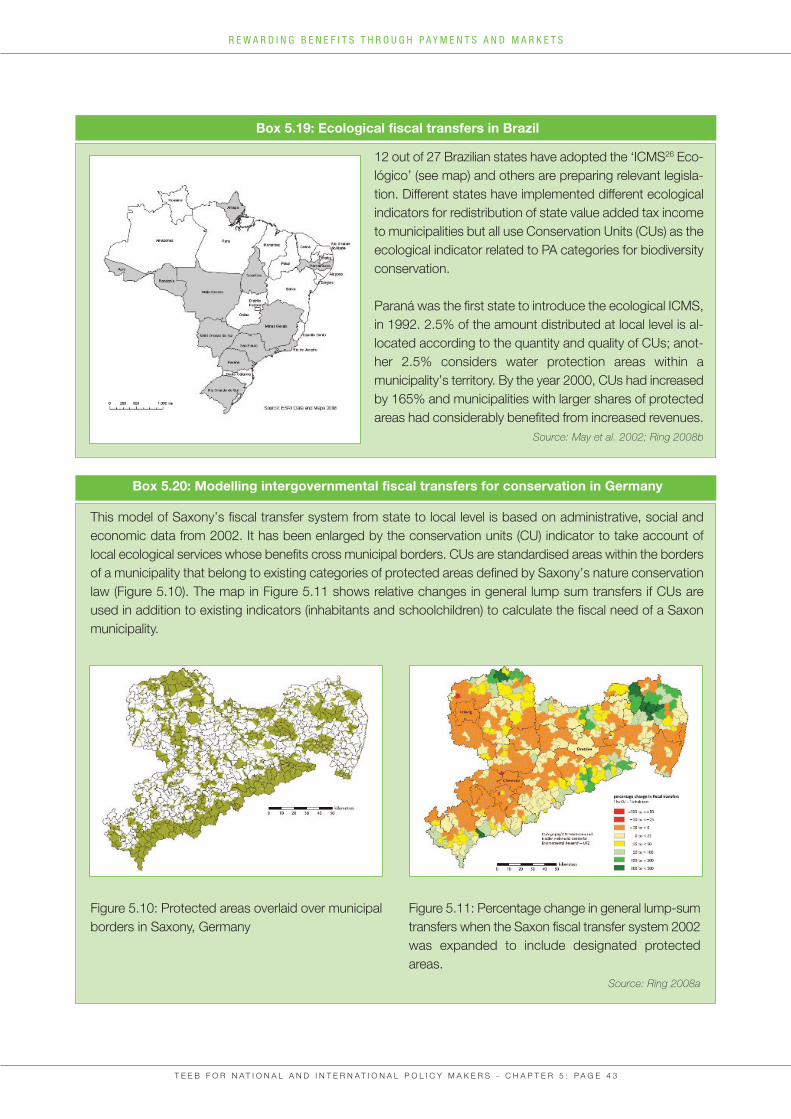
T E E B F O R N A T I O N A L A N D I N T E R N A T I O N A L P O L I C Y M A K E R S - C H A P T E R 5 : P A G E 4 3
R E W A R D I N G B E N E F I T S T H R O U G H P A Y M E N T S A N D M A R K E T S
Box 5.19: Ecological fiscal transfers in Brazil
12 out of 27 Brazilian states have adopted the ‘ICMS26 Eco-lógico’ (see map) and others are preparing relevant legisla-tion. Different states have implemented different ecologicalindicators for redistribution of state value added tax incometo municipalities but all use Conservation Units (CUs) as theecological indicator related to PA categories for biodiversityconservation.
Paraná was the first state to introduce the ecological ICMS,in 1992. 2.5% of the amount distributed at local level is al-located according to the quantity and quality of CUs; anot-her 2.5% considers water protection areas within amunicipality’s territory. By the year 2000, CUs had increasedby 165% and municipalities with larger shares of protectedareas had considerably benefited from increased revenues.
Source: May et al. 2002; Ring 2008b
Box 5.20: Modelling intergovernmental fiscal transfers for conservation in Germany
Figure 5.10: Protected areas overlaid over municipalborders in Saxony, Germany
Figure 5.11: Percentage change in general lump-sumtransfers when the Saxon fiscal transfer system 2002was expanded to include designated protectedareas.
Source: Ring 2008a
This model of Saxony’s fiscal transfer system from state to local level is based on administrative, social andeconomic data from 2002. It has been enlarged by the conservation units (CU) indicator to take account oflocal ecological services whose benefits cross municipal borders. CUs are standardised areas within the bordersof a municipality that belong to existing categories of protected areas defined by Saxony’s nature conservationlaw (Figure 5.10). The map in Figure 5.11 shows relative changes in general lump sum transfers if CUs areused in addition to existing indicators (inhabitants and schoolchildren) to calculate the fiscal need of a Saxonmunicipality.
financial flows involved. Building on existing transferschemes and integrating suitable ecological criteria (e.g.protected area coverage in hectares as a percentage ofterritory covered) can help decision makers promote in-novative solutions to raise funds for conservation.
For Switzerland, Köllner et al. (2002) have developed amodel for intergovernmental transfers to the local level,based on biodiversity indicators and cantonal bench-marking. For Germany, Ring (2008a) suggested ways ofincorporating protected areas into the intergovernmentalfiscal transfer system in Saxony (see Box 5.20).
5.4.3 COMPENSATING LAND USERS FOR WILDLIFE DAMAGE
Compensation payments are designed to indemnifyland users, mostly farmers and fishermen, for the da-mage caused by particular wildlife species e.g. damageto livestock by wolves (Fourli 1999) or to fishing gear byseals (Similä et al. 2006). These kind of payments can becontroversial but many have proven to be effective andare accepted by local stakeholders. Compensation sche-mes have been set up in many developed and developingcountries (see example in Box 5.21 and also the India/elephants reward programme case in Chapter 8).
Although compensation payments for wildlife damageare sometimes essential to prevent hunting or cullingof protected and highly endangered species, they are often associated with – or may even create – a negative perception of wildlife. In many countries, perspective is shifting away from damage compen-sation schemes (i.e. seeing wildlife as a cost) towardsdeveloping public payments that reward the presenceof wild animals on private lands or support measuresto provide feeding habitats for protected species (i.e.seeing wildlife as positive and making related pay-ments) (Similä et al. 2006; Suvantola in preparation;see Box 5.22 and the discussion on PES in Section5.1).
T E E B F O R N A T I O N A L A N D I N T E R N A T I O N A L P O L I C Y M A K E R S - C H A P T E R 5 : P A G E 4 4
R E W A R D I N G B E N E F I T S T H R O U G H P A Y M E N T S A N D M A R K E T S
Box 5.21: Goose Management Scheme, Scotland
This scheme aims to promote conservation and asustainable goose population by compensating far-mers for damage to agricultural crops caused bywintering wild geese. It requires a specific area oneach farm to be set aside for geese, which may thenbe scared away from the remaining farm areas.
At the start of this initiative, payments were madeon the basis of geese headage which involved hightransaction costs. Payments are now made on anarea basis. The maximum payment is £ 301.55(about 338 EUR) per hectare of rotational grass orarable land. The payments are made by the UK go-vernment according to the five-year agreement inplace.
Source: MacMillan et al. 2004
Box 5.22: Rewarding conservation of goldeneagles by the Sami in Finland
The scheme provides compensation for lossescaused by golden eagles to reindeer husbandry inNorthern Finland. As recently amended, it aims topromote the conservation status of the species rat-her than focusing primarily on damage.
Payments are now based on nesting and repro-duction of the species and actively involve the Samipeople in monitoring nesting sites. Participantshave access to information on nesting sites andalso provide information to conservation authoritieson newly discovered sites. In this way, the schemediscourages disturbance of the eagles during nes-ting and encourages creation of nesting sites ratherthan their destruction. There is also ongoing follow-up to build trust between the authorities and thosewho are subject to the negative impacts of the spe-cies’ recovery.
Source: Similä et al. 2006; Suvantola in preparation
T E E B F O R N A T I O N A L A N D I N T E R N A T I O N A L P O L I C Y M A K E R S - C H A P T E R 5 : P A G E 4 5
R E W A R D I N G B E N E F I T S T H R O U G H P A Y M E N T S A N D M A R K E T S
Market mechanisms that reflect the values of biodiver-sity are well established for some goods and servicesand have been growing steadily over the last decade27.This trend reflects the increasing awareness of manyconsumers and producers that conventional productionand consumption practices threaten the long-term via-bility of ecosystems. This section outlines progress onmarket development in key sectors (5.5.1) and identifiesbarriers to the success of ‘green’ products and services(5.5.2) before considering ways to expand the reach ofbiodiversity-friendly markets (5.5.3).
5.5.1 SUPPORT FOR BIODIVERSITY-FRIENDLY PRODUCTS AND SERVICES
Market niches are available for products and ser-vices that can reliably distinguish themselvesfrom their competitors by demonstrating conser-vation credentials, including:• products characterised by reduced direct impacts
on biodiversity, due to adoption of more efficient or low-impact production and processing methods(e.g. reduced impact forestry or fisheries);
• products with reduced indirect impacts on biodiver-sity as a result of decreased pollution load (e.g. biodegradable detergents);
• products and services based on the sustainable use of ecosystem services and biodiversity (e.g. ecotourism or biotrade).
While most product markets still do not treat biodiver-sity as a key concern, there is growing evidence fromacross the world that conservation can enhance acompany’s competitive position and be an oppor-tunity in all sectors. In some cases, biodiversity-friendly products and services can:• attract market share or premiums for certain
products and their suppliers;
DEVELOPING MARKETS FOR GREEN GOODS AND SERVICES 5.5
• facilitate access to previously inaccessible markets or create entirely new markets;
• offer enhanced product differentiation in increa-singly competitive global markets;
• reinforce and validate positive community relations and improved corporate image;
• improve employee morale, retention and producti-vity; and
• support the poor where they are directly involved in production (Bishop et al. 2008).
BUSINESS ACTION ON GREENING SUPPLY CHAINS
For most business sectors and companies, biodiversityconservation is still seen as a liability rather than a profitcentre. The main drivers of private investment in biodi-versity come from legal requirements, charitable impul-ses and informal pressure from shareholders, localcommunities and NGOs. The business case for such in-vestment is more often expressed in terms of protectingfirms’ market share or minimising risk to reputation.
However, there are exceptions. Some retailers commit-ted themselves in the early 1990s to stock only timberproducts certified as meeting strict environmental per-formance standards. For example, the B&Q Do-It-Yourself chain in the UK, owned by Kingfisher, was oneof the companies responsible for setting up the ForestStewardship Council (see below) to provide a crediblemechanism to demonstrate responsible purchasing oftimber products.
Such private voluntary actions can help make marketswork better for the environment. When large companieschoose to direct their purchasing power in a particulardirection, they can have a large impact on trade andproduction practices around the world. Such initiativesrequire vision and commitment from the top as well as
considerable patience as such options are not easy orcheap to implement. However, the payback in publicrelations and corporate social responsibility are oftendeemed worth the risk.
PUBLIC SUPPORT FOR GREEN MARKETS
In April 2009, the European Commission issued aCommunication signalling its strong support forthe Fair Trade movement (EC 2009). It applaudedprivate sector initiative in this area although stoppingshort of mandating any action. Fair Trade focuses onsocial rather than environmental criteria but EU supportis a positive development for the certification industryin general. Individual governments can also support bio-diversity-friendly products and services through green pu-blic procurement policies and practices (see Section 5.6).
Several international institutions recognise the value ofencouraging products and services that take biodiver-sity and ecosystems into account. The CBD,UNCTAD, CITES and a growing number of coun-tries support BioTrade activities for the promotion ofgoods and services derived from native biodiversityunder strict sustainable development criteria.
NON-GOVERNMENTAL ORGANISATIONSAND GREEN MARKETS
NGOs have played a significant role in developing vo-luntary environmental standards for a range of productsand services. WWF worked in partnership with Unileverto establish the Marine Stewardship Council (MSC) forthe certification of sustainably produced marine pro-ducts (see Box 5.24) and has helped catalyse demandfor certified timber. International NGOs such as Conser-vation International and WWF are currently involved invarious fora addressing biofuel production e.g. theRound Table on Sustainable Palm Oil.
Since the mid-1990s, several non-profit organisationshave been established to assess the sustainability ofselected commodities and services against emergingstandards on biodiversity-friendly production. Theseprogrammes are increasingly formalised through inde-pendent certification and assurance mechanisms, with
both NGOs and private firms competing to offer verifi-cation and audit services (see below).
CERTIFICATION OF FORESTRY PRODUCTS
The International Tropical Timber Organisation (ITTO),established under UN auspices to administer a tradeagreement between producers and consumers of tropicaltimber, describes sustainable forest management asforest-related activities that do “not damage the forest tothe extent that its capacity to deliver products and ser-vices – such as timber, water and biodiversity conserva-tion – is significantly reduced. Forest management shouldalso aim to balance the needs of different forest users sothat its benefits and costs are shared equitably”28.
Several certification schemes now exist for forest ma-nagement, of which two are responsible for the majorityof forest certification (see Box 5.23).
Between 2001 and 2005, global coverage of certifiedforests expanded by about 50 million hectares per year,mainly due to a rapid increase in certified forest area inNorth America (Figure 5.12). By 2009, 325.2 millionhectares worldwide had been certified under variousschemes (8.3% of total forest area: UNECE/FAO 2009).
In terms of global roundwood production (i.e. sectionsof timber in raw unmanufactured state), approximately26% was harvested from certified forests between May2008 and May 2009. However, the rate of expansionhas decreased over the last three years. Between May2008 and May 2009, the rate of increase did not ex-ceed four million hectares (Table 5.3).
This reduction in the rate of expansion of certifiedforestsmay reflect the fact that, in the developed worldat least, most of the larger forest areas are already cer-tified. Certifying forests in developing countries presentscontinuing challenges linked to lack of capacity, resources and incentives to participate as a signi-ficant proportion of forest areas are owned by smallernon-industrial and communal sectors. The geographicalbias of certified forests towards the northern he-misphere inevitably limits the effectiveness of certifica-tion as an instrument for protecting biodiversity (seeTable 5.3 and Section 5.5.2 below).
T E E B F O R N A T I O N A L A N D I N T E R N A T I O N A L P O L I C Y M A K E R S - C H A P T E R 5 : P A G E 4 6
R E W A R D I N G B E N E F I T S T H R O U G H P A Y M E N T S A N D M A R K E T S
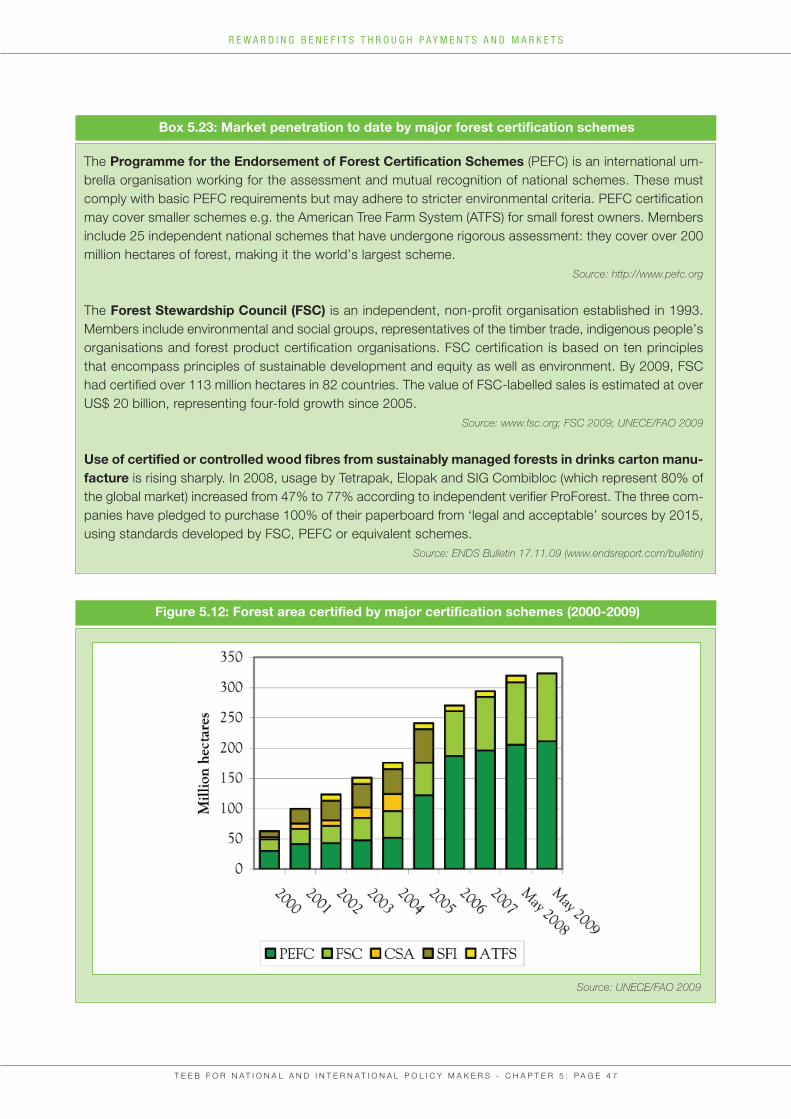
T E E B F O R N A T I O N A L A N D I N T E R N A T I O N A L P O L I C Y M A K E R S - C H A P T E R 5 : P A G E 4 7
R E W A R D I N G B E N E F I T S T H R O U G H P A Y M E N T S A N D M A R K E T S
Box 5.23: Market penetration to date by major forest certification schemes
The Programme for the Endorsement of Forest Certification Schemes (PEFC) is an international um-brella organisation working for the assessment and mutual recognition of national schemes. These mustcomply with basic PEFC requirements but may adhere to stricter environmental criteria. PEFC certificationmay cover smaller schemes e.g. the American Tree Farm System (ATFS) for small forest owners. Membersinclude 25 independent national schemes that have undergone rigorous assessment: they cover over 200million hectares of forest, making it the world’s largest scheme.
Source: http://www.pefc.org
The Forest Stewardship Council (FSC) is an independent, non-profit organisation established in 1993.Members include environmental and social groups, representatives of the timber trade, indigenous people’sorganisations and forest product certification organisations. FSC certification is based on ten principlesthat encompass principles of sustainable development and equity as well as environment. By 2009, FSChad certified over 113 million hectares in 82 countries. The value of FSC-labelled sales is estimated at overUS$ 20 billion, representing four-fold growth since 2005.
Source: www.fsc.org; FSC 2009; UNECE/FAO 2009
Use of certified or controlled wood fibres from sustainably managed forests in drinks carton manu-facture is rising sharply. In 2008, usage by Tetrapak, Elopak and SIG Combibloc (which represent 80% ofthe global market) increased from 47% to 77% according to independent verifier ProForest. The three com-panies have pledged to purchase 100% of their paperboard from ‘legal and acceptable’ sources by 2015,using standards developed by FSC, PEFC or equivalent schemes.
Source: ENDS Bulletin 17.11.09 (www.endsreport.com/bulletin)
Figure 5.12: Forest area certified by major certification schemes (2000-2009)
Source: UNECE/FAO 2009
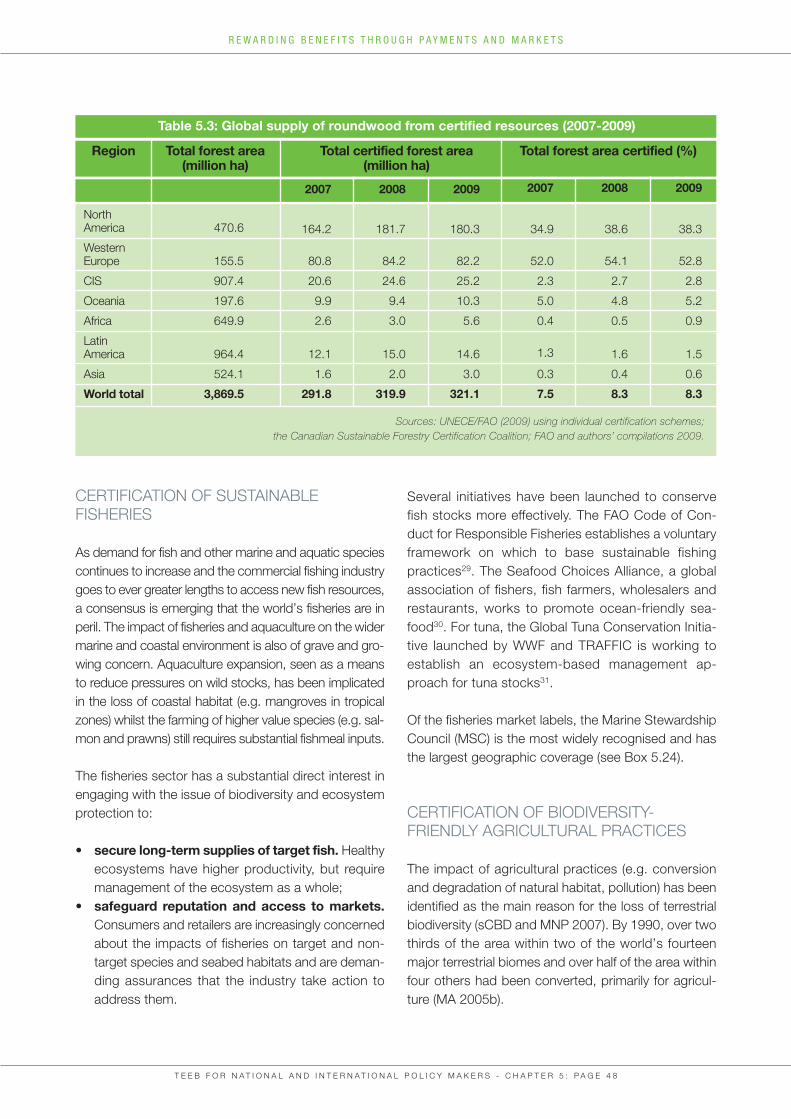
CERTIFICATION OF SUSTAINABLE FISHERIES
As demand for fish and other marine and aquatic speciescontinues to increase and the commercial fishing industrygoes to ever greater lengths to access new fish resources,a consensus is emerging that the world’s fisheries are inperil. The impact of fisheries and aquaculture on the widermarine and coastal environment is also of grave and gro-wing concern. Aquaculture expansion, seen as a meansto reduce pressures on wild stocks, has been implicatedin the loss of coastal habitat (e.g. mangroves in tropicalzones) whilst the farming of higher value species (e.g. sal-mon and prawns) still requires substantial fishmeal inputs.
The fisheries sector has a substantial direct interest inengaging with the issue of biodiversity and ecosystemprotection to:
• secure long-term supplies of target fish. Healthy ecosystems have higher productivity, but require management of the ecosystem as a whole;
• safeguard reputation and access to markets.Consumers and retailers are increasingly concerned about the impacts of fisheries on target and non-target species and seabed habitats and are deman-ding assurances that the industry take action to address them.
Several initiatives have been launched to conservefish stocks more effectively. The FAO Code of Con-duct for Responsible Fisheries establishes a voluntaryframework on which to base sustainable fishingpractices29. The Seafood Choices Alliance, a globalassociation of fishers, fish farmers, wholesalers andrestaurants, works to promote ocean-friendly sea-food30. For tuna, the Global Tuna Conservation Initia-tive launched by WWF and TRAFFIC is working toestablish an ecosystem-based management ap-proach for tuna stocks31.
Of the fisheries market labels, the Marine StewardshipCouncil (MSC) is the most widely recognised and hasthe largest geographic coverage (see Box 5.24).
CERTIFICATION OF BIODIVERSITY-FRIENDLY AGRICULTURAL PRACTICES
The impact of agricultural practices (e.g. conversionand degradation of natural habitat, pollution) has beenidentified as the main reason for the loss of terrestrialbiodiversity (sCBD and MNP 2007). By 1990, over twothirds of the area within two of the world’s fourteenmajor terrestrial biomes and over half of the area withinfour others had been converted, primarily for agricul-ture (MA 2005b).
T E E B F O R N A T I O N A L A N D I N T E R N A T I O N A L P O L I C Y M A K E R S - C H A P T E R 5 : P A G E 4 8
R E W A R D I N G B E N E F I T S T H R O U G H P A Y M E N T S A N D M A R K E T S
Table 5.3: Global supply of roundwood from certified resources (2007-2009)
Region Total forest area (million ha)
Total forest area certified (%)Total certified forest area(million ha)
2007
164.2
80.8
20.6
9.9
2.6
12.1
1.6
291.8
2008
181.7
84.2
24.6
9.4
3.0
15.0
2.0
319.9
2009
180.3
82.2
25.2
10.3
5.6
14.6
3.0
321.1
2007
34.9
52.0
2.3
5.0
0.4
1.3
0.3
7.5
2008
38.6
54.1
2.7
4.8
0.5
1.6
0.4
8.3
2009
38.3
52.8
2.8
5.2
0.9
1.5
0.6
8.3
North America
WesternEurope
CIS
Oceania
Africa
Latin America
Asia
World total
470.6
155.5
907.4
197.6
649.9
964.4
524.1
3,869.5
Sources: UNECE/FAO (2009) using individual certification schemes;the Canadian Sustainable Forestry Certification Coalition; FAO and authors’ compilations 2009.
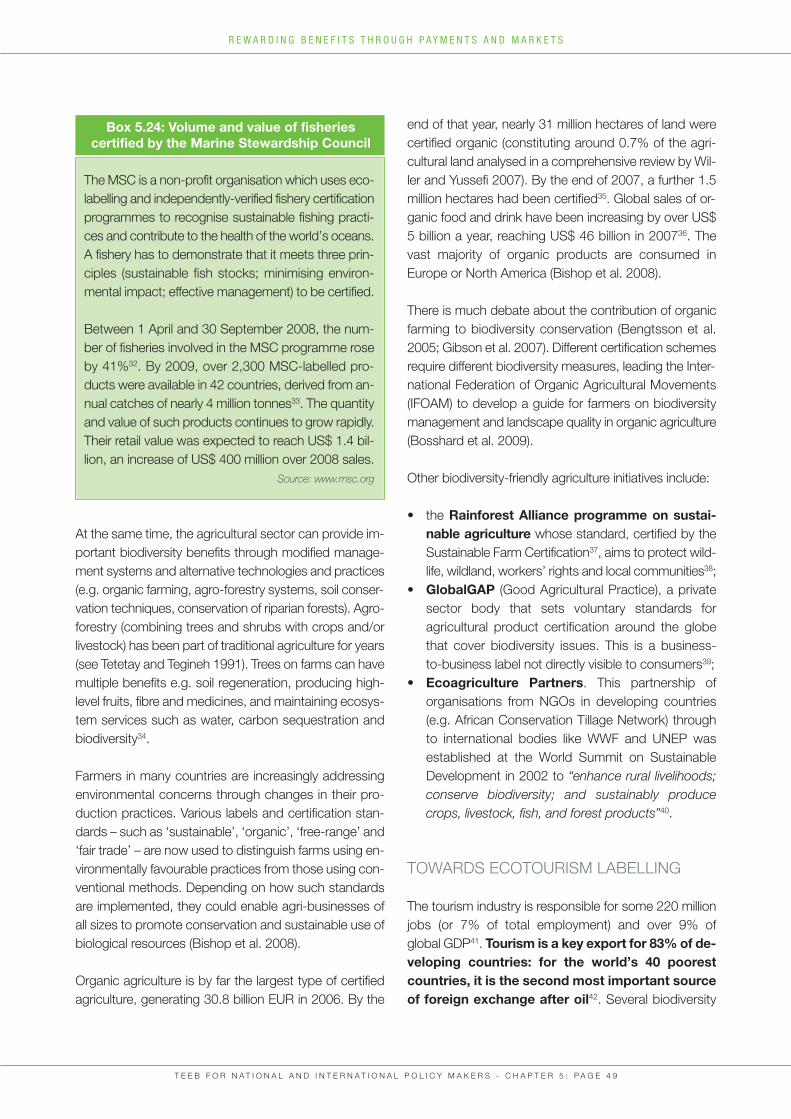
At the same time, the agricultural sector can provide im-portant biodiversity benefits through modified manage-ment systems and alternative technologies and practices(e.g. organic farming, agro-forestry systems, soil conser-vation techniques, conservation of riparian forests). Agro-forestry (combining trees and shrubs with crops and/orlivestock) has been part of traditional agriculture for years(see Tetetay and Tegineh 1991). Trees on farms can havemultiple benefits e.g. soil regeneration, producing high-level fruits, fibre and medicines, and maintaining ecosys-tem services such as water, carbon sequestration andbiodiversity34.
Farmers in many countries are increasingly addressingenvironmental concerns through changes in their pro-duction practices. Various labels and certification stan-dards – such as ‘sustainable’, ‘organic’, ‘free-range’ and‘fair trade’ – are now used to distinguish farms using en-vironmentally favourable practices from those using con-ventional methods. Depending on how such standardsare implemented, they could enable agri-businesses ofall sizes to promote conservation and sustainable use ofbiological resources (Bishop et al. 2008).
Organic agriculture is by far the largest type of certifiedagriculture, generating 30.8 billion EUR in 2006. By the
end of that year, nearly 31 million hectares of land werecertified organic (constituting around 0.7% of the agri-cultural land analysed in a comprehensive review by Wil-ler and Yussefi 2007). By the end of 2007, a further 1.5million hectares had been certified35. Global sales of or-ganic food and drink have been increasing by over US$5 billion a year, reaching US$ 46 billion in 200736. Thevast majority of organic products are consumed inEurope or North America (Bishop et al. 2008).
There is much debate about the contribution of organicfarming to biodiversity conservation (Bengtsson et al.2005; Gibson et al. 2007). Different certification schemesrequire different biodiversity measures, leading the Inter-national Federation of Organic Agricultural Movements(IFOAM) to develop a guide for farmers on biodiversitymanagement and landscape quality in organic agriculture(Bosshard et al. 2009).
Other biodiversity-friendly agriculture initiatives include:
• the Rainforest Alliance programme on sustai-nable agriculture whose standard, certified by the Sustainable Farm Certification37, aims to protect wild-life, wildland, workers’ rights and local communities38;
• GlobalGAP (Good Agricultural Practice), a private sector body that sets voluntary standards for agricultural product certification around the globe that cover biodiversity issues. This is a business-to-business label not directly visible to consumers39;
• Ecoagriculture Partners. This partnership of organisations from NGOs in developing countries (e.g. African Conservation Tillage Network) through to international bodies like WWF and UNEP was established at the World Summit on Sustainable Development in 2002 to “enhance rural livelihoods; conserve biodiversity; and sustainably produce crops, livestock, fish, and forest products”40.
TOWARDS ECOTOURISM LABELLING
The tourism industry is responsible for some 220 millionjobs (or 7% of total employment) and over 9% of global GDP41. Tourism is a key export for 83% of de-veloping countries: for the world’s 40 poorestcountries, it is the second most important sourceof foreign exchange after oil42. Several biodiversity
T E E B F O R N A T I O N A L A N D I N T E R N A T I O N A L P O L I C Y M A K E R S - C H A P T E R 5 : P A G E 4 9
R E W A R D I N G B E N E F I T S T H R O U G H P A Y M E N T S A N D M A R K E T S
Box 5.24: Volume and value of fisheries certified by the Marine Stewardship Council
The MSC is a non-profit organisation which uses eco-labelling and independently-verified fishery certificationprogrammes to recognise sustainable fishing practi-ces and contribute to the health of the world’s oceans.A fishery has to demonstrate that it meets three prin-ciples (sustainable fish stocks; minimising environ-mental impact; effective management) to be certified.
Between 1 April and 30 September 2008, the num-ber of fisheries involved in the MSC programme roseby 41%32. By 2009, over 2,300 MSC-labelled pro-ducts were available in 42 countries, derived from an-nual catches of nearly 4 million tonnes33. The quantityand value of such products continues to grow rapidly.Their retail value was expected to reach US$ 1.4 bil-lion, an increase of US$ 400 million over 2008 sales.
Source: www.msc.org
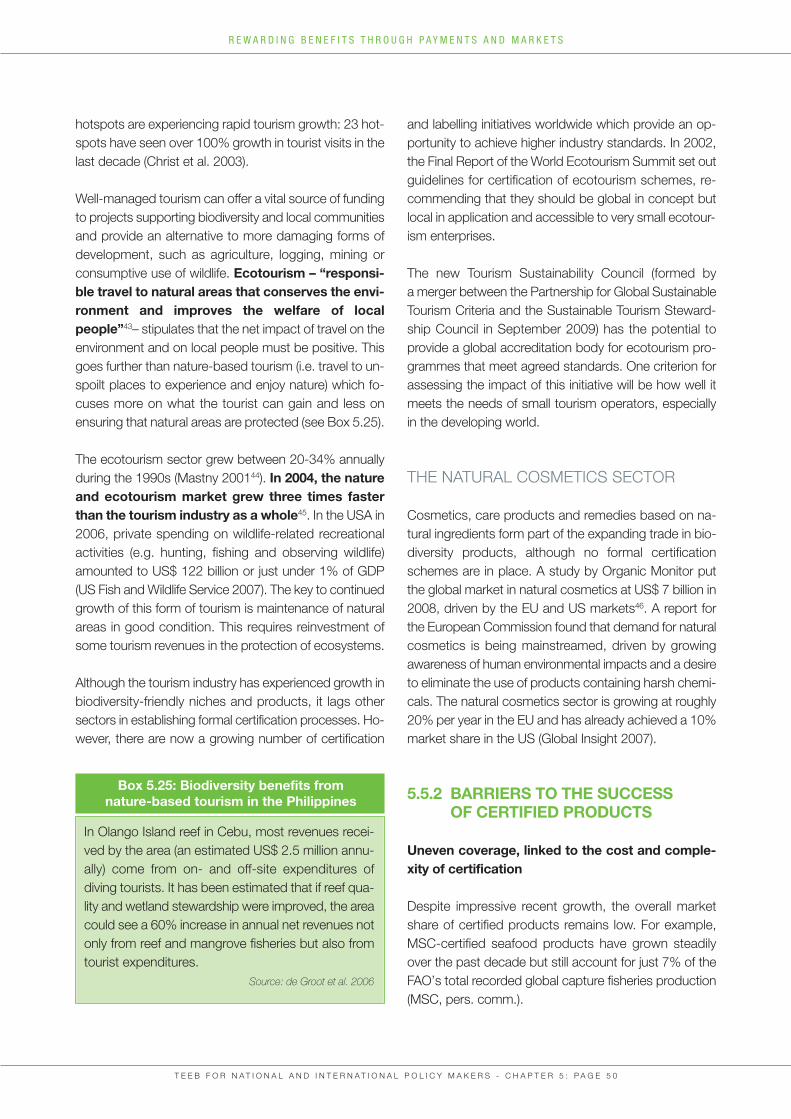
hotspots are experiencing rapid tourism growth: 23 hot-spots have seen over 100% growth in tourist visits in thelast decade (Christ et al. 2003).
Well-managed tourism can offer a vital source of fundingto projects supporting biodiversity and local communitiesand provide an alternative to more damaging forms ofdevelopment, such as agriculture, logging, mining orconsumptive use of wildlife. Ecotourism – “responsi-ble travel to natural areas that conserves the envi-ronment and improves the welfare of localpeople”43– stipulates that the net impact of travel on theenvironment and on local people must be positive. Thisgoes further than nature-based tourism (i.e. travel to un-spoilt places to experience and enjoy nature) which fo-cuses more on what the tourist can gain and less onensuring that natural areas are protected (see Box 5.25).
The ecotourism sector grew between 20-34% annuallyduring the 1990s (Mastny 200144). In 2004, the natureand ecotourism market grew three times fasterthan the tourism industry as a whole45. In the USA in2006, private spending on wildlife-related recreationalactivities (e.g. hunting, fishing and observing wildlife)amounted to US$ 122 billion or just under 1% of GDP(US Fish and Wildlife Service 2007). The key to continuedgrowth of this form of tourism is maintenance of naturalareas in good condition. This requires reinvestment ofsome tourism revenues in the protection of ecosystems.
Although the tourism industry has experienced growth inbiodiversity-friendly niches and products, it lags othersectors in establishing formal certification processes. Ho-wever, there are now a growing number of certification
and labelling initiatives worldwide which provide an op-portunity to achieve higher industry standards. In 2002,the Final Report of the World Ecotourism Summit set outguidelines for certification of ecotourism schemes, re-commending that they should be global in concept butlocal in application and accessible to very small ecotour-ism enterprises.
The new Tourism Sustainability Council (formed by a merger between the Partnership for Global SustainableTourism Criteria and the Sustainable Tourism Steward-ship Council in September 2009) has the potential toprovide a global accreditation body for ecotourism pro-grammes that meet agreed standards. One criterion forassessing the impact of this initiative will be how well itmeets the needs of small tourism operators, especiallyin the developing world.
THE NATURAL COSMETICS SECTOR
Cosmetics, care products and remedies based on na-tural ingredients form part of the expanding trade in bio-diversity products, although no formal certificationschemes are in place. A study by Organic Monitor putthe global market in natural cosmetics at US$ 7 billion in2008, driven by the EU and US markets46. A report forthe European Commission found that demand for naturalcosmetics is being mainstreamed, driven by growingawareness of human environmental impacts and a desireto eliminate the use of products containing harsh chemi-cals. The natural cosmetics sector is growing at roughly20% per year in the EU and has already achieved a 10%market share in the US (Global Insight 2007).
5.5.2 BARRIERS TO THE SUCCESS OF CERTIFIED PRODUCTS
Uneven coverage, linked to the cost and comple-xity of certification
Despite impressive recent growth, the overall marketshare of certified products remains low. For example,MSC-certified seafood products have grown steadilyover the past decade but still account for just 7% of theFAO’s total recorded global capture fisheries production(MSC, pers. comm.).
T E E B F O R N A T I O N A L A N D I N T E R N A T I O N A L P O L I C Y M A K E R S - C H A P T E R 5 : P A G E 5 0
R E W A R D I N G B E N E F I T S T H R O U G H P A Y M E N T S A N D M A R K E T S
Box 5.25: Biodiversity benefits from nature-based tourism in the Philippines
In Olango Island reef in Cebu, most revenues recei-ved by the area (an estimated US$ 2.5 million annu-ally) come from on- and off-site expenditures ofdiving tourists. It has been estimated that if reef qua-lity and wetland stewardship were improved, the areacould see a 60% increase in annual net revenues notonly from reef and mangrove fisheries but also fromtourist expenditures.
Source: de Groot et al. 2006
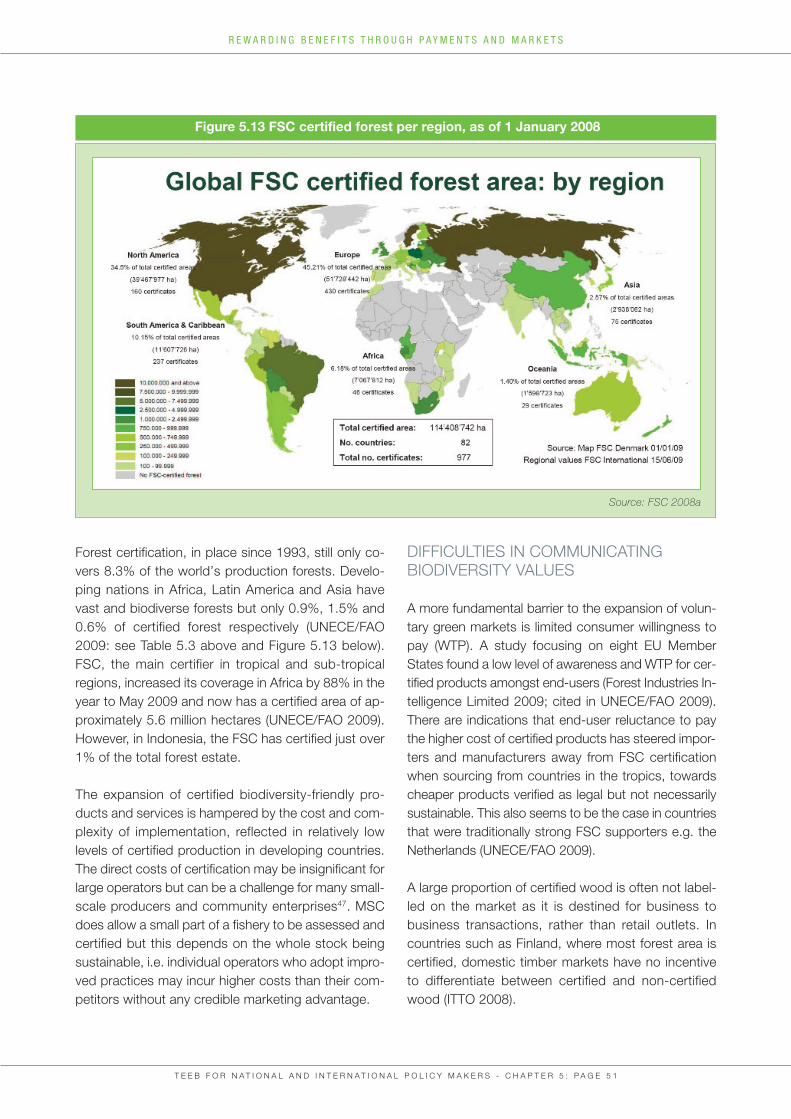
Forest certification, in place since 1993, still only co-vers 8.3% of the world’s production forests. Develo-ping nations in Africa, Latin America and Asia havevast and biodiverse forests but only 0.9%, 1.5% and0.6% of certified forest respectively (UNECE/FAO2009: see Table 5.3 above and Figure 5.13 below).FSC, the main certifier in tropical and sub-tropical regions, increased its coverage in Africa by 88% in theyear to May 2009 and now has a certified area of ap-proximately 5.6 million hectares (UNECE/FAO 2009).However, in Indonesia, the FSC has certified just over1% of the total forest estate.
The expansion of certified biodiversity-friendly pro-ducts and services is hampered by the cost and com-plexity of implementation, reflected in relatively lowlevels of certified production in developing countries.The direct costs of certification may be insignificant forlarge operators but can be a challenge for many small-scale producers and community enterprises47. MSCdoes allow a small part of a fishery to be assessed andcertified but this depends on the whole stock beingsustainable, i.e. individual operators who adopt impro-ved practices may incur higher costs than their com-petitors without any credible marketing advantage.
DIFFICULTIES IN COMMUNICATING BIODIVERSITY VALUES
A more fundamental barrier to the expansion of volun-tary green markets is limited consumer willingness topay (WTP). A study focusing on eight EU MemberStates found a low level of awareness and WTP for cer-tified products amongst end-users (Forest Industries In-telligence Limited 2009; cited in UNECE/FAO 2009).There are indications that end-user reluctance to paythe higher cost of certified products has steered impor-ters and manufacturers away from FSC certificationwhen sourcing from countries in the tropics, towardscheaper products verified as legal but not necessarilysustainable. This also seems to be the case in countriesthat were traditionally strong FSC supporters e.g. theNetherlands (UNECE/FAO 2009).
A large proportion of certified wood is often not label-led on the market as it is destined for business to business transactions, rather than retail outlets. Incountries such as Finland, where most forest area iscertified, domestic timber markets have no incentiveto differentiate between certified and non-certifiedwood (ITTO 2008).
T E E B F O R N A T I O N A L A N D I N T E R N A T I O N A L P O L I C Y M A K E R S - C H A P T E R 5 : P A G E 5 1
R E W A R D I N G B E N E F I T S T H R O U G H P A Y M E N T S A N D M A R K E T S
Figure 5.13 FSC certified forest per region, as of 1 January 2008
Source: FSC 2008a
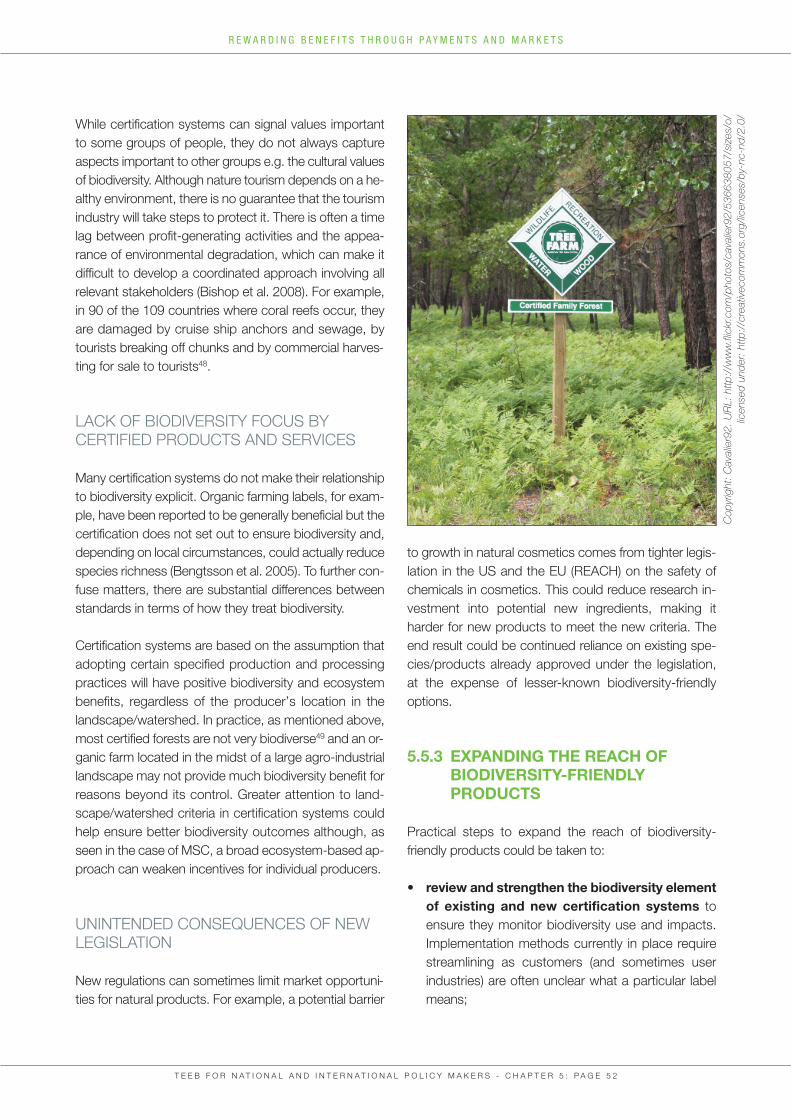
While certification systems can signal values importantto some groups of people, they do not always captureaspects important to other groups e.g. the cultural valuesof biodiversity. Although nature tourism depends on a he-althy environment, there is no guarantee that the tourismindustry will take steps to protect it. There is often a timelag between profit-generating activities and the appea-rance of environmental degradation, which can make itdifficult to develop a coordinated approach involving allrelevant stakeholders (Bishop et al. 2008). For example,in 90 of the 109 countries where coral reefs occur, theyare damaged by cruise ship anchors and sewage, bytourists breaking off chunks and by commercial harves-ting for sale to tourists48.
LACK OF BIODIVERSITY FOCUS BY CERTIFIED PRODUCTS AND SERVICES
Many certification systems do not make their relationshipto biodiversity explicit. Organic farming labels, for exam-ple, have been reported to be generally beneficial but thecertification does not set out to ensure biodiversity and,depending on local circumstances, could actually reducespecies richness (Bengtsson et al. 2005). To further con-fuse matters, there are substantial differences betweenstandards in terms of how they treat biodiversity.
Certification systems are based on the assumption thatadopting certain specified production and processingpractices will have positive biodiversity and ecosystembenefits, regardless of the producer’s location in thelandscape/watershed. In practice, as mentioned above,most certified forests are not very biodiverse49 and an or-ganic farm located in the midst of a large agro-industriallandscape may not provide much biodiversity benefit forreasons beyond its control. Greater attention to land-scape/watershed criteria in certification systems couldhelp ensure better biodiversity outcomes although, asseen in the case of MSC, a broad ecosystem-based ap-proach can weaken incentives for individual producers.
UNINTENDED CONSEQUENCES OF NEWLEGISLATION
New regulations can sometimes limit market opportuni-ties for natural products. For example, a potential barrier
to growth in natural cosmetics comes from tighter legis-lation in the US and the EU (REACH) on the safety ofchemicals in cosmetics. This could reduce research in-vestment into potential new ingredients, making it harder for new products to meet the new criteria. Theend result could be continued reliance on existing spe-cies/products already approved under the legislation, at the expense of lesser-known biodiversity-friendly options.
5.5.3 EXPANDING THE REACH OF BIODIVERSITY-FRIENDLY PRODUCTS
Practical steps to expand the reach of biodiversity-friendly products could be taken to:
• review and strengthen the biodiversity element of existing and new certification systems to ensure they monitor biodiversity use and impacts. Implementation methods currently in place require streamlining as customers (and sometimes user industries) are often unclear what a particular label means;
T E E B F O R N A T I O N A L A N D I N T E R N A T I O N A L P O L I C Y M A K E R S - C H A P T E R 5 : P A G E 5 2
R E W A R D I N G B E N E F I T S T H R O U G H P A Y M E N T S A N D M A R K E T S
Cop
yright: Cavalier92. U
RL: http
://w
ww.flickr.com
/pho
tos/ca
valier92/53
6638
057/size
s/o/
licen
sed un
der: http
://creativec
ommon
s.org/licen
ses/by
-nc-nd
/2.0/
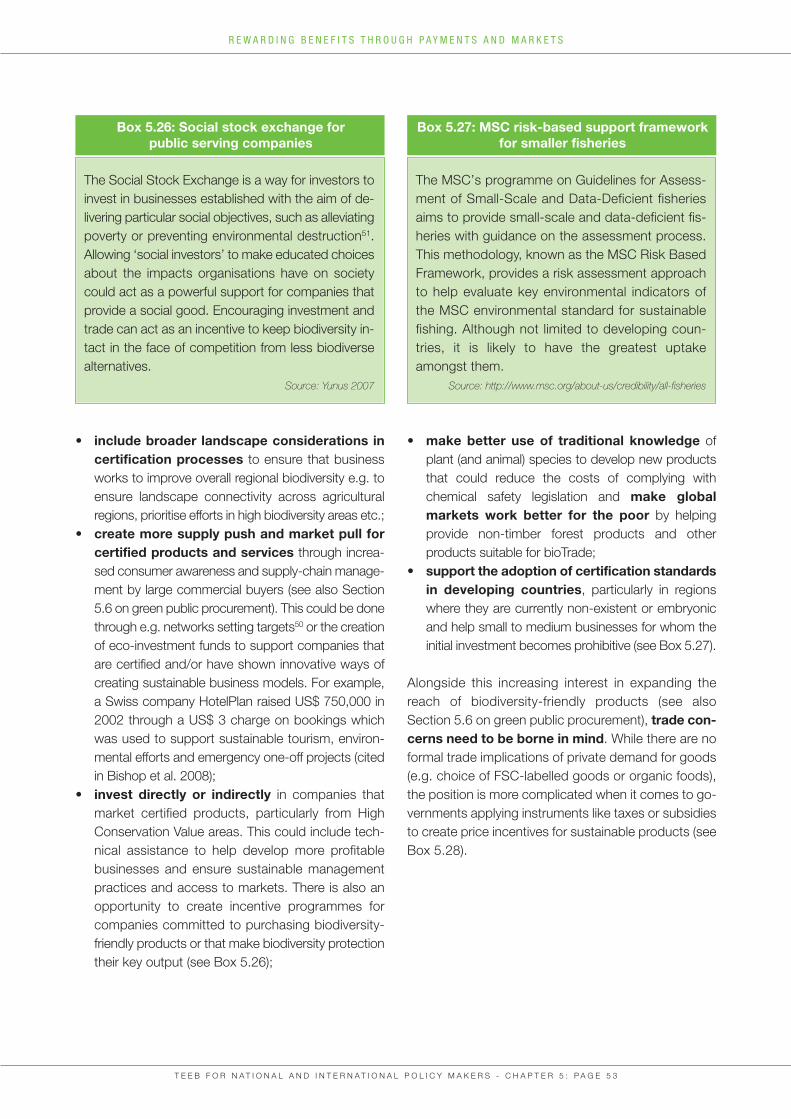
• include broader landscape considerations in certification processes to ensure that business works to improve overall regional biodiversity e.g. to ensure landscape connectivity across agricultural regions, prioritise efforts in high biodiversity areas etc.;
• create more supply push and market pull for certified products and services through increa-sed consumer awareness and supply-chain manage-ment by large commercial buyers (see also Section 5.6 on green public procurement). This could be done through e.g. networks setting targets50 or the creation of eco-investment funds to support companies that are certified and/or have shown innovative ways of creating sustainable business models. For example, a Swiss company HotelPlan raised US$ 750,000 in 2002 through a US$ 3 charge on bookings which was used to support sustainable tourism, environ-mental efforts and emergency one-off projects (cited in Bishop et al. 2008);
• invest directly or indirectly in companies that market certified products, particularly from High Conservation Value areas. This could include tech-nical assistance to help develop more profitable businesses and ensure sustainable management practices and access to markets. There is also an opportunity to create incentive programmes for companies committed to purchasing biodiversity-friendly products or that make biodiversity protection their key output (see Box 5.26);
• make better use of traditional knowledge of plant (and animal) species to develop new products that could reduce the costs of complying with chemical safety legislation and make global markets work better for the poor by helping provide non-timber forest products and other products suitable for bioTrade;
• support the adoption of certification standards in developing countries, particularly in regions where they are currently non-existent or embryonic and help small to medium businesses for whom the initial investment becomes prohibitive (see Box 5.27).
Alongside this increasing interest in expanding thereach of biodiversity-friendly products (see alsoSection 5.6 on green public procurement), trade con-cerns need to be borne in mind. While there are noformal trade implications of private demand for goods(e.g. choice of FSC-labelled goods or organic foods),the position is more complicated when it comes to go-vernments applying instruments like taxes or subsidiesto create price incentives for sustainable products (seeBox 5.28).
T E E B F O R N A T I O N A L A N D I N T E R N A T I O N A L P O L I C Y M A K E R S - C H A P T E R 5 : P A G E 5 3
R E W A R D I N G B E N E F I T S T H R O U G H P A Y M E N T S A N D M A R K E T S
Box 5.26: Social stock exchange for public serving companies
The Social Stock Exchange is a way for investors toinvest in businesses established with the aim of de-livering particular social objectives, such as alleviatingpoverty or preventing environmental destruction51.Allowing ‘social investors’ to make educated choicesabout the impacts organisations have on societycould act as a powerful support for companies thatprovide a social good. Encouraging investment andtrade can act as an incentive to keep biodiversity in-tact in the face of competition from less biodiversealternatives.
Source: Yunus 2007
Box 5.27: MSC risk-based support frameworkfor smaller fisheries
The MSC’s programme on Guidelines for Assess-ment of Small-Scale and Data-Deficient fisheriesaims to provide small-scale and data-deficient fis-heries with guidance on the assessment process.This methodology, known as the MSC Risk BasedFramework, provides a risk assessment approachto help evaluate key environmental indicators of the MSC environmental standard for sustainablefishing. Although not limited to developing coun-tries, it is likely to have the greatest uptakeamongst them.
Source: http://www.msc.org/about-us/credibility/all-fisheries
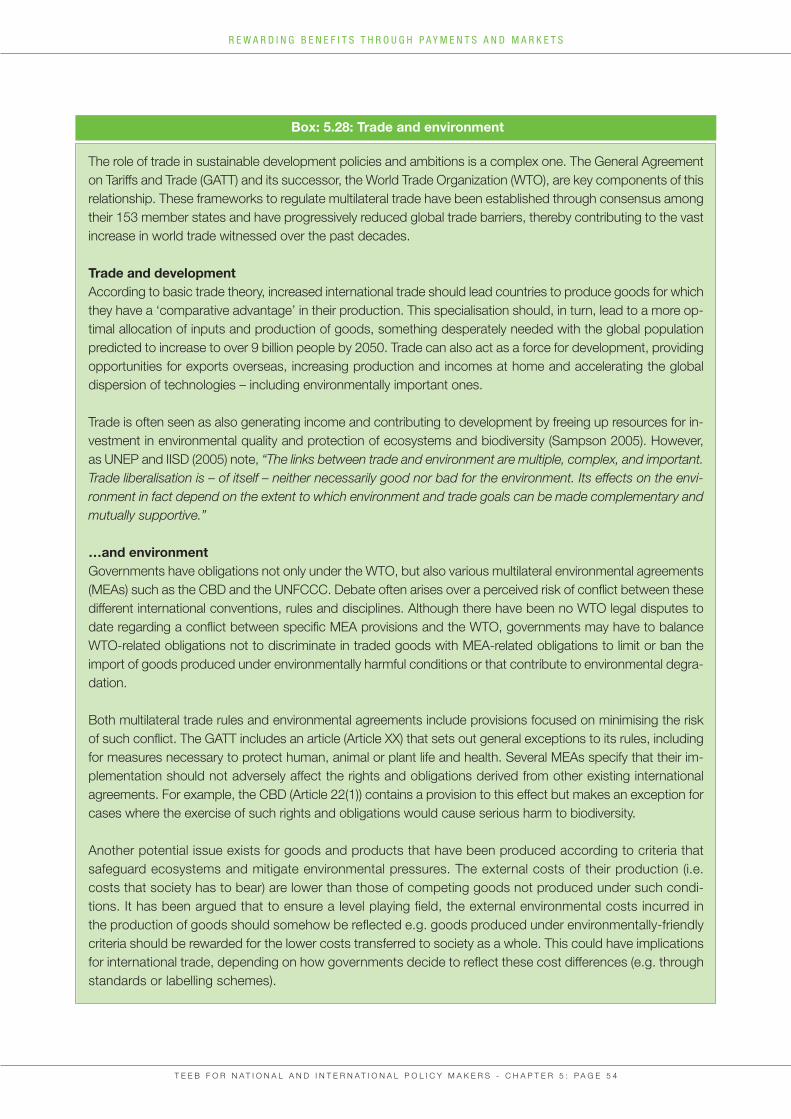
T E E B F O R N A T I O N A L A N D I N T E R N A T I O N A L P O L I C Y M A K E R S - C H A P T E R 5 : P A G E 5 4
R E W A R D I N G B E N E F I T S T H R O U G H P A Y M E N T S A N D M A R K E T S
Box: 5.28: Trade and environment
The role of trade in sustainable development policies and ambitions is a complex one. The General Agreementon Tariffs and Trade (GATT) and its successor, the World Trade Organization (WTO), are key components of thisrelationship. These frameworks to regulate multilateral trade have been established through consensus amongtheir 153 member states and have progressively reduced global trade barriers, thereby contributing to the vastincrease in world trade witnessed over the past decades.
Trade and developmentAccording to basic trade theory, increased international trade should lead countries to produce goods for whichthey have a ‘comparative advantage’ in their production. This specialisation should, in turn, lead to a more op-timal allocation of inputs and production of goods, something desperately needed with the global populationpredicted to increase to over 9 billion people by 2050. Trade can also act as a force for development, providingopportunities for exports overseas, increasing production and incomes at home and accelerating the globaldispersion of technologies – including environmentally important ones.
Trade is often seen as also generating income and contributing to development by freeing up resources for in-vestment in environmental quality and protection of ecosystems and biodiversity (Sampson 2005). However,as UNEP and IISD (2005) note, “The links between trade and environment are multiple, complex, and important.Trade liberalisation is – of itself – neither necessarily good nor bad for the environment. Its effects on the envi-ronment in fact depend on the extent to which environment and trade goals can be made complementary andmutually supportive.”
…and environment Governments have obligations not only under the WTO, but also various multilateral environmental agreements(MEAs) such as the CBD and the UNFCCC. Debate often arises over a perceived risk of conflict between thesedifferent international conventions, rules and disciplines. Although there have been no WTO legal disputes todate regarding a conflict between specific MEA provisions and the WTO, governments may have to balanceWTO-related obligations not to discriminate in traded goods with MEA-related obligations to limit or ban theimport of goods produced under environmentally harmful conditions or that contribute to environmental degra-dation.
Both multilateral trade rules and environmental agreements include provisions focused on minimising the riskof such conflict. The GATT includes an article (Article XX) that sets out general exceptions to its rules, includingfor measures necessary to protect human, animal or plant life and health. Several MEAs specify that their im-plementation should not adversely affect the rights and obligations derived from other existing internationalagreements. For example, the CBD (Article 22(1)) contains a provision to this effect but makes an exception forcases where the exercise of such rights and obligations would cause serious harm to biodiversity.
Another potential issue exists for goods and products that have been produced according to criteria thatsafeguard ecosystems and mitigate environmental pressures. The external costs of their production (i.e.costs that society has to bear) are lower than those of competing goods not produced under such condi-tions. It has been argued that to ensure a level playing field, the external environmental costs incurred inthe production of goods should somehow be reflected e.g. goods produced under environmentally-friendlycriteria should be rewarded for the lower costs transferred to society as a whole. This could have implicationsfor international trade, depending on how governments decide to reflect these cost differences (e.g. throughstandards or labelling schemes).
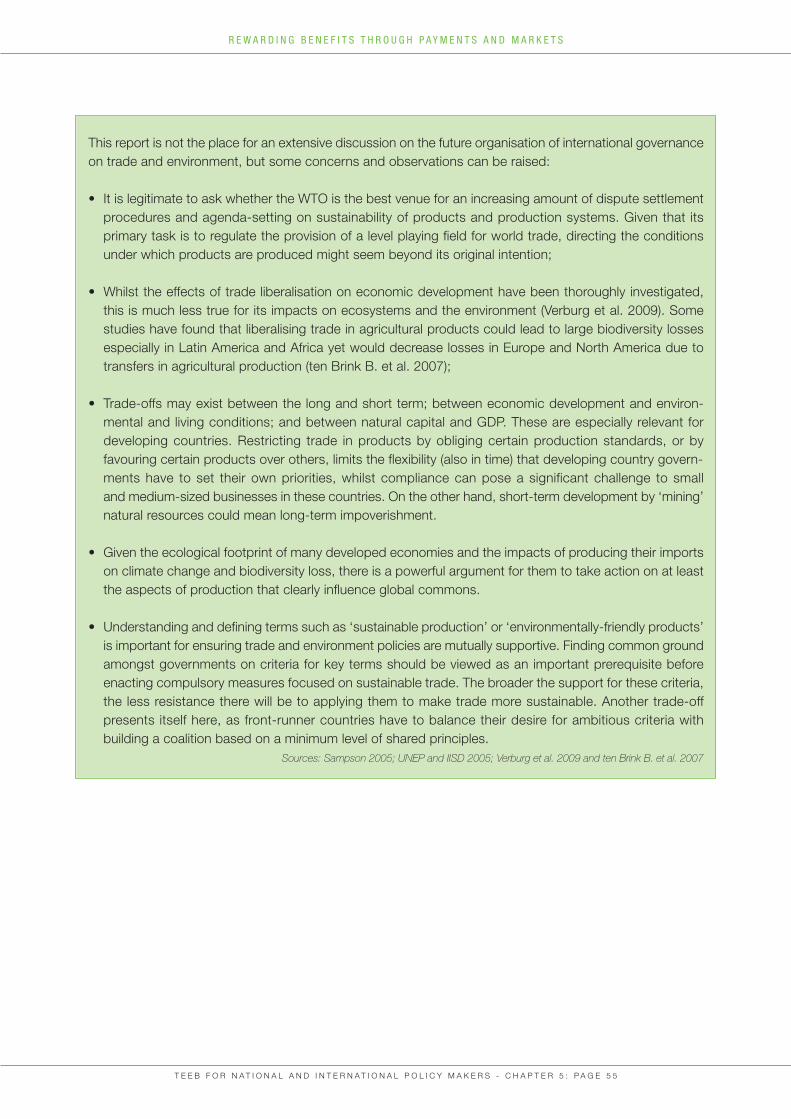
T E E B F O R N A T I O N A L A N D I N T E R N A T I O N A L P O L I C Y M A K E R S - C H A P T E R 5 : P A G E 5 5
R E W A R D I N G B E N E F I T S T H R O U G H P A Y M E N T S A N D M A R K E T S
This report is not the place for an extensive discussion on the future organisation of international governanceon trade and environment, but some concerns and observations can be raised:
• It is legitimate to ask whether the WTO is the best venue for an increasing amount of dispute settlement procedures and agenda-setting on sustainability of products and production systems. Given that its primary task is to regulate the provision of a level playing field for world trade, directing the conditions under which products are produced might seem beyond its original intention;
• Whilst the effects of trade liberalisation on economic development have been thoroughly investigated, this is much less true for its impacts on ecosystems and the environment (Verburg et al. 2009). Some studies have found that liberalising trade in agricultural products could lead to large biodiversity losses especially in Latin America and Africa yet would decrease losses in Europe and North America due to transfers in agricultural production (ten Brink B. et al. 2007);
• Trade-offs may exist between the long and short term; between economic development and environ-mental and living conditions; and between natural capital and GDP. These are especially relevant for developing countries. Restricting trade in products by obliging certain production standards, or by favouring certain products over others, limits the flexibility (also in time) that developing country govern-ments have to set their own priorities, whilst compliance can pose a significant challenge to small and medium-sized businesses in these countries. On the other hand, short-term development by ‘mining’ natural resources could mean long-term impoverishment.
• Given the ecological footprint of many developed economies and the impacts of producing their imports on climate change and biodiversity loss, there is a powerful argument for them to take action on at least the aspects of production that clearly influence global commons.
• Understanding and defining terms such as ‘sustainable production’ or ‘environmentally-friendly products’ is important for ensuring trade and environment policies are mutually supportive. Finding common ground amongst governments on criteria for key terms should be viewed as an important prerequisite before enacting compulsory measures focused on sustainable trade. The broader the support for these criteria, the less resistance there will be to applying them to make trade more sustainable. Another trade-off presents itself here, as front-runner countries have to balance their desire for ambitious criteria with building a coalition based on a minimum level of shared principles.
Sources: Sampson 2005; UNEP and IISD 2005; Verburg et al. 2009 and ten Brink B. et al. 2007
T E E B F O R N A T I O N A L A N D I N T E R N A T I O N A L P O L I C Y M A K E R S - C H A P T E R 5 : P A G E 5 6
R E W A R D I N G B E N E F I T S T H R O U G H P A Y M E N T S A N D M A R K E T S
“By giving a clear signal to all partiesinvolved in the procurement process,
public authorities can draw new environmental technologies into themarket place that in turn have the
potential to strengthen the competitiveness of European
industry.
Green Public Procurement will also help EU Member States meet obligations for energy-efficiency in
buildings, energy services and reduced CO2 emissions. The potential
of this instrument is enormous and I recommend that public administrati-
ons, at all levels, turn policy intopractice and demonstrate their willingness to 'green' Europe.”Stavros Dimas, EU Commissioner for Environment
5.6.1 OBJECTIVES AND TAKE-UP OF GPP POLICIES
Green Public Procurement (GPP) means that publicpurchasers take account of environmentalfactors when buying products, services orworks. A product or service can only qualify as‘green’ if it goes beyond what is required by lawand beyond the performance of products com-monly sold in the market. Whereas regulatory stan-dards create a minimum baseline (see Chapter 7),GPP helps to green the markets: ecologically innova-tive products can increase market share and often geta price premium.
Governments at all levels, public agencies and orga-nisations can quickly make use of GPP to reducepressures on biodiversity, drive or create markets for
GREEN PUBLIC PROCUREMENT (GPP)5.6 green products and green the supply chain. Their vastbuying power – from offices and canteens to con-struction and transportation – can directly expand themarket for products and services produced or sup-plied with less environmental impact (e.g. energy- andwater-efficient devices and building techniques, non-hazardous or bio-degradable products, organicor seasonal food, sustainably produced timber andpaper).
GPP can facilitate eco-innovation because govern-ments can take more risk when opting for new pro-ducts, assuming the role of ‘launching customer’.This may create economies of scale and help com-panies to move up the learning curve, put innovativeproducts on the market and create green-collar jobs.Less green products and services are progressivelyplaced at a significant disadvantage when competingfor government contracts.
GPP has been rapidly developing since the early2000s and is now being mainstreamed by environ-mentally ambitious governments. The EU market forgovernment purchases alone exceeds 1,500 billonEUR/year or 16% of EU Gross National Product. TheEuropean Commission has proposed to MemberStates that by 2010, 50% of their purchasing shouldbe GPP. Some have chosen to set more ambitioustargets e.g. in the Netherlands, the national govern-ment intends to purchase 100% green by 2010, withlevels of 50 to 75% for local and regional govern-ments (see Box 5.29).
Many other large economies – including Japan,China, New Zealand, Korea and the US – also haveformal policies in place that stimulate GPP (see Box5.30).
5.6.2 GPP STANDARDS, CRITERIA AND COSTING
Standards and criteria are the backbone of GPP. Pro-ducers and suppliers need to know on what basistheir products are assessed and how they can im-prove their chances of winning a contract. Making en-vironmental criteria measurable and transparent is aconsiderable challenge given the range of productsand services purchased by governments. Coopera-tion with relevant sectors and producers is needed tostrike a balance between environmental ambition andproduct availability. Training of purchasers is importantto ensure that policy goals are translated into action.
Through GPP, governments can choose to buy certi-fied or labelled products that are guaranteed to meetpurchasing criteria for a given category of products(see Box 5.31 and Section 5.5 above). Such policies
may not only have direct environmental benefits butalso increase the recognisability and diffusion of mar-ket-based labelling schemes.
Greening certain purchases may yield higher envi-ronmental benefits than others. Recent studies havefocused mainly on CO2 effects of GPP policies and notyet on direct biodiversity impacts. One found that focu-sing on construction and electricity products and ser-vices is the ‘low-hanging fruit’ for governments willing totarget CO2 emissions (PWC 2009). GPP’s specific be-nefits for biodiversity could be assessed by analysingprocurement criteria with a positive effect on biodiversityand linking this to actual contracts and amounts boughtby national/local governments. However, it is alreadyclear that creating demand for products with low envi-ronmental impacts is directly or indirectly beneficial forsoil and water quality, ecosystem integrity and long-termsustainability of natural capital.
T E E B F O R N A T I O N A L A N D I N T E R N A T I O N A L P O L I C Y M A K E R S - C H A P T E R 5 : P A G E 5 7
R E W A R D I N G B E N E F I T S T H R O U G H P A Y M E N T S A N D M A R K E T S
Box 5.29: The ‘Green-7’ in the European Union
Seven EU Member States (Austria, Denmark, Finland, Germany, Netherlands, Sweden and UK) consistentlyhave more tenders with green criteria than other Member States, supported by:• strong political drivers and/or national guidelines; • national GPP programmes in place for a number of years; • strong information sources (dedicated GPP websites containing relevant criteria/specifications); • innovative procurement techniques (most use dedicated tools e.g. life-cycle costs as an award criterion, or functional specifications/requests for environmental variants);
• application of environmental management systems by purchasing organisations. Source: Bouwer et al. 2006
Box 5.30: Strengthening regulations for GPP implementation in China
China’s Government Purchase Law took effect on 1 January 2003. Five years later, official statistics showthat about 5.1 billion Yuan (630 million US$) has been saved in government procurement costs.
The Law as enacted established a ‘preferential’ list which allowed government bodies to shop around forother products if they could justify them on cost and energy-efficiency grounds. Subsequently, the StateCouncil adopted a compulsory list (December 2007) of nine types of products, including air conditioners,fluorescent lamps, televisions, electric water heaters, computers, printers, computer monitors and waternozzles.
A new State Council Order, published on the central government's website, indicates that China will imposetougher compulsory procurement rules for energy-saving products and give priority to eco-friendly productsin future public purchases.
Source: China Daily, 14 April 2009
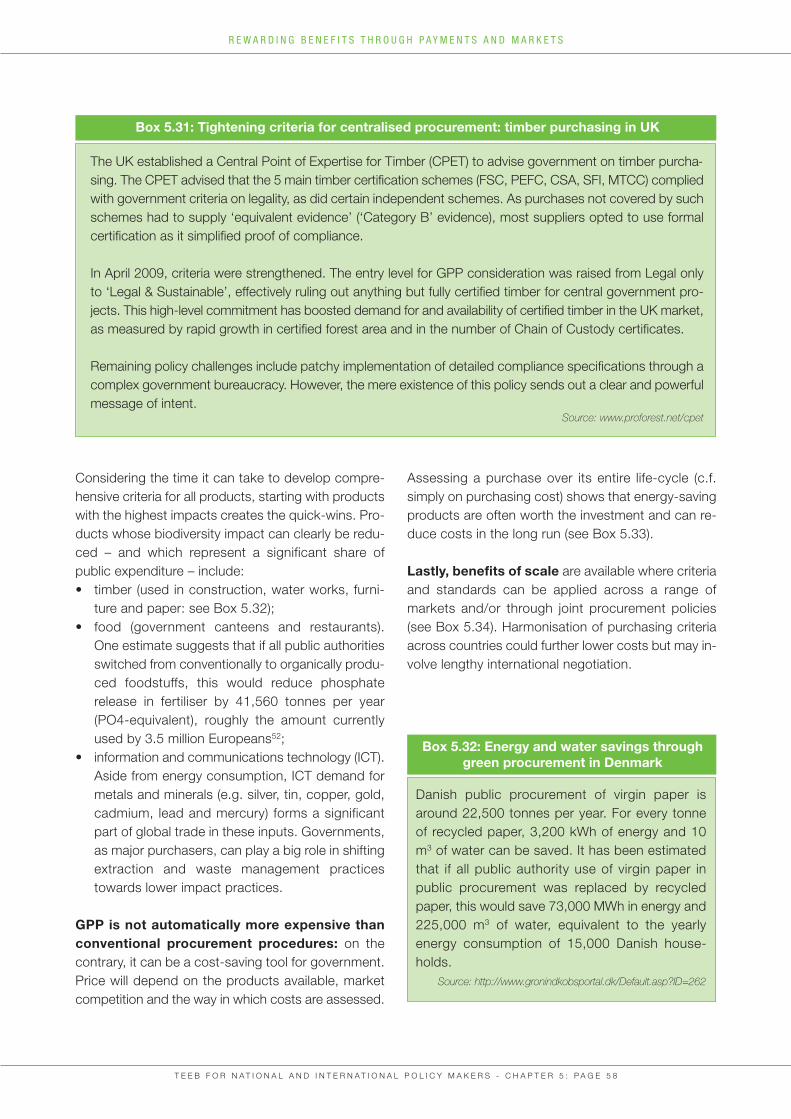
Considering the time it can take to develop compre-hensive criteria for all products, starting with productswith the highest impacts creates the quick-wins. Pro-ducts whose biodiversity impact can clearly be redu-ced – and which represent a significant share ofpublic expenditure – include:• timber (used in construction, water works, furni-
ture and paper: see Box 5.32);• food (government canteens and restaurants).
One estimate suggests that if all public authorities switched from conventionally to organically produ-ced foodstuffs, this would reduce phosphate release in fertiliser by 41,560 tonnes per year (PO4-equivalent), roughly the amount currently used by 3.5 million Europeans52;
• information and communications technology (ICT). Aside from energy consumption, ICT demand for metals and minerals (e.g. silver, tin, copper, gold, cadmium, lead and mercury) forms a significant part of global trade in these inputs. Governments, as major purchasers, can play a big role in shifting extraction and waste management practices towards lower impact practices.
GPP is not automatically more expensive thanconventional procurement procedures: on thecontrary, it can be a cost-saving tool for government.Price will depend on the products available, marketcompetition and the way in which costs are assessed.
Assessing a purchase over its entire life-cycle (c.f.simply on purchasing cost) shows that energy-savingproducts are often worth the investment and can re-duce costs in the long run (see Box 5.33).
Lastly, benefits of scale are available where criteriaand standards can be applied across a range of markets and/or through joint procurement policies(see Box 5.34). Harmonisation of purchasing criteriaacross countries could further lower costs but may in-volve lengthy international negotiation.
T E E B F O R N A T I O N A L A N D I N T E R N A T I O N A L P O L I C Y M A K E R S - C H A P T E R 5 : P A G E 5 8
R E W A R D I N G B E N E F I T S T H R O U G H P A Y M E N T S A N D M A R K E T S
Box 5.31: Tightening criteria for centralised procurement: timber purchasing in UK
The UK established a Central Point of Expertise for Timber (CPET) to advise government on timber purcha-sing. The CPET advised that the 5 main timber certification schemes (FSC, PEFC, CSA, SFI, MTCC) compliedwith government criteria on legality, as did certain independent schemes. As purchases not covered by suchschemes had to supply ‘equivalent evidence’ (‘Category B’ evidence), most suppliers opted to use formalcertification as it simplified proof of compliance.
In April 2009, criteria were strengthened. The entry level for GPP consideration was raised from Legal onlyto ‘Legal & Sustainable’, effectively ruling out anything but fully certified timber for central government pro-jects. This high-level commitment has boosted demand for and availability of certified timber in the UK market,as measured by rapid growth in certified forest area and in the number of Chain of Custody certificates.
Remaining policy challenges include patchy implementation of detailed compliance specifications through acomplex government bureaucracy. However, the mere existence of this policy sends out a clear and powerfulmessage of intent.
Source: www.proforest.net/cpet
Box 5.32: Energy and water savings throughgreen procurement in Denmark
Danish public procurement of virgin paper isaround 22,500 tonnes per year. For every tonneof recycled paper, 3,200 kWh of energy and 10m3 of water can be saved. It has been estimatedthat if all public authority use of virgin paper in public procurement was replaced by recycledpaper, this would save 73,000 MWh in energy and225,000 m3 of water, equivalent to the yearlyenergy consumption of 15,000 Danish house-holds.
Source: http://www.gronindkobsportal.dk/Default.asp?ID=262
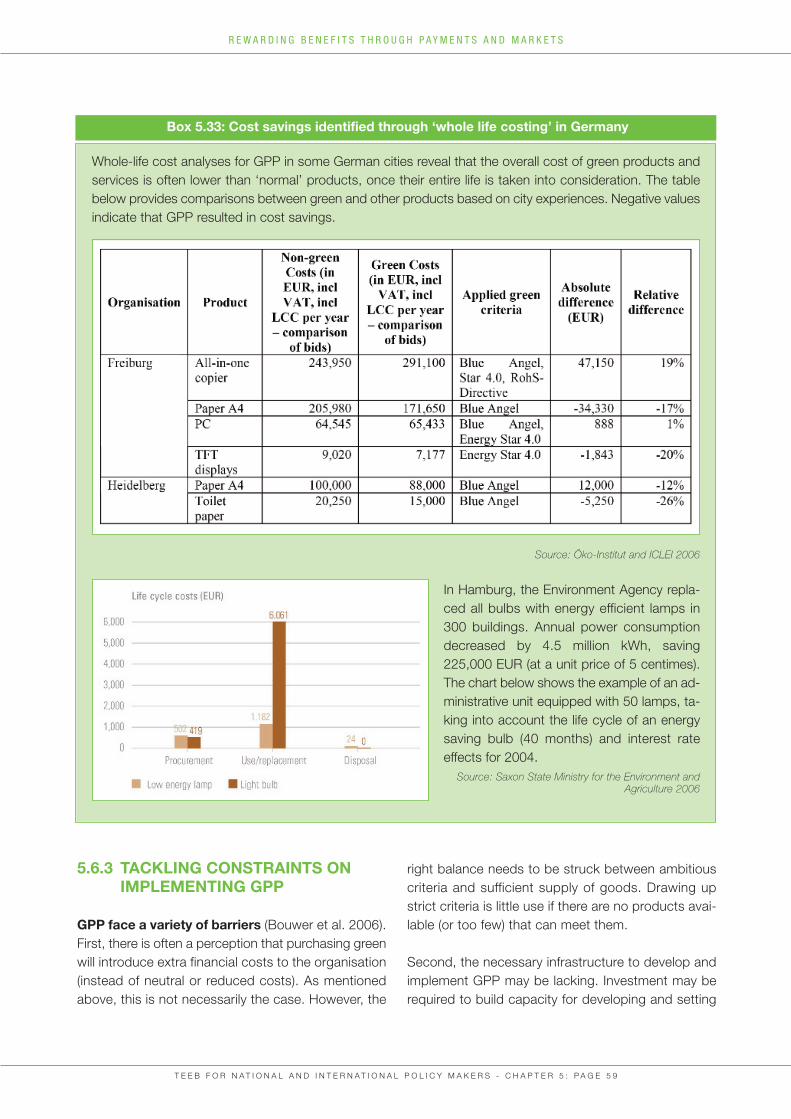
T E E B F O R N A T I O N A L A N D I N T E R N A T I O N A L P O L I C Y M A K E R S - C H A P T E R 5 : P A G E 5 9
R E W A R D I N G B E N E F I T S T H R O U G H P A Y M E N T S A N D M A R K E T S
Box 5.33: Cost savings identified through ‘whole life costing’ in Germany
Whole-life cost analyses for GPP in some German cities reveal that the overall cost of green products andservices is often lower than ‘normal’ products, once their entire life is taken into consideration. The tablebelow provides comparisons between green and other products based on city experiences. Negative valuesindicate that GPP resulted in cost savings.
Source: Öko-Institut and ICLEI 2006
In Hamburg, the Environment Agency repla-ced all bulbs with energy efficient lamps in300 buildings. Annual power consumptiondecreased by 4.5 million kWh, saving225,000 EUR (at a unit price of 5 centimes).The chart below shows the example of an ad-ministrative unit equipped with 50 lamps, ta-king into account the life cycle of an energysaving bulb (40 months) and interest rate effects for 2004.
Source: Saxon State Ministry for the Environment andAgriculture 2006
5.6.3 TACKLING CONSTRAINTS ON IMPLEMENTING GPP
GPP face a variety of barriers (Bouwer et al. 2006).First, there is often a perception that purchasing greenwill introduce extra financial costs to the organisation(instead of neutral or reduced costs). As mentionedabove, this is not necessarily the case. However, the
right balance needs to be struck between ambitiouscriteria and sufficient supply of goods. Drawing upstrict criteria is little use if there are no products avai-lable (or too few) that can meet them.
Second, the necessary infrastructure to develop andimplement GPP may be lacking. Investment may berequired to build capacity for developing and setting
criteria, to transfer these into practical tools and as-sessments and to train purchasing officers. Essentialcomponents of GPP policies include third party veri-fication of compliance and supply chain management:the more a product is a combination of inputs, themore complicated it can become to trace the impactsof inputs at their respective points of production.
Third, building support at political and/or manageriallevel is important for efficient policy implementation.A phased approach can be useful, using demonstra-ted small-scale success to leverage support for broa-der roll-out (see Box 5.35).
T E E B F O R N A T I O N A L A N D I N T E R N A T I O N A L P O L I C Y M A K E R S - C H A P T E R 5 : P A G E 6 0
R E W A R D I N G B E N E F I T S T H R O U G H P A Y M E N T S A N D M A R K E T S
Box 5.34: Joint procurement through the EcoProcurement Service Vorarlberg, Austria
Since 1998, 96 municipalities in Austria’s most western province have collaborated on GPP through a environmental association (Umweltverband Vorarlberg). In 2001, the dedicated EcoProcurement ServiceVorarlberg (ÖkoBeschaffungsService – ÖBS) was launched to:
• organise joint procurement activities on behalf of all member municipalities;• offer legal and environmental advice on GPP;• organise workshops on GPP;• develop GPP guidelines for specific product groups (office equipment and building construction);• assist municipalities in implementing sustainable construction.
A key driver was the realisation that few municipalities were applying environmental criteria, even when clearguidance was available. Joint procurement was seen as a way to combine financial and environmental benefitsand reduce costs. Substantial savings have been made in administrative costs (20-60%) and in prices paid for products (5-25%). In 2005 savings of about 286,500 EUR were achieved.
Source: http://www.iclei-europe.org/index.php?id=3490
Box 5.35: Phased implementation of green food procurement policies in Scotland
East Ayrshire, Scotland: Over four years, the local authority transformed the school meal service from astandard public service to a successful model of sustainable food provision supporting local and organic pro-ducers and promoting a healthy food culture. The pilot project (one primary school, 20,000 meals in one year)began in August 2004; the second phase from 2005 involved 10 primary schools (220,000 meals); in early2007, the scheme was expanded to include 26 primary schools and will eventually cover all 44 primary schoolsand 9 secondary schools in the county.
The scheme was conceived and managed by the East Ayrshire Council and financially supported by the ScottishExecutive initiative. It follows the ‘Food for Life’ model for sustainable food procurement which requires purchasesfor school canteens to fulfil specific criteria, including:
• at least 75% of food ingredients must be unprocessed;• at least 50% of food ingredients must be locally sourced;• at least 30% of food ingredients must be organic.
Positive environmental effects of the initiative include reducing food miles by 70%, reduced packaging wasteand saving almost £100,000 in environmental costs.
Source: Sonnino undated
Fourth, differences in criteria and/or procedures amongstdifferent countries or administrations can create extracosts and uncertainties. Some countries are moving bey-ond GPP towards ‘sustainable public procurement’(SPP) which combines environmental and social criteriain purchasing decisions. Where priorities vary, procure-ment criteria will obviously also vary between countriesor even between regional and local authorities.
In some cases, such differences have raised concernsover international competitiveness. In general terms, thereis always the risk that GPP targets and criteria put strainon free trade agreements or, in the case of the EU, the in-ternal market (e.g. criteria that give preference to nationalproducers could distort competition and create suspici-
ons of protectionism). Inclusion of social criteria could alsolead to conflicts under trade agreements (see discussionof environmental protection obligations in the context ofthe GATT/WTO in Box 5.28 and also Box 5.36 below).
GPP can yield broader results when combinedwith development cooperation efforts and whereresources for capacity building and green industrydevelopment are available. Supporting greener pro-duction in countries of origin, especially developingcountries, will open up new markets to providers, im-prove and expand a reliable supply of green productsand lower the price of green procurement.
Looking to the future:• GPP is a policy instrument with considerable
environmental benefits, given the huge markets for government purchases;
• most quantification of benefits has been based on substitution costs (e.g. replacing virgin paper with recycled), reduction in natural resource use (e.g. water) or reduced emissions (e.g. GHG, pollution). Much more work needs to be done to quantify the benefits to biodiversity from certification and label-ling programmes;
• the time is right for committed governments to upscale GPP and set national goals as first lessons have been learned and criteria are being devised and revised at an increasing rate;
• harmonisation where feasible could further lower costs and increase GPP’s attractiveness;
• transparency and clarity are important for produ-cers at all levels and sizes;
• national GPP policies can be combined with de-velopment objectives to support the development of certified markets in other countries.
T E E B F O R N A T I O N A L A N D I N T E R N A T I O N A L P O L I C Y M A K E R S - C H A P T E R 5 : P A G E 6 1
R E W A R D I N G B E N E F I T S T H R O U G H P A Y M E N T S A N D M A R K E T S
Box 5.36: Compatibility of GPP with free traderules and disciplines
The General Agreement on Tariffs and Trade (GATT)requires States to treat foreign and domestically pro-duced goods alike (Article III – the ‘national treatmentobligation’) and prohibits discrimination against im-ported goods that are ‘like’ domestically producedgoods, independent of how or where they have beenproduced.
However, Article III.8(a) excludes all products con-sumed by a government in the course of its nor-mal activity from the ‘national treatment obligation’e.g. furniture, hospital material or social housing. Thismeans that GPP policies have significant scope toexplicitly promote biodiversity-friendly purchasing –e.g. by specifying FSC timber based products – without infringing GATT provisions.
Source: FSC 2008b
Chapter 5 has looked at a range of different instruments to reward providers of benefits from ecosys-tem services or to reward products that have less impact on nature. The former included payments for en-vironmental services, mechanisms for access and benefit sharing for genetic resources as well as tax breaksand transfers. The discussion of market-based reward tools has focused on certified products and the useof public procurement to expand and green the markets.
Chapter 6 and 7 discuss closely-related tools. Chapter 6 considers the need for subsidy reform to ensure that subsidies reflect the value of biodiversity and respond efficiently to current and future priorities.Chapter 7 analyses ways in which regulation and pricing can minimise damage to natural capital:these tools form an essential foundation for the markets analysed in Chapter 5.
T E E B F O R N A T I O N A L A N D I N T E R N A T I O N A L P O L I C Y M A K E R S - C H A P T E R 5 : P A G E 6 2
R E W A R D I N G B E N E F I T S T H R O U G H P A Y M E N T S A N D M A R K E T S
Endnotes
1 The chapter uses the terms (i) environmental services, (ii) eco-
system services, and (iii) ecological services interchangeably. In par-
ticular, we usually refer to the Millennium Ecosystem Assessment
interpretation of ‘ecosystem services’ which includes products (pro-
visioning services) as well as intangible services.
2 Australian Government, Department of the Environment, Water,
Heritage and the Arts, URL: http://www.environment.gov.au/biodi-
versity/incentives/tender.html
3 United States, Department of Agriculture, http://www.nrcs.
usda.gov/programs/CRP/
4 The approach of remunerating environmental service providers
as mean to internalise environmental services is sometimes also re-
ferred to as “provider gets” approach to highlight the differing per-
spective compared to the more widespread application of the
“polluter pays” principle. As pointed out by Pagiola et al. (2005), it
does not matter -- from a pure efficiency perspective -- whether
‘‘polluter pays’’ or ‘‘provider gets’’ applies. According to the Coase
theorem, either approach will yield the same result provided that
markets are competitive, property rights are enforceable, and there
are no transaction costs (Coase 1960). In practice, however, few if
any of these conditions hold in the case of environmental service
(Pagiola et al. 2005). The argumentation is that (i)environmental ser-
vices have the peculiar characteristic of being the cumulative result
of a wide range of spatially dispersed land uses, and (ii) monitoring
the impact of many land users scattered over a landscape on the
provision of environmental services would be prohibitively costly.
The latter is partly reflected by the insufficient compliance with many
land use laws (e.g. deforestation bans, fire prohibition), especially in
developing countries where equity concerns play an additional role
and where adopting a polluter pays approach would impose the
cost of environmental protection on often poorer land users rather
on better-of service beneficiaries (Pagiola et al. 2005). These ele-
ments argue in favor of a “provider gets” approach rather than a
“polluter pays” approach when seeking to internalize the generation
or conservation of environmental services, especially in the context
of developing countries (Wertz-Kanounnikoff 2006)
5 Auctioning schemes can be designed for this.
6 See Republic of South Africa, Department: Water and Environ-
mental Affairs, http://www.dwaf.gov.za/wfw/
7 This section draws on Karousakis (2009) Promoting Biodiversity
Co-benefits in REDD. OECD Paris
8 There might of course be impacts on other ecosystems; per-
haps less species rich, but harbouring different species and con-
tributing different services. It will be important to understand
knock-on effects of choice of where to fund and hence where not
to fund.
9 Reforestation relates to areas previously covered in forest. Affo-
restation relates to areas not previously covered in forests.
10 Sub-national refers to States or provinces, or regions within
countries.
11 Monitoring emission reductions from deforestation/degradation
requires two types of data: changes in forest stocks and changes
in carbon stocks.
12 Net deforestation (net loss of forest area) is defined in the FAO
Global Forest Resources Assessment (2005) as overall deforesta-
tion minus changes in forest area due to forest planting, landscape
restoration and natural expansion of forests.
13 In REDD pilot and demonstration activities, in particular for the
‘readiness’ phase (i.e. structural and regulatory preparations and
capacity building), predominantly fund-based grants are used.
These might increasingly be accompanied by loans e.g. when the
World Bank Forest Investment Programme becomes operational).
Private sector investments might further complement the available
funding during the REDD readiness phase, if an agreement on
REDD is reached in the UNFCCC.
14 REDD credits could also be fungible with permits/allowances
under existing (domestic) emission trading schemes such as the
European Union Allowances (EUAs) under the EU Emissions Tra-
ding Scheme (EU ETS).
15 The UNFCCC REDD web-platform was created to share such
information. Due to the early stage, there is currently some informa-
tion on actions being undertaken but little on the lessons learned.
See http://unfccc.int/ methods_science/redd/items/4531.php.
16 These are in essence ‘Green Standard’ REDD credits, similar to
existing Gold Standard Clean Development Mechanism (CDM) cre-
dits which are voluntary premiums for CDM credits meeting addi-
tional sustainable development criteria.
17 More details on the agreements are available from Breibart 1997;
ICBG 1997; Mulholland and Wilman 1998; Neto and Dickson 1999;
Ten Kate and Laird 1999; Merson 2000; Artuso 2002; Greer and
Harvey 2004; and Dedeurwaerdere et al. 2005.
18 It should be noted that not all indigenous communities are keen
on pursuing this line of development as some reject the commercial
exploitation of knowledge.
19 Source suppliers covers source country governments; local ma-
nagement entities; indigenous people/communities, some of whom
have the right to grant permission for access to and use of genetic
resources and their derivatives; national organisations; and/or sta-
keholder groups with access to traditional knowledge. This still lea-
ves open, however, the rights and equity issues. Even if we take the
suppliers to be national governments that does not infer that all ju-
risdictions have wholly equitable or indeed well defined rights of
sourcing and supply. This is itself a cause of much concern. For
more details see Ding et al 2007.
20 Note that ‘buyers’ can also be intermediaries, such a local re-
search institutes and universities.
21 One reviewer of this chapter noted that asset specificity may not
apply so forcefully to bioprospecting, arguing that wild and so far
undiscovered genetic resources collected for screening purposes
usually have no specificity. A provider country can offer their resour-
ces to any company interested in the use and companies can ap-
proach any provider country.
22 For a further discussion of how transaction costs economics
apply to bioprospecting, see Gehl Sampath 2005,
23 For further discussion on the constraints on equitable sharing of
benefits and related economic issues, see OECD (2003) and Ri-
cherhagen and Holm-Mueller (2005).
24 Suggestion made by Professor Vogel, University of Costa Rica
(http://ictsd.net/i/environment/31517).
25 Voluntary approaches are in place from local to international
level. See e.g. for municipalities in Australia http://www.logan.qld.
gov.au/LCC/logan/environment/biodiversity/cip/voluntaryconserva-
tionagreements.htm and at international level, the FAO Code of
Conduct for Responsible Fisheries (http://www.fao.org/docrep/005/
v9878e/v9878e00.HTM) and FAO Code of Practice for Forest Har-
vesting in Asia-Pacific (http://www.fao.org/docrep/004/AC142E/
AC142E00.HTM). For further discussion, see Menzies 2002 in ten
Brink 2002.
26 The ICMS is the tax on sale of goods and services which ope-
rates at state level in Brazil.
27 For example, see UNECE 2006 on forests
http://www.unece.org/timber/docs/fpama/2006/fpamr2006.pdf
and www.msc/org/aboutus/10 for fisheries.
28 International Tropical Timber Organization: http://www.itto.int/.
29 http://www.fao.org/docrep/005/v9878e/v9878e00.
HTM#2
30 http://www.seafoodchoices.com/home.php
31 http://assets.panda.org/downloads/fortuna.pdf
32 http://www.msc.org/newsroom/msc-news/archive-
2009/sustained-growth-of-msc-labelled-products
33 http://www.msc.org/documents/msc-brochures/ MSC-Fishe-
riesCommitments-Aug09-WEB.pdf
34 http://www.worldagroforestry.org/af/
35 Figures from the new World of Organic Agriculture: Statistics and
Emerging Trends 2008. cited on their website:
http://www.ifoam.org/press/press/2008/Global_Organic_Agricul-
ture_Continued_Growth.php
36 See Organic Monitor research news http://www.organicmoni-
tor.com/r3001.htm
37 http://www.sustainablefarmcert.com/
38 http://www.rainforest-alliance.org/agriculture. cfm?id= main
39 http://www.globalgap.org/cms/front_content.php?
idart=3&idcat=9&lang=1
40 http://www.ecoagriculture.org/index.php
41 http://www.wttc.org/
42 http://www.mekongtourism.org/site/uploads/media/
IETS_Ecotourism_Fact_Sheet_-_Global_1__01.pdf
43 ht tp:/ /www.ecotour ism.org/s i te/c.orLQKXPCLmF/
b.4835303/k.BEB9/What_is_Ecotourism__The_International_Eco-
tourism_Society.htm (source of citation from Mastny 2001).
T E E B F O R N A T I O N A L A N D I N T E R N A T I O N A L P O L I C Y M A K E R S - C H A P T E R 5 : P A G E 6 3
R E W A R D I N G B E N E F I T S T H R O U G H P A Y M E N T S A N D M A R K E T S
44 http://www.mekongtourism.org/site/uploads/media/
IETS_Ecotourism_Fact_Sheet_-_Global_1__01.pdf
45 http://www.wttc.org/
46 http://www.organicmonitor.com/r1709.htm
47 See What Do We Know About the Costs and Benefits of Tropical
Timber Certification? (2004) Timbmet Group Ltd: Oxford.
48 Ibid.
49 Plantations are usually more productive than natural forests, and
some argue that the world’s timber and fibre needs should be met
from plantations, thereby relieving pressure on natural forest to pro-
vide the same material.
50 e.g. through the Global Forest and Trade Network (GFTN), bro-
kered by WWF, consuming and producing companies sign up to
the network and report annually to the WWF on progress against
individually agreed targets in return for use of its logo for PR purpo-
ses (www.gftn.panda.org/about_gftn/)
51 http://www.socialstockexchange.eu/why/default.html
52 http://ec.europa.eu/environment/gpp/index_en.htm.
T E E B F O R N A T I O N A L A N D I N T E R N A T I O N A L P O L I C Y M A K E R S - C H A P T E R 5 : P A G E 6 4
R E W A R D I N G B E N E F I T S T H R O U G H P A Y M E N T S A N D M A R K E T S
REFERENCES
Angelsen A. (2008) Moving ahead with REDD – Issues, Optionsand Implications, Center for International Forestry Research.CIFOR, Bogor.
Angelsen, A. and Wertz-Kanounnikoff, S. (2008) What are the keydesign issues for REDD and the criteria for assessing options? inAngelsen A. (ed), Moving ahead with REDD – Issues, Options andImplications. CIFOR, Bogor.
Artuso, A. (2002) Bioprospecting, benefit sharing, and biotechno-logical capacity building. World Development 30(8): 1355-1368.
Asquith, N et al. (2008) Selling two environmental services: In-kindpayments for bird habitat and watershed protection in Los Negros,Bolivia. Ecological Economics 65(4): 675-684. URL:http://www.sciencedirect.com/science?_ob=ArticleURL&_udi=B6VDY-4RW4S2G-1&_user=10&_rdoc=1&_fmt=&_orig=search&_sort=d&view=c&_acct=C000050221&_version=1&_urlVer-sion=0&_userid=10&md5=da8c60544f71328bcdbf180faa3ad07d (last access Nov 6, 2009).
Barbier, E.B. and Aylward, B. (1996) Capturing the PharmaceuticalValue of Biodiversity in a Developing Country. Environmental andResource Economics 8: 157-181.
Bassi, S. et al. (2008) Agriculture and Environment: Payments forEnvironmental Services (PES). Presentation at the conference onCommon Agriculture Policy and its Impacts in Malta (Victoria,Gozo, 7-9 November 2008).
Baylis, K.; Rausser, G., and Simon, L. (2004) Agri-environmentalprograms in the United States and European Union. In. Anania,G.; Bohman, M.E.; Carter, C.A. and McCalla, A.F. (eds.) Agricul-tural policy reform and WTO: Where are we heading? (pp. 210–233). Cheltenham, UK: Edward Elgar.
Bengtsson, J.; Ahnström, J. and Weibull, A. (2005) The effects oforganic agriculture on biodiversity and abundance: a meta-analy-sis, Journal of Applied Ecology 42: 261-269.
Bennett, M. (2008) China’s sloping land conversion programme:Institutional innovation or business as usual? Ecological Econo-mics 65(4): 699-711.
Bishop, J.; Kapila, S.; Hicks, F.; Mitchell, P. and Vorhies, F. (2008)Building Biodiversity Business. Shell International Limited and theInternational Union for Conservation of Nature: London, UK, andGland, Switzerland. 159 pp.
Bosshard, A.; Reinhard, B.R. and Taylor S. (eds.) (2009) Guide toBiodiversity and Landscape Quality in Organic Agriculture. IFOAM,Bonn (D), ISBN 978-3-940946-11-9, 185 pp.
Bouwer M; Jonk M.; Berman T.; Bersani R.; Lusser H.; Nappa V.;Nissinen A.; Parikka K.; Szuppinger P. and Viganò C. (2006) GreenPublic Procurement in Europe 2006 – Conclusions and recom-mendations. Virage Milieu & Management bv, Korte Spaarne 31,2011 AJ Haarlem, the Netherlands. URL: http://europa.eu.int/comm/environment/gpp (last access Dec 9, 2009).
Boyd, J.; Caballero, K. and Simpson, R.D. (2000) The Law andEconomics of Habitat Conservation: Lessons From an Analysis ofEasement Acquisitions. Stanford Environmental Law Journal19(1): 393-412.
Bracer, C.; Scherr, S.; Molnar, A.; Sekher, M.; Ochieng, B.O. andSriskanthan, G. (2007) Organization and Governance for FosteringPro-Poor Compensation for Ecosystem Services. CES ScopingStudy Issue Paper No.4, ICRAF Working Paper No. 39, WorldAgroforestry Center, Nairobi, Kenya.
Brand, D. (2002) Investing in the Environmental Services of Aust-ralian Forest. as in Pagiola, S., Bishop, J. and Landell-Mills, N.(eds) Selling Forest Environmental Services: Market-Based Me-chanisms for Conservation and Development. London, UK.Earthscan Publications.
Bräuer et al. (2006) The Use of Market Incentives to Preserve Bio-diversity. Final Report, Project under Framework contract for eco-nomic analysis ENV.G.1/FRA/2004/0081, Berlin.
CBD (1992) Convention on Biological Diversity Convention Text.URL: http://biodiv.org/doc/legal/cbd-en.pdf, (last access Nov 9,2009)
Christ, C.; Hillel, O.; Matus, S. and Sweeting, J. (2003) Tourismand Biodiversity: Mapping tourism’s global footprint. ConservationInternational, Washington, D.C. 20036.
Coase, R.H. (1960) The Problem of Social Cost. Journal of Lawand Economics 3(1): 1–44.
Costello, C. and Ward, M. (2006) Search, bioprospecting and bio-diversity conservation. Journal of Environmental Economics andManagement 52(3): 615-626.
Craft, A. B. and Simpson, R. D. (2001) The value of biodiversity inpharmaceutical research with differentiated products. Environmen-tal and Resource Economics 18 (1): 1-17.
De Melo, J. J. and Prates, J. (2007) EcoTerra Model – Economicinstruments for sustainable land use management in Portugal.Paper presented at the 7th International Conference of the Euro-pean Society for Ecological Economics. Leipzig, June 5–8.
de Groot, R.; Stuip, M.; Finlayson, M. and Davidson, N. (2006) Va-luing wetlands: Guidance for valuing the benefits derived from wet-land ecosystem services. Ramsar Technical Report No. 3, CBDTechnical Series No. 27, URL: http://www.cbd.int/doc/publicati-ons/cbd-ts-27.pdf (last access June 5, 2009).
Dedeurwaerdere, T. (2005) From bioprospecting to reflexive go-vernance. Ecological Economics 53(4): 473-491.
Dedeurwaerdere, T.; Krishna, V. and U. Pascual (2005) Biodisco-very and Intellectual Property Rights: A Dynamic Approach toEconomic Efficiency'. Department of Land Economy Environmen-tal Economy and Policy Research Working Papers, 13.2005, Uni-versity of Cambridge.
T E E B F O R N A T I O N A L A N D I N T E R N A T I O N A L P O L I C Y M A K E R S - C H A P T E R 5 : P A G E 6 5
R E W A R D I N G B E N E F I T S T H R O U G H P A Y M E N T S A N D M A R K E T S
T E E B F O R N A T I O N A L A N D I N T E R N A T I O N A L P O L I C Y M A K E R S - C H A P T E R 5 : P A G E 6 6
R E W A R D I N G B E N E F I T S T H R O U G H P A Y M E N T S A N D M A R K E T S
Ding, H.; Nunes, P.A.L.D. and L. Onofri (2007) An EconomicModel for Bioprospecting Contracts. Fondazioni Eni Enrico Mattei- Note di Lavoro, 102.07, Fondazioni Eni Enrico Mattei, Milan, Italy.
EC (Commission of the European Communities) (2007) GreenPaper on market-based instruments for environment and relatedpolicy purposes. COM (2007) 140 final, Brussels, 28.3.2007.
EC (Commission of the European Communities) (2009) Contribu-ting to Sustainable Development: The role of Fair Trade and non-governmental trade-related sustainability assurance schemes.Communication COM(2009) 215 final, Brussels.
Eliasch, J. (2008) climate change: financing global forests. The Eli-asch review. UK. url: http://www.occ.gov.uk/activities/eliasch/full_report_eliasch_review(1).pdf (last access Nov 6, 2009).
Emerton, L.; Bishop, J. and Thomas, L. (2006) Sustainable Finan-cing of Protected Areas: A global review of challenges and opti-ons. IUCN, Gland, Switzerland and Cambridge, UK.
FAO – Food and Agriculture Organisation (2000) Global forest re-source Assessment. Food and Agriculture Organization of the Uni-ted Nations, Rome, available at: ftp://ftp.fao.org/docrep/fao/003/y1997E/frA%202000%20Main%20report.pdf (last access Oct 26,2009).
Ferraro, P (2007) Performance Payments for Sea Turtle Nest Pro-tection in Low-income Nations: a case study from Tanzania. URL:http://www2.gsu.edu/~wwwcec/docs/doc%20updates/NOAA%20Paper%20TZ%20Final%20Draft%20June%202007.pdf (lastaccess Nov 9, 2009)
Ferraro, P.J. and Kiss, A. (2002) Direct Payments to Conserve Bio-diversity. Science. 298: 1718-19.
Forest Industries Intelligence Limited (2009) The EU Market for“Verified Legal” and “Verified Legal and Sustainable” Timber Pro-ducts. UK Timber Trade Federation and Department for Interna-tional Development.
Fourli M. (1999) Compensation for damage caused by bears andwolves in the European Union. Office for Official Publications ofthe European Communities, Luxembourg.
Frinn, R.D. (2003) Bioprospecting – Why Is It So Unrewarding?Biodiversity and Conservation 12: 207–216.
Frost, P and Bond, I (2008) The CAMPFIRE programme in Zim-babwe: Payments for wildlife services. Ecological Economics65(4): 776-787.
FSC – Forest Stewardship Council (2008a) Facts and figures onFSC growth and markets: Info Pack. FSC Presentation 28 Febru-ary 2008, URL: http://www.fsc.org/fileadmin/web data/public/do-cument_center/powerpoints_graphs/facts_figures/2008-01-01_FSC_market_info_pack_-_FINAL.pdf (last access May 15, 2009).
FSC – Forest Stewardship Council (2008b) Specifying FSC in Pu-blic Procurement – In Line with WTO Rules. FSC Factsheet Octo-ber 2008. URL: www.fsc.org/fileadmin/web.../Procurement_and_WTO-EN.pdf (last access Dec 6, 2009).
FSC - Forest Stewardship Council (2009) Facts and figures, avai-lable at: http://www.fsc.org/facts-figures.html (last access June15, 2009).
Gatti, J.; Goeschl, T.; Groom, B. and Swanson, T. (2004) The Bio-diversity Bargaining Problem. CWPE 0447, University of Cam-bridge.
–Gibson, R.H.; Pearce, S.; Morris, R.J., Symondson, W.O.C. andMemmott, J. (2007) Plant diversity and land use under organicand conventional agriculture: a whole-farm approach. Journal ofApplied Ecology 44: 792–803.
Global Canopy Programme (2008) From REDD to PINC, Briefingnote #1. December 2008.
Global Insight (2007) A Study of the European Cosmetics Industry.Prepared for: European Commission, Directorate General for En-terprise and Industry, URL: http://ec.europa.eu/enterprise/newsroom/cf/document.cfm?action=display&doc_id=4561&user-service_id=1 (last access Dec 9, 2009).
Greer, D. and Harvey, B. (2004). Blue Genes: Sharing and Con-serving the World's Aquatic Biodiversity. Earthscan/IDRC.
Grieg-Gran, M. (2000) Fiscal Incentives for Biodiversity Conserva-tion: The ICMS Ecológico in Brazil. Discussion Paper 00-01 IIEDDecember 2000. London.
Gutman, P. (2006) PES: A WWF Perspective. Presentation givenat the Workshop on: Conservation Finance, Global BiodiversityForum, Curitiba, Brazil, March 25th 2006, URL:http://assets.panda.org/downloads/peswwfmpo.pdf (last accessNov 11, 2009).
Hanski, I.; Koivulehto, H.; Cameron, A. and Rahagalala, P. (2007)Deforestation and apparent extinctions of endemic forest beetlesin Madagascar. Biol. Lett. 22 June 2007 3(3): 344-347, URL:http://rsbl.royalsocietypublishing.org/content/3/3/344.full.pdf+html (last access Dec 4, 2009).
ICBG (1997) Report of a Special Panel of Experts on the Interna-tional Cooperative Biodiversity Groups (ICBG). URL:http://www.fic.nih.gov/programs/finalreport.html, (last access onNov 9, 2009).
IPCC – Intergovernmental Panel on Climate Change (2007a) Cli-mate Change 2007: Synthesis report. Intergovernmental Panel onClimate Change Fourth Assessment Report, p. 70, 1-72.
IPCC – Intergovernmental Panel on Climate Change (2007b) Cli-mate Change 2007: the physical science basis. Contribution ofworking group I to the fourth assessment report of the Intergo-vernmental Panel on Climate Change. 2007, Cambridge, UK,Cambridge University Press.
IPCC – Intergovernmental Panel on Climate Change (2007c) Cli-mate Change 2007: Mitigation of Climate Change, Contributionof working group III to the fourth assessment report of the Inter-governmental Panel on Climate Change. 2007, Cambridge, UK,Cambridge University Press.
ITTO – International Tropical Timber Organization (2008) Develo-ping forest certification towards increasing the comparability andacceptance of forest certification systems worldwide. TechnicalSeries 29, URL: http://illegal-logging.info/uploads/TS29.pdf (lastaccess Nov 10, 2009).
Johnstone, N. and Bishop, J. (2007) Private Sector Participationin Natural Resource Management: What Relevance in DevelopingCountries? International Review of Environmental and ResourceEconomics 1: 67–109.
Kapos, V.; Ravilious, C.; Campbell, A.; Dickson, B.; Gibbs, H. K.;Hansen, M. C.; Lysenko, I.; Miles, L.; Price, J.; Scharlemann, J. P.W. and Trumper K. C. (2008) Carbon and biodiversity: a demons-tration atlas. UNEP-WCMC, Cambridge, UK.
Karousakis, K (2009) Promoting Biodiversity Co-benefits in REDD.Organisation for Economic Development and Co-operation –OECD Paris.
Karousakis, K and Corfee-Morlot, J. (2007) Financing Mechanismsto Reduce Emissions from Deforestation: Issues in Design and Im-plementation. Organisation for Economic Development and Co-operation – OECD Paris.
Kindermann, G.; Obersteiner, M.; Sohngen, B.; Sathaye, J.; An-drasko, K.; Rametsteiner, E.; Schlamadinger, B.; Wunder, S. andBeach, R. (2008) Global cost estimates of reducing carbon emis-sions through avoided deforestation. PNAS.
Köllner, T.; Schelske, O. and Seidl, I. (2002) Integrating biodiversityinto intergovernmental fiscal transfers based on cantonal bench-marking: a Swiss case study. Basic and Applied Ecology 3: 381391.
Land Trust Alliance (2006) 2005 National land trust census. LandTrust Alliance, Washington, D.C. URL: http://www.sfbayjv.org/tools/ConservationEasementsBiodiversityProtectionandPriva-teUse.pdf (last access Dec 6, 2009).
Leverington, F.; Hockings, M. and Lemos Costa, K. (2008) Ma-nagement Effectiveness Evaluation in Protected Areas: A globalstudy. The University of Queensland, IUCN, WWF, The NatureConservancy, Gatton, Queensland.
Lindsey, R. (2007) Tropical Deforestation. NASA Earth Observa-tory, 30 March 2007, URL: http://earthobservatory.nasa.gov/Fea-tures/Deforestation/ (last access Nov 12, 2009).
MA – Millennium Ecosystem Assessment (2005a) Ecosystemsand human well-being: biodiversity synthesis. World ResourcesInstitute, Washington, D.C.
MA – Millennium Ecosystem Assessment (2005b) Ecosystemsand Human Well-being: General Synthesis. World Resources In-stitute, Washington, D.C.
MacMillan, D.; Hanley N. and Daw M. (2004) Costs and benefitsof wild goose conservation in Scotland,. Biological Conservation119:475–485.
MAFF – Forestry Agency, Ministry of Agriculture, Forestry and Fis-heries of Japan (2008) Annual Report on Trends in Forests andForestry.
Marengo, J. A.; Soares, W. R.; Saulo, C. and Nicolini, M. (2004)Climatology of the low-level jet east of the Andes as derived fromthe NCEP-NCAR reanalyses: Characteristics and temporal varia-bility. Journal of Climate 17: 2261-2280.
Mastny, L. (2001) Worldwatch Paper #159: Travelling Light: NewPaths for International Tourism. ISBN: 1-878071-61-0 88 pagesp. 37. cited here http://www.mekongtourism.org/site/uploads/media/IETS_Ecotourism_Fact_Sheet_-_Global_1__01.pdf (lastaccess Dec 13, 2009).
May, P. H.; Veiga Neto, F.; Denardin, V. and Loureiro, W. (2002)Using fiscal instruments to encourage conservation: Municipal re-sponses to the “ecological” value-added tax in Paraná and MinasGerais, Brazil. In Pagiola, S.; Bishop, J. and Landell-Mills, N (eds)Selling forest environmental services: Market-based mechanismsfor conservation and development. London: Earthscan, 173–199.
MEFT – Ministère de l'Environnement des Forêts et du Tourisme ;USAID - United States Agency for International Development andCI - Conservation International (2009) Evolution de la couverturede forêts naturelles à Madagascar, 1990-2000-2005. Conserva-tion International, Antananarivo.
Menzies D (2002) Conflict or Collaboration? The New ZealandForest Accord. Chapter 5 in ten Brink P (ed) Voluntary Environ-mental Agreements: Process and Practice, and Future Trends.Greenleaf Publishing, March 2002.
Meridian Institute (2009) Reducing Emissions from Deforestationand Forest Degradation (REDD): An Options Assessment Report.Prepared for the Government of Norway, by Angelsen, A.; Brown,S.; Loisel, C.; Peskett, L.; Streck, C. and Zarin. D, URL:http://www.REDD-OAR.org (last access Nov 10, 2009).
Merson, J. (2000) Bio-prospecting or bio-piracy: intellectual pro-perty rights and biodiversity in a colonial and postcolonial context.Osiris 15: 282-296.
Meyer, C. and Schweppe-Kraft, B. (Eds.) (2006) Integration öko-logischer Aspekte in die Finanzpolitik. BfN-Skripten, 167, Bonn.
Mulholland D.M. and Wilman E.A. (1998) Bioprospecting and Bio-diversity Contracts. Working Papers in Ecological Economics9806, Australian National University, Centre for Resource and En-vironmental Studies, Ecological Economics Program.
Muñoz-Piña, C.; Guevara, A.; Torres, J.M. and Braña, J. (2007)Paying for the Hydrological Services of Mexico’s Forests: Analysis,Negotiation, and Results. Ecological Economics 65(4); 725-736.
Nepstad, D.; Soares Filho, B.; Merry, F.; Moutinho, P.; Rodrigues,H.O.; Bowman, M.; Schwartzman, S.; Almeida, O. and Rivero, S.(2007) The Costs and Benefits of Reducing Carbon Emissionsfrom Deforestation and Forest Degradation in the Brazilian Ama-zon. Woods Hole Research Center, Woods Hole, Massachusetts,USA. URL: http://www.whrc.org/policy/BaliReports/assets/WHRC_Amazon_REDD.pdf (last access Dec 9, 2009).
T E E B F O R N A T I O N A L A N D I N T E R N A T I O N A L P O L I C Y M A K E R S - C H A P T E R 5 : P A G E 6 7
R E W A R D I N G B E N E F I T S T H R O U G H P A Y M E N T S A N D M A R K E T S
Neto, R.B. and Dickson, D. (1999) $3m deal launches major huntfor drug leads in Brazil. Nature 400: 302.
Niedersächsisches Umweltministerium, Niedersächsisches Lan-desamt für Ökologie (2002) 10 Jahre Trinkwasserschutz in Nie-dersachsen. Modell der Kooperation zwischen Landwirtschaftund Wasserwirtschaft. Hannover (Umweltministerium). URL:http://cdl.niedersachsen.de/blob/images/C1202143_L20.pdf(last access Sept 9, 2009).
OECD – Organisation for Economic Development and Co-opera-tion (1999) Handbook on Incentive Measures for Biodiversity. Or-ganisation for Economic Development and Co-operation, Paris.
OECD – Organisation for Economic Development and Co-opera-tion (2003) Economic Issues in Access and Benefit Sharing of Ge-netic Resources: A Framework for Analysis. Paris / Working Partyon Global and Structural Policies / Working Group on EconomicAspects of Biodiversity.
OECD – Organisation for Economic Development and Co-opera-tion (2005) Environmental Fiscal Reform for Poverty Reduction.Organisation for Economic Development and Co-operation, Paris.
OECD – Organisation for Economic Development and Co-opera-tion (2009) International Financing for Biodiversity Conservation:An Overview of Innovative Approaches and Persistent Challenges.Organisation for Economic Development and Co-operation, Paris.
Öko-Institut and ICLEI (2006) Costs and Benefits of Green PublicProcurement in Europe. Final report to DG Environment of the Eu-ropean Commission. Service contract number: DG ENV.G.2/SER/2006/0097r, Freiburg, 26 July 2007.
Olsen, N. and Bishop, J. (2009) The Financial Costs of REDD: Evi-dence from Brazil and Indonesia. IUCN: Gland.
Pagiola, S.; Landell-Mills, N.; and Bishop, J. (2002) Making Mar-ket-based Mechanisms Work for Forests and People in Pagiola,S.; Bishop, J. and Landell-Mills, N. (eds.) Selling Forest Environ-mental Services: Market-Based Mechanisms for Conservation andDevelopment. Earthscan: London.
Pagiola, S. (2003) Paying for Water Services. World Conservation,No. 1, World Bank, Washington, D.C.
Pagiola, S. (2008) Payments for environmental services in CostaRica. Ecological Economics 65(4): 712–725.
Parker, C.; Mitchell, A.; Trivedi, M. and Mardas, N. (2009) The LittleREDD+ Book. Global Canopy Programme, URL: http://www.glo-balcanopy.org/themedia/file/PDFs/LRB_lowres/lrb_en.pdf (last ac-cess Nov 10, 2009).
Perrot-Maître, D. (2006) The Vittel payments for ecosystem ser-vices: A “perfect” PES case? International Institute for Environ-ment and Development, London.
PNAAPD (2007) Plan national d’action pour des achats publicsdurables. Ministère de l’Ecologie, de l’Energie, du Développementdurable et de la Mer, Paris, URL: http://www.ecologie.gouv.fr/IMG/pdf/PNAAPD.pdf (last access Nov 12, 2009).
Porras I.; Grieg-Gran, M. and Neves, N. (2008) All that glitters: Areview of payments for watershed services in developing coun-tries. Natural Resource Issues No. 11. International Institute forEnvironment and Development. London, UK.
Portela, R. and Rodriguez, M.C. (2008) Environmental servicespayment in Costa Rica. unpublished manuscript. Conservation In-ternational.
PWC - Price Waterhouse Coopers (2009) Collection of StatisticalInformation on Green Public Procurement in the EU. London.
Rausser, G.C. and Small, A.A. (2000) Valuing Research Leads:Bioprospecting and the Conservation of Genetic Resources. UCBerkeley: Berkeley Program in Law and Economics. URL:http://escholarship.org/uc/item/4t56m5b8 (last access Dec 9,2009).
Richerhagen, C. and Holm-Mueller, K. (2005) The effectiveness ofaccess and benefit sharing in Costa Rica: implications for nationaland international regimes. Ecological Economics 53: 445-460.
Ring, I. (2002) Ecological public functions and fiscal equalisationat the local level in Germany. Ecological Economics 42: 415-427.
Ring, I. (2008a) Compensating municipalities for protected areas:Fiscal transfers for biodiversity conservation in Saxony, Germany.GAIA 17(S1): 143-151.
Ring, I. (2008b): Integrating local ecological services into intergo-vernmental fiscal transfers: the case of the ecological ICMS in Bra-zil. Land use policy 25(4), 485-497.
Rissman, A.R.; Lozier, L.; Comendant, T.; Kareiva, P.; Kiesecker,J.M.; Shaw, M.R. and Merenlender, A.M. (2007) Conservation Ea-sements: Biodiversity Protection and Private Use. ConservationBiology 21(3): 709–718.
Sampson, G.P. (2005) The World Trade Organization and sustai-nable development. United Nations University.
Sarr, M. and T. Swanson (2007) The Economics of IPR for GeneticResources and Traditional Knowledge: North-South Cooperationin Sequential R&D. mimeo., University College London.
Saxon State Ministry for the Environment and Agriculture (2006)Green procurement is simpler than you think. Dresden. URL:www.smul.sachsen.de/umwelt/.../SMUL_BR_Beschaffung_engl.pdf (last access Dec 6, 2009).
SCBD – Secretariat of the Convention on Biological Diversity(2008) Access and Benefit-Sharing in Practice: Trends in Partner-ships Across Sectors. Technical Series No. 38, 140 pages, Mont-real.
SCBD – Secretariat of the Convention on Biological Diversity(2009) Connecting Biodiversity and Climate Change Mitigation andAdaptation: Report of the Second Ad Hoc Technical Expert Groupon Biodiversity and Climate Change. Montreal, Technical SeriesNo. 41, 126 pages. Montreal.
T E E B F O R N A T I O N A L A N D I N T E R N A T I O N A L P O L I C Y M A K E R S - C H A P T E R 5 : P A G E 6 8
R E W A R D I N G B E N E F I T S T H R O U G H P A Y M E N T S A N D M A R K E T S
SCBD and MNP – Secretariat of the Convention on Biological Di-versity and Netherlands Environmental Assessment Agency (2007)Cross-roads of Life on Earth — Exploring means to meet the 2010Biodiversity Target. Solution oriented scenarios for Global Biodi-versity Outlook 2. Technical Series no. 31, 90 pages, Montreal.
Science Council of Japan, (2001) Evaluation of the multiple functi-ons of agriculture and forests that concern the global environmentand the human living environment. Report and Appendices, No-vember 2008.
Scheele M (2008) Common Agricultural Policy: landscapes goodsand environmental services for rural areas. Presentation at 12thCongress of the European Association of Agricultural Economists- Brussels Session "Health check and future perspectives of theCAP: Challenges for agriculture - A day of scientific dialogue"Brussels, 28 August 2008. URL: http://ec.europa.eu/agriculture/events/eaae/2008_en.htm (last access Nov 12,2009).
Similä J.; Thum R.; Varjopuro R. and Ring I. (2006) Protected spe-cies in conflict with fisheries: The interplay between European andnational regulation. Journal of European Environmental Planningand Law 5:432-445.
Simpson, R.D.; Sedjo, R. and Reid, J. (1996) Valuing Biodiversityfor Use in Pharmaceutical Research. Journal of Political Economy104 (1): 163-185.
Shine, C. (2005) Using tax incentives to conserve and enhancebiodiversity in Europe. Council of Europe Publishing, Nature andEnvironment No. 143.
Sonnino, R. (undated) Creative Public procurement: Lessons fromItaly and the UK, in Morgan, K. and Soninno, R. (2008) The SchoolFood Revolution: public food and the challenge of sustainable de-velopment. Earthscan, London.
Stern, N. (2006) The Stern Review on the Economics of ClimateChange. Cambridge University Press, Cambridge.
Suvantola, L. (in press) The Golden Eagle Compensation Schemein Finland as an Example of Incentive Measures – Potential forConflict Management? In: Klenke, R.; Ring, I.; Kranz, A.; Jepsen,N.; Rauschmayer, F. and Henle, K. (Eds.) Human-wildlife conflictsin Europe – Fisheries and fish-eating vertebrates as a model case.Springer, Heidelberg.
Swanson, T. (2009) An International Market Based Instrument toFinance Biodiversity Conservation: Towards a Green DevelopmentMechanism. Report from Amsterdam expert workshop, Swanson,T. and Mullan, K., March 2009.
Swanson, T.; Mullan, K. and Kontoleon, A., (2009) Towards an In-ternational Market-Based Instrument to Finance Biodiversity Con-servation: Green Development Mechanism Technical BackgroundPaper.
ten Brink P. (Ed.) (2002) Voluntary Environmental Agreements: Pro-cess and Practice, and Future Trends. Greenleaf Publishing, Shef-field.
ten Brink, B.; Alkemade, R.; Bakkenes, M.; Clement, J.; Eickhout,B.; Fish, L.; de Heer, M.; Kram, T.; Manders, T.; van Meijl, H.; Miles,L.; Nellemann, C.; Lysenko, I.; van Oorschot, M.; Smout, F.; Ta-beau, A.; van Vuuren, D. and Westhoek, H. (2007) Cross-roadsof Life on Earth – Exploring means to meet the 2010 biodiversitytarget. CBD Secretariat, Montreal.
ten Kate, K. and Laird, S.A. (1999) The Commercial Use of Biodi-versity. London, Earthscan Publications Ltd.
Tetetay, D. and Tegineh, A. (1991) Traditional tree crop base agro-forestry in coffee producing areas of Harerge, Eastern Ethiopia.Agroforestry Systems 16(3): 257-267.
Trivedi, M. R.; Mitchell, A. W.; Mardas, N.; Parker, C.; Watson, J.E.and Nobre, A.D. (2009) REDD and PINC: A new policy frameworkto fund tropical forests as global ‘eco-utilities’. IOP ConferenceSeries: Earth and Environmental Science. Vol 8: Beyond Kyoto:Addressing the Challenges of Climate Change: 012005.
Turner, W.R.; Brandon, K.; Brooks, T.M.; Costanza, R.; da Fon-seca, G.A.B. and Portela, R. (2007) Global conservation of biodi-versity and ecosystem services. BioScience 57: 868-873.
Turpie, J.K.; Marais, C. and Blignaut, J.N. (2008) The working forwater programme: Evolution of a payments for ecosystem ser-vices mechanism that addresses both poverty and ecosystemservice delivery in South Africa. Ecological Economics 65(4): 788-798.
UNECE – United Nations Economic Commission for Europe(2006) Forest Products Annual Market Review: 2005-06. GenevaTimber and Forest Study Paper 21, United Nations EconomicCommission for Europe/FAO, New York and Geneva.
UNECE/FAO – United Nations Economic Commission for Europeand Food Agriculture Organization (2009) Forest Products AnnualMarket Review: 2008-09. Geneva Timber and Forest Study, Uni-ted Nations Economic Commission for Europe/Food and Agricul-ture Organisation, New York and Geneva.
UNEP and IISD – United Nations Environment Programme and In-ternational Institute for Sustainable Development (2005) Environ-ment and Trade: A Handbook. UNEP Geneva.
UNEP-WCMC – United Nations Environment Programme WorldConservation Monitoring Centre (2008) Carbon and biodiversity:a demonstration atlas (eds) Kapos V.; Ravilious C.; Campbell A.;Dickson B.; Gibbs H.; Hansen M.; Lysenko I.; Miles L.; Price J.;Scharlemann J.P.W. and Trumper K. UNEP-WCMC, Cambridge,England.
US Fish & Wildlife Service. (2007) 2006 National Survey of Fishing,Hunting, and Wildlife-Associated Recreation: National Overview.URL: http://wsfrprograms.fws.gov/Subpages/NationalSurvey/nat_survey2006_final.pdf, (last access 10 Nov, 2009).
van Soest, D.P. and Lesink, R. (2000) Foreign Transfers and Tro-pical Deforestation: What terms of conditionality? American Jour-nal of Agricultural Economics 88: 389-399.
T E E B F O R N A T I O N A L A N D I N T E R N A T I O N A L P O L I C Y M A K E R S - C H A P T E R 5 : P A G E 6 9
R E W A R D I N G B E N E F I T S T H R O U G H P A Y M E N T S A N D M A R K E T S
Vera, C.; Baez, J.; Douglas, M.; Emmanuel, C. B.; Marengo, J.;Meitin, J.; Nicolini, M.; Nogues-Paegle, J.; Paegle, J.; Penalba,O.; Salio, P.; Saulo, C.; Dias, M. A. S.; Dias, P. S. and Zipser, E.(2006) The South American low-level jet experiment. Bulletin ofthe American Meteorological Society 87, 63-77.
Verburg, R.; Stehfest, E.; Woltjer, G. and Eickhout, B. (2009) Theeffect of agricultural trade liberalization on land-use related green-house gas emissions. Global Environmental Change.
Wertz-Kanounnikoff, S. (2006) Payments for Environmental Ser-vices – A solution for biodiversity conservation? Idées pour leDébat 12/2006 (Institut du développement durable et des relationsinternationales, Paris).
Wertz-Kanounnikof, S. (2008) Estimating the costs of reducingforest emissions. A review of methods. CIFOR Working Paper No.42, Bogor, Indonesia.
Williamson, O. (1979) Transaction Cost Economics: The Gover-nance of Contractual Relations. Journal of Law and Economics22: 233 261.
Willer, H. and Yussefi, M. (eds.) (2007) The World of Organic Agri-culture. Statistics and Emerging Trends 2007. 9th edition, totallyrevised and updated. International Federation of Organic Agricul-ture Movements IFOAM, Bonn, Germany.
World Bank (2005) Environmental Fiscal Reform: What Should BeDone and How to Achieve it. Washington, D.C.
Wunder, S. (2005) Payments for Environmental Services: SomeNuts and Bolts. CIFOR Occasional Paper no. 42.
Wunder, S. (2007) The efficiency of payments for environmentalservices in tropical conservation. Conservation Biology 21(1): 48–58.
Wunder, S. (2008) Necessary conditions for ecosystem servicepayments. Paper presented at the Economics and Conservationin the Tropics: A Strategic Dialogue conference, Moore Founda-tion/ CSF/ RFF, San Francisco, 31st January-1st February, 2005,URL: http://www.rff.org/News/Features/Pages/ConservationStra-tegiesintheTropics.aspx (last access Nov 10, 2009).
Wunder S. and Wertz-Kanounnikoff, S. (2009) Payments for eco-system services: a new way of conserving biodiversity in forests.Journal for Sustainable Forestry 28: 576-596.
Yunus, M. (2007) Creating a world without poverty. Public Affairs,New York.
Zanderson M.; Bråten K. G. and Lindhjem H. (2009) Payment forand Management of Ecosystem Services. Issues and Options inthe Nordic Context. TeamNord 2009:571 Nordic Council of Minis-ters, Copenhagen 2009.
Zilberman, D.; Lipper, L. and McCarthy, N. (2006) When are Pay-ments for Environmental Services Beneficial to the Poor? ESAWorking Paper No. 06-04 (April), FAO, Rome.
T E E B F O R N A T I O N A L A N D I N T E R N A T I O N A L P O L I C Y M A K E R S - C H A P T E R 5 : P A G E 7 0
R E W A R D I N G B E N E F I T S T H R O U G H P A Y M E N T S A N D M A R K E T S