Embed Size (px)
Citation preview
F R A C T U R E M E C H A N I C S O F M O D E I D E L A M I N A T I O N I N C O M P O S I T E M A T E R I A L S
F . X . D E C H A R E N T E N A Y a n d M . B E N Z E G G A G H.Département de Génie Mécanique
Université de Technologie de CompiègneB. P. 233 - 60206 Compiègne - France
The délamination failure in laminate composites occurs in three steps : initiation, microcracking propagation, macroscopie délamination. These three steps may well be described in mode I delamination by the evolution of G, as determined by the compliance method, in function of the crack or microcrack length.Trecisely, the logarithm of the increase of G over the initiation value G^ is linearly dependent of crack length with a transition point which defines the onset of macroscopic delamination. This analysis is presented for a number of composites materials based on glass, carbon or Kevlar fibers.
The total acoustic emission counts monitored during delamination experiments is also described by an exponential law in function of microcrack or crack length.
186

INTRODUCTION
Because the increasing use of composites Tnaterials in structural components, a
good knowledge of the failure mechanism is necessary for a better design and an adequate safety. Among the multiple failure mode in composite materials, delamination is often encountered. Several loading situation induces interlaminar stress acting on the weak matrix layer. For .^instance tension on isotropic or - 45® laminates, or bending on thick beam produce failures by matrix or interface fracture. These mechanisms have been subjects of many papers [l] [2] [3] [4] . However the stress distribution in interlaminar layer is rather difficult to define in these studies and, as an example, the different method for measuring the shear strength gives rather inconsis
tent results [ 5]Considering the need of simplification for interlaminar failure experimental
studies and according to the fact that defects are the failure initiation in real structure, we have designed a simple test of mode I delamination by pulling out the two edges of an interlaminar defect introduced in multilayered composite material (Fig. 1). This simple test was at first used in a study of the acoustic emission arising during delamination [6] [7] . This cleavage was already used by a few authors(F.J. McGARRY [S] , G.R. SIDEY [9] ) for compositesmaterials and also by people studying adhesion : MOSTOVOY and RIFLING [lO] and CHANG [ll] . Note that this cleavage experiment is simply the extension of the DCB sample used in LEFM study to an heterogeneous multilayered materials. Recently W.D. BASCOM used a tapered sample in which width is larger near the point of initiation in order to dispose of a "cons
tant Kq" sample [l2]
Fig. 1 : Made I delamination or cleavage experiment
Our acoustic emission study carried out on glass fiber reinforced polyester, has shown the inçortance of the microcracking phase which precede the macroscopic delamination [6] [7) . Thus the interlaminar strength is not only characterized byan initiation fracture energy but also by propagation fracture energy which increase during the microcracking phase. The study, by fracture mechanics of this fracture energy evolution for a number of different composites materials is the subject
of this paper.
MECHANICAL ANALYSISThe experimental load displacement curVeV"(fig^ 2) presents clearly the three
phases of mechanical behaviour : a first part of elastic deformation of the two beams, a second part of slow growth of microcracks in the matrix layer and a third
part where delamination crack opening occurs.
187

Counts Rate
Displacement
Fig. 2 Cleavage experiment : load and counts rate in function of displacement
The amplitude of the second phase depends of the type of materials used.Also., in
some experiments, depending o£^ the defect length ao,the third phase, delamination, shows a saw tooth aspect, which indicates a stable-unstable propagation.
The mechanical analysis of this cleavage experiment has been well described byJ.J. GILMAN [13] and J.P. BERRY [l^] • The displacement S may be simply expressed in function of length of defect Sq , the load P and a material parameter h :
S = P(1)
Thus the compliance is
C =(2)
log C » n log ao - log h (3)
The plots log C - log ao for experiments with different ao. afford the coefficient n and h.The compliance method for determining G,the GRIFFITH fracture energy (here G£ for initiation) may be used :
G- -^ 2 B dao
i for initiation w
f,. _ n Pi <Si- (5)
(6)2 b' h ‘/n | P i *1 )
width of specimenDuring the propagation phase (phase 2 and 3) the equation (4) may be used :
r - P"^ 9R Ha (7)2B da
However, since some raicrocracking has altered the crack tip, the compliance is not known. Furthermore, for the non transparent materials, the crack length a is also not known. Thus we must, during experiment, reverse the displacement and determine at a few point of load displacement curve the elastic behaviour (fig. 3).
188

Fig. 3 : Determination of Gp with unloading during cleavage experiment
Knowing the compliance Cp for these points, an equivalent crack length ap and a propagation fracture energy Gp may be calculated :
n Pn
p /
displacement 5p
c —P 2 B h
n+1 ^ n- 1 j 1 /nfor the
(8)
(9)
(10)The calculated length ap may be different from the real crack length a, because
the crack tip is preceded by a microcracking zone. In the microcracking propagation
phase, the macroscopic crack length is still ao, but there is a microcrack length a^. In the macroscopic delamination phase, the delamination crack length is a^, and there also is a microcrack of length am (fig.4). Notice that ap of Eq. (9) is lower than aQ + ajjj or ao + ai + a^. In transparent materials we way observe the length a^ in phase 2'or a^ + a^ if 4elamination has taken place. In order to use simple expression we shall use 1^ for the observable damaged length or .11m (.1<1) for the equivalent damaged length in non transparent materials (ap = ao +Alm). The variation of Gq in function of an is known as the resistance curves.
Fig. 4 : Length of damaged zone in nicrocracking and delamination phases
189

EXPERIMENTAL
Samples and materials
Mode I (or cleavage test) is applied to the laminates by pulling apart the two part of a partially delaminated conçosite (fig. 1). The artificial delamination is introduced during processing by insertion in the resin layer between two reinforcements (or between two preimpregnated layers) of a non adhesive thin film (parrafin for polyester, PET for Carbon and Kevlar laminates). Materials and samples dimen
sions are presented in table 1.
Fiber
CarbonKevlar
Glass Roving
T 300 T 300 270 g/m^ 830 g/m^
Matrix
EpoJcy
Epoxy
Polyester
N 5208 Brochier Stratyl166RPI(S.116)
î^orsodyne 294 T CDF(N 294 T)
Laminates ürîîd. Unid, Unidirectionnal Roving tissu 0 - 90®
Volume fiber (%) 60 60 60 30 25
Number of layers (mm)
50 16 20 16 4
Thickness (mm) 5,3 2 2,1 3,2 3,2
Width (mm) 20 29,9 30 31 31,3
Table 1 : Samples and materials
Mechanical test and acoustic emission
The load displacement curves are determined on an Instron TTDM testing machine at displacement rate of 5 mm/min. Acoustic emission (A.E.) was used to monitor the stress waves emitted in the microscopic process of fracture. The signal of a piezoelectric transducer (300 KHz) is amplified, filtered and fed to a discriminator which transforms burst signal into counts (Leanord - CGR). The acoustic emission is recorded andmay be used either as counts rate or as total count number.
RESULTS AND DISCUSSION
Initiation
Typical load and (A.E.) counts rate versus displacement curves are shown for Carbon-Epoxy (fig. 5) for Kevlar-Epoxy (fig. 6) and for Glass-Polyester (fig. 7).
190

Fig. 5 : Load and counts rate vs displacement, Carbon-Epoxy
Fig. 6 ; Load and counts rate vs displacement, Kevlar-Epoxy
191

Load Counts Rate
Fig. 7 : Load and counts rate vs displacement, Glass-Polyester
The initiation point A is easily defined from the A.E. coimts rate although the load displacement curves does not show evident singularity. In table II are gathered parameters and results of the three sets of experiments : the n and h coefficients of the equation (2), the fracture energy Gj at initiation and its dispersion for the
different samples in each set.
.................. ...... Composites
......... 1 . , . - ~ ■ 1 1 . T
Carbon-Epoxy Kevlar-Epoxy Glass-Polyester
■T 300 N 5208
T 300 Brochier
S. 116270 g/m
N 294 T 830 g/m^
Number of samples 15 12 12 12 10
Range of a^ (ram) 39 to 103 23 to 76 22 to 79 >5 to 88 25 to 88,5
n 2,44 2,6 2,71 2,83 2,94
h (Nm^ ) 20,4 1,356 0,59 0,43 0,321
Gi (J/m^) 58,25 45,52 118,7 164,4 102,83
< G. (J/m^) 8,0 3,86 19,4 1 1 6,0
Table 2 : Compliance and G^ initiation results
According to linear elastic fracture mechanics, the G^ values for the different samples are independant of Sq and dispersion is fairly low. This G^ value is a parameter characteristic of the resistance of matrix or interface to the first^damage by microcracking. The measured fracture energy are of the order of 100 J/m which are common measured value for pure resin. The Carbon-Epoxy composites is shown here to be the most sensitive to the initiation of microcracking in delamination.
192

Propagation
Behind the initiation Point, microcracking occurs at the crack tip and the fracture energy Gp of propagation is greater than the initiation energy . From C and ^ determined by a few unloading during experiment, Gp is calculated (equ. 10)^for the propagation phase. These tests have been done only for a few samples. Since the increase of fracture energy arise from the microcracking phenomenon, it is interesting to look at the relationship between the increment of G, A G (ziG = G - G£). and the length of damaged zone or the equivalent length of crack Aim*
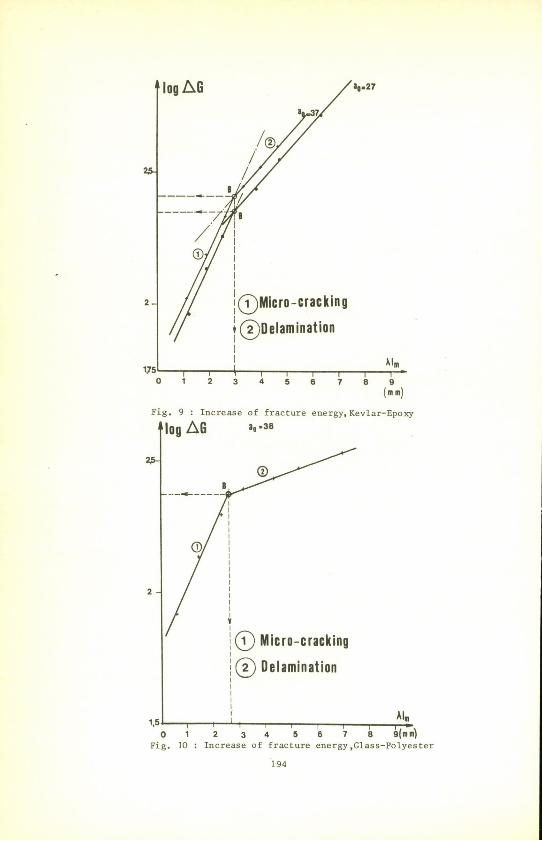
The three different composites, Carbon-Epoxy (fig, 8), Kevlar-Epoxy (fig. 9), Glass-Polyester (fig. 10), presents the same type of relationship, between AG and A U .
a„-63
Fig. 8 : Increase of fracture energy,Carbon-Epoxy
193
1.!
‘log A Ga, .38
1
j
Micro-cracking
@ Delamination
sJ---- 1---- —lin
1 1---- 1---- 1---- 1 1. ■1 6 8
Fig. JO ; Increase of fracture energy,Glass-Polyester
194

In a log ziG - Al j diagram there are two straight lines corresponding to two delamination zone. This type of variation is similar to the relationship between the loga
rithm of total counts number and Al^ (or Im) which was in a previous study the way we have detected the two phases, microcracking and macroscopic delamination [6] .
Recently, on same type of laminates we have checked that transition at point B between the two phases occurs at the same equivalent length Aljjj in the A.E. experiment and the mechanical experiment. Thus the acoustic emission total counts is proved to be stricly associated with energy of fracture. Point B is indicated on the load
displacement curves (fig. 5, 6, 7).Since log AG is linearly dependant of equivalent length of crack Alj » the R
curves which describes the dependence of Gp in function of ap (ap = a^ + Alçj) must be composed of two exponential curves in the propagation phase, one for the microcracking and one for the macroscopic delamination. However the transition, cross point of these two curves is difficult to define in the arithmetic scale of the R curves. Thus this representation, although often used for large plastic or damaged zone is
here not useful.Some of the results of the propagation phase are presented in table 3.Gp] is
the fracture energy at the point of macroscopic delamination, i.e. the end or pure
microcracking (point B).
Composites Carbon-Epoxy Kevlar Epoxy Glass Polyester
N 5208 T 300
T 300 Brochier
3 116 270g/m"
N 294 T« 830 g/m
Length of defect
ao (nim)63 34 37 38 31 88,5
Gi initiation 56,88 48,33 98,9 160,4 109,65 94,8
GpX délamination
(§)
79,1 163,14 353,5 398 273,99 133,78
‘''1 “ S i ” '’i20,9 114,81 234,8 233,6 164,34 38,98
Gpl/Gj 1,39 3,37 3 2,5 2,498 1,41
AIqj equivalent length of micro- cr^ks at delamination (B)(mm)
2 1 3 2,7 2,35 0,8
Table 3 : Microcrack propagation parameters
AG] represents the increase of fracture energy between initiation of microcracking and Onset of macroscopic delamination. This value is thus a measurement of the extent of the microcracking phenomenon in these materials. For equivalent ap, AG] is clearly higher for Kevlar-Epoxy and Glass-Polyester than for Carbon-Epoxy. The same difference is found for Aim (1), the equivalent crack length at onset of delamination. The microcrack contribution to the very high toughness of these materials is here confirmed in a stress state which only strain the matrix. For instance, in cleaved unidirectionnel sample, such an extent of microcracking State the question of the origin of the multiple initiation points, heterogeneity or internal stress
in the cured resin.However AG^ is dependant of length ap and thus is not a material constant. The
evolution of Gpi in function of is presented in fig. 11 for one Glass-Polyester composites we have recently extensively studied. For small a^, G ^ is much higher.
195

Fig. 1 1 : Evolution of the fracture energy at the point of macroscopic delamination vs of length a , Glass-Polyester
Then we must consider, since the onset of macroscopic delamination is a fracture of a damaged matrix between reinforcement layers, that the structure of the damages is dependant of aQ• This hypothesis is consistent with the influence of a^ on the slope of the curves log G vs Aim in the microcracking phase. Differences of behaviour for different a_ are summarized in table 4.
ao
small large
Al„ at onset of dela- mination
large small
slope log AG - Aim low high
G 1 pi
high low
density of microcracks at the tip of initial crack (hypothesis)
low high
Table 4 : Influence of initial crack length a^ on the propagation phase
Since the slope of the curves logZN in A.E. vs Al^^ is not dependant of a^ we may state the hypothesis that the rate of microcrack advent in terms of number is not a^ dependant but the shape of microcrack is a^ dependant. If this hypothesis hold,the density of microcrack and hence the fracture energy of microcracked zone is ao dependant. This description has to be verified by microfractography. Work are now under progress in order to get better correlation, for a set of sample with different ao, between acoustic emission and fracture energy during the propagation
196

phase,
CONCLUSIONIn cleavage experiment, parallel to the reinforcement layers, the microcracking
phenomenon has been characterized extensively :The initiation fracture energy is a measure of matrix or interfacial strength at
a microscopic level*The growth of fracture energy during propagation is proved to be an exponential
function of crack extension*The point of macroscopic delamination is easily defined by the evolution of frac
ture energy.This result confirms previous study with acoustic emission and opens new way to
study relationship between A.E. and fracture energy.
REFERENCES1 PIPES R.B. and PAGANO N.S., Journal Composite Materials, Vol. 4, 1970, pp. 538 -
548
2 PAGANO N.S. and PIPES R.B., Journal Composite Materials, Vol. 5, 1971, pp. 50 - 57
3. REIFSNIDER K.L., HENNEKE E.G. and STINCHCOMB W.W. , ASTM.STP 617, 1977, pp. 93 - 105
4. RYBICKIE.F. , SCHUESER D.W. and FOX J. , Journal Composites Materials, Vol. 11,1977, pp. 470- 481
5. CHIAOC.C., I400RE R.L. and CHIAO T.T., Composites, Vol. 8, July ( 1977) pp, I6I -169
6. DE CHARENTENAY F.'X. , BETHMONT M. , BENZEGGAGH M. and CHRETIEN J.F., ICM 3 Cambridge, England, Vol, 3, 1979, pp, 241 - 251
7. BETHlfôNT M., These 3ême cycle, "Etude par émission acoustique de matériaux composites stratifiés", U.T, Corapiègne, 13 Juin 1977
8 McKENNA G.B,, MANDELL J,F, and McGARRY F.J,, M.I.T,, Research Report R 72-76,Dec. 1972, pp. 1 - 31
9 SIDEY G.R. and BRADSHOW F,J,, International Conf. on Carbon Fibres, their composites and application, London 1971, Paper n® 25, pp, 1 - 6
10 KIPLING E.J., W3ST0V0Y S. and PATRICK R.L., Mat. Res. & Standards, Vol. 4 1964pp. 129 - 134 ’ ’
11 CHANG D.J., MUKI R. and WESTMANN R.A., Int. Journal Solids Structures, Vol, 12, 1976, pp. 13 - 26
12 BASCOMW.D,, BITNER J.L,, MOULTON R,J. and SIEBERT A,R., Conposites, Vol. 11, n° 1, Janv. I960, pp, 9 - 1 8
13. GILMAN J.J., Journal of Applied Physics, Vol, 31, n® 12, Dec. 1960, pp. 2208 - 2218
14. BERRY J.L., Journal of Applied Physics, Vol. 34, 1963, pp. 62
197