Embed Size (px)
Citation preview

ELSEVIER PII: S0032-3861(97)00219-X
Polymer Vol. 39 No. I, pp. 75-82, 1998 © 1997 Elsevier Science Ltd
Printed in Great Britain. All rights reserved 0032-3861/97/$17.00+0.(X)
Fracture toughness of polypropylene copolymers: influence of interparticle distance and temperature J. U. Starke a, G. H. Michler a, W. Grellmann a'*, S. Seidler b, M. Gahleitner c, J. Fiebig c and E. Nezbedova d aMartin-Luther-University Halle-Wittenberg, Institute of Materials Science, 06217 Merseburg, Germany b Technical University Wien, Institute of Materials Science and Testing, 1040 Wien, Austria cpCD Polymere GmbH, 4021 Linz, Austria dpolymer Institute, 65649 Brno, CZ (Received 27 November 1996)
A heterophasic reactor grade polypropylene-ethylene copolymer (RAHECO ®) was diluted with a propylene- ethylene random copolymer to get materials with constant EPR/PE-particle diameter but various interparticle distances. According to the results of instrumented impact tests, brittle-to-tough transitions were found at -20°C, -10°C, 0°C, +10°C and room temperature. The critical interparticle distance shifts linearly over the range of temperatures from about 0.4 #m at -20°C to 1.3 #m at room temperature. The results were compared with measurements of conventional notched Charpy impact strength at room temperature. The transition from brittle to tough impact behaviour was correlated to a transition of micromechanical deformation mechanisms from cavitation bands to croids. Cavitation of the rubber particles was always the first step of deformation. The in situ HVEM investigations additionally show that the particle distribution should be as homogeneous as possible. © 1997 Elsevier Science Ltd.
(Keywords: polypropylene copolymers; brittle tough transition)
INTRODUCTION
Polypropylene (PP) is characterised by a poor low temperature impact behaviour because of its relatively high glass transition temperature T~. The incorporation of elastomer particles offers a classical solution of this problem. Heterophasic PP blends with increased toughness were first developed by melt compounding PP with different polyolefines (HDPE) 'o r prefabricated ethylene-propylene copolymers (EPR) 1'2 as well as ethylenediene terpolymers (EPDM) 3. Particularly, PP/EPR blends have been more effectively produced b4Y polymerisation of the monomers directly in the reactor. In this way, it is possible to get materials with distinctive, well dispersed morphologies. Besides the amorphous EPR phase, the modifier particles in these so called 'reactor blends' can also contain crystalline polyethylene (PE). The PE lamellas are generally enveloped in the EPR phase which is useful as compatibilising agent between the semi-crystalline PP matrix and PE.
The size, shape and spatial packing of elastomer particles varied by manufacturing and processing conditions are important parameters in controlling the micromechanical 5
67 S and mechanical" behaviour of PP/EPR blends. Wu explained that a critical interparticle distance or critical matrix ligament thickness Acrit exists below which the notched Izod impact strength of nylon blends rapidly
* To whom correspondence should be addressed
increases. He defined this increase of notched Izod impact strength as brittle-to-tough transition and the critical value of Acri t as a specific parameter of the material. However, Borggreve e t a / . 9A0 and later Margolina II showed that the critical interparticle distance in nylon blends is strongly affected by rate, method of loading and test temperature. They found for instance that Acrit indeed decreases approximately linearly with temperature.
The nature of transition from brittle to ductile mode of failure is controversially discussed. Besides Wu's percola- tion theory 8, another interpretation 7'9'12'j3 exists which assumes that stress field overlap begins if the interparticle distance is lower than Acrit.
Changes from plane strain to plane stress conditions in thinner matrix ligaments, reducing the critical stress for matrix yielding, are preferred by Margolina et al. 14"15
Although the concept is generally accepted, the reduction of the critical stress for matrix yielding cannot explain the frequently investigated changes of micromechanical deformation processes in the interval of brittle-to-tough
16 1"7 transition " . For toughened PP blends, both crazing and shear yielding have been described with respectively brittle and tough fracture 3"18. However, van der Wal and Gaymansl9 did not find any evidence of crazing in PP/EPDM. They showed that crack tip blunting, melt blunting mechanisms at high testing speeds and cavitation of the rubber particles were the main mechanisms of plastic deformation. Particularly, effects of particle cavitation in toughened plastics have been analysed in detail by Lazzeri and Bucknall 2°.
POLYMER Volume 39 Number 1 1998 75

Fracture toughness of polypropylene copolymers: J. U. Starke et al.
~ Striker
I Load- e/,-- n Transducer
- i J "Support t / "
I Amplifier Chat~ Impact Digital-
Tester Oscilloscope
] Photooptical ~ = ~ Deflection- System Sensor
Figure 1 Experimental equipment of instrumented impact tests.
Many explanations have been proposed for brittle-to- tough transition in several nylon/rubber materials and PP/ EPDM blends. That is not the case for PP/EPR copolymers whose industrial employment will expand even more in future. Regarding the low temperature toughness, the aim of the present study is to analyse the impact behaviour of PP/ EPR copolymers over a wide range of temperatures and compositions.
EXPERIMENTAL
By means of an instrumented Charpy impact tester with 4J work capacity, impact measurements were performed at -20°C, -10°C, 0°C, +10°C and +23°C to detemine fracture mechanics values as resistance against instable crack growth (Figure 1). The impact speed was always 1.5 ms-
The PP/EPR copolymers 21 were kindly supplied by PCD Polymere GmbH. The basic material RAHECO ® (hetero- phasic random copolymer) was melt compounded with a PP material to lower particle concentrations in a single-screw extruder (Table 1). The PP material used for dilution was an ethylene-propylene random copolymer with comparable characteristics as the PP-matrix material of RAHECO ~.
The dimensions of the injection moulded specimens were: length, L = 80mm; width, W = 10mm and thickness, B = 4 mm. The samples were notched with a razor blade (notch tip radius = 0.2 #m). The test conditions were optimised by simulating specimen loading using a finite element method (FEM)2Z. Based on these FEM results, the experimental parameters initial crack length a --- 2 mm and support span s = 40 mm were selected. The consideration of a/W = 0.2 and s/W = 4 enables the determination of geometry-independent fracture mechanics values 23. Furthermore, a comparison of experimentally measured and numerically computed J-integral values 22 shows a distinct conformity with results of approximation
o n Su er n T r 25 M l 24 methods of e r k e a n d C rte and mpt a d urne . J-integral values according to Sumpter and Turner can be calculated as:
ST Ael Apl W - aef f ( 1 ) JQd : r/el B(~/-- a) + ~7pl B(W - a) W - a
[,,~-
l
Load-Deflection-Diagram
Fma~ A o = Apl + Ael~_~-
A pi//~lf, y Ae, tB ; fma.'-
, Time or Deflection
Fracture Surface
Table 1 Designation and composition of investigated PP/EPR copoly- mers
Composition RAHECO/~ Matri x
Material (wt. %)
1 100/0 RAHECO 2 90/10 3 80/20 4 65/35 5 50/50 6 35/65 7 20/80 8 10/90 9 0/100 Matrix material
with
and
2FGyS2( w -- a )p2 (a /W)( 1 _ ~,2) (2) Y/el = fGyEdBW3
(1 - a/W)(0.892 - 4.476a/W) %1=2 - 1.125 + 0.892a/W _ 2.238(a/W)2 (3)
To ensure statistical safety of J-values as resistance against instable crack growth, ten single edge notched specimens per temperature and material were tested at least. In equa- tion (I), Ae~ and Apl represent the elastic and the plastic part of total deformation energy Ag (Figure 1). The effective crack length aeff results from: aeff = a + Aa. Stable crack growth Aa is quantified on the fracture surface by light microscopy. The Young's modulus Ed and the yield stress 6y were measured at corresponding temperatures averaging values of five unnotched specimens. The Poisson' s ratio v of the whole sample is approximately given by 0.38. The force Fgy and the deflection fgr are defined by means of load- deflection diagrams at the transition point from pure elastic to elastic-plastic material behaviour (Figure 1). P(alW) depicts a fitting function correcting the finite specimen geo- metry.
The materials used for this investigation additionally were characterised by:
• dynamic mechanical analysis (DMA), to decide Tg of amorphous PP and EPR rubber;
76 POLYMER Volume 39 Number 1 1998

Fracture toughness of polypropylene copolymers: J. U. Starke et al.
• differential scanning calorimetry(DSC), to detect the grade of crystallisation;
• further mechanical tests, to determine Charpy impact toughness and flexural modulus Ef of the materials according to ISO 179lieU and 178, respectively.
• transmission electron microscopy (TEM), to analyse the morphology of the blends (interparticle distance A, par- ticle diameter D). The investigated sections of about 0.1 #m were microtomed from the bulk at -100°C and stained with rutheniumtetroxid (RuO4) vapour for 18h.
• high-voltage electron microscopy (HVEM), to observe the micromechanical deformation structures at room tem- perature by in situ tensile tests of semi-thin sections (thickness: 0.75/~m).
The summary of performed tests shows the complexity of questions which have to be solved to recognise structure- toughness relationships.
RESULTS AND DISCUSSION
Basic characterisation Figure 2 shows DMA curves of the materials 100/0, 65/
35, 35/65 and 10/90. Separately detected tan t5 peaks of PP and EPR glass transitions indicate that phase separation takes place during copolymerisation. The maximum of PP in the tan 6 versus temperature curves does not shift with decreasing EPR concentration. The PP glass transition temperature of - 5°C is consequently not affected by
1,5
1,0
o,s ""'
0 , 0 I I , I , I , I ~ I , -150 -100 -50 0 50 100
T [*C]
Figure 2 Loss factor tan 6 as a function of temperature T for materials 100/0, 65/35, 35/65 and 10/90. The arrows indicate the position of glass transition temperature of the EPR and amorphous PP phase.
Table 2 Summary of characterstic material parameters
Material
Glass transition temperature of Crystallization
Composition EPR temperature
~ R A H E C O / ~ Matris T g T k
(wt. %) (°c)] (°c)
100/0 - 47,1 98,8 90/10 - 46,8 98,8 80/20 - 47,6 98,5 65/35 - 49,9 97,3 50/50 - 51,3 97,7 35/65 - 51,8 97,2 20/80 - 54,4 96,5 10/90 - 55,0 96,2 0/100 - - 94,3
90
70.
60-
5O 0 2b 4b 6~ 8b 100
* ~ : 0 [wt%]
Figure 3 Melt enthalpy H.1 based on DSC measurements of all materials versus RAHECO weight fraction.
800
700
600
tat
4OO
3OO
~b r,b 8b 100 ~m~o [wt.%]
Figure 4 Flexural modulus Er versus RAHECO concentration. The continuous slope of Ef guarantees a linear dilution range to a great extent.
blending processes. In contrast to that, a Tg shift of EPR was observed. The designated Tg values of EPR are given in Table 2.
Figure 3 shows the result of DSC measurements, where the melt enthalpy Hm decreases gradually with increasing EPR content. At the same time, the crystallization temperature Tk increases due to the nucleation effect of rubber particles (Table 2). In the range of dilution, the expected DSC peak caused by the PE content is only to be detected as a weak shoulder which cannot be evaluated. This implies that the crystalline PE phase is not well developed.
Besides the linear decrease of Hm, the continuous decrease of flexural modulus Ef presented in Figure 4 implies that the processing parameters were effectively selected. The result is a system of materials which corresponds to the prescribed mixture relations.
Morphology Adjustment of matrix and elastomer viscosity in combi-
nation with random copolymerisation of PP with ethylene, which decrease the surface tension between the two phases, realises a very fine morphology of the materials, as illustrated in Figure 5. In the micrographs, the particles appear dark owing to staining with RuO4. Figure 5(b) in particular reveals the internal structure of the particles. They consist of up to five PE-rich inclusions, which are not clearly separated from each other. Within the inclusions, single PE lamellae exist. They are thicker than the PP lamellae of the matrix, so that both kinds of lamellae are
POLYMER Volume 39 Number 1 1998 77

Fracture toughness of polypropylene copolymers: J. U. Starke et al.
Figure 5 TEM micrographs of material 65/35: (a) Low magnification shows the modifier particle distribution. (b) High magnification represents the internal structure of EPR/PE-particles.
Table 3 Morphological parameters of investigated materials 80
Average particle Average interparticle 70 Composition diameter distance ~0 RAHECO/~O Matrix D A 60
Material (wt.%) (/zm) (~m) 50 ,6-"
1 100/0 0,47 0,36 " ~ 2 90/10 0,50 0,39 ~ . 40 3 80/20 0,48 0,40 30 4 65/35 0,45 0,54 t~ 5 50/50 0,46 0,57 20 6 35/65 0,49 1,00 7 20/80 0,46 1,50 10 8 10/90 0,47 2,20 9 0/100 - - - - 0
2,5
2,0
1,5
< 1,0
0,5
0,0 o 2b 46 66 8b 10o
+ P~HmO [wt.%]
Figure 6 Number-average interparticie distance A versus RAHECO content.
distinguishable. The PE-rich inclusions are surrounded by a dark shining amorphous shell of EPR, providing good adhesion between matrix and modifier particles. Frequently, it is observed that the heterophasic particles are elliptically deformed in the injection moulding direction. The long drawn out ends of the particles are most probably caused by a portion of low molecular weight EPR.
Furthermore, it can be said that the elastomer particles are well dispersed with diameters between 0.1/zm and 2 ~m. The number-average particle diameters and interparticle distances of all materials, summarised in Table 3, were obtained from TEM micrographs by image analysis systems
zb 4b 6b ab 10o
~RAHB~O [~%]
Figure 7 Charpy impact strength at room temperature v e r s u s RAHECO content. Particle size and interfacial adhesion are constant.
averaging more than 1000 particles. The average particle diameter D is independent of EPR content and processing conditions and amounts to about 0.47/~m. Figure 6 illustrates the average particle distance A as a function of RAHECO content. It can be observed that the interparticle distance rapidly decreases in the range of RAHECO concentrations from 10 to 50wt.%, whereas A only gradually decreases between 50 and 100 wt.% of RAHECO.
Mechanical testing The notched Charpy impact strength (acN) of all materials
measured at room temperature is given in Figure 7. With increasing RAHECO content, acN is approximately constant to 30 wt.%. The transition from moderately to very tough material behaviour is connected with a transition from total to partial fracture. Thereby, the notched Charpy impact strength increases rapidly from about 10kJm -2 to
2 7 0 k J m - . The transition occurs at about 45 wt.% RAHECO. The flexural modulus decreases continuously with RAHECO content (Figure 4), and the increase of impact strength is not directly affected by the amount of EPR-rubber.
For many industrial applications, the temperature depen- dence of impact strength is a very interesting point of view. Over the past few years instrumented impact tests 22'23'26 have received increasing attention. Due to the separate registration of the energy components (cf. equation (1)) and
78 POLYMER Volume 39 Number 1 1998
250
200
25O
2OO
150
Z LL IO0
5O
150
Z U. IO0
5O
0 0
f [mm]
0/100
250
200
Z L , . , I
t, lOO
5o
0 0 1
20/80
3 4 3 4
f [mm]
1000.
800-
200.
/ O0 1L ;t 3 4' 0 0 1 2 3 4
f [ram] f [ram]
Figure 8 Load (F)-deflection (0-curves of selected materials recorded during instrumented impact tests at 10°C.
250
5O/5O 6~35
150
Z ~'1oo
5O
1200- 100
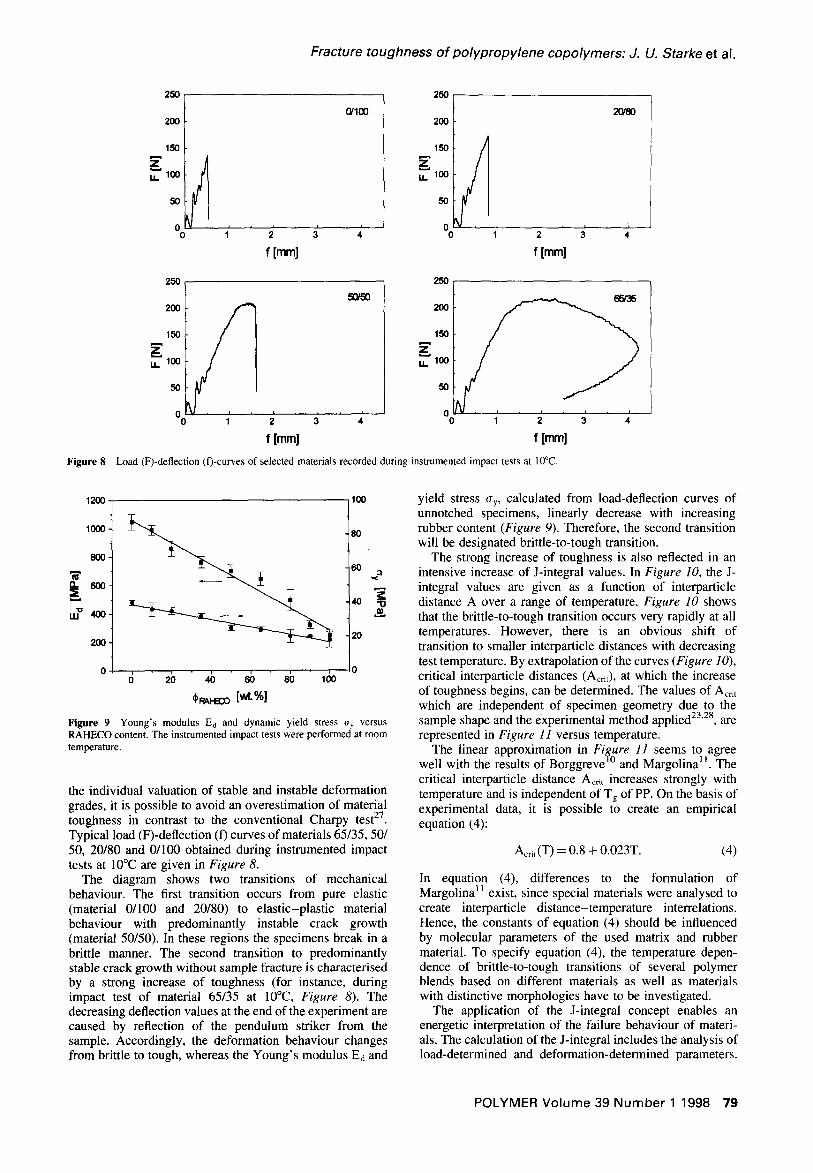
Figure 9
2~ 4b 6b 8~ 16o ~F~,~ [wt.%]
Fracture toughness of polypropylene copolymers: J. U. Starke et al.
80
eo 2
20
!0
Young's modulus Ed and dynamic yield stress oy versus RAHECO content. The instrumented impact tests were performed at room temperature.
the individual valuation of stable and instable deformation grades, it is possible to avoid an overestimation of material toughness in contrast to the conventional Charpy test 27. Typical load (F)-deflection (f) curves of materials 65/35, 50/ 50, 20/80 and 0/100 obtained during instrumented impact tests at 10°C are given in Figure 8.
The diagram shows two transitions of mechanical behaviour. The first transition occurs from pure elastic (material 0/100 and 20/80) to elastic-plastic material behaviour with predominantly instable crack growth (material 50/50). In these regions the specimens break in a brittle manner. The second transition to predominantly stable crack growth without sample fracture is characterised by a strong increase of toughness (for instance, during impact test of material 65/35 at 10°C, Figure 8). The decreasing deflection values at the end of the experiment are caused by reflection of the pendulum striker from the sample. Accordingly, the deformation behaviour changes from brittle to tough, whereas the Young's modulus Ed and
yield stress O'y, calculated from load-deflection curves of unnotched specimens, linearly decrease with increasing rubber content (Figure 9). Therefore, the second transition will be designated brittle-to-tough transition.
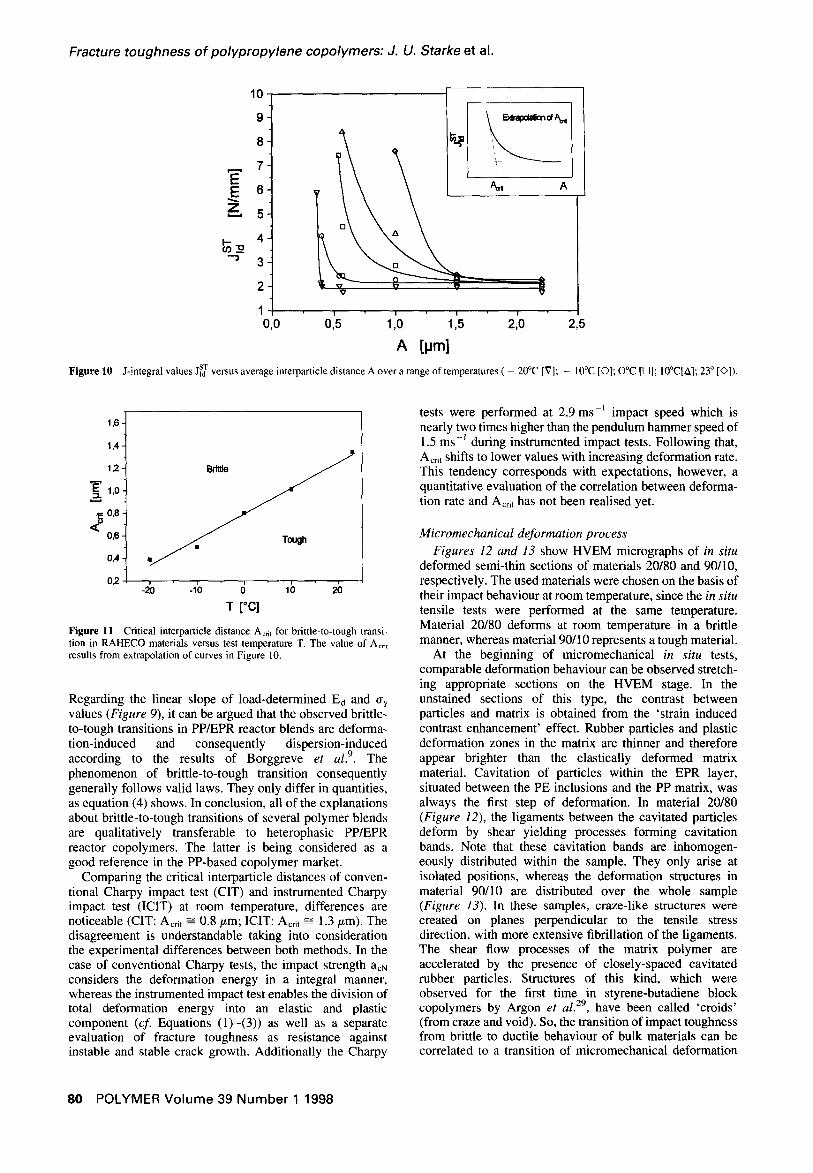
The strong increase of toughness is also reflected in an intensive increase of J-integral values. In Figure 10, the J- integral values are given as a function of interparticle distance A over a range of temperature. Figure 10 shows that the brittle-to-tough transition occurs very rapidly at all temperatures. However, there is an obvious shift of transition to smaller interparticle distances with decreasing test temperature. By extrapolation of the curves (Figure 10), critical interparticle distances (Acrit), at which the increase of toughness begins, can be determined. The values of Acrit which are independent of specimen geometry due to the
23 28 sample shape and the experimental method applied -' , are represented in Figure 11 versus temperature.
The linear approximation in Figure 11 seems to agree well with the results of Borggreve I° and Margolina I I. The critical interparticle distance Acr~t increases strongly with temperature and is independent of Tg of PP. On the basis of experimental data, it is possible to create an empirical equation (4):
Acrit(T) ---- 0 .8 q- 0 .023T . (4)
In equation (4), differences to the formulation of Margolina ~ exist, since special materials were analysed to create interparticle distance-temperature interrelations. Hence, the constants of equation (4) should be influenced by molecular parameters of the used matrix and rubber material. To specify equation (4), the temperature depen- dence of brittle-to-tough transitions of several polymer blends based on different materials as well as materials with distinctive morphologies have to be investigated.
The application of the J-integral concept enables an energetic interpretation of the failure behaviour of materi- als. The calculation of the J-integral includes the analysis of load-determined and deformation-determined parameters.
POLYMER Volume 39 Number 1 1998 79
Fracture toughness of polypropylene copolymers: J. U. Starke et al.
Figure 10
10
7
A
5~
l I l I
0,0 0,5 1,0 1,5 2,0 2,5
A [pm] J-integral values Jl sT versus average interparticle distance A over a range of temperatures ( - 20°C [V]; - 10°C [©]; O°C [rq]; 10°C[A]; 23 ° [O]).
1,6-
1,4-
1,2-
'~ 1,0
<~0,8 0,6
0,4-
0 2
Tough
T [°el
Figure 11 Critical interparticle distance Acrit for brittle-to-tough transi- tion in RAHECO materials versus test temperature T. The value of Acri t results from extrapolation of curves in Figure 10.
Regarding the linear slope of load-determined Ed and try values (Figure 9), it can be argued that the observed brittle- to-tough transitions in PP/EPR reactor blends are deforma- tion-induced and consequently dispersion-induced according to the results of Borggreve et al. 9. The phenomenon of brittle-to-tough transition consequently generally follows valid laws. They only differ in quantities, as equation (4) shows. In conclusion, all of the explanations about brittle-to-tough transitions of several polymer blends are qualitatively transferable to heterophasic PP/EPR reactor copolymers. The latter is being considered as a good reference in the PP-based copolymer market.
Comparing the critical interparticle distances of conven- tional Charpy impact test (CIT) and instrumented Charpy impact test (ICIT) at room temperature, differences are noticeable (CIT: Acrit ~ 0.8 ~m; ICIT: Acrit ~--- 1.3/~m). The disagreement is understandable taking into consideration the experimental differences between both methods. In the case of conventional Charpy tests, the impact strength acN considers the deformation energy in a integral manner, whereas the instrumented impact test enables the division of total deformation energy into an elastic and plastic component (cf. Equations (1)-(3)) as well as a separate evaluation of fracture toughness as resistance against instable and stable crack growth. Additionally the Charpy
tests were performed at 2.9 ms -I impact speed which is nearly two times higher than the pendulum hammer speed of
r 1.5 ms- during instrumented impact tests. Following that, Acrit shifts to lower values with increasing deformation rate. This tendency corresponds with expectations, however, a quantitative evaluation of the correlation between deforma- tion rate and Acrit has not been realised yet.
Micromechanical deformation process Figures 12 and 13 show HVEM micrographs of in situ
deformed semi-thin sections of materials 20/80 and 90/10, respectively. The used materials were chosen on the basis of their impact behaviour at room temperature, since the in situ tensile tests were performed at the same temperature. Material 20/80 deforms at room temperature in a brittle manner, whereas material 90/10 represents a tough material.
At the beginning of micromechanical in situ tests, comparable deformation behaviour can be observed stretch- ing appropriate sections on the HVEM stage. In the unstained sections of this type, the contrast between particles and matrix is obtained from the 'strain induced contrast enhancement' effect. Rubber particles and plastic deformation zones in the matrix are thinner and therefore appear brighter than the elastically deformed matrix material. Cavitation of particles within the EPR layer, situated between the PE inclusions and the PP matrix, was always the first step of deformation. In material 20/80 (Figure 12), the ligaments between the cavitated particles deform by shear yielding processes forming cavitation bands. Note that these cavitation bands are inhomogen- eously distributed within the sample. They only arise at isolated positions, whereas the deformation structures in material 90/10 are distributed over the whole sample (Figure 13). In these samples, craze-like structures were created on planes perpendicular to the tensile stress direction, with more extensive fibrillation of the ligaments. The shear flow processes of the matrix polymer are accelerated by the presence of closely-spaced cavitated rubber particles. Structures of this kind, which were observed for the first time in styrene-butadiene block copolymers by Argon e ta / . 29, have been called 'croids' (from craze and void). So, the transition of impact toughness from brittle to ductile behaviour of bulk materials can be correlated to a transition of micromechanical deformation
80 POLYMER Volume 39 Number 1 1998

Fracture toughness of polypropylene copolymers: J. U. Starke et al.
Figure 12 HVEM micrographs of in situ deformed sections of material 20/80. (a) Low magnification-isolated cavitation bands. (b) High magnification-cavitated particles and shear deformation structures between them.
Figure 13 HVEM micrographs of in situ deformed sections of material 90/10. (a) Low magnification-craze-like structures (croids) distributed over the whole sample. (b) High magnification-elongated ligaments between cavitated particles.
structure in semi-thin sections from cavitation bands to croids.
Furthermore, the results of in situ tests suggest that not only the average interparticle distance between cavitated particles but also the distribution of A should be important to the transition from brittle to tough impact behaviour of the material. Assuming that particles cavitate, if the interparticle distance is smaller than a critical value, the material reacts tougher according to the number of interparticle distances below Acrit. If the number of A -< Acrit is relatively small, particles cavitate and initiate only isolated deformation structures (croids or cavitation bands). In contrast, the overall deformation of the material is larger if many particles cavitate simultaneously, where they form numerous deformation structures distributed over large sample areas. That means, a homogeneous dispersion of modifier particles with A --< Acr~t will be better than a wide interparticle distance distribution with the same average particle separation.
CONCLUSIONS
The knowledge of relations between structure and mechan- ical properties of heterophasic PP/EPR reactor copolymers enables the manufacturer to produce materials with certain
morphologies by altering processing conditions. Related to the present results, the structure of the reactor blends could be adjusted, so that the material deforms in a toughened manner at practical operation temperatures.
ACKNOWLEDGEMENTS
The authors would like to thank the German Research Council (DFG) for financial support of this study which forms part of the research programme 'Innovationskolleg: Grenzschichteigenschaften in Polymerwerkstoffen'. They also thank the 'Max-Planck-Institut fuer Mikrosturkturphy- sik' in Halle/S. for the opportunity to carry out deformation tests in the 1000 kV high-voltage electron microscope as well as Mr. C. Paulik at PCD Polymere (Linz) for supplying the sample material.
REFERENCES
I. Ramsteiner, F., Acta Polymerica, 1991, 42, 584. 2. Seiler, E., Kunststoffe, 1995, 85, 1109. 3. Hayashi, K., Morioka, T. and Toki, S., J. Appl. Polym. Sci., 1993,
48, 411. 4. Neirl, W. and Ledwinka, H., Kunststoffe, 1993, 83, 577.
POLYMER Volume 39 Number 1 1998 81
Fracture toughness of polypropylene copolymers: J. U. Starke et al.
5. Kim, G. M., Michler, G. H., Gahleitner, M. and Fiebig, J., J. Appl. Polym. Sci., 1996, 60, 1391.
6. Galli, P., Haylock, J. C. and Simonazzi, T., Polypropylene: Struc- ture, Blends and Composites, ed. J. Karger-Kocsis, Chapman and Hall, London, 1995, p. 1.
7. Michler, G. H. and Starke, J. U., Toughened Plastics H: Science and Engineering, ed. C. K. Riew and A. J. Kinloch. American Chem. Soc. (ACS Series 252), Washington DC, 1996, Ch. 17, pp. 251- 277.
8. Wu, S., Polymer, 1985, 26, 1855. 9. Borggreve, R. J. M., Gaymans, R. J. and Luttmer, A. R., Makromol
Chem., Macromol. Symp., 1988, 16, 195. 10. Borggreve, R. J. M., Gaymans, R. J., Schuijer, J. and Ingen Housz, J.
F., Polymer, 1987, 28, 1489. 11. Margolina, A., Polym. Commun., 1990, 31, 95. 12. Hopps, S. Y., Bopp, R. C. and Watkins, V. H., Polym. Eng. Sci.,
1983, 23, 381. 13. Sjoerdsma, S. D., Polym. Commun., 1989, 30, 106. 14. Margolina, A. and Wu, S., Polymer, 1988, 29, 2170. 15. Wu, S. and Margolina, A., Polymer, 1990, 31, 972. 16. Cieslinsky, R. C., J. Mater. Sci. Letters, 1992, 11,813. 17. Starke, J.U., Godehardt, R., Michler, G.H. and Bucknall, C.B., J.
Mater. Sci., 1997, 32, 1855.
18. Chou, C. J., Vijayan, K., Kirby, D., Hitner, A. and Bear, E. J., Mater. Sci., 1988, 23, 2533.
19. van der Wal, A. and Gaymans, R. J., Polymat, London, 1994, p. 618. 20. Lazzeri, A. and Bucknall, C. B., Polymer, 1995, 36, 2895. 21. Paulik, C., Gahleimer, M. and Nei/31, W., Kunststoffe, 1996, 86,
1616. 22. Grellmann, W. and Sommer, J.-P., Fracture Mechanics and
Coupled Fields (FMC-Series), Vol. 17, Chemnitz, 1985, p. 48. 23. Grellmann, W. and Seidler, S., Int. J. Fract., 1994, 68, R I 9 -
R22. 24. Merkle, J. G. and Corten, H. T., ASME J. Pressure Vessel Technol.,
1974, 6, 286. 25. Sumpter, J. D. G. and Turner, C. E., ASTM STP 601, 1976, p. 3. 26. Grellmann, W., in Handbuch der Kunststoffpriifung, ed. H. Schmie-
del, Carl Hanser Verlag, Miinchen, 1992, p. 139. 27. Grellmann, W. and Che, M., J. Appl. Polym. Sci., in press. 28. Grellmann, W. and Lach, R., Die angew. Makromol. Chemie., 1996,
237, 191. 29. Argon, A. S., Cohen, R. E., Gebizlioglu, O. S. and Schwier, C. E., in
Advances in Polymer Science 52/53, ed. H. H. Kausch, Springer Verlag, Heidelberg, 1983, p. 275.
82 POLYMER Volume 39 Number 1 1998


![Static and Dynamic Density Functional Theory and ...called copolymers. Here we consider the class of copolymers called \block copolymers" [7] while there are many kinds of copolymers](https://img.pdfslide.net/doc/110x75/5eccfbf97d791301bb64d299/static-and-dynamic-density-functional-theory-and-called-copolymers-here-we.jpg)