Embed Size (px)
Citation preview
Framework ForCarbon Footprints For
paper and board produCts
April 2017
2
ExEcutivE SummAry
climate change has become a topic of high public interest. Building on this, politicians are increasingly looking at standards, labels and other instruments relevant to consumers that would lead them to participate in climate change mitigation. therefore, attention has shifted beyond cO2 emissions related to production activities, companies or sectors, and is now also focused on cO2 emissions associated with products.
in this context, buyers are asking for the “carbon footprint” associated with the supply chain for the manufacture, distribution and disposal of products provided to them. customers are asking for “carbon footprints” for different reasons:
− to meet public concerns− to increase their own available information− to improve their image and reputation− to position against competition− to compare different products− to reduce the climate effect of their own activities.
customers want a simple statement and a guarantee that the statement accurately reflects the real situation and is credible. However, behind the simple statement, there is a world of science and a complexity of facts. carbon footprint declarations can range from a single number to a full LcA (Life cycle Assessment). in practice, a figure will be accompanied by a communication statement, based on background data and studies that can be shown as needed.
companies’ choices and interpretations often make comparisons difficult. Harmonisation of approaches in the sector is desirable in order to limit the confusion at customer level and in the marketplace. From the industry’s point of view, the more common the approach, the more credible the comparison.
in 2007, cEPi, the confederation of European Paper industries was one of the first to propose a common framework, enabling companies to undertake carbon footprints for paper and board products, as there was no standardised approach for their development at that time. Since then, three major internationally-recognised product-related carbon footprint protocols and frameworks have been published, namely:
− the “Greenhouse gases - carbon footprint of products - requirements and guidelines for quantification and communication” technical specification from the international Organization for Standardization (iSO/tS 14067:2013);
− the Product Life cycle Accounting and reporting Standard (Product Standard) from the World resource institute (Wri) and World Business council for Sustainable Development (WBcSD) GHG Protocol published in 2011;
− the European commission Product Environmental Footprint (PEF) category rules (PEFcr) for intermediate Paper Products (Final Draft PEFcr for stakeholder consultation, may 2016);1
− A revision of this common framework has now been undertaken to update the methods in order to be more aligned with the methods proposed in these guidance documents.
the common framework aims to bring forward the attributes of our products and show the way to obtain the most useful information possible.
1 the PEFcr not only address GHGs but a variety of environmental aspects.
ExEc
uti
vE S
um
mA
ry
3
method oF working
Four steps have been taken to come to a common framework, based on a “bottom-up” approach, as follows:
− At the time the framework was first proposed (2007), all relevant standards, definitions and related information sources were reviewed in detail.
− the ten key elements (or “ten toes”) of carbon footprints of paper and board products were identified. Guidance was prepared regarding how to quantify each element in a manner consistent with existing standards, with emphasis on identifying the most objective calculation approaches for aspects of greatest significance to the paper industry.
− A proposed carbon footprint framework was prepared and published, based on these ten key elements, as a common approach for developing carbon footprints for paper and board products.
− the common framework has now been updated for better harmonisation with more recently developed carbon footprint protocols and frameworks from the iSO GHG Protocol.
the ten elements oF a Carbon Footprint For paper and board produCts
the following ten elements must be examined when describing the relationship between paper and board products and making a carbon footprint for a specific product or an industry-average product:
1. Biomasscarbonremovalandstorage2inforests
2. Biomasscarboninpaperandboardproducts
3. Greenhousegasemissionsfrompaperandboardproducts’manufacturingfacilities
4. Greenhousegasemissionsassociatedwithproducingwoodfibre
5. Greenhousegasemissionsassociatedwithproducingotherrawmaterials/fuels
6. Greenhousegasemissionsassociatedwithpurchasedandsoldelectricity,steam,heat,
andhotandcoldwater
7. Greenhousegasemissionsassociatedwithtransportation
8. Greenhousegasemissionsassociatedwithproductuse
9. Greenhousegasemissionsassociatedwithproductendoflife
10. Avoidedgreenhousegasemissions(optional)
the issues involved in reaching a common framework have been extensively described in this document, indicating the choices for each element that need to be made at different levels in the industry.
Final result
One of the main results of this exercise is the fact that it is not possible to develop a “one-size-fits-all” standard for carbon footprints for paper and board products. A number of key choices cannot be made at cEPi level as they vary by industry sub-sector. Also, many of the choices may have market implications, favouring one sector or company while limiting others. the aim of this framework is to enable companies to address their individual needs in a way that is consistent, to the extent possible, and in alignment with guidance from iSO and the GHG Protocol.
2 iSO/tS 14067:2013 requires GHG emissions and removals to be included. it defines greenhouse gas removal [or carbon removal] as “mass of a greenhouse gas [or carbon] removed from the atmosphere”. in this context, this frame-work uses the term “carbon removal” to mean the action of removing the carbon from the atmosphere, for instance by tree growing. Alternative terminologies for “removal”, for instance by iPcc, include “carbon uptake” or “carbon sequestration”. in contrast, iSO/tS 14067:2013 defines “carbon storage” as “carbon removed from the atmosphere and stored as carbon in a product”. Hence, in this framework, “carbon storage” is used to mean carbon that was previously removed from the atmos-phere and is now maintained out of the atmosphere.
mEt
HO
D O
F W
OrK
iNG
, tE
N E
LEm
ENtS
, FiN
AL
rESu
LtS
4
proposal
taking into consideration the realistically possible level of harmonisation and the questions associated with developing an approach to reach it, the common framework proposes that the industry will:
− Work from the common understanding and background information established in this carbon footprint framework.
− include two qualitative statements in all carbon footprints regarding the two most significant and unique aspects of paper and board products:
• the fact that our products are based on a renewable raw material based on the start-ing point of our products; the capacity of forests to bind cO2.• the fact that our products store carbon and, furthermore, that recycling of paper and board products delays this cO2 from returning to the atmosphere.
− include a statement in all carbon footprints that Sustainable Forest management (SFm) helps ensure that carbon stocks in forests remain stable or even improve over time and build on this statement.
− use the same system boundaries (i.e. which elements are to be included) for all products or sub-sectors of the industry, as much as possible. Define the scope of carbon footprints for paper and board products as being from the forest, or the collection of recycled fibre, through to the delivery to the customer of the product (elements 1 to 7 overleaf) (also known as cradle-to-gate boundaries).
− make a decision at the level of the different industry sectors (or converters) of these paper and board products whether additional components of the life cycle (i.e. the use phase of the product, end of life emissions, and avoided emissions elements) are to be included in the footprint (elements 8 to 10 overleaf). A key aspect to consider in this regard is whether these footprints should be made comparable to those for products made of competing materials and/or the scope of existing databases.
− Discuss at the level of the different industry sectors whether the development and use of an industry average number is desirable and in the best interest of sector members.
− include in the footprint all relevant and significant emissions for the product, encompassing both the emissions under the companies’ control and the emissions not under companies’ control (e.g. emissions attributable to purchased electricity).
− Aim to include at least 90% of all emissions (on a cO2 equivalent basis) within the system boundaries in the carbon footprint of the product (a cut-off criterion).
− initiate the development of generic data on, for example, transport emissions, harvesting emissions in the forest, biomass carbon removals and end of life emissions. update these data on a regular basis.
− Develop knowledge based on carbon storage in products and carbon storage in forests, and advocate for the acknowledgement of carbon storage in forests and forest products (in particular paper and board products) in international and domestic policy development.
− maintain the existing cEPi group structure to coordinate between the different industry sectors and identify areas where increased harmonisation is possible.
PrO
POSA
L
5
aCknowledgements
this framework has been developed by the confederation of European Paper industries (cEPi, www.cEPi.org). the first, pioneering edition was produced in 2007. For the current revision, cEPi has worked closely with Euro-Graph (www.euro-graph.org), the European tissue Symposium (www.europeantissue.com) and the international confederation of Paper and Board converters in Europe (citPA) (www.citpa-europe.org). cEPi is particularly thankful for the financial contributions from citPA, Euro-Graph, EurOSAc (www.eurosac.org), cEPi Eurokraft (www.cepi-eurokraft.org), FEFcO (www.fefco.org) and Pro carton (www.procarton.com).
As was the case for the first edition, cEPi has been assisted by the National council for Air and Stream improvement (NcASi), a uS-based non-profit research institute that focuses on environmental topics of interest to the forest products industry (www.NcASi.org). We hereby acknowledge the work carried out by caroline Gaudreault of NcASi, in particular. Angeline de Beaufort-Langeveld, independent consultant and leading LcA expert in the European paper and board industry, has also given valuable support throughout the revision.
A group of company and national association experts has provided valuable advice and guidance in the updating of this framework to a second edition.
AcKN
OW
LED
Gm
ENtS

6
table oF Contents
1. part 1 presents general guidance on the framework for carbon footprints.
A. introduction (Background, a common framework, intended use) 9
B. Description of the general structure of the common framework 12
c. General guidance for forest product carbon footprints 13
D. Proposal for a common approach for paper and board products 17
2. part 2 presents the specific guidance on each of the 10 elements we think should be included or mentioned in a carbon footprint for paper and board products. also, further information is given on:
1. Biomass carbon removal and storage in forests 22
2. Biomass carbon in paper and board products 24
3. Greenhouse gas emissions from paper and board product manufacturing facilities 26
4. Greenhouse gas emissions associated with producing fibre 28
5. Greenhouse gas emissions associated with producing other raw materials and fuels 30
6. Greenhouse gas emissions associated with purchased electricity,
steam and heat and hot and cold water 31
7. Greenhouse has emissions associated with transportation 33
8. Greenhouse gas emissions associated with product use 35
9. Greenhouse gas emissions associated with product end of life 36
10. Avoided greenhouse gas emissions 39
Additional information 41
the carbon Footprint Balance Sheet 42
Glossary 43
3. part 3 (appendices with background information, aiding the reader in understanding the general and specific guidance and steering the reader towards sources of information, standards, developments, etc) is in a separate document.
PrO
POSA
L
7
table oF Contents
1. part 1 presents general guidance on the framework for carbon footprints.
A. introduction (Background, a common framework, intended use) 9
B. Description of the general structure of the cEPi framework 12
c. General guidance for forest product carbon footprints 13
D. Proposal for a common approach for paper and board products 17
2. part 2 presents the specific guidance on each of the ten elements we think should be included or mentioned in a carbon footprint for paper and board products.
introduction
1. Biomass carbon removal and storage in forests 22
2. Biomass carbon in paper and board products 24
3. Greenhouse gas emissions from paper and board products manufacturing facilities 26
4. Greenhouse gas emissions associated with producing fibre 28
5. Greenhouse gas emissions associated with producing other raw materials and fuels 30
6. Greenhouse gas emissions associated with purchased and sold electricity,
steam and heat and hot and cold water 31
7. Greenhouse gas emissions associated with transportation 33
8. Greenhouse gas emissions associated with product use 35
9. Greenhouse gas emissions associated with product end of life 36
10. Avoided greenhouse gas emissions (optional) 39
Additional information (optional) 41
the carbon Footprint Balance Sheet 42
Glossary 43
3. part 3 (appendices with background information, aiding the reader to understand the general and specific guidance and steering the reader towards sources of information, standards, developments, etc.) is in a separate document

8

99
introduCtion and eXplanationgeneral guidanCe
PAR
T 1
10
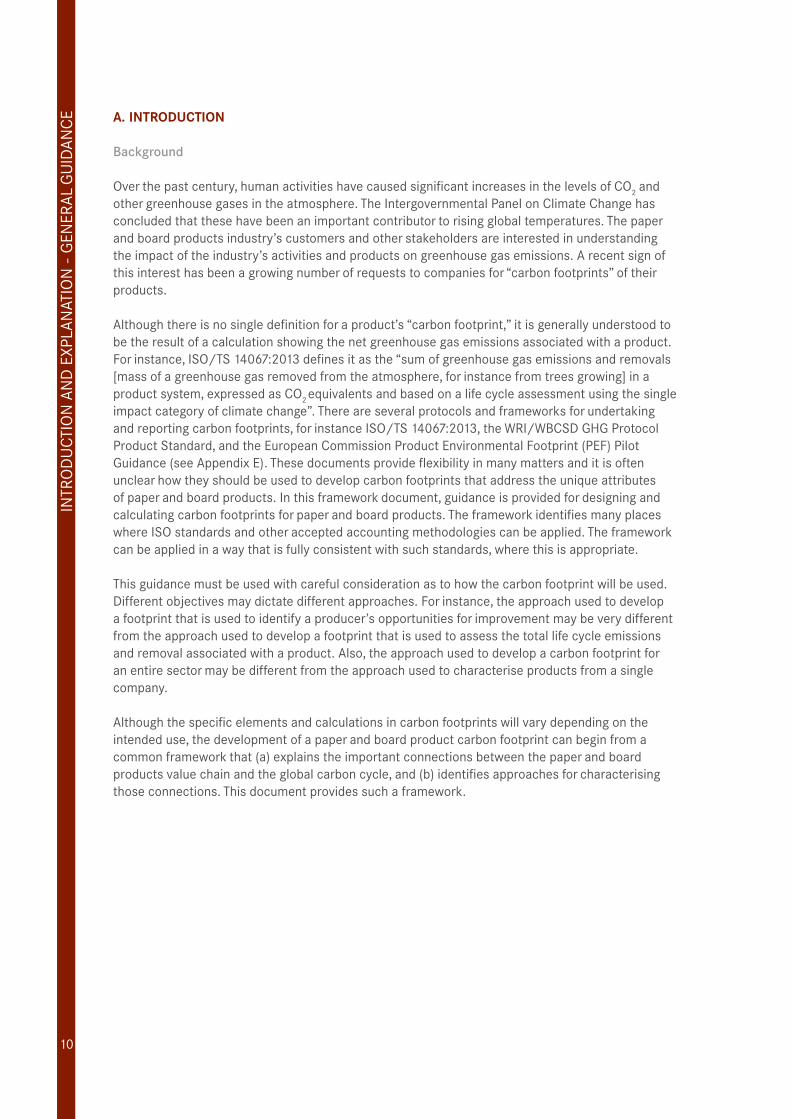
a. introduCtion
Background
Over the past century, human activities have caused significant increases in the levels of cO2 and other greenhouse gases in the atmosphere. the intergovernmental Panel on climate change has concluded that these have been an important contributor to rising global temperatures. the paper and board products industry’s customers and other stakeholders are interested in understanding the impact of the industry’s activities and products on greenhouse gas emissions. A recent sign of this interest has been a growing number of requests to companies for “carbon footprints” of their products.
Although there is no single definition for a product’s “carbon footprint,” it is generally understood to be the result of a calculation showing the net greenhouse gas emissions associated with a product. For instance, iSO/tS 14067:2013 defines it as the “sum of greenhouse gas emissions and removals [mass of a greenhouse gas removed from the atmosphere, for instance from trees growing] in a product system, expressed as cO2 equivalents and based on a life cycle assessment using the single impact category of climate change”. there are several protocols and frameworks for undertaking and reporting carbon footprints, for instance iSO/tS 14067:2013, the Wri/WBcSD GHG Protocol Product Standard, and the European commission Product Environmental Footprint (PEF) Pilot Guidance (see Appendix E). these documents provide flexibility in many matters and it is often unclear how they should be used to develop carbon footprints that address the unique attributes of paper and board products. in this framework document, guidance is provided for designing and calculating carbon footprints for paper and board products. the framework identifies many places where iSO standards and other accepted accounting methodologies can be applied. the framework can be applied in a way that is fully consistent with such standards, where this is appropriate.
this guidance must be used with careful consideration as to how the carbon footprint will be used. Different objectives may dictate different approaches. For instance, the approach used to develop a footprint that is used to identify a producer’s opportunities for improvement may be very different from the approach used to develop a footprint that is used to assess the total life cycle emissions and removal associated with a product. Also, the approach used to develop a carbon footprint for an entire sector may be different from the approach used to characterise products from a single company.
Although the specific elements and calculations in carbon footprints will vary depending on the intended use, the development of a paper and board product carbon footprint can begin from a common framework that (a) explains the important connections between the paper and board products value chain and the global carbon cycle, and (b) identifies approaches for characterising those connections. this document provides such a framework.
iNtr
OD
uc
tiO
N A
ND
ExP
LAN
AtiO
N -
GEN
ErA
L G
uiD
AN
cE
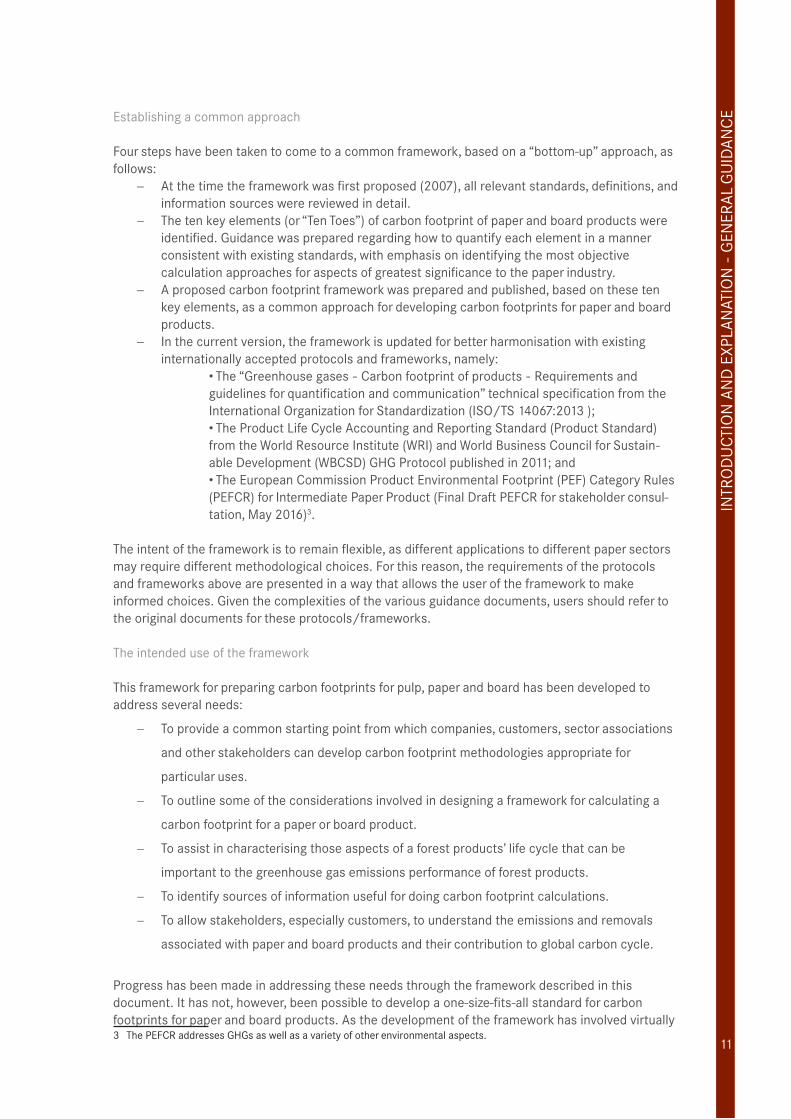
Establishing a common approach
Four steps have been taken to come to a common framework, based on a “bottom-up” approach, as follows:
− At the time the framework was first proposed (2007), all relevant standards, definitions, and information sources were reviewed in detail.
− the ten key elements (or “ten toes”) of carbon footprint of paper and board products were identified. Guidance was prepared regarding how to quantify each element in a manner consistent with existing standards, with emphasis on identifying the most objective calculation approaches for aspects of greatest significance to the paper industry.
− A proposed carbon footprint framework was prepared and published, based on these ten key elements, as a common approach for developing carbon footprints for paper and board products.
− in the current version, the framework is updated for better harmonisation with existing internationally accepted protocols and frameworks, namely:
• the “Greenhouse gases - carbon footprint of products - requirements and guidelines for quantification and communication” technical specification from the international Organization for Standardization (iSO/tS 14067:2013 ); • the Product Life cycle Accounting and reporting Standard (Product Standard) from the World resource institute (Wri) and World Business council for Sustain- able Development (WBcSD) GHG Protocol published in 2011; and • the European commission Product Environmental Footprint (PEF) category rules (PEFcr) for intermediate Paper Product (Final Draft PEFcr for stakeholder consul- tation, may 2016)3.
the intent of the framework is to remain flexible, as different applications to different paper sectors may require different methodological choices. For this reason, the requirements of the protocols and frameworks above are presented in a way that allows the user of the framework to make informed choices. Given the complexities of the various guidance documents, users should refer to the original documents for these protocols/frameworks.
the intended use of the framework
this framework for preparing carbon footprints for pulp, paper and board has been developed to address several needs:
− to provide a common starting point from which companies, customers, sector associations
and other stakeholders can develop carbon footprint methodologies appropriate for
particular uses.
− to outline some of the considerations involved in designing a framework for calculating a
carbon footprint for a paper or board product.
− to assist in characterising those aspects of a forest products’ life cycle that can be
important to the greenhouse gas emissions performance of forest products.
− to identify sources of information useful for doing carbon footprint calculations.
− to allow stakeholders, especially customers, to understand the emissions and removals
associated with paper and board products and their contribution to global carbon cycle.
Progress has been made in addressing these needs through the framework described in this document. it has not, however, been possible to develop a one-size-fits-all standard for carbon footprints for paper and board products. As the development of the framework has involved virtually 3 the PEFcr addresses GHGs as well as a variety of other environmental aspects.
iNtr
OD
uc
tiO
N A
ND
ExP
LAN
AtiO
N -
GEN
ErA
L G
uiD
AN
cE
11
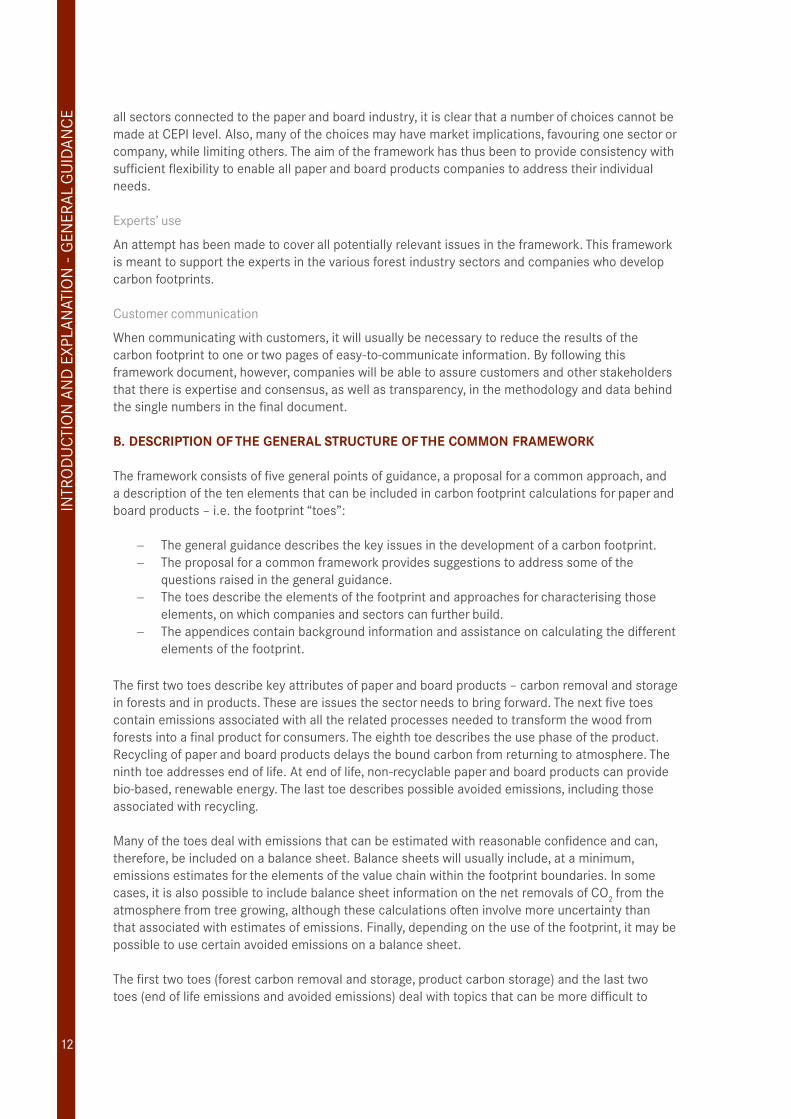
12
all sectors connected to the paper and board industry, it is clear that a number of choices cannot be made at cEPi level. Also, many of the choices may have market implications, favouring one sector or company, while limiting others. the aim of the framework has thus been to provide consistency with sufficient flexibility to enable all paper and board products companies to address their individual needs.
Experts’ use
An attempt has been made to cover all potentially relevant issues in the framework. this framework is meant to support the experts in the various forest industry sectors and companies who develop carbon footprints.
customer communication
When communicating with customers, it will usually be necessary to reduce the results of the carbon footprint to one or two pages of easy-to-communicate information. By following this framework document, however, companies will be able to assure customers and other stakeholders that there is expertise and consensus, as well as transparency, in the methodology and data behind the single numbers in the final document.
b. desCription oF the general struCture oF the Common Framework
the framework consists of five general points of guidance, a proposal for a common approach, and a description of the ten elements that can be included in carbon footprint calculations for paper and board products – i.e. the footprint “toes”:
− the general guidance describes the key issues in the development of a carbon footprint.− the proposal for a common framework provides suggestions to address some of the
questions raised in the general guidance.− the toes describe the elements of the footprint and approaches for characterising those
elements, on which companies and sectors can further build.− the appendices contain background information and assistance on calculating the different
elements of the footprint.
the first two toes describe key attributes of paper and board products – carbon removal and storage in forests and in products. these are issues the sector needs to bring forward. the next five toes contain emissions associated with all the related processes needed to transform the wood from forests into a final product for consumers. the eighth toe describes the use phase of the product. recycling of paper and board products delays the bound carbon from returning to atmosphere. the ninth toe addresses end of life. At end of life, non-recyclable paper and board products can provide bio-based, renewable energy. the last toe describes possible avoided emissions, including those associated with recycling.
many of the toes deal with emissions that can be estimated with reasonable confidence and can, therefore, be included on a balance sheet. Balance sheets will usually include, at a minimum, emissions estimates for the elements of the value chain within the footprint boundaries. in some cases, it is also possible to include balance sheet information on the net removals of cO2 from the atmosphere from tree growing, although these calculations often involve more uncertainty than that associated with estimates of emissions. Finally, depending on the use of the footprint, it may be possible to use certain avoided emissions on a balance sheet.
the first two toes (forest carbon removal and storage, product carbon storage) and the last two toes (end of life emissions and avoided emissions) deal with topics that can be more difficult to
iNtr
OD
uc
tiO
N A
ND
ExP
LAN
AtiO
N -
GEN
ErA
L G
uiD
AN
cE
13
quantify, although they are important parts of the framework. many of them involve both technical considerations as well as a number of policy considerations. in this document, the ten toes are described and initial guidance is provided on how to develop the estimates. Additional guidance will be needed to explain in more detail how to develop the estimates and use them on a balance sheet.Offsets are not included in this framework.
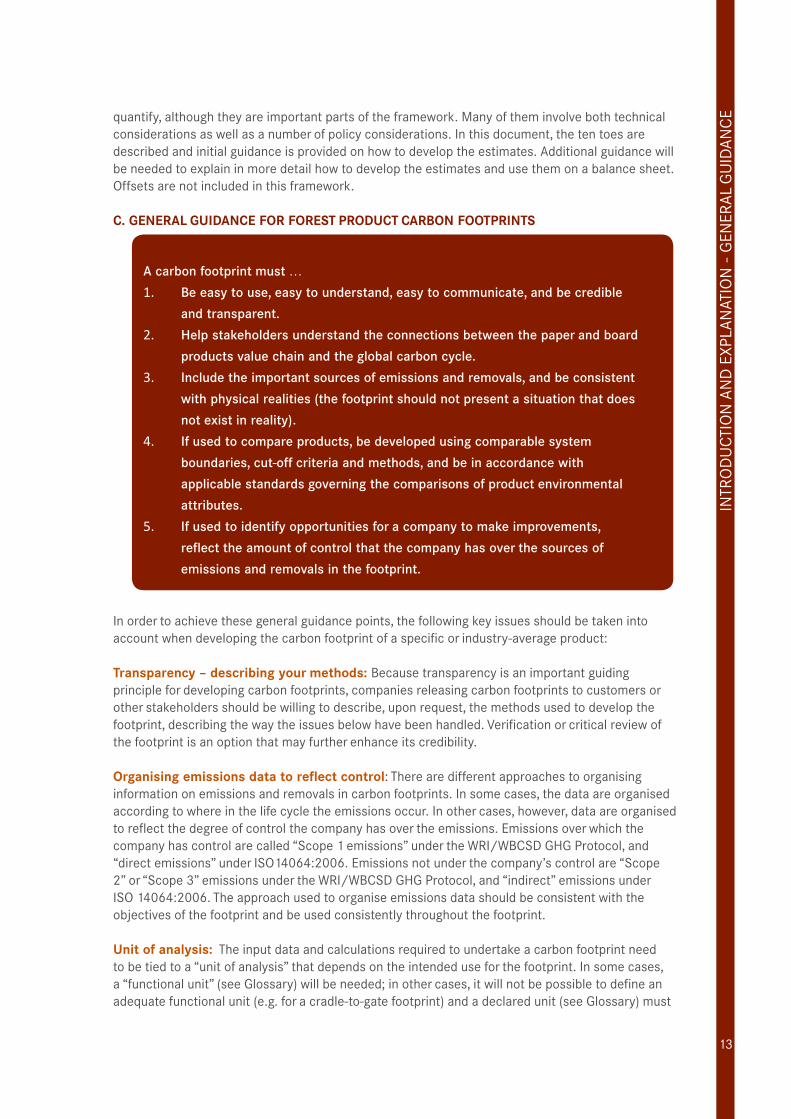
C. general guidanCe For Forest produCt Carbon Footprints
Acarbonfootprintmust…
1. Beeasytouse,easytounderstand,easytocommunicate,andbecredible
andtransparent.
2. Helpstakeholdersunderstandtheconnectionsbetweenthepaperandboard
productsvaluechainandtheglobalcarboncycle.
3. Includetheimportantsourcesofemissionsandremovals,andbeconsistent
withphysicalrealities(thefootprintshouldnotpresentasituationthatdoes
notexistinreality).
4. Ifusedtocompareproducts,bedevelopedusingcomparablesystem
boundaries,cut-offcriteriaandmethods,andbeinaccordancewith
applicablestandardsgoverningthecomparisonsofproductenvironmental
attributes.
5. Ifusedtoidentifyopportunitiesforacompanytomakeimprovements,
reflecttheamountofcontrolthatthecompanyhasoverthesourcesof
emissionsandremovalsinthefootprint.
in order to achieve these general guidance points, the following key issues should be taken into account when developing the carbon footprint of a specific or industry-average product:
transparency – describing your methods: Because transparency is an important guiding principle for developing carbon footprints, companies releasing carbon footprints to customers or other stakeholders should be willing to describe, upon request, the methods used to develop the footprint, describing the way the issues below have been handled. verification or critical review of the footprint is an option that may further enhance its credibility.
organising emissions data to reflect control: there are different approaches to organising information on emissions and removals in carbon footprints. in some cases, the data are organised according to where in the life cycle the emissions occur. in other cases, however, data are organised to reflect the degree of control the company has over the emissions. Emissions over which the company has control are called “Scope 1 emissions” under the Wri/WBcSD GHG Protocol, and “direct emissions” under iSO14064:2006. Emissions not under the company’s control are “Scope 2” or “Scope 3” emissions under the Wri/WBcSD GHG Protocol, and “indirect” emissions under iSO 14064:2006. the approach used to organise emissions data should be consistent with the objectives of the footprint and be used consistently throughout the footprint.
unit of analysis: the input data and calculations required to undertake a carbon footprint need to be tied to a “unit of analysis” that depends on the intended use for the footprint. in some cases, a “functional unit” (see Glossary) will be needed; in other cases, it will not be possible to define an adequate functional unit (e.g. for a cradle-to-gate footprint) and a declared unit (see Glossary) must
iNtr
OD
uc
tiO
N A
ND
ExP
LAN
AtiO
N -
GEN
ErA
L G
uiD
AN
cE
14
be used instead. Different standards may have different requirements in terms of the unit of analysis to use for a given application. Some examples of these requirements may be found in Appendix E.
determining boundary conditions: there are many possible uses for carbon footprints. the boundary conditions used in the analysis (i.e., the decision on which elements of the value chain to include) must be appropriate for the intended use. the boundary conditions for an industry-average product carbon footprint may be different than those for a carbon footprint of the same product manufactured at a specific company. For instance, an industry-average footprint might include end of life emissions as generic data can be used to describe the average situation. the products from a specific company, however, may not follow the average situation and the true end of life destiny of products from the company may not be known, thus the company may use footprint boundaries that exclude end of life. Alternatively, a carbon footprint on the products from a specific company can still include end of life based, for instance, on industry-average assumptions. it is therefore important to describe these boundaries.
there are a number of factors to consider in selecting boundary conditions:− to what extent is the footprint intended to reflect emissions and removals that are outside
the company’s control?− How accurate are the data for characterising emissions and removals along the value
chain?− What are the boundary conditions being used in carbon footprints against which the
footprint will be compared?
Another factor is whether the footprint is intended to be consistent with guidelines in other protocols and frameworks, for instance iSO 14067 or the Wri/WBcSD Product Standard. these standards have their own requirements in terms of system boundaries. Some examples of these requirements may be found in Appendix E.
time period for assessment of ghg emissions and removals: the selection of boundary conditions is closely related to how the analysis considers the timing of GHG emissions and carbon removals. Flows of GHGs into and from the paper and board products value chain occur over decades or longer. indeed, although paper and board products are typically short-lived, trees take several years to grow, thus sequestering carbon over several years. While not common in Europe, in cases where used paper products would be placed in landfills, they would take many years to degrade releasing the carbon over time. Also, some of the carbon in products disposed in landfills will, for all practical purposes, never degrade under anaerobic conditions4.
traditional carbon footprint practice does not consider timing, except to the extent that temporal system boundaries dictate which stocks and flows are included. increasingly, customers and other stakeholders are interested in the timing of emissions and removals. Addressing the timing of emissions and removals in a carbon footprint greatly complicates the calculations and introduces additional uncertainty. As a result, other protocols and frameworks (e.g. iSO 14067 and the Product Standard) allow, but do not require, information on timing to be reported separately from the calculated carbon footprint (cFP) (again, except to the extent that the protocols may specify temporal boundaries). Similarly, the framework described in this document does not require information on the timing of emissions and removal except to the extent that temporal boundaries must be clearly explained. information on timing may be included as additional information, however.
4 For instance, iPcc’s National inventory Guidelines (vol. 5, ch. 3) indicate that “…some degradable organic carbon does not degrade, or degrades very slowly, under anaerobic conditions in the Solid Waste Disposal Site (SWDS). the recom-mended default value for [this fraction] is 0.5 (under the assumption that the SWDS environment is anaerobic and the DOc values include lignin…)”.
iNtr
OD
uc
tiO
N A
ND
ExP
LAN
AtiO
N -
GEN
ErA
L G
uiD
AN
cE
15
Cut-off criteria: it is not practical or necessary to include every substance or emission that enters or leaves the boundaries of the carbon footprint. in life cycle studies, cut-off criteria are set to determine which of the inputs and outputs should be included. (See iSO 14040:2006 and iSO 14044:2006.) in carbon accounting protocols, these cut-offs are sometimes called materiality thresholds. (See the Wri/WBcSD GHG Protocol corporate Accounting Standard.) For footprints that are available to the public, the cut-off criteria or other approaches that were used to decide which inputs and outputs to include in the footprint should be clear. For the common framework discussed here, cut-off criteria or materiality thresholds are suggested to be expressed as a fraction of the total footprint greenhouse gas emissions (in cO2 equivalent). the cut-off criteria should be defined consistently with the intended application and different protocols and framework will have different requirements. Some examples of these requirements may be found in Appendix E.
Comparing carbon footprints: A number of industry stakeholders have expectations that carbon footprints will be helpful in comparing products. Product comparisons, however, must be done with great care. iSO has developed standards that apply to the use of life cycle studies for supporting product comparisons and these standards are relevant to comparisons of carbon footprints of different products. iSO 14044:2006 and iSO/tS 14067:2013 are especially relevant. When comparing carbon footprints, special attention must be paid to (a) ensuring that the products perform the same function (i.e. the study must be based on equivalent functional units), (b) using consistent boundary conditions, allocation methods and cut-off criteria, (c) transparency in reporting, and (d) obtaining an appropriate level of critical review. in addition, when comparing products, it is important to remember that there are environmental attributes other than greenhouse gas emissions that may be important to a product’s overall environmental performance. more specifically, various protocols and frameworks will have different requirements regarding public comparisons of carbon footprints. For instance, iSO 140467:2013 specifies that a cFP study shall not be used for a communication on overall environmental superiority of one product vs. another one. comparison based on the cFPs of different products is only permitted if the calculation of cFPs of the products to be compared follow identical cFP quantification and communication requirements. claims regarding the overall environmental superiority or equivalence of one product versus a competing product, referred to in iSO 14044 as comparative assertions, are not supported by the Wri/WBcSD GHG Protocol Product Standard.
allocating ghg emissions among products and co-products: in many cases, facilities produce several types of products, for example different types of paper/paperboard, wood products, bioenergy, biomass fuels and calcium carbonate. in addition, some facilities produce other types of products – excess electricity, for instance. Allocation of GHG emissions to co-products should be done for these co-products. iSO/tS 14067:2013 and the Product Standard allow for various co-products allocation methods. Examples of these requirements can be found in Appendix E. Allocation rules should be made transparent when publishing a footprint.
allocation in systems involving recycling of used products: Forest product manufacturers, particularly those in the paper and paperboard sectors, rely heavily on recycled fibre as raw material. through recycling, the virgin fibre (after its first use) may be used as a raw material in the original production system (closed loop recycling), producing the same product or in another production system (open loop recycling), producing a different product. When calculating a carbon footprint in cases where fibres are used several times, one must decide how to allocate the emissions from both the virgin and recycled fibre operations to the products that result from multiple uses of the fibre.Allocation rules should be used consistently throughout the carbon footprint calculations to avoid double counting. Handling allocation for recycling is especially important when the intended use of the footprint is to compare products based on virgin fibres and products based on partly or entirely recycled fibre. iSO 14044:2006 provides guidance in a stepwise procedure, starting with options
iNtr
OD
uc
tiO
N A
ND
ExP
LAN
AtiO
N -
GEN
ErA
L G
uiD
AN
cE
16
to avoid allocation, wherever possible. the same stepwise procedure is used in iSO/tS 14067:2013 but the Product Standard has different requirements (see Appendix x). it may be appropriate for different industry sectors to use different allocation approaches for recycling. For instance, the corrugated box industry in Europe uses a closed loop allocation approach that shares the emissions from the virgin and recycled fibre systems equally among all products. (FEFcO-cEPi containerboard European Database for corrugated Board Life cycle Studies, 2015). the European tissue sector (EtS), does not apply any allocation or avoided emissions for recycling in their Product category rules but requires that an additional process with virgin fibre production be added to compensate for actual fibre loss in the deinking process. Examples of permissible allocation methods for recycling in various protocols and frameworks may be found in Appendix E.
working with aggregated data: many of the toes in the framework described herein require disaggregated data. For instance, if one wants to include the emissions from the production of fuels, these emissions would be in a different toe than the emissions associated with burning those fuels. Some data sources, however, combine these into a single value. For purposes of transparency, it is recommended that, to the extent practicable, emissions be disaggregated according to the toes described in this framework. Aggregated data may be used, however, and the data may be organised differently than suggested in this framework, where it is appropriate for the intended use of the footprint.
biomass carbon and biomass-derived Co2: carbon removal and the use of biomass fuels are important attributes of the paper and board products value chain. there are a number of approaches for quantifying and/or characterising the role of carbon removal. Some of these approaches generate estimates of net removal (or net emissions) that can be used on greenhouse gas balance sheets while others are useful primarily as tools for educating stakeholders. Several approaches for characterising the effects of biomass carbon are discussed in Appendix B. it is important to understand that estimates of cO2 emissions from biomass burning have no meaning in and of themselves because they represent only one of many places along the value chain where carbon is transferred to and from the atmosphere. While estimates of cO2 emissions from biomass burning are often included as “additional information” they are not combined with cO2 emissions from fossil fuels in greenhouse gas emissions totals in the European trading Scheme, the Wri/WBcSD GHG Protocol corporate Standard, or the 2006 iPcc National reporting Guidelines. Other existing internationally-accepted carbon footprint protocols and frameworks, however, take a different approach, and typically require inclusion of biogenic carbon removals and emissions in the reported calculated carbon footprint value. more detail concerning the different reporting requirements of biogenic carbon in these protocols and frameworks can be found in Appendix E.
A good practice in terms of reporting biogenic carbon removals and emissions, and one that will help ensure consistency with other existing carbon footprint protocols and frameworks, is to be fully transparent in terms of quantification and treatment of these removals and emissions across the value chain, to the extent the data are available. more specifically, this would mean reporting information on the following elements:• Disaggregated and net emissions and removals of biogenic cO2;• Emissions and removals of biogenic cO2 due to direct land use change (dLuc);• total carbon footprint value excluding emissions and removals of biogenic cO2; and• total carbon footprint including biogenic cO2 emissions and removals.in addition, information on indirect land use change (iLuc) and on the effect of the selected allocation procedures on the reported biogenic cO2 could also be reported as separate information.
iNtr
OD
uc
tiO
N A
ND
ExP
LAN
AtiO
N -
GEN
ErA
L G
uiD
AN
cE
17
d. proposal For a Common approaCh For paper and board produCts
in order to come to a common approach as much as it seems possible today, with the establishment of this carbon footprint framework and the remaining open questions and debates, cEPi proposes that the industry as a whole:
1. Works from the common understanding and background information established in this carbon footprint framework.
2. includes two qualitative statements in all carbon footprints regarding the two most significant and unique aspects of paper and board products:
− the fact that our products are based on a renewable raw material, using the starting point of our products; the capacity of forests to bind cO2.
− the fact that our products store carbon and, furthermore, that recycling of paper and board products keeps this cO2 from returning to the atmosphere.
3. includes a statement in all carbon footprints that Sustainable Forest management (SFm) helps ensure that carbon stocks in forests remain stable or even improve over time and build on this statement.
4. uses the same system boundaries (i.e. which elements are to be included) for all products or sub-sectors of the industry, as much as possible. Defines the scope of carbon footprints for paper and board products as being from the forest, or the collection of recycled fibre, through to the delivery to the customer of the product (elements 1 to 7 above) (also known as cradle-to-gate boundaries).
5. makes a decision at the level of the different industry sectors (or converters) of these paper and board products whether additional components of the life cycle (i.e. the use phase of the product, end of life emissions, and avoided emissions elements) are to be included in the footprint (elements 8 to 10 above). A key aspect to consider in this regard is whether these footprints should be made comparable to those for products made of competing materials and/or the scope of existing databases.
6. Discusses at the level of the different industry sectors whether the development and use of an industry average number is desirable and in the best interest of sector members.
7. includes in the footprint all relevant and significant emissions for the product, encompassing both the emissions under the companies’ control and the emissions not under companies’ control (e.g. emissions attributable to purchased electricity).
8. Aims to include at least 90% of all emissions (on a cO2 equivalent basis) within the system boundaries in the carbon footprint of the product (a cut-off criterion).
9. initiates the development of generic data on, for example, transport emissions, harvesting emissions in the forest, biomass carbon removals and end of life emissions. update these data on a regular basis.
10. Develops knowledge based on carbon storage in products and carbon storage in forests, and advocate for the acknowledgement of carbon storage in forests and forest products (in particular paper and board products) in international and domestic policy development.
11. maintains the existing cEPi group structure to coordinate between the different industry sectors and identifys areas where increased harmonisation is possible.
the eleven points above should form the common framework. they take into consideration competition between different grades and processes. Further work on the common approach is
iNtr
OD
uc
tiO
N A
ND
ExP
LAN
AtiO
N -
GEN
ErA
L G
uiD
AN
cE
18
ongoing at the level of the different industry sectors, based on cEPi’s framework.the general approach to decisions that still need to be made is the following – where consensus is not possible, transparency is key. As long as all involved in developing the carbon footprints are clear and transparent in their choices, the different approaches can be understood.
Finally, it must be said that the establishment of a carbon footprint framework or the calculation of a carbon footprint of a product does not guarantee a positive or neutral result in itself. this framework brings the attributes of our industry’s products forward and shows the way to achieve the most objective and realistic results possible.
iNtr
OD
uc
tiO
N A
ND
ExP
LAN
AtiO
N -
GEN
ErA
L G
uiD
AN
cE
19
iNtr
OD
uc
tiO
N A
ND
ExP
LAN
AtiO
N -
GEN
ErA
L G
uiD
AN
cEthe ten toes oF a Carbon Footprint
PAR
T 2
THE
TEN
TO
ES O
F C
ARB
ON
FO
OTP
RIN
T
20
tHE
tEN
tO
ES O
F c
ArB
ON
FO
OtP
riN
t
21
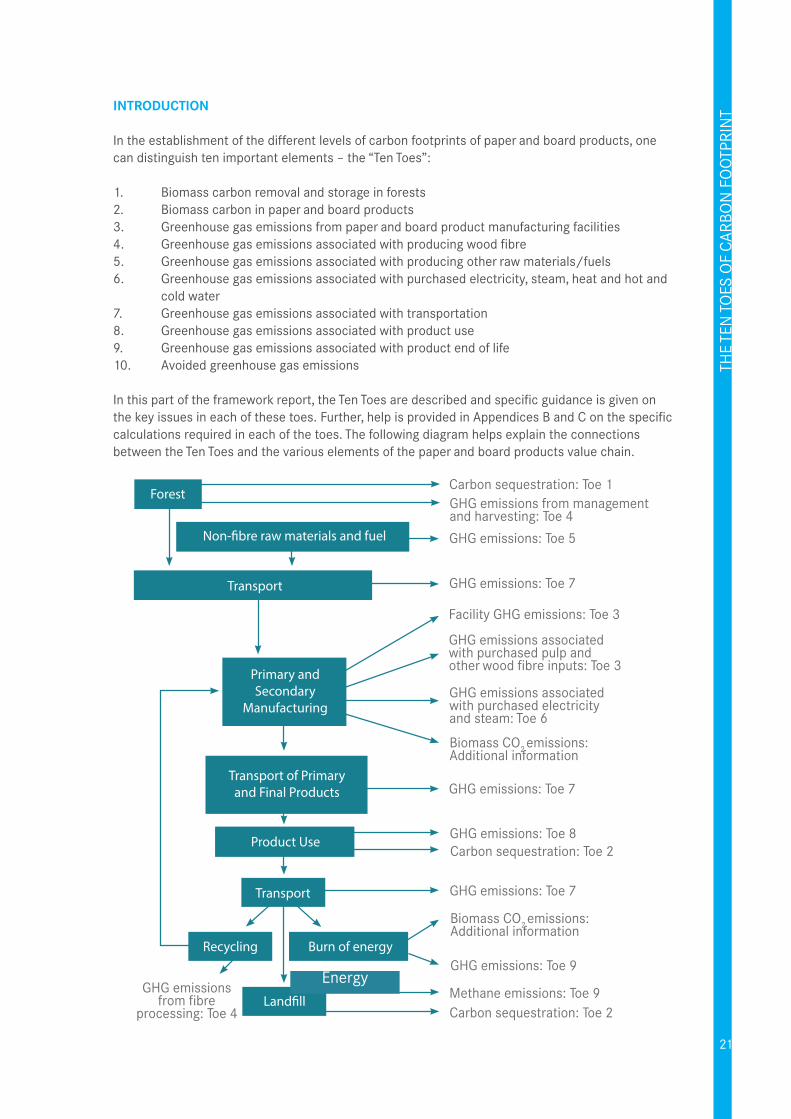
introduCtion
in the establishment of the different levels of carbon footprints of paper and board products, one can distinguish ten important elements – the “ten toes”:
1. Biomass carbon removal and storage in forests2. Biomass carbon in paper and board products3. Greenhouse gas emissions from paper and board product manufacturing facilities4. Greenhouse gas emissions associated with producing wood fibre5. Greenhouse gas emissions associated with producing other raw materials/fuels6. Greenhouse gas emissions associated with purchased electricity, steam, heat and hot and cold water7. Greenhouse gas emissions associated with transportation8. Greenhouse gas emissions associated with product use9. Greenhouse gas emissions associated with product end of life10. Avoided greenhouse gas emissions
in this part of the framework report, the ten toes are described and specific guidance is given on the key issues in each of these toes. Further, help is provided in Appendices B and c on the specific calculations required in each of the toes. the following diagram helps explain the connections between the ten toes and the various elements of the paper and board products value chain.
tHE
tEN
tO
ES O
F c
ArB
ON
FO
OtP
riN
t
Forest
Transport
Primary andSecondary
Manufacturing
Transport of Primaryand Final Products
Product Use
Transport
Recycling Burn of energy
carbon sequestration: toe 1
carbon sequestration: toe 2
carbon sequestration: toe 2
GHG emissions: toe 5
GHG emissions: toe 7
GHG emissions: toe 7
GHG emissionsfrom fibre
processing: toe 4
GHG emissions: toe 8
GHG emissions: toe 7
GHG emissions: toe 9
methane emissions: toe 9
Facility GHG emissions: toe 3
GHG emissions associatedwith purchased pulp and other wood fibre inputs: toe 3
GHG emissions associatedwith purchased electricityand steam: toe 6
Biomass cO2 emissions:Additional information
Biomass cO2 emissions:Additional information
GHG emissions from managementand harvesting: toe 4
Energy
THE
TEN
TO
ES O
F C
ARB
ON
FO
OTP
RIN
T
22
introduCtionthe first item to address in a carbon footprint for paper and board products is information on the importance of forest carbon. Forests sequester biomass carbon while providing raw materials for industry, important environmental services and employment. the industry’s use of wood fibre provides an incentive to keep land in forest where it can “bind carbon” and sustainable forest management practices help ensure that new biomass carbon is grown to replace the biomass carbon that is removed during harvest. Biomass carbon removal and storage are attributes that are missing from the value chains of most other industries but are central features of the value chain of the forest products industry, in particular paper and board products.
While forests are critical to the environmental attributes of paper products, it can be difficult to determine the precise effect of an individual product on forest carbon. therefore, the approach below allows companies to use various types of information, from quantitative to descriptive.
issues/disCussion
A simple way to deliver the messagethe concept of biomass carbon in forests can be difficult to understand. A simple way to deliver the message is to use the starting point that sustainable forest management (SFm) helps to ensure that the stocks of carbon in forests remain stable or even improve over time.
Forest carbon stocksLargely due to the wide adoption of SFm practices in the developed world, forest carbon stocks in these countries are typically stable or increasing, despite the fact that the majority of the world’s industrial harvesting is undertaken in these same countries. According to the European GHG inventory, forests of the Eu-28 are a net carbon sink, with net cO2 removals by forests having increased by over 19% between 1990 and 2014. indeed, throughout the developed world, sustainable management practices are largely in place to help ensure the future availability of wood. By replenishing the forests, these practices help maintain stable stocks of forest carbon. it is difficult, however, to isolate the effects attributable to a specific product. Also complicating the calculations is the reliance on imported wood in some places.
Economic incentivesA very important impact of the forest products industry, including the paper and board industry, on forest carbon is the economic incentive that the industry provides by creating demand for wood. Without this demand, the pressures to convert land to non-forest uses might result in large losses of forest carbon due to land clearing. Where avoided deforestation can be estimated, it may be possible to discuss this as additional information, explaining the important connections between the industry and the global carbon cycle. information on the influence of the increased demand for biomass fuels can also be useful.
tHE
tEN
tO
ES O
F c
ArB
ON
FO
OtP
riN
t toe 1biomass carbon removal and storage5 in forests
5 iSO/tS 14067:2013 requires GHG emissions and removals to be included. it defines greenhouse gas removal [or carbon removal] as “mass of a greenhouse gas [or carbon] removed from the atmosphere”. in this context, this framework uses the term “carbon removal” to mean the action of removing the carbon from the atmosphere, for instance by tree growing. Alterna-tive terminologies for “removal”, for instance by iPcc, includes “carbon uptake” or “carbon sequestration”. in contrast, iSO/tS 14067:2013 defines “carbon storage” as “carbon removed from the atmosphere and stored as carbon in a product”. Hence, in this framework, “carbon storage” is used to mean carbon that was previously removed from the atmosphere and is now maintained out of the atmosphere.
23
Qualitative and quantitativeExisting carbon footprint protocols and frameworks (e.g. iSO/tS 14067:2013 and the Wri/WBcSD GHG Protocol Product Standard) typically require that carbon removals are included in the calculated cFP and reported separately. A good practice is to be fully transparent in reporting biogenic carbon information. to simplify, in the absence of land use change, carbon removal can be assumed to be equal to the carbon content of wood inputs to the paper product (for both material and energy purposes).
in addition, in some cases there will be GHG emissions and/or removals from direct and indirect land use change (dLuc and iLuc). Some companies may be able to estimate changes in forest carbon stocks and attribute a portion of those changes to individual products. in these cases, the footprint may include quantitative information in the form of a number indicating the net additions to forest carbon stocks per unit of product, averaged over appropriate areas and times. the reporting requirements for dLuc and iLuc in the various carbon footprint protocols and framework are discussed in Appendix E. the considerations involved in using biomass carbon information in balance sheets are explored in Appendix B.
companies that do not have the possibility to make quantitative statements about forest carbon storage in a footprint should still address this issue in the footprint by describing how a company’s sustainable forest management practices and fibre procurement practices are helping to ensure that forest carbon stocks are not being depleted. reliance on fibre from sustainably-managed forests should usually allow a product to be characterised as having, at worst, a “net zero” impact on forest carbon. in some cases, however, it may be necessary to consider whether there was a significant change in the average carbon stocks associated with wood production. Large changes in management intensity, such as converting a sustainably-managed naturally-regenerating forest to plantation, can have a significant impact on average carbon stocks. For instance, the Wri/WBcSD GHG Protocol Product Standard requires the practitioner to pay attention to these types of situations.
to help stakeholders understand the importance of the industry’s use of sustainably-managed forests to the carbon cycle, companies may also want to calculate how much carbon is maintained, on average, in the area of sustainably-managed forests needed to supply fibre for the product on a continual basis. Appendix B has more information on this approach.
Relation with carbon storage in products (Toe 2)unless there are large changes in forest management intensity, sustainably-managed forests do not have a large effect on atmospheric cO2 because while some trees are harvested, others are growing, accumulating additional carbon that replaces the carbon lost from the forest in harvested wood. if biomass carbon is stored in products, the estimates derived in toe 1 can understate the net carbon removal accomplished in the paper and paper board products value chain and should therefore be viewed in combination with the issue of carbon removal in products, discussed in toe 2.
Relation with greenhouse gas emissions from paper and board products manufacturing facilities (Toe 3)Biomass is often used for energy in pulp mills. this biomass is accounted for in stock change calculations in the forest in toe 1. in toe 3, cO2 from biomass combustion also needs to be calculated and reported separately, and may be included in overall assessments of biomass carbon stocks or flows, as discussed in Appendix B.
Relation with greenhouse gas emissions associated with producing wood fibre (Toe 4)toe 4 addresses the greenhouse gas emissions generated in producing wood fibre and recycled fibre, that is forest management operations and harvesting, and collection, sorting and processing of paper for recycling before it enters the recycling process, mainly due to the combustion of fossil fuels. it does not address forest carbon, which is included here in toe 1.
tHE
tEN
tO
ES O
F c
ArB
ON
FO
OtP
riN
t
THE
TEN
TO
ES O
F C
ARB
ON
FO
OTP
RIN
T
24
introduCtionthe second item to address in a carbon footprint for paper and board products is the role of biomass carbon in products. Where forests are managed sustainably, forest biomass carbon stocks remain relatively stable. under conditions where forest carbon stocks are stable, net removals of carbon from the atmosphere are not stored in the forest but in the wood removed from the forest. Especially over multiple harvest cycles, effects related to (a) biomass carbon stored in products in use and in landfills (in this toe), and (b) avoided emissions related to substitution of many forest products, including paper and board products, for more greenhouse gas intensive alternatives (discussed in toe 10) may be more important.
the effect of carbon in products on footprint results will depend on the temporal system boundaries used in the analysis.
issues/disCussions
A simple way to deliver the messagethe concept of biomass carbon storage in products can be difficult to understand. A simple way to deliver the message is to show the product, – e.g. this product contains biomass carbon and as long as it is in use this biomass carbon is not in the atmosphere.
Product biomass carbon contentthe biomass carbon content of a product as it is put into commerce can be easily estimated and documented in a carbon footprint report. in footprints ending with manufacturing of intermediate or final products, information on carbon in the product should be included so that the entity receiving the product can continue the carbon footprint and accurately account for continued carbon storage through subsequent parts of the value chain as well as for end of life emissions.
Long-term carbon storagethe fraction of the biomass carbon content of the product that remains stored in a product in use for long periods of time can sometimes be estimated with reasonable confidence because it is closely related to the function of the product, as part of the product design. For instance, most paper and board products are short-lived hence the amount of carbon stored in use will be small but some specific paper products can be archived for extended periods of time, thus increasing the fraction of carbon stored.
in addition, as highlighted by iPcc in the Guidelines for National Greenhouse Gas inventories (2006), only a fraction of the biomass carbon in products placed in landfills will degrade under anaerobic conditions, the remainder being indefinitely stored. the further the product moves through the value chain, however, the more uncertain the biomass carbon storage estimates becomes. After use, the fate of the product is primarily determined by public policy decisions regarding solid waste management, which are out of the company’s control and vary considerably from one region to another. As a result, estimates of carbon stored in landfills can vary significantly between footprints solely due to different public policies regarding waste management in different regions.
tHE
tEN
tO
ES O
F c
ArB
ON
FO
OtP
riN
t toe 2biomass carbon in paper and board products
25
the effect of long-term carbon storage in products in use and in landfills can be estimated. Existing carbon footprint guidelines, however, while allowing for this effect to be documented separately, do not allow this to be included in the reported cFP value, meaning that it would have to be documented separately from the balance sheet. Also, one should only consider the carbon that is expected to remain out of the atmosphere for a length of time determined by the temporal system boundaries. Depending on the footprint’s system boundaries, estimates of storage attributable to biomass carbon in products can be limited to products in use, or can include both products in use and in landfills. the considerations involved in using toe 2 information in balance sheets are examined in Appendix B.
RecyclingKeeping fibre in the recycling loop as long as the fibre is not too degraded to be used in papermaking could be considered as storage of carbon during product use. A calculation approach for accounting for this extended storage is presented in Example 3 of iSO/tr 14047:2003. it is important, however, to calculate the impacts of recycling-related carbon storage in a manner that is consistent with how other aspects of recycling are considered in the cFP. if, for instance, the boundaries of a cFP study are extended to include carbon storage in recycling, they should also include emissions associated with recycling. this introduces many complications and uncertainties that are normally beyond the scope of cFP studies.
Additional considerationsthe impacts of biomass carbon on cO2 in the atmosphere can be estimated using changes in stocks of biomass carbon (i.e. net carbon storage) or net flows of biomass cO2 to the atmosphere. the decision on whether to use stock changes or net flows of biomass cO2 in a balance sheet depends on the intended application of the footprint. However, care is needed in order not to double count the benefits from carbon removal and net storage. As such, the balance sheet should include either the carbon storage occurring within temporal system boundaries or the removal and emissions (flows) of biogenic cO2. iSO/tS 14067:2013, the Product Standard of the GHG Protocol and the PEFcr for intermediate Paper Products require that the latter approach be used.
tHE
tEN
tO
ES O
F c
ArB
ON
FO
OtP
riN
t
THE
TEN
TO
ES O
F C
ARB
ON
FO
OTP
RIN
T
26
introduCtionthe next item to address in a carbon footprint for paper and board products is emissions from fossil fuel and biomass combustion at manufacturing facilities that produce paper and board products, including primary manufacturers (e.g. pulp mills, paper mills, board mills) and final manufacturing facilities (e.g. box plants). this includes all facilities involved in converting wood fibre or recycled fibre into final products regardless of who owns them. it also includes fuels used to operate pollution control devices that are treating releases from the manufacturing operations and for transportation at the facility. toe 3 emissions are usually included in greenhouse gas (GHG) balance sheets.
issues/disCussions
Data sourcesin many cases, emissions from facilities controlled by the company preparing the footprint are estimated for other purposes (e.g. GHG reporting requirements), and can be directly used in preparing a carbon footprint. in some cases, however, these emission estimates may not be available, for instance, where the footprint is being prepared by a company that owns the converting operations but not the primary manufacturing facilities, or where a company purchases pulp from a different company. in these cases, ideally this information can be obtained directly from the facilities of interest. in some situations, however, it will be necessary to use generic information describing facilities of the same general type. in all cases, the company should identify data sources.
Greenhouse gasesFuel-derived cO2 emissions represent the large majority of GHG emissions from paper and board products manufacturing. Other gases or emissions sources may be important, however, for certain uses of carbon footprints. the combustion of fuels may also release cH4 and N2O. An analysis of existing data sources suggests that these non-cO2 greenhouse gases typically contribute 1-5% to the total cO2 -equivalents in fossil fuel combustion (see example in Appendix c), although there are exceptions, especially for coal combustion. the decision on whether to include these emissions in the footprint or not depends on the cut-off criteria used, which must be consistent with the intended use of the carbon footprint. Note that iSO/tS 14067:2013 requires that all significant GHG emissions be included in the calculated cFP. the Wri/WBcSD GHG Protocol requires that emissions of cO2, cH4, N2O, HFcs, PFcs, SF6 and NF3 be included in the cFP value. Appendix c contains information that can be helpful in identifying significant sources of minor greenhouse gases. cO2 from biomass combustion also needs to be calculated and reported separately, and may be included in overall assessments of biomass carbon stocks or flows, as discussed in Appendix F.
Multiple productsFor facilities that produce more than one product (or produce co-products), GHG released from the facilities will need to be allocated among the various outputs. Allocation methods are discussed in more detail in iSO 14044:2006. Different carbon footprint protocols and frameworks have different
requirements in terms of allocation. Some examples of these are presented in Appendix E.
tHE
tEN
tO
ES O
F c
ArB
ON
FO
OtP
riN
t
toe 3biomass greenhouse gas emissions from forest products manufacturing facilities
27
Sales and purchases of electricity and steamPulp and paper mills sometimes sell excess electricity or steam. there are several options for adjusting carbon footprint calculations to address the effects of these practices on toe 3 emissions. Different carbon footprint protocols and frameworks have different requirements in terms of allocation. this is further discussed in toe 6 and in toe 10 and some examples of these are presented in Appendix E.
Combined heat and powerif product or co-product electricity, steam or heat is produced by combined heat and power systems (cHP), it may be necessary to allocate emissions from the cHP system to the various outputs. information on cHP allocation options is available in the icFPA Greenhouse Gas calculation tools for Pulp and Paper mills issued under the Wri/WBcSD GHG Protocol.
Emission factors for fuelsSome fossil fuel emission factors include emissions from the operations involved in producing the fuel. these emissions factors should not be used in calculating toe 3. these upstream emissions are included in the system boundaries, and should be calculated in toe 5.
Miscellaneous sources of greenhouse gases from paper and board product manufacturing facilities there is a variety of small sources of GHG emissions from manufacturing facilities. in some cases, it may be necessary to consider some of these miscellaneous emissions. Examples include wastewater treatment plants that have anaerobic zones, mill sludge and wood waste landfills, combustion of waste, and losses of refrigerant from air conditioning/cooling systems. cO2 emissions from kraft mill lime kilns are a combination of fossil fuel cO2 and biomass cO2. the fossil fuel cO2, associated with burning fossil fuel in the lime kiln, should be reported separately from biomass cO2. All of these miscellaneous sources are part of toe 3 regardless of whether the activities are conducted on-site or off-site.
tHE
tEN
tO
ES O
F c
ArB
ON
FO
OtP
riN
t
THE
TEN
TO
ES O
F C
ARB
ON
FO
OTP
RIN
T
28
introduCtionthe fourth item to address in a carbon footprint for paper and board products is the greenhouse gas emissions generated in producing wood fibre and recycled fibre. For virgin fibre, this includes emissions from plant nurseries, forest management (ideally by considering averages over several years) and harvesting. For recycled fibre, it includes collection, sorting and processing of paper for recycling before it enters the recycling process. Note that transport-related emissions are not included here but rather in toe 7. the emissions in this toe will often be outside the control of the manufacturer of the product described in the footprint, especially those involving recycled fibre. the emissions should normally be included in balance sheets.
issues/disCussions
Size of the emissionsthe greenhouse gas emissions associated with producing usable wood fibre from forests or discarded paper products are usually small compared to emissions associated with manufacturing, purchased electricity and transport emissions. in many cases, therefore, depending on the selected cut-off criteria, it may be possible to exclude these emissions. if they are included, it is reasonable to estimate them using generic emission factors if company-specific information is not available.
The importance of cut-off criteria Because of the relatively small size of the emissions, cut-off criteria will be essential in deciding how many sources to include in the analysis. Where these emissions are included in a carbon footprint, they primarily include emissions associated with fuel usage for harvesting activities.
Multiple productsif the forests or processing facilities producing recycled fibre generate more than one product (or produce co-products), greenhouse gas released from the facilities will need to be allocated among the various outputs. this may be necessary, for instance, for facilities that separate different sources of recycled fibre or for forests that produce wood fuels as well as pulpwood. Emissions from harvesting may be allocated by identifying how harvested wood from different fellings is used5. For instance, first fellings might be used for energy production, second fellings for fibre/paper production, and final fellings for a range of products including wood furniture, building materials, and even paper and paperboard – reflecting the use of wood product plant residuals in pulp mills. For these fellings different equipment is used, leading to different emissions that should be allocated to the appropriate products. this is often known as “process subdivision”. Process subdivision, however, is not always possible, hence will be required to apply another allocation method. the selection of a specific allocation method depends on the specific carbon footprint protocol or framework used. Examples of allocation methods requirements are discussed in Appendix E.
Natural changesForest management and harvesting may change from year to year, depending on natural causes, e.g. storms causing unintended felling of large amounts of trees, and therefore it may be necessary to 5 A felling is the same as a harvest. there can be several fellings over time on a plot of land before all of the trees have been removed and the plot is regenerated.
tHE
tEN
tO
ES O
F c
ArB
ON
FO
OtP
riN
t
toe 4greenhouse gas emissions associated with producing wood fibre
29
average these emissions over several years.
Tracing raw material emissionsPulp and paper mills may purchase bark and sawmill residues for their production processes and find it impossible to track the residues back to a specific forest. Generic estimates may be required in these cases. Some of these emissions may be from sources owned by the company developing the footprint. the remaining information may be available from the companies producing the fibre. in other cases, however, it will be necessary to use generic information describing emissions associated with producing virgin and recycled fibre.
Allocation in systems involving product recyclingWhere fibre inputs contain recycled fibre, a decision must be made on whether and how to allocate various life cycle emissions between virgin and recycled fibres. there are several approaches for making these allocations. useful references are iSO 14040:2006 and 14044:2006 and FEFcO European Database for corrugated Board Life cycle Studies (2015). Different carbon footprint protocols and frameworks will have different requirements in terms of allocation for recycling. Some examples are presented in Appendix E.
tHE
tEN
tO
ES O
F c
ArB
ON
FO
OtP
riN
t
THE
TEN
TO
ES O
F C
ARB
ON
FO
OTP
RIN
T
30
introduCtionthe fifth item to address in a carbon footprint for paper and board products is the greenhouse gas emissions generated during the manufacturing of fuels and non-wood-based raw materials (e.g. chemicals and additives) used in manufacturing paper and board products. these include direct emissions and emissions associated with purchased electricity to manufacture these raw materi-als. Normally these emissions will be largely outside the control of the manufacturer of the product described in the footprint. they can usually be included in balance sheets unless the balance sheet includes only emissions within the company’s control.
issues/discussions
Cut-off criteriaEmissions associated with producing a single process chemical or fuel are usually much smaller than emissions from pulp and paper manufacturing, purchased electricity and transport. For some raw materials, therefore, it may be possible to exclude these from the analysis based on cut-off criteria. in other cases, however, it may be relevant to include raw materials that are used in large quantities (e.g. sodium hydroxide, calcium carbonate or calcium oxide) and feedstocks made of fossil fuels or requiring fossil fuels in manufacturing.
cut-off criteria will be essential in deciding how many inputs to include in the analysis. in most cases, these inputs are not produced by the company developing the footprint. it may be possible to obtain the needed information (e.g. fuel types and consumption) from the companies selling the materials. in many other cases, however, it will be necessary to use generic information describing typical emissions associated with manufacturing these inputs. Past life cycle and footprint studies may be helpful. information on the emissions associated with producing fossil fuels is readily available from life cycle databases.
tHE
tEN
tO
ES O
F c
ArB
ON
FO
OtP
riN
t
toe 5greenhouse gas emissions associated with producing other raw materials and fuels
31
introduCtionthe sixth item to address in a carbon footprint for paper and board products is the cO2 emissions associated with purchased and sold electricity, steam and heat used at facilities that manufacture paper and board products, including chip mills, pulp mills, paper and paperboard mills and final manufacturing facilities (e.g. box plants). this includes electricity for pollution control equipment used to treat manufacturing-derived wastes and emissions. Emissions associated with electricity used at facilities that manufacture other inputs to manufacturing are included in toe 5.
issues/disCussions
Fuel mixcO2 emissions associated with purchased and sold electricity, steam and heat vary greatly depending on the fuels and methods used to produce the energy. this has consequences for calculating a footprint as a paper producer will receive lower or higher emissions depending on the location of the production site even if the producer is purchasing or selling the same amount of energy as a paper producer from another country or region. this is one of the reasons why it is often useful to divide emissions according to control. in recent years, it has become possible to buy electricity from specific sources, which provides direct influence over the emissions in this toe.
Emission factorsthere are large differences in emission factors for grid electricity based on the fuel mix of the electricity produced. in some cases, purchase contracts may specify emission factors or generation methods. Where specific information is not available, emission factors for the regional or national grid may be best. in other cases, it may be appropriate to use the European average emission factor for electricity produced. Some emission factors are based on the average fuels used to produce electricity while others are based on the fuels used to produce marginal electricity (e.g. to meet peak demands). the choice of average versus marginal emission factors depends on the application of the carbon footprints. However, average factors are appropriate for most carbon footprints. Some factors include emissions associated with producing the fuel and may also include emissions from power dissipated via transmission losses.
Accounting for sales of electricity, steam, heat or hot or cold waterthere are different methods for adjusting carbon footprints to account for sales of electricity, steam or heat.
− the first approach is to reduce emissions for producing electricity reported in toe 3 by applying process subdivision. this requires identifying resources used in producing the electricity, steam, heat or hot or cold water that is sold and removing the related greenhouse gases from the footprint.
− A second approach is to identify electricity, steam or heat sales as products or co-products and apply an allocation method to assign emissions to them. this method also has the effect of reducing the emissions reported under toe 3.
− A third approach, particularly suited to situations where sales are small, is to deduct electricity sales from purchases in toe 6 and estimate emissions for net purchases instead
tHE
tEN
tO
ES O
F c
ArB
ON
FO
OtP
riN
t
toe 6greenhouse gas emissions associated with purchased and sold electricity, steam, heat and hot and cold water
THE
TEN
TO
ES O
F C
ARB
ON
FO
OTP
RIN
T
32
of total purchases.− A fourth approach is to estimate the avoided emissions associated with sales of electricity
under toe 10. using this approach, one must report the total emissions from producing sold electricity, steam, heat or hot or cold water under toe 3.
Only one of the methods described above may be applied and it is recommended to be consistent in the footprint regarding the allocation method used for the different allocation situations.
if purchased electricity, steam or heat are used to make products other than the product for which the footprint is being prepared, one should use appropriate allocation methods. care is warranted to ensure that emissions are not double counted.
methods for dealing with sold electricity, steam, heat or hot or cold water are different in different carbon footprint protocols and frameworks. Some examples are provided in Appendix E.
Greenhouse gasesFossil fuel-derived cO2 emissions usually represent the large majority of greenhouse gas emissions associated with purchased electricity, steam and heat. However, in some cases, biomass will be used in producing purchased electricity, steam and heat, involving carbon removals and releases of biomass cO2.
Combined heat and powerif the electricity or steam from a combined heat and power (cHP) system is sold (or purchased), the emissions from the cHP system(s) will almost always need to be allocated between the steam and electricity outputs so that the emissions attributable to manufacturing operations can be calculated. there are a number of methods for allocating emissions in cHP systems (see, for instance, Annex B of the icFPA Greenhouse Gas calculation tools for Pulp and Paper mills issued under the Wri/WBcSD GHG Protocol.).
Cut-off criteriathe combustion of fossil fuels and biomass fuels may release cH4 and N2O. these are relatively small compared to cO2 emissions but are included in many reporting protocols. they are sometimes included within emission factors for purchased electricity. the decision on whether to include them must be consistent with the intended use of the carbon footprint and the cut-off criteria used in the footprint. One can also decide to include transmission losses in the purchased energy if these can be calculated and are consistent with the intended use of the footprint.
tHE
tEN
tO
ES O
F c
ArB
ON
FO
OtP
riN
t
33
introduCtionthe seventh item to address in a carbon footprint for paper and board products is the greenhouse gas emissions associated with transporting raw materials and products along the value chain. it includes emissions from transporting wood, recycled fibre, other raw materials, intermediate products, final products and used products. transport elements to consider include the following:
1. Harvested wood to the mill or chipping facility2. chips to the mill3. Purchased pulp and other major raw materials (on a weight or volume basis) to the mill4. transport of recycled fibre to the mill5. Primary product (e.g. rolls of paper or paperboard) from the mill to facilities that produce
final products6. transport of waste generated by the mill to treatment facilities7. Final products transport to distribution centres, retailers and final consumers8. transport of used products to waste-to-energy facilities, landfill sites or processing centres
where waste is sorted to produce recycled fibre
issues/disCussions
Cut-off criteria and system boundariesthe system boundaries for the footprint will determine the transport-related emissions that need to be considered. the amounts of wood fibre transported through the upstream portions of the value chain are much larger than other raw materials, so in many cases it may be possible to limit the transport calculations to emissions associated with the transport of virgin fibre and recycled fibre provided the cut-off criteria are fulfilled. Emissions associated with transporting a final product can also be significant. companies may have information on transport-related emissions associated with moving a final product to distribution centres, but other emissions associated with transporting a final product are difficult to estimate because the company has no control over, and no special knowledge of, these emissions. For this reason, companies may choose to exclude from system boundaries those emissions associated with transporting a final product, especially for footprints that are focused on emissions within the control of the company. Life cycle studies have shown that greenhouse gas emissions from internal transport in the mill are very low compared to emissions from other sources and can be ignored.
Single value for transport or show different elements of transportthe decision on whether to aggregate transport-related emissions into a single value (as suggested here) or divide them according to their place in the supply chain will be based on the intended use of the footprint.
Estimating transport emissionsthe estimation methods for transport emissions will vary depending on data availability. if the transport vehicles are owned by the company doing the footprint, it may be possible to estimate emissions based on fuel consumption. in most cases, however, estimates will be
tHE
tEN
tO
ES O
F c
ArB
ON
FO
OtP
riN
ttoe 7greenhouse gas emissions associated with transportation
THE
TEN
TO
ES O
F C
ARB
ON
FO
OTP
RIN
T
34
based on knowledge of (or assumptions about) the distances involved, the mode of transport and the expected emissions per kilometre. there are different types of emission factors for estimating transport-related emissions. the most accurate approach is to base the estimates on fuel consumption records. Lacking fuel consumption records, the best estimates are derived from detailed information on the modes of transport and distances travelled. in many cases, especially for transporting final products and for the end of life phase, it may be necessary to use generic information to estimate transport-related emissions. When using generic data to model transportation, care should be taken in avoiding double counting some transportation segments.
Greenhouse gasescH4 and N2O emissions are normally much lower than cO2 emissions related to fossil fuel combustion in transport. inclusion/exclusion of these gases depends on the cut-off criteria and the intended use of the footprint.
tHE
tEN
tO
ES O
F c
ArB
ON
FO
OtP
riN
t
35
introduCtionWhen one decides to expand the system boundaries, the eighth item to address in a carbon footprint for paper and board products is the emissions that occur when a product is used. use-related emissions are very unusual for paper and board products and this is a key asset of paper and board products compared to, for example, electronic media. this is an effective reason to mention these emissions (or lack of) in your footprint.
issues/disCussions
Clear definitionsit is extremely unusual for paper and board products to release greenhouse gases during use or to cause greenhouse gases to be released during use. Paper and board products, however, are frequently used to manufacture other products whose function is separately defined. this separate function may cause greenhouse gases to be released. in toe 8, it is important to include only those emissions that are from products defined by a unit of analysis that itself results in greenhouse gas releases during use. Quantification of Greenhouse Gas emissions from use should be done consistently with the temporal boundary.
tHE
tEN
tO
ES O
F c
ArB
ON
FO
OtP
riN
ttoe 8greenhouse gas emissions associated with product use
THE
TEN
TO
ES O
F C
ARB
ON
FO
OTP
RIN
T
36
introduCtionAfter use, paper or board products that are not recycled enter the end of life phase. Discarded products can be sent to a waste incineration facility or a power plant where the renewable energy contained in paper or board material is recovered by combustion, and thereby use of fossil fuel to produce energy may be avoided. Alternatively, discarded products can be sent to landfills where they will slowly degrade, releasing a fraction of the biomass carbon content over time as carbon dioxide or methane. the fraction of biomass carbon content released as well as the proportion of carbon dioxide and methane will depend on the conditions in the landfill and the management of the landfill gases. in some cases, discarded products may be converted into compost, allowing the biogenic carbon to return to the atmosphere over time, mostly as cO2, although some may be converted to methane.
issues/disCussions
Uncertainty
the estimates for these emissions are inherently uncertain for many reasons:
− the end of life conditions and emissions are highly site-specific.
− the product manufacturer has minimal control over, or special knowledge of, when and
where a product will be discarded.
− the most significant end of life emissions are cH4 and biomass cO2 emissions associated
with discarded paper and board in landfills but the use of landfills for waste management
varies considerably from one region to another. in Europe, common legislation prohibits
landfilling of degradable waste.
− Estimates for cH4 from landfills are greatly influenced by several parametres that also
vary considerably from one region to another – in particular (a) the use of cover systems to
collect and use as fuel or destroy cH4, and (b) degradation rates.
− the fraction of biogenic carbon that is non-degradable under anaerobic conditions varies
considerably depending on the product type as well as other factors.
System boundariesBecause of the high uncertainty, the potential for distorted comparisons between footprints, and the almost complete lack of control by the product manufacturer, care is needed in interpreting the results where end of life is included. Where included, it will often be necessary to estimate these emissions using average data reflecting the regions where it is expected the product will be disposed. Alternatively, results can be developed for a number of different end of life options to show a range of possible effects. certain end of life options may be precluded by public policies that, for instance, prohibit landfilling of certain wastes.
Waste policiesEnd of life emissions are inherently uncertain and vary enormously depending on public policies
tHE
tEN
tO
ES O
F c
ArB
ON
FO
OtP
riN
t
toe 9greenhouse gas emissions associated with product end of life
37
on waste management and site characteristics. As a result, including end of life emissions within system boundaries can result in large differences between products that are outside the producer’s control.
Estimating emissionsAppendix c examines the methods for estimating cH4 and biomass cO2 emissions from landfills receiving used paper and board products.
Emissions from burning wasteWhere used products are burned, biomass cO2 is released. How to report this emission depends on the intended use of the footprint. Other GHG emissions from burning used paper and board products (cH4 and N2O, or cO2 liberated from calcium carbonate) are small compared to emissions associated with toe 3 (manufacturing), toe 6 (purchased electricity) and toe 7 (transport), and may be ignored depending on the cut-off criteria and intended use of the footprint.
Time period for assessment of GHG emissions from landfillsQuantification of GHG emissions from landfills should be done consistently with the temporal boundary of the footprint. For instance, iSO 14067:2013 requires that “[a]ll the GHG emissions and removals arising from the end of life stage of a product shall be included in a cFP study, if this stage is included in the scope”. this means that while calculating the carbon footprint, assumptions need to be made regarding how much of the biomass carbon content in paper and paperboard sent to landfills will degrade in the long term and assume all this carbon is emitted. the fraction of the biomass carbon content that is non-degradable will depend on the paper grade as well as on landfill operating conditions. the fraction of the carbon that is degradable in the long term used to estimate emissions associated with used products in landfills at the end of life should be consistent with those used to characterise carbon stored in products. (See toe 2 for additional discussion of carbon storage in landfills.) Examples of calculation are provided in Appendix c.
Discard ratethe discard rates used to estimate emissions associated with used products at the end of life should be consistent with those used to characterise carbon stored in products. (See toe 2 for additional discussion of carbon storage in landfills.)
Accounting for electricity, steam or heat produced while burning waste product or landfill gasin some cases, waste products will be burned and the energy will be recovered. cH4 from landfills can also be captured and flared to produce energy. Burning with energy recovery, of course, can also be helpful from a GHG emissions standpoint. there are different methods for adjusting carbon footprints to account for this.
− First, the quantity of energy produced at end of life is not likely to be very significant, and thus nor will the related GHG emissions. in this case, depending on the cut-off criteria and the intended application of the footprint, it may be possible to ignore the implications for reported GHGs of energy generated at end of life.
− A second approach is to identify the energy produced at end of life as a co-product and to apply an allocation method to assign emissions to this energy. By applying this method, emissions reported under toe 9 will correspondingly be reduced.
− A third approach is to estimate the avoided emissions associated with sales of energy produced at end of life under toe 10. using this approach, one must report the total emissions from end of life under this toe.
Only one of the methods described above may be applied and it is recommended to be consistent in the footprint regarding the allocation method used for the different allocation situations.
tHE
tEN
tO
ES O
F c
ArB
ON
FO
OtP
riN
t
THE
TEN
TO
ES O
F C
ARB
ON
FO
OTP
RIN
T
in cases where recovered energy is sold, the methods for dealing with sold electricity, steam, heat or hot or cold water are different in different carbon footprint protocols and frameworks. Some examples are provided in Appendix c.
Key messageWhat can be said when discussing these emissions is the fact that a high percentage of recycling and a low rate of landfilling prevents cH4 emissions from taking place. As long as the fibre is of sufficient quality to be recycled, the majority of the carbon is stored in the product chain, extending carbon storage benefits.
tHE
tEN
tO
ES O
F c
ArB
ON
FO
OtP
riN
t
39
introduCtionWhen one decides to expand the system boundaries, the tenth item to consider addressing in a carbon footprint for paper and board products is information on emissions that do not occur (i.e. are avoided) because of an attribute of the product or an activity of the company making the product. the credibility of avoided emissions is directly dependent on that of the scenario used to describe what would have happened in the absence of the product attribute or company activity. there are an almost infinite number of possible avoided emissions therefore it is not possible to offer specific guidance.
While avoided emissions can be very useful in illustrating important connections to the climate change issue, their use in balance sheets can sometimes be controversial. the decision on whether to allow avoided emissions to be netted against other emissions on a balance sheet is primarily a policy issue that will be decided differently in different situations and will depend on the intended use of the footprint.
When using avoided emissions in a carbon footprint, it is important that the assumptions and methods be transparent and explicable to interested parties.
issues/disCussions
Examples of avoided emissionsthe least controversial avoided emissions are those that involve company activities that reduce emissions not controlled by the company. this is because avoided emissions may be the only way for a company to get “credit” for actions that reduce these emissions. Some avoided emissions of interest to the paper and board products industry include the following:
− When a mill exports electricity to the grid or heat to a local city, it may displace electricity from the grid or hot water that would have been produced by more greenhouse gas-intensive methods. thus, these emissions are avoided by the mill’s activities; however, in producing this electricity, the mill’s emissions may have increased. the use of such avoided emissions should be transparently described, and depends on the purpose of the carbon footprint.
− Several national authorities have developed information to assist in calculating the greenhouse gas emissions avoided by recycling paper. the avoided emissions are extremely dependent on local conditions and are especially significant in situations where the paper would have been landfilled if it was not recycled. these avoided emissions will also depend on whether the alternative use of the used paper is burning for energy to displace fossil fuels for heat and electricity production. Again, the inclusion or not of avoided emissions from paper recycling depends on the allocation method used. including avoided emissions and another allocation method will result in double counting.
− in some cases, paper and paperboard products have the potential to reduce life cycle greenhouse gas emissions compared to alternative fossil-based products. in such cases, the use of the paper or paperboard products can be said to avoid greenhouse gas emissions compared to a scenario where more greenhouse gas-intensive materials would have been used.
toe 10avoided greenhouse gas emissions (optional)
tHE
tEN
tO
ES O
F c
ArB
ON
FO
OtP
riN
t
THE
TEN
TO
ES O
F C
ARB
ON
FO
OTP
RIN
T
40
− if mill waste materials are used as fertilisers, they may avoid the emissions associated with the production of fertilisers that would have been used.
− Burning used products or waste materials as a source of biomass energy can avoid emissions associated with the fuels that would have been used otherwise.
− if a mill produces small amounts of co-products, it may avoid alternative production of these co-products elsewhere.
Using avoided emissions in balance sheetsAvoided emissions can be netted against other emissions only where it is consistent with the intended use of the footprint, otherwise they should be reported as additional information. reporting avoided emissions from the co-products, recycling or beneficial use of mill waste should not be undertaken if another method (e.g. allocation) is applied to deal with the associated emissions. considerations in applying avoided emissions methods in various carbon footprint protocols and frameworks are discussed in Appendix c.
tHE
tEN
tO
ES O
F c
ArB
ON
FO
OtP
riN
t
41
additional information (optional):
there are many complex and important connections between the paper and board products industry and the climate change issue other than these discussed so far. Some of these are difficult or impossible to quantify. Nonetheless, it may be important for stakeholders to understand these connections. For this reason, this framework encourages providing additional information where appropriate.
Some examples of useful additional information may include the following:− information on the forest products industry, including the paper and board sectors, support
to infrastructure that can be used to grow, collect and transport biomass for a range of uses that benefit the atmosphere;
− information on the industry’s continuous efforts to increase the efficiency with which it uses wood, making additional amounts available for other uses that benefit the atmosphere;
− Detailed information on biomass carbon removal in forests; − Assumption used in calculating the biomass carbon content of a paper or board product; − information that supports assumptions that the use phase results in little to no emissions; − Assumptions and/or results of sensitivity analyses when calculating emissions and storage
associated with product end of life; − information on avoided emissions other than when used as an allocation method;− information on other relevant environmental aspects, for instance related to biodiversity
(e.g. relevant certifications);− Etc.
tHE
tEN
tO
ES O
F c
ArB
ON
FO
OtP
riN
t
THE
TEN
TO
ES O
F C
ARB
ON
FO
OTP
RIN
T
42
the Carbon Footprint balance sheet
the balance sheet is the part of the footprint that includes emissions and removal that that can be quantified and logically added or subtracted to calculate the total cFP value reported. the decision to use footprint estimates in a balance sheet needs to be consistent with the intended use of the footprint. in addition to the intended use of the footprint, several other factors must be considered, including the following:
− Only emissions and removal within system boundaries should be included on a balance sheet.
− it is important that balance sheets for product-level carbon footprints communicated externally contain estimates in each toe that are not limited to those emissions that the company controls. Doing so would result in balance sheets for a single product that varied greatly depending on where in the value chain the company preparing the footprint was located. Of course, if the footprint is company level instead of product level, and focuses on sources owned or controlled by the company, it may be appropriate to limit the footprint to such sources.
− the accuracy of the estimates should be adequate to meet the intended use of the footprint.
− companies should be willing to document, and provide to stakeholders, the assumptions, methods and data used to develop estimates contained in balance sheets that are available to the public. in particular, companies should be prepared to explain the following:
o the unit of analysis (i.e. the unit of product for which the calculations were done (can be a functional unit or a declared unit, depending on the intended use of the footprint), and the function of the product o System boundaries (including which sources and avoided emissions are included and which greenhouse gases are included) o Sources for emission factors and other data o calculation methods o main assumptions made o treatment of data gaps.
− the special considerations involved in using estimates of biomass carbon removal and storage in balance sheets are discussed in Appendix c.
− Example formats for reporting the results of a carbon footprint for paper and board products shown in Appendix D may also be suitable as a balance sheet, but would include only those toes for which the estimates were suitable for use on a balance sheet.
tHE
cA
rBO
N F
OO
tPri
Nt
BALA
Nc
E SH
EEt
43
glossary
the following terms are taken from Annex iii of the report of Working Group i to the Fifth Assessment report of the intergovernmental Panel on climate change, unless otherwise specified.
afforestationPlanting of new forests on lands that historically have not contained forests.
biomassmaterial of biological origin excluding material embedded in geological formations and material transformed to fossilised material, and excluding peat (iSO/tS 14067:2013).
Carbon cyclethe term used to describe the flow of carbon (in various forms, e.g. as carbon dioxide) through the atmosphere, ocean, terrestrial biosphere and lithosphere.
Carbon dioxide (Co2)A naturally occurring gas, also a by-product of burning fossil fuels from fossil carbon deposits, such as oil, gas and coal, of burning biomass and of land use changes and other industrial processes. it is the principal anthropogenic greenhouse gas that affects the Earth’s radiative balance. it is the reference gas against which other greenhouse gases are measured and therefore has a Global Warming Potential of 1.
Carbon storage (in a product): carbon removed from the atmosphere and stored as carbon in a product [including a product in landfill]. in the case of products from biomass, carbon storage is calculated as carbon removal during plant growth and subsequent emission if the carbon is released in the end of life stage. the carbon removal is equal to the carbon contained in the product (iSO/tS 14067:2013).
Co2-equivalentSee equivalent carbon dioxide emission.
declared unitQuantity of saleable product to be used as a unit of analysis (no source).
deforestationconversion of forest to non-forest (Working Group i contribution to the Fifth Assessment report of the intergovernmental Panel on climate change (Annex iii)).
direct land use change (dluC)change in human use or management of land within the product system being assessed (iSO/tS 14067:2013).
equivalent carbon dioxide (Co2) emissionthe concentration of carbon dioxide that would cause the same radiative forcing as a given mixture of carbon dioxide and other forcing components. its value may consider only greenhouse gases, or a combination of greenhouse gases and aerosols. Equivalent carbon dioxide concentration is a metric for comparing radiative forcing of a mix of different greenhouse gases at a particular time but does not imply equivalence of the corresponding climate change responses nor future forcing. there is generally no connection between equivalent carbon dioxide emissions and resulting equivalent carbon dioxide concentration.
Functional unitQuantified performance of a product system for use as a unit of analysis (modified from iSO/tS 14067:2013).
global warming potential (gwp)An index, based upon radiative properties of well-mixed greenhouse gases, measuring the radiative
GLO
SSA
ry
THE
TEN
TO
ES O
F C
ARB
ON
FO
OTP
RIN
T
44
forcing of a unit mass of a given well-mixed greenhouse gas in the present day atmosphere integrated over a chosen time horizon, relative to that of carbon dioxide. the GWP represents the combined effect of the differing times these gases remain in the atmosphere and their relative effectiveness in absorbing outgoing thermal infrared radiation. the Kyoto Protocol is based on GWPs from pulse emissions over a 100-year time frame.
greenhouse effectthe infrared radiative effect of all infrared-absorbing constituents in the atmosphere. Greenhouse gases, clouds, and (to a small extent) aerosols absorb terrestrial radiation emitted by the Earth’s surface and elsewhere in the atmosphere. these substances emit infrared radiation in all directions, but, everything else being equal, the net amount emitted to space is normally less than would have been emitted in the absence of these absorbers because of the decline of temperature with altitude in the troposphere and the consequent weakening of emission. An increase in the concentration of greenhouse gases increases the magnitude of this effect; the difference is sometimes called the enhanced greenhouse effect. the change in a greenhouse gas concentration because of anthropogenic emissions contributes to an instantaneous radiative forcing. Surface temperature and troposphere warm in response to this forcing, gradually restoring the radiative balance at the top of the atmosphere.
greenhouse gas (ghg)Greenhouse gases are those gaseous constituents of the atmosphere, both natural and anthropogenic, that absorb and emit radiation at specific wavelengths within the spectrum of terrestrial radiation emitted by the Earth’s surface, the atmosphere itself, and by clouds. this property causes the greenhouse effect. Water vapour (H2O), carbon dioxide (cO2), nitrous oxide (N2O), methane (cH4) and ozone (O3) are the primary greenhouse gases in the Earth’s atmosphere.
indirect land use change (iluC)change in the use or management of land which is a consequence of direct land use change, but which occurs outside the product system being assessed (iSO/tS 14067:2013).
intermediate/Final productsintermediate products are goods that are used as inputs in the production of other goods and services. Final products are goods and services that are ultimately consumed by the end user rather than used in the production of another good or service. (Wri/WBcSD GHG Protocol Product Standard).
reforestationPlanting of forests on lands that have previously contained forests but that have been converted to some other use.
removalmass of GHG removed from the atmosphere [for instance, from trees growing]. in the case of products from biomass, the carbon removal is equal to the carbon contained in the product (iSO/tS 14067:2013). Alternative terminologies include carbon uptake and carbon sequestration.
sinkAny process, activity or mechanism that removes a greenhouse gas, an aerosol or a precursor of a greenhouse gas or aerosol from the atmosphere.
GLO
SSA
ry

Framework ForCarbon Footprints For
paper and board produCts
appendices
April 2017
2
3
1 The PEFCR addresses greenhouse gases (GHG) along with a variety of other environmental aspects
2 ISO 14040:2006, Environmental management -- Life cycle assessment -- Principles and framework, 14044:2006 Environmental management -- Life cycle assessment -- Requirements and guidelines
3 ISO/TS 14067:2013, The “Greenhouse gases — Carbon footprint of products — Requirements and guidelines
for quantification and communication” technical specification from the International Organisation for Standardization
4 ISO 14025:2006, “Environmental labels and declarations -- Type III environmental declarations -- Principles
and procedures”
4
5 http://www.environdec.com
6 http://ec.europa.eu/environment/eussd/smgp/dev_methods.htm
7 http://shop.bsigroup.com/upload/shop/download/pas/pas2050.pdf
5
8 http://affichage-environnemental.afnor.org/
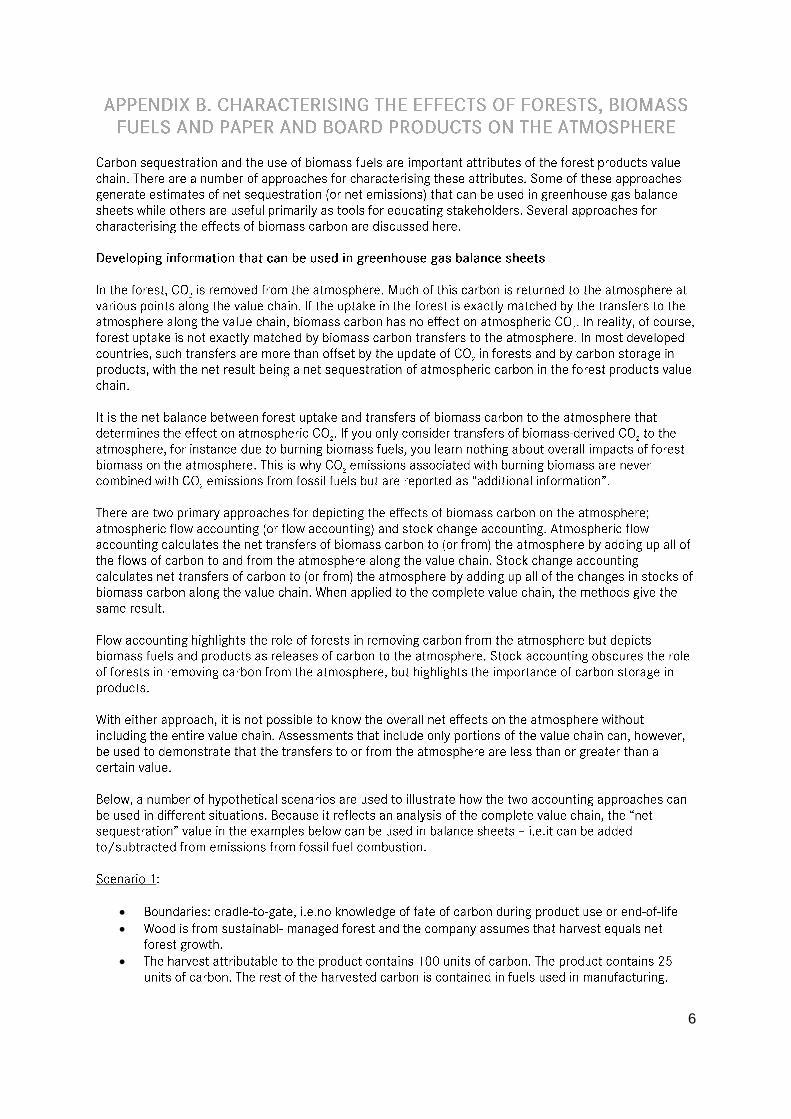
6
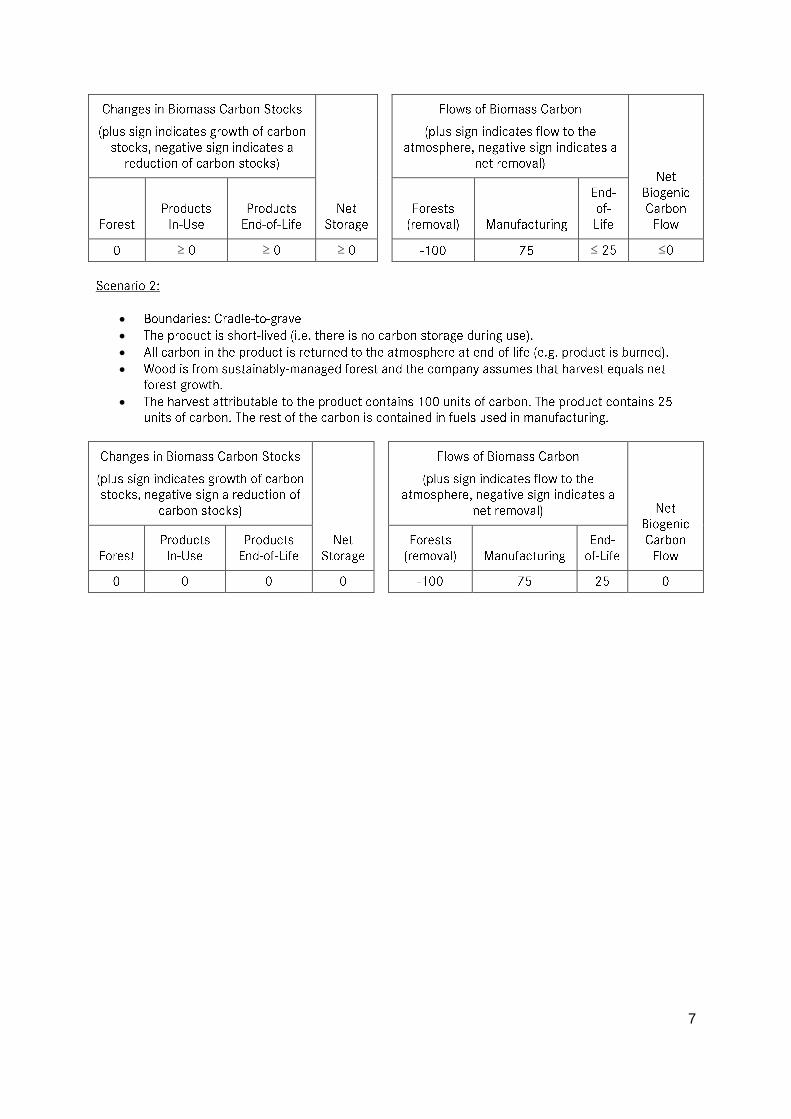
7
≥ ≥ ≥ ≤ ≤
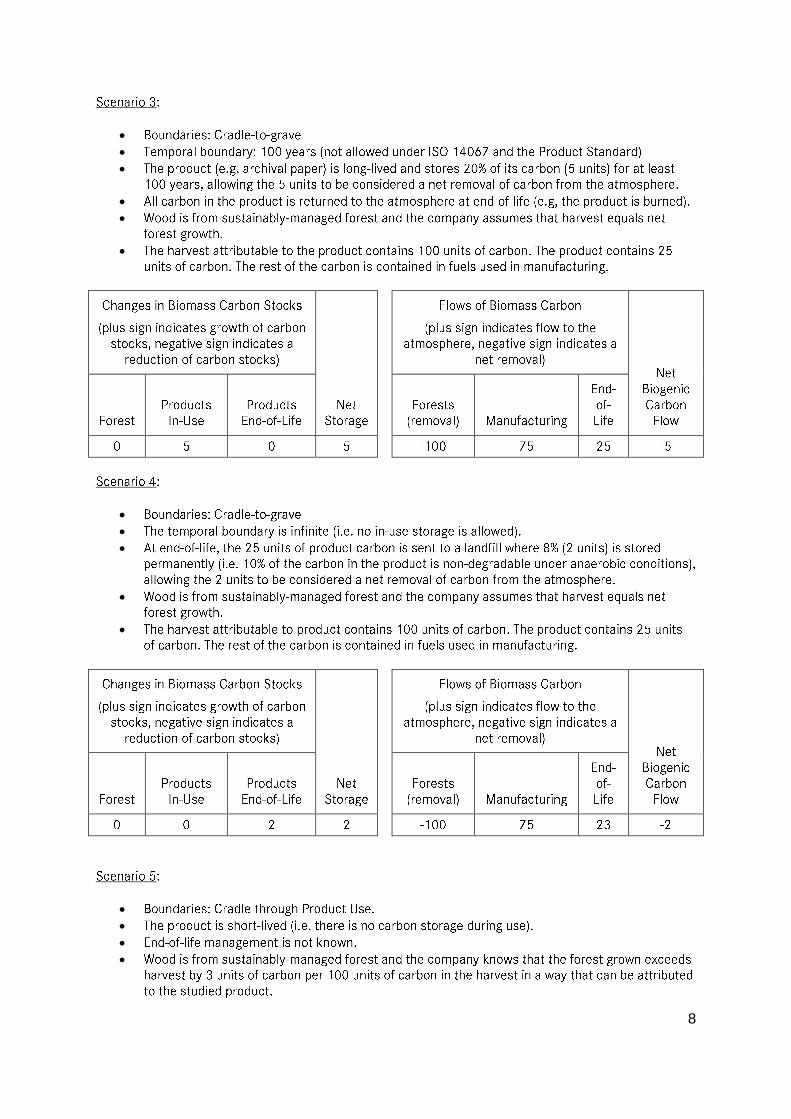
8
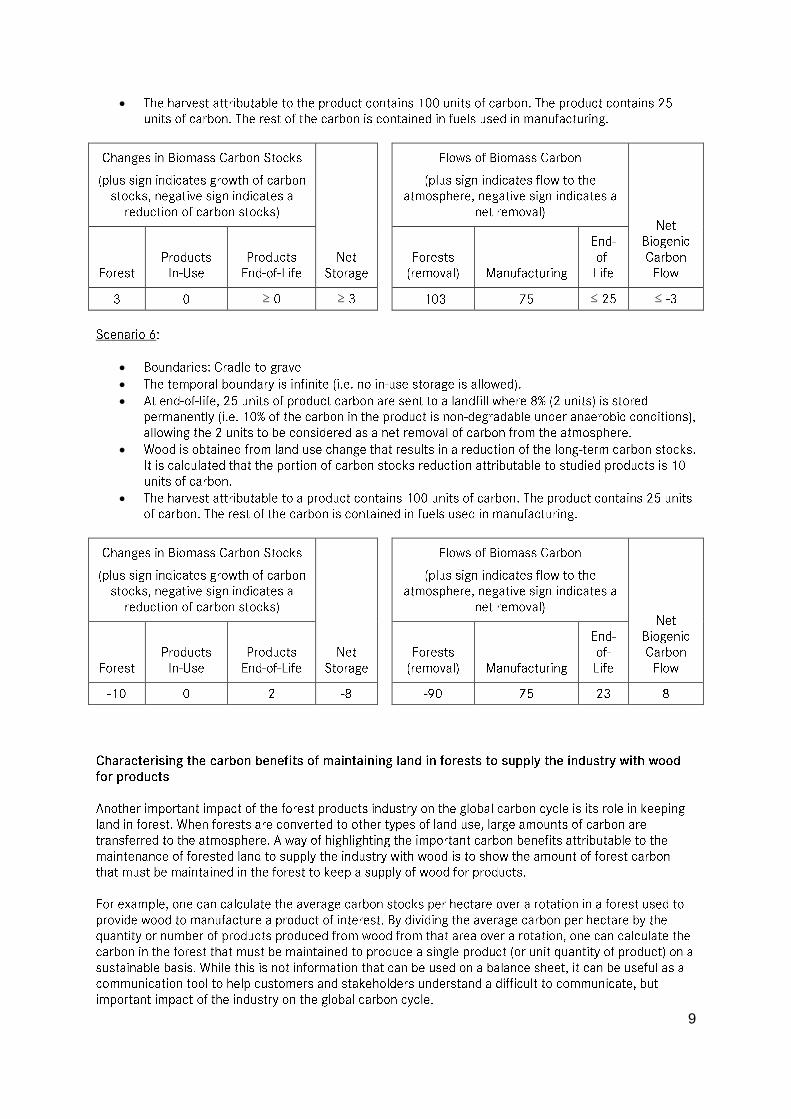
9
≥ ≥ ≤ ≤
10
11
12
13
15
16
17
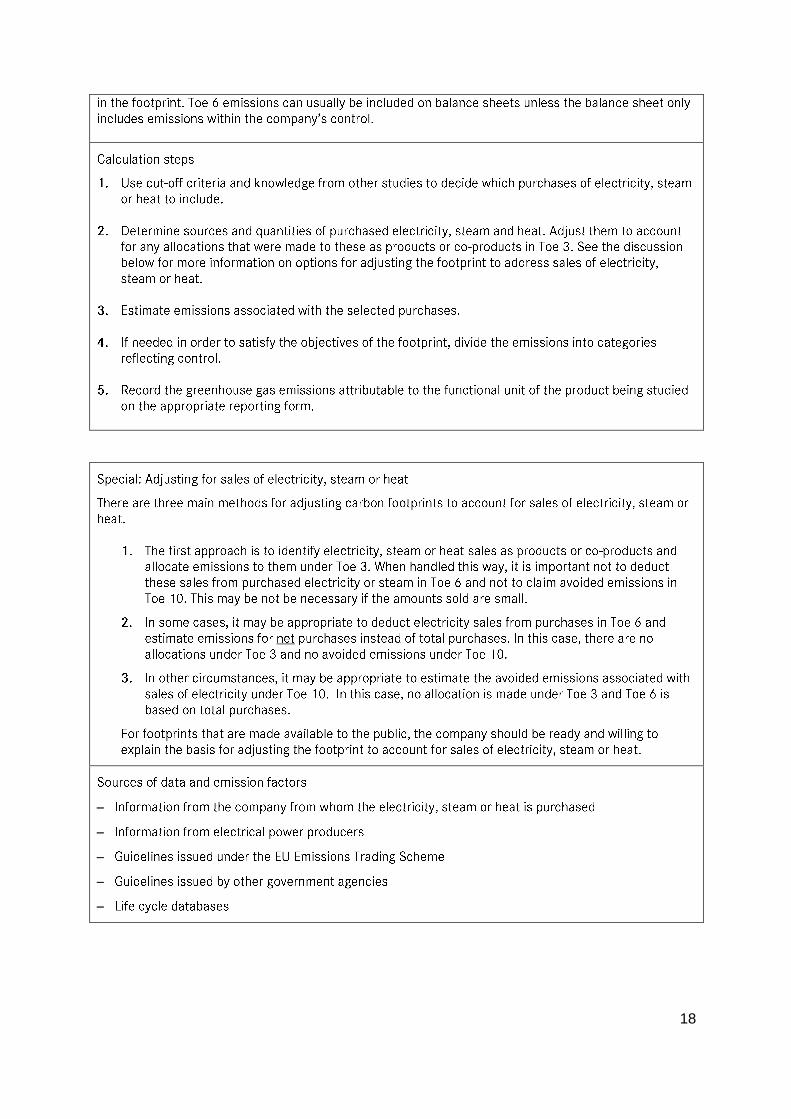
18
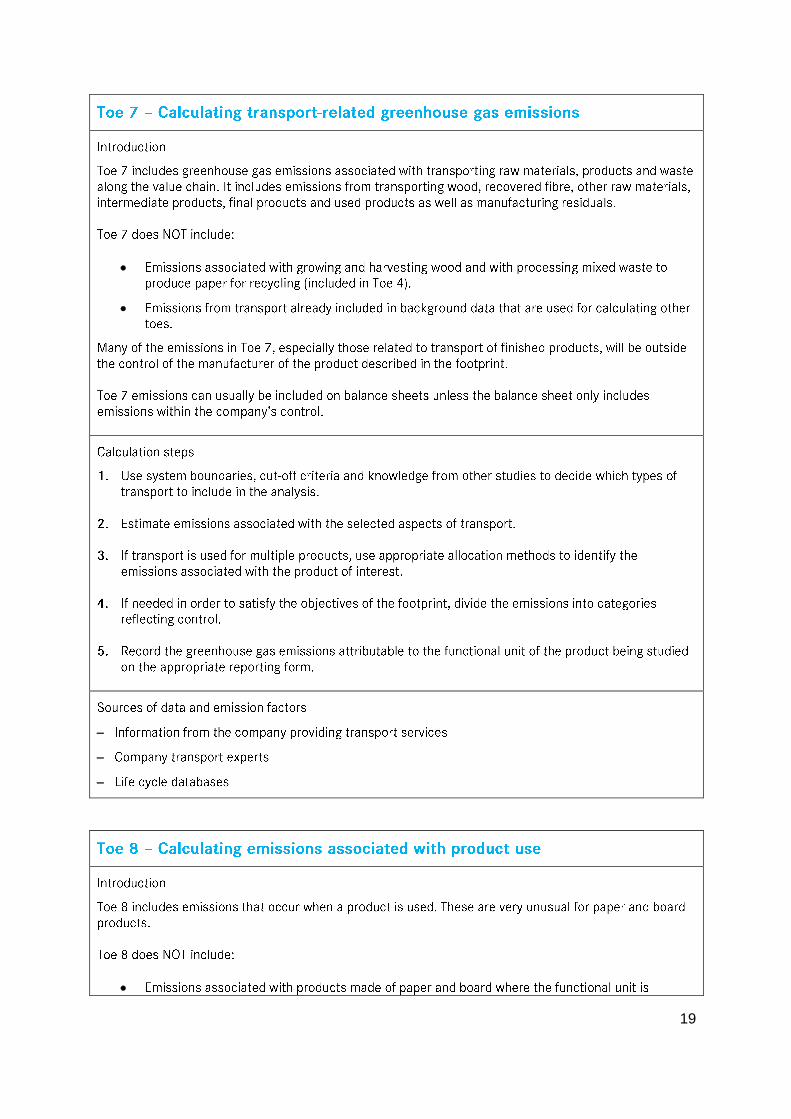
19
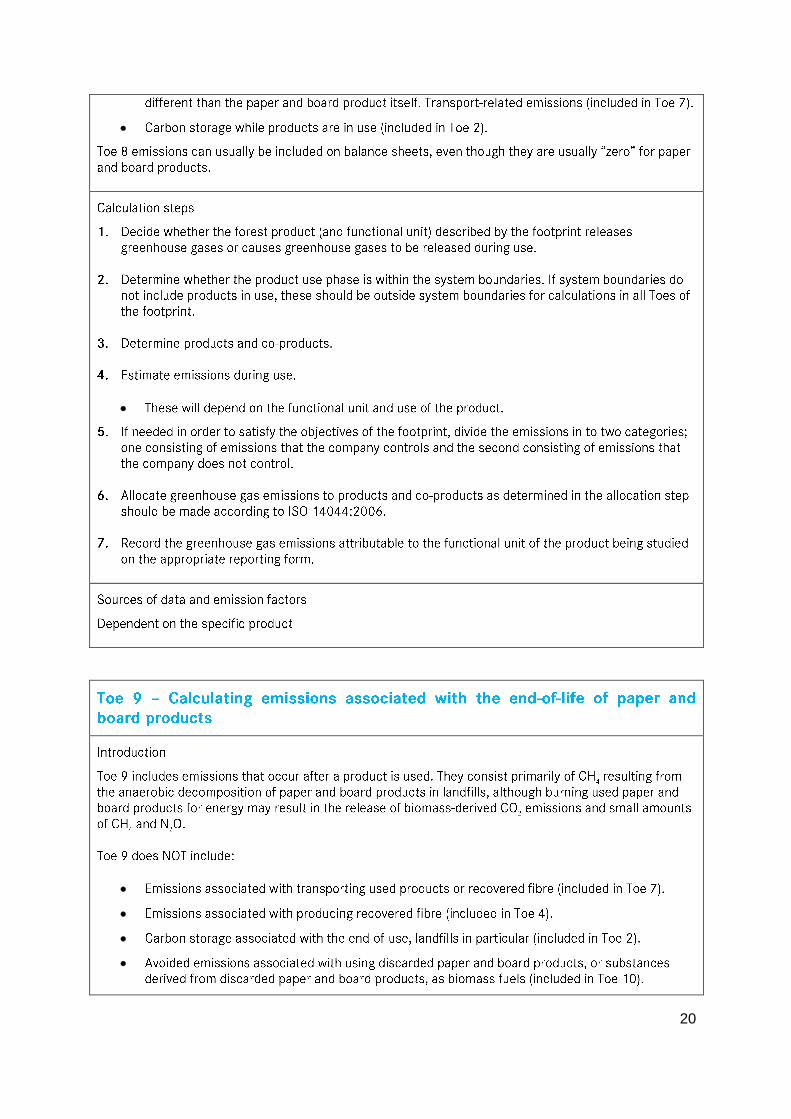
20
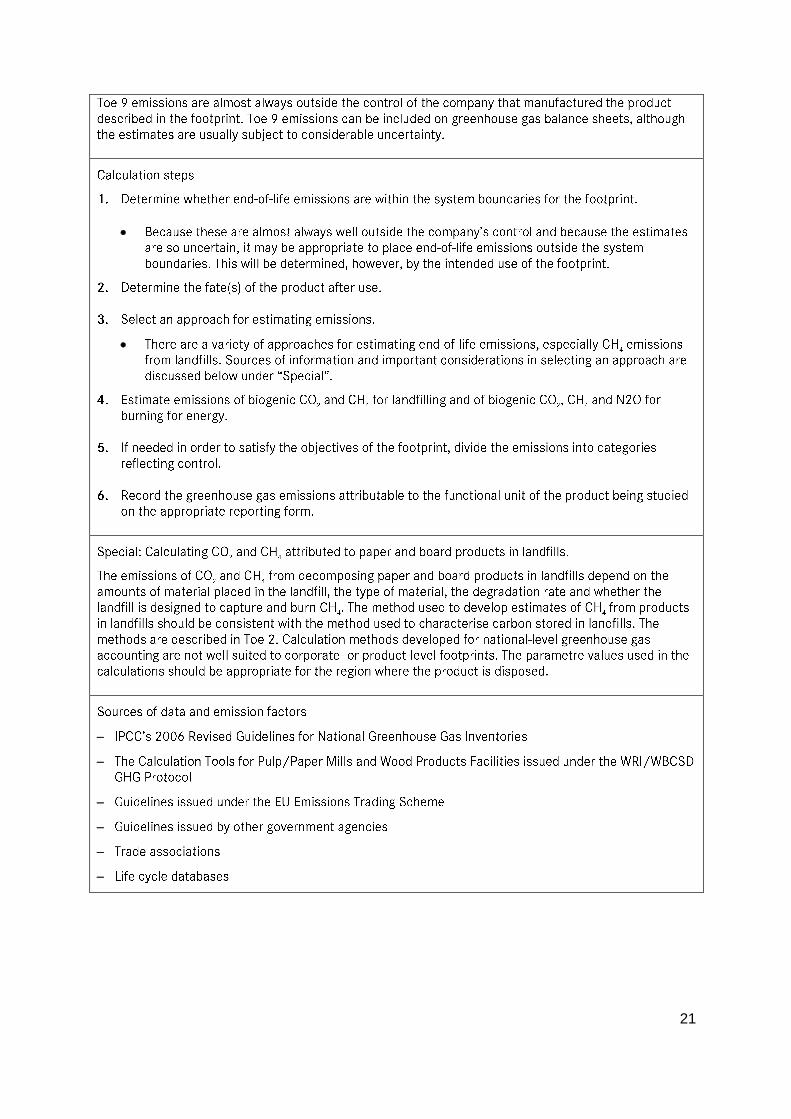
21
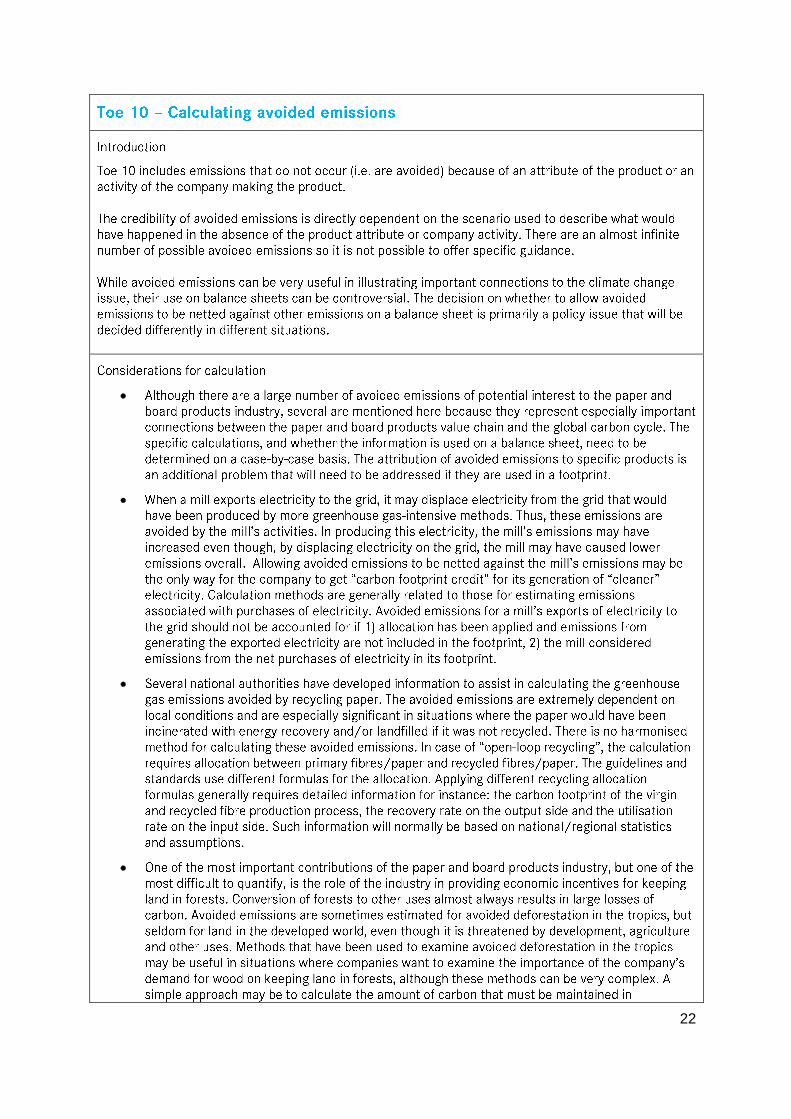
22
23
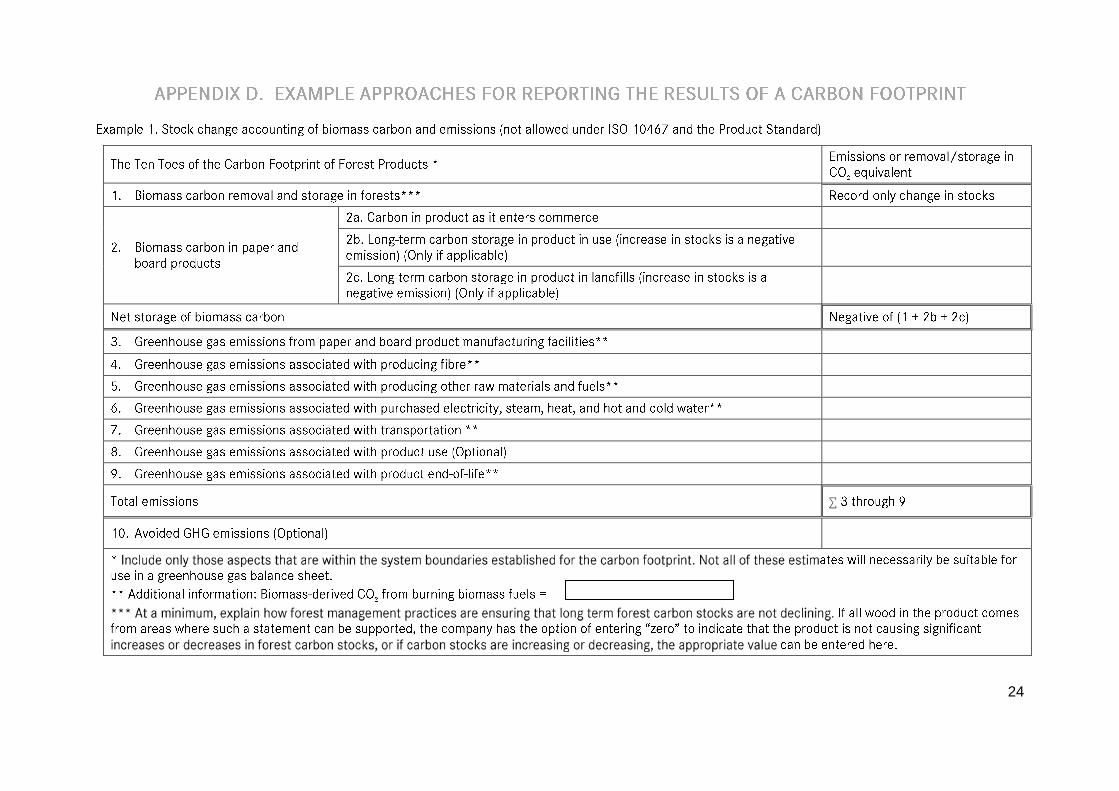
24
∑
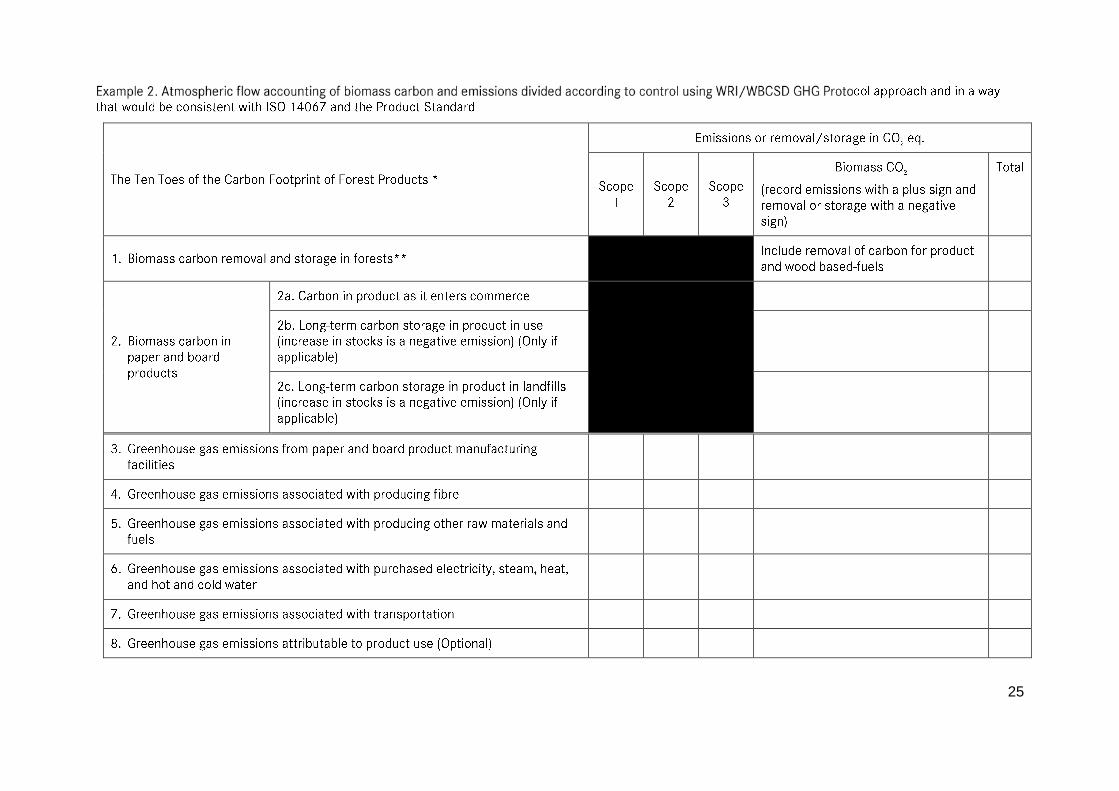
25
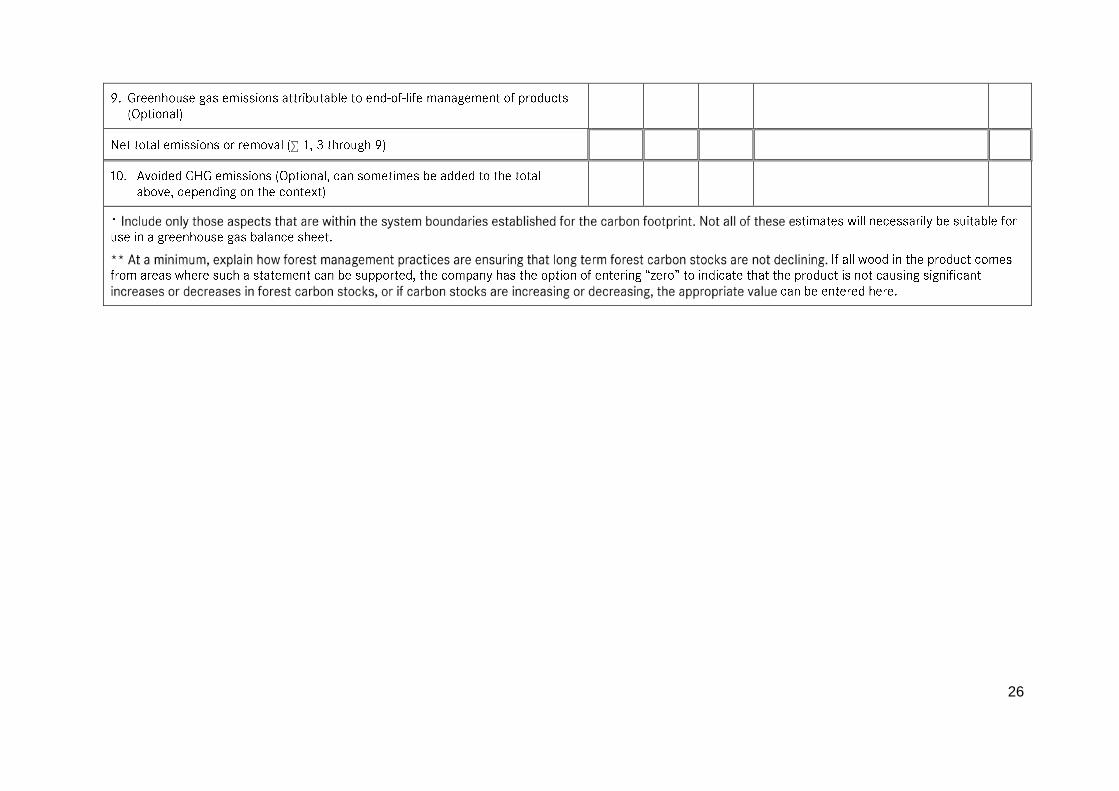
26
∑
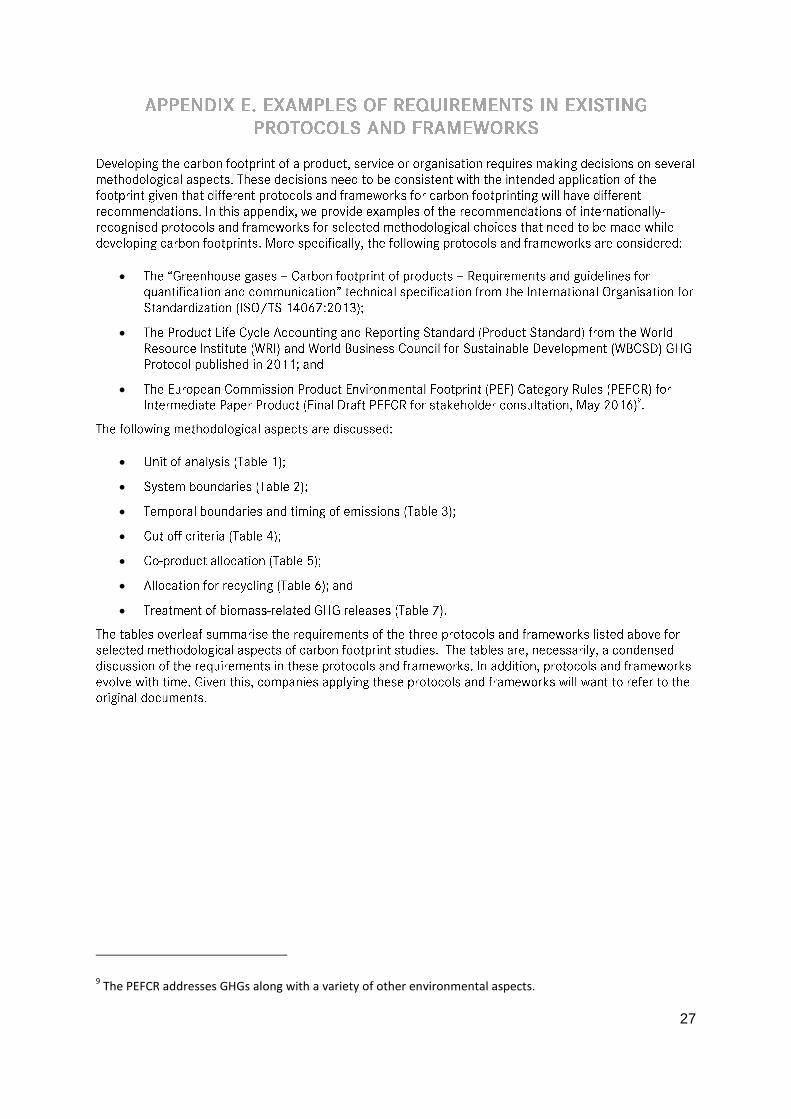
27
9 The PEFCR addresses GHGs along with a variety of other environmental aspects.
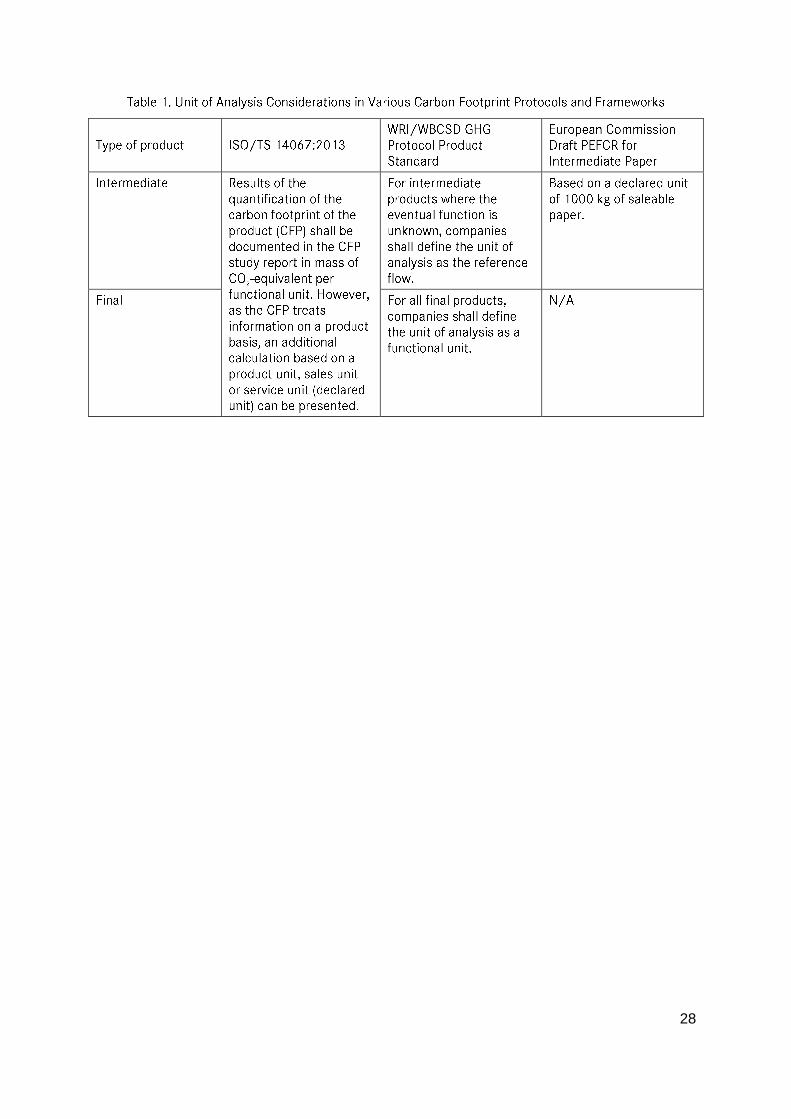
28
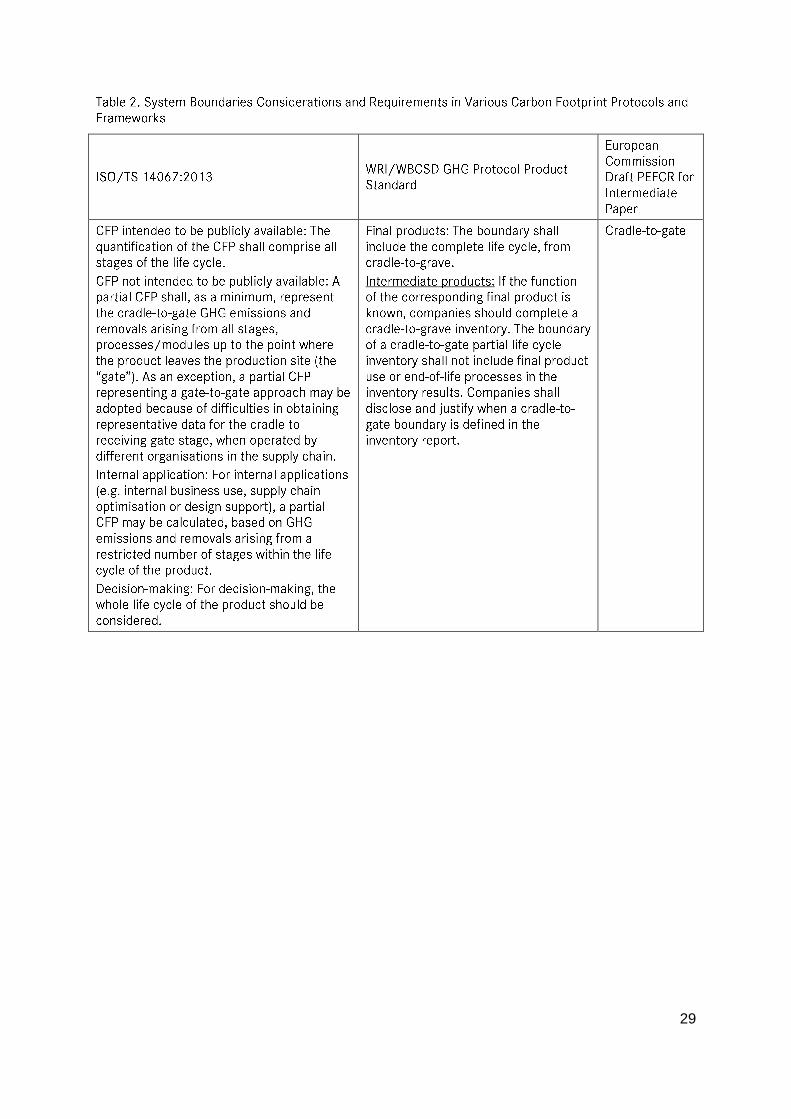
29
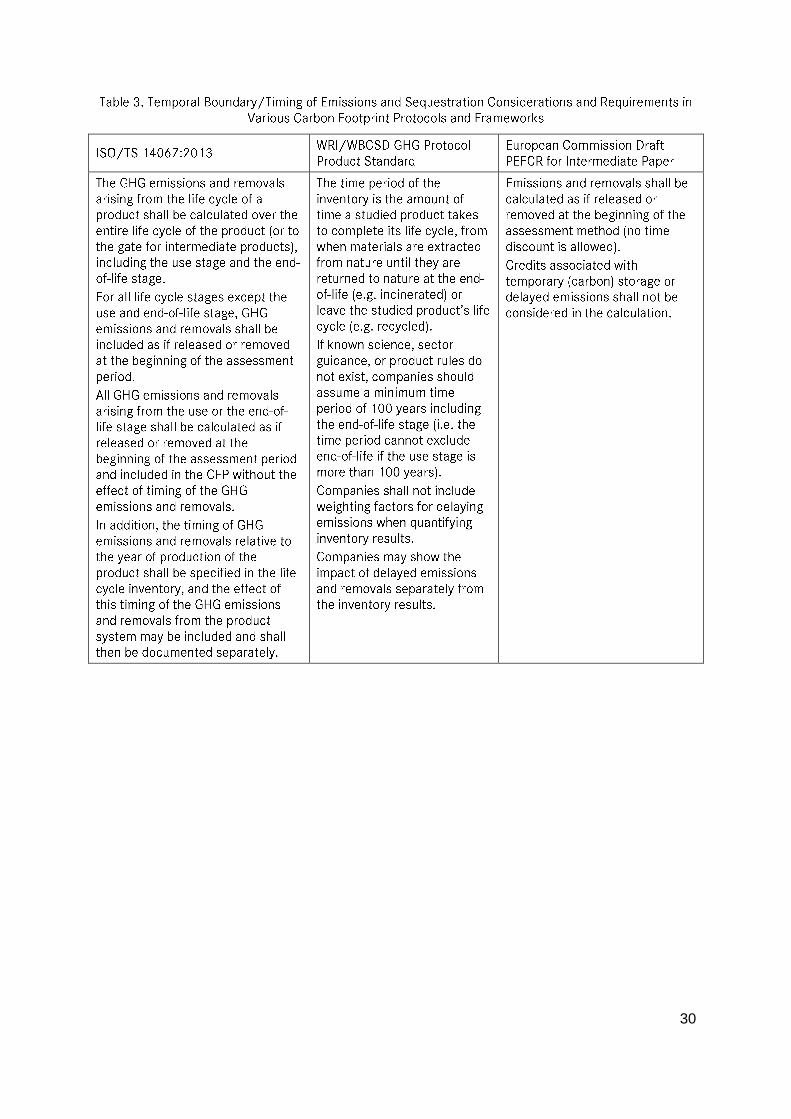
30
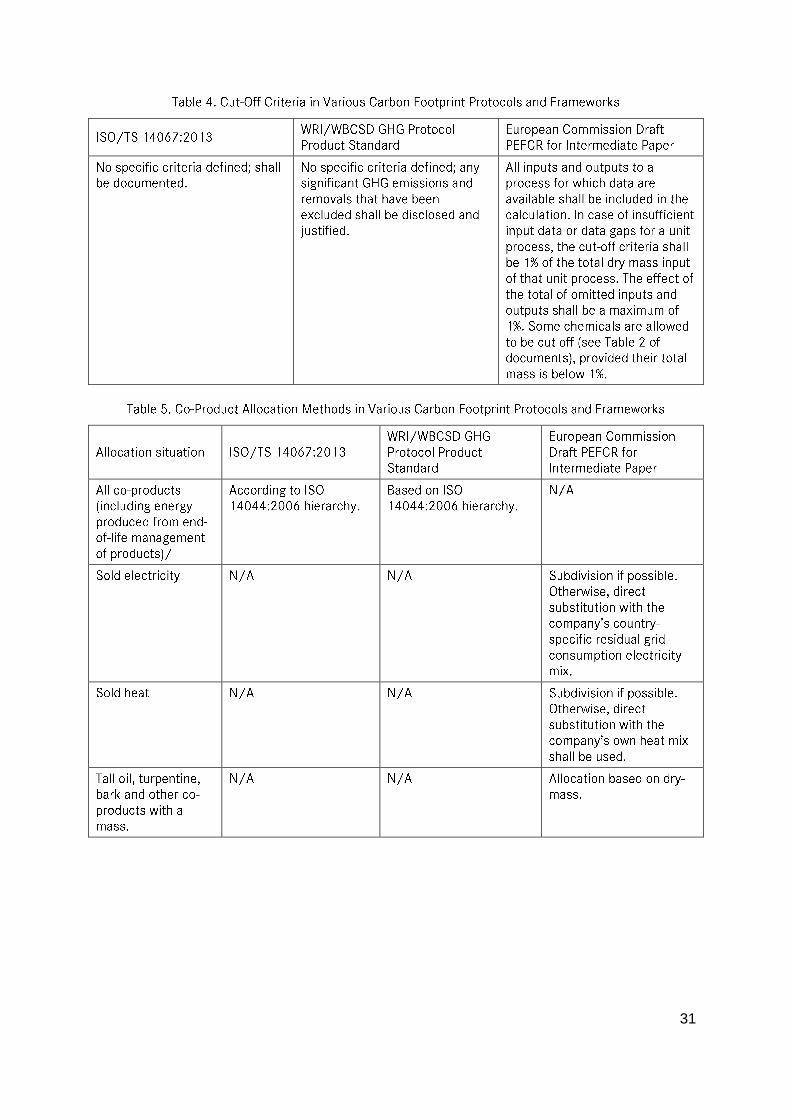
31
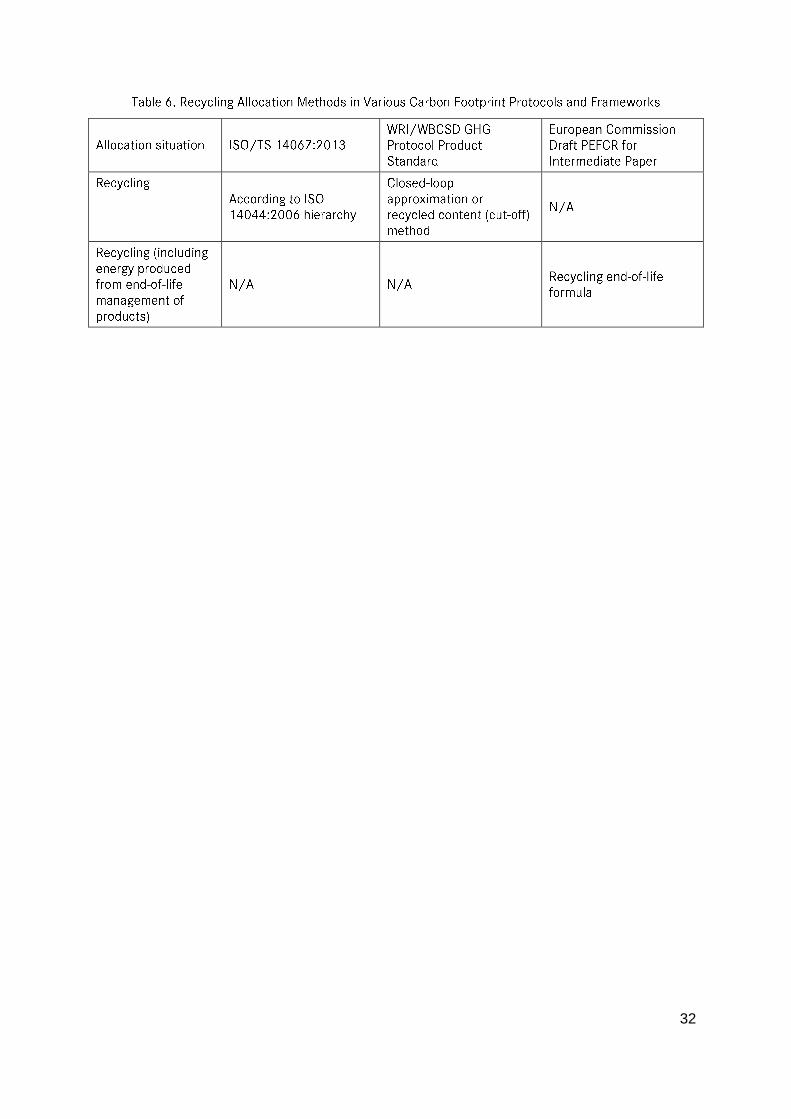
32
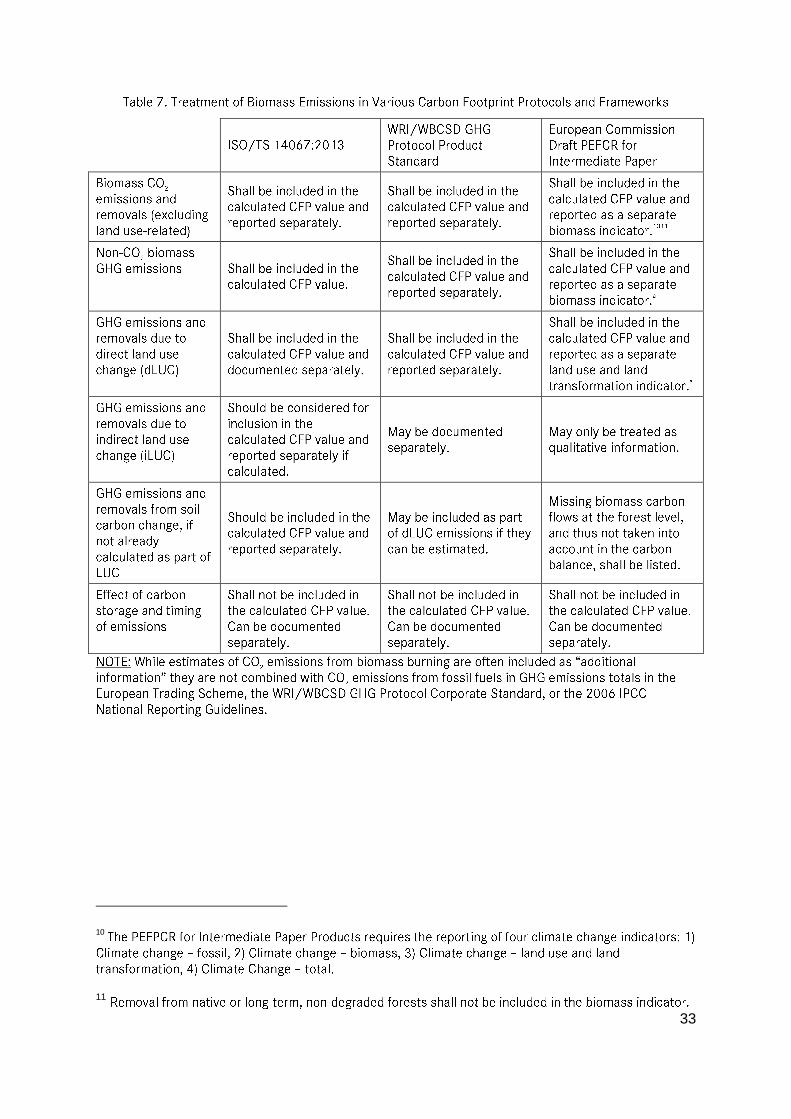
33
10
11