Embed Size (px)
Citation preview

Causes, Time Scales and Consequences
François M. M. Morel
Slides by Ja-Myung Kim

Years before 2010
330 µatm
400 µatm
Vostok paleo
Petit et al. 1999 , Keeling et al.
Mauna Loa
from ice core & modern data
Changes in atm. CO2 concentrationpC
O2 (
µatm
)
400 µatm

Seawater pCO2 time-series monitoring stn.
ESTOC(1995-2009)
BATS(1983-2009)
ALOHA(1988-2009)

Decadal changes at time-series stations
ESTOC(1995-2009)
BATS(1983-2009)
ALOHA(1988-2009)
400
350
300
250
200
1985 1990 1995 2000 2005 2010
Year
pCO
2 (µa
tm)
ALOHA(1988-2009)
ESTOC(1995-2009)
Bates NR, Byrne RH, Dore JE, Feely RA, Gonzalez-Davila M, Karl DM, Lee K, Kleypas JA, Orr J (IPCC ARS)
400
350
300
250
200
1985 1990 1995 2000 2005 2010
Year
pCO
2 (µa
tm)
BATS(1983-2009)
pCO2 increase = 1.5 - 1.8 μatm yr-1
400
350
300
250
200
1985 1990 1995 2000 2005 2010
Year
pCO
2 (µa
tm)

Atlantic0
1000
2000
3000
Pres
sure
(db)
60° 50° 40° 30° 20° 10° 0° 10° 50° 60° N40°30°20°
Indian Pacific0
1000
2000
3000
Pres
sure
(db)
60° 50° 40° 30° 20° 10° 0° 10° 50°40°30°20°60° 50° 40° 30° 20° 10° 0° 10° 20°
Latitude
0
1000
2000
3000
Pres
sure
(db)
Latitude
Vertical distributions of CO2 in the ocean
Anthropogenic CO2 conc. (μmol kg-1)
50403020100
“Half of the CO2 stored in the oceans is found in the upper
10% of the ocean”
Sabine et al. 2004
Anthropogenic carbon emissions are increasing atmospheric CO2
Ocean is a CO2 sink
Why and Howdoes that affect ocean chemistry ?
Ocean acidification

CO2 (aq)
HCO3- CO3
2-
+ H2O + HCO3-H+
CO2 (aq)CO2 (g)
Effect of CO2 on carbonate system
H+ +
CO2 increases CO3
2- decreasesH+ increases (pH decreases)

ESTOC(1995-2009)
BATS(1983-2009)
ALOHA(1988-2009)
Decadal changes of pH & CO32-
at time-series monitoring stn.pH decrease: 0.0013 - 0.0018 yr-1
CO32- decrease : 0.5 - 0.9 µmol kg-1 yr-1

CO32-
pH
CO2
CO32-
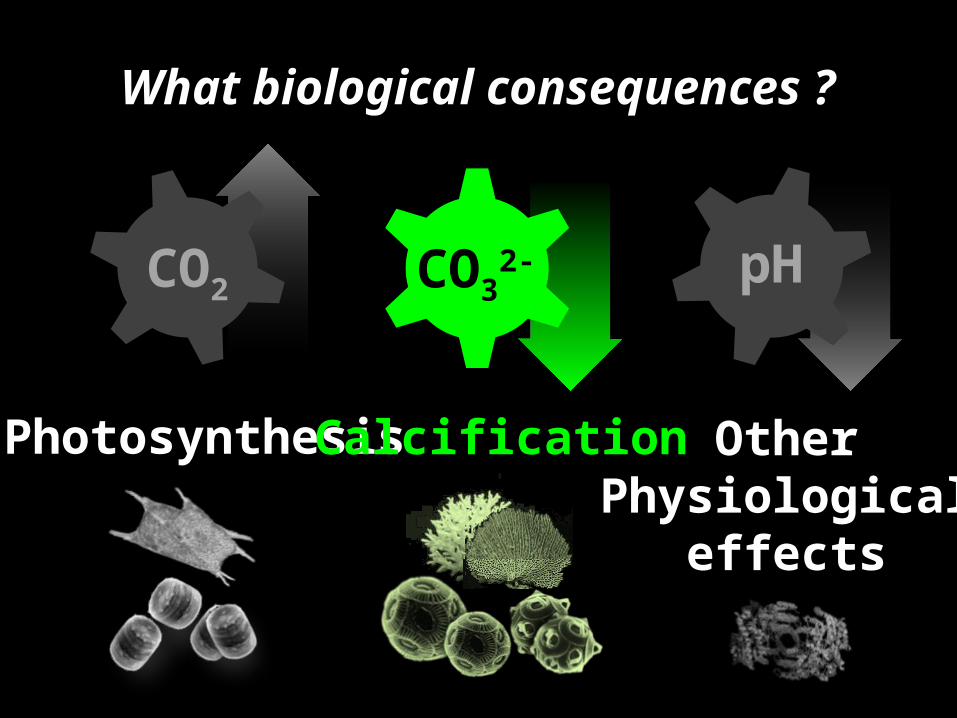
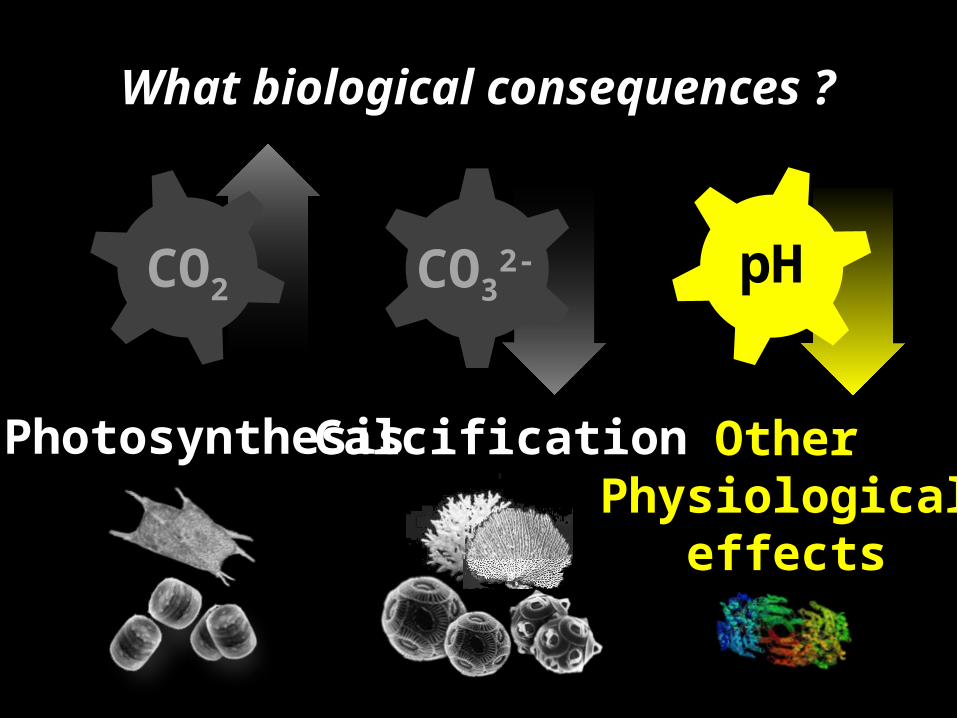
What biological consequences ?
Photosynthesis
CalcificationOther
physiologicaleffects

What biological consequences ?
Photosynthesis Calcification OtherPhysiological
effects
CO2 CO32- pH

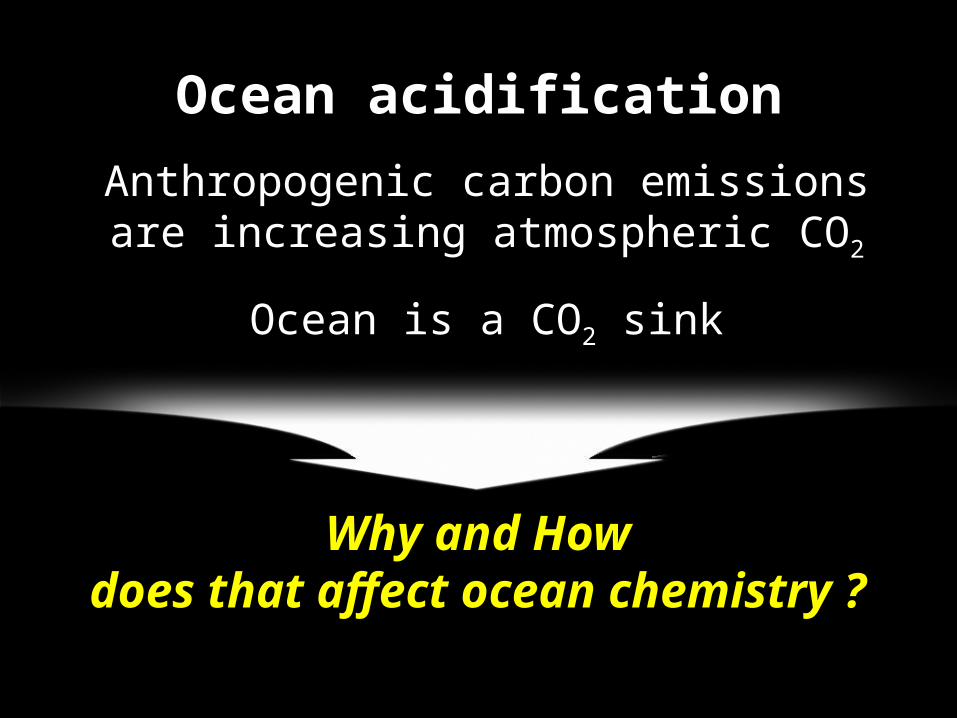
Experimental approaches
Molecular mechanisms
Lab cultures
Coastal in-situ perturbation
Open ocean monitoring
Bottles
Big bags
Natural env.

Open ocean monitoring
Univ. of BergenUniv. of BergenUniv. of WashingtonUniv. of Washington
EPOCAEPOCA
POSTECHPOSTECH
Svalbard
Norway
South Korea
U.S.A
Mesocosm

Open ocean mesocosm, Baltic seaU. Riebesell (GEOMAR)
In situ ecosystem-based CO2 perturbation experiment
MESOCOSM
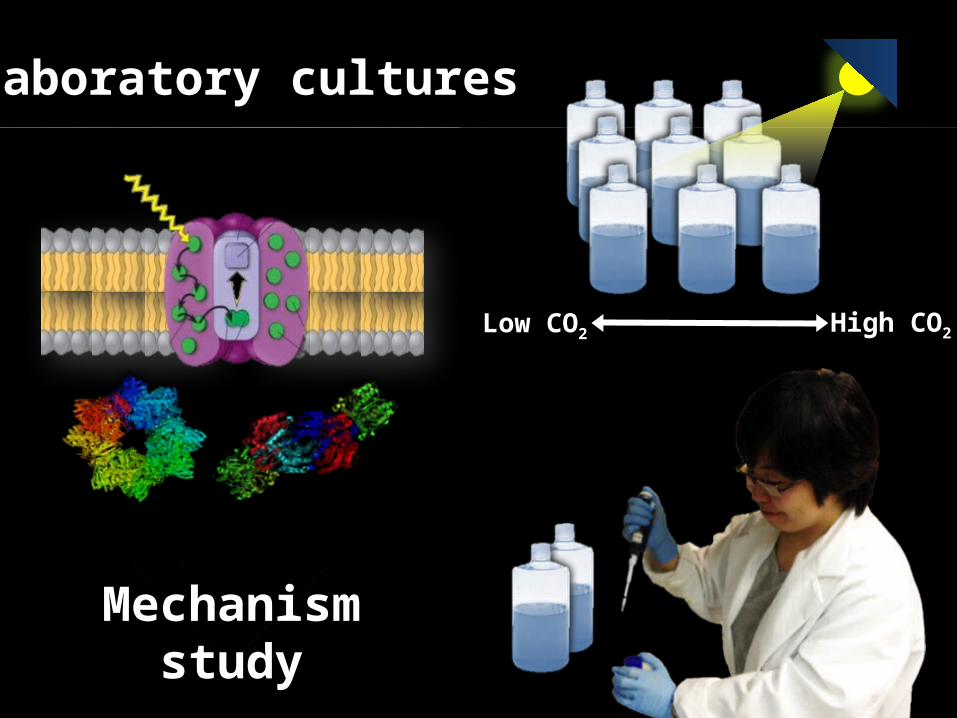
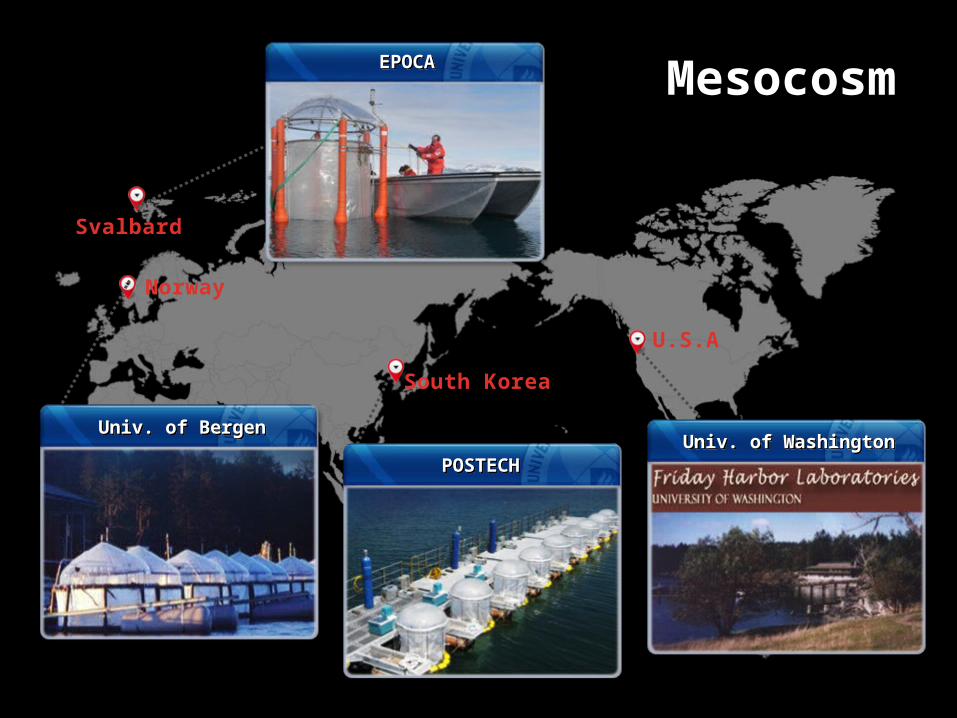
Laboratory cultures
Low CO2 High CO2
Mechanismstudy

What biological consequences ?
Photosynthesis Calcification OtherPhysiological
effects
CO2 CO32- pH

Photosynthesis
CH2OOrganic matter
Light reaction
Dark reactione-
photons
H2O
O2
CO2
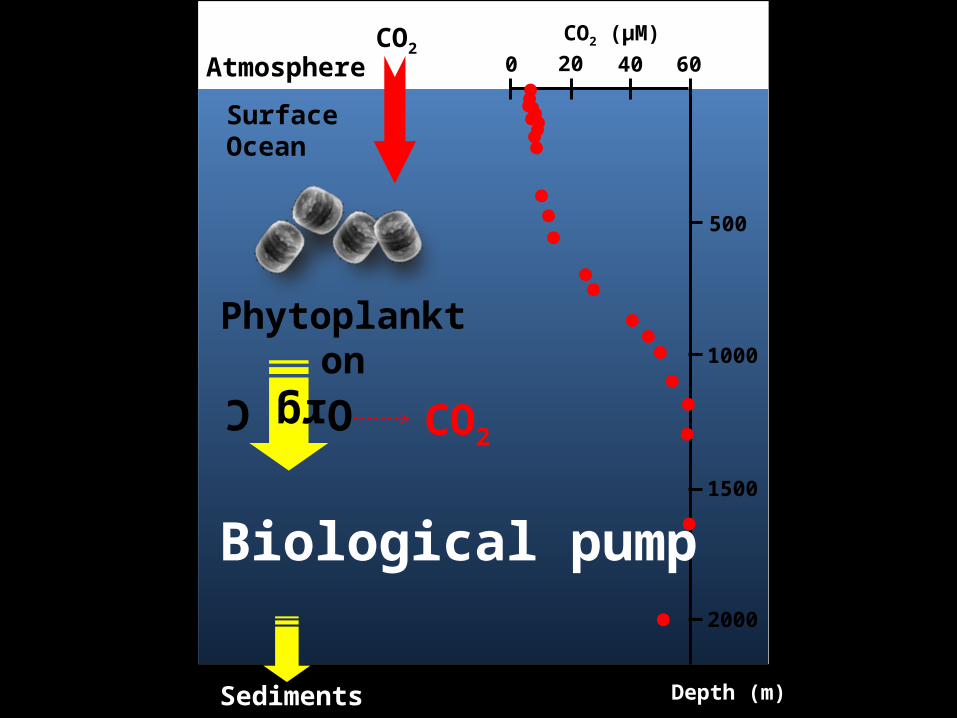
Sediments
Atmosphere
Org C
Phytoplankton
SurfaceOcean
CO2
CO2
500
1000
1500
2000
Depth (m)
0 20 40 60
CO2 (µM)
Biological pump
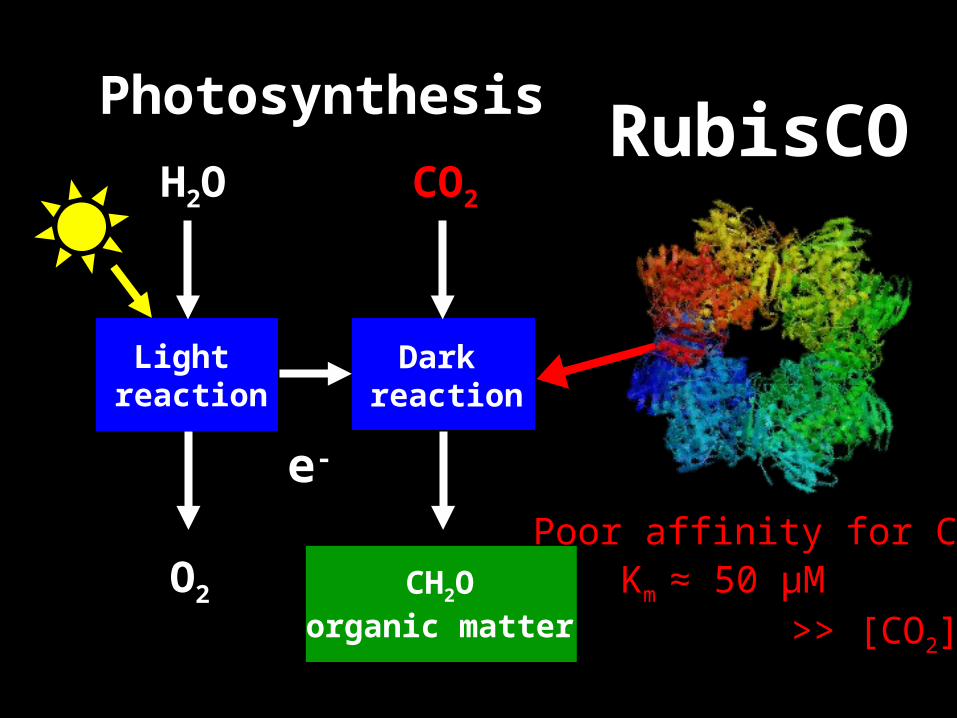
Photosynthesis
Light reaction
Dark reaction
e-
H2O
O2
CO2
CH2Oorganic matter
RubisCO
Poor affinity for CO2 Km ≈ 50 µM
>> [CO2]seawater
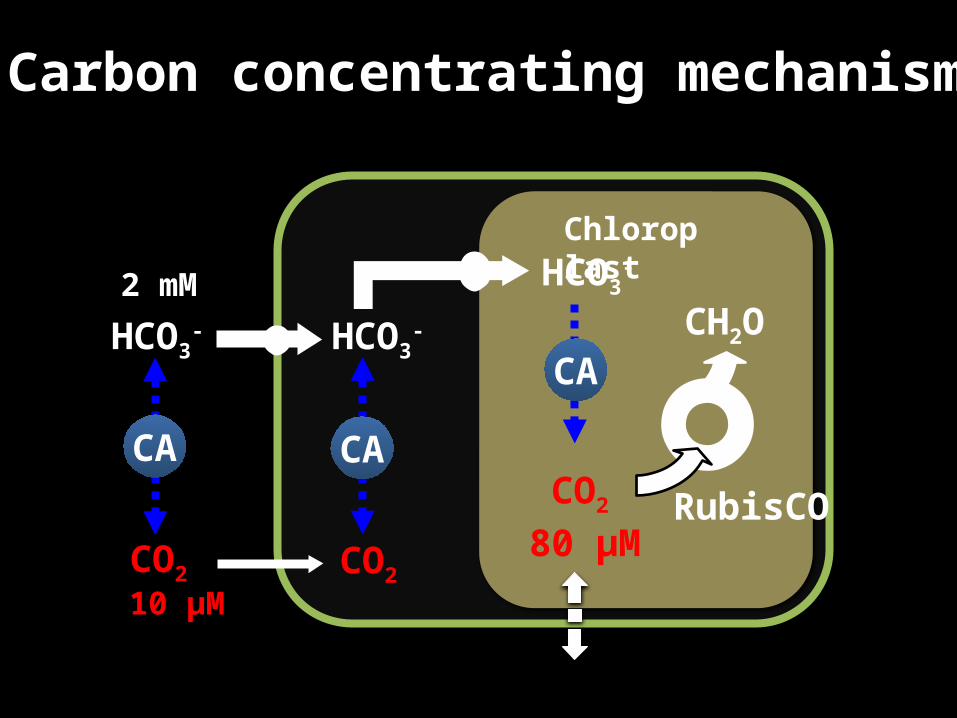
Carbon concentrating mechanism
Chloroplast
CO2
80 µM
HCO3-HCO3
-
CO2CO2
10 µM
HCO3-
CA CA
CH2OCA
RubisCO
2 mM

CASkeletonema costatum
0
2000
CA
act
ivity
U (
mg
Chl
a)-1
1000
180 360 1800 ppm
Enzyme
Rost et al. 2003
Response of CCM to increasing CO2
Growth rates
Labculture
280 720 ppm
3.0
2.0
0
1.0
Gro
wth
rat
e (d
-1)
Skeletonema costatum
Rost et al. 2003
Growth rates
280 720 ppm
1.5
1.0
0
0.5
Gro
wth
rat
e (d
-1)
Skeletonema costatum
40%In-situ
Kim et al. 2006
Growth rates
100 800 ppm
Gro
wth
rat
e (d
-1) Natural assemblage
Ocean
2.0
1.0
0
0.5
1.5
Tortell et al. 2000
Growth rates
Low CO2 High CO2
Gro
wth
rat
e (d
-1) 2.0
1.0
0
0.5
1.5 ? Future growth rate
What biological consequences ?
Photosynthesis Calcification OtherPhysiological
effects
CO2 CO32- pH

Calcium carbonate (CaCO3)production & dissolution
Main overall reaction:
+Ca2+ CO32- CaCO3(s)
[CO32-] > [CO3
2-] sat
[CO32-] < [CO3
2-] sat
Calcite Aragonite

Future projection for saturation state
Turley et al. 2010
[CO32-] = [CO3
2-]sat
[CO32-] / [CO3
2-]sat Aragonite[CO3
2-] / [CO32-]sat Calcite

Tropical corals Coraline algae
Molluscs
Pteropods
Coccolithophores
Responses of marine calcifiersto increasing CO2
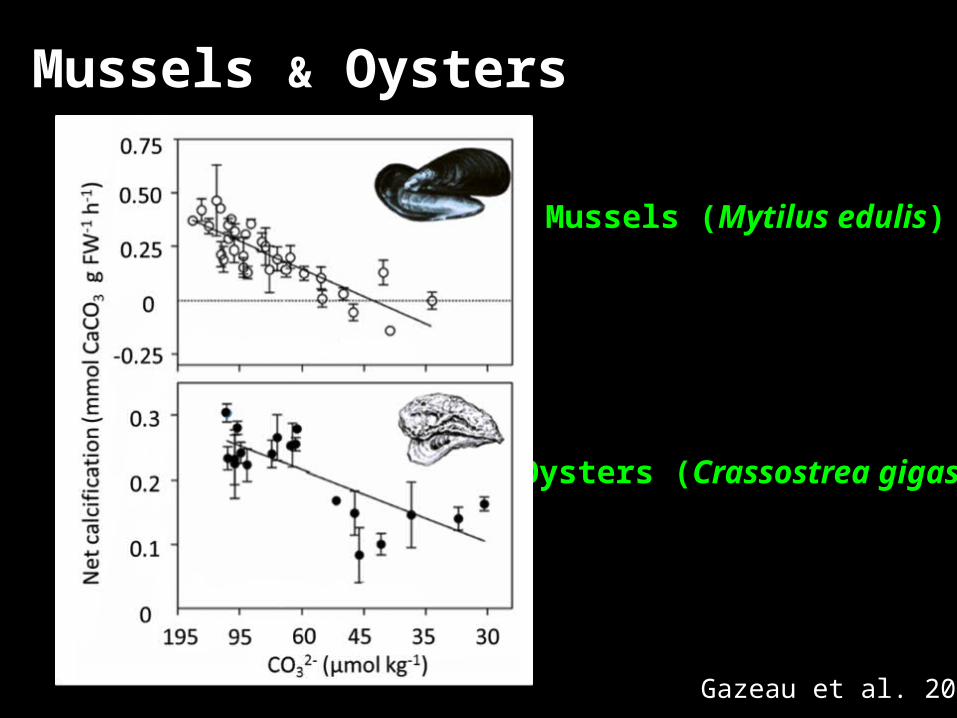
Mussels & Oysters
Gazeau et al. 2007
Mussels (Mytilus edulis)
Oysters (Crassostrea gigas)

Coccolithophores4.0
3.8
3.6
3.4
3.2Low CO3
2-
AmbientCO3
2-HighCO3
2-
Cocc
olith
size
(µm
) Coccolith
Engel et al. 2005

Adapted from Doney et al. 2009
Major groups
Tropical corals
Coraline red algae
Molluscs
Pteropods
Coccolithophores
Responses at increasing CO2
Different responses of marine calcifiersto increasing CO2
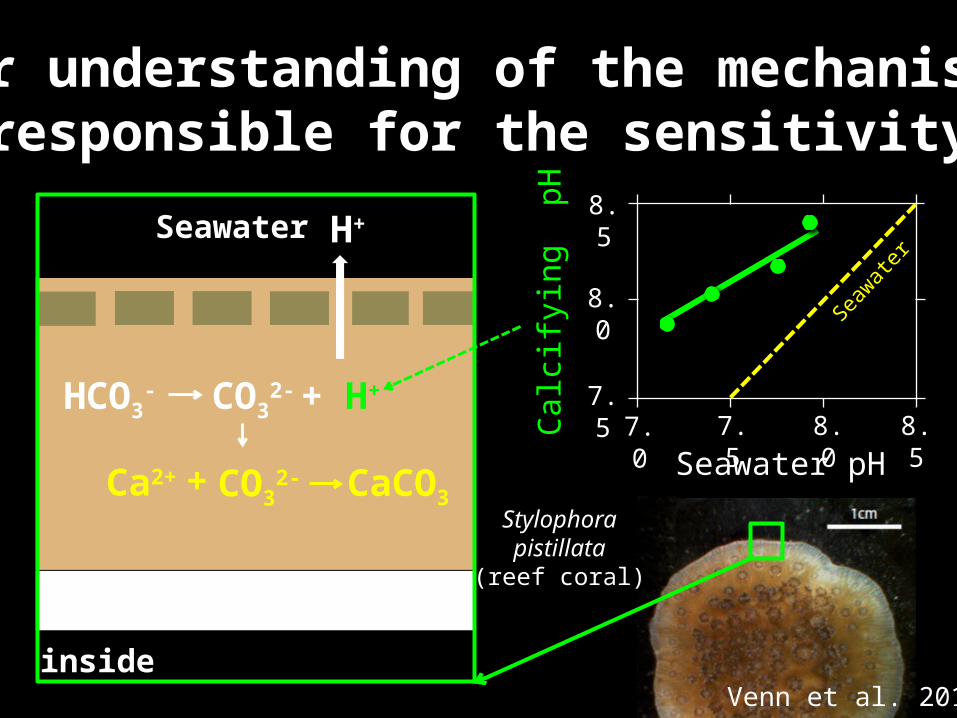
Poor understanding of the mechanisms responsible for the sensitivity
Seawater pH
Calc
ifyin
g p
H
8.5
8.0
7.57.0 7.5 8.0 8.5
Seawater
Skeleton
inside
H+
Ca2+ CaCO3CO32-+
HCO3- + H+CO3
2-
Seaw
ater
Venn et al. 2013
Stylophorapistillata
(reef coral)
What biological consequences ?
Photosynthesis OtherPhysiological
effects
CO2 pH
Calcification
CO32-

l all
pH homeostasis External enzymes
Metalavailability
Physiologicalprocesses
pH

l all
Physiologicalprocesses
pH
Metalavailability
Fe(OH)3 + H+
Fe
pH homeostasis External enzymes

Photosynthesis
Light reaction
Dark reactione-
H2O
O2
CO2
Fe
Organic matter

Effect of pH on Fe chemistry
Ca Fe+ Fe(OH)2+ + 2H+ →
Ca-EDTA Fe-EDTA
Free Fe + 2H+ + Y → Bound Fe

Shi et al. 2010
Thalassiosira weissflogii
The rate of Fe uptake by phytoplankton
Free Fe + 2H+ + Y → Bound Fe
103
102
101
100
100 101 102 103
Total Fe (nM)
µmol
Fe
mol
C-1
day
-1
pH 7.7
pH 8.1
101
Free Fe (pM)
102 103 104
1:1 pH 8.6
Fe u
ptak
e ra
te

pH effect depends on mature of chelator
Shi et al. 2010

Weak effect of pH on Fe uptake in field
Shi et al. 2010

Complications of OA research
Time scales Adaptation
Ocean warming Temperature
Mixing
CO2
CO32-
pH

PhytoplanktonSuccession
Photochemistry
C-fixation
Transporter
EnzymeExpression
Cell Growth
Competition
Acclimation
Adaptation Genetic mutation
Lab. cultures
Field monitoring
Predictions
Time scales
Log10 Days
geological epoches
nano seconds years
centuries10-14 10-5 0.01 1 100 105 108
Timescales
seconds days

Today Year 2100+ 2 to 6°C
Mixing
Nutrient input
Irradiance
Stratification
Surface temperature
++++/-
Ocean warming: Temperature & Mixing
Temperature
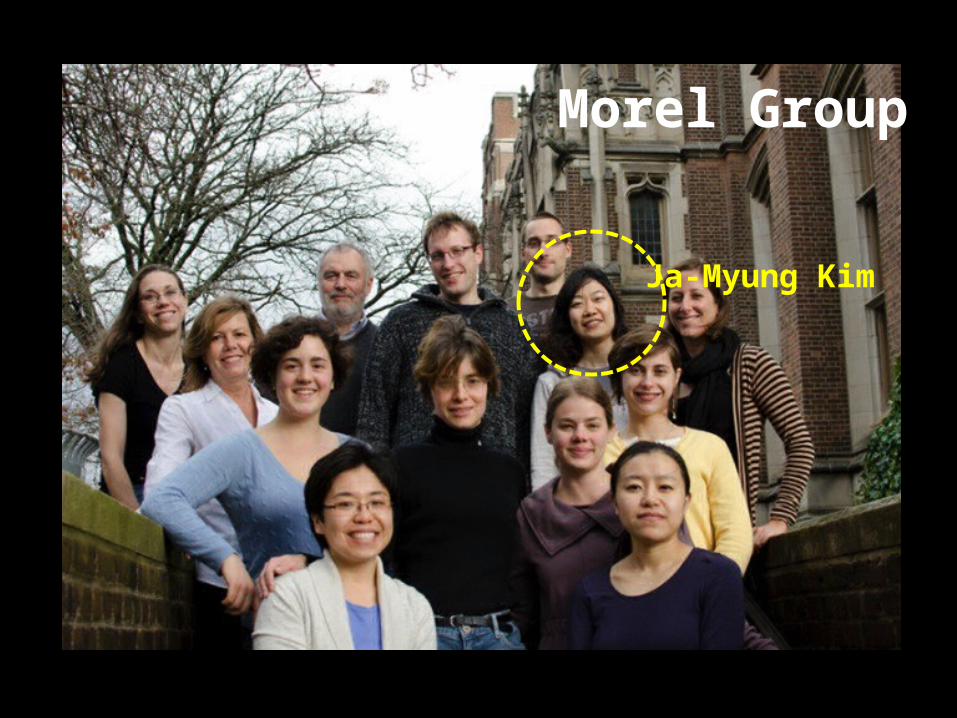
Morel Group
Ja-Myung Kim

Biologically complicated…Chemically simple,