Embed Size (px)
Citation preview

Space ImagingIKONOS Spatial Characterization
Frank GerlachDirector, Quality Assurance

© Space Imaging LLC
Topical Agenda
• System Requirements• Pre Flight Simulation & Sensitivity Analysis• Target Characteristics• On - orbit Results
© Space Imaging LLC
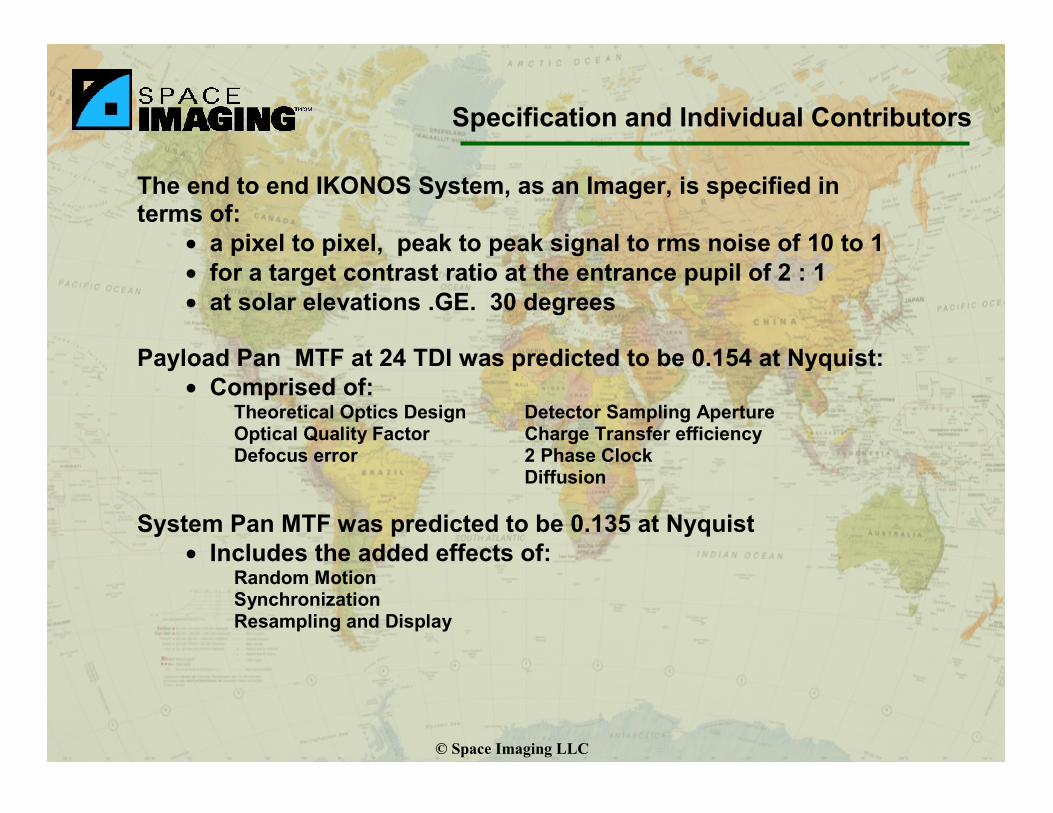
The end to end IKONOS System, as an Imager, is specified interms of:
• a pixel to pixel, peak to peak signal to rms noise of 10 to 1• for a target contrast ratio at the entrance pupil of 2 : 1• at solar elevations .GE. 30 degrees
Payload Pan MTF at 24 TDI was predicted to be 0.154 at Nyquist:• Comprised of:
Theoretical Optics Design Detector Sampling ApertureOptical Quality Factor Charge Transfer efficiencyDefocus error 2 Phase Clock
Diffusion
System Pan MTF was predicted to be 0.135 at Nyquist• Includes the added effects of:
Random MotionSynchronizationResampling and Display
Specification and Individual Contributors

© Space Imaging LLC
Component MTF’s
CRS S Along -S can MTF
0
0.2
0.4
0.6
0.8
1
1.2
0 0.1 0.2 0.3 0.4 0.5 0.6
Normalize d Fre que nc y
Nor
mal
ized
MTF
Optics
Ape rture
Diffus ion
Sm e a r
Motion
MTF

© Space Imaging LLC
Sensitivity Analysis
First Series of Simulations - reported 29 May 1997For Target sizing, orientation and Reflectance
Target size - 14 x 10 m and 28 x 20 mRotation Angle- 10 degreesTarget C/R - 2:1 and 6:1Visibility - 4 and 27 km
Second Series of Simulations - reported 11 December 1997Pixel phasing, noise effects and cropping methods
Target size - 20 x 20 mRotation Angle- 4 and 7 degreesTarget C/R - 2:1, 3:1 and 4:1Visibility - 4 and 27 km

© Space Imaging LLC
Uncertainty of the Mean
Visibility(km)
Target Size(x WPAFB14m x 10m)
ReflectanceRatio (%)
AverageStandardDeviation
D_MTFatNyquist
Uncertaintyof the Mean(90% Confidence)
27 2 48/08 0.012 -0.021 0.013
27 2 64/32 0.023 0.003 0.025
4 2 48/08 0.031 0.011 0.033
4 2 64/32 0.042 0.002 0.045
27 1 48/08 0.012 -0.019 0.013
27 1 64/32 0.010 -0.036 0.011
4 1 48/08 0.036 -0.019 0.038
4 1 64/32 0.045 -0.023 0.048
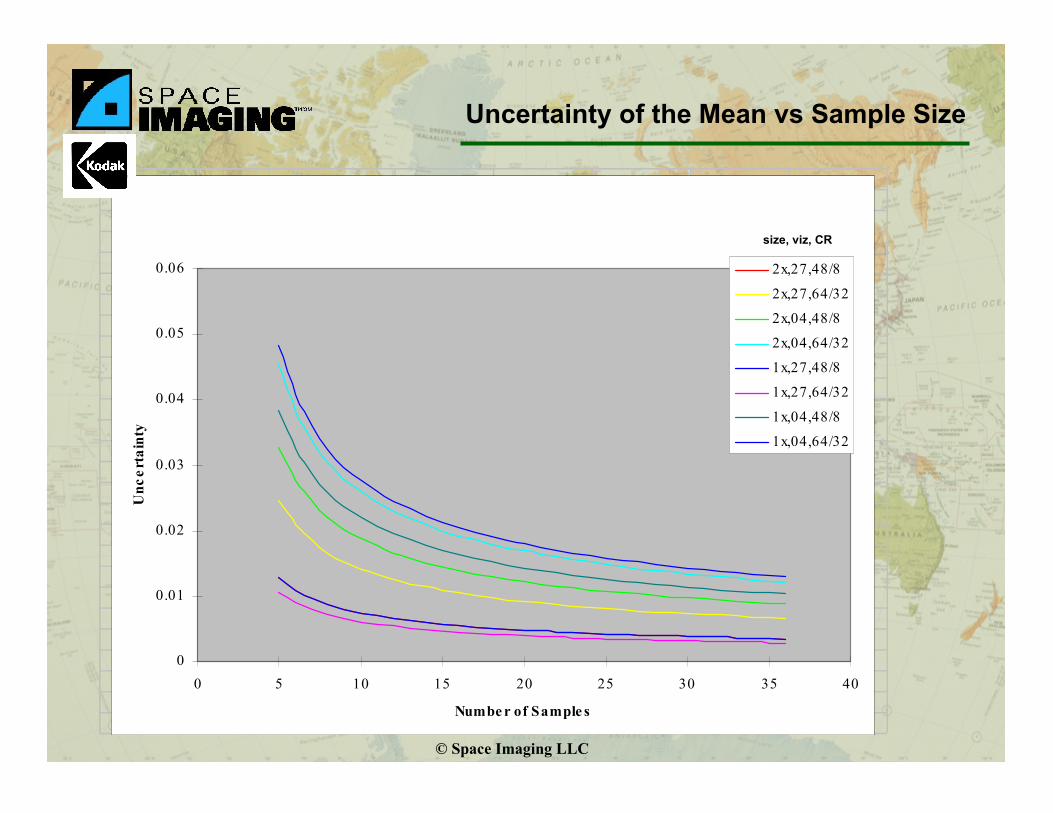
• Determine the uncertainty in the calculated mean MTF as a function of target design parameters and atmospheric effects
• Test Cases and Results
• Visibility caused the largest spread in the results
© Space Imaging LLC
Uncertainty of the Mean vs Sample Size
Uncertainty o f the Mean
0
0.01
0.02
0.03
0.04
0.05
0.06
0 5 10 15 20 25 30 35 40
Numbe r of Sample s
Unc
erta
inty
2x,27,48/8
2x,27,64/32
2x,04,48/8
2x,04,64/32
1x,27,48/8
1x,27,64/32
1x,04,48/8
1x,04,64/32
size, viz, CR

© Space Imaging LLC
Statistical Measures
Case Angle, CR Samples AverageNyquist
Std. Dev. Unc. of theMean
Case 1 4, 3:1 15 0.162 0.018 0.008Case 2 4, 3:1 6 0.160 0.028 0.023Case 3 4, 2:1 10 0.135 0.034 0.019Case 3 4, 3:1 20 0.153 0.025 0.010Case 3 4, 4:1 20 0.156 0.014 0.005Case 3 7, 2:1 10 0.154 0.029 0.017Case 3 7, 3:1 10 0.141 0.023 0.013Case 3 7, 4:1 10 0.141 0.018 0.011Case 3 4, ALL 50 0.150 0.025 0.006Case 3 7, ALL 30 0.146 0.024 0.007Case 3 4&7, 2:1 20 0.145 0.033 0.013Case 3 4&7, 3:1 30 0.149 0.025 0.008Case 3 4&7, 4:1 30 0.151 0.017 0.005Case 3 ALL 80 0.149 0.024 0.005
Case 1 - random noise, Case 2 random phasing, Case 3 random noise and phasing
Simulation Matrix - Second Series of Simulations

© Space Imaging LLC
Sample MTF Profile ResultsCase 1 (Random Noise, Fixed Phase, 4°, 3:1)
14x26 Cropped Area
0
0.1
0.2
0.3
0.4
0.5
0.6
0.7
0.8
0.9
1
0 0.1 0.2 0.3 0.4 0.5
Normalized Frequency
Sample 1Sample 2Sample 3Sample 4Sample 5Sample 6Sample 7Sample 8Sample 9Sample 10Sample 11Sample 12Sample 13Sample 14Sample 15Simulation MTFAverage
MTF at Nyquist = 0.162Standard Deviation = 0.018Uncertainty of Mean = 0.008
Case 3 (Random Noise, Random Phase, 4°, 4:1)14x26 Cropped Area
0
0.1
0.2
0.3
0.4
0.5
0.6
0.7
0.8
0.9
1
0 0.1 0.2 0.3 0.4 0.5
Normalized Frequency
Sample 0Sample 1Sample 2Sample 3Sample 4Sample 5Sample 6Sample 7Sample 8Sample 9Sample 10Sample 11Sample 12Sample 13Sample 14Sample 15Sample 16Sample 17Sample 18Sample 19Simulation MTFAverage
MTF at Nyquist = 0.156Std. Dev. at Nyquist = 0.014Uncertainty of Mean = 0.005
Space Imaging Proprietary
Case 3 (Random Noise, Random Phase, 4°, 2:1)14x26 Cropped Area
0
0.1
0.2
0.3
0.4
0.5
0.6
0.7
0.8
0.9
1
0 0.1 0.2 0.3 0.4 0.5
Normalized Frequency
Sample 0Sample 1Sample 2Sample 3Sample 4Sample 5Sample 6Sample 7Sample 8Sample 9Simulation MTFAverage
MTF at Nyquist = 0.135Standard Deviation = 0.034Uncertainty of Mean = 0.020
MTF Profile , 4 degrees, 2:1 CR, Case 3
Case 2 (Fixed Noise Seed, Random Phase, 4°, 3:1)14x26 Cropped Area
0
0.1
0.2
0.3
0.4
0.5
0.6
0.7
0.8
0.9
1
0 0.1 0.2 0.3 0.4 0.5
Normalized Frequency
Sample 0Sample 1Sample 2Sample 3Sample 4Sample 5Simulation MTFAverage
MTF at Nyquist = 0.160Std. Dev. at Nyquist = 0.028Uncertainty of Mean = 0.023
MTF Profile, 4 degrees, 3:1 CR, for Case 2
MTF Profile, 4 degrees, 4:1, Case 3
MTF Profile, 4 degrees, 3:1, Case 1

© Space Imaging LLC
Examples of Data Fitting
Fit to unmodified raw data
-0.2
0
0.2
0.4
0.6
0.8
1
1.2
-15 -10 -5 0 5 10 15
Pixel Spacing
Raw EdgeFitted Edge
Fit to modifed data
-0.2
0
0.2
0.4
0.6
0.8
1
1.2
-15 -10 -5 0 5 10 15
Pixel Spacing
Raw EdgeFitted Edge
Fit to Raw Data
0
0.2
0.4
0.6
0.8
1
0 0.1 0.2 0.3 0.4 0.5Normalized Frequency
MT
F
Raw DataFitted dataSimulation MTF
MTF at Nyquist:Raw Data = 0.21Fitted Data = 0.039
Fit to Modified Data
0
0.2
0.4
0.6
0.8
1
0 0.1 0.2 0.3 0.4 0.5Normalized Frequency
MT
F
Modified DataModified Fitted data
Simulation MTF
MTF at Nyquist:Modified Data = 0.21Fitted Modified Data = 0.154
• Careful cropping and fitting of the data affects the end results

© Space Imaging LLC
SimulationConclusions and Recommendations
• Random noise and phasing compound uncertainty in Nyquist averagefor the simulated edge measurements
• Technique highly sensitive to cropping area– Take care in selecting region
• Extend width to include enough data points (as a function ofangle collected) to account for phasing
– Modifications in code could reduce sensitivity• Artificially extend flat regions of tails in edge profile• Set flat regions to a constant
– Simulation method using discrete functions for applying an MTFto a discrete edge target, etc. causes phasing to be important.Actual IKONOS data will be continuous application of MTF to acontinuous target image (then discretely sampled) so phasingeffects should be reduced.

Space Imaging Edge Target
P1
P3
P2P1 /P2 = 7.3:1 CR
P2 /P3 = 6.2:1 CR
Oriented 4 degrees from true north

© Space Imaging LLC
The panchromatic MTF was measured using an edge target andFourier techniques during the on-orbit test program. The MTFwas evaluated using “tap-point” data, prior to image syntheticarray resampling, to provide a true representation of thecollection system performance.
IKONOS Modulation Transfer Function at NyquistBand MTF Verification MethodPan 0.17 On-Orbit Test
On - Orbit Measured Modulation Transfer Function

© Space Imaging LLC
On - Orbit Measured Modulation Transfer Function
(Pan Tap Point Images)
0
0.1
0.2
0.3
0.4
0.5
0.6
0.7
0.8
0.9
1
0 0.05 0.1 0.15 0.2 0.25 0.3 0.35 0.4 0.45 0.5
Frequency
MTF
Case 1Case 2Case 3Case 4Case 5Case 6Average

© Space Imaging LLC
B a n d S ig n a lH + L(D N )
r m s N o iseth e o / m e a s
(D N )
F la t F ie ldS N R[L /r m s]
P a y lo a d + m o tio np -p S ig n a l/r m s n o ise
P a n 9 4 7 3 .1 6 /3 .5 5 8 9 1 5B lu e 1 4 0 6 3 .8 5 /5 .0 9 4 2 5G r ee n 1 9 3 3 4 .5 1 /4 .5 1 4 3 4 1R e d 1 3 9 5 3 .8 3 /4 .5 1 0 3 3 0N IR 7 5 1 2 .8 1 /3 .7 5 6 7 1 8
IKONOS Signal to Noise Ratio
The flat field SNR was measured using the on-board calibrationassembly imaging the Sun at an illumination level approximatelyequivalent to the peak signal level associated with the specificationconditions ( H + L).
• The System is Shot noise limited