Embed Size (px)
Citation preview

Franziska Bremus and Katja Neugebauer (2017):
Reduced Cross-border Lending and Financing
Costs of SMEs
Discussion
Julia Schmidt (BdF)Financial structure, financial stability and the economy
Paris, 20 October 2017

Summary of paper
• Investigation of link between cross-border bank lending and borrowing
costs.
• Most literature looks at impact of capital flows on domestic credit growth,
but not at its cost!
• Findings:
• Reductions in cross-border lending are associated with higher interest ratesfor SMEs.
• This only holds for reductions in cross-border lending to banks, but not tonon-banks.
2/14
Are foreign banks / cross-border bank inflows good for the host
economy?
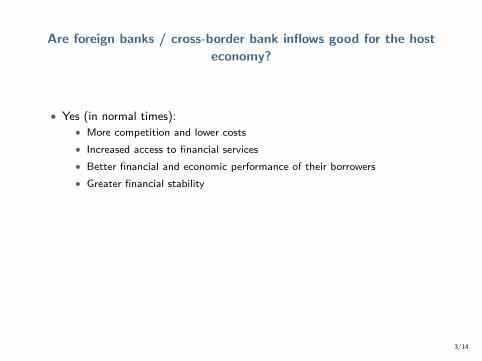
• Yes (in normal times):
• More competition and lower costs
• Increased access to financial services
• Better financial and economic performance of their borrowers
• Greater financial stability
• In crisis times: ...depends, but largely no.
• “Flight home” effect
• Affiliates support constrained parent banks
• Parent banks support constrained affiliates
3/14

Are foreign banks / cross-border bank inflows good for the host
economy?
• Yes (in normal times):
• More competition and lower costs
• Increased access to financial services
• Better financial and economic performance of their borrowers
• Greater financial stability
• In crisis times: ...depends, but largely no.
• “Flight home” effect
• Affiliates support constrained parent banks
• Parent banks support constrained affiliates
3/14

Euro area: fragmentation
Bank interest rates – loans to corporations, maturity < 1 year
0
1
2
3
4
5
6
7
8
9
2005Jan
2005Jun
2005Nov
2006Apr
2006Sep
2007Feb
2007Jul
2007Dec
2008May
2008Oct
2009Mar
2009Aug
2010Jan
2010Jun
2010Nov
2011Apr
2011Sep
2012Feb
2012Jul
2012Dec
2013May
2013Oct
2014Mar
2014Aug
2015Jan
2015Jun
2015Nov
Germany
Spain
France
Greece
Ireland
Italy
Portugal
4/14

Euro area: fragmentation
• Fragmentation = loan interest rates in stressed markets far above those inthe core.
• Despite low policy rates, interest rates for corporate loans are high.
• Credit channel of monetary policy is impaired→ balance sheet channel (borrowers’ balance sheets)→ bank lending channel (supply of loans by banks)
• Central bank policy can influence supply of loans: LTROs
• Do results imply that LTROs were simply not enough?
• Disentangling demand effects (borrowers’ balance sheet weaknesses) frombank supply effects
• Need to quantify the rise in interest rates that is due to bank supply shocks(because this is where central bank liquidity provision can help out)
5/14

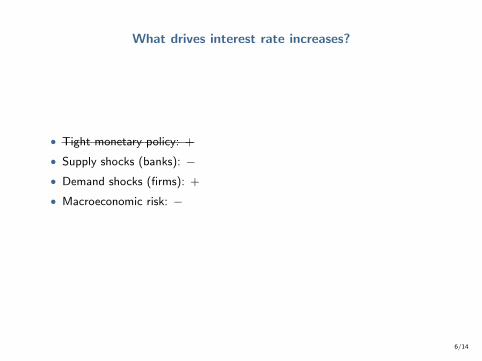
What drives interest rate increases?
• Tight monetary policy: +
• Supply shocks (banks): −• Demand shocks (firms): +
• Macroeconomic risk: −
6/14
What drives interest rate increases?
• Tight monetary policy: +
• Supply shocks (banks): −• Demand shocks (firms): +
• Macroeconomic risk: −
6/14

Endogeneity / identification
Supply shocks
• If capital inflows from abroad are considered exogenous, there a two mainchannels:
• Direct channel: cross-border credit to non-financial firms
• Indirect channel: cross-border credit to banks changes supply of bank creditto firms
• Why is the indirect channel at work, but not the direct channel?
• Direct cross-border loans do not go to SMEs?
7/14
Endogeneity / identification
Supply shocks
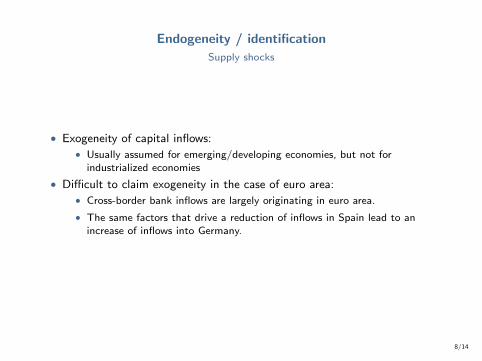
• Exogeneity of capital inflows:
• Usually assumed for emerging/developing economies, but not forindustrialized economies
• Difficult to claim exogeneity in the case of euro area:
• Cross-border bank inflows are largely originating in euro area.
• The same factors that drive a reduction of inflows in Spain lead to anincrease of inflows into Germany.
8/14

Endogeneity / identification
Macroeconomic risk: Credit rationing?
• “Increasing loan rates should make it more attractive for banks to lend.”
• Yes, but imagine:
• Higher interest rates driven by increase of aggregate macro risk
• Proportional shift in riskiness of borrowers
• Interest rates rise proportionally across all firms
• Credit rationing a la Stiglitz and Weiss (1981) due to higher probability ofdefault
• Less supply of credit, even when interest rates rise, and thus less fundingfrom abroad
• Is the drop of cross-border inflows a cause or a symptom?
9/14

Endogeneity / identification
Demand
• Need to properly control for demand.• Paper: include dummy on whether banks face problems finding costumers
• What does the literature usually do?• Loan volume as a function of supply and demand factors:
Lb,f,t =α1Sq + α2Sb,t + β1Dt + β2Df,t + . . .
• St: Economy-wide supply factors, i.e. monetary policy
• Sb,t: Bank-specific supply factors, i.e. wholesale market funding shock
• Dt: Economy-wide demand factors, i.e. rise in uncertainty or fiscal policy shock
• Df,t: Firm-specific demand factors, i.e. productivity shock
• Coefficient of interest is usually: α2Sb,t
• Estimation of α2 when demand cannot be observed:
α2 = α2 + β2cov(Sb,q , Df,t)/var(Sb,t)
• Khwaja and Mian (2008): f, t-FE take care of St, Dt and Df,t
Lb,f,t =λf,t + α2Sb,t + εb,f,t (≥ 2 banks per firm)
10/14
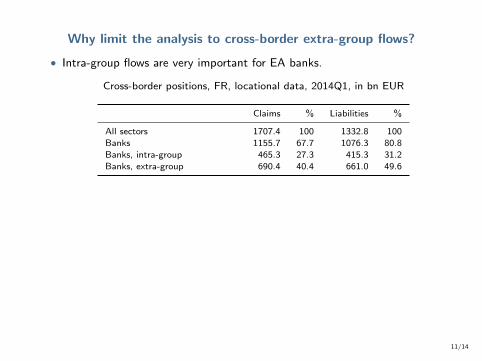
Why limit the analysis to cross-border extra-group flows?
• Intra-group flows are very important for EA banks.
Cross-border positions, FR, locational data, 2014Q1, in bn EUR
Claims % Liabilities %
All sectors 1707.4 100 1332.8 100Banks 1155.7 67.7 1076.3 80.8Banks, intra-group 465.3 27.3 415.3 31.2Banks, extra-group 690.4 40.4 661.0 49.6
• Lending by affiliates abroad is maybe the more policy-relevant issue?
Foreign loans, FR–big 6, consolidated data, mean 2006Q4–2013Q2
Type of lending Stocks in bn EUR %
Foreign lending 1356.7 100Cross-border lending 608.0 44.8
of which: lending to financial sector 276.5 20.4of which: lending to non-financial sector 286.2 21.1
Lending by affiliates abroad 748.8 55.2of which: lending to financial sector 121.4 8.9of which: lending to non-financial sector 543.8 40.1
11/14

Claims vs. liabilities
Int’l claims and liabilities, France, consolidated data, stocks
-1400
-1200
-1000
-800
-600
-400
-200
0
0
500
1000
1500
2000
2500
3000
2000-Q1 2002-Q1 2004-Q1 2006-Q1 2008-Q1 2010-Q1 2012-Q1 2014-Q1 2016-Q1
Claims FR, all sectors
Liabilities FR, all sectors
Net liabilities FR, all sectors (right scale)
12/14

Claims vs. liabilities
Int’l claims and liabilities, Italy, consolidated data, stocks
-200
-100
0
100
200
300
400
500
0
100
200
300
400
500
600
700
800
900
1000
2000-Q1 2002-Q1 2004-Q1 2006-Q1 2008-Q1 2010-Q1 2012-Q1 2014-Q1 2016-Q1
Claims IT, all sectors
Liabilities IT, all sectors
Net liabilities IT, all sectors (right scale)
13/14
Conclusion
• Very nice and clear paper.
• Focus on price effects.
• What are the economic mechanisms at play?
• Quantification would be nice.
• Policy conclusions?
14/14

Conclusion
• Very nice and clear paper.
• Focus on price effects.
• What are the economic mechanisms at play?
• Quantification would be nice.
• Policy conclusions?
14/14
![Zur Zahlengeometrie der Babylonier - Heidelberg Universityflemmermeyer/publ/babylon-1.… · der Babylonier findet man bei Neugebauer [19], Neugebauer & Sachs [20] und Joran Friberg](https://img.pdfslide.net/doc/110x75/605d4e8597a9760e3a4faa96/zur-zahlengeometrie-der-babylonier-heidelberg-university-flemmermeyerpublbabylon-1.jpg)