Embed Size (px)
Citation preview

Office of Freight Managementand Operations1200 New Jersey Avenue SEWashington, D.C. 20590www.ops.fhwa.dot.gov/freight202-366-9210
Freight Data for Local and State Analysis
Freight in the Southeast
March 2015

Overview
• Freight Data in General
• Freight Analysis Framework
• Freight Performance Measures Program
• SHRP2 C20 Freight Demand Modeling and Data

Why Do You Need Freight Data?
To Highlight Passenger and Freight Differences
Freight requires different data because freight is different. How?
– Decision-makers not necessarily the equipment operator
– Private ownership of essential facilities
– No leisure freight transport
– More longer, slower, and intermodal trips
– Time of day, day of week variances
– Business cycles strongly influence volume
– Greater regulatory restrictions on operations

Primary Data TypeFreight DataType: Specific Categories
Examples Data Elements
Economic
Economic Wages Payroll Taxes
Industry/Relationship Relationships between Industries
Demographic Industry density Geographic coverage Establishment information
Land Use Zoning Permitting
Density
Stakeholder Shipments Fleets Usage/Operations
Shipment/Flow
Supply Chain Establishment specific flow of raw and
finished goods
Commodity Flow Commodity Flow Truck Trips Tonnage, ton-miles
Vehicle/Equipment Flow Flows with some commodity detail
Network/System Performance
Network Network location Network condition
Network Usage by Vehicles/Equipment
Vehicle or equipment network usage, volumes, counts
Performance Characteristics
Travel times
Congestion Throughput Safety inspections/Enforcement data
Vehicle/Equipment
Inventory Age, composition, condition
Registration Ownership Age of vehicle State of registration
Utilization Permitting Shipment load characteristics

FAF - The Big Picture
• Freight Analysis Framework (FAF) integrates data from several sources to create:
– A database of regional freight flows by tons and value for all modes, with 30-year forecasts, and annual provisional updates
– An assignment of the average number of freight-hauling trucks to individual highway segments on the national network

How FAF can support freight planning:
– What commodities are moving into, out of, and through my State or region? What modes are being used? How do these flows compare to other States/regions?
– What are the transportation impacts of these flows (e.g., what roads see the heaviest flows)?
– How have these flows changed over time (historic analysis)?
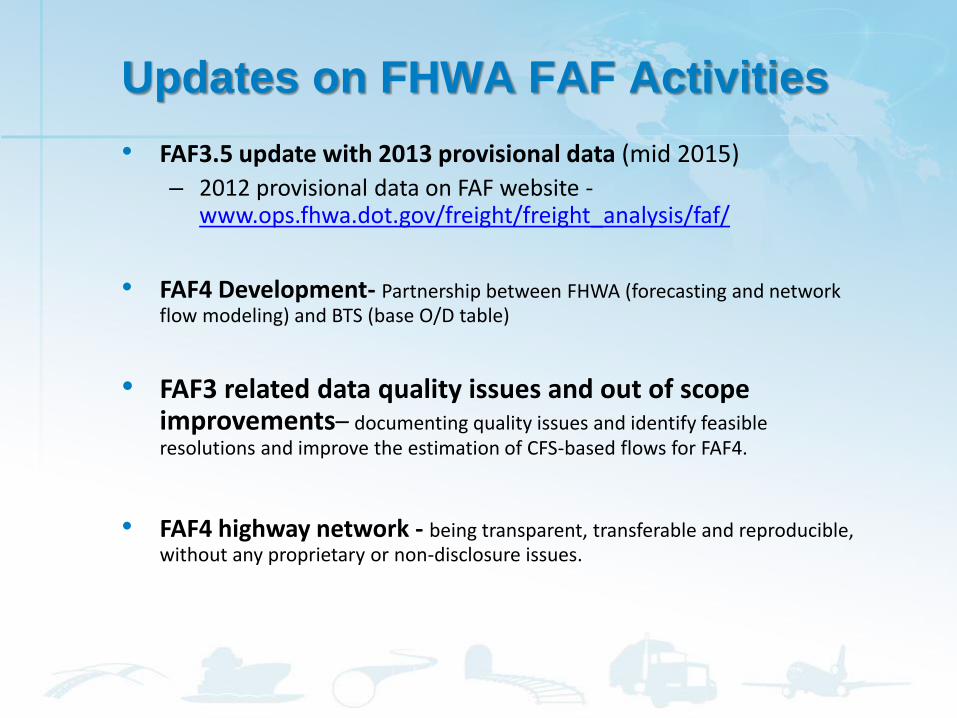
Updates on FHWA FAF Activities
• FAF3.5 update with 2013 provisional data (mid 2015)
– 2012 provisional data on FAF website -www.ops.fhwa.dot.gov/freight/freight_analysis/faf/
• FAF4 Development- Partnership between FHWA (forecasting and network flow modeling) and BTS (base O/D table)
• FAF3 related data quality issues and out of scope improvements– documenting quality issues and identify feasible resolutions and improve the estimation of CFS-based flows for FAF4.
• FAF4 highway network - being transparent, transferable and reproducible, without any proprietary or non-disclosure issues.

FAF Information
• Frequently Asked Questions – coming soon to FAF website -www.ops.fhwa.dot.gov/freight/freight_analysis/faf/
• FAF data update on HEPGIS (FHWA Office of Planning, Environment and & Realty’s Geographic Information Systems website – uses FAF data to generate maps)
• FAF Quarterly Webinars series – Local FAF applications
– Leveraging other data sources with the FAF
More information:
FAF website: www.ops.fhwa.dot.gov/freight/freight_analysis/faf/
FAF email address: [email protected]

FHWA’s Freight Measurement Programs
• FPM Access to Truck Probe Data for the following:– Support the Freight Performance Measurement (FPM) Program
• Support FHWA and USDOT freight performance monitoring and analysis of freight significant corridors and locations
• Provide analysis of origins and destinations, incidents, weather impacts, congestion
– Support supply chain/key freight corridor analyses for North America
• NPMRDS Travel Time Data: Actual observed travel times from passenger and freight probes

FPM Data
• Access for FHWA and internal and external partners to support FPM
• Data collected by the second from approximately 600,000 trucks with embedded technology
• Nationwide coverage
• Multiple industry data sources
• Continuous data since 2002
• Billions of unique truck positions received & processed annually

NPMRDS
• Available primarily to FHWA, federal partners, States and MPOs
• Archived travel time database provided monthly
• The data set includes three distinct average travel times for each 5-minute “bin”– Freight– Passenger– All Traffic
• HERE Data Sources– Passenger probe data is obtained from a number of sources
including mobile phones, vehicles, and portable navigation devices– Freight probe data is obtained from the American Transportation
Research Institute leveraging embedded fleet systems
• TECHNICAL ASSISTANCE IS AVAILABLE FOR USERS – E-MAIL:– [email protected]

NPMRDS Coverage

FPM Analysis Examples


0.00
10.00
20.00
30.00
40.00
50.00
60.00
70.00
2011 2012 2013 2014
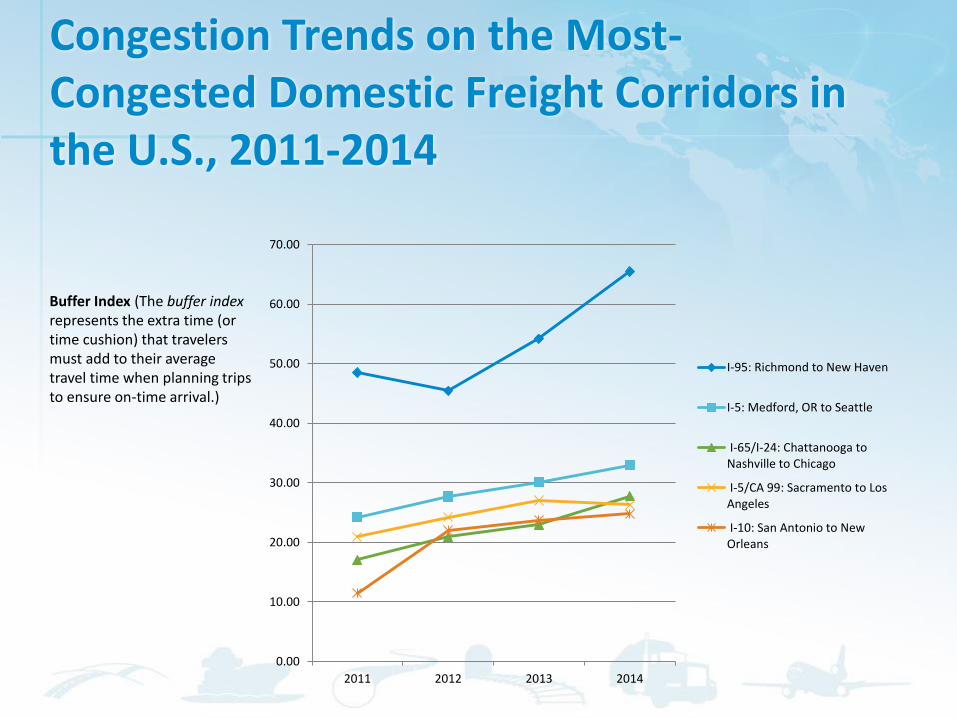
I-95: Richmond to New Haven
I-5: Medford, OR to Seattle
I-65/I-24: Chattanooga toNashville to Chicago
I-5/CA 99: Sacramento to LosAngeles
I-10: San Antonio to NewOrleans
Buffer Index (The buffer indexrepresents the extra time (or time cushion) that travelers must add to their average travel time when planning trips to ensure on-time arrival.)
Congestion Trends on the Most-Congested Domestic Freight Corridors in the U.S., 2011-2014

Freight Movement Efficiency Index

North American Case Study: Automotive Parts Manufacturing
Economic Analysis Directorate
Windsor, ON
Transit Option 1: trucking
Tennessee
Nuevo Laredo Region, MEX
US-MEX Border
Southern Ontario
Southern Ontario
Windsor, ON
Source: Transport Canada

Economic Analysis Directorate 19
Source: Transport Canada, adapted from third-party satellite tracking data provider (Shaw), October 2014.
Truck Trips: Southern Ontario to US-Mexican Border, September 2014
424 trucks trips were identified
The average travel time was 70 hours

SHRP2 Freight Demand Modeling and Data Project (C20) Purpose
To foster fresh ideas and new approaches to design and implement freight demand modeling and data collection that ultimately enhance decision making.

C20: Implementation Assistance Program
• Eleven Proof-of-Concept Pilot Projects were selected:
– Four Behavior-based Modeling
– Seven Innovations in Local Data
• Data projects:
– Identify and adapt disparate sources of data
– Refine current data sources
– Develop new data sources on smaller geographic scales
• Modeling projects:
– Advance ‘tour-based’ and ‘supply chain’ freight modeling
– Improve understanding of decision-making by freight agents and their implications for network modeling


C20: Behavior-based Modeling Recipients
Recipient Project Objective
Maricopa Association of Governments
Develop a multi-modal freight model to better replicate the economic behaviors of establishments, shippers, and carriers.
Maryland Department of Transportation
Develop a regional tour-based truck model covering intra-local distribution with sensitivity to the long-distance truck flows represented in the statewide freight model.
Portland MetroUnderstand the local portion of the region’s supply chains, as well as the tour-based behavior of individual trips.
Wisconsin Department of Transportation
Develop a hybridized model for freight demand that, through integration with regional travel demand models, addresses deficiencies in statewide freight forecasting techniques.

C20: Local Data Recipients
Recipient Project Objective
Capital District Transportation Committee
Create a unified data set for the region at the zip code or TAZ level by integrating diverse data sources.
City of Winston-SalemCollect data to support development of an advanced freight model, development of an advanced freight sub-model, and a conduct a travel diary survey.
Delaware Valley Regional Planning Commission
Better understand intermodal transportation for freight in the region by integrating data for distribution supply chains and for performance management.
Florida Department of Transportation
Improve the accuracy of freight forecasts by collecting data representing the supply and demand chain for petroleum commodities distributed throughout South Florida.
Mid-America Regional Council
Use a combination of existing data and new sources of commercial waybill data to address future freight planning needs.
South Dakota Department of Transportation
Study the growth in agricultural commodity demand and production to analyze the needs and impacts on the State and local transportation systems.
Washington State Department of Transportation
Model the key State supply chains' behavioral responses to different State policy scenarios aimed at reducing emissions.

C20: Implementation Assistance Program
• Thorough documentation of the C20 IAP Pilot Projects will be completed resulting in several products:
– Case studies
– Handbook
– Project evaluations
– Self-assessment tool

C20: National Initiatives• Freight Modeling and Data Expert
Task Group
• Freight Data Collaboration and Standardization Workshops
• Freight, Economic, Land Use and Demographic Data Collaborative
• FMIP Portal
• Collaboration, Knowledge Sharing and Outreach
– Practitioner Handbook
– Project Case Studies
– Briefings
– Peer Exchanges
– Cross-agency trainings
– Conferences and presentations
– Executive training
– Champion outreach
• Additional Strategic Plan Objectives Development

Schedule for the C20 Products
• C20 Pilot Projects to be completed by:
– Data projects: March 2016
– Modeling projects: September 2016
• C20 National Initiatives
– Workshops: 2015-2016
– TEG: 2015-2017
– Research 2015-2017

Thank You


![Itts Cat Ext Gb v101[1]](https://img.pdfslide.net/doc/110x75/577ce7511a28abf10394d9b3/itts-cat-ext-gb-v1011.jpg)