Embed Size (px)
Citation preview
Vision for Water and Nature
Freshwater ecosystemmanagement and
environmental security
M.P. McCartney1, M.C. Acreman1 and G. Bergkamp2
1 Institute of Hydrology, Wallingford, Oxon, OX10 8BB, UK2 IUCN, Rue Mauverney 28, 1196 Gland, Switzerland
Background paper toVision for Water and Nature Workshop,San Jose (Costa Rica), 20-22 June 1999
i
Preface
This paper is written as a contribution to the World Water Council’s “Vision for Water, Life and theEnvironment in the Twenty-first Century” (the World Water Vision). It is one of three papers, commissionedby IUCN, linking freshwater ecosystem management and human security. The other two papers investigatethe links between freshwater ecosystem management and social security, and economic security (Soussan etal., 1999; Swanson and Doble, 1999). The primary objective of this paper is to summarise current thinkingon the associations between freshwater ecosystem management and environmental security. The purpose ofthe paper is to stimulate and provoke discussion at a workshop to be held in San Jose, Costa Rica in June1999.
There are numerous different ideas incorporated in the concepts of ecosystem management and environmentalsecurity and this paper is far from comprehensive. However, it is not intended to be a definitive statement,but rather aims to highlight the principal areas of concern in this field and to emphasize the challenges thatface communities around the world as the twenty-first century approaches.
ii
Executive Summary
This paper has been produced to provoke discussion at a workshop to be held in San Jose, Costa Rica as partof the World Water Council’s Vision for Water, Life and the Environment (Serageldin, 1999). It is notintended as a definitive statement but aims to highlight the links between the management of freshwater andenvironmental security. It is hoped that it will provide the basis for dialogue about what is believed by manyto be one of the most pressing issues currently facing humanity.
As the 21st century approaches humankind is struggling with many complex problems related to managementof freshwater ecosystems. Past mis-management of these ecosystems has resulted in widespreadenvironmental degradation, destruction of ecosystem functions and loss of wildlife habitat. There is evidencethat human-induced changes in freshwater ecosystems have brought about reductions in environmentalsecurity.
For the purpose of this paper, environmental security is defined as:
a means of achieving long-term social, economic and ethical security through: i) thesustainable utilisation of renewable resources and ecosystem functions; ii) protectionfrom natural hazards; and iii) conservation of other species.
The definition acknowledges the fundamental linkages between environmental security and management,economic development and the social well-being of people. This paper provides a review of technical issuesrelated to freshwater ecosystem management and environmental security. Management strategies areconsidered within the context of a pressure-state-response model.
A number of issues associated with environmental security are presented and indices are used to show world-wide trends. However, it is recognised that statistics alone cannot adequately describe environmental security,and that there are limitations with all the indicators used. Not least, the complex nature of interactionsbetween humans and the environment mean that it is presently impossible to derive quantitative links betweenindices of pressure, ecosystem state and environmental security. Nevertheless, the indices provide a crude wayof assessing temporal and spatial variation in pressures on freshwater ecosystems and environmental security.The data demonstrate that world-wide there is:
• increasing human-induced pressure on natural freshwater ecosystems; • increasing degradation of freshwater ecosystems in the sense that they are increasingly unable to provide
the services which benefit humankind;• greatest environmental security in countries which have most altered their freshwater ecosystems (i.e.
developed countries).
Advocates propose ecosystem management as the modern and preferred way of managing natural systems.It is a management approach that aims to increase security through protection of the environment,maintenance of ecosystem functions, preservation of biodiversity and by ensuring sustainable development.There are numerous definitions of ecosystem management, but for the purposes of this paper it is defined as:
deliberate and conscious manipulation of ecosystem structure and/or function, orregulation of human uses of ecological systems, so as to retain defined and desiredfeatures and processes, and to meet human needs in an optimal and sustainable way.
Although largely accepted at the highest political levels, strategies for the practical implementation of
iii
ecosystem management are presently ill-defined.
Catchments provide the most appropriate physical entity on which to base freshwater ecosystem management.In this paper it is suggested that integrated catchment management (ICM) is the most practical strategy forimplementing this. ICM is defined as:
The co-ordinated planning and management of the water resources of a river basinconsidering its interaction with land and other environmental resources for theirequitable, efficient and sustainable use at a range of scales from local to catchment level.(DFID, 1997)
Good management practices introduce feedback mechanisms that both mitigate and adapt to the impact ofhuman interventions in freshwater ecosystems. A range of technical measures that hold promise for ICMinclude:
• demand management• water recycling• desalination• water harvesting• wastewater treatment• watershed and groundwater resource protection• habitat protection• changes in the operation of dams and, in some instances, their decommissioning• rehabilitation and restoration of freshwater ecosystems• biotechnology
However, there remain considerable impediments to the practical application of ICM principles. Theseinclude lack of:
• understanding of linkages between land-use patterns, hydrological regime and biotic response• data to support demand management programs• effective monitoring• practical methods to integrate environmental, social and economic aspects of freshwater ecosystems• methods for incorporating science within the decision-making processes• involvement of all stake-holders in decision-making
Environmental security priorities in the developed and developing world are very different. In developingcountries, the emphasis must be on “elementary environmental care” mostly oriented to meeting basic watersupply, housing and waste disposal needs. However, in the developed world the emphasis is on protectingthe few remaining natural and semi-natural freshwater ecosystems, ameliorating the impact of existingdevelopment and restoring degraded ecosystems. Although the priorities are different, it is a key tenet of thispaper that the basic doctrine proposed within the ICM concept applies to both developing and developedcountries.
Increasing environmental security through ICM requires that:
• issues of environmental change and security are dealt with holistically• ICM strategies satisfy both immediate and long-term needs• research findings are used to provide an analytical perspective of problems, guide policy-making and
inform assessments of management interventions
iv
• resources are directed towards identifying vulnerable geographic regions and sectors of society andpromoting adaptation and resilience in both
• the impediments listed above are overcome
This paper summarises three different future scenarios, developed, in draft form, by the ScenarioDevelopment Panel of the World Water Council . These provide very different visions of possible futures.In the “conventional water world” it is postulated that if economic growth, technological advances anddemographic trends continue as at present, by 2025 the problems impacting on freshwater ecosystems willbe the same as today, but increased in number and consequences. At the global scale, there will be a netreduction in environmental security, particularly in developing countries. Alternatively, in the “water crisis”scenario, it is postulated that if there is a slow-down in economic growth, less dissemination of newtechnologies and a failure to adopt water strategies, then there will be increased water scarcity andcatastrophic reduction in environmental security in many regions. If the third scenario, a “sustainable waterworld”, is to be achieved, with an associated increase in environmental security, then significant changes mustbe made in the way that humankind manages and utilises freshwater ecosystems.
v
Contents
Preface i
Executive Summary ii
1. Introduction 1
2. Background 4
2.1 The global water cycle 42.2 Concepts used in freshwater ecosystems 52.3 Human appropriation of freshwater 82.4 Environmental security 12
3. Problem identification and analysis 17
3.1 The Problem: unsustainable utilisation of freshwater and environmental degradation 173.2 Underlying causes of declining environmental security (a conceptual model) 213.3 Indicators of human-induced pressures on freshwater ecosystems 25
3.3.1 Land-cover transformation 253.3.2 Dam construction 283.3.3 Urbanisation 303.3.4 Freshwater fisheries 313.3.5 Climate change 34
3.4 Indicators of the state of freshwater ecosystems 343.4.1 Loss of wetlands 343.4.2 Water Pollution 353.4.3 Freshwater biodiversity status and trends 37
3.5 Indicators of environmental security 403.5.1 Water scarcity 403.5.2 Access to safe water and sanitation 413.5.3 Water related disease 433.5.4 Impact of floods 45
3.6 Synthesis: links between pressures, environmental state and environmental security 47
vi
4. Scenarios: assessment of long-range patterns and problems 48
4.1 The scenario approach 484.2 Conventional water world 49
4.2.1 Consequences for freshwater ecosystems and environmental security 494.3 Water crisis 50
4.3.1 Consequences for freshwater ecosystems and environmental security 504.4 Sustainable water world 51
4.4.1 Consequences for freshwater ecosystems and environmental security 514.5 Synthesis: future environmental security 52
5. Future Strategies 53
5.1 Concepts 545.1.1 Ecosystem management 545.1.2 Integrated catchment management 56
5.2 Responses to mitigate threats to freshwater ecosystems and environmental security 585.2.1 Mitigation measures that impact on water quantity 585.2.2 Mitigation measures that impact on water quality 605.2.3 Habitat protection 61
5.3 Responses to adapt to changes in freshwater ecosystems and environmental security 625.3.1 Restoration of ecological services 625.3.2 Biotechnology 64
5.5 Synthesis: impediments to future strategies 65
6. Final Statement 66
References 68
Glossary 74
vii
List of Figures
1. Global total water and freshwater reserves 42. Freshwater ecosystems: lateral, longitudinal and vertical fluxes of water, energy and
material 63. General relationships in freshwater ecosystems 84. Components of global security 135. Comparison of benefits accrued to society from natural and artificial ecosystems 146. Maximising ecosystem benefits accrued to society 147. Simple conceptual model of the interaction within social-economic-environmental
Systems 228. Change in the proportion of agricultural land 1961-1991
a) by continent b) in developed and developing countries 269. Change in forest cover 1961-1991
a) by continent b) in developed and developing countries 2710. Dam index (number of large dams/km2) as an indicator of pressure on freshwater
Ecosystems 3011. Change in the proportion of urban population 1961-1991
a) by continent b) in developed and developing countries 3212. World-wide freshwater fish catch 1961-1991
a) by continent b) in developed and developing countries 3313. Conceptual evolution of the development of water pollution in relation to
socio-economic development 3614. Causes of extinction in North American freshwater fishes 3715. Threatened species of fish and amphibians 3916. Access to a) safe drinking water and b) sanitation in developing countries 1980-1994 4217. Cholera index (nos. of deaths per million) 1970-1997 4318. Flood disasters: a) number of flood disasters 1987-1996 by continent
b) flood damage 1987-1996 in million dollars by continentc) deaths from floods 1987-1996 by continent 46
List of Tables
1. Water use by sector (km3 y-1) 92. Services provided by freshwater ecosystems 113. Global trends in freshwater withdrawal 184. Conceptual model for assessing causes and implications of change in freshwater
ecosystems 245. Dam disasters in which 1,000 or more people have been killed 286. Examples of the numbers of people displaced as a consequence of the construction
of large dams 297. Wetland loss 358. Freshwater fish species: numbers per country and species per unit land area 389. Current water constraints according to use-to-resources index 4110. Estimates of morbidity and mortality of water-related diseases 4411. Core principles in the management of freshwater ecosystems 5512. Tools for use in integrated catchment management 58
1
1. Introduction
Giver and taker of life; essential element of all existence and untameable destroyer;spiritual expression of purity and contaminated purveyor of affliction; bringer ofblessings and of tragedy; agent of social, economic and political discord. Water is allthese things ........(Page, 1997).
As with all species, humankind is dependent on functioning ecosystems to survive; ecological processes keepthe planet fit for life. All organisms impact on ecosystems, but only humans have the ability to significantlymodify the environment to meet their own needs. It seems likely that as we approach the end of the twentieth-century humankind has altered, to a greater or lesser extent, nearly all natural systems on the planet. However, uniquely among the species on Earth, our cognitive abilities, enable us to make choices about howwe utilise ecosystems and the extent to which we alter them. In this regard, key questions that need to beasked are:
Χ to what purpose do we modify natural systems ?;Χ how should we plan the limits to which we modify natural systems ?;Χ at what point do human-induced changes in a natural ecosystem become deleterious ?
The history of land-use in the developed world indicates that, in the most prosperous countries, theecosystems that people most depend on are those whose function, composition and structure are far removedfrom natural systems. In most developing countries many people remain directly dependent on ecosystemsthat are in a much more natural state. In recent years concern about the modification of natural systems hasbeen expressed for three reasons. First, it is not known if heavily modified systems are sustainable in thelong-term. Second, the realisation that natural (i.e. less modified) ecosystems provide both economic andsocial benefits to society and that these benefits may be lost if an ecosystem is changed, has gainedprominence. Third, it is felt by many that humankind has an ethical duty to protect nature from the impactof human activities.
In the light of these concerns, the ecosystem management approach has been cast as a new paradigmreforming the way that humans interact with nature. In broad terms ecosystem management seeks to restoreand sustain the health, productivity, and biological diversity of ecosystems and the overall quality of lifethrough a natural resource management approach that is fully integrated with social and economic goals(White House Interagency Ecosystem Management Task Force, 1995). Although there are numerousdefinitions of ecosystem management, for the purpose of this paper it is defined as:
deliberate and conscious manipulation of ecosystem structure and/or function, orregulation of human uses of ecological systems, so as to retain defined and desiredfeatures and processes, and to meet human needs in an optimal and sustainable way.
However, what this means in terms of practical application remains far from clear.
Water, vital for life, plays a complex and multifaceted role in both human activities and natural systems. Itsavailability varies both spatially and temporally and both too little (i.e. droughts) and too much (i.e. floods)have negative effects on human well being. In an attempt to control water resources humanity hasmanipulated freshwater ecosystems for thousands of years. For example, both the Sumerian and Egyptiancivilisations, flourished in part because of food surpluses derived as a consequence of elementary watermanagement strategies (Newson, 1992). Traditionally, water management has focussed on the directprovision of enough water for people to drink, grow their food and support industries.
Today, the world is struggling with complex problems related to freshwater management. Many areas of the
2
world face water stress, millions of people die annually from water-related diseases, human-induced changeof freshwater ecosystems continues apace and world-wide there are growing disputes over water. Highpopulation growth, increasing expectations and environmental degradation are increasing the severe strainson existing water resources. It is estimated that humans already appropriate more than half of all accessiblesurface water runoff and that this may increase to 70% by 2025 (Postel et al., 1996). The use of water byhumankind impinges on the volume, quality and seasonal rhythm of freshwater, so that the effective shareavailable for the rest of nature declines.
Management of freshwater is required to balance conflicting demands. The primary goal of freshwaterecosystem management is to maximise the long-term economic and social benefits to be gained fromfreshwater whilst at the same time conserving ecosystem processes and biodiversity. Mis-management offreshwater ecosystems may result in environmental degradation, destruction of ecosystem functions and lossof wildlife habitat with a consequent loss in the benefits to humankind. There are instances where humaninterventions in freshwater ecosystems have induced, or at least contributed to, social disorder and violentconflict.
The publication of the Brundtland Report, Our Common Future (WCED, 1987) and Caring for the Earth(IUCN et al., 1991) and the UN Conference on Environment and Development (UNCED) in 1992 mark aturning point in modern thinking and led to two interrelated concepts. The first is sustainable development,which has been defined as “development that meets the needs of the present without compromising the abilityof future generations to meet their own needs”. The second concept is that the lives of people and theenvironment are profoundly inter-linked. This has lead to an alternative definition of sustainabledevelopment, i.e. “improving the quality of human life while living within the carrying capacity of supportingecosystems”. Based upon principles developed at water conferences in Mar del Plata (UN, 1977) and inDublin (WMO, 1992), Chapter 18 of Agenda 21 develops the concept of Integrated Water ResourcesManagement (IWRM). This treats “water as an integral part of the ecosystem, a natural resource and a socialand economic good, whose quantity and quality determine the nature of its utilisation” (UN, 1992). Centralto an IWRM approach is the protection of surface water and groundwater resources, water quality and aquaticecosystems and the management of land and water in an integrated way.
Hence, at the highest political levels, there is an increasing consensus on the need to manage water and water-related processes in a sustainable manner. However, at the local level, water is still often taken for grantedand, in development, it remains the case that the value of ecosystems is rarely considered. A key problem forregional and local managers is how to allocate water between conflicting human demands and therequirements of the environment. It is often the case that the integrated effects of local management decisionsare incompatible with the broader scale wishes of society and the agenda of high politics. There remainserious challenges to confront before there is widespread and credible application of the ecosystemmanagement concept. As we approach the 21st century there are increasing constraints on human activitiesposed by the condition of freshwater ecosystems, the problems continue to escalate, and there is a growingfeeling of an incipient world water crisis (Falkenmark and Lundqvist, 1998).
The increasing human pressures placed on freshwater ecosystems are a consequence of socio-economic statesthat ultimately arise from a number of global drivers of which population growth, urbanisation and economicglobalisation are the most significant. Although these aspects are touched on briefly in this paper, they arenot discussed in detail; this is the task of the other two papers in the series (Swanson and Doble, 1999;Soussan et al., 1999). This paper focuses on technical issues related to reconciling freshwater ecosystemmaintenance and water resource management.
The primary objective of this paper is to present a summary of current thinking on the link between themanagement of freshwater ecosystems and environmental security. Environmental security can, in simpleterms, be considered as a state of human well-being arising from a stable, protective and unthreatening
3
physical environment. Discussed in detail in section 2, for the purpose of this paper it is defined as:
a means of achieving long-term social, economic and ethical security through: i) thesustainable utilisation of renewable resources and ecosystem functions; ii) protectionfrom natural hazards and iii) conservation of other species
Section 2 provides an overview of the key concepts related to freshwater ecosystems, summarises the benefitsthese systems provide for humankind, and outlines the principle of environmental security. Section 3 is areview of the human-induced pressures presently acting on freshwater ecosystems, the current state of thesesystems and the consequent implications for environmental security. As far as possible, numerical indicesare used to summarise information about the complex inter-relationship between people and freshwaterecosystems. In section 4, three scenarios, conventional water world, water crisis and sustainable water world,are presented. These provide very different visions of possible futures. The implications for the state offreshwater ecosystems and consequent environmental security are considered in each case. Against thisbackground, the concept of ecosystem management as a possible future strategy for resource managementis presented in section 5. Various technical options for both mitigating and adapting to changes in freshwaterecosystems are discussed. A final statement, which draws together the key findings of this paper, is presentedin section 6. In addition, a number of key issues, identified to provide the basis for discussion at the CostaRica workshop, are offered.
4
2. Background
However much we learn to manipulate our environment, we cannot escape ourdependency on biodiversity for food, medicines and materials or for the ecologicalservices provided by healthy, diverse ecosystems(Stephen Blackmore, Keeper of Botany, The Natural History Museum, London, 1996).
In this section, ecosystem concepts are discussed and the services provided by freshwater ecosystems to thebenefit of human societies are summarised. A definition of environmental security is sought and the need forecosystem management is addressed.
2.1 The global water cycle
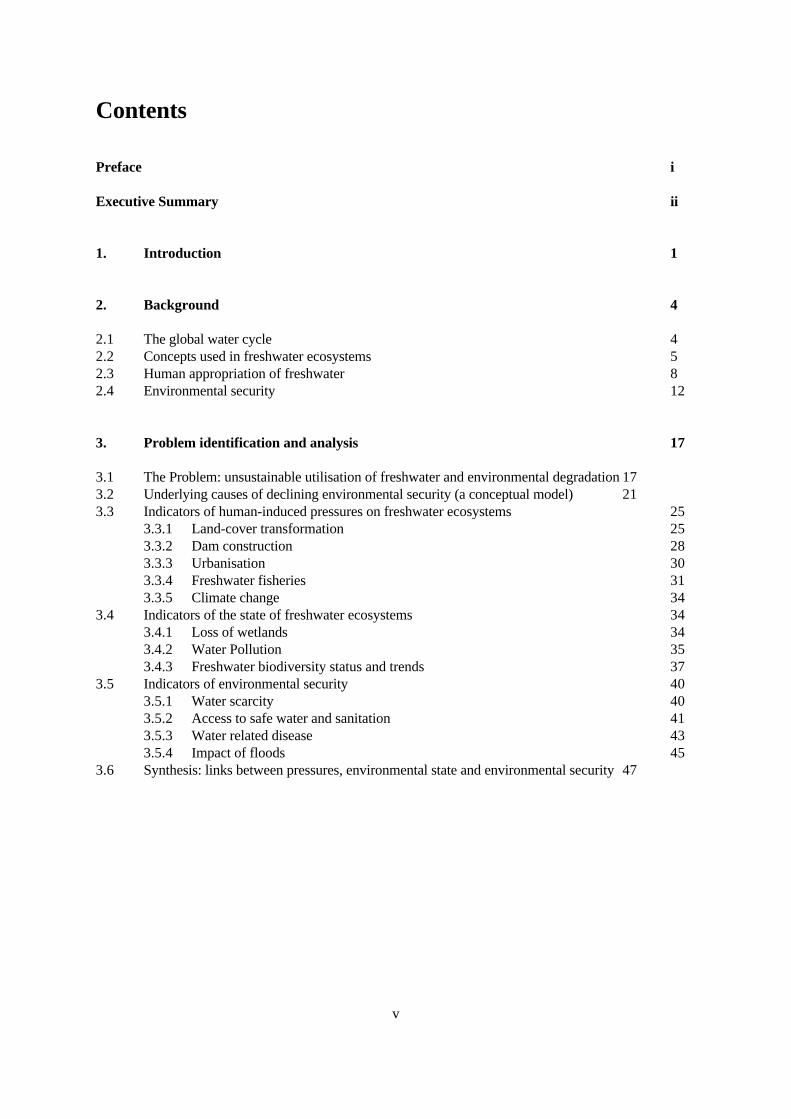
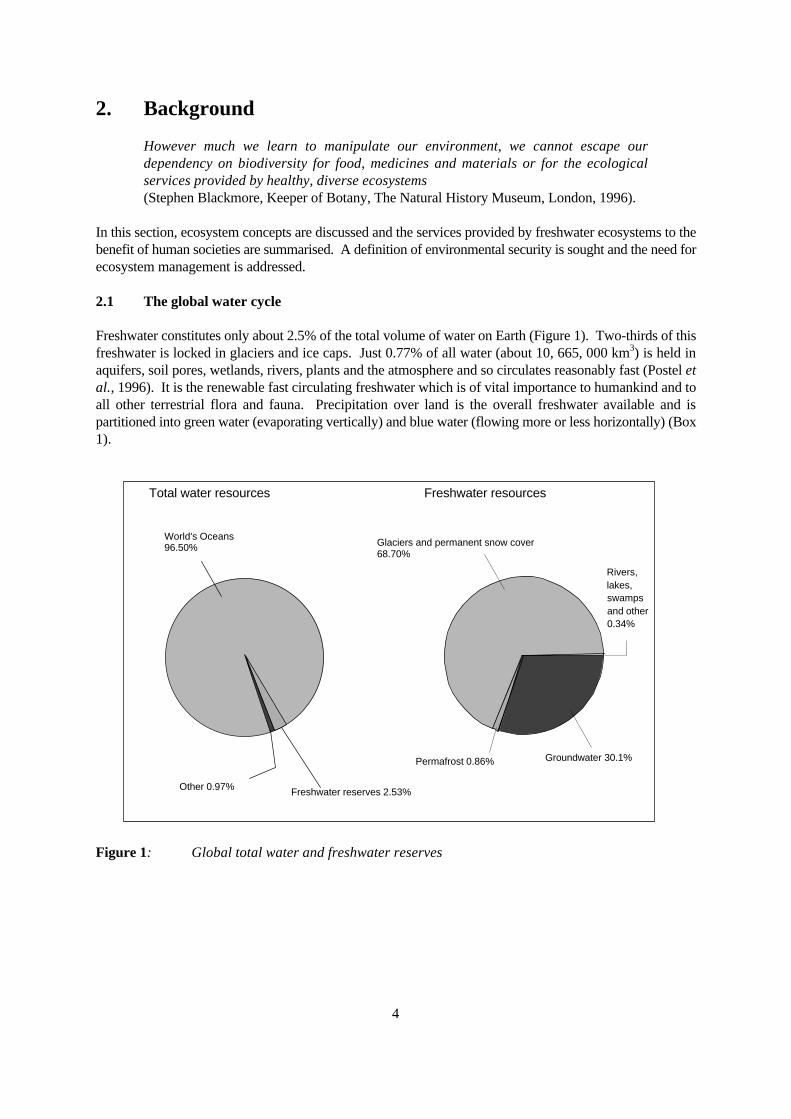
Freshwater constitutes only about 2.5% of the total volume of water on Earth (Figure 1). Two-thirds of thisfreshwater is locked in glaciers and ice caps. Just 0.77% of all water (about 10, 665, 000 km3) is held inaquifers, soil pores, wetlands, rivers, plants and the atmosphere and so circulates reasonably fast (Postel etal., 1996). It is the renewable fast circulating freshwater which is of vital importance to humankind and toall other terrestrial flora and fauna. Precipitation over land is the overall freshwater available and ispartitioned into green water (evaporating vertically) and blue water (flowing more or less horizontally) (Box1).
Total water resources Freshwater resources
Permafrost 0.86% Groundwater 30.1%
Rivers,lakes,swampsand other0.34%
Glaciers and permanent snow cover 68.70%
World's Oceans 96.50%
Other 0.97% Freshwater reserves 2.53%
Figure 1: Global total water and freshwater reserves
5
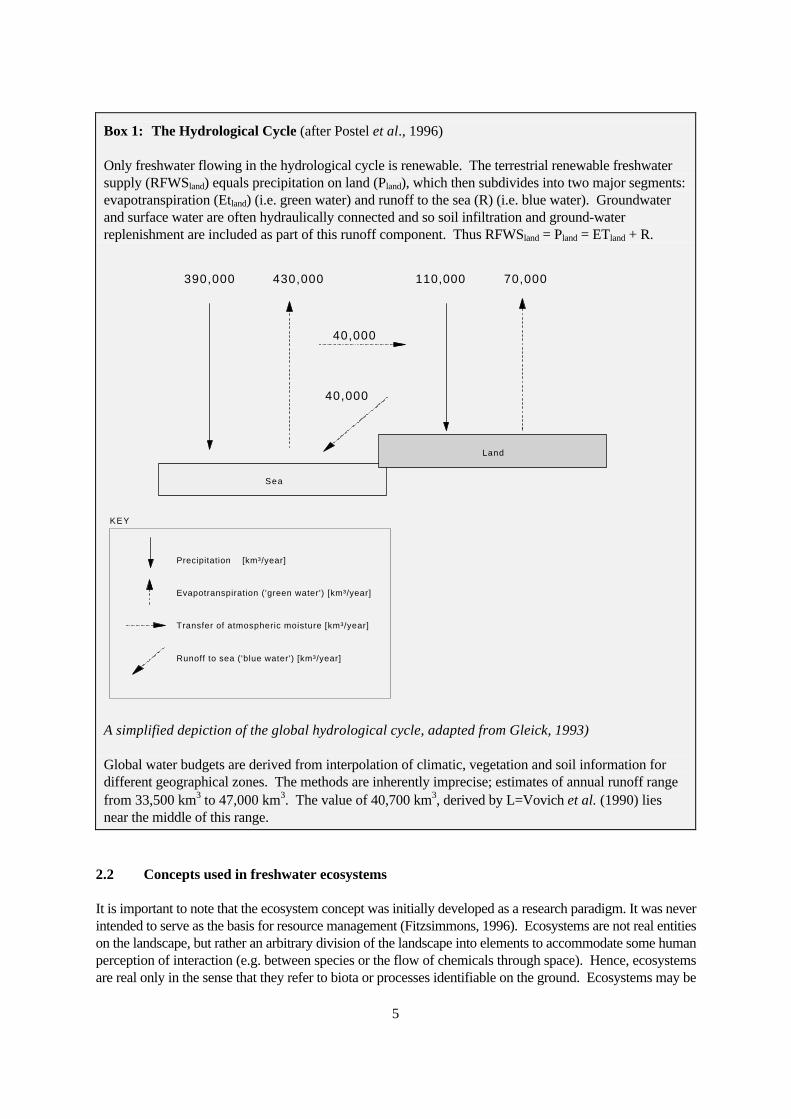
Box 1: The Hydrological Cycle (after Postel et al., 1996)
Only freshwater flowing in the hydrological cycle is renewable. The terrestrial renewable freshwatersupply (RFWSland) equals precipitation on land (Pland), which then subdivides into two major segments:evapotranspiration (Etland) (i.e. green water) and runoff to the sea (R) (i.e. blue water). Groundwaterand surface water are often hydraulically connected and so soil infiltration and ground-waterreplenishment are included as part of this runoff component. Thus RFWSland = Pland = ETland + R.
Land
Sea
390,000 430,000 110,000 70,000
40,000
Precipitation [km³/year]
Evapotranspiration ('green water') [km³/year]
Transfer of atmospheric moisture [km³/year]
Runoff to sea ('blue water') [km³/year]
KEY
40,000
A simplified depiction of the global hydrological cycle, adapted from Gleick, 1993)
Global water budgets are derived from interpolation of climatic, vegetation and soil information fordifferent geographical zones. The methods are inherently imprecise; estimates of annual runoff rangefrom 33,500 km3 to 47,000 km3. The value of 40,700 km3, derived by L=Vovich et al. (1990) liesnear the middle of this range.
2.2 Concepts used in freshwater ecosystems
It is important to note that the ecosystem concept was initially developed as a research paradigm. It was neverintended to serve as the basis for resource management (Fitzsimmons, 1996). Ecosystems are not real entitieson the landscape, but rather an arbitrary division of the landscape into elements to accommodate some humanperception of interaction (e.g. between species or the flow of chemicals through space). Hence, ecosystemsare real only in the sense that they refer to biota or processes identifiable on the ground. Ecosystems may be
6
identified at multiple spatial scales by association of ecological factors, such as climate, geology, landform,soil, water, plants and animals (Jensen et al., 1996).
In this paper freshwater ecosystems are defined as linked landscape elements that affect the passage of bluewater from the land to the sea and green water from the land to the atmosphere. As such nearly the wholeof the terrestrial milieu can be considered as part of freshwater ecosystems. Freshwater ecosystemsencompass all the environmental units associated with river catchments, not only the whole length of the riverchannel, but also lakes, ponds, meadows, floodplains, fens and swamps as well as the upland areas whichdrain into these. It can be difficult to define the boundaries of ecosystems and in the context of freshwaterit is in many instances the river catchment that is the most easily identified management unit (section 5.1.2). A river catchment is defined as the unit of land from which water flows downhill to a specified point on awatercourse. It is determined by topographical features which include a surrounding boundary or perimeterknown as a drainage divide or catchment boundary. However, it is important to note that the use of rivercatchments as a management unit has limitations. These include the fact that groundwater catchments areoften very different to river catchments because the movement of groundwater is often determined bygeological characteristics, rather than topography. Furthermore, river catchments do not include the coastalmarine habitats, the ecology of which are often dependent on the inflow of freshwater (Box 2).
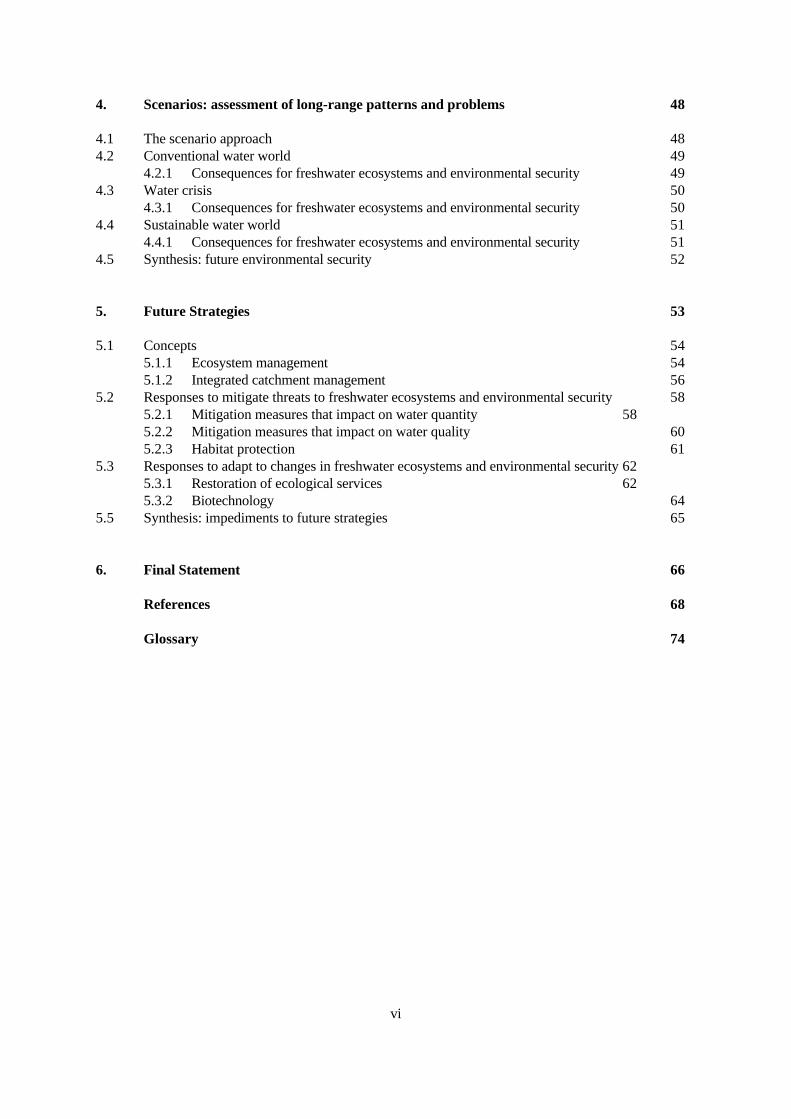
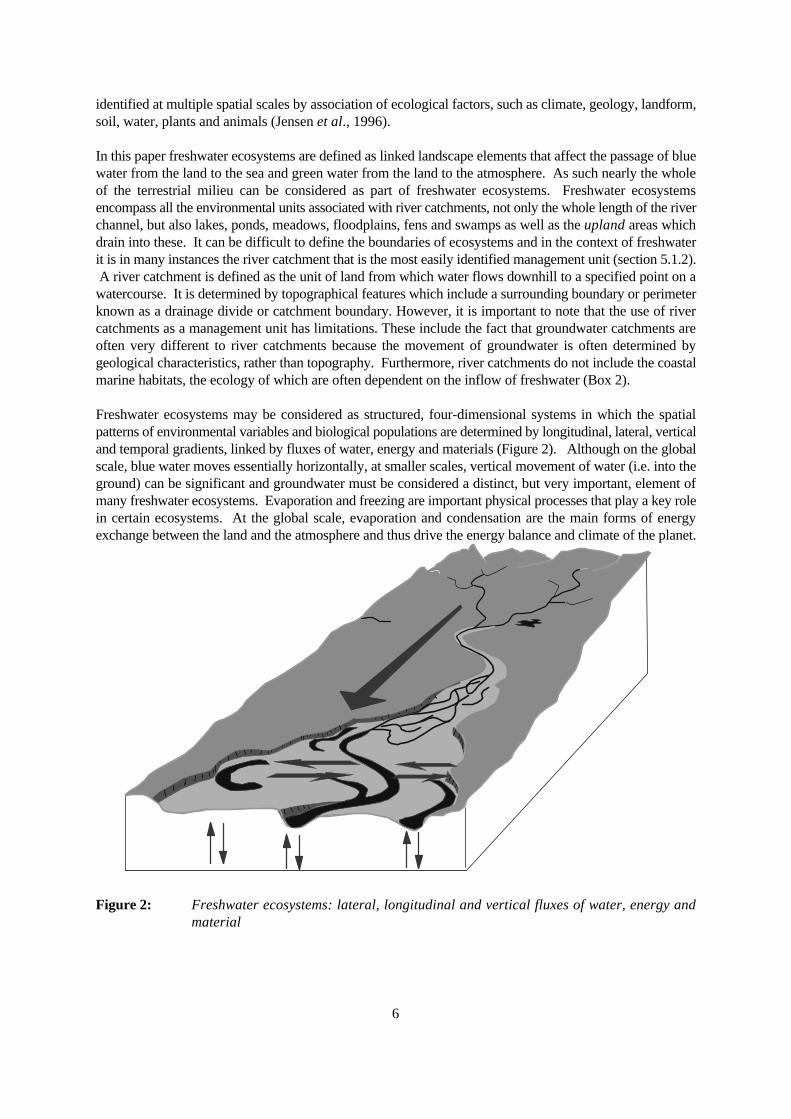
Freshwater ecosystems may be considered as structured, four-dimensional systems in which the spatialpatterns of environmental variables and biological populations are determined by longitudinal, lateral, verticaland temporal gradients, linked by fluxes of water, energy and materials (Figure 2). Although on the globalscale, blue water moves essentially horizontally, at smaller scales, vertical movement of water (i.e. into theground) can be significant and groundwater must be considered a distinct, but very important, element ofmany freshwater ecosystems. Evaporation and freezing are important physical processes that play a key rolein certain ecosystems. At the global scale, evaporation and condensation are the main forms of energyexchange between the land and the atmosphere and thus drive the energy balance and climate of the planet.
Figure 2: Freshwater ecosystems: lateral, longitudinal and vertical fluxes of water, energy andmaterial
7
Box 2: The dependence of coastal marine ecosystems on freshwater ecosystems
Material and energy fluxes ensure that all ecosystems are linked in both space and time. Coastal ecosystemshighlight the fact that all ecosystems are interdependent. Changes in terrestrial freshwater ecosystems canhave a considerable impact on the state of marine and estuarine systems. For example, the Indus Delta , anarea of some 600 000 ha on the borders of India and Pakistan is dependent on the outflow of freshwater andsilt from the Indus River. In recent years the character of the delta has changed as it has been progressivelydeprived of 80% of its average annual freshwater and silt inflow as a consequence of upstream abstractionfor irrigation, occurring hundreds of kilometres upstream (Pirot and Meynell, 1998).
The construction of dams alters the flow regime of rivers which in turn modifies the input of freshwater,nutrients and silt into marine systems. This often results in increased salinity and reduced productivity inestuarine and adjacent marine areas with a consequent effect on associated fisheries. For example, in theIndus Delta the creeks and mangroves provide excellent nursery areas for young fish, especially shrimps.Shrimps are a major export commodity, making up 68% of the US$100 million which Pakistan earns fromfishery exports. However, it is feared that shrimp and other commercial species will decline as the mangrovesare lost as a consequence of human induced changes, both locally and upstream (Meynell and Qureshi, 1993).
Reduced sedimentation as a consequence of silt being trapped behind dams can result in coastal erosion. Forexample, parts of the coastline of the Nile delta are being eroded at a rate of 240 m a year. Although the deltawas eroding prior to construction of the Aswan High Dam the higher rates of erosion observed in recent yearsare attributed by many to the reduction in sediment reaching the coast after closure of this dam (McCully,1996). Similarly, erosion of parts of the Rufiji Delta, by up to 40 m per year, is attributed to the constructionof dams (Horrill, 1993).
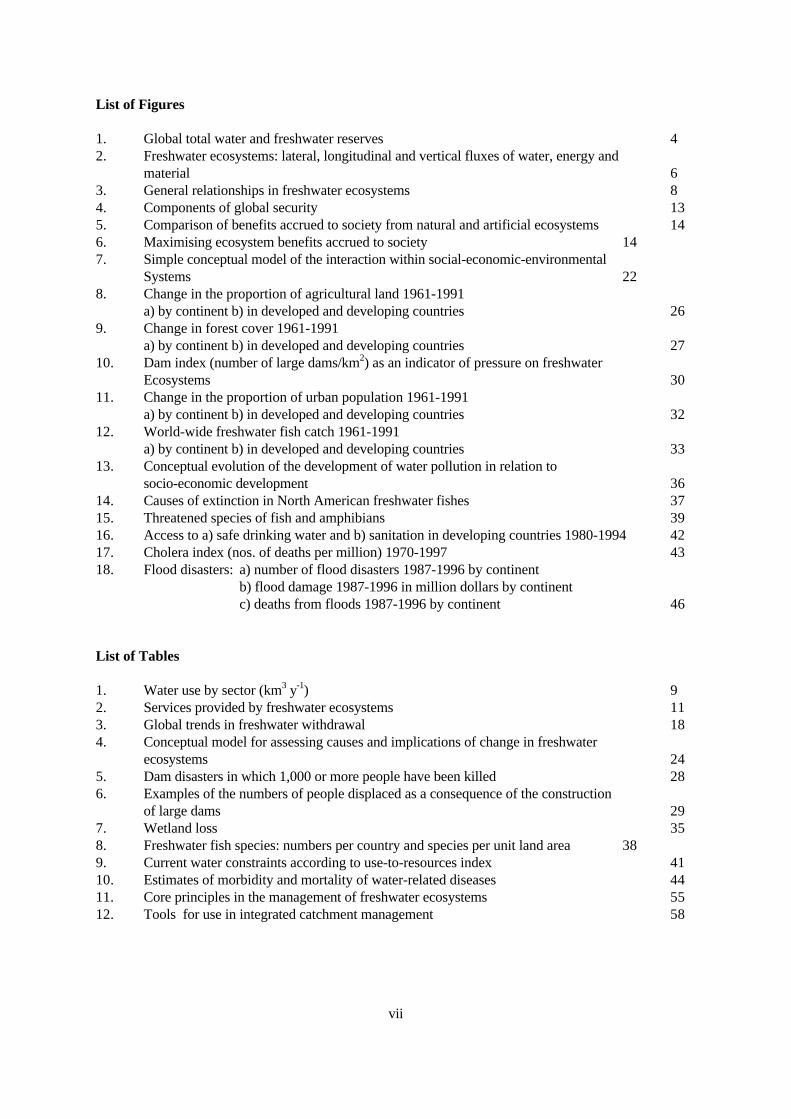
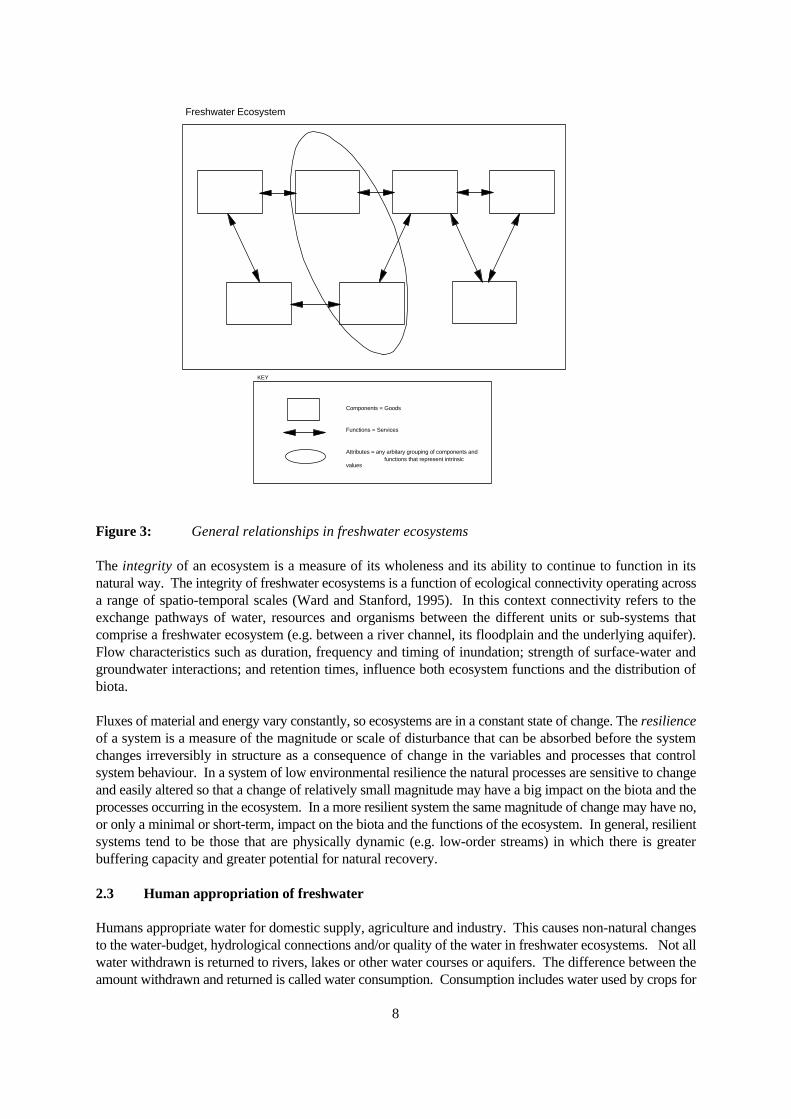
Freshwater ecosystems comprise features that may be classified as components, functions andattributes (Figure 3). The components of the system are the biotic and non-biotic features, which include soiland sediment, water, and aquatic organisms (i.e. microbes, macrophytes and micro-algae, riparian plants,invertebrates, fish, amphibians, reptiles, mammals and water birds). The interactions between thecomponents comprise hydrological, biological, chemical and physical processes that result in ecosystemfunctions such as evaporation, respiration, photosynthesis, retention of water, nutrient transformation,productivity and habitat maintenance and development. The ecosystem itself possesses attributes, such asbiodiversity, that derive from both the structure and functioning of the ecosystem. People obtain both directand indirect benefits from all three facets of freshwater ecosystems (section 2.3).
8
Freshwater Ecosystem
Components = Goods
Functions = Services
Attributes = any arbitary grouping of components and functions that represent intrinsic
values
KEY
Figure 3: General relationships in freshwater ecosystems
The integrity of an ecosystem is a measure of its wholeness and its ability to continue to function in itsnatural way. The integrity of freshwater ecosystems is a function of ecological connectivity operating acrossa range of spatio-temporal scales (Ward and Stanford, 1995). In this context connectivity refers to theexchange pathways of water, resources and organisms between the different units or sub-systems thatcomprise a freshwater ecosystem (e.g. between a river channel, its floodplain and the underlying aquifer).Flow characteristics such as duration, frequency and timing of inundation; strength of surface-water andgroundwater interactions; and retention times, influence both ecosystem functions and the distribution ofbiota.
Fluxes of material and energy vary constantly, so ecosystems are in a constant state of change. The resilienceof a system is a measure of the magnitude or scale of disturbance that can be absorbed before the systemchanges irreversibly in structure as a consequence of change in the variables and processes that controlsystem behaviour. In a system of low environmental resilience the natural processes are sensitive to changeand easily altered so that a change of relatively small magnitude may have a big impact on the biota and theprocesses occurring in the ecosystem. In a more resilient system the same magnitude of change may have no,or only a minimal or short-term, impact on the biota and the functions of the ecosystem. In general, resilientsystems tend to be those that are physically dynamic (e.g. low-order streams) in which there is greaterbuffering capacity and greater potential for natural recovery.
2.3 Human appropriation of freshwater
Humans appropriate water for domestic supply, agriculture and industry. This causes non-natural changesto the water-budget, hydrological connections and/or quality of the water in freshwater ecosystems. Not allwater withdrawn is returned to rivers, lakes or other water courses or aquifers. The difference between theamount withdrawn and returned is called water consumption. Consumption includes water used by crops for
9
transpiration or building plant tissue, water evaporated from land and reservoirs and that part of the waterdiverted for industrial or community use that evaporates or is consumed or incorporated into a finishedproduct. Consumed water cannot be immediately re-used. Water returned to ecosystems may be polluted;warmer, cooler, richer in nutrients or heavy-metals etc.
In the past the effect of human activities on freshwater ecosystems was generally insignificant and of a localnature. In many cases, the natural systems had sufficient resilience to recover from the human-inducedstresses placed on them. The situation has fundamentally changed during recent centuries; in many regionsthe effects of human activities are evident both in terms of water resource development, water use, and land-use change. In the past 50 years, increasing population, coupled with technological advances and intensiveirrigation development have had an ever greater impact (both intentional and inadvertent) on freshwaterecosystems. Changes in water balance and water quality have resulted in environmental degradation,destruction of natural habitat and/or loss of ecological functions, with serious implications not only for theintegrity of these systems but also for people’s well-being.
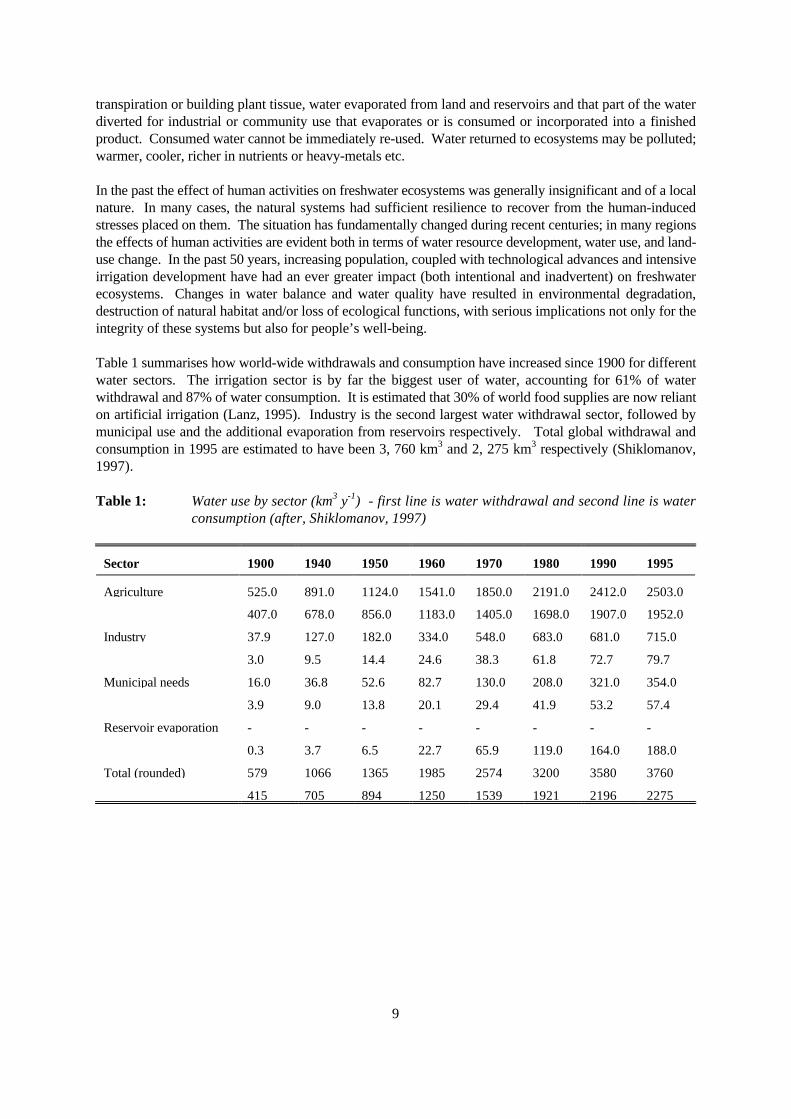
Table 1 summarises how world-wide withdrawals and consumption have increased since 1900 for differentwater sectors. The irrigation sector is by far the biggest user of water, accounting for 61% of waterwithdrawal and 87% of water consumption. It is estimated that 30% of world food supplies are now relianton artificial irrigation (Lanz, 1995). Industry is the second largest water withdrawal sector, followed bymunicipal use and the additional evaporation from reservoirs respectively. Total global withdrawal andconsumption in 1995 are estimated to have been 3, 760 km3 and 2, 275 km3 respectively (Shiklomanov,1997).
Table 1: Water use by sector (km3 y-1) - first line is water withdrawal and second line is waterconsumption (after, Shiklomanov, 1997)
Sector 1900 1940 1950 1960 1970 1980 1990 1995
Agriculture 525.0 891.0 1124.0 1541.0 1850.0 2191.0 2412.0 2503.0
407.0 678.0 856.0 1183.0 1405.0 1698.0 1907.0 1952.0
Industry 37.9 127.0 182.0 334.0 548.0 683.0 681.0 715.0
3.0 9.5 14.4 24.6 38.3 61.8 72.7 79.7
Municipal needs 16.0 36.8 52.6 82.7 130.0 208.0 321.0 354.0
3.9 9.0 13.8 20.1 29.4 41.9 53.2 57.4
Reservoir evaporation - - - - - - - -
0.3 3.7 6.5 22.7 65.9 119.0 164.0 188.0
Total (rounded) 579 1066 1365 1985 2574 3200 3580 3760
415 705 894 1250 1539 1921 2196 2275
10
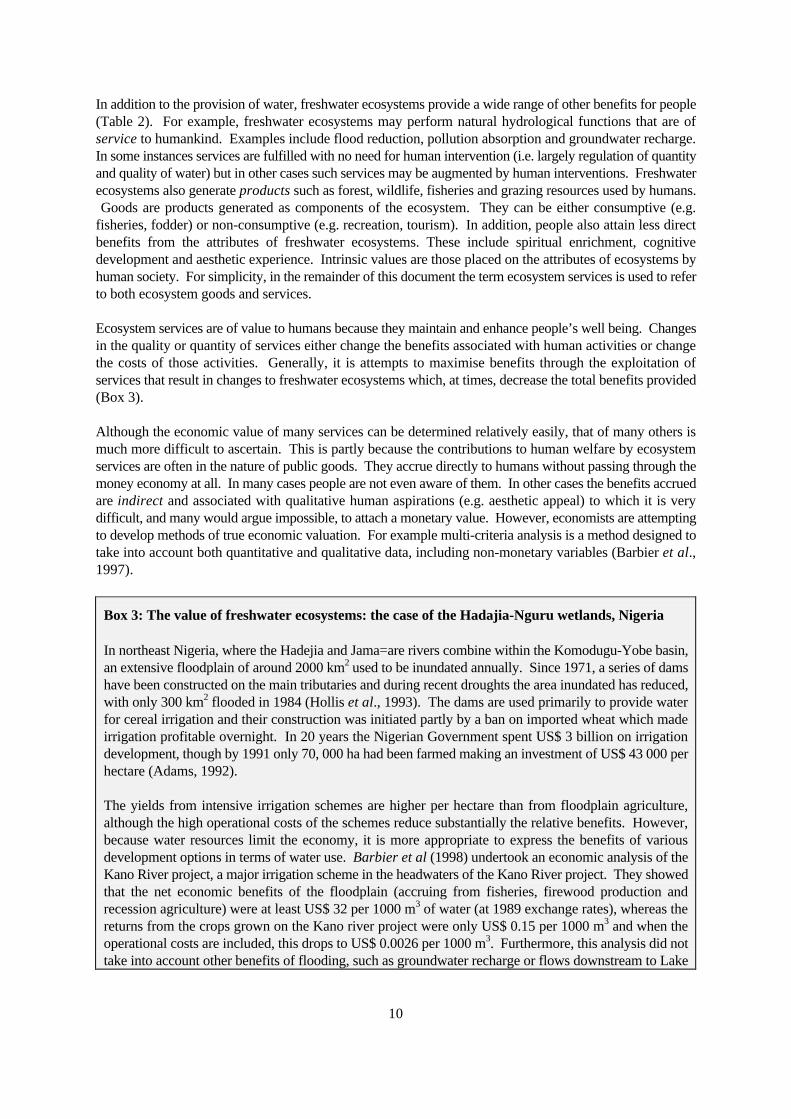
In addition to the provision of water, freshwater ecosystems provide a wide range of other benefits for people(Table 2). For example, freshwater ecosystems may perform natural hydrological functions that are ofservice to humankind. Examples include flood reduction, pollution absorption and groundwater recharge.In some instances services are fulfilled with no need for human intervention (i.e. largely regulation of quantityand quality of water) but in other cases such services may be augmented by human interventions. Freshwaterecosystems also generate products such as forest, wildlife, fisheries and grazing resources used by humans. Goods are products generated as components of the ecosystem. They can be either consumptive (e.g.fisheries, fodder) or non-consumptive (e.g. recreation, tourism). In addition, people also attain less directbenefits from the attributes of freshwater ecosystems. These include spiritual enrichment, cognitivedevelopment and aesthetic experience. Intrinsic values are those placed on the attributes of ecosystems byhuman society. For simplicity, in the remainder of this document the term ecosystem services is used to referto both ecosystem goods and services.
Ecosystem services are of value to humans because they maintain and enhance people’s well being. Changesin the quality or quantity of services either change the benefits associated with human activities or changethe costs of those activities. Generally, it is attempts to maximise benefits through the exploitation ofservices that result in changes to freshwater ecosystems which, at times, decrease the total benefits provided(Box 3).
Although the economic value of many services can be determined relatively easily, that of many others ismuch more difficult to ascertain. This is partly because the contributions to human welfare by ecosystemservices are often in the nature of public goods. They accrue directly to humans without passing through themoney economy at all. In many cases people are not even aware of them. In other cases the benefits accruedare indirect and associated with qualitative human aspirations (e.g. aesthetic appeal) to which it is verydifficult, and many would argue impossible, to attach a monetary value. However, economists are attemptingto develop methods of true economic valuation. For example multi-criteria analysis is a method designed totake into account both quantitative and qualitative data, including non-monetary variables (Barbier et al.,1997).
Box 3: The value of freshwater ecosystems: the case of the Hadajia-Nguru wetlands, Nigeria
In northeast Nigeria, where the Hadejia and Jama=are rivers combine within the Komodugu-Yobe basin,an extensive floodplain of around 2000 km2 used to be inundated annually. Since 1971, a series of damshave been constructed on the main tributaries and during recent droughts the area inundated has reduced,with only 300 km2 flooded in 1984 (Hollis et al., 1993). The dams are used primarily to provide waterfor cereal irrigation and their construction was initiated partly by a ban on imported wheat which madeirrigation profitable overnight. In 20 years the Nigerian Government spent US$ 3 billion on irrigationdevelopment, though by 1991 only 70, 000 ha had been farmed making an investment of US$ 43 000 perhectare (Adams, 1992).
The yields from intensive irrigation schemes are higher per hectare than from floodplain agriculture,although the high operational costs of the schemes reduce substantially the relative benefits. However,because water resources limit the economy, it is more appropriate to express the benefits of variousdevelopment options in terms of water use. Barbier et al (1998) undertook an economic analysis of theKano River project, a major irrigation scheme in the headwaters of the Kano River project. They showedthat the net economic benefits of the floodplain (accruing from fisheries, firewood production andrecession agriculture) were at least US$ 32 per 1000 m3 of water (at 1989 exchange rates), whereas thereturns from the crops grown on the Kano river project were only US$ 0.15 per 1000 m3 and when theoperational costs are included, this drops to US$ 0.0026 per 1000 m3. Furthermore, this analysis did nottake into account other benefits of flooding, such as groundwater recharge or flows downstream to Lake
11
Chad.
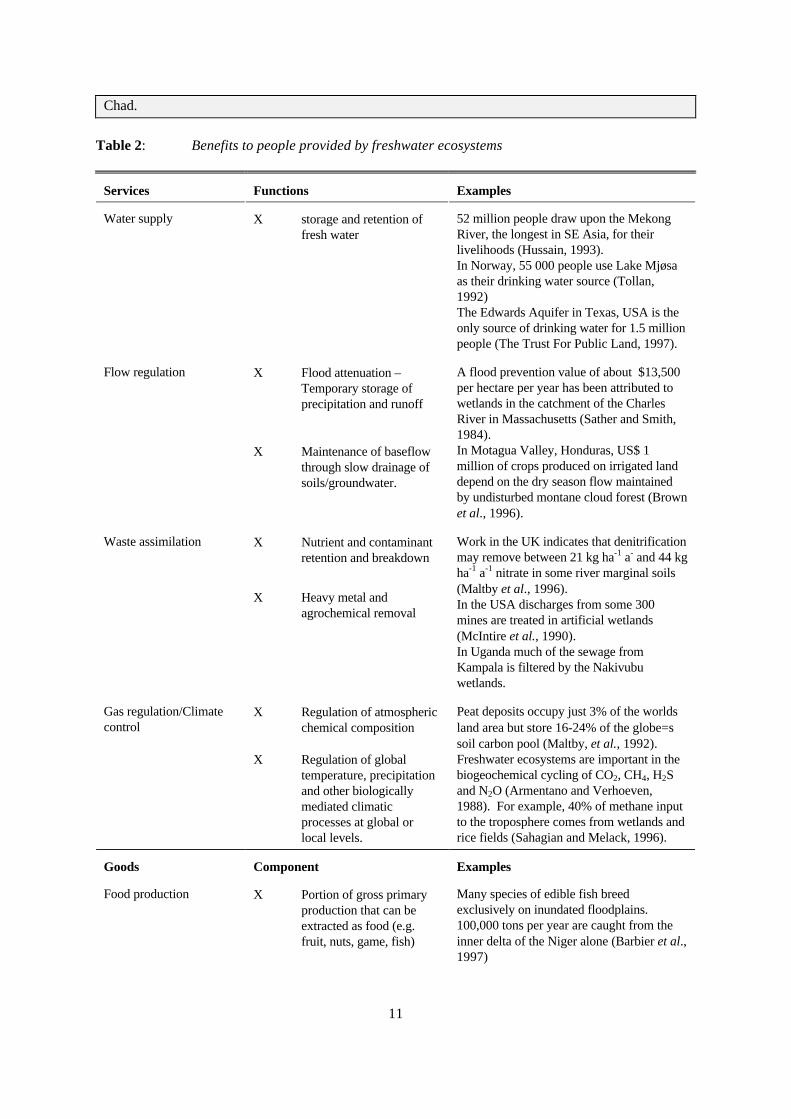
Table 2: Benefits to people provided by freshwater ecosystems
Services Functions Examples
Water supply Χ storage and retention offresh water
52 million people draw upon the MekongRiver, the longest in SE Asia, for theirlivelihoods (Hussain, 1993).In Norway, 55 000 people use Lake Mjøsaas their drinking water source (Tollan,1992)The Edwards Aquifer in Texas, USA is theonly source of drinking water for 1.5 millionpeople (The Trust For Public Land, 1997).
Flow regulation Χ Flood attenuation –Temporary storage ofprecipitation and runoff
Χ Maintenance of baseflowthrough slow drainage ofsoils/groundwater.
A flood prevention value of about $13,500per hectare per year has been attributed towetlands in the catchment of the CharlesRiver in Massachusetts (Sather and Smith,1984).In Motagua Valley, Honduras, US$ 1million of crops produced on irrigated landdepend on the dry season flow maintainedby undisturbed montane cloud forest (Brownet al., 1996).
Waste assimilation Χ Nutrient and contaminantretention and breakdown
Χ Heavy metal andagrochemical removal
Work in the UK indicates that denitrificationmay remove between 21 kg ha-1 a- and 44 kgha-1 a-1 nitrate in some river marginal soils(Maltby et al., 1996). In the USA discharges from some 300mines are treated in artificial wetlands(McIntire et al., 1990).In Uganda much of the sewage fromKampala is filtered by the Nakivubuwetlands.
Gas regulation/Climatecontrol
Χ Regulation of atmosphericchemical composition
Χ Regulation of globaltemperature, precipitationand other biologicallymediated climaticprocesses at global orlocal levels.
Peat deposits occupy just 3% of the worldsland area but store 16-24% of the globe=ssoil carbon pool (Maltby, et al., 1992).Freshwater ecosystems are important in thebiogeochemical cycling of CO2, CH4, H2Sand N2O (Armentano and Verhoeven,1988). For example, 40% of methane inputto the troposphere comes from wetlands andrice fields (Sahagian and Melack, 1996).
Goods Component Examples
Food production Χ Portion of gross primaryproduction that can beextracted as food (e.g.fruit, nuts, game, fish)
Many species of edible fish breedexclusively on inundated floodplains.100,000 tons per year are caught from theinner delta of the Niger alone (Barbier et al.,1997)
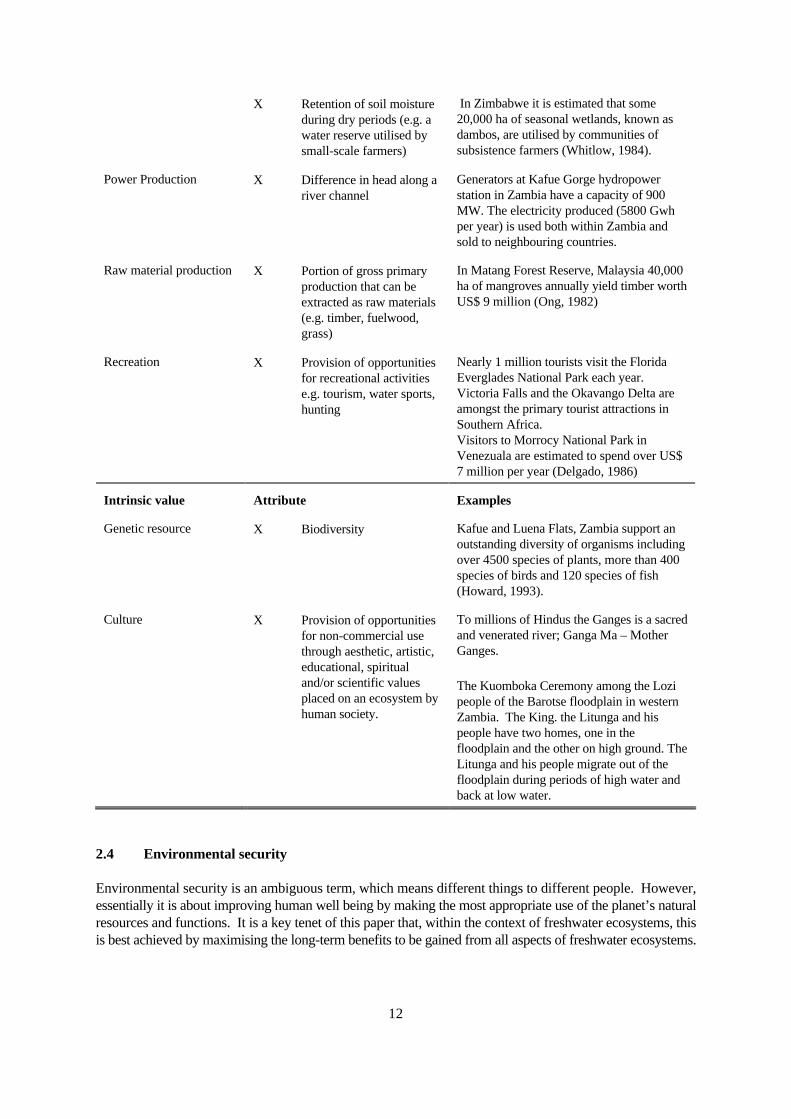
12
Χ Retention of soil moistureduring dry periods (e.g. awater reserve utilised bysmall-scale farmers)
In Zimbabwe it is estimated that some20,000 ha of seasonal wetlands, known asdambos, are utilised by communities ofsubsistence farmers (Whitlow, 1984).
Power Production Χ Difference in head along ariver channel
Generators at Kafue Gorge hydropowerstation in Zambia have a capacity of 900MW. The electricity produced (5800 Gwhper year) is used both within Zambia andsold to neighbouring countries.
Raw material production Χ Portion of gross primaryproduction that can beextracted as raw materials(e.g. timber, fuelwood,grass)
In Matang Forest Reserve, Malaysia 40,000ha of mangroves annually yield timber worthUS$ 9 million (Ong, 1982)
Recreation Χ Provision of opportunitiesfor recreational activitiese.g. tourism, water sports,hunting
Nearly 1 million tourists visit the FloridaEverglades National Park each year. Victoria Falls and the Okavango Delta areamongst the primary tourist attractions inSouthern Africa.Visitors to Morrocy National Park inVenezuala are estimated to spend over US$7 million per year (Delgado, 1986)
Intrinsic value Attribute Examples
Genetic resource Χ Biodiversity Kafue and Luena Flats, Zambia support anoutstanding diversity of organisms includingover 4500 species of plants, more than 400species of birds and 120 species of fish(Howard, 1993).
Culture Χ Provision of opportunitiesfor non-commercial usethrough aesthetic, artistic,educational, spiritualand/or scientific valuesplaced on an ecosystem byhuman society.
To millions of Hindus the Ganges is a sacredand venerated river; Ganga Ma – MotherGanges.
The Kuomboka Ceremony among the Lozipeople of the Barotse floodplain in westernZambia. The King. the Litunga and hispeople have two homes, one in thefloodplain and the other on high ground. TheLitunga and his people migrate out of thefloodplain during periods of high water andback at low water.
2.4 Environmental security
Environmental security is an ambiguous term, which means different things to different people. However,essentially it is about improving human well being by making the most appropriate use of the planet’s naturalresources and functions. It is a key tenet of this paper that, within the context of freshwater ecosystems, thisis best achieved by maximising the long-term benefits to be gained from all aspects of freshwater ecosystems.
13
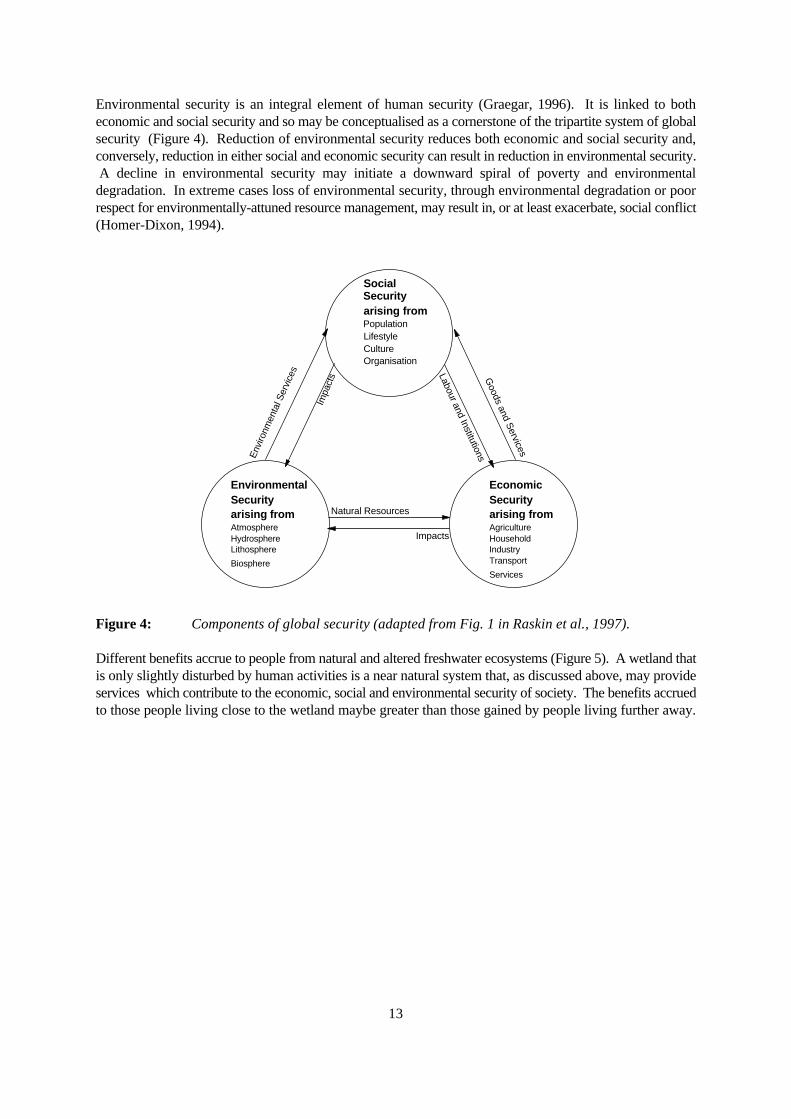
Environmental security is an integral element of human security (Graegar, 1996). It is linked to botheconomic and social security and so may be conceptualised as a cornerstone of the tripartite system of globalsecurity (Figure 4). Reduction of environmental security reduces both economic and social security and,conversely, reduction in either social and economic security can result in reduction in environmental security. A decline in environmental security may initiate a downward spiral of poverty and environmentaldegradation. In extreme cases loss of environmental security, through environmental degradation or poorrespect for environmentally-attuned resource management, may result in, or at least exacerbate, social conflict(Homer-Dixon, 1994).
Social Securityarising fromPopulationLifestyleCultureOrganisation
EnvironmentalSecurityarising fromAtmosphereHydrosphereLithosphere
Biosphere
EconomicSecurityarising fromAgricultureHouseholdIndustryTransport
Services
Env
ironm
enta
l Ser
vice
sG
oods and Services
Natural Resources
Impacts
Impa
cts Labour and Institutions
Figure 4: Components of global security (adapted from Fig. 1 in Raskin et al., 1997).
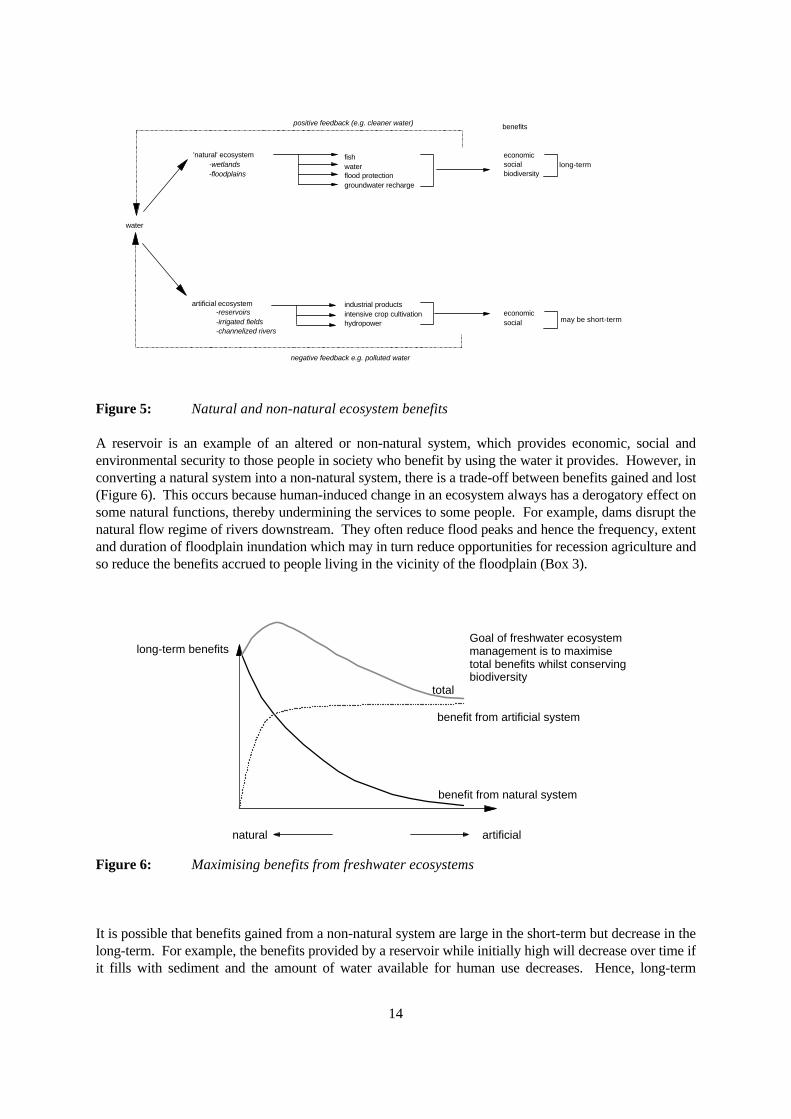
Different benefits accrue to people from natural and altered freshwater ecosystems (Figure 5). A wetland thatis only slightly disturbed by human activities is a near natural system that, as discussed above, may provideservices which contribute to the economic, social and environmental security of society. The benefits accruedto those people living close to the wetland maybe greater than those gained by people living further away.
14
'natural' ecosystem-wetlands-floodplains
fishwaterflood protectiongroundwater recharge
artificial ecosystem-reservoirs-irrigated fields-channelized rivers
industrial productsintensive crop cultivationhydropower
benefits
economicsocialbiodiversity
economic social
water
negative feedback e.g. polluted water
positive feedback (e.g. cleaner water)
long-term
may be short-term
Figure 5: Natural and non-natural ecosystem benefits
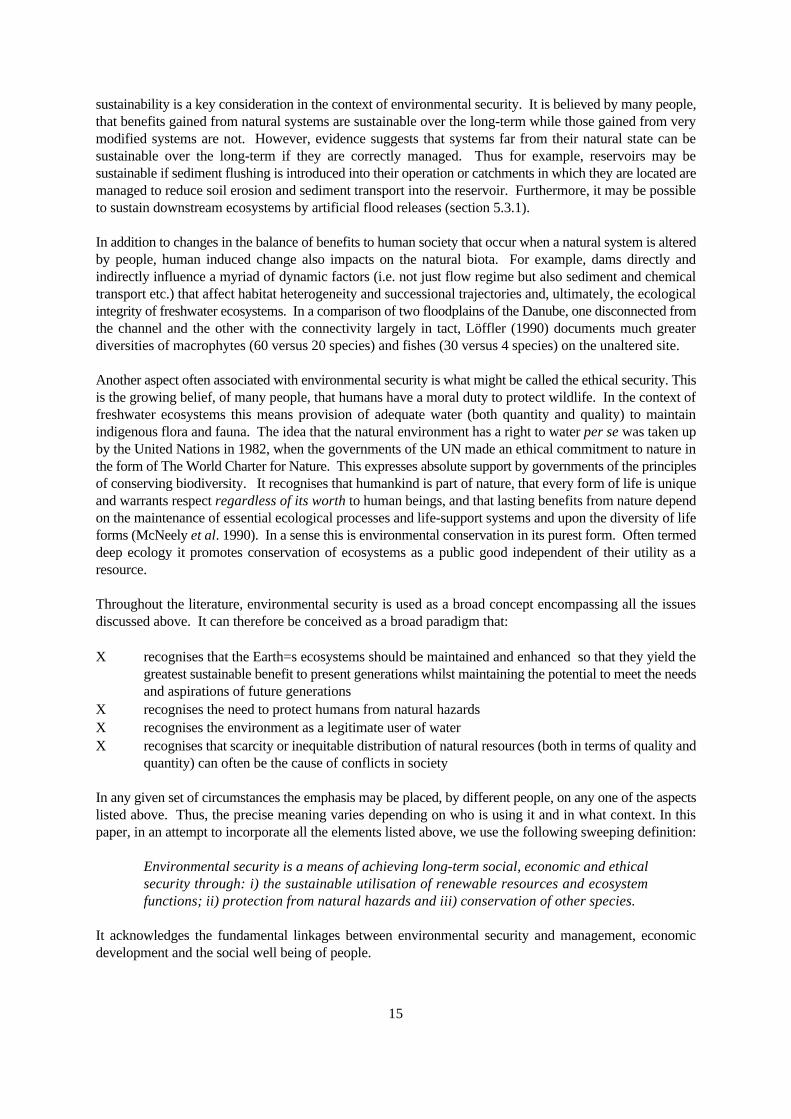
A reservoir is an example of an altered or non-natural system, which provides economic, social andenvironmental security to those people in society who benefit by using the water it provides. However, inconverting a natural system into a non-natural system, there is a trade-off between benefits gained and lost(Figure 6). This occurs because human-induced change in an ecosystem always has a derogatory effect onsome natural functions, thereby undermining the services to some people. For example, dams disrupt thenatural flow regime of rivers downstream. They often reduce flood peaks and hence the frequency, extentand duration of floodplain inundation which may in turn reduce opportunities for recession agriculture andso reduce the benefits accrued to people living in the vicinity of the floodplain (Box 3).
long-term benefits
benefit from artificial system
benefit from natural system
total
natural artificial
Goal of freshwater ecosystem management is to maximise total benefits whilst conserving biodiversity
Figure 6: Maximising benefits from freshwater ecosystems
It is possible that benefits gained from a non-natural system are large in the short-term but decrease in thelong-term. For example, the benefits provided by a reservoir while initially high will decrease over time ifit fills with sediment and the amount of water available for human use decreases. Hence, long-term
15
sustainability is a key consideration in the context of environmental security. It is believed by many people,that benefits gained from natural systems are sustainable over the long-term while those gained from verymodified systems are not. However, evidence suggests that systems far from their natural state can besustainable over the long-term if they are correctly managed. Thus for example, reservoirs may besustainable if sediment flushing is introduced into their operation or catchments in which they are located aremanaged to reduce soil erosion and sediment transport into the reservoir. Furthermore, it may be possibleto sustain downstream ecosystems by artificial flood releases (section 5.3.1).
In addition to changes in the balance of benefits to human society that occur when a natural system is alteredby people, human induced change also impacts on the natural biota. For example, dams directly andindirectly influence a myriad of dynamic factors (i.e. not just flow regime but also sediment and chemicaltransport etc.) that affect habitat heterogeneity and successional trajectories and, ultimately, the ecologicalintegrity of freshwater ecosystems. In a comparison of two floodplains of the Danube, one disconnected fromthe channel and the other with the connectivity largely in tact, Löffler (1990) documents much greaterdiversities of macrophytes (60 versus 20 species) and fishes (30 versus 4 species) on the unaltered site.
Another aspect often associated with environmental security is what might be called the ethical security. Thisis the growing belief, of many people, that humans have a moral duty to protect wildlife. In the context offreshwater ecosystems this means provision of adequate water (both quantity and quality) to maintainindigenous flora and fauna. The idea that the natural environment has a right to water per se was taken upby the United Nations in 1982, when the governments of the UN made an ethical commitment to nature inthe form of The World Charter for Nature. This expresses absolute support by governments of the principlesof conserving biodiversity. It recognises that humankind is part of nature, that every form of life is uniqueand warrants respect regardless of its worth to human beings, and that lasting benefits from nature dependon the maintenance of essential ecological processes and life-support systems and upon the diversity of lifeforms (McNeely et al. 1990). In a sense this is environmental conservation in its purest form. Often termeddeep ecology it promotes conservation of ecosystems as a public good independent of their utility as aresource.
Throughout the literature, environmental security is used as a broad concept encompassing all the issuesdiscussed above. It can therefore be conceived as a broad paradigm that:
Χ recognises that the Earth=s ecosystems should be maintained and enhanced so that they yield thegreatest sustainable benefit to present generations whilst maintaining the potential to meet the needsand aspirations of future generations
Χ recognises the need to protect humans from natural hazardsΧ recognises the environment as a legitimate user of waterΧ recognises that scarcity or inequitable distribution of natural resources (both in terms of quality and
quantity) can often be the cause of conflicts in society
In any given set of circumstances the emphasis may be placed, by different people, on any one of the aspectslisted above. Thus, the precise meaning varies depending on who is using it and in what context. In thispaper, in an attempt to incorporate all the elements listed above, we use the following sweeping definition:
Environmental security is a means of achieving long-term social, economic and ethicalsecurity through: i) the sustainable utilisation of renewable resources and ecosystemfunctions; ii) protection from natural hazards and iii) conservation of other species.
It acknowledges the fundamental linkages between environmental security and management, economicdevelopment and the social well being of people.

16
From the preceding discussion of environmental security, it is clear that there are complex inter-relationshipsbetween humans and the natural environment. Today, as discussed in section 3, various driving forces andhuman-induced pressures are increasing the competition for scarce water resources and causing a reductionin environmental security, across the entire spectrum of the term. Management is required to balance thedifferent and competing demands placed on freshwater ecosystems. The need to balance human requirementsfor freshwater and freshwater ecosystem services against ecosystem capabilities and constraints is made morecomplicated by the additional need to take into account societal preferences about the manner in whichecosystems are utilised. There is no baseline state against which to determine the condition of a naturalfreshwater ecosystem so desired states must be determined by society.
17
3. Problem identification and analysis
Our numbers are burdensome.....the world can hardly supply us from its naturalelements.....our wants grow more and more keen, our complaints more bitter, whilenature fails in affording us her sustenance (Tertullian, Rome, 160-230AD)
Human induced pressures are causing changes in the state of freshwater ecosystems and leading to localisedresource scarcity. However, the severity and consequences of these changes for humankind are still widelydebated. There are two extreme positions. First, there are those, often biologists or ecologists, who claimthat finite natural resources place strict limits on the growth of the human population and consumption; ifthese limits are exceeded, poverty, social breakdown and ecosystem degradation result. Second, there arethose, mainly neoclassical economists, who argue that there need be few, if any, strict limits to humanpopulation, consumption or prosperity, because human ingenuity is such that resource substitution, thedevelopment of new resources, technological innovation and improved management will enable humans tosurmount scarcity and improve their lot (Homer-Dixon, 1995).
A pre-requisite to resolving this debate is an understanding of the extent to which human interventions arealtering ecosystems and their functions and quantification of how this impacts on environmental security.Against this background this chapter aims to:
• Describe the problem of unsustainable utilisation of freshwater ecosystems.• Discuss the underlying causes of human degradation of these systems.• Identify the principal anthropogenic pressures exerted on freshwater ecosystems. • Review evidence of changes in the state of freshwater ecosystems and different aspects of environmental
security related to freshwater ecosystems.
The issues are discussed as a series of themes. The interaction of humans with the environment is complexand, wherever possible, indices are used to provide summary or surrogate information. There are problemswith all the indices used (as a consequence of data scarcity and/or definition of terminology), neverthelessthey assist in making the complex phenomena discussed more perceptible.
3.1 The Problem: unsustainable utilisation of freshwater and environmental change
All natural ecosystems experience change as a consequence of natural phenomena. However, today, humaninterventions are causing unprecedented rates of change and the planets natural resources are being exploitedin a manner that many argue is largely non-sustainable. Since the industrial revolution there has been adramatic increase in population and resource use. The consequences of human exploitation of theenvironment are observable throughout the world in the form of decline in the quantity and/or quality ofrenewable resources which is occurring faster than natural processes renew them. At present, water pollution,falling water tables, soil erosion, destruction of ecosystem functions and loss of wildlife habitat arewidespread. The direct threats to freshwater ecosystems result from physical, chemical or biological changesin the environment. Examples of physical changes include dam construction and changing the land-use withina catchment. Chemical changes include changing water salinity, increasing the organic loading, and/orincreasing nutrient content or levels of toxic material in the water. Biological changes include over-exploitation of fish, changes arising from grazing and introduction of exotic species (Box 4).
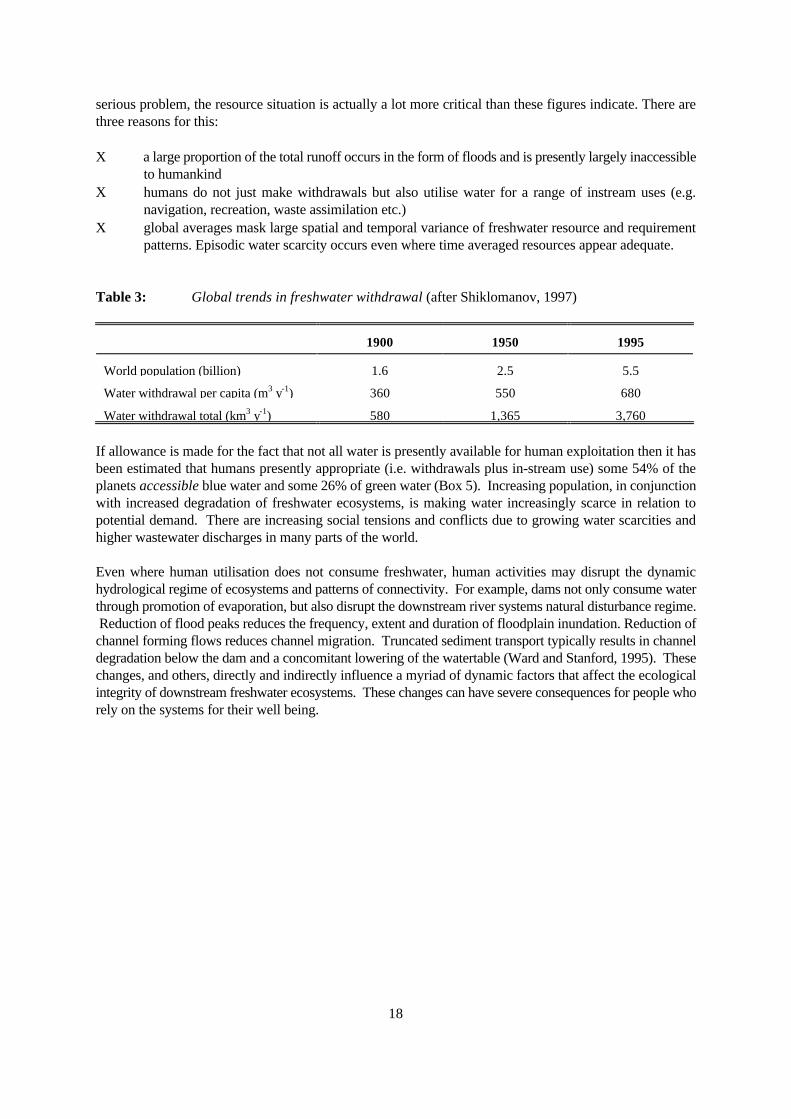
The spectacular increase in the scale of global water withdrawals is illustrated in Table 3. Since 1900, totalwater extraction has increased by a factor of 6.5 as a result of both population increase (a factor of 3.4) andwater use per capita (1.9). Although at first sight the estimated total freshwater withdrawal (i.e. 3, 760 km3)which accounts for only about 9% of the total average annual runoff (40, 000 km3), appears not to be a
18
serious problem, the resource situation is actually a lot more critical than these figures indicate. There arethree reasons for this:
Χ a large proportion of the total runoff occurs in the form of floods and is presently largely inaccessibleto humankind
Χ humans do not just make withdrawals but also utilise water for a range of instream uses (e.g.navigation, recreation, waste assimilation etc.)
Χ global averages mask large spatial and temporal variance of freshwater resource and requirementpatterns. Episodic water scarcity occurs even where time averaged resources appear adequate.
Table 3: Global trends in freshwater withdrawal (after Shiklomanov, 1997)
1900 1950 1995
World population (billion) 1.6 2.5 5.5
Water withdrawal per capita (m3 y-1) 360 550 680
Water withdrawal total (km3 y-1) 580 1,365 3,760
If allowance is made for the fact that not all water is presently available for human exploitation then it hasbeen estimated that humans presently appropriate (i.e. withdrawals plus in-stream use) some 54% of theplanets accessible blue water and some 26% of green water (Box 5). Increasing population, in conjunctionwith increased degradation of freshwater ecosystems, is making water increasingly scarce in relation topotential demand. There are increasing social tensions and conflicts due to growing water scarcities andhigher wastewater discharges in many parts of the world.
Even where human utilisation does not consume freshwater, human activities may disrupt the dynamichydrological regime of ecosystems and patterns of connectivity. For example, dams not only consume waterthrough promotion of evaporation, but also disrupt the downstream river systems natural disturbance regime. Reduction of flood peaks reduces the frequency, extent and duration of floodplain inundation. Reduction ofchannel forming flows reduces channel migration. Truncated sediment transport typically results in channeldegradation below the dam and a concomitant lowering of the watertable (Ward and Stanford, 1995). Thesechanges, and others, directly and indirectly influence a myriad of dynamic factors that affect the ecologicalintegrity of downstream freshwater ecosystems. These changes can have severe consequences for people whorely on the systems for their well being.
19
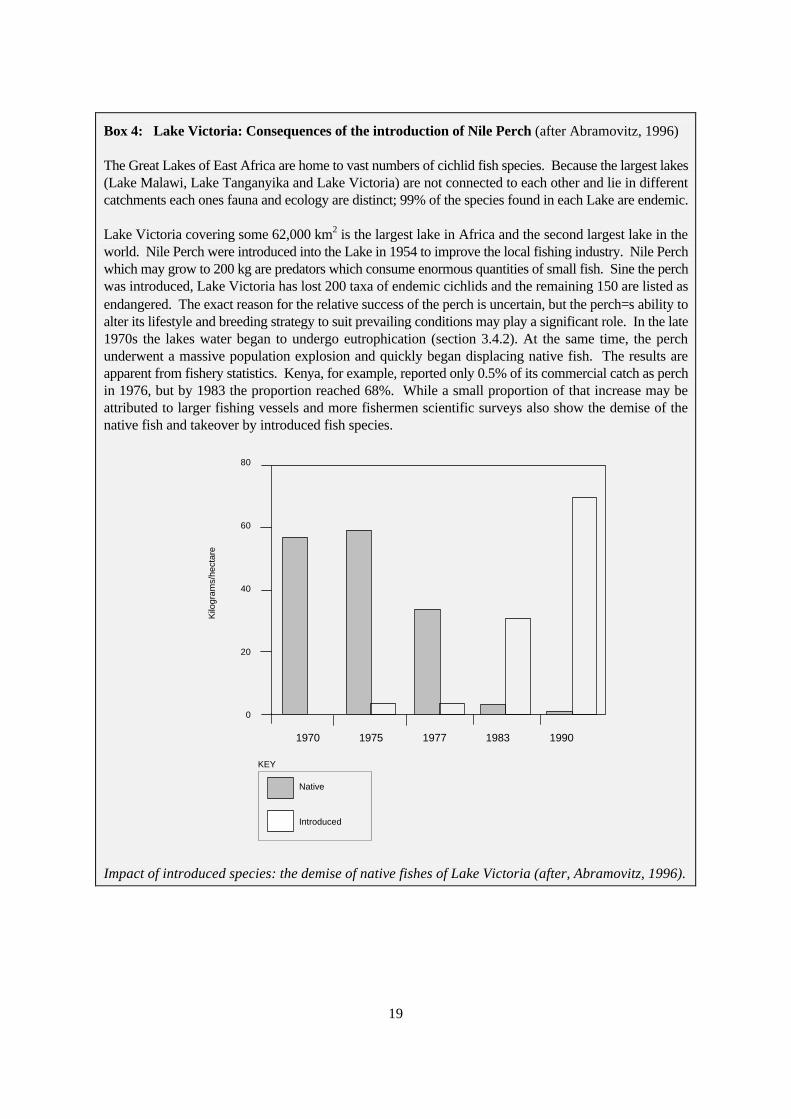
Box 4: Lake Victoria: Consequences of the introduction of Nile Perch (after Abramovitz, 1996)
The Great Lakes of East Africa are home to vast numbers of cichlid fish species. Because the largest lakes(Lake Malawi, Lake Tanganyika and Lake Victoria) are not connected to each other and lie in differentcatchments each ones fauna and ecology are distinct; 99% of the species found in each Lake are endemic.
Lake Victoria covering some 62,000 km2 is the largest lake in Africa and the second largest lake in theworld. Nile Perch were introduced into the Lake in 1954 to improve the local fishing industry. Nile Perchwhich may grow to 200 kg are predators which consume enormous quantities of small fish. Sine the perchwas introduced, Lake Victoria has lost 200 taxa of endemic cichlids and the remaining 150 are listed asendangered. The exact reason for the relative success of the perch is uncertain, but the perch=s ability toalter its lifestyle and breeding strategy to suit prevailing conditions may play a significant role. In the late1970s the lakes water began to undergo eutrophication (section 3.4.2). At the same time, the perchunderwent a massive population explosion and quickly began displacing native fish. The results areapparent from fishery statistics. Kenya, for example, reported only 0.5% of its commercial catch as perchin 1976, but by 1983 the proportion reached 68%. While a small proportion of that increase may beattributed to larger fishing vessels and more fishermen scientific surveys also show the demise of thenative fish and takeover by introduced fish species.
80
60
40
20
0
1970 1975 1977 1983 1990
Kilo
gram
s/he
ctar
e
Native
Introduced
KEY
Impact of introduced species: the demise of native fishes of Lake Victoria (after, Abramovitz, 1996).
20
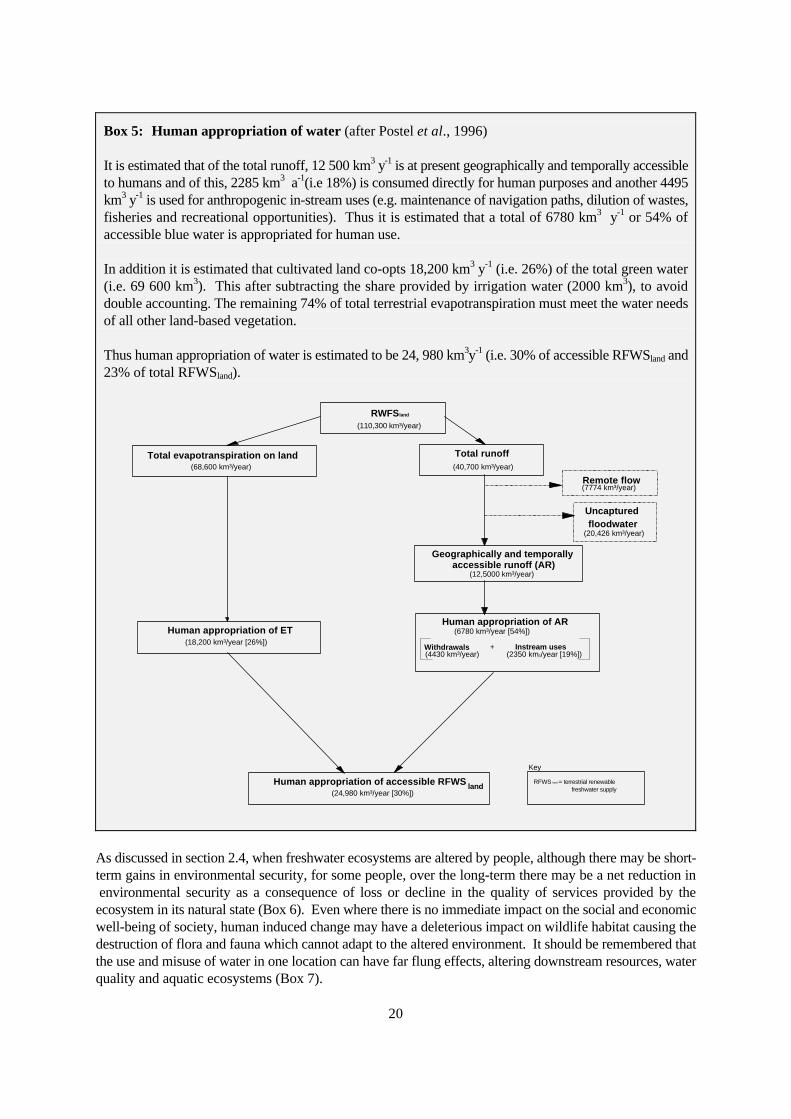
Box 5: Human appropriation of water (after Postel et al., 1996)
It is estimated that of the total runoff, 12 500 km3 y-1 is at present geographically and temporally accessibleto humans and of this, 2285 km3 a-1(i.e 18%) is consumed directly for human purposes and another 4495km3 y-1 is used for anthropogenic in-stream uses (e.g. maintenance of navigation paths, dilution of wastes,fisheries and recreational opportunities). Thus it is estimated that a total of 6780 km3 y-1 or 54% ofaccessible blue water is appropriated for human use.
In addition it is estimated that cultivated land co-opts 18,200 km3 y-1 (i.e. 26%) of the total green water(i.e. 69 600 km3). This after subtracting the share provided by irrigation water (2000 km3), to avoiddouble accounting. The remaining 74% of total terrestrial evapotranspiration must meet the water needsof all other land-based vegetation.
Thus human appropriation of water is estimated to be 24, 980 km3y-1 (i.e. 30% of accessible RFWSland and23% of total RFWSland).
RWFSland
(110,300 km³/year)
Total runoff(40,700 km³/year)
Remote flow(7774 km³/year)
Uncaptured floodwater
(20,426 km³/year)
Geographically and temporally accessible runoff (AR)
(12,5000 km³/year)
Human appropriation of AR(6780 km³/year [54%])
Total evapotranspiration on land (68,600 km³/year)
Human appropriation of ET
(18,200 km³/year [26%])
Human appropriation of accessible RFWS land(24,980 km³/year [30%])
Withdrawals (4430 km³/year)
Instream uses(2350 km3/year [19%])
+
RFWS land = terrestrial renewable freshwater supply
Key
As discussed in section 2.4, when freshwater ecosystems are altered by people, although there may be short-term gains in environmental security, for some people, over the long-term there may be a net reduction in environmental security as a consequence of loss or decline in the quality of services provided by theecosystem in its natural state (Box 6). Even where there is no immediate impact on the social and economicwell-being of society, human induced change may have a deleterious impact on wildlife habitat causing thedestruction of flora and fauna which cannot adapt to the altered environment. It should be remembered thatthe use and misuse of water in one location can have far flung effects, altering downstream resources, waterquality and aquatic ecosystems (Box 7).
21
Box 6: Senegal River: an example of reduction in environmental security resulting from mis-management of water resources (after Homer-Dixon, 1994).
In the Senegal River Basin, past floodplain farming, herding and fishing was dependent on the river=sannual floods. However, in the 1970s concern about food shortages and drought led the governments ofthe region to seek financing for the Manantali Dam on a tributary, and the Diama barrage near the mouthof the river. These dams were designed to regulate the river=s flow with the multiple aims of producinghydropower, expanding agriculture and increasing river transport. However, the plan had unforeseenconsequences. In anticipation of increased land values along the river, the Mauritanian elite, comprisingmainly white moors, rewrote legislation governing land ownership; effectively preventing black Africanscontinuing traditional flood-based activities along the river. This resulted in ethnic violence in both Senegaland Mauritania. In Senegal, almost all the 17,000 shops owned by Moors were destroyed, and theirowners were deported to Mauritania. In Mauritania some 70,000 black Mauritanians had propertyconfiscated and were forcibly expelled to Senegal. Several hundred people were killed and the twocountries almost went to war. Although diplomatic relations have now been restored, neither country hasagreed to allow the expelled population to return or to compensate them for their losses.
Box 7: Aral Sea: an example of reduction in environmental security resulting from mis-management of water resources (after Zaletaev, 1995; Postel, 1996)
The Aral Sea is one of the planets greatest environmental disasters. Prior to 1960 an average of 55 billioncubic metres of water flowed into the Aral Sea, then the planets fourth largest lake, from the Amu Dar=yaand Syr Dar=ya. However, abstraction for cotton irrigation and the construction of flood storage reservoirsresulted in a decline in average annual inflow to 7 billion cubic metres between 1981 and 1990. This hasresulted in a catastrophic regression in sea levels (16 m between 1962 and 1994) and a total decline involume of three-quarters. Twenty of the 24 species of fish that used to be present in the sea havedisappeared, and the fish catch that totalled 44,000 tons a year in the 1950s and supported 60,000 jobshas dropped to zero. There has been a drastic reduction in terrestrial biotic diversity on the floodplainsof the Amu Dar=ya and Syr Dar=ya. Toxic dust-salt mixtures picked up from the dry seabed and depositedon surrounding farmland are harming and killing crops. The low river flows have concentrated salts andtoxic chemicals making water supplies hazardous to drink and contributing to the high rate of manydiseases in the area. The population of Munyak, a former fishing town, has dropped from 40,000 severaldecades ago to just 12,000 today. The 12 000 people who have left are ecological refugees; theirenvironmental security has been eroded to such an extent that they have moved.
3.2 Underlying causes of decreases in environmental security (a conceptual model)
Given that the benefits that people accrue from freshwater ecosystems are now broadly understood, thequestion arises: why is it that management policies which result in a net decrease in environmental securitycontinue to occur ? The reasons are complex and result from the interaction of environmental, social andeconomic issues. A detailed analysis is beyond the scope of this paper, but in summary, it arises mainly forthree reasons:
Χ Insecurity in the socio-economic corners of the human security system outweigh the need to maintainenvironmental security. Long-term environmental security is sacrificed because of the need tomaintain or re-establish security in the other corners of the tripartite system. Desperate people willoften focus on immediate survival strategies and neglect the long-range value of ecological
22
preservation. To care about the environment requires at least one square meal a day (R.Leakey, ex-Director of the Kenya Widlife Service - cited in Simonovic, 1996)).
Χ As a result of inappropriate and ill-informed decision-making. There is a tendency to focus on thebenefits that alteration of ecosystems bring to certain people in society and not others. For example,catchments are often managed to maximise the benefits to be gained by the urban population whileneglecting the rural populations. Furthermore, the focus is very often on short-term gain rather thanlong-term benefits.
Χ When environmental problems occur, existing management strategies are often focused on technicalsolutions that consider only certain parts of the total system. Such engineering solutions areimplemented mostly as end-of-pipe measures (e.g. emission restrictions for the discharge ofpollutants to receiving waters) to meet directly the experienced environmental problem (concerningwater quantity or quality). Dynamics and interactions are investigated only in the small local systemunder consideration.
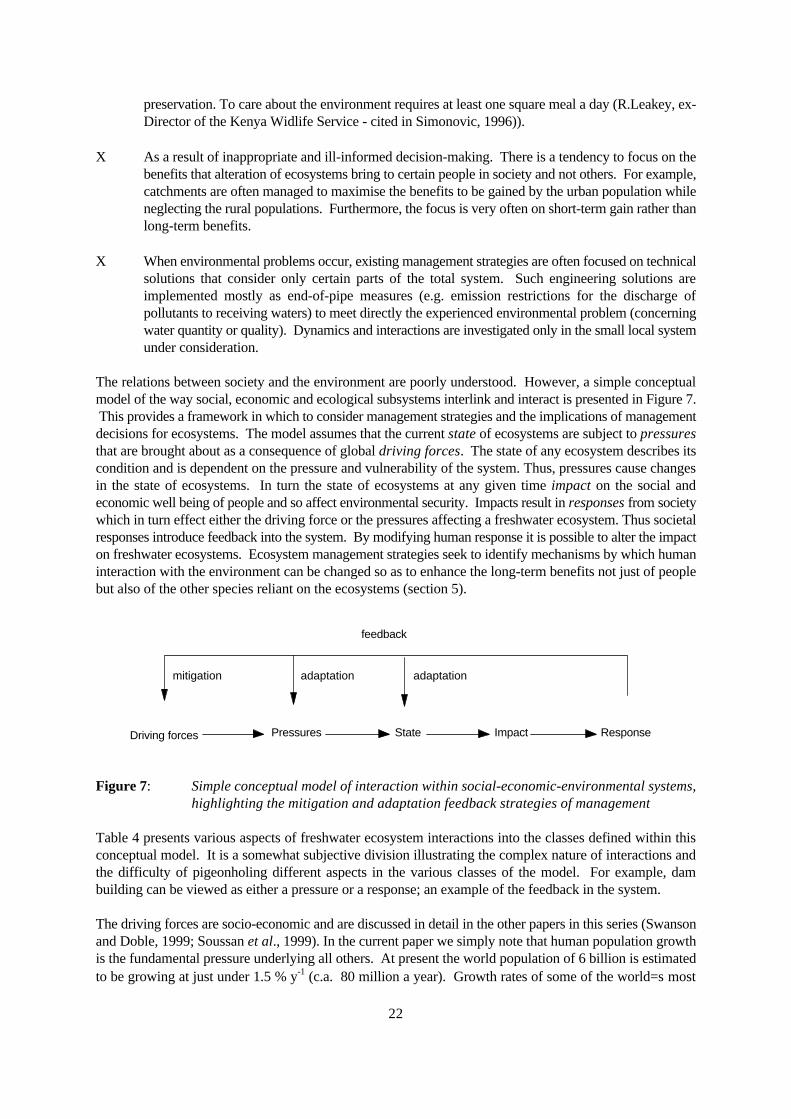
The relations between society and the environment are poorly understood. However, a simple conceptualmodel of the way social, economic and ecological subsystems interlink and interact is presented in Figure 7. This provides a framework in which to consider management strategies and the implications of managementdecisions for ecosystems. The model assumes that the current state of ecosystems are subject to pressuresthat are brought about as a consequence of global driving forces. The state of any ecosystem describes itscondition and is dependent on the pressure and vulnerability of the system. Thus, pressures cause changesin the state of ecosystems. In turn the state of ecosystems at any given time impact on the social andeconomic well being of people and so affect environmental security. Impacts result in responses from societywhich in turn effect either the driving force or the pressures affecting a freshwater ecosystem. Thus societalresponses introduce feedback into the system. By modifying human response it is possible to alter the impacton freshwater ecosystems. Ecosystem management strategies seek to identify mechanisms by which humaninteraction with the environment can be changed so as to enhance the long-term benefits not just of peoplebut also of the other species reliant on the ecosystems (section 5).
Driving forces Pressures State Impact Response
feedback
mitigation adaptation adaptation
Figure 7: Simple conceptual model of interaction within social-economic-environmental systems,highlighting the mitigation and adaptation feedback strategies of management
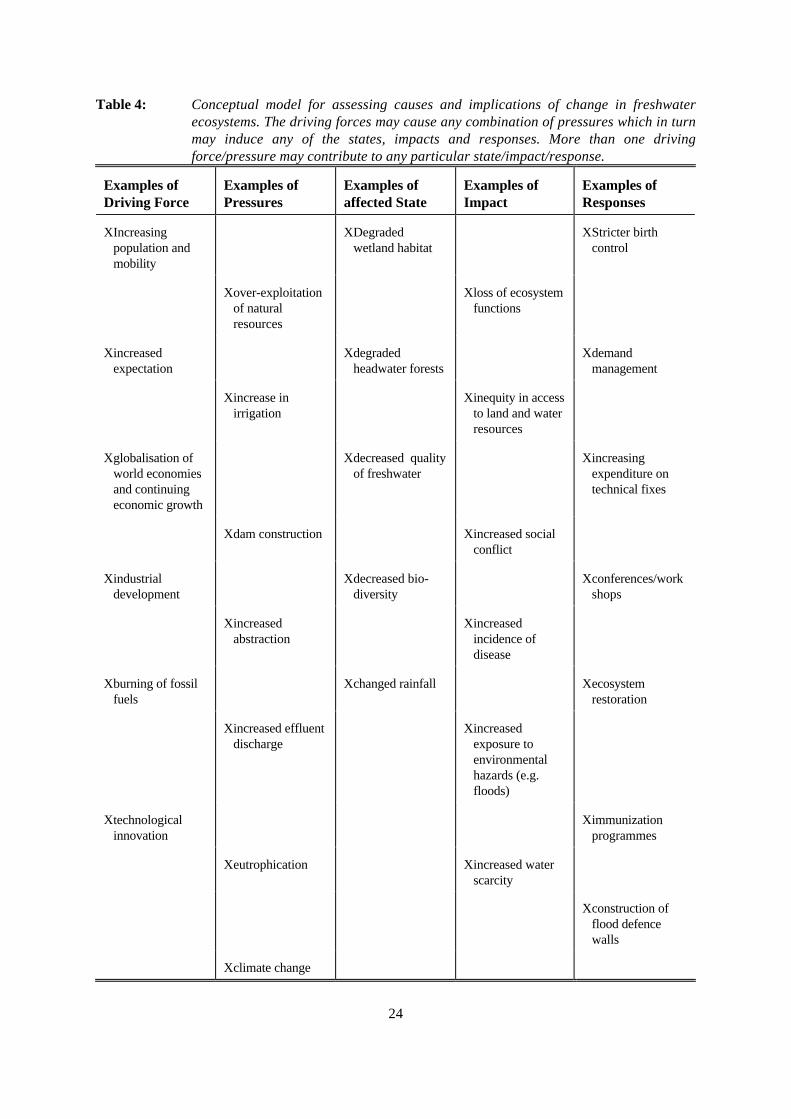
Table 4 presents various aspects of freshwater ecosystem interactions into the classes defined within thisconceptual model. It is a somewhat subjective division illustrating the complex nature of interactions andthe difficulty of pigeonholing different aspects in the various classes of the model. For example, dambuilding can be viewed as either a pressure or a response; an example of the feedback in the system.
The driving forces are socio-economic and are discussed in detail in the other papers in this series (Swansonand Doble, 1999; Soussan et al., 1999). In the current paper we simply note that human population growthis the fundamental pressure underlying all others. At present the world population of 6 billion is estimatedto be growing at just under 1.5 % y-1 (c.a. 80 million a year). Growth rates of some of the world=s most

23
populous countries are hardly declining at all. India=s rate has levelled off at around 2.1% (17.9 millionpeople), China=s at around 1.3% (14.8 million people) per year. The mid-range projection from the UnitedNations is that world population will grow to about 8.3 billion in 2025, 9.4 billion by 2050 and will probablystabilise towards the end of the 21st century at about 11 billion (Engleman and LeRoy, 1993).
24
Table 4: Conceptual model for assessing causes and implications of change in freshwaterecosystems. The driving forces may cause any combination of pressures which in turnmay induce any of the states, impacts and responses. More than one drivingforce/pressure may contribute to any particular state/impact/response.
Examples ofDriving Force
Examples ofPressures
Examples ofaffected State
Examples ofImpact
Examples of Responses
Χ Increasingpopulation andmobility
Χ Degraded wetland habitat
Χ Stricter birthcontrol
Χ over-exploitationof naturalresources
Χ loss of ecosystemfunctions
Χ increasedexpectation
Χ degraded headwater forests
Χ demandmanagement
Χ increase inirrigation
Χ inequity in accessto land and waterresources
Χ globalisation ofworld economiesand continuingeconomic growth
Χ decreased qualityof freshwater
Χ increasingexpenditure ontechnical fixes
Χ dam construction Χ increased socialconflict
Χ industrialdevelopment
Χ decreased bio-diversity
Χ conferences/workshops
Χ increasedabstraction
Χ increasedincidence ofdisease
Χ burning of fossilfuels
Χ changed rainfall Χ ecosystemrestoration
Χ increased effluentdischarge
Χ increasedexposure toenvironmentalhazards (e.g.floods)
Χ technologicalinnovation
Χ immunizationprogrammes
Χ eutrophication Χ increased waterscarcity
Χ construction offlood defencewalls
Χ climate change
25
3.3 Indicators of human-induced pressures on freshwater ecosystems
In this section the human-induced pressures placed on freshwater ecosystems are investigated. In many casesthe pressures on freshwater ecosystems can only be ascertained indirectly. Data are sparse and problematicbecause descriptions and data collected vary from country to country. Hence, the themes and indicespresented in this section are an illustrative rather than a definitive compilation.
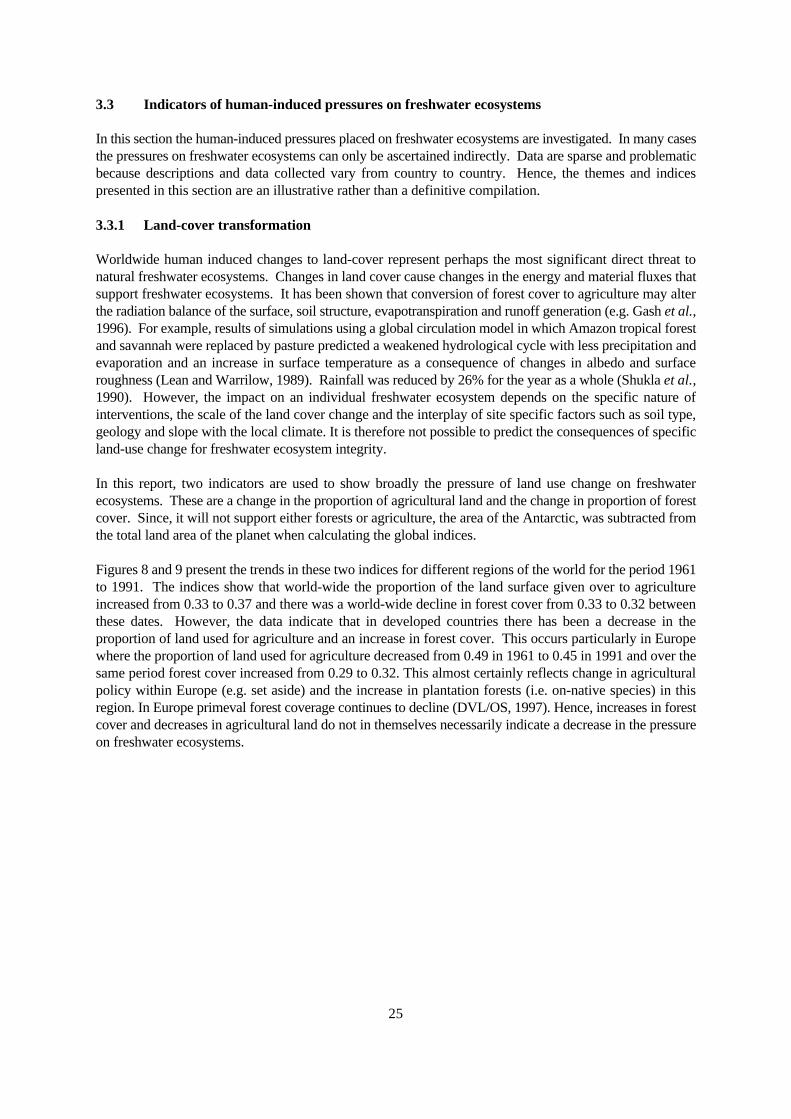
3.3.1 Land-cover transformation
Worldwide human induced changes to land-cover represent perhaps the most significant direct threat tonatural freshwater ecosystems. Changes in land cover cause changes in the energy and material fluxes thatsupport freshwater ecosystems. It has been shown that conversion of forest cover to agriculture may alterthe radiation balance of the surface, soil structure, evapotranspiration and runoff generation (e.g. Gash et al.,1996). For example, results of simulations using a global circulation model in which Amazon tropical forestand savannah were replaced by pasture predicted a weakened hydrological cycle with less precipitation andevaporation and an increase in surface temperature as a consequence of changes in albedo and surfaceroughness (Lean and Warrilow, 1989). Rainfall was reduced by 26% for the year as a whole (Shukla et al.,1990). However, the impact on an individual freshwater ecosystem depends on the specific nature ofinterventions, the scale of the land cover change and the interplay of site specific factors such as soil type,geology and slope with the local climate. It is therefore not possible to predict the consequences of specificland-use change for freshwater ecosystem integrity.
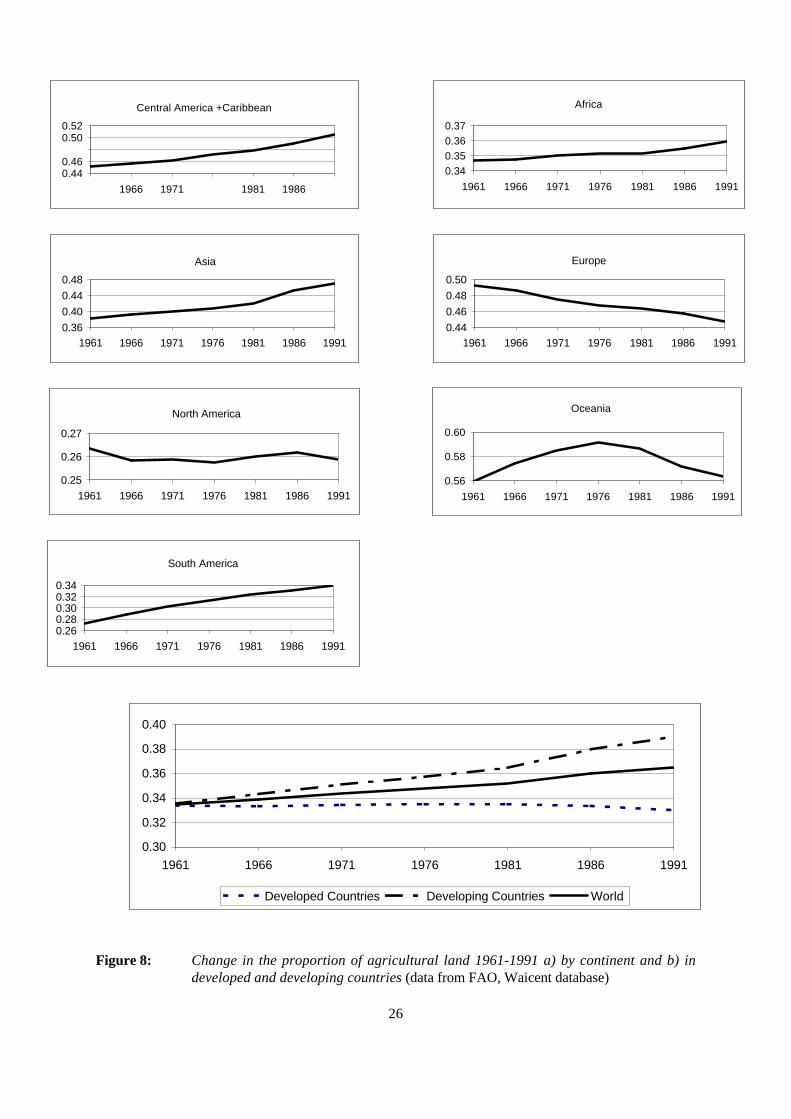
In this report, two indicators are used to show broadly the pressure of land use change on freshwaterecosystems. These are a change in the proportion of agricultural land and the change in proportion of forestcover. Since, it will not support either forests or agriculture, the area of the Antarctic, was subtracted fromthe total land area of the planet when calculating the global indices.
Figures 8 and 9 present the trends in these two indices for different regions of the world for the period 1961to 1991. The indices show that world-wide the proportion of the land surface given over to agricultureincreased from 0.33 to 0.37 and there was a world-wide decline in forest cover from 0.33 to 0.32 betweenthese dates. However, the data indicate that in developed countries there has been a decrease in theproportion of land used for agriculture and an increase in forest cover. This occurs particularly in Europewhere the proportion of land used for agriculture decreased from 0.49 in 1961 to 0.45 in 1991 and over thesame period forest cover increased from 0.29 to 0.32. This almost certainly reflects change in agriculturalpolicy within Europe (e.g. set aside) and the increase in plantation forests (i.e. on-native species) in thisregion. In Europe primeval forest coverage continues to decline (DVL/OS, 1997). Hence, increases in forestcover and decreases in agricultural land do not in themselves necessarily indicate a decrease in the pressureon freshwater ecosystems.
26
Figure 8: Change in the proportion of agricultural land 1961-1991 a) by continent and b) indeveloped and developing countries (data from FAO, Waicent database)
Central America +Caribbean
0.440.46
0.500.52
1966 1971 1981 1986
Africa
0.340.350.360.37
1961 1966 1971 1976 1981 1986 1991
Asia
0.36
0.40
0.44
0.48
1961 1966 1971 1976 1981 1986 1991
Europe
0.44
0.46
0.48
0.50
1961 1966 1971 1976 1981 1986 1991
North America
0.25
0.26
0.27
1961 1966 1971 1976 1981 1986 1991
Oceania
0.56
0.58
0.60
1961 1966 1971 1976 1981 1986 1991
South America
0.260.280.300.320.34
1961 1966 1971 1976 1981 1986 1991
0.30
0.32
0.34
0.36
0.38
0.40
1961 1966 1971 1976 1981 1986 1991
Developed Countries Developing Countries World
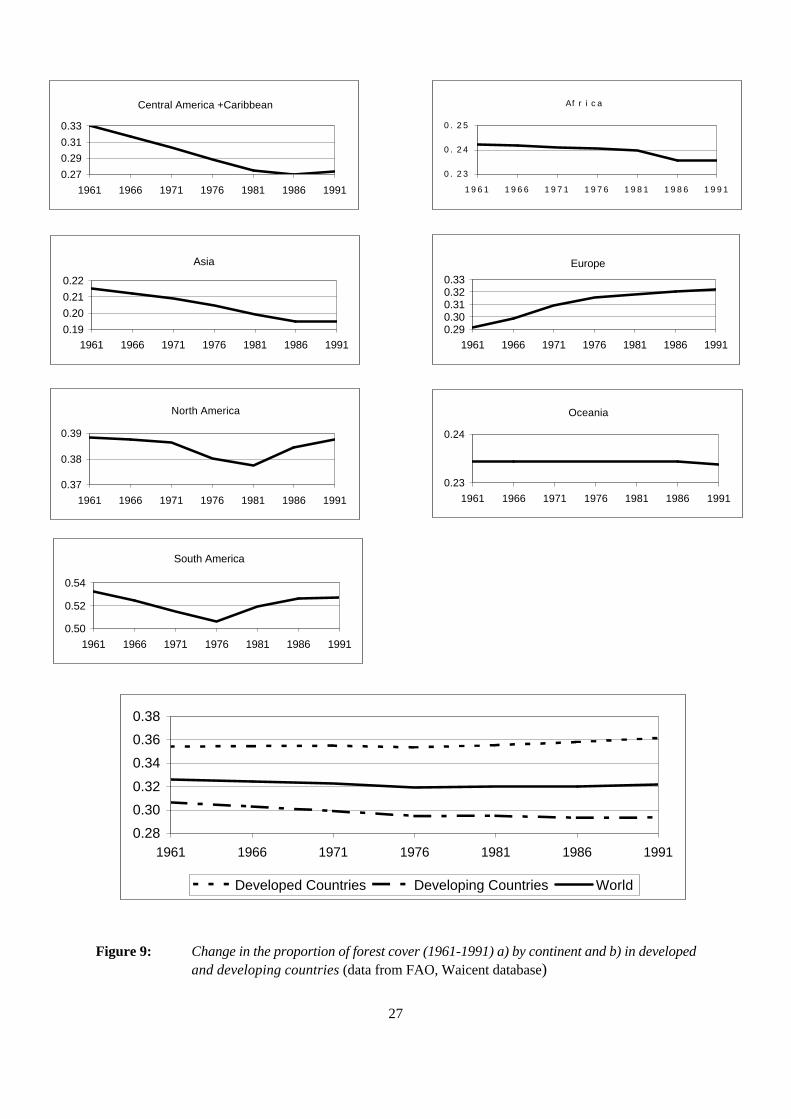
27
Figure 9: Change in the proportion of forest cover (1961-1991) a) by continent and b) in developedand developing countries (data from FAO, Waicent database)
Central America +Caribbean
0.27
0.29
0.31
0.33
1961 1966 1971 1976 1981 1986 1991
A f r i c a
0 . 2 3
0 . 2 4
0 . 2 5
1 9 6 1 1 9 6 6 1 9 7 1 1 9 7 6 1 9 8 1 1 9 8 6 1 9 9 1
Asia
0.19
0.20
0.21
0.22
1961 1966 1971 1976 1981 1986 1991
Europe
0.290.300.310.320.33
1961 1966 1971 1976 1981 1986 1991
North America
0.37
0.38
0.39
1961 1966 1971 1976 1981 1986 1991
Oceania
0.23
0.24
1961 1966 1971 1976 1981 1986 1991
South America
0.50
0.52
0.54
1961 1966 1971 1976 1981 1986 1991
0.28
0.30
0.32
0.34
0.36
0.38
1961 1966 1971 1976 1981 1986 1991
Developed Countries Developing Countries World
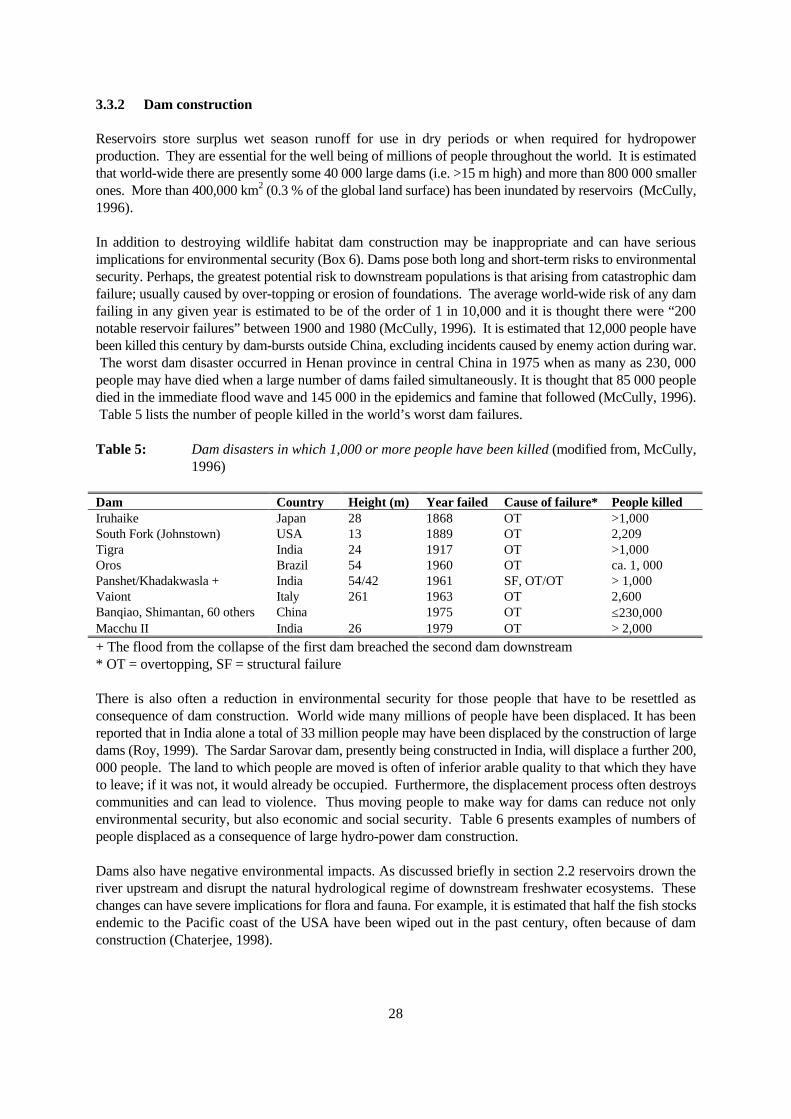
28
3.3.2 Dam construction
Reservoirs store surplus wet season runoff for use in dry periods or when required for hydropowerproduction. They are essential for the well being of millions of people throughout the world. It is estimatedthat world-wide there are presently some 40 000 large dams (i.e. >15 m high) and more than 800 000 smallerones. More than 400,000 km2 (0.3 % of the global land surface) has been inundated by reservoirs (McCully,1996).
In addition to destroying wildlife habitat dam construction may be inappropriate and can have seriousimplications for environmental security (Box 6). Dams pose both long and short-term risks to environmentalsecurity. Perhaps, the greatest potential risk to downstream populations is that arising from catastrophic damfailure; usually caused by over-topping or erosion of foundations. The average world-wide risk of any damfailing in any given year is estimated to be of the order of 1 in 10,000 and it is thought there were “200notable reservoir failures” between 1900 and 1980 (McCully, 1996). It is estimated that 12,000 people havebeen killed this century by dam-bursts outside China, excluding incidents caused by enemy action during war. The worst dam disaster occurred in Henan province in central China in 1975 when as many as 230, 000people may have died when a large number of dams failed simultaneously. It is thought that 85 000 peopledied in the immediate flood wave and 145 000 in the epidemics and famine that followed (McCully, 1996). Table 5 lists the number of people killed in the world’s worst dam failures.
Table 5: Dam disasters in which 1,000 or more people have been killed (modified from, McCully,1996)
Dam Country Height (m) Year failed Cause of failure* People killedIruhaike Japan 28 1868 OT >1,000South Fork (Johnstown) USA 13 1889 OT 2,209Tigra India 24 1917 OT >1,000Oros Brazil 54 1960 OT ca. 1, 000Panshet/Khadakwasla + India 54/42 1961 SF, OT/OT > 1,000Vaiont Italy 261 1963 OT 2,600Banqiao, Shimantan, 60 others China 1975 OT ≤230,000Macchu II India 26 1979 OT > 2,000
+ The flood from the collapse of the first dam breached the second dam downstream* OT = overtopping, SF = structural failure
There is also often a reduction in environmental security for those people that have to be resettled asconsequence of dam construction. World wide many millions of people have been displaced. It has beenreported that in India alone a total of 33 million people may have been displaced by the construction of largedams (Roy, 1999). The Sardar Sarovar dam, presently being constructed in India, will displace a further 200,000 people. The land to which people are moved is often of inferior arable quality to that which they haveto leave; if it was not, it would already be occupied. Furthermore, the displacement process often destroyscommunities and can lead to violence. Thus moving people to make way for dams can reduce not onlyenvironmental security, but also economic and social security. Table 6 presents examples of numbers ofpeople displaced as a consequence of large hydro-power dam construction.
Dams also have negative environmental impacts. As discussed briefly in section 2.2 reservoirs drown theriver upstream and disrupt the natural hydrological regime of downstream freshwater ecosystems. Thesechanges can have severe implications for flora and fauna. For example, it is estimated that half the fish stocksendemic to the Pacific coast of the USA have been wiped out in the past century, often because of damconstruction (Chaterjee, 1998).
29
Table 6: Examples of numbers of people displaced as a consequence of the construction of largedams (after, IUCN, 1997)
Project Name Country Megawatts Area flooded(ha)
No. of people displaced
No.displaced/MW
Three Gorges China 18, 200 110, 000 1, 300, 000 71Itaipu Brazil/Paraguay 12, 600 135, 000 59, 000 5Guri Complex Venezuela 10, 300 426, 000 1, 500 0Tucurui Brazil 7, 600 243, 000 30, 000 4Grand Coulee USA 6, 494 33, 306 10, 000 2Churchill Falls Canada 5, 225 665, 000 0 0Tarbela Pakistan 3, 478 24, 280 96, 000 28Ertan China 3, 300 10, 100 30, 000 9Ilha Solteira Brazil 3, 200 125, 700 6, 150 2Yacyreta Argentina/Paraguay 2, 700 172, 000 50, 000 19Ataturk Turkey 2, 400 81, 700 55, 000 23Bakun Malaysia 2, 400 70, 000 9, 000 4Tehri India 2, 400 4, 200 100, 000 42Aswan High Eygpt 2, 100 400, 000 100, 000 48Cabora Bassa Mozambique 2, 075 380, 000 250, 000 120Ghazi Barotha Pakistan 1, 450 2, 640 899 1Sobradinho Brazil 1, 050 415, 000 65, 000 62Narmada Sagar India 1, 000 90, 820 80, 500 81Mangla Pakistan 1, 000 25, 300 90, 000 90Akosombo/Volta Ghana 833 848, 200 80, 000 96Kainji Nigeria 760 126, 000 50, 000 66Nam Theun 2 Laos 600 34, 000 4, 500 8Pehuenche Chile 500 400 10 0Arun III Nepal 402 43 775 2Khao Laem Thailand 300 38, 800 10, 800 36Balbina Brazil 250 236, 000 1, 000 4Victoria Sri Lanka 210 2, 270 45, 000 214Nam Thuen-Hinboun Laos 210 630 0 0Nam Ngum Laos 150 37, 000 3, 000 20Pak Mun Thailand 34 6, 000 4, 945 145Kedung Ombo Indonesia 29 4, 600 29, 000 1, 000Kompiennnga Burkina Faso 14 20, 000 1, 842 132
An indicator of the pressure of dams on freshwater ecosystem integrity, is the number of large dams per km2
of land (Figure 10). Ideally the number per kilometre of river network would be used but data on the lengthof river networks is not available. Only large dams are considered because it is difficult to obtain thenumbers of small dams in any particular region. The indicator is crude since, the overall effect of a dam onthe integrity of an ecosystem is a function of not only its size relative to the flow of water in the river, but alsothe way in which it is operated and the specific conditions pertaining to the catchment in which it is built.
30
Figure 10: Dam index (nos. of large dams/km2) as an indicator of pressure on freshwater ecosystems
Today, construction of large dams continues. Both China and India are pursuing ambitious hydropowerdevelopment and projects are underway in Europe and South and North America. However, there is growingpublic opposition to large dams, primarily as a consequence of the negative environmental and social impacts. The rate of large dam building is slowing and in 1997 the US Government for the first time refused torelicense a hydroelectric dam (section 5.3.1). Many people predict the end of the large dam era in the nearfuture (e.g. Lanz, 1995).
The World Commission on Dams is currently conducting an objective review of the overall costs and benefitsof large dam projects. It has a mandate to assess the experience of existing, new and proposed large damprojects so as to improve (existing) practises, social and environmental conditions and to develop decision-making criteria, policy and regulatory frameworks for assessing alternatives for energy and water resourcesdevelopment. It also aims to develop and promote internationally acceptable standards for the planning,assessment, design, construction, operation and monitoring of large dam projects and, if the dams are built,to ensure that affected peoples are better off.
3.3.3 Urbanisation
Cities place pressure on freshwater ecosystems because the sustenance of the high concentration of peoplein one place requires large inputs of natural resources and tends to overload the sink capacity (e.g. forpollutants) of natural systems in the vicinity of a city. For example, Mexico City (population over 10 million)consumes 1 km3 y-1 more water than can be provided by renewable sources in its abstraction area (DVL/OS,1997) and Sana=a, Yemen (population over 1 million) is mining fossil aquifers to provided water for itspopulation. In Zimbabwe, failure to properly treat the wastewater generated by the people and industry ofHarare is placing the water quality of reservoirs and rivers in the vicinity of the city at risk. It is estimated thatat least 600 million urban dwellers in Africa, Asia and Latin America live in housing that is so overcrowdedand of such poor quality with such inadequate provision of for water, sanitation and drainage that their livesand health are continually at risk (United Nations Centre for Human Settlements, 1996).
The index used to illustrate the changing pressure of urbanisation on ecosystems is simply the proportion of
00.0010.0020.0030.004
0.0050.0060.0070.008
Australia
Brazil
Canada
Czechoslovakia
CIS
Mexico
Sw
eden
India
South A
frica
Germ
any
US
A
Norw
ay
France
Spain
Italy
China
Great B
ritain
Sw
itzerland
Japan
South K
orea
31
population living in cities (Figure 11). Once again it is only a relatively crude indicator since it does notindicate the extent of investment in infrastructure (e.g. wastewater treatment plants) to protect theenvironment from the impact of higher urban population. Over the 35 years from 1961 to 1996 the world-wide proportion of the population living in the urban environment increased from 0.34 to 0.46. In 1995 321cities had population in excess of 1 million and there were 15 mega-cities with population 10-20 million. Theproportion of the population in cities is 0.73 and 0.38 in developed and developing countries respectively. However, the highest rates of urban growth are in developing countries (i.e. in Africa, South America andAsia) which are those least able, through lack of resources, to ameliorate the impact on the environment ofgreater urbanisation. It is estimated that by 2025, 56% of population will be urban and there will be morethan 30 mega-cities (WMO, 1997). The increase in the world=s urban population has consequences for waterplanning and management around the globe.
3.3.4 Freshwater fisheries
The size of the annual freshwater fish catch provides a crude indicator of human exploitation of the naturalresource function provided by freshwater ecosystems. Fish constitute a major source of animal proteinthroughout the world, especially in many tropical and subtropical countries. The change in freshwater fishcatch between 1961 and 1996 is presented in Figure 12. This has been calculated from FAO statistics andis simply the total fish catch minus the marine fish catch.
The data show that between 1961 and 1996 there was a five-fold increase (from 8.7 x10⁶ to 45.6 x10⁶ metrictons) in the world-wide freshwater fish catch. The greatest growth has been in developing countries,particularly those in Asia, where over the same period there was nearly an 8-fold increase. Even allowing forthe increase in farmed fish (estimated to have averaged 11.2 x 10⁶ tons per annum between 1993 and 1995(WRI et al., 1998)) this still represents a very significant increase in the human exploitation of the naturalfish resource. Although, the case for over-exploitation of the fish-stock is not as clear as for marine fishnevertheless it is considered that most freshwater fishes are being exploited at, or above, sustainable levels(Abramovitz, 1996).
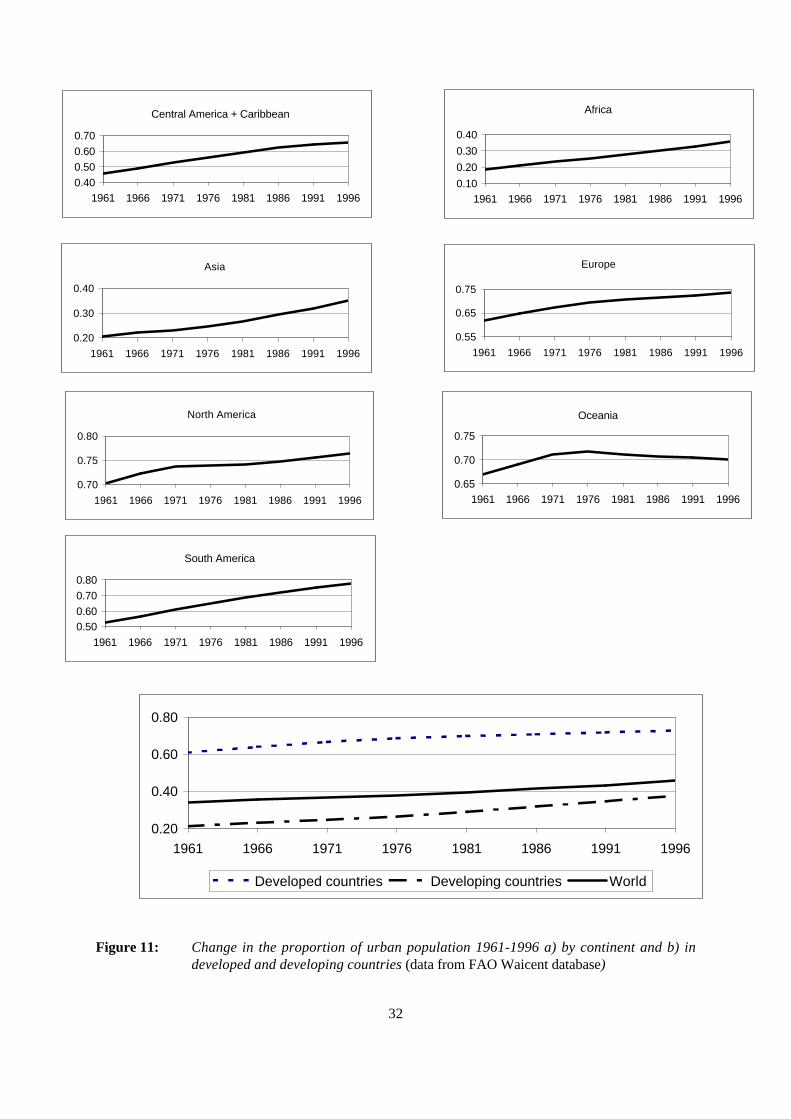
32
Figure 11: Change in the proportion of urban population 1961-1996 a) by continent and b) indeveloped and developing countries (data from FAO Waicent database)
Central America + Caribbean
0.400.500.600.70
1961 1966 1971 1976 1981 1986 1991 1996
Africa
0.10
0.20
0.30
0.40
1961 1966 1971 1976 1981 1986 1991 1996
Asia
0.20
0.30
0.40
1961 1966 1971 1976 1981 1986 1991 1996
Europe
0.55
0.65
0.75
1961 1966 1971 1976 1981 1986 1991 1996
North America
0.70
0.75
0.80
1961 1966 1971 1976 1981 1986 1991 1996
Oceania
0.65
0.70
0.75
1961 1966 1971 1976 1981 1986 1991 1996
South America
0.500.600.700.80
1961 1966 1971 1976 1981 1986 1991 1996
0.20
0.40
0.60
0.80
1961 1966 1971 1976 1981 1986 1991 1996
Developed countries Developing countries World
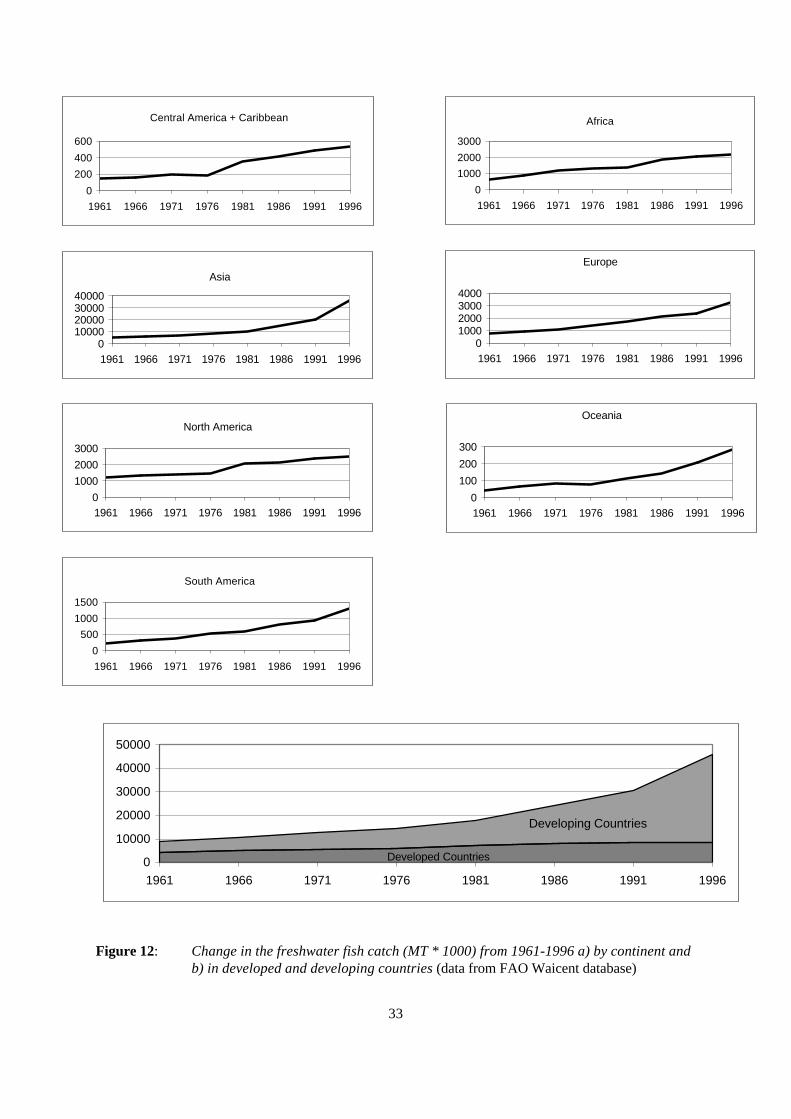
33
Figure 12: Change in the freshwater fish catch (MT * 1000) from 1961-1996 a) by continent andb) in developed and developing countries (data from FAO Waicent database)
Central America + Caribbean
0
200
400
600
1961 1966 1971 1976 1981 1986 1991 1996
Africa
0
1000
2000
3000
1961 1966 1971 1976 1981 1986 1991 1996
Asia
010000200003000040000
1961 1966 1971 1976 1981 1986 1991 1996
Europe
01000200030004000
1961 1966 1971 1976 1981 1986 1991 1996
North America
0
1000
2000
3000
1961 1966 1971 1976 1981 1986 1991 1996
Oceania
0
100
200
300
1961 1966 1971 1976 1981 1986 1991 1996
South America
0
500
1000
1500
1961 1966 1971 1976 1981 1986 1991 1996
Developed Countries
Developing Countries
0
10000
20000
30000
40000
50000
1961 1966 1971 1976 1981 1986 1991 1996
34
3.3.5 Climate change
The Intergovernmental Panel on Climate Change (IPCC) concludes that since the late 19th century, humaninduced emissions of gases, such as carbon dioxide (CO2) that trap heat in the atmosphere have contributedto an increase in global mean surface air temperatures of 0.3 to 0.6ΕC. Moreover, based on the IPCC=s mid-range scenario of future gas emissions and aerosols and their best estimate of climate sensitivity, a furtherincrease of 2ΕC is expected by the year 2100.
There is little doubt that climate change will alter the globes hydrological cycle in a variety of ways, but thereis at present little certainty about the form these changes will take. At the most general level IPCC (1996)predict that:
Warmer temperatures will lead to a more vigorous hydrological cycle; this translates intoprospects for more severe droughts and/or floods in some places and less severe droughtsand/or floods in other places. Several models indicate an increase in precipitation intensity,suggesting a possibility for more extreme rainfall events.
However, many more impacts will occur. Changes in evapotranspiration, snowmelt, runoff and soil moisturewill all affect freshwater ecosystem integrity both directly and indirectly as a result of human interventionsdesigned to compensate for changes in water resources.
The hydrology of arid and semi arid areas is particularly sensitive to climate variations. Relatively smallchanges in temperature and/or rainfall can have significant effects on evapotranspiration and groundwaterrecharge. These changes will impact both the total annual flow in rivers and its distribution through the year. In a dry area of Tanzania model results indicate a dramatic 40% decrease in recharge caused by a 15%reduction in annual rainfall, which is further accentuated under degraded conditions to a 58% decrease(Sandström, 1998). Since dry season flow in rivers is maintained by groundwater recharge this has severeimplications for freshwater ecosystem integrity in this and similar areas.
3.4 Indicators of the state of freshwater ecosystems
Human-induced pressures result in changes in freshwater ecosystems. In this section a range of themes andindicators of the changing state of freshwater ecosystems are presented. As with the previous section, thethemes are illustrative rather than a complete compilation and once again the indicators must be treated withcaution because there are problems with data collection and analysis.
3.4.1 Loss of wetlands
Wetlands, as defined by the Ramsar convention are:
areas of marsh, fen, peatland or water, whether natural, artificial, permanent ortemporary, with water that is static or flowing, fresh, brackish or salt, including areasof marine water, the depth of which at low tide does not exceed 6 m.
This definition although encompassing saline-water systems also incorporates a wide-range of differentfreshwater ecosystems. Consequently, although there is not a direct one-to-one correspondence between theterms, loss of integrity or destruction of wetlands is an indicator of pressures on freshwater ecosystems.Furthermore, it should be noted that the integrity of estuarine, deltaic and coastal wetlands is also dependenton inputs of freshwater (Box.2). Loss of wetlands may arise either directly from conversion to agricultural,industrial or residential use or indirectly as a consequence of human-induced change elsewhere in the
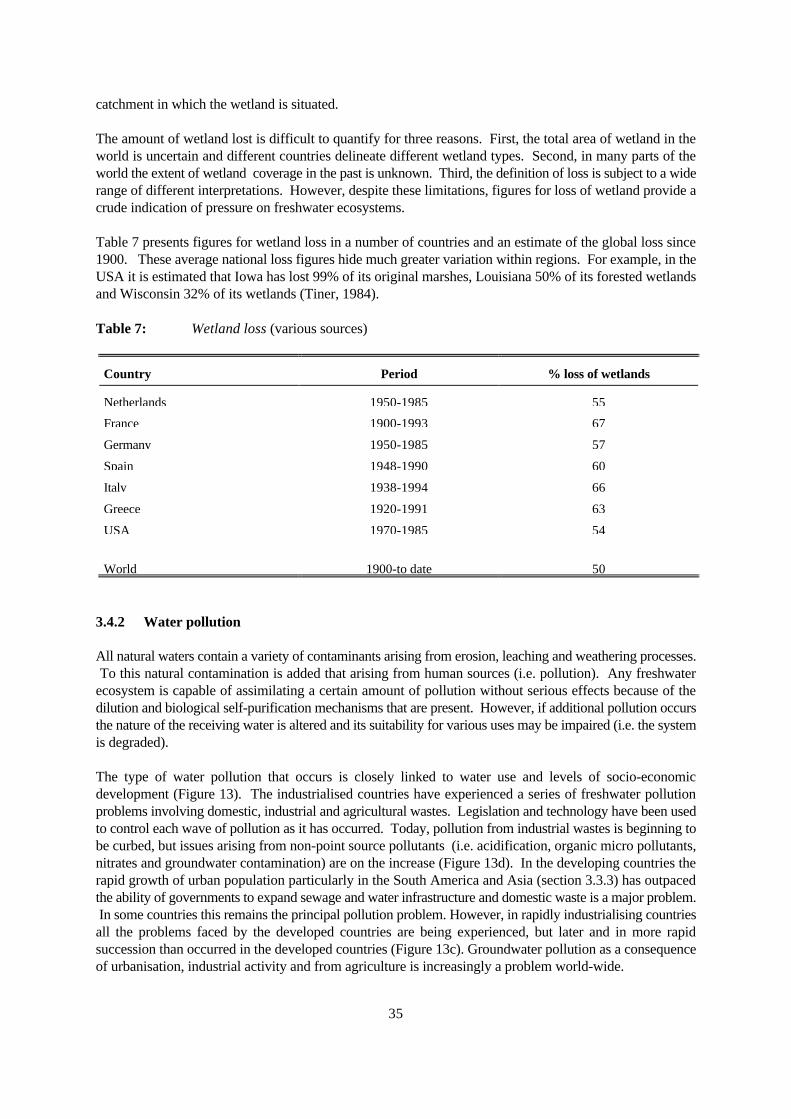
35
catchment in which the wetland is situated.
The amount of wetland lost is difficult to quantify for three reasons. First, the total area of wetland in theworld is uncertain and different countries delineate different wetland types. Second, in many parts of theworld the extent of wetland coverage in the past is unknown. Third, the definition of loss is subject to a widerange of different interpretations. However, despite these limitations, figures for loss of wetland provide acrude indication of pressure on freshwater ecosystems.
Table 7 presents figures for wetland loss in a number of countries and an estimate of the global loss since1900. These average national loss figures hide much greater variation within regions. For example, in theUSA it is estimated that Iowa has lost 99% of its original marshes, Louisiana 50% of its forested wetlandsand Wisconsin 32% of its wetlands (Tiner, 1984).
Table 7: Wetland loss (various sources)
Country Period % loss of wetlands
Netherlands 1950-1985 55
France 1900-1993 67
Germany 1950-1985 57
Spain 1948-1990 60
Italy 1938-1994 66
Greece 1920-1991 63
USA 1970-1985 54
World 1900-to date 50
3.4.2 Water pollution
All natural waters contain a variety of contaminants arising from erosion, leaching and weathering processes. To this natural contamination is added that arising from human sources (i.e. pollution). Any freshwaterecosystem is capable of assimilating a certain amount of pollution without serious effects because of thedilution and biological self-purification mechanisms that are present. However, if additional pollution occursthe nature of the receiving water is altered and its suitability for various uses may be impaired (i.e. the systemis degraded).
The type of water pollution that occurs is closely linked to water use and levels of socio-economicdevelopment (Figure 13). The industrialised countries have experienced a series of freshwater pollutionproblems involving domestic, industrial and agricultural wastes. Legislation and technology have been usedto control each wave of pollution as it has occurred. Today, pollution from industrial wastes is beginning tobe curbed, but issues arising from non-point source pollutants (i.e. acidification, organic micro pollutants,nitrates and groundwater contamination) are on the increase (Figure 13d). In the developing countries therapid growth of urban population particularly in the South America and Asia (section 3.3.3) has outpacedthe ability of governments to expand sewage and water infrastructure and domestic waste is a major problem. In some countries this remains the principal pollution problem. However, in rapidly industrialising countriesall the problems faced by the developed countries are being experienced, but later and in more rapidsuccession than occurred in the developed countries (Figure 13c). Groundwater pollution as a consequenceof urbanisation, industrial activity and from agriculture is increasingly a problem world-wide.
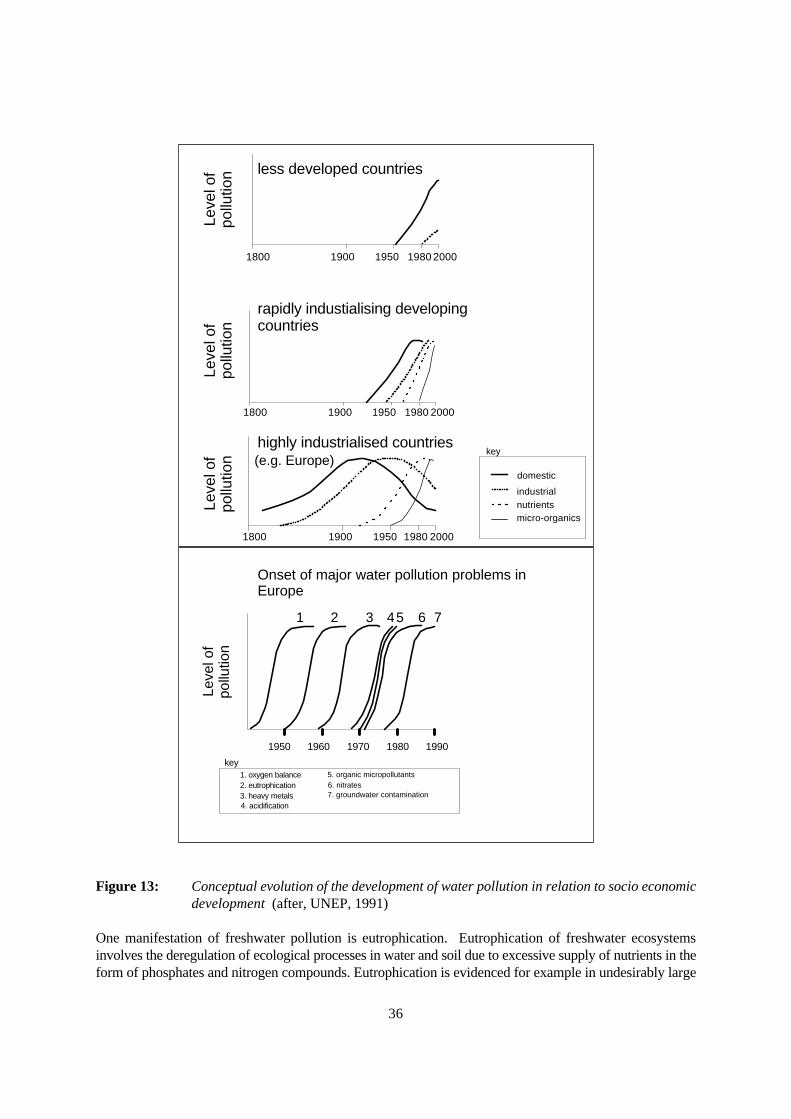
36
Leve
l of
pollu
tion
Leve
l of
pollu
tion
1800 1900 1950 1980 2000
1800 1900 1950 1980 2000
1800 1900 1950 1980 2000
Leve
l of
pollu
tion less developed countries
rapidly industialising developing countries
highly industrialised countries(e.g. Europe)
domestic
industrialnutrientsmicro-organics
key
3. heavy metals
1950 1960 1970 1980 1990
Leve
l of
pollu
tion
Onset of major water pollution problems in Europe
1 2 3 45 6 7
1. oxygen balance2. eutrophication
5. organic micropollutants6. nitrates7. groundwater contamination
key
4. acidification
Figure 13: Conceptual evolution of the development of water pollution in relation to socio economicdevelopment (after, UNEP, 1991)
One manifestation of freshwater pollution is eutrophication. Eutrophication of freshwater ecosystemsinvolves the deregulation of ecological processes in water and soil due to excessive supply of nutrients in theform of phosphates and nitrogen compounds. Eutrophication is evidenced for example in undesirably large
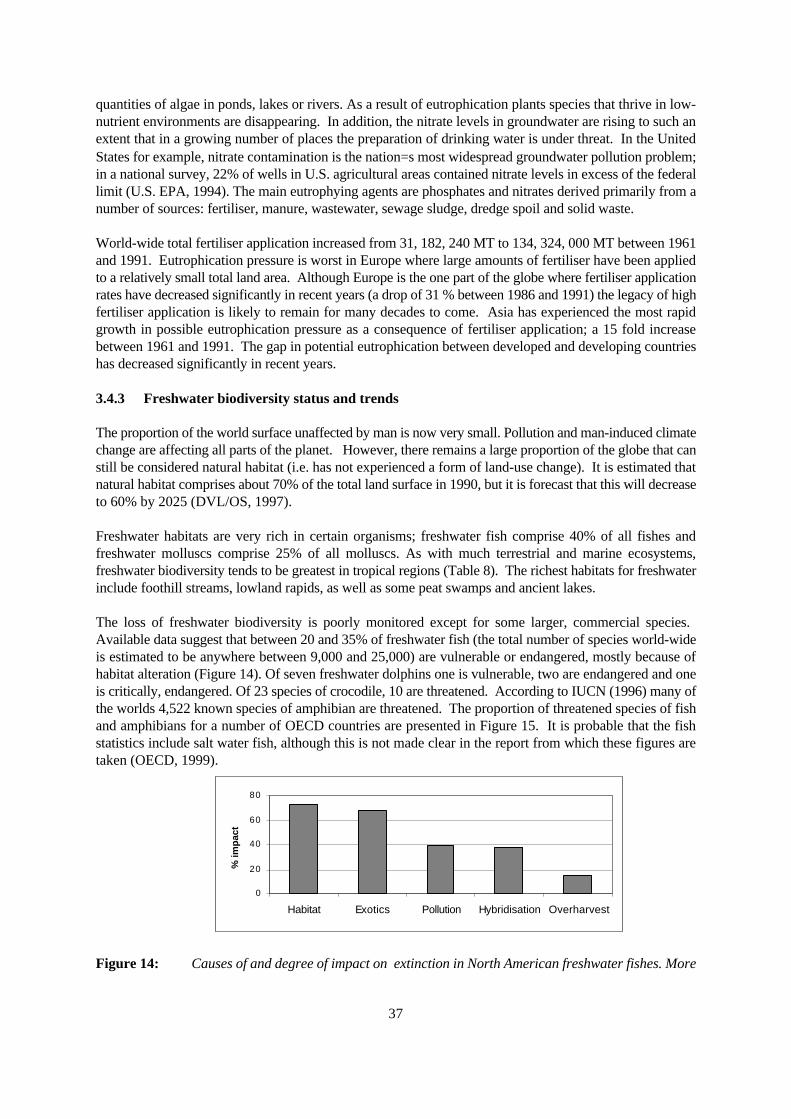
37
quantities of algae in ponds, lakes or rivers. As a result of eutrophication plants species that thrive in low-nutrient environments are disappearing. In addition, the nitrate levels in groundwater are rising to such anextent that in a growing number of places the preparation of drinking water is under threat. In the UnitedStates for example, nitrate contamination is the nation=s most widespread groundwater pollution problem;in a national survey, 22% of wells in U.S. agricultural areas contained nitrate levels in excess of the federallimit (U.S. EPA, 1994). The main eutrophying agents are phosphates and nitrates derived primarily from anumber of sources: fertiliser, manure, wastewater, sewage sludge, dredge spoil and solid waste.
World-wide total fertiliser application increased from 31, 182, 240 MT to 134, 324, 000 MT between 1961and 1991. Eutrophication pressure is worst in Europe where large amounts of fertiliser have been appliedto a relatively small total land area. Although Europe is the one part of the globe where fertiliser applicationrates have decreased significantly in recent years (a drop of 31 % between 1986 and 1991) the legacy of highfertiliser application is likely to remain for many decades to come. Asia has experienced the most rapidgrowth in possible eutrophication pressure as a consequence of fertiliser application; a 15 fold increasebetween 1961 and 1991. The gap in potential eutrophication between developed and developing countrieshas decreased significantly in recent years.
3.4.3 Freshwater biodiversity status and trends
The proportion of the world surface unaffected by man is now very small. Pollution and man-induced climatechange are affecting all parts of the planet. However, there remains a large proportion of the globe that canstill be considered natural habitat (i.e. has not experienced a form of land-use change). It is estimated thatnatural habitat comprises about 70% of the total land surface in 1990, but it is forecast that this will decreaseto 60% by 2025 (DVL/OS, 1997).
Freshwater habitats are very rich in certain organisms; freshwater fish comprise 40% of all fishes andfreshwater molluscs comprise 25% of all molluscs. As with much terrestrial and marine ecosystems,freshwater biodiversity tends to be greatest in tropical regions (Table 8). The richest habitats for freshwaterinclude foothill streams, lowland rapids, as well as some peat swamps and ancient lakes.
The loss of freshwater biodiversity is poorly monitored except for some larger, commercial species. Available data suggest that between 20 and 35% of freshwater fish (the total number of species world-wideis estimated to be anywhere between 9,000 and 25,000) are vulnerable or endangered, mostly because ofhabitat alteration (Figure 14). Of seven freshwater dolphins one is vulnerable, two are endangered and oneis critically, endangered. Of 23 species of crocodile, 10 are threatened. According to IUCN (1996) many ofthe worlds 4,522 known species of amphibian are threatened. The proportion of threatened species of fishand amphibians for a number of OECD countries are presented in Figure 15. It is probable that the fishstatistics include salt water fish, although this is not made clear in the report from which these figures aretaken (OECD, 1999).
Figure 14: Causes of and degree of impact on extinction in North American freshwater fishes. More
0
20
40
60
80
Habitat Exotics Pollution Hybridisation Overharvest
% im
pac
t
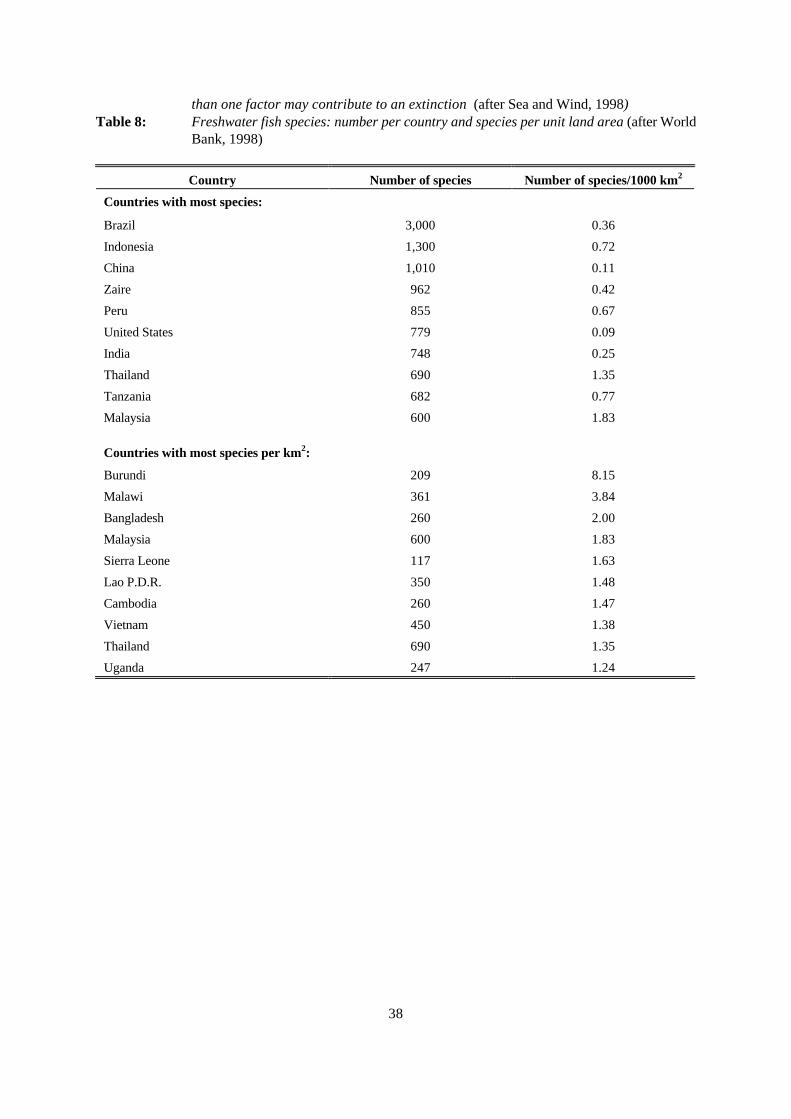
38
than one factor may contribute to an extinction (after Sea and Wind, 1998)Table 8: Freshwater fish species: number per country and species per unit land area (after World
Bank, 1998)
Country Number of species Number of species/1000 km2
Countries with most species:
Brazil 3,000 0.36
Indonesia 1,300 0.72
China 1,010 0.11
Zaire 962 0.42
Peru 855 0.67
United States 779 0.09
India 748 0.25
Thailand 690 1.35
Tanzania 682 0.77
Malaysia 600 1.83
Countries with most species per km2:
Burundi 209 8.15
Malawi 361 3.84
Bangladesh 260 2.00
Malaysia 600 1.83
Sierra Leone 117 1.63
Lao P.D.R. 350 1.48
Cambodia 260 1.47
Vietnam 450 1.38
Thailand 690 1.35
Uganda 247 1.24
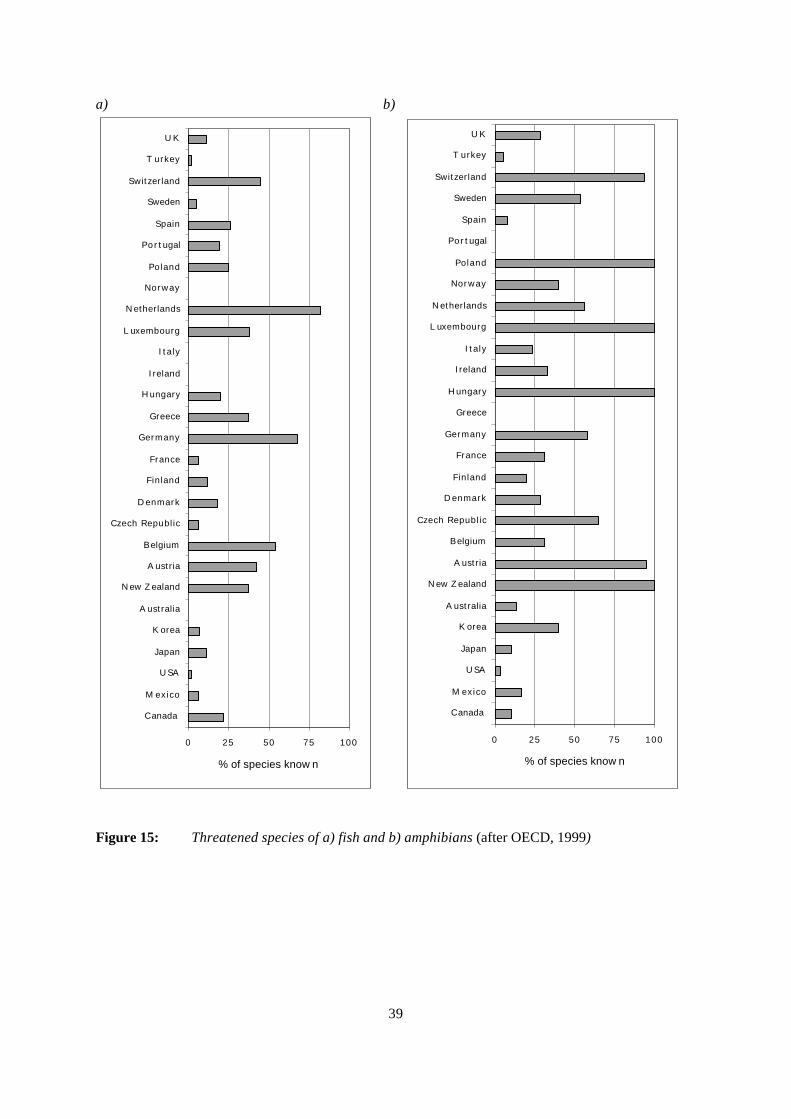
39
a) b)
Figure 15: Threatened species of a) fish and b) amphibians (after OECD, 1999)
0 25 50 75 100
C anada
M exico
U SA
Japan
K orea
A ustralia
N ew Z ealand
A ustria
B elgium
Czech Republic
D enmark
Finland
France
Germany
Greece
H ungary
Ireland
Italy
L uxembourg
N etherlands
Norway
Poland
Po r tugal
Spain
Sweden
Switzerland
T urkey
U K
% of species know n
0 25 50 75 100
C anada
M exico
U SA
Japan
K orea
A ustralia
N ew Z ealand
A ustria
B elgium
Czech Republic
D enmark
Finland
France
Germany
Greece
H ungary
Ireland
Italy
L uxembourg
N etherlands
Norway
Poland
Po r tugal
Spain
Sweden
Switzerland
T urkey
U K
% of species know n
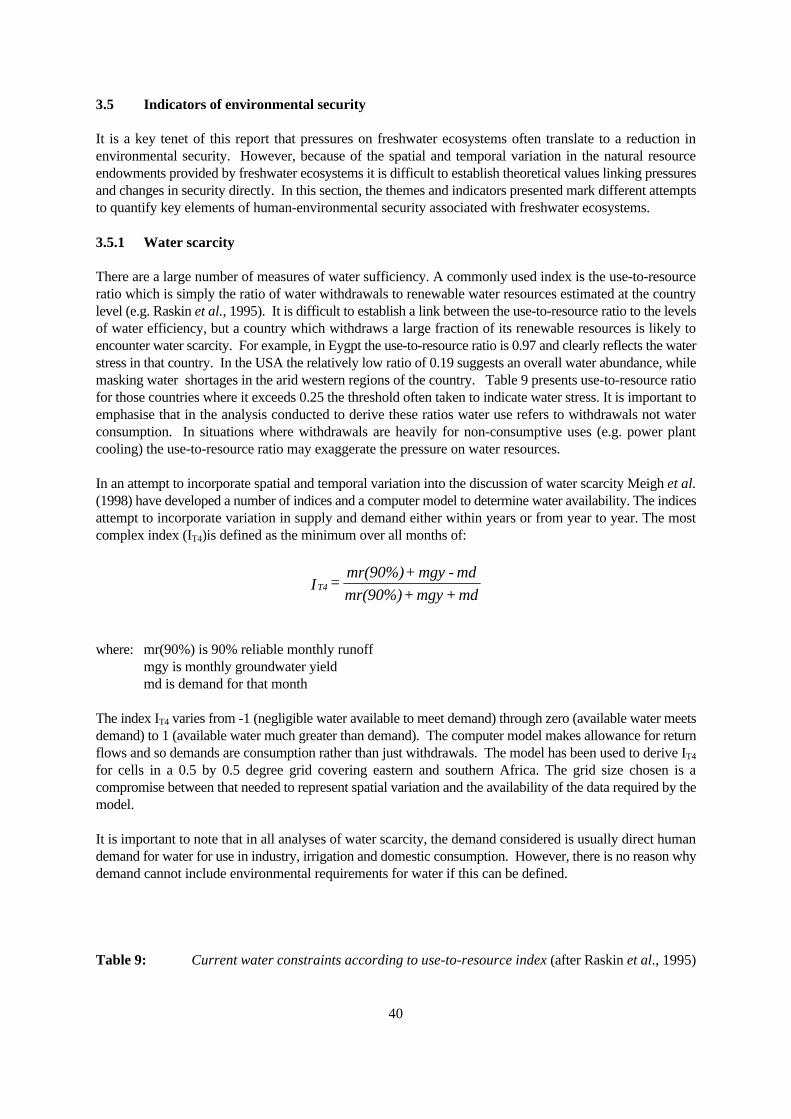
40
3.5 Indicators of environmental security
It is a key tenet of this report that pressures on freshwater ecosystems often translate to a reduction inenvironmental security. However, because of the spatial and temporal variation in the natural resourceendowments provided by freshwater ecosystems it is difficult to establish theoretical values linking pressuresand changes in security directly. In this section, the themes and indicators presented mark different attemptsto quantify key elements of human-environmental security associated with freshwater ecosystems.
3.5.1 Water scarcity
There are a large number of measures of water sufficiency. A commonly used index is the use-to-resourceratio which is simply the ratio of water withdrawals to renewable water resources estimated at the countrylevel (e.g. Raskin et al., 1995). It is difficult to establish a link between the use-to-resource ratio to the levelsof water efficiency, but a country which withdraws a large fraction of its renewable resources is likely toencounter water scarcity. For example, in Eygpt the use-to-resource ratio is 0.97 and clearly reflects the waterstress in that country. In the USA the relatively low ratio of 0.19 suggests an overall water abundance, whilemasking water shortages in the arid western regions of the country. Table 9 presents use-to-resource ratiofor those countries where it exceeds 0.25 the threshold often taken to indicate water stress. It is important toemphasise that in the analysis conducted to derive these ratios water use refers to withdrawals not waterconsumption. In situations where withdrawals are heavily for non-consumptive uses (e.g. power plantcooling) the use-to-resource ratio may exaggerate the pressure on water resources.
In an attempt to incorporate spatial and temporal variation into the discussion of water scarcity Meigh et al.(1998) have developed a number of indices and a computer model to determine water availability. The indicesattempt to incorporate variation in supply and demand either within years or from year to year. The mostcomplex index (IT4)is defined as the minimum over all months of:
where: mr(90%) is 90% reliable monthly runoffmgy is monthly groundwater yieldmd is demand for that month
The index IT4 varies from -1 (negligible water available to meet demand) through zero (available water meetsdemand) to 1 (available water much greater than demand). The computer model makes allowance for returnflows and so demands are consumption rather than just withdrawals. The model has been used to derive IT4
for cells in a 0.5 by 0.5 degree grid covering eastern and southern Africa. The grid size chosen is acompromise between that needed to represent spatial variation and the availability of the data required by themodel.
It is important to note that in all analyses of water scarcity, the demand considered is usually direct humandemand for water for use in industry, irrigation and domestic consumption. However, there is no reason whydemand cannot include environmental requirements for water if this can be defined.
Table 9: Current water constraints according to use-to-resource index (after Raskin et al., 1995)
md +mgy + mr(90%)
md -mgy + mr(90%) = IT4
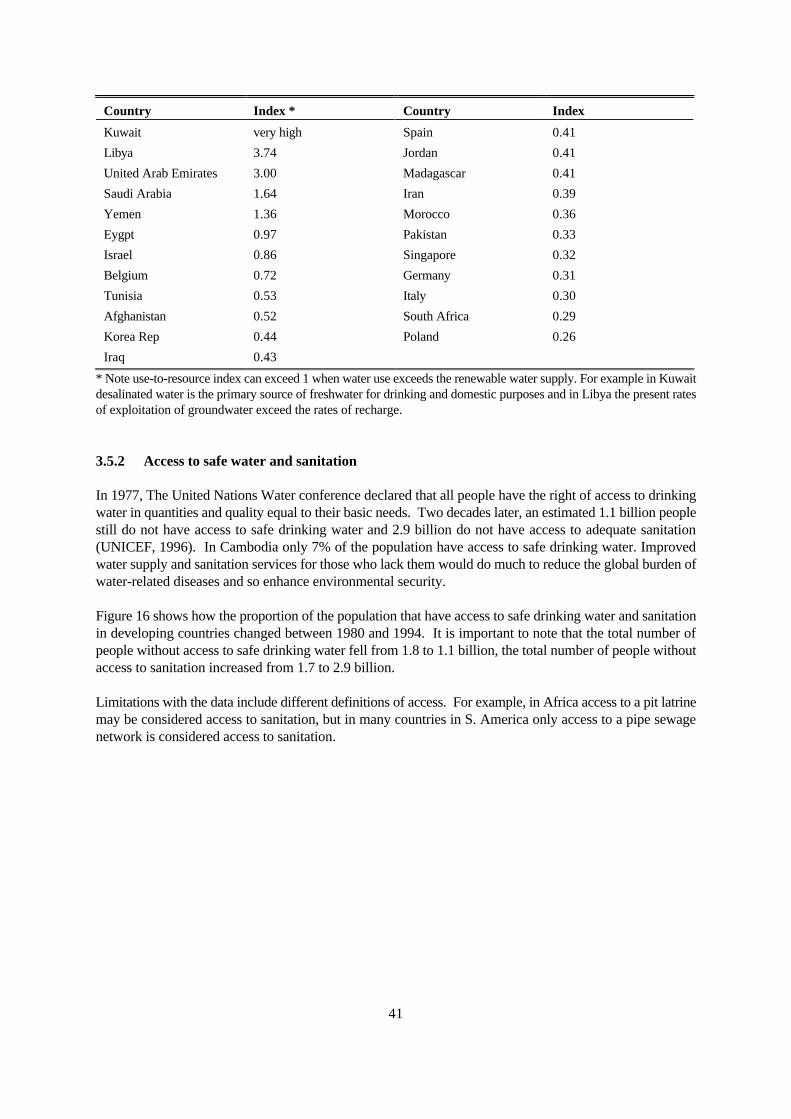
41
Country Index * Country Index
Kuwait very high Spain 0.41
Libya 3.74 Jordan 0.41
United Arab Emirates 3.00 Madagascar 0.41
Saudi Arabia 1.64 Iran 0.39
Yemen 1.36 Morocco 0.36
Eygpt 0.97 Pakistan 0.33
Israel 0.86 Singapore 0.32
Belgium 0.72 Germany 0.31
Tunisia 0.53 Italy 0.30
Afghanistan 0.52 South Africa 0.29
Korea Rep 0.44 Poland 0.26
Iraq 0.43
* Note use-to-resource index can exceed 1 when water use exceeds the renewable water supply. For example in Kuwaitdesalinated water is the primary source of freshwater for drinking and domestic purposes and in Libya the present ratesof exploitation of groundwater exceed the rates of recharge.
3.5.2 Access to safe water and sanitation
In 1977, The United Nations Water conference declared that all people have the right of access to drinkingwater in quantities and quality equal to their basic needs. Two decades later, an estimated 1.1 billion peoplestill do not have access to safe drinking water and 2.9 billion do not have access to adequate sanitation(UNICEF, 1996). In Cambodia only 7% of the population have access to safe drinking water. Improvedwater supply and sanitation services for those who lack them would do much to reduce the global burden ofwater-related diseases and so enhance environmental security.
Figure 16 shows how the proportion of the population that have access to safe drinking water and sanitationin developing countries changed between 1980 and 1994. It is important to note that the total number ofpeople without access to safe drinking water fell from 1.8 to 1.1 billion, the total number of people withoutaccess to sanitation increased from 1.7 to 2.9 billion.
Limitations with the data include different definitions of access. For example, in Africa access to a pit latrinemay be considered access to sanitation, but in many countries in S. America only access to a pipe sewagenetwork is considered access to sanitation.
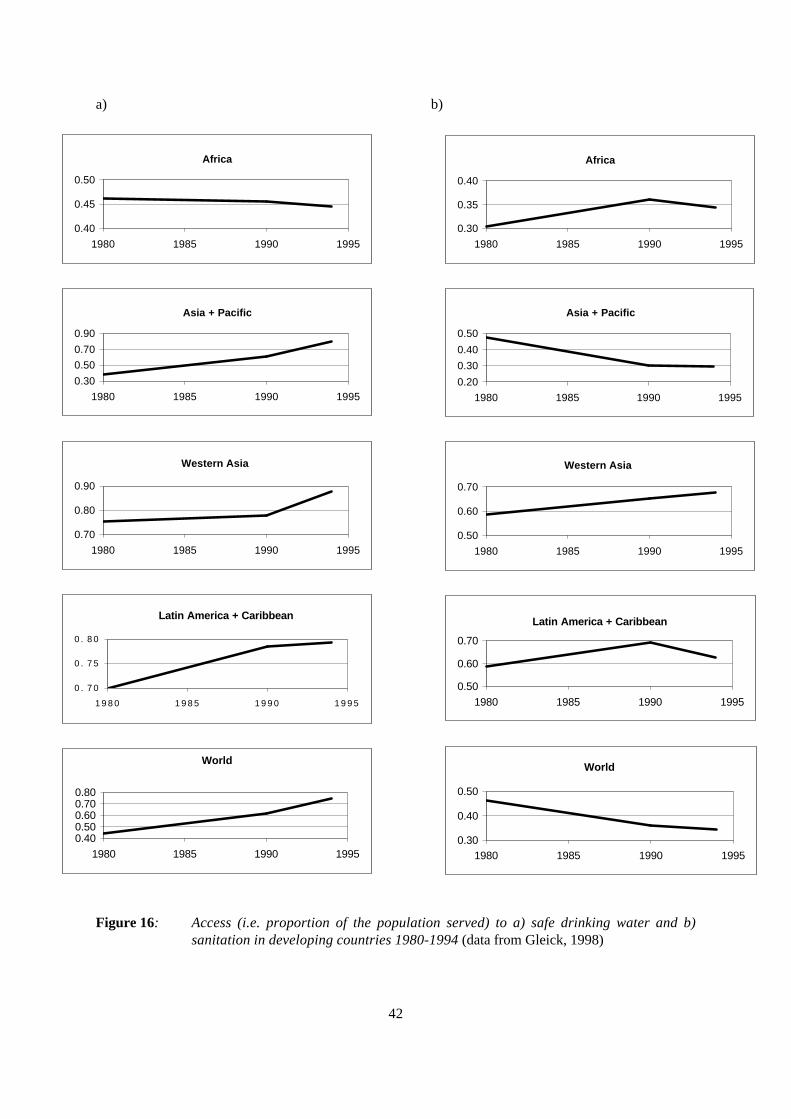
42
a) b)
Figure 16: Access (i.e. proportion of the population served) to a) safe drinking water and b)sanitation in developing countries 1980-1994 (data from Gleick, 1998)
Africa
0.30
0.35
0.40
1980 1985 1990 1995
Asia + Pacific
0.20
0.30
0.40
0.50
1980 1985 1990 1995
Western Asia
0.50
0.60
0.70
1980 1985 1990 1995
Latin America + Caribbean
0.50
0.60
0.70
1980 1985 1990 1995
World
0.30
0.40
0.50
1980 1985 1990 1995
Africa
0.40
0.45
0.50
1980 1985 1990 1995
Asia + Pacific
0.30
0.50
0.70
0.90
1980 1985 1990 1995
Western Asia
0.70
0.80
0.90
1980 1985 1990 1995
Latin America + Caribbean
0 . 7 0
0 . 7 5
0 . 8 0
1 9 8 0 1 9 8 5 1 9 9 0 1 9 9 5
World
0.400.500.600.700.80
1980 1985 1990 1995
43
3.5.3 Water related diseases
Interactions between human populations and freshwater ecosystems have consequences for health. Althoughdata are incomplete and unreliable, the World Health Organisation estimate that there are of the order of 250million cases of water-related diseases and roughly 5 to 10 million deaths annually (Table 10). Water-relateddiseases are of major concern in most of the developing world but have been largely eliminated fromindustrialised countries.
Drinking water contaminated with human or animal excreta is the main source of water-related disease. Theseinclude most of the enteric and diarrhoeal diseases caused by bacteria, parasites and viruses, such as cholera,giardia and rotaviruses. In the developed world dramatic improvements in public health were obtained inthe1800s as a consequence of protecting and treating drinking water supplies. Figure 17 indicates that deathsfrom cholera now occur predominantly in Asia and Africa.
Figure 17: Cholera index (nos. of deaths per million) as an indicator of environmental security (datafrom Gleick, 1998)
Water-based diseases come from hosts that live in water or require water for their life-cycle. The two mostwidespread examples are schistosomiasis which results from contact with snails that serve as hosts anddracunculiasis (guinea worm) which results from ingesting contaminated host zooplankton.
Schistosomiasis currently infects 200 million people in 70 countries. World-wide prevalence of the diseasehas risen over the last five decades, due mostly to the expansion of irrigation systems in hot climates (WRI,et al, 1998). The slow moving water in irrigation channels, drainage ditches and at the edge of reservoirsprovide ideal habitats for the host snails. Clear links to increases in schistosomiasis have been documentedin irrigation projects such as the Mwea project in Kenya, where schistosomiasis accounts for 18% of alldeaths (WRI et al., 1998). Following construction of the Diama dam on the Senegal river, the prevalencerate of schistosomiasis rose from 2% to 72% (Bergkamp, et al., 1998). In Ghana, schistosomiasis prevalencetripled in the late 1950s and early 1960s when a large number of agricultural impoundments were constructed(WRI, et al., 1998).
Africa
010203040
1970 1975 1980 1985 1990 1995 2000
Asia
02468
1970 1975 1980 1985 1990 1995 2000
Europe
0.00
0.05
0.10
0.15
1965 1970 1975 1980 1985 1990 1995 2000
World
02468
1970 1975 1980 1985 1990 1995 2000
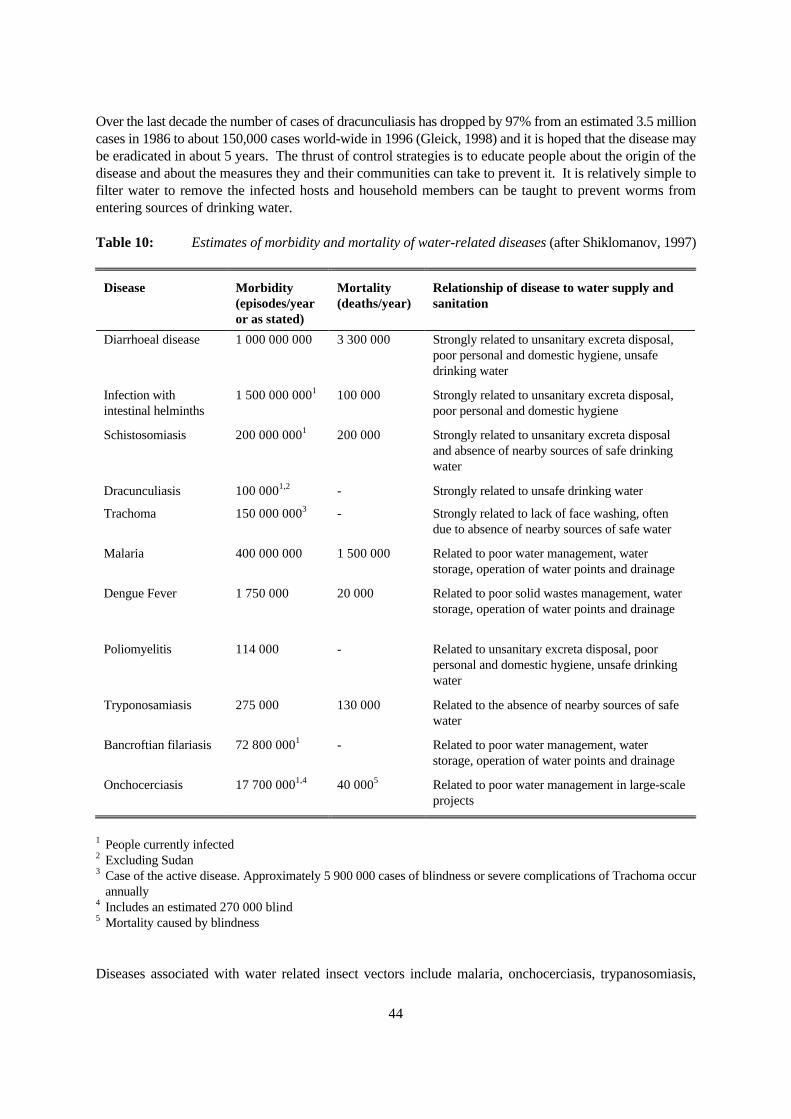
44
Over the last decade the number of cases of dracunculiasis has dropped by 97% from an estimated 3.5 millioncases in 1986 to about 150,000 cases world-wide in 1996 (Gleick, 1998) and it is hoped that the disease maybe eradicated in about 5 years. The thrust of control strategies is to educate people about the origin of thedisease and about the measures they and their communities can take to prevent it. It is relatively simple tofilter water to remove the infected hosts and household members can be taught to prevent worms fromentering sources of drinking water.
Table 10: Estimates of morbidity and mortality of water-related diseases (after Shiklomanov, 1997)
Disease Morbidity(episodes/yearor as stated)
Mortality(deaths/year)
Relationship of disease to water supply andsanitation
Diarrhoeal disease 1 000 000 000 3 300 000 Strongly related to unsanitary excreta disposal,poor personal and domestic hygiene, unsafedrinking water
Infection withintestinal helminths
1 500 000 0001 100 000 Strongly related to unsanitary excreta disposal,poor personal and domestic hygiene
Schistosomiasis 200 000 0001 200 000 Strongly related to unsanitary excreta disposaland absence of nearby sources of safe drinkingwater
Dracunculiasis 100 0001,2 - Strongly related to unsafe drinking water
Trachoma 150 000 0003 - Strongly related to lack of face washing, oftendue to absence of nearby sources of safe water
Malaria 400 000 000 1 500 000 Related to poor water management, waterstorage, operation of water points and drainage
Dengue Fever 1 750 000 20 000 Related to poor solid wastes management, waterstorage, operation of water points and drainage
Poliomyelitis 114 000 - Related to unsanitary excreta disposal, poorpersonal and domestic hygiene, unsafe drinkingwater
Tryponosamiasis 275 000 130 000 Related to the absence of nearby sources of safewater
Bancroftian filariasis 72 800 0001 - Related to poor water management, waterstorage, operation of water points and drainage
Onchocerciasis 17 700 0001,4 40 0005 Related to poor water management in large-scaleprojects
1 People currently infected2 Excluding Sudan3 Case of the active disease. Approximately 5 900 000 cases of blindness or severe complications of Trachoma occur
annually4 Includes an estimated 270 000 blind5 Mortality caused by blindness
Diseases associated with water related insect vectors include malaria, onchocerciasis, trypanosomiasis,
45
dengue fever and yellow fever. Modification of freshwater ecosystems that create or remove conditionsfavourable to their hosts may increase or reduce the prevalence of these diseases. For example, the drainingof wetlands made a significant contribution to the eradication of malaria in many developed countries.However, in Africa, deforestation favours malaria transmission by a species of mosquito which prefers tobreed in the open rather than in dense forest. In the Usambara mountains in north-east Tanzania, forestclearing activities along the mountaintops are considered one cause for the introduction and spread of malaria(WRI, et al. 1998). At present three to four hundred million people carry the malaria parasite and malariaaccounts for 20-30% of childhood deaths in developing countries.
It is impossible to quantify the additional toll of diseases related to irrigation, land conversion and otherhuman-induced changes in freshwater ecosystems. The complex relationships between habitat modification,the functioning of ecosystems and the transmission of disease mean that it is difficult to predict how changesin freshwater ecosystems will affect disease rates, especially when the vulnerability of exposed populationsvaries so widely with income, access to health care and proper nutrition. Nevertheless, it is fair to say thaton balance these changes contribute to the overall burden of water-related disease and so reduceenvironmental security.
3.5.4 Impact of Floods
Another aspect of environmental security related to freshwater ecosystems is exposure to too much water (i.e.floods). Floods play a dual role with regard to human welfare. Sometimes they provide environmentalsecurity through the maintenance of floodplain services (Box 3). However in other circumstances they reduceenvironmental security bringing death and destruction to communities. In this section their destructive roleis discussed.
Floods are the most frequent and damaging of all types of natural disaster. Few countries are spared theeffects of floods and between 1991 and 1995 it is estimated that floods caused more than US$200 billion inlosses, almost half of all economic damage caused by disasters during the same time span. Each year floodsare responsible for a quarter of deaths due to natural disasters and in 1996 alone 60 million people wereaffected by this natural hazard (Miller, 1997). In the worst natural disaster this century 3.5 million peoplelost their lives as a consequence of flooding in Hwang-Ho in China.
Asia is the continent that suffers the most from floods (Figure 18). It suffered 44% of all flood disasters and93% of flood-caused deaths in the period 1987-1996. The high death toll is not only due to the densepopulation in the flood plains of the region, but also the difficulties that the developing countries in Asia facein mounting effective flood defences (Miller, 1997).
Flood magnitude and frequency may be altered by human-induced changes in freshwater ecosystems. Forexample, deforestation in the middle and upper reaches of the Yangtze River and its tributaries is widelyattributed to have exacerbated the recent floods in China (The Economist, 1998). Although the exact natureof catchment response to deforestation is very site specific, removal of trees, particularly in the dry tropicstends to result in reduced rates of infiltration and percolation and hence increased runoff (Sandström, 1998). Societies have attempted to reduce the impact of flooding using both structural and non-structural floodcontrol methods. Structural measures include the construction of dykes or levees to prevent water spreadingacross the floodplain and the construction of large flood control dams. Non-structural measures include soiland water conservation methods (e.g. reforestation and contour ploughing in fields) and floodplain zoningand general regulation of development on floodplains.
Flooding is a natural phenomenon that will inevitably occur from time to time. It is impossible to ascertaina direct relationship between human modification of catchments and freshwater ecosystems and theconsequent impact of floods.
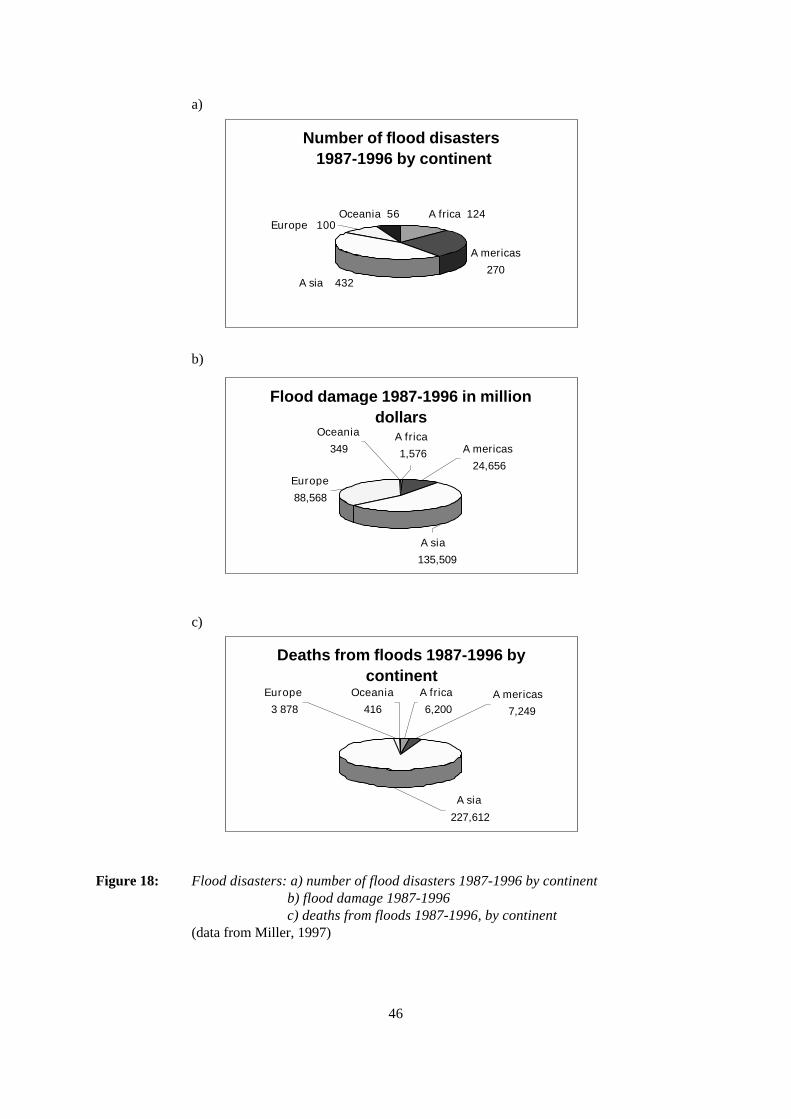
46
a)
b)
c)
Figure 18: Flood disasters: a) number of flood disasters 1987-1996 by continentb) flood damage 1987-1996c) deaths from floods 1987-1996, by continent
(data from Miller, 1997)
Deaths from floods 1987-1996 by continent
A sia
227,612
Oceania
416
A frica
6,200A mericas
7,249
Europe
3 878
Flood damage 1987-1996 in million dollars
A sia
135,509
A mericas
24,656
A frica
1,576
Europe
88,568
Oceania
349
Number of flood disasters 1987-1996 by continent
A frica 124
A mericas
270 A sia 432
Oceania 56 Europe 100
47
3.6 Synthesis: links between pressures, environmental state and security
Although far from comprehensive the problems identified and discussed in this chapter are the currently mostpressing issues in the context of freshwater ecosystems. Although there are problems with all the indicespresented, they provide a crude way of assessing temporal and spatial variation in the human-inducedpressures on freshwater ecosystems and the state of those ecosystems. As yet there is no method ofintegrating the indices to derive an index of either total pressure or current state. It is recognised that thesynergistic effects of several different pressures will have a cumulative impact that is different to the simplesum of the individual pressures (Gosselink et al., 1990). Furthermore, because of the complex nature ofinteractions between humans and the environment it is presently impossible to derive quantitative linksbetween indices of pressure and ecosystem state and environmental security. Statistics alone cannotadequately describe the pressures on freshwater ecosystems, their state nor environmental security. Recognising these limitations the indices nevertheless provide useful information.
The indices show that, world-wide, there is a tendency for increasing human pressure on natural freshwaterecosystems. Conversion of land to agricultural use, deforestation, urbanisation, dam construction andfreshwater fishing continue to impact on freshwater ecosystems everywhere. In the future it is likely thatclimate change will induce significant changes in the state of freshwater ecosystems. Many of the indicesshow that, to a large extent, the pressures are greatest in the developing countries which, not uncoincidentally,are where people presently have the lowest environmental security and populations are increasing mostrapidly. In the developed world some pressures are decreasing (e.g. the rate of conversion to agricultural landand construction of large dams has slowed) but it is in the developed countries that natural freshwaterecosystems have already experienced the greatest alteration.
The indices show that world-wide natural freshwater ecosystems are becoming increasingly altered by humanintervention. The loss of wetlands, water pollution and the changing status of biodiversity all indicate adecline in the “naturalness” of freshwater ecosystems. The water pollution indices highlight how theproblems faced by freshwater ecosystems change as countries become increasingly industrialised; while somepressures maybe moderated new pressures arise. Nevertheless, in the developed world, there has been anoverall improvement in the state of some freshwater ecosystems, in recent years, particularly with regard towater quality. To date this has been achieved primarily through engineering solutions and heavy investmentin end-of-pipe technologies.
World-wide indicators of environmental security are mixed. At present the greatest levels of human securityare in the developed world (i.e. in those countries which have the most altered freshwater ecosystems). Inthese countries, water related health risks have largely been overcome and in general terms societies aresufficiently prosperous to be able to choose between a range of options on how to manage freshwaterecosystems. In the developing world, for many people environmental security is greatly undermined by waterscarcity, the continued lack of safe water and sanitation and the consequent prevalence of water relateddiseases.
48
4. Scenarios: assessment of long-range patterns and problems
Man…perfects, corrects and improves the works of lower nature. Therefore the powerof man is similar to that of divine nature…. How wonderful is the cultivation of soil allover the Earth, how marvellous the construction of buildings and cities, how skillful thecontrol of waterways (Medieval humanist, Ficino, cited in Sale, 1992)
4.1 The scenario approach
The future state of freshwater ecosystems on this planet is dependent to a large extent on the way humankindopts to manage them. Decisions related to the management of freshwater ecosystems should not beimplemented on the basis of trial and error, but require a thorough review of the prospective effects. Thelong-term consequences and the total outcome on both the environment and society must be determined. However, the complexity of the interplay between human activities and freshwater ecosystems means thefuture of these systems is inherently unpredictable. Three types of indeterminacy can be identified:
Χ insufficient information on present conditions i.e. the state of systems and the forces governing theirdynamics
Χ even if precise information were available, complex systems are known to exhibit chaotic behaviour- extreme sensitivity to initial conditions and branching behaviours at various thresholds whichthwart prediction
Χ human freewill ensures that the future is unknowable.
While we cannot forecast the future accurately, we can use scenarios to present plausible futures; thescenarios are what if propositions. Applied to long range resources assessments scenarios draw upon bothscience (i.e. our understanding of historical patterns, current conditions and physical and social processes)and the imagination to conceive and evaluate a range of alternative pathways. In so doing, scenarios canilluminate the relationships within the total system and the relationship between human actions and the wholecomplex of interconnected outcomes. It is this added insight, leading to more informed and rational decision-making that is the primary objective of scenarios.
A water scenario has to include assumptions about many interacting elements: population and demographicpatterns, life-styles and consumption patterns, economic scale and structure, technology and efficiency,policies and institutions. Three scenarios, developed, in draft form, by the World Water Council’s ScenarioDevelopment Panel are presented. These scenarios, up to 2025, are:
Conventional water world: in which it is assumed that economic growth, technological advances anddemographic trends continue as at present so that although the regional water resource pressure increase andenvironmental security is reduced in some regions, a global water crisis is averted .
Water crisis: in which it is assumed that there is less dissemination of new technologies, slower economicgrowth and a failure to adopt water strategies resulting in increased water scarcity and a catastrophicreduction in environmental security in many regions.
Sustainable water world: in which it is assumed that water-related objectives and targets are given higherpriority than at present and are widely adopted resulting in increased environmental security world-wide.
In this paper the key elements of the scenarios are presented, with some additional information taken fromother sources. The emphasis is on the technical issues relating to each scenario.
49
4.2 Conventional water world
The principal aspects of this scenario can be summarised as follows:
Χ Resource intensive consumption patterns of developed countries continue uncheckedΧ World-wide population levels continue to rise, particularly in developing countriesΧ Continued economic and social inequity between countries of the developed and developing worldΧ Developing countries continue to try and switch from agrarian to industrial societyΧ Populations are increasingly urbanisedΧ Progressive globalisation of culture and commerceΧ Gradual convergence of developing and industrial economiesΧ Climate change
4.2.1 Consequences for freshwater ecosystems and environmental security
Changes in land-use increasingly affect water resources, particularly as a result of deforestation in moisttropical areas and grazing that has increased in arid areas. In developed countries problems with toxic(micro-organic) pollutants and new strains of water-borne viruses in surface and groundwater becomeincreasingly problematic. In the developing countries problems of access to safe drinking water and adequatesanitation continue to pose the most significant risk to environmental security.
The integrity and resilience of freshwater ecosystems continues to be degraded as a consequence ofencroaching human settlement and pollution. Nonetheless, water-related diseases are kept at the samepercentage levels that exist at present through some improved sanitation and water management. The deathtoll of curable water-related diseases such as diarrhoea, particularly among children, remains high. There havebeen no major widespread and dramatic epidemics of cholera or typhoid, but the chronic impact of low waterquality remains a major health problem in developing countries.
The conversion of wetlands into arable land and residential areas has slowed, but not halted, except in somedeveloped countries where the public outcry over the last remaining wetlands has led to costly actions toprotect and even recreate small areas. In developing countries water-based tourism remains economicallyimportant in some areas, but others have over-exploited their resources and seen their tourism revenuesdecline.
There has been an increase of water use by agriculture because of an expansion of irrigated land. It isestimated that 60% of all food will be produced by irrigation in 2025 (Lanz, 1995). Water use efficiency hasincreased, because of increased application of more efficient irrigation systems as well as the developmentof less water demanding crops. However, these gains only partly offset the increases in water withdrawalsfor irrigated lands. A slight shift from irrigated to rain-fed agriculture has occurred because the increase inyield of rain-fed agriculture grows faster than that of irrigated crops. This reduces the rate of water use foragriculture because irrigated lands, while accounting for an important fraction of agricultural production,represent a relatively small amount of total agricultural land in terms of area.
By 2025, world-wide water withdrawals reach 5187 km3 y-1 and of this 2879 km3 y-1 are consumed. Groundwater levels in many renewable aquifers gradually fall because withdrawal exceeds recharge. Increased technological efficiencies and improved management prevent dramatic water crises. However,continued water degradation and increased costs of new water supplies make the global situation less resilientand more vulnerable to crises.
50
Humankind takes for direct use an even greater share of the limited renewable fresh water than today. Thiswater can only be obtained at an increasing financial and ecological price. This results in increased stress onwater resources, human health and ecosystems. The problems impacting on freshwater ecosystems are thesame as today, but increased in number and consequences at the global scale. There are continued socio-economic problems due to persistence of poverty, failure to achieve global equity and increase in conflict overscarce water resources. Thus there is a net reduction in environmental security, particularly in developingcountries.
4.3 Water Crisis
Until 2015 this scenario follows a similar pattern to that of the conventional scenario (section 4.2) except thatoverall global economic growth is slower and capital flows away from some parts of the developing world. After 2015 this results in a significantly worse water situation. The principal aspects of the scenario are asfollows:
Χ Income inequality between the rich and poor countries increases and both relative and absolute levels ofpoverty rise
Χ Economic globalisation has expanded the economy but various types of trade conflicts have reduced theoverall rate of growth
Χ Global co-operation is undermined by the scarcity of waterΧ Many technological developments are applied in some parts of the world, but not others, thereby
increasing inequitiesΧ Global food production and trading systems are becoming vulnerable to disruptionΧ International and national equity have decreased significantly with related social tension and pressures
for migrationΧ Water withdrawals have continued to grow without the efficiencies expected from improved water
resources management, resulting in acute water stress in many countriesΧ Little progress has been made to solving current critical water problems, other than locally at a small scaleΧ The resilience of natural and social systems is eroded to such an extent that climate change causes large
scale ecological collapse
4.3.1 Consequences for freshwater ecosystems and environmental security
Despite their diversity, the events unfolding in this scenario have one thing in common; they all contributeto the general erosion of resilience in both human societies and the natural and ecological realms. The resultis environmental degradation leading to critical resource scarcity and human catastrophes that in turn effectglobal economic processes, creating a downward spiral of reducing global security.
Water scarcity combined with the need for irrigation and economic development, particularly in Africa, Indiaand China resulted in exceedance of the ecological thresholds required to protect ecosystems. This generateswidespread degradation of freshwater ecosystems. With ecological resilience lost in those areas, some of theeffects have global implications. Episodes of large scale ecological collapse, involving conversion of foreststo agricultural land to dustbowls or wastelands, eutrophication of inland freshwater bodies, collapses offreshwater fisheries and increased catastrophic floods triggered by loss of ecological regulation at thecatchment level occur frequently.
51
Water resource systems do not collapse globally, but major catchments and socio-economic regions areaffected. International conflicts over shared water resources occur with increasing frequency. Water useefficiency decreases as investment and maintenance decline. The price of water increases. Increasinglydeveloped countries and corporate alliances look towards water-surplus areas such as the Congo and Amazonbasins to grow their food and spare their water reserves for industrial and domestic use. However, this hasdevastating consequences for the ecosystems of these areas. Environmental security is severely compromised,world-wide.
4.4 Sustainable water world
The principal aspects of this scenario can be summarised as follows:
Χ The rate of growth in the human population is decreasing and it is forecast that it will stabilise e.g. at 10billion) by 2070
Χ An international consensus is achieved on the principles that should govern utilisation of natural resourcesΧ Methods of resource evaluation have been developed and introduced - water is correctly valued and
benefits provided by ecosystems understood as a consequence of researchΧ Basic human needs for water have been identified. Significant advances have been made in providing
access to water for drinking, sanitation and food preparation throughout the developing worldΧ Domestic water use in the developed world is more efficient and equitable as a consequence of
technological advances and re-use of wastewater for non-potable uses.Χ Solar desalination is widespreadΧ National and international actions to protect ecosystems have been established. These include
comprehensive minimum environmental water commitments and international agreements on speciesprotection and management. All international aid and development projects include explicit ecosystemprotection and management components. Basic ecosystem water needs are identified.
Χ Water-related conflicts resolved through negotiations. Formal agreements/treaties are signed for all theworlds major river systems, including shared responsibility for environmental and ecological protection
Χ Increased irrigation efficiency is obtained through adoption of modern technology (e.g. sprinklers, dripirrigation, sensor and computer technology).
Χ Climate change cannot be prevented but management policies are flexible and adaptable enough to copewith changes that are occurring
4.4.1 Consequences for freshwater ecosystems and environmental security
As a consequence of social, economic and technological changes, water withdrawals are stabilised at asustainable level. Technological innovation increasingly concentrates on biosystems, harnessing the potentialof ecosystems to produce resources necessary for life at low energy intensity and high material efficiency.
Ecosystem restoration and rehabilitation becomes a leading sector of the economy. As a result environmentalquality improves. While not all ecosystems can be recuperated, many new, sustainable and productiveecosystems evolve. Freshwater ecosystems are managed in a sustainable manner and to the benefit ofhumankind as well as other flora and fauna. Environmental security is significantly increased.
52
4.5 Synthesis: future water security
The foundation of the three scenarios described is the Conventional Water World, which has as its basiscurrent trends and practices. The driving forces of the Conventional Water World then diverge at some pointto produce either the Water Crisis or the Sustainable Water World.
Human intervention affects the state of freshwater ecosystems, and the services provided to human society,through the feedback mechanisms illustrated in Figure 7. Over the long-term these may be either negative(i.e. increased degradation of ecosystems so that there is a net reduction in benefits) or positive (i.e. reduceddegradation and a net increase in benefits), depending on the nature of the intervention.
As discussed in section 3.2, the underlying reasons why the Conventional Water World results in a netdecrease in environmental security, are primarily a consequence of: i) socio-economic insecurity outweighingthe need to maintain environmental security; ii) ill-informed decision making and iii) an inappropriateemphasis on technological solutions. If a Sustainable Water World is to be achieved, significant changes mustbe made in the way that humankind manages and utilises freshwater ecosystems. Many people argue, thatif drastic decreases in environmental security are to be avoided, changes must be implemented soon (e.g.Falkenmark and Lundqvist, 1998).
The interaction of humankind with freshwater ecosystems is complex. Successful management mustincorporate all social, economic and environmental elements in an integrated approach aimed at attainingspecific goals. These goals should be targeted at increasing environmental security by building resilience inboth social and environmental systems so that future change (e.g. arising from climate change) does not havedetrimental impacts on either ecological integrity or human security. Consequently management strategiesmust be holistic in nature and adaptable. It is important to note that requirements for improvingenvironmental security vary from place to place; there are no simple recipe–book solutions.
To a large extent social and economic interventions influence the global driving forces to a much greaterextent than technical interventions. Nevertheless, at the catchment scale, technical intervention in conjunctionwith appropriate social and economic strategies can significantly alter the impact of human interventions onecosystem integrity and hence environmental security. It is beyond the scope of this paper to describe thesocial and economic interventions in detail, but these are discussed in the other two papers in this series(Swanson and Doble, 1999; Soussan et al., 1999). In the following section, technical approaches andtechnological options that may be incorporated in the future management of freshwater ecosystems and thatwill assist in approaching a sustainable water world are discussed.
53
5. Future Strategies
The need for integrated, basinwide, water resource management is considered aprime security objective for the prospects of …… regional co-operation (SIDA, 1995)
Freshwater ecosystems are changed as a consequence of land conversion, agriculture, pollution, majorengineering schemes and urban development. As discussed above, these changes may alter ecosystems tothe extent that benefits accrued to society from the natural functions and attributes of an ecosystem are lost. As such human-induced changes can represent threats to environmental security. In this context a degradedecosystem is one which has lost some or all of its direct or indirect value to human society
Although there remains much debate about the best approach to reduce the impact of human intervention onfreshwater ecosystems there is growing recognition, at the highest political level, that wide ranging andintegrated strategies are required to resolve complex problems (section 1). In this section the role ofecosystem management as a conceptual framework on which to base future management of freshwaterecosystems is discussed. We argue that although it provides a useful water “ethic” ecosystem managementis poorly defined and so does not provide a rational basis for environmental and natural resource policies. Theconcept of integrated catchment management (ICM) is conceived as a practical framework for implementingecosystem management because catchments provide an appropriate physical context in which to applyresource planning.
Mitigation and adaptation strategies are conceived as components of ICM that seek to alleviate the negativeimpacts of human intervention in freshwater ecosystems on environmental security. For the purpose of thispaper these strategies are defined as follows:
• Mitigation strategies are strategies that are intended to significantly reduce or eliminate defined threatsor sources of degradation. In terms of the conceptual model described in section 3.1 approaches whichsuccessfully mitigate human-induced change in freshwater ecosystems are those which break the linkbetween the driving forces and the resulting pressure on the ecosystem. This can be achieved either bydealing with the driving force directly (e.g. reduction in population growth by stricter birth control) orby altering the anthropogenic response to the driving force (e.g. reduction in per capita waterconsumption through demand management).
• Adaptation strategies are strategies that seek to regain ecological services that have been lost as aconsequence of human-induced change in an ecosystem. In terms of the conceptual model ofenvironmental security described in section 3.1, strategies which alleviate the impacts of changes tofreshwater ecosystems, are conceptualised as those which break the link between pressures on theecosystem and its state or, alternatively, break the link between the state of the ecosystem and theconsequent impact on environmental security. In terms of Figure 6 this can be visualised as moving backtowards the benefit peak from a position on the recession limb of the total benefits curve.
Within this paper the emphasis is on technical aspects of mitigation and adaptation within the context ofICM. Although social-economic interventions are mentioned these are dealt with in more detail in the othertwo papers of this series (Swanson and Doble, 1999; Soussan et al., 1999). It is important to recognise thatthe separation between mitigation and adaptation is somewhat arbitrary because, within the context of ICM,many technical interventions can be classified as either, or indeed both, depending on the specificcircumstances in which they are applied.
54
5.1 Concepts
5.1.1 Ecosystem management
Ecosystem management is proposed by advocates as the modern and preferred way of managing naturalsystems. It is offered as a management approach that will protect the environment, maintain ecosystemfunctions, preserve biodiversity and ensure sustainable development (e.g. Norton, 1992). The basic idea isthat resource and landscape management is tailored to landscape conditions, processes and potential so thatdesired features and processes of ecosystems are maintained and human needs are met in an optimal andsustainable way (Pirot and Meynell, 1998). This involves defining, on the basis of sound scientific evidence,the intrinsic capabilities and limitations of ecosystems to support, over the long-term, a particular suite ofhuman activities.
Others (e.g. Fitzsimmons, 1996) see the concept of ecosystem management as flawed because, despite thewidespread acceptance of the general ideals, the concept remains full of ambiguity and at present there is nooperational framework for integrating technical analysis into land use and natural resource decision making. However, although these criticisms are valid, it remains the case that something like ecosystem managementis needed to address the environmental and social problems arising from the exploitation-focused, and singleresource approach to management that has generally been applied in the past. There is a critical need todecide the role of science in policy-making and resource management.
It is beyond the scope of this document to analyse in detail the many issues raised by the concept ofecosystem management and discussed interminably in recent scientific literature. However, Table 11summarises seven key principles of ecosystem management and comments on each in relation to themanagement of freshwater ecosystems. Here, we simply note the following:
Χ It is self-evident that water-dependent ecosystems rely on water for their existence and functions andso provision of water is needed for their services to the environment and people.
Χ Land and water resources are linked so it is essential that they are managed in an integrated manner.Χ Although there are limitations, nevertheless, catchments provide the most obvious physical entity
on which to base management of natural resources, particularly freshwater (section 5.1.2).Χ Heavily modified ecosystems can be sustainable over the long-term, in that the transformed systems
can continue to be productive indefinitely, providing that appropriate management systems areestablished.
Χ Ecosystem management should seek to maximise the benefits to human society to be obtained fromboth the natural and non-natural services provided by any particular ecosystem (Figure 6).
Χ To be successful management practices must be based on knowledge of ecosystems and anunderstanding of social mechanisms. There is a need to develop methods that link the two directly.
Χ Local and traditional knowledge can be of immense value as a basis for designing and implementingmanagement plans.
Χ Management should promote resilience within freshwater ecosystems on a long-term basis andshould be adaptable so that future changes in societal preference can be accommodated (Berkes etal., 1998). This has to be achieved by adoption of a variety of physical, social and economic policiesand techniques, all aimed at minimising the adverse consequences of development.
Χ Water allocation needs to be based on participation and joint decisions of all stakeholders. Χ At present the developed world=s preference is seemingly paradoxical: wanting the benefits and
affluence obtained through extreme modification of ecosystems but at the same time placing highvalue on the non-consumptive elements of ecosystems such as pristineness.
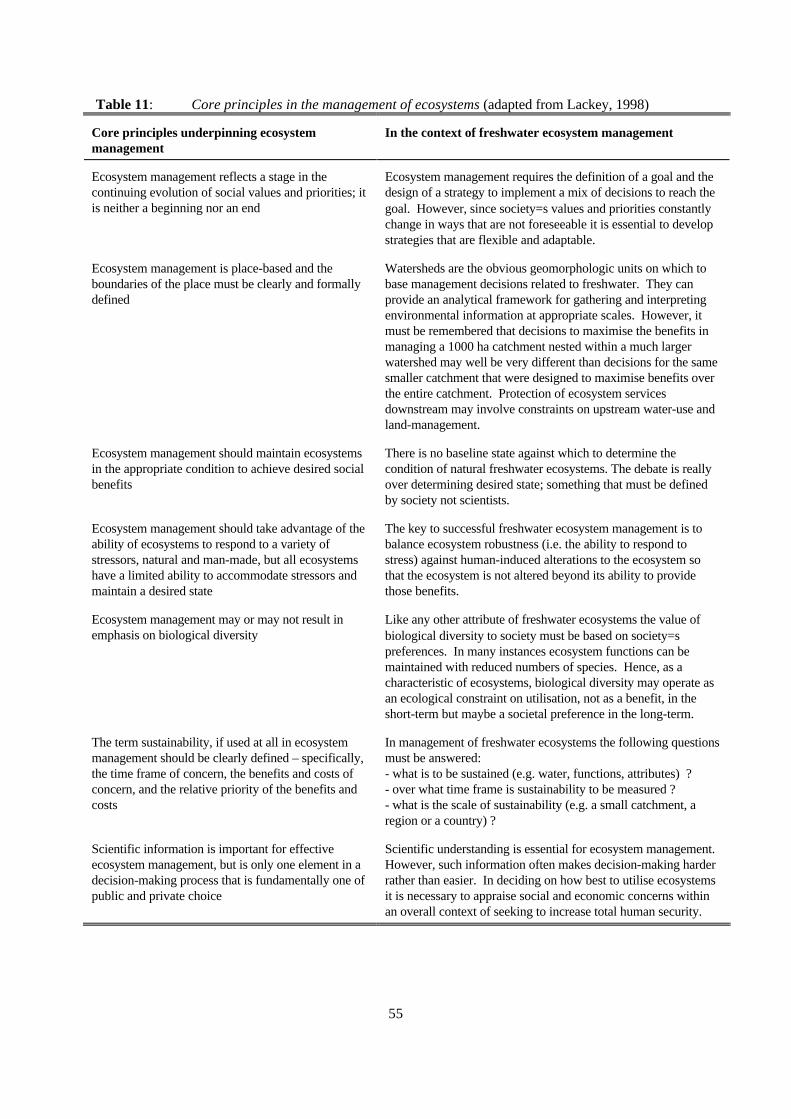
55
Table 11: Core principles in the management of ecosystems (adapted from Lackey, 1998)
Core principles underpinning ecosystemmanagement
In the context of freshwater ecosystem management
Ecosystem management reflects a stage in thecontinuing evolution of social values and priorities; itis neither a beginning nor an end
Ecosystem management requires the definition of a goal and thedesign of a strategy to implement a mix of decisions to reach thegoal. However, since society=s values and priorities constantlychange in ways that are not foreseeable it is essential to developstrategies that are flexible and adaptable.
Ecosystem management is place-based and theboundaries of the place must be clearly and formallydefined
Watersheds are the obvious geomorphologic units on which tobase management decisions related to freshwater. They canprovide an analytical framework for gathering and interpretingenvironmental information at appropriate scales. However, itmust be remembered that decisions to maximise the benefits inmanaging a 1000 ha catchment nested within a much largerwatershed may well be very different than decisions for the samesmaller catchment that were designed to maximise benefits overthe entire catchment. Protection of ecosystem servicesdownstream may involve constraints on upstream water-use andland-management.
Ecosystem management should maintain ecosystemsin the appropriate condition to achieve desired socialbenefits
There is no baseline state against which to determine thecondition of natural freshwater ecosystems. The debate is reallyover determining desired state; something that must be definedby society not scientists.
Ecosystem management should take advantage of theability of ecosystems to respond to a variety ofstressors, natural and man-made, but all ecosystemshave a limited ability to accommodate stressors andmaintain a desired state
The key to successful freshwater ecosystem management is tobalance ecosystem robustness (i.e. the ability to respond tostress) against human-induced alterations to the ecosystem sothat the ecosystem is not altered beyond its ability to providethose benefits.
Ecosystem management may or may not result inemphasis on biological diversity
Like any other attribute of freshwater ecosystems the value ofbiological diversity to society must be based on society=spreferences. In many instances ecosystem functions can bemaintained with reduced numbers of species. Hence, as acharacteristic of ecosystems, biological diversity may operate asan ecological constraint on utilisation, not as a benefit, in theshort-term but maybe a societal preference in the long-term.
The term sustainability, if used at all in ecosystemmanagement should be clearly defined – specifically,the time frame of concern, the benefits and costs ofconcern, and the relative priority of the benefits andcosts
In management of freshwater ecosystems the following questionsmust be answered:- what is to be sustained (e.g. water, functions, attributes) ?- over what time frame is sustainability to be measured ?- what is the scale of sustainability (e.g. a small catchment, aregion or a country) ?
Scientific information is important for effectiveecosystem management, but is only one element in adecision-making process that is fundamentally one ofpublic and private choice
Scientific understanding is essential for ecosystem management. However, such information often makes decision-making harderrather than easier. In deciding on how best to utilise ecosystemsit is necessary to appraise social and economic concerns withinan overall context of seeking to increase total human security.
56
5.1.2 Integrated Catchment Management
The concept of Integrated Catchment Management (ICM) recognises that successful natural resourcemanagement requires a holistic approach that integrates both land and water-use as well as technical and non-technical human interventions. The key tenet of the approach is that water catchments represent the mostappropriate physical entity on which to base water management policy. The term is often usedinterchangeably with similar terms including integrated water resources management, integrated watershedmanagement and total catchment management. It can be defined as:
The co-ordinated planning and management of the water resources of a river basinconsidering its interaction with land and other environmental resources for theirequitable, efficient and sustainable use at a range of scales from local to catchment level.(DFID, 1997).
ICM programmes comprise an overall strategy that clearly defines the management objectives, a range ofdelivery mechanisms that enable these objectives to be achieved and a monitoring schedule that evaluates theprogramme performance. Mechanisms and policies are established that enable long-term support toprogrammes of environmental recovery (Box 8).
The objective of ICM can be summarised as increasing environmental security through the following:
• In the short term, to prevent further environmental degradation and, in the longer term, restore degradedresources.
• Promote sustainable agricultural, forestry, fisheries, industrial and urban development• Ensure appropriate resource use planning and management• Ensure a long-term viable economic future for basin dependants• Safeguard self-maintaining populations of native species• Preserve cultural heritage• Maintain the tourism potential and develop linkages between tourism and conservation
ICM strategies recognise that:
• Decisions need to be formulated in the context of a broad strategy that takes the long-term view,incorporates assumptions about the actions and reactions of all participants in water management, andfully considers the ecosystems and socio-economic structures that exist in an entire river basin.
• Solutions need to focus on underlying causes not merely their symptoms.• Issues must be approached in an integrated way• In general, development of sound resource management and collective responsibility for resources will take
place at the sub-regional or village level• There is potential for multiple reuse of water within catchments and that some water that is lost at the
household or field level may be reused.• Protection of ecosystem services downstream in rivers may involve constraints on upstream water-use both
in terms of quantity and quality
57
Box 8: The Murray Darling Basin Initiative: the Worlds largest catchment managementprogramme
The Murray Darling catchment covers more than one million square kilometres, one sixth of Australia andincludes 24 major rivers. Salinity is a natural feature of the catchment. The problem is that changes in landuse and water use have intensified this aspect of the catchment resulting in conflict with human andenvironmental needs. Removal of natural vegetation has altered the water balance of the land so thatwatertables have been rising, leading over time to salinisation of the soil. Saline inflows in turn impact onriver water quality with salinity endangering important aquatic and riparian ecosystems as well as threateningdomestic water supplies for the city of Adelaide and much of South Australia.
In recognition of this, and other problems in the catchment, the Murray Darling Basin (MDB) Initiative wasestablished in 1987. The Natural Resources Management Strategy that deals with the management of theriverine environment, management of irrigated and dryland regions and basin-wide issues, underpins theMDB Initiative. The riverine environment sub-programme covers three broad areas: improvements to waterquality; river flows with respect to balancing human and environmental needs and nature conservation. Asalinity and drainage strategy has been for irrigated regions. Through this strategy:
• Improved land management techniques are being introduced to minimise the amount of irrigation waterbeing added to the watertable. Through the use of new crops and more efficient irrigation technology thiswill encourage the use of land within its sustainable capacity.
• Engineering works are being constructed to intercept highly saline groundwater and pump it to suitabledisposal sites before it flows into the main river system
• New operating rules have been introduced to reduce evaporation losses from reservoirs.
In addition the MDB Initiative recognises the role of wetlands in enhancing river water quality and theFloodplain Wetland Management Strategy has been developed. This aims to maintain and where possibleenhance the floodplain wetland ecosystems. Constructed wetlands are being specifically designed to reducenutrient loads from farm runoff, sewage treatment and industrial plants and urban runoff.
Throughout Australia, ICM and the Landcare system have encouraged farmers and other rural industries towork together with government and rural communities to solve a wide range of rural problems (Campbell,1994a). The Landcare system combines elements of community and environmental education, action researchand participatory planning. More than 2000 voluntary Landcare community groups are currently workingto develop more sustainable systems of land and water use supported by a national 10-year funding program.
To be successful ICM requires basic understanding about biological, physical, chemical and socio-economicsystems and how they interact within a catchment. There is therefore a need for inputs from a wide range ofdifferent professions. Much can be learnt about the success and failure of different management interventionsfrom previous experience. By collating and analysing this experience it is possible to synthesise current “best practise” in the form of guidelines. For example, in the UK a framework has been drawn up to supportthe sustainable management of groundwater source abstractions. This provides a practical basis for strategicwater resource planning (Acreman and Adams, 1998). Similarly, the Economic and Social Commission forAsia and the Pacific have developed guidelines for land-use planning and practices in watershed managementand disaster reduction (UN, 1997). As noted in section 3.3.2, the World Commission on Dams, establishedin 1997, is presently assessing the experience with existing, new and proposed large dam projects in order
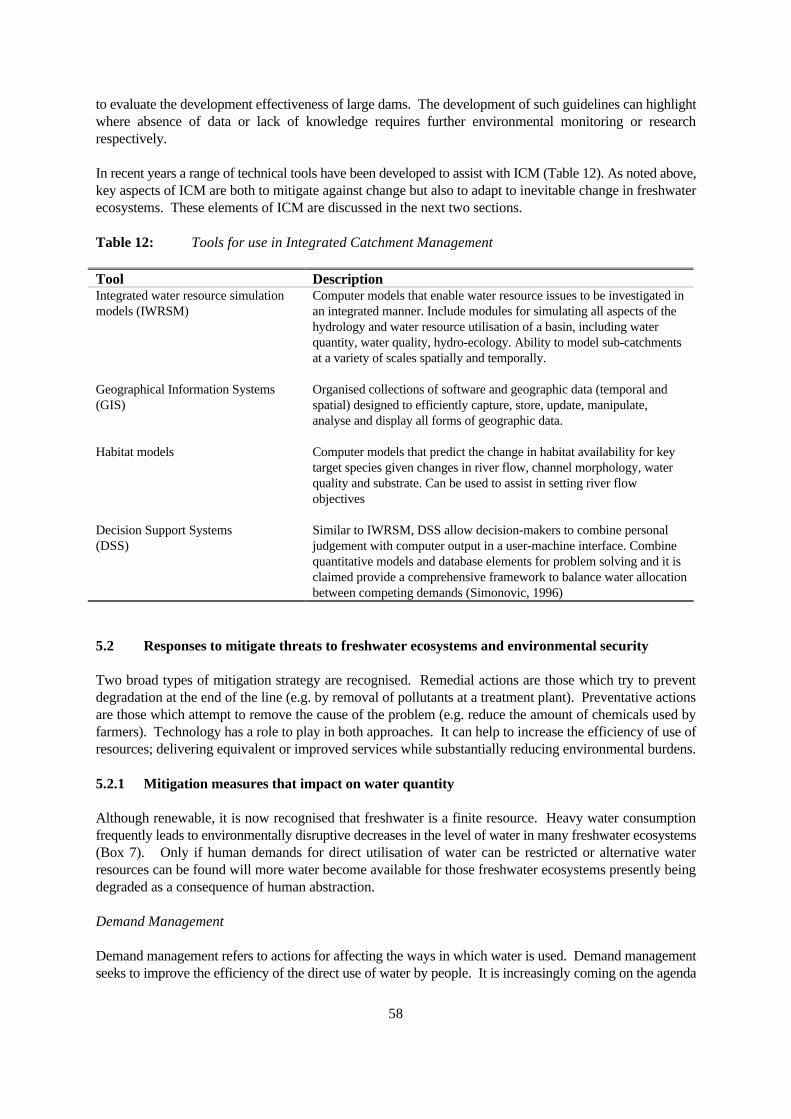
58
to evaluate the development effectiveness of large dams. The development of such guidelines can highlightwhere absence of data or lack of knowledge requires further environmental monitoring or researchrespectively.
In recent years a range of technical tools have been developed to assist with ICM (Table 12). As noted above,key aspects of ICM are both to mitigate against change but also to adapt to inevitable change in freshwaterecosystems. These elements of ICM are discussed in the next two sections.
Table 12: Tools for use in Integrated Catchment Management
Tool DescriptionIntegrated water resource simulationmodels (IWRSM)
Computer models that enable water resource issues to be investigated inan integrated manner. Include modules for simulating all aspects of thehydrology and water resource utilisation of a basin, including waterquantity, water quality, hydro-ecology. Ability to model sub-catchmentsat a variety of scales spatially and temporally.
Geographical Information Systems(GIS)
Organised collections of software and geographic data (temporal andspatial) designed to efficiently capture, store, update, manipulate,analyse and display all forms of geographic data.
Habitat models Computer models that predict the change in habitat availability for keytarget species given changes in river flow, channel morphology, waterquality and substrate. Can be used to assist in setting river flowobjectives
Decision Support Systems(DSS)
Similar to IWRSM, DSS allow decision-makers to combine personaljudgement with computer output in a user-machine interface. Combinequantitative models and database elements for problem solving and it isclaimed provide a comprehensive framework to balance water allocationbetween competing demands (Simonovic, 1996)
5.2 Responses to mitigate threats to freshwater ecosystems and environmental security
Two broad types of mitigation strategy are recognised. Remedial actions are those which try to preventdegradation at the end of the line (e.g. by removal of pollutants at a treatment plant). Preventative actionsare those which attempt to remove the cause of the problem (e.g. reduce the amount of chemicals used byfarmers). Technology has a role to play in both approaches. It can help to increase the efficiency of use ofresources; delivering equivalent or improved services while substantially reducing environmental burdens.
5.2.1 Mitigation measures that impact on water quantity
Although renewable, it is now recognised that freshwater is a finite resource. Heavy water consumptionfrequently leads to environmentally disruptive decreases in the level of water in many freshwater ecosystems(Box 7). Only if human demands for direct utilisation of water can be restricted or alternative waterresources can be found will more water become available for those freshwater ecosystems presently beingdegraded as a consequence of human abstraction.
Demand Management
Demand management refers to actions for affecting the ways in which water is used. Demand managementseeks to improve the efficiency of the direct use of water by people. It is increasingly coming on the agenda
59
in regions where concerns have arisen over water sufficiency, allocation, high costs of expanding suppliesand environmental preservation.
World-wide, irrigated agriculture is by far the greatest direct consumer of water (section 2.3). It is also theleast efficient. Traditional surface irrigation generally achieves 40% efficiency. Modern technology canimprove efficiency by improving the timing of delivery of water and by cutting the amount of water applied. Automated methods that measure soil water directly and so ensure water is applied only when crops arestressed are now available. Sprinkler irrigation can be 70 to 80% efficient and drip irrigation can reach over90% efficiency (Wolff and Stein, 1998). These methods are expensive and require significant maintenance. Consequently they are inappropriate for many regions in developing countries. However, for subsistenceagriculture, simple methods based on subsurface or pitcher irrigation have been developed (Batchelor, 1996).
Water supply and sanitation systems in many urban areas are characterised by high leakage and lowefficiencies. A great deal of water is not returned directly (treated or untreated) to the source from which itwas withdrawn. In some communities water these losses can reach 40-60%. In contrast in modern cities withcentralised water pipeline systems and relatively new sewage systems consumption does not usually exceed5-10% (Shiklomanov, 1997). These figures demonstrate that actions to improve operational efficiency andreduce leaks could make a significant impact on water demand in urban areas.
An idea closely associated with efficiency of water use is the notion of efficiency of allocation. This is theidea that water should be allocated to those sectors from which the greatest economic returns are obtained.This is strictly an economic evaluation and is discussed in more detail in the paper on economic security(Swanson and Doble, 1999).
Water recycling
Recycling refers to the capture and reuse of water prior to ejecting wastewater to ground or surface waterreceptors. Hence, recycling reduces water withdrawal requirements for a given set of final uses. For example,end-use water requirements for an industrial process may be met totally by withdrawals in a once-throughprocesses, or by lower levels of withdrawals in combination with internal recycling which captures and reuseswaste water. Similar considerations apply in the capture and reuse of water in municipal and irrigationsystems.
Domestic wastewater has been used in irrigation for over a century in some countries, including Germany.Prudent management can considerably reduce health risks. At present some 5000 km2 0.2 % of the world=sirrigated farmland is watered using wastewater. Although it is probable that this figure will increase in future,it is unlikely that it will increase above 1% of the total irrigated surface area (Wolff and Stein, 1998).
Not all industrial and domestic processes require water to be of potable standard. For example, there is noreason why water used for toilet flushing needs to be of the same quality as drinking water. The use ofrecycled grey water (i.e. wastewater that is not sewage) for non-potable uses is becoming increasinglycommon. For example, in California there are about 380 schemes and a state ordinance requires that all largenew buildings include dual plumbing (Surendran and Wheatley, 1998). The re-use of sewage is also beinginvestigated. In a new housing development in Sydney tertiary-treated and disinfected sewage effluent hasbeen connected to toilets and external taps (Mills and Asano, 1996).
Desalination
The production of new freshwater by desalinating sea water has attracted much attention in recent years. InKuwait desalination (six desalination plants with maximum capacity of 950 000 m3d-1) is the primary sourceof freshwater for drinking and domestic purposes. The quantity of desalinated water produced in Kuwait in
60
1993 was 231 million m3 (Green Cross, International, 1998). In Morocco a 10 MW nuclear power stationis being built to provide electricity for a desalination plant that will provide water for 70,000 people (George,1999).
However, at present only 0.1 % of human water-use is supplied by desalination. This is because it is energy-intensive and hence expensive. The theoretical minimum energy requirement to remove salt from water is2.8 million joules per cubic metre, but even the best desalination plants now operating use 30 times thisamount (Postel et al., 1996). Nevertheless, in recent years technological advances have caused a significantdecline in the costs of desalination. For new plants the cost is about US$ 1 m-3. In California, new plantshave become operational to desalinate brackish water at a cost of US$ 0.5 m-3. It is anticipated that improvedtechnologies in future (e.g. improved exploitation of solar energy) could reduce the costs to the extent thatdesalination becomes a relatively small component of the overall cost of urban water supply and sanitation. However, it is unlikely that desalinated water will be used extensively for irrigation in the near future.
Water harvesting
Water harvesting is the direct capture of rainfall or collection of surface runoff to use as drinking water andto water crops and livestock. In some circumstances traditional methods of harvesting water may presentopportunities for relieving water shortages in arid areas. Techniques include:
Χ the capture of rainfall draining from the roofs of buildings;Χ tanks to capture surface runoff;Χ low earth embankments built across drainage channels to divert runoff onto fields;Χ bunds constructed on fields to promote the infiltration of surface runoff.
Such practices generally do enhance the efficiency with which precipitation is used. However, whether waterharvesting measures improve the efficiency of water use in a catchment area as a whole depends on localconditions. For example, too much water retention in the upper part of a catchment can reduce the water yieldlower in the catchment creating the risk of water shortages for users downstream (Hollis, 1986).
5.2.2 Mitigation measures that impact on water quality
Human induced changes in the quality of freshwater can have very large impact on environmental security.For example, disposal of industrial wastewater and untreated sewage in the Indian city of Ludhiana hascontaminated wells with chromium and cyanide and so jeopardised future development of groundwater, theonly source of drinking water for the city (Singh, 1998). Contamination of water can also have very seriousconsequences for freshwater biota. There are various mitigation measures that improve water quality.
Wastewater treatment
Treatment of wastewater is an end-of-pipe solution to the problem of contaminated water. As mentioned insection 3.5.3 dramatic increases in environmental security were obtained in the developed world in the 1800sthrough the introduction of treatment of industrial and municipal effluent. New technologies, such as ultra-violet treatment, have been developed to improve the quality of effluents discharged to freshwaterecosystems.
In recent years the use of wetlands to passively treat polluted discharges has been widely proposed, and inplaces attempted. In the USA 300 man-made wetlands treat polluted mine discharges and the approach isbecoming increasingly used in Europe. In the UK eight systems have been installed. These wetlands aredesigned to mimic the waste assimilation and self-purification functions of natural wetlands. Such wetlands
61
are ideal in situations where chemical treatment of diffuse source pollutants is very expensive. Presently thewetlands are designed for function rather than form, but it is hoped that in future it will be possible tointegrate them as far as possible into the natural ecological systems of catchments (Younger et al., 1998).
Watershed and groundwater resource protection
Production of potable water depends on three things: watershed protection, filtration and disinfection. In thepast watershed protection, which attempts to keep pathogens and pollutants from entering the water, ratherthan killing or removing those that do, has received scant attention. Instead as new threats emerged,engineering solutions were introduced. New technologies - such as airstripping to remove volatile organicpollutants from groundwater, activated carbon filtration and ozone disinfection - were devised. However suchtreatments are very expensive and watershed protection is proposed as non-engineering alternative in somecases (Box 9).
The principle is that potentially polluting activities are prohibited or restricted in water source areas. InEurope and the USA the source protection zones may be complex and relatively large. They are often dividedinto two or three sub-zones and the most severe restrictions applied only close to the source. Strips ofvegetation along streams and around reservoirs are also important buffers in both urban and rural settings. These buffer zones demonstrably lessen the amount of pollution entering the water system. Similarly,protection around individual wells may be used to protect water abstraction points.
In developing countries community water supplies in rural areas are rarely treated but sloping concrete apronsaround wellheads to prevent spilled water leaking back into the well and the prohibition of animals from thearea immediately around a water source can significantly reduce the risk of pollution. A circular protectionzone of 50-100 m in radius can be introduced to reduce the risk of pathogenic contamination. Within thiszone pit latrines, septic tanks and other potential sources of contamination are not allowed.
Box 9: Watershed protection in New York (source: The Trust for Public Land, 1997)
New York City has set aside US$250 - 300 million for land acquisition as part of an integrated strategyto protect water supplies from pollution. The intention is to purchase some 80 000 acres of the land, moreif necessary, in order to protect water sources. Watershed regulations are also being expanded to addressthings like the construction of roads and parking lots - impervious surfaces – close to reservoirs andwatercourses; storm-water runoff; the unprotected storage of highway salt; and rigorous standards forsewage handling. Special attention is being given to septic systems of which there are 130,000 in NewYork's watershed. Many of these will be closed and strict standards set for the construction of new ones. Homes and businesses will be connected to newly constructed, city subsidised tertiary treatment plants. Total investment in the strategy is US$1.5 billion. However, by protecting the water sources that supplyNew York from pollution, the city is able to avoid constructing a water filtration plant that would cost US$6 - 8 billion and would incur annual operating costs of $300 million.
5.2.3 Habitat Protection
As demonstrated in section 5.2.2 protected areas can play a central role in developing strategies of watermanagement. People can benefit directly from the protection of downstream areas as well as catchmentheadwaters. For instance, the protection of downstream ecosystems may conserve critical fisheries,floodplain forests or pasture. Moreover, the idea of protecting natural ecosystems for no other reason than
62
that they exist is becoming an increasingly popular societal preference in developed countries. Studies haveshown that people in these countries are willing to pay simply to know that such places exist, even if they willnever visit them and they gain no direct benefits from them (Barbier et al., 1997). This suggests that oncea certain level of social and economic security is attained people seek ethical security through the protectionof near pristine environments.
Frissell and Bayles (1996) propose the establishment of watershed reserves. They argue that these reservesshould constitute a network of the best-remaining examples of relatively unaltered ecosystems and aquaticcommunities. In extensively altered landscapes they suggest that these would need to be supplemented orreplaced by the least-disrupted ecosystems that retain much of their ecological value and hold good promisefor relatively rapid and cost efficient restoration. Such a reserve network would ideally encompass aregionally representative range of terrestrial and aquatic ecosystem types and natural successional conditions,and incorporate areas that have especially high ecological integrity or natural diversity, high incidence of rareor seriously declining aquatic and riparian species and assemblages, and relatively unimpaired natural-historical catchment-wide biophysical processes and disturbance regimes”. They propose that the networkwould provide a fall-back position against uncertainties about the success of future managementmanipulations of ecosystems that are bound to have unanticipated and unforeseeable consequences. Thereserves would serve this purpose in four ways. First, they would ensure that the same mistakes would notbe made everywhere. Second, they would provide necessary and appropriately-scaled scientific controlsagainst which the ecosystem management strategies might be assessed. Third, if selected as described above,they would represent the areas where the greatest share of biotic resources can be protected with limitedresources. Finally, they would provide the best possible living models for the development of truly restorativeecosystem management on severely altered parts of the landscape.
5.3 Responses to adapt to changes in freshwater ecosystems and environmental security
ICM is supposed to be flexible and adaptive management approach. The need for development is recognisedand so adaptation strategies are a key element of ICM. The principle of “no net loss” is one that may infuture become increasingly called upon when assessing development strategies. The principle stipulates theneed for compensation for loss of ecosystems through measures to create, restore or improve a similar nearbyarea if a freshwater ecosystem is degraded or destroyed as a consequence of development. It is often a costlyoption and at present is only applicable to certain forms of freshwater ecosystem.
In this section the restoration of ecological services in altered systems and the idea of utilising biotechnologyto adapt to changes in freshwater ecosystems are discussed.
5.3.1 Restoration of ecological services
Altering operation and decommissioning dams
Reservoirs, if properly managed, meet one of the key requirements for environmental security, namely long-term sustainability. The water can be used only once and it is then necessary to wait for the next season'srainfall before refilling, thus it cannot be over exploited. However, as discussed in section 3.3.2 dams dohave negative environmental consequences. They drown the river upstream of the dam and they replace thenatural cycle of floods and low flows with a more constant flow related to downstream supply requirementsand electricity demand. These changes, in addition to destroying wildlife habitat can have seriousimplications for the environmental security of people living in the catchment.
However, setting aside some reservoir volume to mimic critical environmental flows can in part reduce thenegative aspects of dams. For example, it is now common practise to stipulate minimum compensation flows
63
in rivers in order to maintain dry season baseflows and the idea of releasing artificial flood flows (sometimestermed freshets) to inundate floodplains at critical times of year is becoming more widely promoted(Acreman, 1996). For example, on the Kafue River, control rules for the operation of the Itezhi-tezhi damstipulate that a minimum flow of 25m3s-1 must be maintained all year and a release of 300 m3s-1 must releasedfor 4 week period in March each year in order to flood the ecologically important Kafue Flats.
It is also possible for management strategies to be introduced to compensate for the truncation of sedimenttransport. For example, on the upper Rhine, gravel is added to the channel to compensate for reduced sediment transport arising as a consequence of upstream impoundments. This intention is to reduce beddegradation and maintain groundwater levels (Dister et al., 1990 - cited in Ward and Stanford, 1995). Tobe successful the preservation of freshwater ecosystems must be given high priority within whatever management strategy is adopted or else when water is scarce, dam operators will tend to use the water in wayswhich do not protect the downstream ecosystems.
An alternative to operation of dams to preserve downstream ecological functions, and one which isincreasingly being considered in the USA and Europe, is the decommissioning of dams. In 1997 the USfederal government refused to relicense an existing dam for the first time ever. The reasons given were thatthe benefits to be obtained by removal outweighed those that accrued from continued presence of the structure(Box 10). It is important to note that decommissioning dams can itself cause environmental problems. Forinstance the washing of sediments previously stored behind the dam into the river may cover fish spawningareas, damage river habitats (particularly that of species that are happier in still water) and change the shapeof the river. These problems may be compounded by the fact that the sediments are often toxic.
Box 10: Decommissioning of the Edwards dam, USA
When in 1997 the Federal Energy Regulatory Commission (FERC) in the USA ordered the removal ofthe Edwards dam (built in 1870) it cited compelling environmental considerations. The Commissionsaid its actions were based on the following key considerations:
Χ power produced at the dam can easily be replaced by existing resources in the regionΧ removal will provide 9 species of fish with continuous access to 15 miles of spawning habitatΧ removal will provide 4 species of fish that do not use fishways, with access to their entire historic
range within the Kennebec riverΧ wetland habitats, recreational boating and fishing will benefitΧ there will be no major environmental or social drawbacks
Rehabilitation and restoration of freshwater ecosystems
Restoration refers to the process by which freshwater ecosystems are returned to what is regarded as a morenatural or less disturbed state. It aims at the full or partial replacement of structural or functionalcharacteristics that have been extinguished or diminished and the substitution of alter native qualities orcharacteristics than the ones originally present with the proviso that they have more social, economic orecological value than existed in the disturbed state (Cairns, 1988). A distinction can be made betweenrestoration, which is any activity that aims to return a system to the condition it was prior to the disturbance(regardless of whether this was pristine), and rehabilitation, defined as any activity which aims to convert adegraded system to a stable alternative use which is designed to meet a particular management objective (Fridand Clark, 1999). Restoration is usually regarded as having a well defined end point (i.e. the status of thesystem before it was degraded). However, it is very rarely possible to return ecosystems to their originalcondition.
64
A key goal for science is to establish the appropriate mechanisms and the level of support required to restorefreshwater ecosystems to a desired natural or artificial state. Progress is being made in developingrelationships between hydrological change and habitat for biological indicators (Petts, 1996). These willenable evaluation of the ecological effects of change. However, although models exist (e.g. PHABSIM) theyare at present imprecise and remain largely qualitative in nature. Furthermore, even when quantitative dataare available the decisions on the acceptability of a particular ecosystem state depend largely on valuejudgements. A major challenge of restoration of freshwater ecosystems is the need to integrate scientificknowledge with those economic and social pressures that have a direct impact on the system.
Schemes for restoring or rehabilitating freshwater ecosystems will be most successful if consideration is givento the following (adapted from Wade et al., 1998):
• clear goals and objectives must be identified at the outset• schemes are adaptive and flexible• maintenance costs in the long-term are kept to a minimum• the scheme is suitable for existing climate and hydrological regime• the scheme can cope, indeed is designed for extreme events as well as average conditions• all stakeholders are included in the design process• it is recognised that schemes will not become functional instantaneously• schemes are designed for function and not form• schemes are not over-engineered, but are as natural as possible
There is a need for monitoring to determine if restoration projects are effective. Three types of monitoringhave been identified as appropriate (Kershner, 1997): implementation, effectiveness and validation.Implementation monitoring identifies whether the restoration measures are functioning as intended.Effectiveness monitoring determines if the restoration is meeting the objectives identified at the outset of thescheme. Validation monitoring is primarily a research activity, used to gather information on the basicassumptions needed to develop objectives.
5.3.2 Biotechnology
Advances in biotechnology may lead to the introduction of drought, salt and pest resistant crops therebyincreasing crop yields and allowing expansion of potentially arable land. It is likely that within the next 5to 7 years, the functions of most of the genes that are in plants will be known. With this knowledge it issurmised that it may be possible to develop transgenic plants that are more tolerant to drought and salinitystress (Panel on Biotechnology of the Water Commission on Water, 1999). In 1996, there were 7 millionacres of transgenic crops in the world. There were 31 million acres in 1997 and over 75 million acres wereplanted in 1998. If this trend continues rain-fed agriculture may provide the most effective way to expandfood production on a global scale with a consequent decrease in projected irrigation withdrawals.
Although biotechnology options have potential there remain two significant problems. First, despitenumerous studies conducted there is still only limited knowledge of the physiological, biochemical and geneticdeterminants of stress in plants and a great deal more understanding is required before DNA modificationcan be used to manipulate water and salinity stress resistance. Second, recent events in Europe suggest thatbiotechnology is treated with suspicion and it may be that genetically modified organisms are unacceptableto some societies.
5.4 Synthesis: impediments to future strategies
65
In the past improvement in environmental security in the developed world has been dependent to a largeextent on the application of technology. Existing and new technologies will have a role to play in increasingenvironmental security in the future. However, it is now widely recognised that whilst freshwater managementhas traditionally been governed by “supply side planning” or utilisation of engineering solutions to managethe resource to meet levels of projected, and often unregulated demand, such an approach is not sustainablein the long-term. ICM, a new approach based on the ethic of ecosystem management, is now being widelypromoted.
The environmental security indicators presented in section 3.5 indicate that priorities in the developed anddeveloping world are very different. In developing countries the emphasis must be on elementaryenvironmental care mostly oriented to meeting the basic water supply, housing and waste disposal needs. Inthe developed world the emphasis must be on protecting the few remaining near-pristine freshwaterecosystems, ameliorating the impact of existing development and introducing management strategies torestore degraded ecosystems. Although the priorities are different, the basic doctrine proposed within theconcept of ICM applies to both developed and developing countries.
There are at present considerable technical difficulties to the practical application of ICM principles. Thesecan be summarised as follows:
• Successful ICM schemes are dependent on understanding the cause and effect linkages between land-usepatterns, hydrological regime and biotic response. To a large extent these relationships are notunderstood. There is a need for increased research to develop quantitative useable relationships betweenthese three components of freshwater ecosystems.
• There is a great deal of potential for societies to improve the efficiency of direct use of water. However,the interest in demand-side management is new and the required database for analysing water usepatterns in detail in order to formulate sound demand management programs are in many places sparse.
• Monitoring programs are important in ICM because management strategies must be adaptable. However,such “effectiveness” monitoring is time consuming and costly. Many current monitoring programs areinadequate, for a variety of reasons, and do not provide information that is useful for ICM.
• Successful ICM strategies must integrate environmental, social and economic factors. However, there arevery few practical methods for directly linking these different aspects of freshwater ecosystems.
• Good scientific analyses often make decision making more difficult because it highlights criticaluncertainties arising from the complexities of ecology and the history of human interventions.Consequently, it is not clear how science should be incorporated within the decision-making process.
Overcoming these impediments is essential if ICM is to provide a basis for freshwater ecosystemmanagement and the enhancement of environmental security in the next century.
66
6. Final Statement
Freshwater ecosystems are inherently complex, comprising many interdependent components. History hasshown that human activities undertaken without full consideration of the social, environmental and economicimplications can, and do, have adverse repercussions. Management practices that respond to a single wateruse, a single population segment, or a single sector have caused inadvertent disruption to ecological functionsand resulted in a net loss of environmental security. Comprehensive management strategies that recognisethe interdependencies existing within freshwater ecosystems are required in order to maximise benefitsaccrued to society and so increase environmental security.
Ecosystem management represents an ill-defined basis for resource management. To be technically crediblethe term must be defined in much narrower policy and scientific terms. Nevertheless, it does provide a validwater ethic on which freshwater management can be founded. As we approach the 21st century, the mainchallenge is to put the general principles of ecosystem management into practice. It is suggested that themulti-objective goals relating to society, economics and the environment can be integrated within catchmentmanagement strategies, but many problems remain in deriving practical approaches to doing this.
It is clear from the analysis presented in this document that environmental security issues are multiple andcomplex. Environmental degradation and resource depletion creates or exacerbates human insecurity. Currently, the environmental security problems in developing countries are very different to those of thedeveloped world. In developing countries the future emphasis must be on elementary environmental caremostly oriented to meeting the basic water supply, housing and waste disposal needs. Appropriate technicalsolutions exist and have a crucial role to play in increasing security in these countries. In the developedworld, high levels of social and economic security have been obtained through application of complextechnologies and considerable alteration of natural ecosystems. These societies are now sufficientlyprosperous that they can contemplate a large range of possible options on the way they manage freshwaterecosystems. In these countries societies are placing greater value on the indirect benefits of near-naturalfreshwater ecosystems, to the extent that costly rehabilitation schemes and the establishment of reserves, thatprovide no direct benefits are being increasingly implemented.
In both developing and developed countries successful management of freshwater ecosystems requires anintegrated approach drawing upon the expertise of multi-disciplinary teams. Much can be learnt from localresource management based on traditional practise. Although there are limitations, nevertheless rivercatchments provide the most logical, easily identifiable hydro-geomorphologic unit on which to basemanagement strategies. ICM has been developed to provide a framework for action. Management strategiesmust be adaptable and flexible to meet constantly changing environmental conditions and human demands. As this paper has illustrated, ingenious solutions are often required to solve complex problems. Scientificand socio-economic monitoring is essential to further understanding of cause and effect relationships bothwithin the natural environment and in human interactions with the natural environment.
In summary, increasing environmental security requires that:
Χ Issues of environmental change and security are dealt with holistically. Management strategies mustbe conceived, designed and implemented with a clear appreciation of the interconnectedness ofpoverty, environmental change and security.
Χ Management strategies satisfy both immediate and long-term needs.Χ Research findings are used to provide an analytical perspective of problems, guide policy-making
and inform assessments of management interventions.Χ Resources are directed towards identifying vulnerable geographical regions and sectors of society
and promoting adaptation and resilience in both.Χ The impediments to ICM summarised in section 5.4 are overcome.
67
Issues for discussion at the workshop
The objective of the San Jose workshop is to develop practical strategies that move towards the visionprovided in the sustainable water world scenario. Box 11 lists a number of issues that might be discussedat the workshop:
Box 11: Issues for discussion
Χ Biodiversity is sometimes a benefit and sometimes a constraint on human development. How do weassess when it is acceptable to sacrifice biodiversity and when should it be retained? Is this simplya question of societal preference ?
Χ Should environmental security (i.e. protection of the environment for human benefit) and ethicalsecurity (i.e. a moral duty to protect the environment from human interference) be treated as separateissues ? The distinction between the two has perhaps been blurred by conservationists but surelythey are quite separate.
Χ Is it the case that at present, planning for ecosystem management remains largely focussed ondefining how and where traditional resource extraction activities and environmental disruption canbe continued without irreversible damage to water quality, biodiversity and other ecosystem values? As such is it simply a search for the last free lunch ? Is something more required ?
Χ Is it the case that attempts to meet multiple conflicting and changing needs simply result in continualcompromise and gradual degradation of natural ecosystems ?
Χ Is it true that all very artificial freshwater ecosystems are non-sustainable over the long-term, despiteour best management efforts ?
Χ Is it necessary to do more than integrate water and land-use ? Should the idea of water managementas a legitimate land-use (i.e. as in the case of New York ?) be more widely promoted?
Χ What are the tools necessary to effectively implement freshwater ecosystem management so as tomaintain and/or enhance environmental security ?
Χ Recognising that it is impossible to know everything about the structure and functioning of anecosystem, is it possible to define what we must know in order to effectively manage them tomaintain and/or enhance environmental security ?
68
References
Abramovitz, J.N. 1996. Imperiled waters, impoverished future: the decline of freshwater ecosysytem. WorldWatch Paper 128. 80 pp.
Acreman, M.C. 1996. Environmental effects of hydroelectric power generation in Africa and the potentialfor artificial floods. J. CIWEM 10, 429-435.
Acreman, M.C. and Adams, B. 1998. Low flows, groundwater and wetland interactions. Institute ofHydrology and British geological Survey.
Armentano, T.V. and Verhoeven, 1988. The contribution of freshwater wetlands to the global biogeochemicalcycles of carbon, nitrogen and sulphur. In: Wetlands and Shallow Water Bodies, Vol 1, SPB Academic, TheHague, The Netherlands 101-134.
Barbier, E.B. and Thompson, J.R. 1998. The value of water: floodplain versus large-scale irrigation benefitsin Northern Nigeria. Ambio, 27 (6) 434-440.
Barbier, E.B., Acreman, M. and Knowler, D. 1997. Economic valuation of wetlands: a guide for polcymakers and planners. Ramsar Convention Bureau, Gland Switzerland. 127 pp.
Batchelor, C., Lovell, C. and Murata, M. 1996. Simple micro-irrigation techniques for improving efficiencyon vegetable gardens. Agricultural Water Management 32 37-48
Berkes, F., Folke, C. and Colding, J. 1998. Linking Social and Ecological Systems: management practicesand social mechnaisms for building resilience. Cambridge University Press. 440 pp.
Bergkamp, G., Acreman, M., Safford, L. and Matiza, T. 1998. Maintaining functioning ecosystems: the keyto sustainable management of water resources. UN Commission on sustainable development - expert groupon strategic approaches to freshwater management. Harare 27-30 January 1998.
Brown, M.B., Roca, I, vallejo, A., Ford, G, Casey, J., Aguilar, B. and Haacker, R. 1996. A valuation analysisof the role of cloud forests in watershed protection. 134 pp.
Cairns, J. 1986. Restoration, reclamation and regeneration of degraded and destroyed ecosystems. In: Soule,M.E. (Editor) Conservation Biology, Sinauer Associates, Sunderland, MA.
Chatterjee, P. 1998. Dam busting. New Scientist 34-37.
DIFD, 1997. Integrated Water Resource Management in Southern Africa: an overview of relevant UKsupported research. Water Resources Occasional paper No. 4.
Dister, E., Gomer, D. Orbdlik, P. Petermann, P. and Schneider, E. 1990. Water management and ecologicalpersepectives of the upper Rhine=s floodplains. Regulated Rivers 5 1-15.
DVL/OS, 1997. Developments in Sustainability. The Netherlands, Ministry of Foreign Affairs. 96 pp.
Engelman, R. and Leroy, P. 1993. Sustaining water: population and the future of renewable water supplies. Population and Environment Program. Population Action International. 56 pp.
69
Falkenmark, M. and Lundqvist, J. 1998. Towards water security: political determination and humanadaptation crucial. Natural Resources Forum 22 (1) 12-28.
Fitzsimmons, A.K. 1996. Sound policy or smoke and mirrors: does ecosystem management make sense ?Water Resources Bulletin 32 (2) 217-227.
Frid, C.L.J. and Clark, S. 1999. Restoring aquatic ecosystems: an overview. Aquatic conservation: marineand freshwater ecosystems, 9 1-4.
Frissell, C.A. and Bayles, D. 1996. Ecosystem management and the conservation of aquatic biodiversity andecological integrity. Water Resources Bulletin, 32 (2) 229-240.
Gash, J.H.C., Nobre, C.A., Roberts, J.M. and Victoria, R.L. (Editors) 1996. Amazonian deforestation andclimate. John Wiley and Sons, Chichester 611 pp.
Gleick, P.H. 1998. The World=s Water 1998-1999: the biennial report on freshwater resources. IslandPress, Washington, D.C. USA. 308 pp.
Gleick, P.H. (Editor) 1993. Water in Crisis: A Guide to the World=s Fresh Water Resources. OxfordUniversity Press, New York, 25-39.
George, A. 1999. Morocco signs nuclear desal deal. Water and Environment, 8 (57) 19.
Gosselink, J.G., Sasser, C.E., Creasman, L.A., Hamilton, S.C., Swenson, E.M. and Shaffer, G.P. 1990.Ecological Processes and Cumulative Impacts: illustrated by bottomland hardwood wetlands ecosystems.Lewis Publishers, Chelsea. 78 pp.
Graeger, N. 1996. Environmental Security. Journal of Peace Research 33 (1) 109-116.
Green Cross International, 1998. An envirnmental assessment of Kuwait seven years after the Gulf War. 117pp.
Hollis, G.E., Adams, W.M. and Kano, M.A. (Editors) 1993. The Hadejia-Nguru Wetlands: environment,economy and sustainable development of a Sahelian floodplain wetland. IUCN, Gland, Switzerland 244 pp.
Hollis, G.E. 1986. The modelling and management of the internationally important wetland at Garaet ElIchkeul, Tunisia. International Waterfowl Research Bureau Special Publication (4) 120 pp.
Homer Dixon, T.F. 1995. The igenuity gap: can poor countries adapt to resource scarcity ? Population andDevelopment Review 21 (3) 587-612.
Homer-Dixon, T.F. 1994. Environmental scarcities and violent conflict: evidence from cases. InternationalSecurity 19 (1) 5-40.
Horrill, J.C. 1993. Marine wetland interactions and policy in Tanzania. In: Kamukala, G.L. and Crafter, S.A.(eds) Wetlands of Tanzania. Proceedings of a Seminar on the Wetlands of Tanzania, Morogoro, Tanzania,27-29 November, 1991. 125-137.
Hussain, Z. 1993. The Mekong: Indochina=s River of Life. IUCN Bulletin 2/93: 19.
70
Intergovernmental Panel on Cliimate Change, 1996. Climate Change 1995: impacts adaptations andmitigation of climate change. Cambridge University Press.
IUCN 1997. Large dams: learning from the past, looking at the future. IUCN, Gland, Switzerland andCambridge, UK and the World Bank Group, Washington, DC v. + 145 pp.
IUCN 1996.Red list of threatened animals. IUCN. Gland, Switzerland.
IUCN, UNEP, WWF, 1991. Caring for the Earth.. A strategy for sustainable living. Gland, Switzerland228 pp.
Jensen, M.E., Bourgeron, P., Everett, R. And Goodman, I. 1996. Ecosystem management: a landscapeecology perspective. Water Resources Bulletin. 32 (2) 203-216.
Kershner, J.L. 1997. Setting riparian/aquatic restoration objectives within a watershed context. RestorationEcology 5, 15-24.
Lackey, R.T. 1998. Seven pillars of ecosystem management. Landscape and urban planning (in press).
Lanly, J.P. 1982. Tropical Forest resources. FAO Forestry paper, 30, FAO, Rome.
Lanz, K. 1995. The Greepeace Book of Water. Cameron Books, Dumfriesshire, Scotland pp. 165.
Lean, J. And Warrilow, D. 1989. Simulation of the regional impact of Amazon deforestation. Nature 342411-413.
Löffler, H. 1990. Danube backwaters and their response to anthropogenic alteration. In: Whigham, D.F.,Good, R.E. and Kvet, J. (Editors) Wetland Ecology and Management: Case Studies. Kluwer, Dordrecht 127-130.
Maltby, E. Immirizi, C.P. and McLaren, D.P. 1992. Do not disturb ! Peat bogs and the greenhouse effect.Friends of the Earth 54 pp.
Maltby, E., Mockler, N. and McInnes, R. 1996. Denitrification rates in river marginal wetlands and bufferzone management. In: Hydrologie dans les pays celtiques. Rennes France, 8-11 Juillet 1996. 293-303.
McCully, P. 1996. Silenced Rivers: the ecology and politics of large dams. Zed Books, London 350 pp.
McIntire, P.E., Edenborn, M.H. and Hammack, R.W. 1990. Incorporation of bacterial sulfate reduction intoconstructed wetlands for the treatment of acid and metal mine drainage National Symposium on Mining,Knoxville, Tenessee 1990. 207-213.
McNeely, J.A., Miller, K.R., Reid, W.V., Mittermeier, R.A. and Werner, T.B. 1990. Conserving the World=sBiological Diversity. IUCN, Gland, Switzerland. 191 pp.
Meigh, J.R., McKenzie, A.A., Austin, B.N., Bradford, R.B and Reynard, N.S. 1998. Assessment of globalwater resources - phase II. Estimates of present and future water availability for eastern and Southern Africa.Institute of Hydrology . DFID report 98/4. 55 pp.
Meynell, P.J. and Qureshi, M.T. 1993. Sustainable management of mangroves in the Indus Delta, PakistanIn: Davis, T.J. Towards the Wise Use of Wetlands: Report of the Ramsar Convention Wise Use Project
71
113-122.Miller, J.B. 1997. Floods: people at risk, strategies for prevention. United Nations, New York. 93 pp.
Mills, R.A. and Asano, T.A. 1996. A retrospective assessment of water reclaimation projects. Wat. Sci.Technol. 33, 59.
Newson, M. 1992. Land, water and development. Routledge, London. 351 pp.
Norton, B.G. 1992. A new paradigm for environmental management In: Costanza, R., Norton, B.G andHaskell, B.D. (Editors) Ecosystem Health Island Press, Washington D.C. 23-41.
OECD, 1999. Towards sustainable development: environmental indicators.
Page, T. 1997. Introduction In: Schwartz, D. Delta: the perils profits and politics of water in South andSouth East Asia Thames and Hudson.
Panel on Biotechnology of the World Commission on Water for the 21st Century, 1999. Biotechnology andWater Security in the 21st Century. 19 pp.
Petts, G.E. 1996. Water allocation to protect river ecosystems. Regulated Rivers: Research andManagement, 12, 353-365
Pirot, J,Y. and Meynell, P.J. 1998. Ecosystem management: lessons from around the world. IUCN, Gland,Switzerland. 90 pp.
Postel, S.L., Daily, G.C. and Ehrlich, 1996. Human appropriation of renewable fresh water. Science 192,785-788.
Postel, S.L., 1996. Dividing the Waters: food security, ecosystem health and the new politics of scarcity.Worldwatch paper 132. 78 pp.
Raskin, P., Hansen, E., and Margolis, R. 1995. Water and sustainability: a global outlook. Polestar Seriesreport no. 4. Stockholm Environment Institute. 66 pp.
Raskin, P., Gleick, P., Kirshen, P., Pontius, G. And Strezpek, K. 1996. Comprehensive assessment of thefreshwater resources of the world. Water futures: assessment of long-range patterns and problems.Stockholm Enviroment Institute. 77 pp.
Roy, A. 1999. Lies, dams and statistics. The Guardian 05/06/99.
Sahagian, D. and Melack, J. (Editors) 1996. Global wetland distribution and functional characterization:tracegases and the hydrologic cycle. IGBP Report 46, Stockholm, Sweden. 92 pp.
Sale, K. 1992. The conquest of paradise. Pan Macmillan Publishers 453 pp.
Sandström, K. 1998. Can forests provide water: widespread myth or scientific reallity ? Ambio 27 (2) 132-138.
Sather, J.M. and Smith, R.D. 1984. An overview of major wetland functions and values. Report for the USFsh and Wildlife Services, FWS/OBS- 84/18 68 pp.Serageldin, I. 1999. Looking ahead: water, life and the environment in the twenty-first century. Water
72
Resources Development 15 (1/2) 17-28.
SIDA, 1995. Water and security in Southern Africa. Publications on Water Resources No.1, Department forNatural Resources and the Environment, Swedish International Development Cooperation, Agency (SIDA).
Shiklomanov, I.A. (Editor) 1997. Assessment of Water Resources and Water Availability in the World.Comprehensive Assessment of the Freshwater Resources of the World. Stockholm Environment Institute,Stockholm.
Shukla, J., Nobre, C. and Sellers, P. 1990. Amazon deforestion and climate change. Science 247, 1322-1325.
Simonovic, S.P. 1996. Decision support systems for sustainable management of water resources: 1. Generalprinciples. Water International, 21, 223-232.
Singh, K.P. 1998. Groundwater pollution and risks in developing new groundwater supplies in the Ludhianaarea, Punjab, India. In: Wheater, H. and Kirby, C. Hydrology in a Changing Environment Vol II. John Wileyand Sons, Chichester, UK. 89-95.
Soussan, J., Emmel, N. and Howorth, C. 1999. Freshwater ecosystems management and social security. http://www.waterandnature.org/english/WaterAndNature/index_documents.html 53 pp.
Surendran, S. and Wheatley, A.D. 1998. Grey water reclaimation for non-potable re-use. Journal of theChartered Institution of Water and Environmental Management. 12 (6) 406-413.
Swanson, T, and Doble C. 1999. Freshwater ecosystems management and economic security.http://www.waterandnature.org/english/WaterAndNature/index_documents.html 59 pp.
The Economist, 1998. China: Precipitation problems. 26th September, 1998. 71-72
The Trust for Public Land, 1997. Protecting the Source: land conservation and the future of America=sdrinking water. San Fransisco, CA. 28 pp.
Tiner, R.W 1984. Wetlands of the United States: current status and trends. U.S. Fish and Wildlife Services,Washington, D.C.
Tollan, A. 1992. The ecosystem management approach to water management. ????? Bulletin 4 (1) 28-34.
United Nations, 1997. Guidelines and manual on land-use planning and practices in watershedmanagement and disaster reduction. 133 pp.
United Nations Children=s Fund (UNICEF), 1996. The Progress of Nations, New York.
United Nations Environment Programme (UNEP), 1991. Freshwater Pollution. UNEP, Nairobi 36 pp.
United States Environmental Protect Agency (U.S. EPA) 1995. National Water Quality Inventory, 1994Report to Congress. Report No. EPA. 841-R-95-005. Wshington, D.C. 114-115.
Wade, P.M., Large, A.R.G. and de Waal, L.C. 1998. Rehabilitation of degraded river habitat: an introductionIn Wade, P.M., Large, A.R.G. and de Waal, L.C. (Editors) Rehabilitation of Rivers: Principles andImplementation. 1-9.
73
Ward, J.V. and Stanford, J.A. 1995. Ecological connectivity in alluvial river ecosystems and its disruptionby flow regulation. Regulated Rivers:Research and Management, 11, 105-119
Water Resources Institute, United Nations Environment Programme, United Nations DevelopmentProgramme and the World Bank 1998. World Resources. Oxford University Press, New York. 369 pp.
White House Interagency Ecosystem Management Task Force, 1995. The Ecosystem Approach: healthyEcosystems and Sustainable Economies. White House, Washington D.C. 55 pp.
Whitlow, J.R. 1984. A survey of dambos in Zimbabwe. Zimb, Agric. J. 81, 129-138.
Wolff, P. and Stein, T.M. 1998. Water efficiency and conservation in agriculture - opportunities andlimitations. Agriculture and Rural Development 17-20.
World Health Organisation 1995. Community Water Supply and sanitation: needs, challenges and healthobjectives. 48th World Health Assembly, A48/INF.DOC./2, 28 April, Geneva, Switzerland.
World Meteorological Organisation 1997. Comprehensive assessment of the freshwater resources of theworld. 33 pp.
Younger, P.L., Large, A.R.G. and Jarvis, A.P. 1998. The creation of floodplain wetlands to passively treatpolluted minewaters. In: Wheater, H. and Kirby, C. (Editors) Hydrology in a changing environment. 1, 495-502.
Zaletaev, V.S. 1995. Extreme events in biocomplexes of Amu-Darya and Syr-Darya flooplains and deltasas elements of the Aral Sea ecological crisis. Proceeding BHS 5th National Hydrology Symposium,Edinburugh. 9.37-9.40.
74
Glossary
Aquifer: Porous rock containing water
Catchment: Used synonomously with watershed, river basin or drainage area. It is the unit of land fromwhich water flows downhill to a specified point on a watercourse. It is determined by topographical featureswhich include a surrounding boundary or perimeter known as a drainage divide or catchment boundary.
Connectedness: A general term for the cohesiveness of a system. Systems with strong interaction arerelatively highly connected, as are systems with a large number of the parts interconnected.
Connectivity: A measure of the degree of connectedness of a system
Degraded ecosystem: An ecosystem that has lost some or all of its direct or indirect value to human society.
Ecosystem: A discrete entity that consists of living and non-living parts, interacting to form a stable unit.
Ecosystem management: deliberate and conscious manipulation of ecosystem structure and/or function, orregulation of human uses of ecological systems, so as to retain defined and desired features and processes,and to meet human needs in an optimal and sustainable way.
Environmental Security: A means of achieving long-term social, economic and ethical security through:i) the sustainable utilisation of renewable resources and ecosystem functions; ii) protection from naturalhazards and iii) conservation of other species.
Integrated Catchment Management (ICM): The co-ordinated planning and management of the waterresources of a river basin considering its interaction with land and other environmental resources for theirequitable, efficient and sustainable use at a range of scales from local to catchment level.
Integrity: The continuity of a complex and the totality of its locations within some order.
Robustness: The property of remaining unchanged even under the influence of new forces, new data or newperspectives of observation.
Resilience: A measure of the magnitude or scale of disturbance that can be absorbed before a system changesin structure by the change of variables or processes that control system behaviour. Resilience in this contextis a measure of robustness and buffering capacity of the system to changing conditions.
Rehabilitation: The conversion of a degraded ecosystem to a stable alternative use, designed to meet aparticular management objective.
Restoration: The conversion of an ecosystem to the condition it was in prior to anthropogenic disturbance.