Embed Size (px)
Citation preview
Proceedings of ACOUSTICS 2016 9-11 November 2016, Brisbane, Australia
ACOUSTICS 2016 Page 1 of 10
Fresnel Zones and Spheroids for Room Acoustics
James Heddle
James Heddle Acoustical Consultants, Brisbane, Australia
ABSTRACT The concept of Fresnel Zones arises from considering reflection paths off a surface differing from the direct sound
propagation path by some multiple of half a wavelength. The modelling of these zones, and of zones derived using a set
time delay, provides useful insights for the design of spaces for listening and communication. This paper gives an
overview of analysis using this approach together with some examples and is intended as a companion paper to
(Heddle,2016a).
1. FRESNEL ZONE THEORY The Huygens-Fresnel Principle (HFP) states that every unobstructed point of a wave front, at a given instant,
serves as a source of spherical secondary wavelets (with the same frequency as that of the primary wave). The
amplitude of the sound field at any point beyond is the superposition of all these wavelets (considering their
amplitudes, directivity and relative phases).
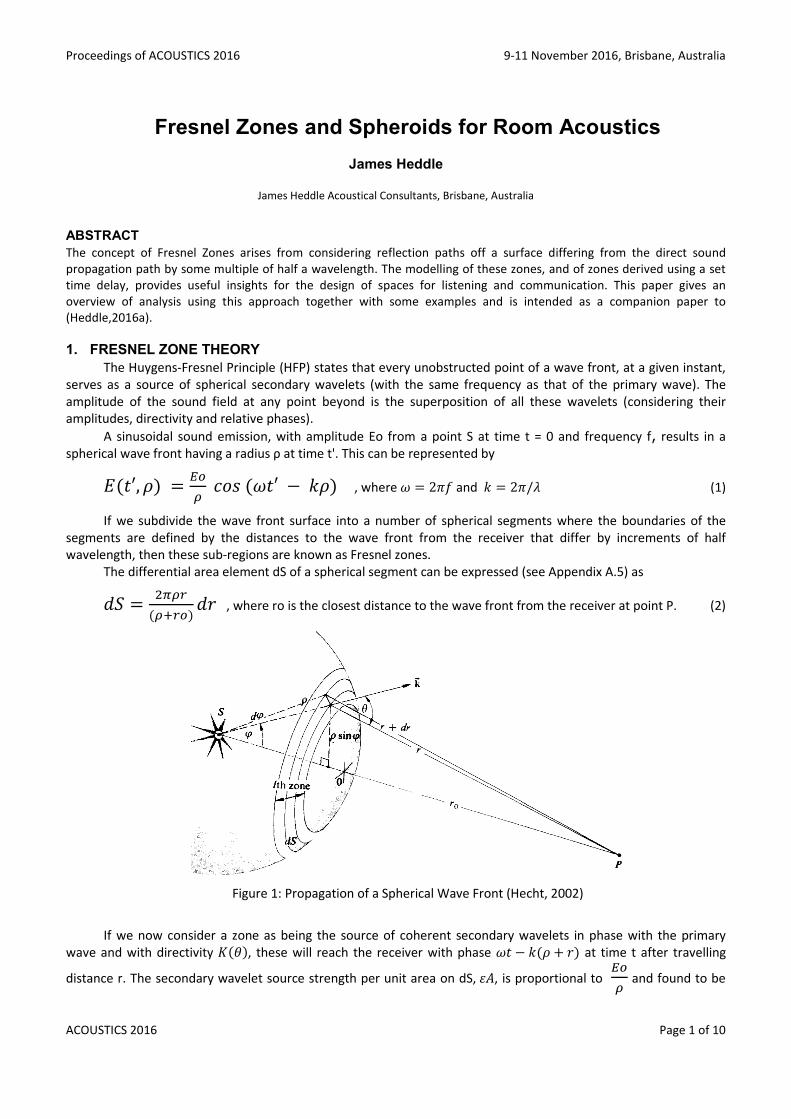
A sinusoidal sound emission, with amplitude Eo from a point S at time t = 0 and frequency f, results in a
spherical wave front having a radius ρ at time t'. This can be represented by
�(�′, �) = �� ��(��′ − ��) , where � = 2�� and � = 2�/� (1)
If we subdivide the wave front surface into a number of spherical segments where the boundaries of the
segments are defined by the distances to the wave front from the receiver that differ by increments of half
wavelength, then these sub-regions are known as Fresnel zones.
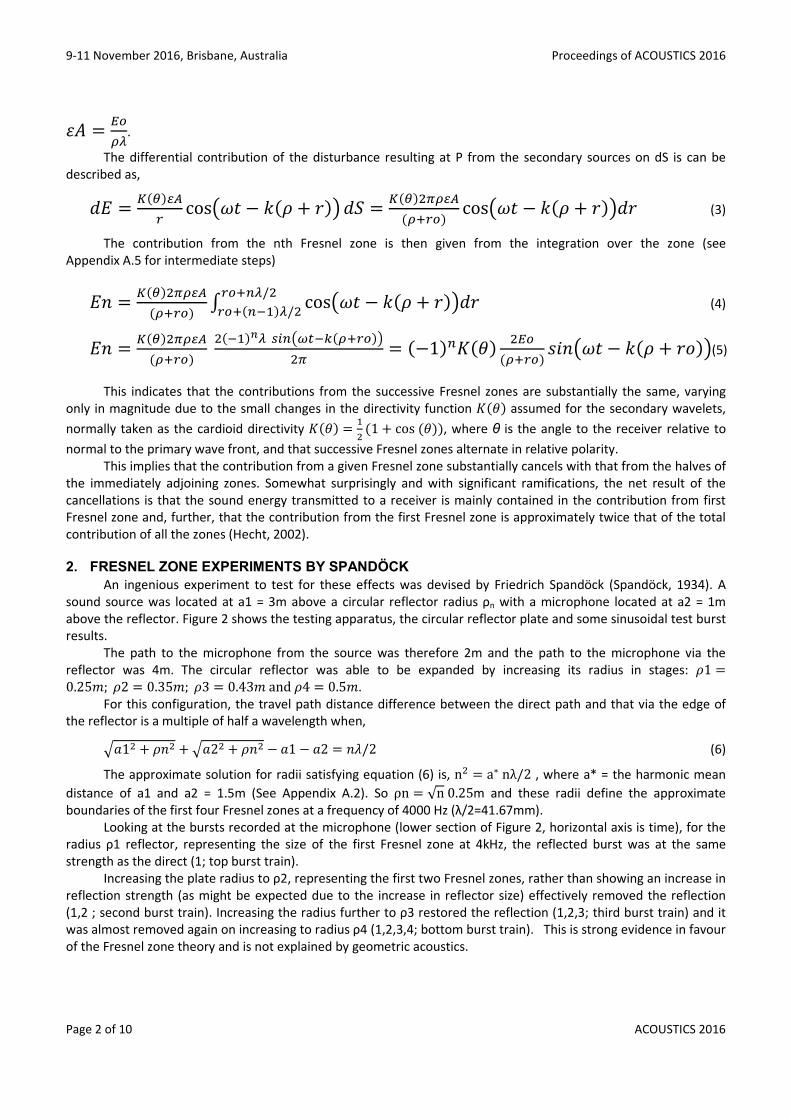
The differential area element dS of a spherical segment can be expressed (see Appendix A.5) as
�� = ����(����)�� , where ro is the closest distance to the wave front from the receiver at point P. (2)
Figure 1: Propagation of a Spherical Wave Front (Hecht, 2002)
If we now consider a zone as being the source of coherent secondary wavelets in phase with the primary
wave and with directivity �( ), these will reach the receiver with phase �� − �(� + �) at time t after travelling
distance r. The secondary wavelet source strength per unit area on dS,"#, is proportional to �� and found to be
9-11 November 2016, Brisbane, Australia Proceedings of ACOUSTICS 2016
Page 2 of 10 ACOUSTICS 2016
"# = ��$.
The differential contribution of the disturbance resulting at P from the secondary sources on dS is can be
described as,
�� = %(&)'(� cos,�� − �(� + �)-�� = %(&)���'(
(����) cos,�� − �(� + �)-�� (3)
The contribution from the nth Fresnel zone is then given from the integration over the zone (see
Appendix A.5 for intermediate steps)
�. = %(&)���'((����) / cos,�� − �(� + �)-�����0$/�
���(012)$/� (4)
�. = %(&)���'((����) �(12)3$ 450,6718(����)-�� = (−1)0�( ) ��
(����) �:.,�� − �(� + ��)-(5)
This indicates that the contributions from the successive Fresnel zones are substantially the same, varying
only in magnitude due to the small changes in the directivity function �( ) assumed for the secondary wavelets,
normally taken as the cardioid directivity �( ) = 2� (1 + cos( )), where θ is the angle to the receiver relative to
normal to the primary wave front, and that successive Fresnel zones alternate in relative polarity.
This implies that the contribution from a given Fresnel zone substantially cancels with that from the halves of
the immediately adjoining zones. Somewhat surprisingly and with significant ramifications, the net result of the
cancellations is that the sound energy transmitted to a receiver is mainly contained in the contribution from first
Fresnel zone and, further, that the contribution from the first Fresnel zone is approximately twice that of the total
contribution of all the zones (Hecht, 2002).
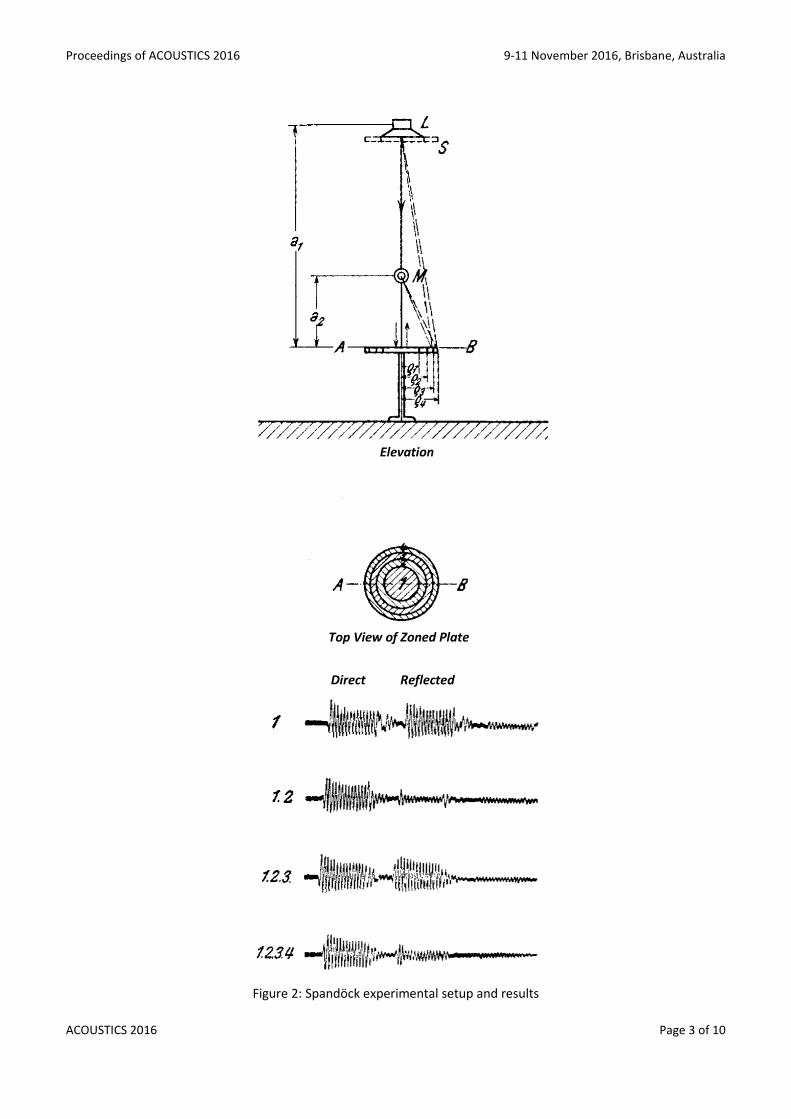
2. FRESNEL ZONE EXPERIMENTS BY SPANDÖCK An ingenious experiment to test for these effects was devised by Friedrich Spandöck (Spandöck, 1934). A
sound source was located at a1 = 3m above a circular reflector radius ρn with a microphone located at a2 = 1m
above the reflector. Figure 2 shows the testing apparatus, the circular reflector plate and some sinusoidal test burst
results.
The path to the microphone from the source was therefore 2m and the path to the microphone via the
reflector was 4m. The circular reflector was able to be expanded by increasing its radius in stages: �1 =0.25>; �2 = 0.35>; �3 = 0.43>and�4 = 0.5>.
For this configuration, the travel path distance difference between the direct path and that via the edge of
the reflector is a multiple of half a wavelength when,
EF1� + �.� +EF2� + �.� − F1 − F2 = .�/2 (6)
The approximate solution for radii satisfying equation (6) is, n� = a∗nλ/2 , where a* = the harmonic mean
distance of a1 and a2 = 1.5m (See Appendix A.2). So ρn = √n0.25m and these radii define the approximate
boundaries of the first four Fresnel zones at a frequency of 4000 Hz (λ/2=41.67mm).
Looking at the bursts recorded at the microphone (lower section of Figure 2, horizontal axis is time), for the
radius ρ1 reflector, representing the size of the first Fresnel zone at 4kHz, the reflected burst was at the same
strength as the direct (1; top burst train).
Increasing the plate radius to ρ2, representing the first two Fresnel zones, rather than showing an increase in
reflection strength (as might be expected due to the increase in reflector size) effectively removed the reflection
(1,2 ; second burst train). Increasing the radius further to ρ3 restored the reflection (1,2,3; third burst train) and it
was almost removed again on increasing to radius ρ4 (1,2,3,4; bottom burst train). This is strong evidence in favour
of the Fresnel zone theory and is not explained by geometric acoustics.
Proceedings of ACOUSTICS 2016 9-11 November 2016, Brisbane, Australia
ACOUSTICS 2016 Page 3 of 10
Figure 2: Spandöck experimental setup and results
Direct Reflected
Elevation
Top View of Zoned Plate
9-11 November 2016, Brisbane, Australia Proceedings of ACOUSTICS 2016
Page 4 of 10 ACOUSTICS 2016
Since the travel path distance via the reflector to the microphone was twice that of the direct path from the
source, it would be expected that the reflected level would be half the amplitude of the direct sound level.
However, as noted above, it was equivalent to the direct level. This also supports the predictions of the HFP.
3. EXTENSION TO SPHEROIDS There are multiple combinations of source to reflector and reflector to receiver paths that result in a half
wavelength path length difference relative to the direct path. These combinations describe an ellipse with foci at
the source and receiver locations. We can rotate this ellipse to form an ellipsoid that is circular about the direct axis,
a spheroid, and we can describe a set of spheroids with half-wavelength differences in size. It should be noted that
the spheroid surface also describes all reflection paths representing a particular delay of the reflected sound
relative to the direct path between the source and receiver.
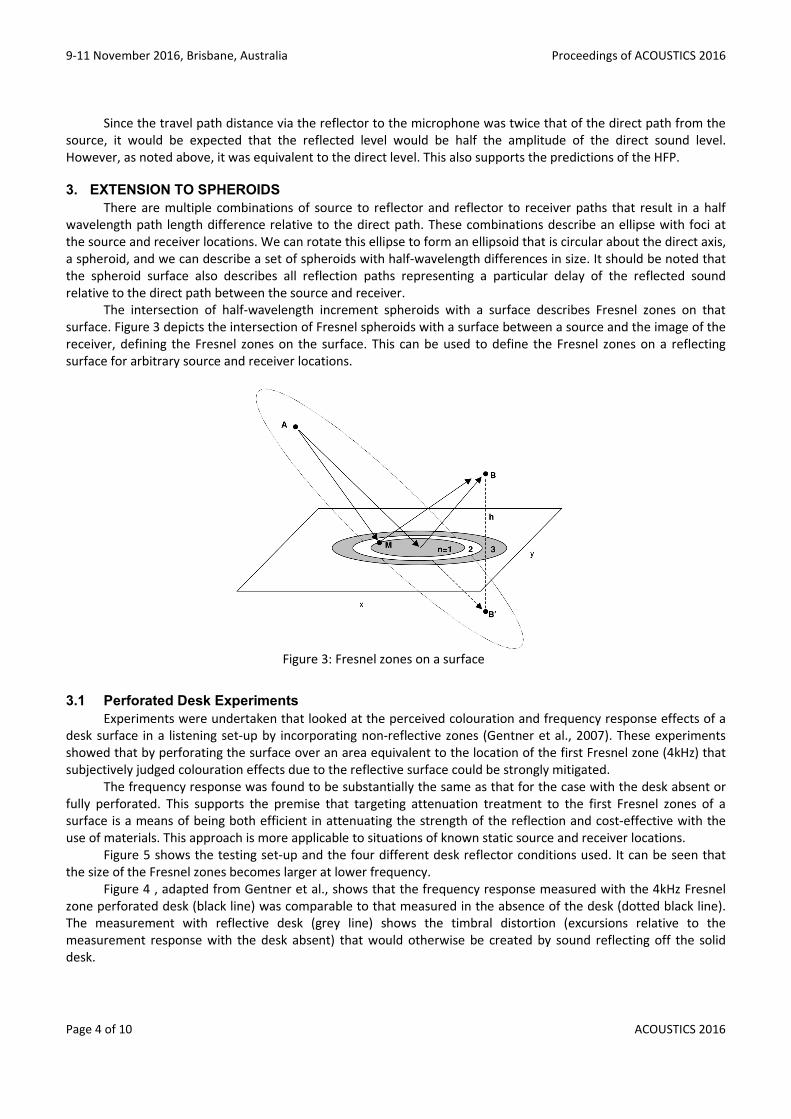
The intersection of half-wavelength increment spheroids with a surface describes Fresnel zones on that
surface. Figure 3 depicts the intersection of Fresnel spheroids with a surface between a source and the image of the
receiver, defining the Fresnel zones on the surface. This can be used to define the Fresnel zones on a reflecting
surface for arbitrary source and receiver locations.
Figure 3: Fresnel zones on a surface
3.1 Perforated Desk Experiments Experiments were undertaken that looked at the perceived colouration and frequency response effects of a
desk surface in a listening set-up by incorporating non-reflective zones (Gentner et al., 2007). These experiments
showed that by perforating the surface over an area equivalent to the location of the first Fresnel zone (4kHz) that
subjectively judged colouration effects due to the reflective surface could be strongly mitigated.
The frequency response was found to be substantially the same as that for the case with the desk absent or
fully perforated. This supports the premise that targeting attenuation treatment to the first Fresnel zones of a
surface is a means of being both efficient in attenuating the strength of the reflection and cost-effective with the
use of materials. This approach is more applicable to situations of known static source and receiver locations.
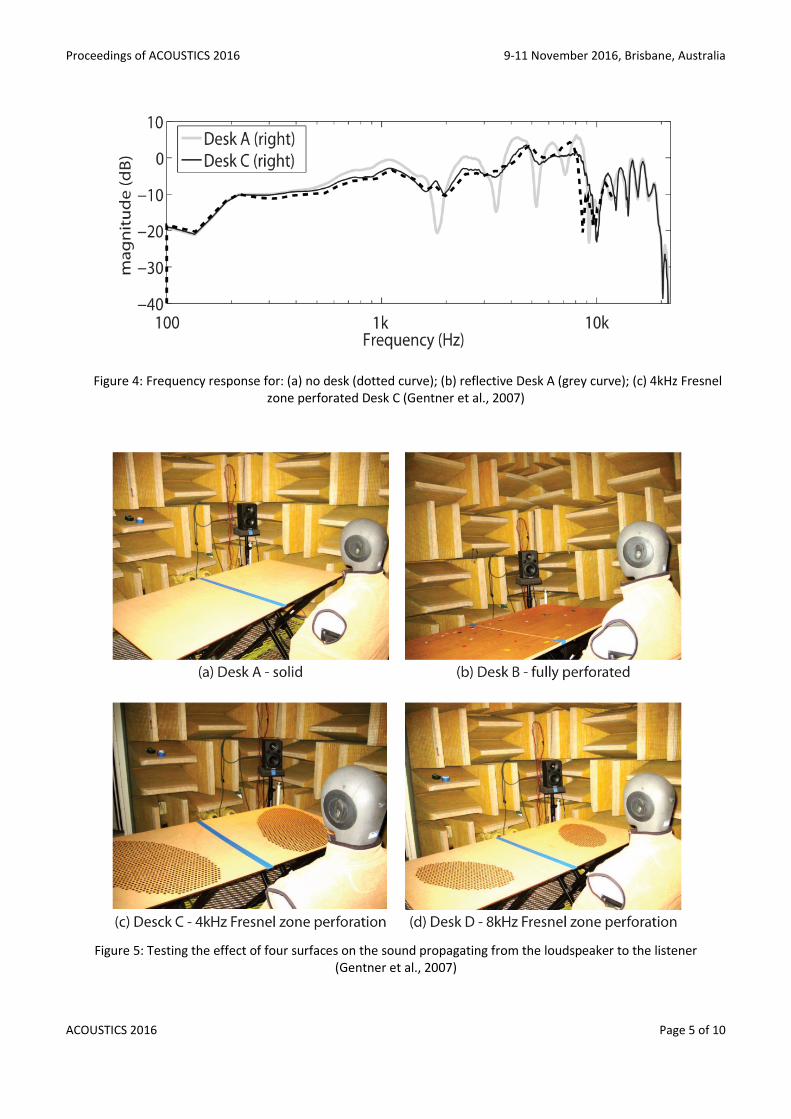
Figure 5 shows the testing set-up and the four different desk reflector conditions used. It can be seen that
the size of the Fresnel zones becomes larger at lower frequency.
Figure 4 , adapted from Gentner et al., shows that the frequency response measured with the 4kHz Fresnel
zone perforated desk (black line) was comparable to that measured in the absence of the desk (dotted black line).
The measurement with reflective desk (grey line) shows the timbral distortion (excursions relative to the
measurement response with the desk absent) that would otherwise be created by sound reflecting off the solid
desk.
Proceedings of ACOUSTICS 2016 9-11 November 2016, Brisbane, Australia
ACOUSTICS 2016 Page 5 of 10
Figure 4: Frequency response for: (a) no desk (dotted curve); (b) reflective Desk A (grey curve); (c) 4kHz Fresnel
zone perforated Desk C (Gentner et al., 2007)
Figure 5: Testing the effect of four surfaces on the sound propagating from the loudspeaker to the listener
(Gentner et al., 2007)

9-11 November 2016, Brisbane, Australia Proceedings of ACOUSTICS 2016
Page 6 of 10 ACOUSTICS 2016
3.2 Room Reflection Control Analysis Determining the location and extent of the first Fresnel zones at room surfaces for expected source and
receiver locations is useful information in order to develop the most effective measures to control early room
reflections. Figure 6 shows an example of the first Fresnel zone locations determined for a room side wall with a
given source and receiver location and for three frequencies. On the basis of the Fresnel zone theory, locating
absorption in this zone of the wall would be expected to be the most effective positioning of treatment to attenuate
sound energy reflecting off the wall, the overall result depending somewhat on the frequency content of the source
signal and the characteristics of the absorption treatment. A similar first Fresnel zone analysis may be undertaken
for the other early reflections in the room from the ceiling, floor, front wall, rear wall and far side wall. In addition
to this, the location of surface zones relating to the earliest reflections in a space may be determined from source-
receiver based spheroids determined in terms of delay rather than half-wavelength.
Figure 6: First Fresnel zone analysis for a listening room side wall showing the location and extent of the zones for
three frequencies. Dimensions are relative to the listener location at (0, 0). Source is at (1.602, 0.280).
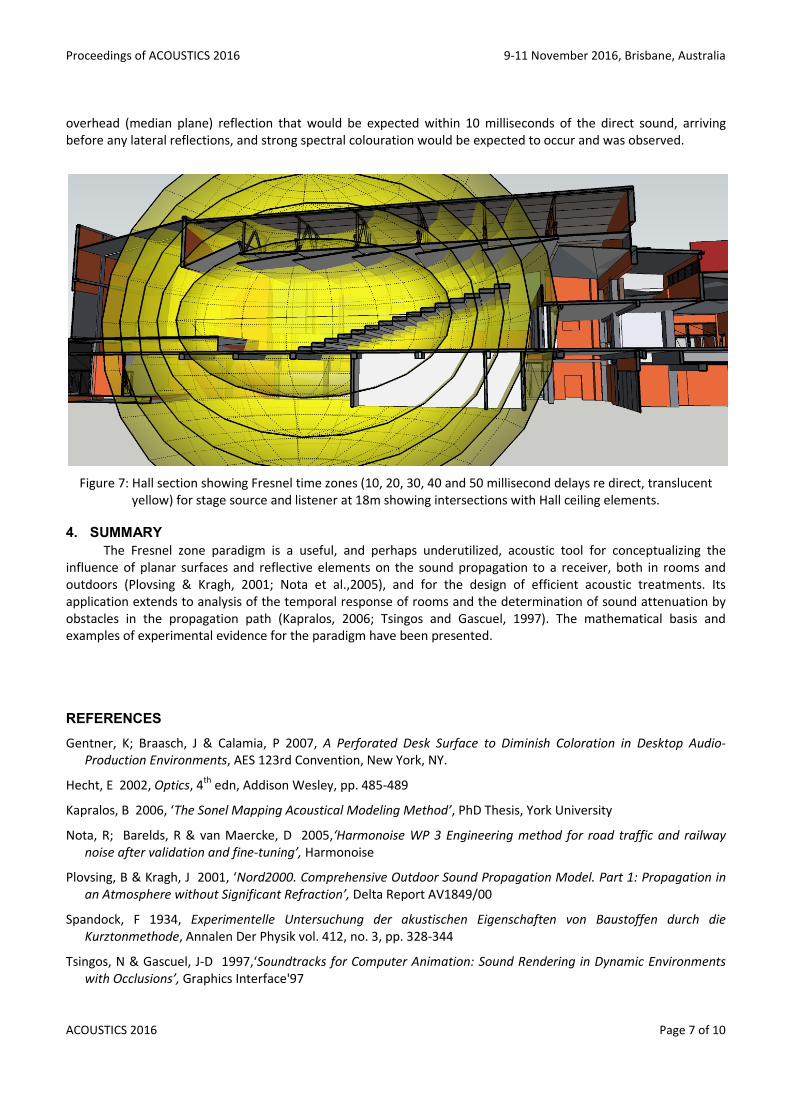
3.3 Early Reflection Time Window Analysis Figure 7 shows an example of an early reflection analysis for a hall refurbishment. Rather than describing surfaces
some multiple of half wavelength longer than the direct path, these spheroidal surfaces (translucent yellow)
describe the equal length reflection pathways with a given delay relative to the direct sound at a receiver, in this
case for a source at talking height on the stage to a particular audience seat. The intersection of these spheroids
with the room surfaces assist in highlighting where early reflections may arise from, for the given time delay (the
spheroid surfaces of increasing size represent 10, 20, 30, 40 and 50 millisecond delays respectively).
For this listener position, 18m back from the source on the stage, it can be seen that the earliest reflection zones
are the stage and main floor, which is the normal situation, but more importantly, the ceiling is generating an
0.680, 0.119
1.699, -0.865
-0.339, 1.102
0.663, 0.116
1.699, 1.102
-0.339, -0.865
-2
-1
0
1
2
3
-2 -1 0 1 2 3 4
Height, m
Depth, m
Side Fresnel Zone is 335mm off the Floor, 1886mm from the Sides
(2038mm Wide) and 1967mm in Height
Centre of Fresnel Zones
Reflection Point
500 Hz FZ1
1000 Hz FZ1
2000 Hz FZ1
Treatment Zone (Far L/S
Sidewall)
Near Sidewall Zone
Sidewall
Proceedings of ACOUSTICS 2016 9-11 November 2016, Brisbane, Australia
ACOUSTICS 2016 Page 7 of 10
overhead (median plane) reflection that would be expected within 10 milliseconds of the direct sound, arriving
before any lateral reflections, and strong spectral colouration would be expected to occur and was observed.
Figure 7: Hall section showing Fresnel time zones (10, 20, 30, 40 and 50 millisecond delays re direct, translucent
yellow) for stage source and listener at 18m showing intersections with Hall ceiling elements.
4. SUMMARY The Fresnel zone paradigm is a useful, and perhaps underutilized, acoustic tool for conceptualizing the
influence of planar surfaces and reflective elements on the sound propagation to a receiver, both in rooms and
outdoors (Plovsing & Kragh, 2001; Nota et al.,2005), and for the design of efficient acoustic treatments. Its
application extends to analysis of the temporal response of rooms and the determination of sound attenuation by
obstacles in the propagation path (Kapralos, 2006; Tsingos and Gascuel, 1997). The mathematical basis and
examples of experimental evidence for the paradigm have been presented.
REFERENCES
Gentner, K; Braasch, J & Calamia, P 2007, A Perforated Desk Surface to Diminish Coloration in Desktop Audio-
Production Environments, AES 123rd Convention, New York, NY.
Hecht, E 2002, Optics, 4th
edn, Addison Wesley, pp. 485-489
Kapralos, B 2006, ‘The Sonel Mapping Acoustical Modeling Method’, PhD Thesis, York University
Nota, R; Barelds, R & van Maercke, D 2005,‘Harmonoise WP 3 Engineering method for road traffic and railway
noise after validation and fine-tuning’, Harmonoise
Plovsing, B & Kragh, J 2001, ‘Nord2000. Comprehensive Outdoor Sound Propagation Model. Part 1: Propagation in
an Atmosphere without Significant Refraction’, Delta Report AV1849/00
Spandock, F 1934, Experimentelle Untersuchung der akustischen Eigenschaften von Baustoffen durch die
Kurztonmethode, Annalen Der Physik vol. 412, no. 3, pp. 328-344
Tsingos, N & Gascuel, J-D 1997,‘Soundtracks for Computer Animation: Sound Rendering in Dynamic Environments
with Occlusions’, Graphics Interface'97

9-11 November 2016, Brisbane, Australia
Page 8 of 10
APPENDIX
A.1 Path Lengths and the Law of Cosines
From the construction
ro2 = (B + xo)
2 + zo
2
B + xo = Kro�–zo�
xo = Kro�–zo� − B
where zo = ro.cos(Theta)
So, xo =Ero� − ro�. cos( = roEsin(Theta)� giving xo = ro.sin(Theta) – B
r1 = √xo� + zo� = EV = Ero�. Vsin(Theta giving r1 = Ero� − 2. B. ro. sin
For ro >> B,
r1 ≅ ro − B. sin(Theta) + XY
A.2 The Harmonic Mean of Two DistancesThe harmonic mean is a type of average and can be described as
reciprocals. The harmonic mean of two distances, a1 and a2, is given by,
this may alternatively be expressed as
11 November 2016, Brisbane, Australia Proceedings of ACOUSTICS 2016
Law of Cosines
(Theta)� − B = Ero�. V1 − cos(Theta)�Z − B
) − B , since sin(Theta)2 + cos(Theta)
2 = 1
EVro. sin(Theta) − BZ� + Vro. cos(Theta)�Z Theta)� + cos(Theta)�Z − 2. B. ro. sin(Theta)+ B�
sin(Theta) +B� , equivalent to the Law of Cosines for angle (90
.[\](^_`ab)Y�c\ +
Xd.]ef(^_`ab).[\](^_`ab)Y�.c\Y + g
The Harmonic Mean of Two Distances type of average and can be described as the reciprocal of the arithmetic mean of the
. The harmonic mean of two distances, a1 and a2, is given by,
F∗ = �hih� h
iY
be expressed as 2j∗ = 2
�j2 + 2�j�
Proceedings of ACOUSTICS 2016
ACOUSTICS 2016
equivalent to the Law of Cosines for angle (90-Theta) (A.1)
g(k 2�lm
n) (A.2)
the reciprocal of the arithmetic mean of the
(A.3a)
(A.3b)
Proceedings of ACOUSTICS 2016 9-11 November 2016, Brisbane, Australia
ACOUSTICS 2016 Page 9 of 10
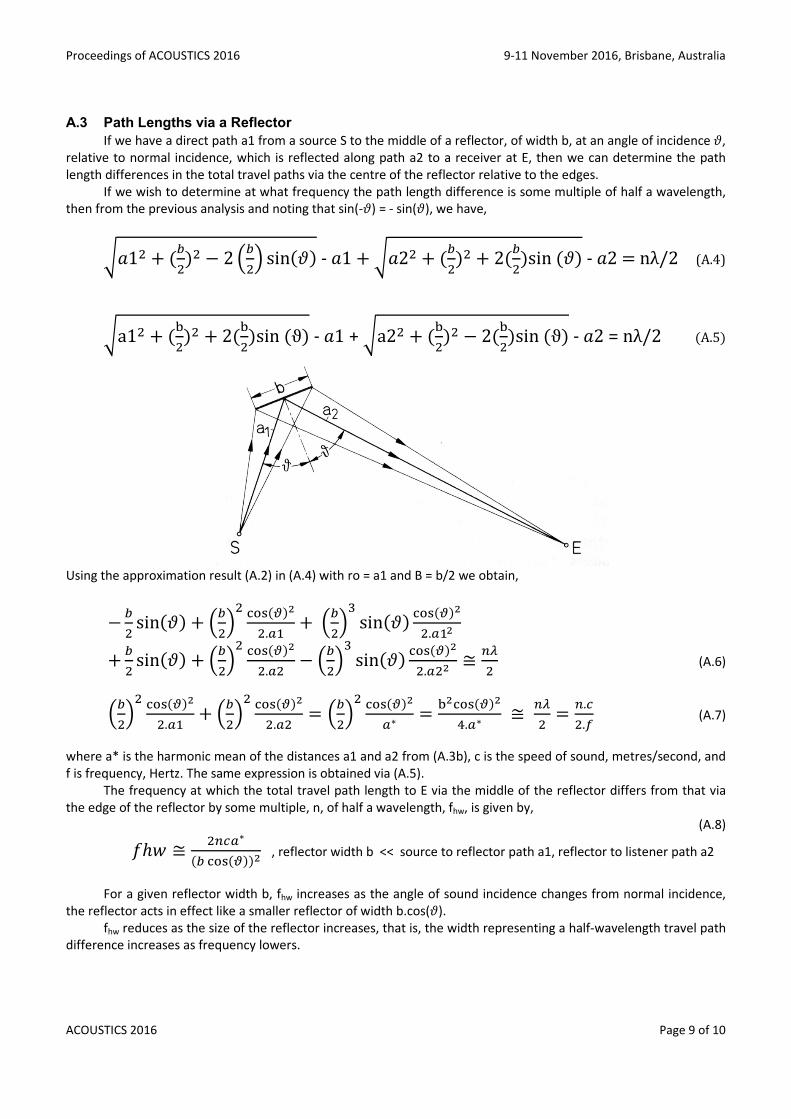
A.3 Path Lengths via a Reflector If we have a direct path a1 from a source S to the middle of a reflector, of width b, at an angle of incidence o,
relative to normal incidence, which is reflected along path a2 to a receiver at E, then we can determine the path
length differences in the total travel paths via the centre of the reflector relative to the edges.
If we wish to determine at what frequency the path length difference is some multiple of half a wavelength,
then from the previous analysis and noting that sin(-o) = - sin(o), we have,
KF1� + (p�)� − 2kp�m sin(o)-F1+KF2� + (p�)� + 2(p�)sin(o)-F2=nλ/2 (A.4)
Ka1� + (r�)� + 2(r�)sin(ϑ) - F1 + Ka2� + (r�)� − 2(r�)sin(ϑ) - F2 = nλ/2 (A.5)
Using the approximation result (A.2) in (A.4) with ro = a1 and B = b/2 we obtain,
− p� sin(o) + kp�m
� [\](u)Y�.j2 +kp�m
n sin(o) [\](u)Y�.j2Y
+ p� sin(o) + kp�m
� [\](u)Y�.j� − kp�m
n sin(o) [\](u)Y�.j�Y ≅ 0$� (A.6)
kp�m� [\](u)Y
�.j2 + kp�m� [\](u)Y
�.j� = kp�m� [\](u)Y
j∗ = rY[\](u)Yv.j∗ ≅ 0$� = 0.w
�.x (A.7)
where a* is the harmonic mean of the distances a1 and a2 from (A.3b), c is the speed of sound, metres/second, and
f is frequency, Hertz. The same expression is obtained via (A.5).
The frequency at which the total travel path length to E via the middle of the reflector differs from that via
the edge of the reflector by some multiple, n, of half a wavelength, fhw, is given by,
(A.8)
�ℎz ≅ �0wj∗(p [\](u))Y , reflector width b << source to reflector path a1, reflector to listener path a2
For a given reflector width b, fhw increases as the angle of sound incidence changes from normal incidence,
the reflector acts in effect like a smaller reflector of width b.cos(o).
fhw reduces as the size of the reflector increases, that is, the width representing a half-wavelength travel path
difference increases as frequency lowers.
9-11 November 2016, Brisbane, Australia Proceedings of ACOUSTICS 2016
Page 10 of 10 ACOUSTICS 2016
A.5 Fresnel Zone Intermediate Calculation Results First we need a few identities and results:
sin({ − |) = sin(α)cos(β) − cos(α) sin(β) (A.9)
sin(�.) = sin(�(. − 1) = 0 and cos(�.) = −cos,�(. − 1)- = (−1)0 (A.10)
Using (A.9) and (A.10) we find
sin,{ − �(. − 1)- = sin({) cos,�(. − 1)- − cos({) sin,�(. − 1)- = −(−1)0sin({) (A.11a)
sin({ − �.) = sin({) cos(�.) − cos({) sin(�.) = (−1)0sin({) (A.11b)
For ρ and r radii, � = 2�� and � = 2�/� we may derive the definite integral
/ cos,�� − �(� + �)- ���� = − ]ef,6718(���)-
8 + ]ef,6718(���)-8 (A.12)
For u and v representing paths with a difference in path length to the receiver of 0$� we may write:
� = �� + (012)$� and � = �� + 0$
�
Then, since � (012)$� = �(. − 1) and � 0$
� = �. , (A.12) becomes
− ]ef(6718(����)1�(012))8 + ]ef(6718(����)1�0)
8 (A.13)
From (A.11a) and (A.11b) setting { = �� − �(� + ��) and using � = 2�/� this reduces to
(1(12)3�h�(12)3)450,6718(����)-
8 = �(12)3$ 450,6718(����)-�� (A.14)
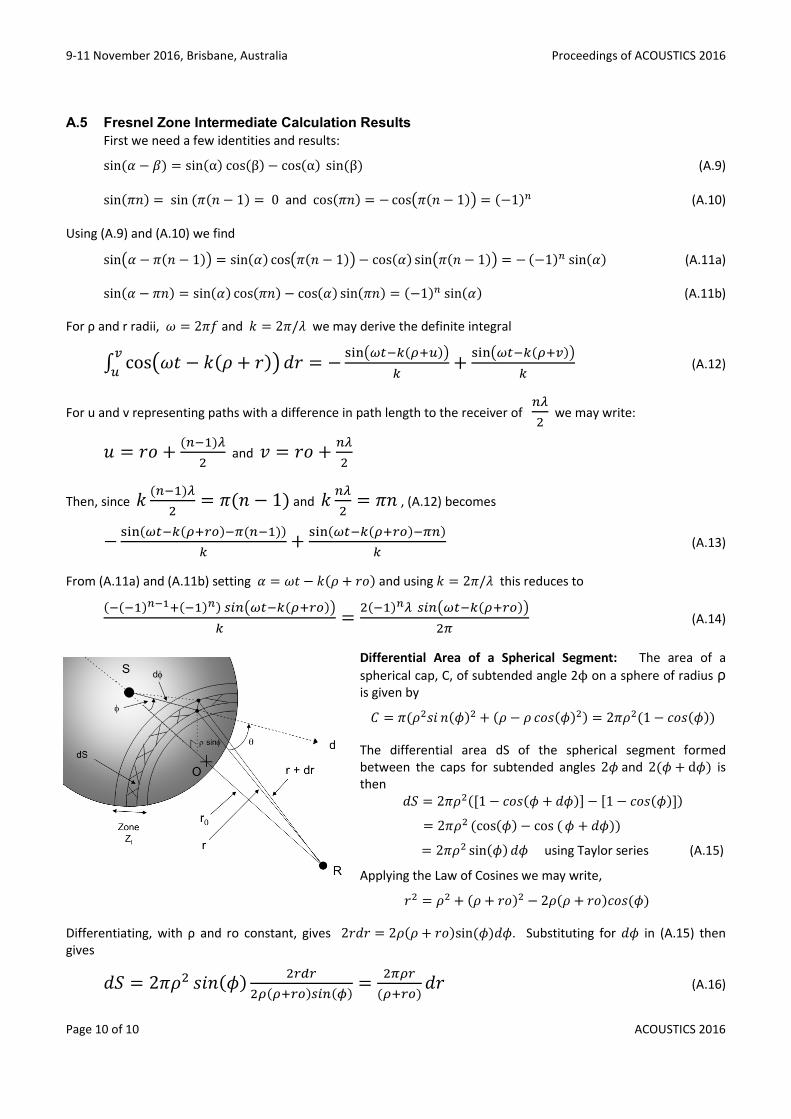
Differential Area of a Spherical Segment: The area of a
spherical cap, C, of subtended angle 2ϕ on a sphere of radius ρ
is given by
� = �(���: .(�)� + (� − � ��(�)�) = 2���(1 − ��(�)) The differential area dS of the spherical segment formed
between the caps for subtended angles 2�and 2(� + d�) is
then
�� = 2���(V1 − ��(� + ��)Z − V1 − ��(�)Z) = 2��� (cos(�) − cos(� + ��)) = 2��� sin(�)�� using Taylor series (A.15)
Applying the Law of Cosines we may write,
�� = �� + (� + ��)� − 2�(� + ��) ��(�) Differentiating, with ρ and ro constant, gives 2��� = 2�(� + ��)sin(�)��. Substituting for �� in (A.15) then
gives
�� = 2��� �:.(�) ������(����)450(�) = ����
(����)�� (A.16)