Embed Size (px)
Citation preview
INTERNAL COLOR PROPERTIES OF RESOLVED SPHEROIDS IN THE DEEP HUBBLE SPACE TELESCOPEADVANCED CAMERA FOR SURVEYS FIELD OF UGC 10214
F. Menanteau,1H. C. Ford,
1G. D. Illingworth,
2M. Sirianni,
1J. P. Blakeslee,
1G. R. Meurer,
1A. R. Martel,
1N. Benıtez,
1
M. Postman,3M. Franx,
4D. R. Ardila,
1F. Bartko,
5R. J. Bouwens,
1T. J. Broadhurst,
6R. A. Brown,
3C. J. Burrows,
3
E. S. Cheng,7M. Clampin,
3N. J. G. Cross,
1P. D. Feldman,
1D. A. Golimowski,
1C. Gronwall,
8G. F. Hartig,
3
L. Infante,9R. A. Kimble,
7J. E. Krist,
3M. P. Lesser,
10G. K. Miley,
4P. Rosati,
11W. B. Sparks,
3
H. D. Tran,1Z. I. Tsvetanov,
1R. L. White,
1,3and W. Zheng
1
Receivved 2003 September 6; accepted 2004 May 11
ABSTRACT
We study the internal color properties of a morphologically selected sample of spheroidal galaxies taken fromthe Hubble Space Telescope (HST ) Advanced Camera for Surveys (ACS) Early Release Observation program ofUGC 10214 (‘‘the Tadpole’’). By taking advantage of the unprecedented high resolution of the ACS in this verydeep data set, we are able to characterize spheroids at subarcsecond scales. Using the V606 and I814 bands, weconstruct V � I color maps and extract color gradients for a sample of spheroids at I814 < 24 mag. We assess theability of the ACS to make resolved color studies of galaxies by comparing its results with the multicolor datafrom the Hubble Deep Fields (HDFs). Here we report that with ACS WFC data using less than �1/10 theexposure of the WFPC2 HDFs, it is possible to confidently carry out resolved studies of faint galaxies at similarmagnitude limits. We also investigate the existence of a population of morphologically classified spheroids thatshow extreme variation in their internal color properties, similar to the ones reported in the HDFs. These aredisplayed as blue cores and inverse color gradients with respect to those accounted for from metallicity varia-tions. Following the same analysis, we find a similar fraction of early-type systems (�30%–40%) that shownonhomologous internal colors, suggestive of recent star formation activity. We present two statistics forquantifying the internal color variation in galaxies and tracing blue cores, from which we estimate the ratio ofnonhomogeneous to homogeneous internal colors as a function of redshift up to zP1:2. We find that it can bedescribed as about constant as a function of redshift, with a small increase with redshift for the fraction ofspheroids that present strong color dispersions. The implications of a constant fraction at all redshifts suggeststhe existence of a relatively permanent population of evolving spheroids up to zP1. We discuss the implicationsof this in the context of spheroidal formation.
Subject headinggs: galaxies: elliptical and lenticular, cD — galaxies: evolution —galaxies: fundamental parameters
Online material: color figures, machine-readable table
1. INTRODUCTION
In recent years, the use of field elliptical galaxies has be-come a conventional tool for testing between very differentstructures of formation, where the main competing views ofgalaxy formation at high and low redshift are often referred toas monolithic, or early formation, and hierarchical, or lateformation, respectively (Peebles 2002). Many observational
studies have been devoted to a number of ‘‘scaling relations’’in ellipticals in rich clusters; i.e., the low scatter in the fun-damental plane (Djorgovski & Davis 1987; Dressler et al.1987; van Dokkum & Franx 1996; Treu et al. 1999) and in thecolor-magnitude relation (CMR; Sandage & Visvanathan 1978;Bower et al. 1992; Ellis et al. 1997). These imply a high degreeof homogeneity in the stellar population, which reinforcesthe idea of a monolithic collapse model in which ellipticalsformed during a rapid collapse at high redshift (Eggen et al.1962).The simple view of early formation contrasts with the
predictions of models in which galaxies assemble hierarchi-cally as the result of the merging of smaller subunits, at a rategoverned by the merger of cold dark matter halos (White &Rees 1978; White & Frenk 1991; Baugh et al. 1996). Al-though the prevailing view in the past was that ellipticals inthe field formed in isolation in a high-redshift initial burst offormation, as did their clustered counterparts, several authorshave shown that the observational properties of field spheroids(collectively, Es and S0s) are incompatible with the bulk ofthe population forming at high redshift (Zepf 1997; Bargeret al. 1999; Menanteau et al. 1999; Trager et al. 2000). Mostof these studies were prompted by the success of hierarchicalmodels in the prediction of a large quantity of observableproperties of galaxies, suggesting that massive field ellipticals
A
1 Department of Physics and Astronomy, Johns Hopkins University, 3400North Charles Street, Baltimore, MD 21218.
2 University of California Observatories/Lick Observatory, University ofCalifornia, Santa Cruz, CA 95064.
3 Space Telescope Science Institute, 3700 San Martin Drive, Baltimore,MD 21218.
4 Leiden Observatory, Postbus 9513, 2300 RA Leiden, Netherlands.5 Bartko Science and Technology, P.O. Box 670, Mead, CO 80542-0670.6 Racah Institute of Physics, Hebrew University, Jerusalem 91904, Israel.7 NASA Goddard Space Flight Center, Laboratory for Astronomy and
Solar Physics, Greenbelt, MD 20771.8 Department of Astronomy and Astrophysics, Pennsylvania State Uni-
versity, 525 Davey Laboratory, University Park, PA 16802.9 Departamento de Astronomıa y Astrofısica, Pontificia Universidad
Catolica de Chile, Casilla 306, Santiago 22, Chile.10 Steward Observatory, University of Arizona, 933 North Cherry Avenue,
Tucson, AZ 85721.11 European Southern Observatory, Karl-Schwarzschild-Strasse 2, D-85748
Garching, Germany.
202
The Astrophysical Journal, 612:202–214, 2004 September 1
# 2004. The American Astronomical Society. All rights reserved. Printed in U.S.A.
could only have been assembled recently (z < 1). The generalconsensus that arose is that a single short period of formationat high redshift is incompatible with the observations. There isgrowing evidence of the existence of blue spheroids withperturbed colors at intermediate redshift and a deficit of redsystems compared to monolithic-model predictions (Treu &Stiavelli 1999; Menanteau et al. 2001a; Kodama et al. 1999;Zepf 1997). More recently, however, Bell et al. (2004) havereported, using a large sample of Hubble Space Telescope(HST ) galaxies, that E/S0s dominate the red sequence ofgalaxies at z � 0:7. As the outcome of these new studies, anew view of elliptical formation is emerging.
A surprising result from this wave of studies is the dis-covery of field spheroids with blue central regions at inter-mediate redshifts 0:4 < z < 1:0. These objects were originallydetected from their V606 � I814 color maps (Abraham et al.1999; Menanteau et al. 2001a) in the Hubble Deep Fields(HDFs) and are suggestive of recent star formation activityassociated with the central region of the galaxy. The presenceof blue-core spheroids in the HDFs has generated interest inreproducing their observed properties using both semianalytic(Benson et al. 2002) and extended monolithic collapse(Jimenez et al. 1998; Menanteau et al. 2001b) models. Thehierarchical description of Benson et al. (2002) accuratelypredicts the number of spheroids and the degree of colorvariations observed in spheroids, but misses most of the redspheroids in the sample. On the other hand, multizone chemo-dynamical models can predict the existence of blue cores andhomogeneous colors of evolved ellipticals with success, byadjusting the redshift of formation of the galaxy, although thecosmological mechanisms responsible for detailing the for-mation of spheroids are somewhat unclear (Menanteau et al.2001b; Friaca & Terlevich 2001).
The use of resolved colors in evolutionary studies, althoughlargely unexploited for characterizing distant galaxies (seeTamura et al. 2000, Abraham et al. 1999, Menanteau et al.2001a, and Hinkley & Im 2001 for examples), supplies a newset of independent constraints to the traditional use of countsand redshift distributions alone, particularly useful whenattempting to discriminate between models of elliptical for-mation. Moreover, it is appealing to examine independentspheroid samples that look for galaxies with color inhomo-geneities like those reported in the HDFs. Over larger data sets,they can provide important clues for determining the fractionof spheroids still experiencing star formation. Unfortunately,until the arrival of the Advanced Camera for Surveys (ACS),resolved color analysis has been limited only to superb signal-to-noise ratio (SNR) and highly time-consuming data sets suchas the HDFs. In this paper we explore the advantages arising
from exploiting the unprecedented capabilities of the ACS inobtaining HDF-like data sets with only a fraction of the inte-gration time. We use the first data available from the ACS tostudy the resolved color properties of faint, distant galaxies andcompare them with previous results from the HDFs.
A plan for the paper follows. In x 2, we describe the ob-servations and data reduction of the ACS images and ourmorphological classification of galaxies utilized in segregatingspheroids. In x 3, we discuss the resolved color properties andthe construction of color maps of spheroids in our sample. Inx 4, we present our methodology for characterizing the re-solved color properties, using a model-independent approach.In x 5, we discuss the results of our analysis, and finally, in x 6we summarize our conclusions.
2. SPHEROIDS IN THE ACS WFC UGC 10214 FIELD
The spheroids in our study were selected from one of thefirst science observations acquired by the ACS (Ford et al.2003) Wide Field Channel (WFC) as part of the Early ReleaseObservations (EROs) program. The ACS WFC houses two2048 ;4096 butted CCDs separated by a �200 gap, providinga field of view (FOV) of 20200 ; 20200 with a pixel size of0B05.
2.1. ACS WFC Observvations
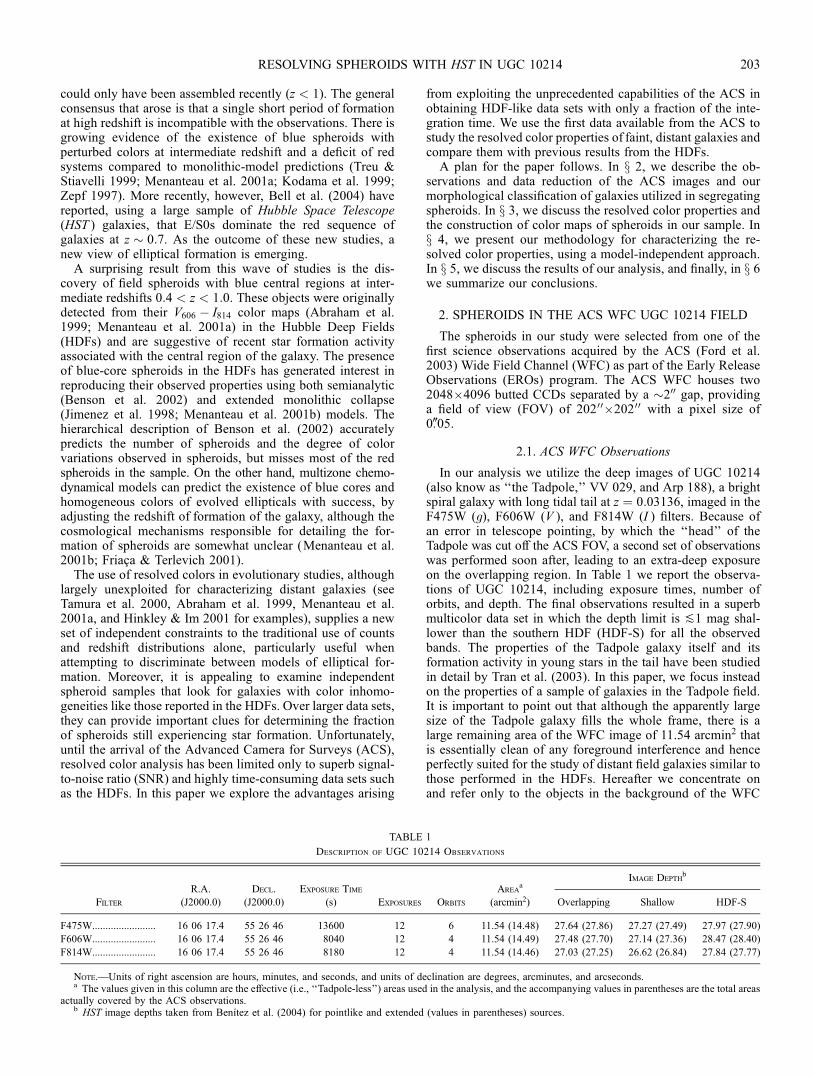
In our analysis we utilize the deep images of UGC 10214(also know as ‘‘the Tadpole,’’ VV 029, and Arp 188), a brightspiral galaxy with long tidal tail at z ¼ 0:03136, imaged in theF475W (g), F606W (V ), and F814W (I ) filters. Because ofan error in telescope pointing, by which the ‘‘head’’ of theTadpole was cut off the ACS FOV, a second set of observationswas performed soon after, leading to an extra-deep exposureon the overlapping region. In Table 1 we report the observa-tions of UGC 10214, including exposure times, number oforbits, and depth. The final observations resulted in a superbmulticolor data set in which the depth limit is P1 mag shal-lower than the southern HDF (HDF-S) for all the observedbands. The properties of the Tadpole galaxy itself and itsformation activity in young stars in the tail have been studiedin detail by Tran et al. (2003). In this paper, we focus insteadon the properties of a sample of galaxies in the Tadpole field.It is important to point out that although the apparently largesize of the Tadpole galaxy fills the whole frame, there is alarge remaining area of the WFC image of 11.54 arcmin2 thatis essentially clean of any foreground interference and henceperfectly suited for the study of distant field galaxies similar tothose performed in the HDFs. Hereafter we concentrate onand refer only to the objects in the background of the WFC
TABLE 1
Description of UGC 10214 Observations
Image Depthb
Filter
R.A.
(J2000.0)
Decl.
(J2000.0)
Exposure Time
(s) Exposures Orbits
Areaa
(arcmin2) Overlapping Shallow HDF-S
F475W........................ 16 06 17.4 55 26 46 13600 12 6 11.54 (14.48) 27.64 (27.86) 27.27 (27.49) 27.97 (27.90)
F606W........................ 16 06 17.4 55 26 46 8040 12 4 11.54 (14.49) 27.48 (27.70) 27.14 (27.36) 28.47 (28.40)
F814W........................ 16 06 17.4 55 26 46 8180 12 4 11.54 (14.46) 27.03 (27.25) 26.62 (26.84) 27.84 (27.77)
Note.—Units of right ascension are hours, minutes, and seconds, and units of declination are degrees, arcminutes, and arcseconds.a The values given in this column are the effective (i.e., ‘‘Tadpole-less’’) areas used in the analysis, and the accompanying values in parentheses are the total areas
actually covered by the ACS observations.b HST image depths taken from Benıtez et al. (2004) for pointlike and extended (values in parentheses) sources.
RESOLVING SPHEROIDS WITH HST IN UGC 10214 203
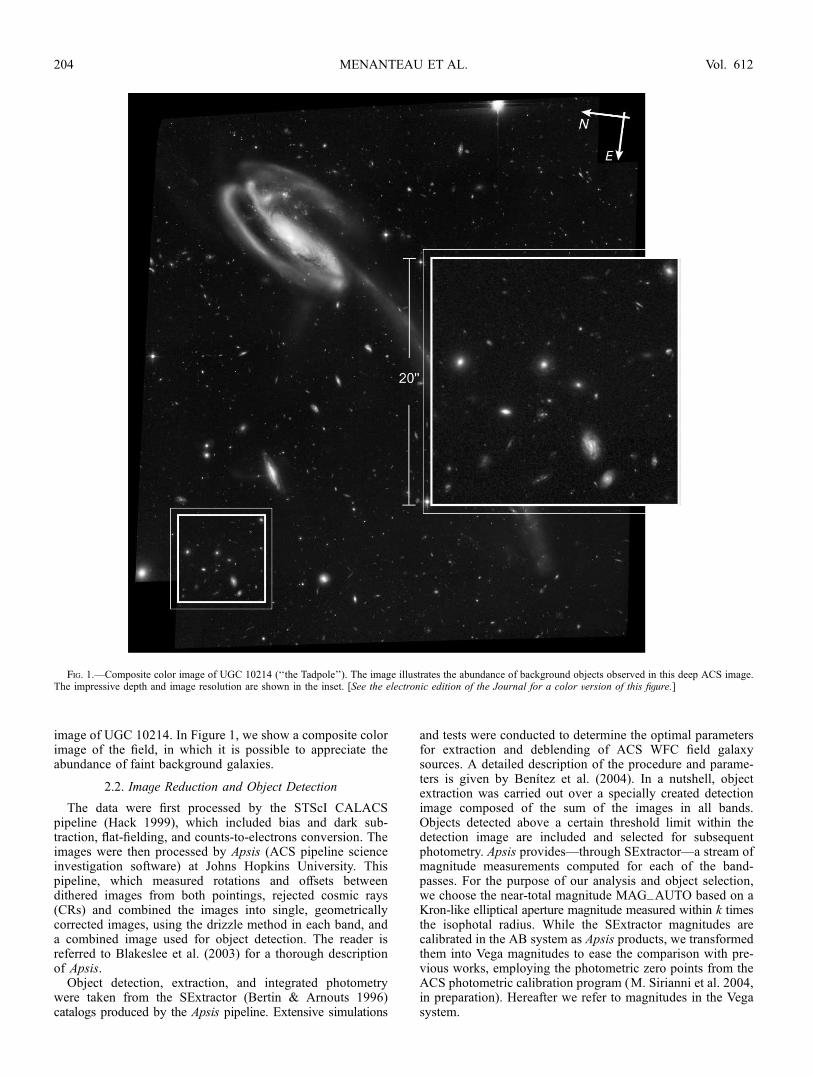
image of UGC 10214. In Figure 1, we show a composite colorimage of the field, in which it is possible to appreciate theabundance of faint background galaxies.
2.2. Imagge Reduction and Object Detection
The data were first processed by the STScI CALACSpipeline (Hack 1999), which included bias and dark sub-traction, flat-fielding, and counts-to-electrons conversion. Theimages were then processed by Apsis (ACS pipeline scienceinvestigation software) at Johns Hopkins University. Thispipeline, which measured rotations and offsets betweendithered images from both pointings, rejected cosmic rays(CRs) and combined the images into single, geometricallycorrected images, using the drizzle method in each band, anda combined image used for object detection. The reader isreferred to Blakeslee et al. (2003) for a thorough descriptionof Apsis.
Object detection, extraction, and integrated photometrywere taken from the SExtractor (Bertin & Arnouts 1996)catalogs produced by the Apsis pipeline. Extensive simulations
and tests were conducted to determine the optimal parametersfor extraction and deblending of ACS WFC field galaxysources. A detailed description of the procedure and parame-ters is given by Benıtez et al. (2004). In a nutshell, objectextraction was carried out over a specially created detectionimage composed of the sum of the images in all bands.Objects detected above a certain threshold limit within thedetection image are included and selected for subsequentphotometry. Apsis provides—through SExtractor—a stream ofmagnitude measurements computed for each of the band-passes. For the purpose of our analysis and object selection,we choose the near-total magnitude MAG_AUTO based on aKron-like elliptical aperture magnitude measured within k timesthe isophotal radius. While the SExtractor magnitudes arecalibrated in the AB system as Apsis products, we transformedthem into Vega magnitudes to ease the comparison with pre-vious works, employing the photometric zero points from theACS photometric calibration program (M. Sirianni et al. 2004,in preparation). Hereafter we refer to magnitudes in the Vegasystem.
Fig. 1.—Composite color image of UGC 10214 (‘‘the Tadpole’’). The image illustrates the abundance of background objects observed in this deep ACS image.The impressive depth and image resolution are shown in the inset. [See the electronic edition of the Journal for a color version of this figure.]
MENANTEAU ET AL.204 Vol. 612
2.3. SelectinggSpheroids
In selecting field spheroids we first choose objects withintegrated magnitude I814 < 24, using MAG_AUTO fromthe SExtractor products. This is our starting point for segre-gating early types. We decided to select objects brighter thanI814 < 24—the same criterion adopted by Menanteau et al.(2001a) in the HDFs—as this enables both reliable morpho-logical classification and abundant SNR pixel information ondeep HST images and provides us with the right tools tocompare with the HDFs sample. This led us to an initialsample of 373 objects.
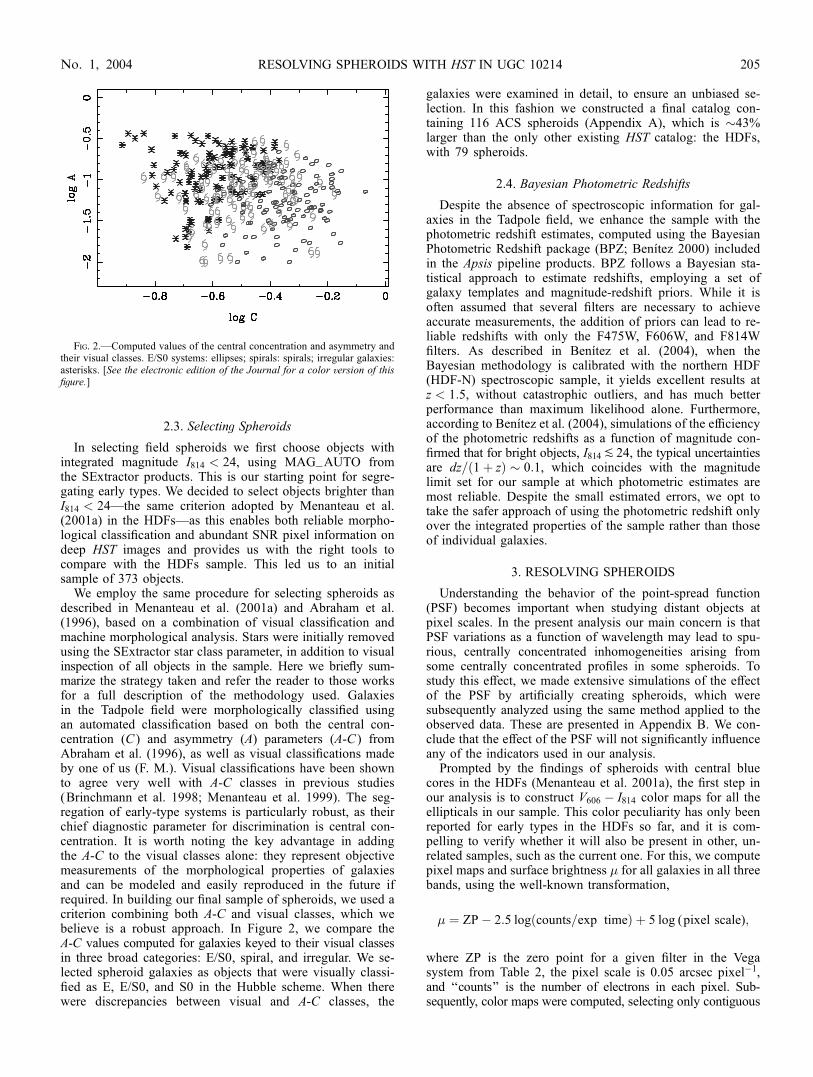
We employ the same procedure for selecting spheroids asdescribed in Menanteau et al. (2001a) and Abraham et al.(1996), based on a combination of visual classification andmachine morphological analysis. Stars were initially removedusing the SExtractor star class parameter, in addition to visualinspection of all objects in the sample. Here we briefly sum-marize the strategy taken and refer the reader to those worksfor a full description of the methodology used. Galaxiesin the Tadpole field were morphologically classified usingan automated classification based on both the central con-centration (C ) and asymmetry (A) parameters (A-C ) fromAbraham et al. (1996), as well as visual classifications madeby one of us (F. M.). Visual classifications have been shownto agree very well with A-C classes in previous studies(Brinchmann et al. 1998; Menanteau et al. 1999). The seg-regation of early-type systems is particularly robust, as theirchief diagnostic parameter for discrimination is central con-centration. It is worth noting the key advantage in addingthe A-C to the visual classes alone: they represent objectivemeasurements of the morphological properties of galaxiesand can be modeled and easily reproduced in the future ifrequired. In building our final sample of spheroids, we used acriterion combining both A-C and visual classes, which webelieve is a robust approach. In Figure 2, we compare theA-C values computed for galaxies keyed to their visual classesin three broad categories: E/S0, spiral, and irregular. We se-lected spheroid galaxies as objects that were visually classi-fied as E, E/S0, and S0 in the Hubble scheme. When therewere discrepancies between visual and A-C classes, the
galaxies were examined in detail, to ensure an unbiased se-lection. In this fashion we constructed a final catalog con-taining 116 ACS spheroids (Appendix A), which is �43%larger than the only other existing HST catalog: the HDFs,with 79 spheroids.
2.4. Bayesian Photometric Redshifts
Despite the absence of spectroscopic information for gal-axies in the Tadpole field, we enhance the sample with thephotometric redshift estimates, computed using the BayesianPhotometric Redshift package (BPZ; Benıtez 2000) includedin the Apsis pipeline products. BPZ follows a Bayesian sta-tistical approach to estimate redshifts, employing a set ofgalaxy templates and magnitude-redshift priors. While it isoften assumed that several filters are necessary to achieveaccurate measurements, the addition of priors can lead to re-liable redshifts with only the F475W, F606W, and F814Wfilters. As described in Benıtez et al. (2004), when theBayesian methodology is calibrated with the northern HDF(HDF-N) spectroscopic sample, it yields excellent results atz < 1:5, without catastrophic outliers, and has much betterperformance than maximum likelihood alone. Furthermore,according to Benıtez et al. (2004), simulations of the efficiencyof the photometric redshifts as a function of magnitude con-firmed that for bright objects, I814P24, the typical uncertaintiesare dz= 1þ zð Þ � 0:1, which coincides with the magnitudelimit set for our sample at which photometric estimates aremost reliable. Despite the small estimated errors, we opt totake the safer approach of using the photometric redshift onlyover the integrated properties of the sample rather than thoseof individual galaxies.
3. RESOLVING SPHEROIDS
Understanding the behavior of the point-spread function(PSF) becomes important when studying distant objects atpixel scales. In the present analysis our main concern is thatPSF variations as a function of wavelength may lead to spu-rious, centrally concentrated inhomogeneities arising fromsome centrally concentrated profiles in some spheroids. Tostudy this effect, we made extensive simulations of the effectof the PSF by artificially creating spheroids, which weresubsequently analyzed using the same method applied to theobserved data. These are presented in Appendix B. We con-clude that the effect of the PSF will not significantly influenceany of the indicators used in our analysis.
Prompted by the findings of spheroids with central bluecores in the HDFs (Menanteau et al. 2001a), the first step inour analysis is to construct V606 � I814 color maps for all theellipticals in our sample. This color peculiarity has only beenreported for early types in the HDFs so far, and it is com-pelling to verify whether it will also be present in other, un-related samples, such as the current one. For this, we computepixel maps and surface brightness � for all galaxies in all threebands, using the well-known transformation,
� ¼ ZP� 2:5 log counts=exp timeð Þ þ 5 log (pixel scale);
where ZP is the zero point for a given filter in the Vegasystem from Table 2, the pixel scale is 0.05 arcsec pixel�1,and ‘‘counts’’ is the number of electrons in each pixel. Sub-sequently, color maps were computed, selecting only contiguous
Fig. 2.—Computed values of the central concentration and asymmetry andtheir visual classes. E/S0 systems: ellipses; spirals: spirals; irregular galaxies:asterisks. [See the electronic edition of the Journal for a color version of thisfigure.]
RESOLVING SPHEROIDS WITH HST IN UGC 10214 205No. 1, 2004
pixels above a surface brightness threshold of �606 �25 mag arcsec�2. We note that we use this surface bright-ness limit only in the computation of � V � Ið Þ in x 4.1 inorder to maintain consistency when comparing with pre-vious observations. However, in x 4.2 we discuss a more
robust method for selecting and measuring the light ofspheroids.
3.1. Old Ellipticals vversus Blue Ellipticals
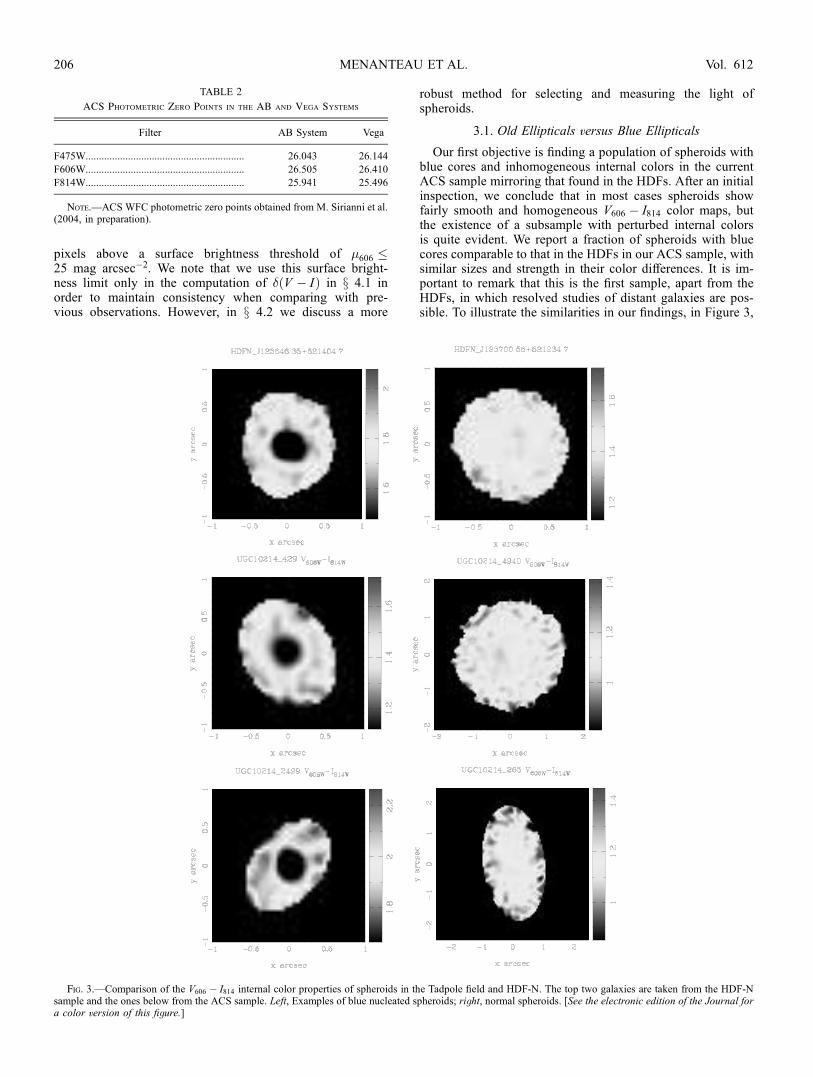
Our first objective is finding a population of spheroids withblue cores and inhomogeneous internal colors in the currentACS sample mirroring that found in the HDFs. After an initialinspection, we conclude that in most cases spheroids showfairly smooth and homogeneous V606 � I814 color maps, butthe existence of a subsample with perturbed internal colorsis quite evident. We report a fraction of spheroids with bluecores comparable to that in the HDFs in our ACS sample, withsimilar sizes and strength in their color differences. It is im-portant to remark that this is the first sample, apart from theHDFs, in which resolved studies of distant galaxies are pos-sible. To illustrate the similarities in our findings, in Figure 3,
TABLE 2
ACS Photometric Zero Points in the AB and Vega Systems
Filter AB System Vega
F475W............................................................ 26.043 26.144
F606W............................................................ 26.505 26.410
F814W............................................................ 25.941 25.496
Note.—ACS WFC photometric zero points obtained from M. Sirianni et al.(2004, in preparation).
Fig. 3.—Comparison of the V606 � I814 internal color properties of spheroids in the Tadpole field and HDF-N. The top two galaxies are taken from the HDF-Nsample and the ones below from the ACS sample. Left, Examples of blue nucleated spheroids; right, normal spheroids. [See the electronic edition of the Journal fora color version of this figure.]
MENANTEAU ET AL.206 Vol. 612
we show examples of spheroids with normal and peculiarinternal color properties in the HDF-N and the present sampleof ACS spheroids. The similarities in the form of the bluenucleated ones in both samples are quite evident.
4. METHODOLOGY AND ANALYSIS
After considering the color maps of spheroids, we want toinvestigate how the internal colors of field ellipticals vary as afunction of redshift and to quantify the fraction that departsfrom a passively evolving population. Although we can iden-tify a distinctive population of spheroids with blue cores andcolor inhomogeneities from visual inspections alone, we wishto develop a method for quantifying the strength of the inho-mogeneity in an objective way. A standard tool for this pur-pose is to model their color properties using stellar synthesispopulation models (Abraham et al. 1999; Menanteau et al.2001b). Unfortunately, these predictions are quite sensitiveto the galaxy redshift of observation, and our present sampleonly encompasses photometric estimates, making this approachtoward characterizing individual galaxies somewhat uncertain.Instead, we choose to explore a model-free approach and focuson the integrated properties, which in our view represents asafer way to evaluate the trend of the population. For thispurpose we revisit the internal color dispersion estimator fromMenanteau et al. (2001a) and devise a new measurement basedon the slope of the color gradients of a galaxy that we show ismore sensitive to the presence of central blue spots.
4.1. The Internal Color Dispersion, � V � Ið ÞThe idea of studying the internal colors of an individual
galaxy can be considered a generalization of the use of theCMR in the study of the history of elliptical galaxies inclusters (Bower et al. 1992), where the photometric dispersionis employed as a powerful mechanism to determine variationsin their star formation history. The first quantity that wepresent is the SNR-weighted scatter in the internal V606 � I814colors of a galaxy, � V � Ið Þ, as defined in Menanteau et al.(2001a). This measurement has proved to be a good tracer ofpeculiarities in spheroid colors at pixel scales, in the sense thatobjects with low values of � V � Ið Þ have very uniform andnormal color maps, while those with higher values do presentdisturbed internal colors and in many cases blue cores.
A key motivation for revisiting this estimator is that it hasalready been applied and calibrated with a similarly selectedsample of galaxies in the HDFs, where it proved to be a gooddiscriminant of objects with blue cores versus ellipticals withnormal colors. This feature enables us to make direct com-parison between the HDFs sample � V � Ið Þ measurementsand the current one. In addition, it is a model-independentmethod for studying differences in the star formation historiesof galaxies, making it free of assumptions regarding the epochof formation in ellipticals.
In our estimates of � V � Ið Þ, we follow the same procedureused in the HDFs, and we also choose to concentrate only onthe V606 and I814 bands for computing color dispersions, as theresulting V606 � I814 color contains significantly smaller ob-servational errors than g450 � V606, especially for systemsdominated by old stellar populations (see Menanteau et al.2001a for details). However, it is important to note that strongvariations in the internal colors are also present when theg450 � V606 colors are examined. We select all contiguouspixels within a surface brightness limit of less than 25 magarcsec�2 in V606, to isolate the galaxy from the background
sky and maximize the associated SNR per pixel. Using onlythe pixels within this limit, � V � Ið Þ is computed from theweighted SNR distribution of V606 � I814 colors for individualpixels, which in turn identifies the internal homogeneity of agalaxy, using the following recipe:
� V � Ið Þ /P
xi � xð Þ2S xið ÞSNR xið ÞP
S xið ÞSNR xið Þ ; ð1Þ
x ¼P
xi S xið ÞSNR xið ÞP
S xið ÞSNR xið Þ ; ð2Þ
where S xð Þ is a selection function for pixels with SNR above acertain threshold such that S xð Þ ¼ 1 for pixels above andS xð Þ ¼ 0 for pixels below the threshold; SNR xið Þ is the SNRfor a given pixel color xi. The selection function S xð Þ and theweighting according to SNR xð Þ address biases arising fromnoise variations at pixel scales by rejecting low-signal pixelsand weighting the pixels’ contribution proportionally to theirsignal.
4.2. The Mean Slope V606 � I814ð Þ rð Þ of the Galaxy
In addition to the color dispersion, we wish to develop analternative quantity to isolate spheroids with nonhomogene-ous internal colors. This should be suited to measuring thestrength of the blue cores and not prone to dispersions arisingfrom particularly reddened core. For this we concentrate on amethod that quantifies the variation in the color as a functionof the galaxy radius. Given that in most cases, color pecu-liarities manifest themselves via the presence of blue cores, aclear pattern of this effect is the display of inverted (i.e.,positive sign) color gradients, as opposed to the case of‘‘normal’’ passively evolving ellipticals, which show eitherflat or slightly negative color gradients, as expected frommetal-enriched cores.
We focus on the V606 � I814 colors to compute color gra-dients as a function of the radius r, as these represent the bandswhere the SNR is higher and can be more directly related to� V � Ið Þ. In the extraction of the color gradients, initially wemeasure the centroid and second-order moments (x2, y2, xy) ofthe galaxy utilizing the I814 band, from which we determinethe ellipticity parameters of the objects (a, b, �). It is worthnoting that we keep the same elongation ratio e ¼ a=b up tothe isophotal limit for computing the color gradient. Next,using concentric ellipses, we calculate the V606 � I814ð Þ rið Þgradients as the median color in the shell between ri�1 andriþ1. To gauge the slope of the color gradient, we fit a fourth-order polynomial function to the observed V606 � I814ð Þ rð Þ, upto a certain maximum radius rmax, from which we measure theslope by simply obtaining the first derivative of the fittedpolynomial function. In order to consistently measure theslope of galaxies over similar physical areas on spheroidsand at different redshifts, we compute the slope up to a radiusrmax following an approach similar to the one described byPapovich et al. (2003) and Conselice et al. (2000). This con-sists of choosing the aperture radius rmax of the galaxy asrmax ¼ 1:5rP with � ¼ 0:2, where rP is the Petrosian (1976)radius and � rð Þ is defined as
� rð Þ ¼ I rð Þ= I rð Þh i; ð3Þ
where I rð Þ is the surface brightness of the galaxy in an an-nulus of radius r and I rð Þh i is its mean value up to the sameradius. The Petrosian radius depends only on the galaxysurface brightness, and it is independent of the redshift of
RESOLVING SPHEROIDS WITH HST IN UGC 10214 207No. 1, 2004
observation. Formally, the mean slope V606 � I814ð Þ rð Þ of thegalaxy can be expressed as
slope ¼P
d=drð Þ V � Ið Þ rð Þjri�riP
�ri; ð4Þ
where the derivative is taken over the fitted function,�ri is thesize of the concentric shells, and r is measured in kiloparsecs.We repeat this procedure for all the galaxies in our sample. Inx 5, we investigate how it performs compared with � V � Ið Þand present examples.
4.3. Comparinggthe Indicators
An important objective of our analysis is to carry out directcomparisons of the internal color dispersions observed in thepresent ACS sample and those observed in the HDFs. For thispurpose, we include in our study the morphologically selectedcatalog of spheroids in HDF-N from Menanteau et al. (2001a).The HDF-N sample was constructed using the same selectionlimits and morphological classification, ensuring a robustcomparison between samples. We include only the northernHDF, as this contains the largest number of spectroscopicredshifts, making possible an investigation of how the internalcolor dispersions vary as a function of redshift, as opposed tothe photometric estimates in ACS spheroids. After computing� V � Ið Þ and the mean slope for all galaxies in the ACS andHDF-N samples, we examine how they perform against eachother first in the ACS sample and subsequently for the HDF-Nspheroids.
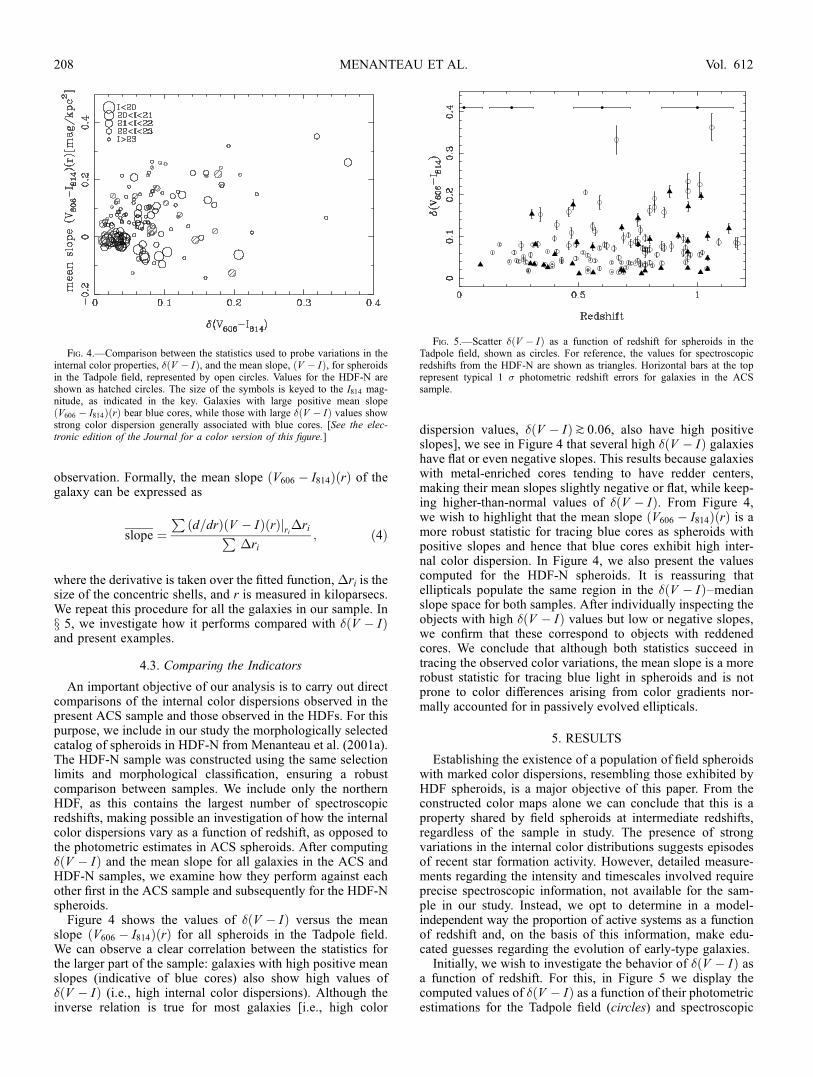
Figure 4 shows the values of � V � Ið Þ versus the meanslope V606 � I814ð Þ rð Þ for all spheroids in the Tadpole field.We can observe a clear correlation between the statistics forthe larger part of the sample: galaxies with high positive meanslopes (indicative of blue cores) also show high values of� V � Ið Þ (i.e., high internal color dispersions). Although theinverse relation is true for most galaxies [i.e., high color
dispersion values, � V � Ið Þk0:06, also have high positiveslopes], we see in Figure 4 that several high � V � Ið Þ galaxieshave flat or even negative slopes. This results because galaxieswith metal-enriched cores tending to have redder centers,making their mean slopes slightly negative or flat, while keep-ing higher-than-normal values of � V � Ið Þ. From Figure 4,we wish to highlight that the mean slope V606 � I814ð Þ rð Þ is amore robust statistic for tracing blue cores as spheroids withpositive slopes and hence that blue cores exhibit high inter-nal color dispersion. In Figure 4, we also present the valuescomputed for the HDF-N spheroids. It is reassuring thatellipticals populate the same region in the � V � Ið Þ–medianslope space for both samples. After individually inspecting theobjects with high � V � Ið Þ values but low or negative slopes,we confirm that these correspond to objects with reddenedcores. We conclude that although both statistics succeed intracing the observed color variations, the mean slope is a morerobust statistic for tracing blue light in spheroids and is notprone to color differences arising from color gradients nor-mally accounted for in passively evolved ellipticals.
5. RESULTS
Establishing the existence of a population of field spheroidswith marked color dispersions, resembling those exhibited byHDF spheroids, is a major objective of this paper. From theconstructed color maps alone we can conclude that this is aproperty shared by field spheroids at intermediate redshifts,regardless of the sample in study. The presence of strongvariations in the internal color distributions suggests episodesof recent star formation activity. However, detailed measure-ments regarding the intensity and timescales involved requireprecise spectroscopic information, not available for the sam-ple in our study. Instead, we opt to determine in a model-independent way the proportion of active systems as a functionof redshift and, on the basis of this information, make edu-cated guesses regarding the evolution of early-type galaxies.Initially, we wish to investigate the behavior of � V � Ið Þ as
a function of redshift. For this, in Figure 5 we display thecomputed values of � V � Ið Þ as a function of their photometricestimations for the Tadpole field (circles) and spectroscopic
Fig. 4.—Comparison between the statistics used to probe variations in theinternal color properties, � V � Ið Þ, and the mean slope, V � Ið Þ, for spheroidsin the Tadpole field, represented by open circles. Values for the HDF-N areshown as hatched circles. The size of the symbols is keyed to the I814 mag-nitude, as indicated in the key. Galaxies with large positive mean slopeV606 � I814ð Þ rð Þ bear blue cores, while those with large � V � Ið Þ values showstrong color dispersion generally associated with blue cores. [See the elec-tronic edition of the Journal for a color version of this figure.]
Fig. 5.—Scatter � V � Ið Þ as a function of redshift for spheroids in theTadpole field, shown as circles. For reference, the values for spectroscopicredshifts from the HDF-N are shown as triangles. Horizontal bars at the toprepresent typical 1 � photometric redshift errors for galaxies in the ACSsample.
MENANTEAU ET AL.208 Vol. 612
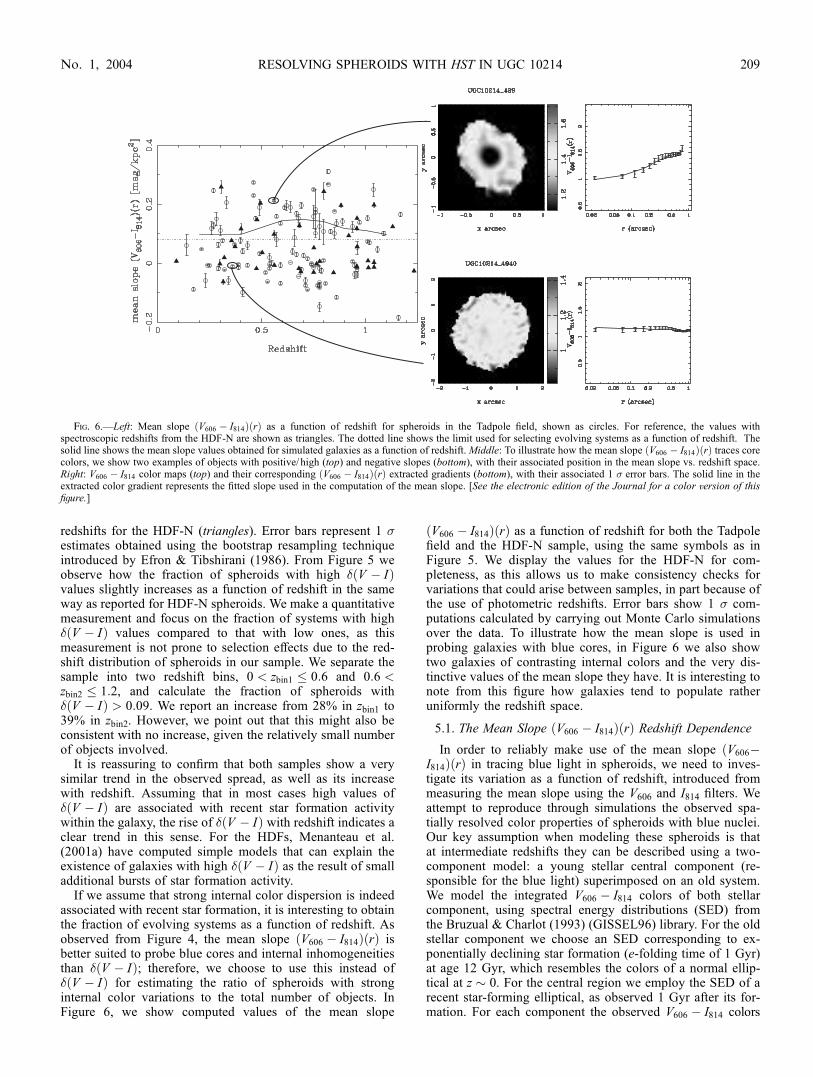
redshifts for the HDF-N (triangles). Error bars represent 1 �estimates obtained using the bootstrap resampling techniqueintroduced by Efron & Tibshirani (1986). From Figure 5 weobserve how the fraction of spheroids with high � V � Ið Þvalues slightly increases as a function of redshift in the sameway as reported for HDF-N spheroids. We make a quantitativemeasurement and focus on the fraction of systems with high� V � Ið Þ values compared to that with low ones, as thismeasurement is not prone to selection effects due to the red-shift distribution of spheroids in our sample. We separate thesample into two redshift bins, 0 < zbin1 � 0:6 and 0:6 <zbin2 � 1:2, and calculate the fraction of spheroids with� V � Ið Þ > 0:09. We report an increase from 28% in zbin1 to39% in zbin2. However, we point out that this might also beconsistent with no increase, given the relatively small numberof objects involved.
It is reassuring to confirm that both samples show a verysimilar trend in the observed spread, as well as its increasewith redshift. Assuming that in most cases high values of� V � Ið Þ are associated with recent star formation activitywithin the galaxy, the rise of � V � Ið Þ with redshift indicates aclear trend in this sense. For the HDFs, Menanteau et al.(2001a) have computed simple models that can explain theexistence of galaxies with high � V � Ið Þ as the result of smalladditional bursts of star formation activity.
If we assume that strong internal color dispersion is indeedassociated with recent star formation, it is interesting to obtainthe fraction of evolving systems as a function of redshift. Asobserved from Figure 4, the mean slope V606 � I814ð Þ rð Þ isbetter suited to probe blue cores and internal inhomogeneitiesthan � V � Ið Þ; therefore, we choose to use this instead of� V � Ið Þ for estimating the ratio of spheroids with stronginternal color variations to the total number of objects. InFigure 6, we show computed values of the mean slope
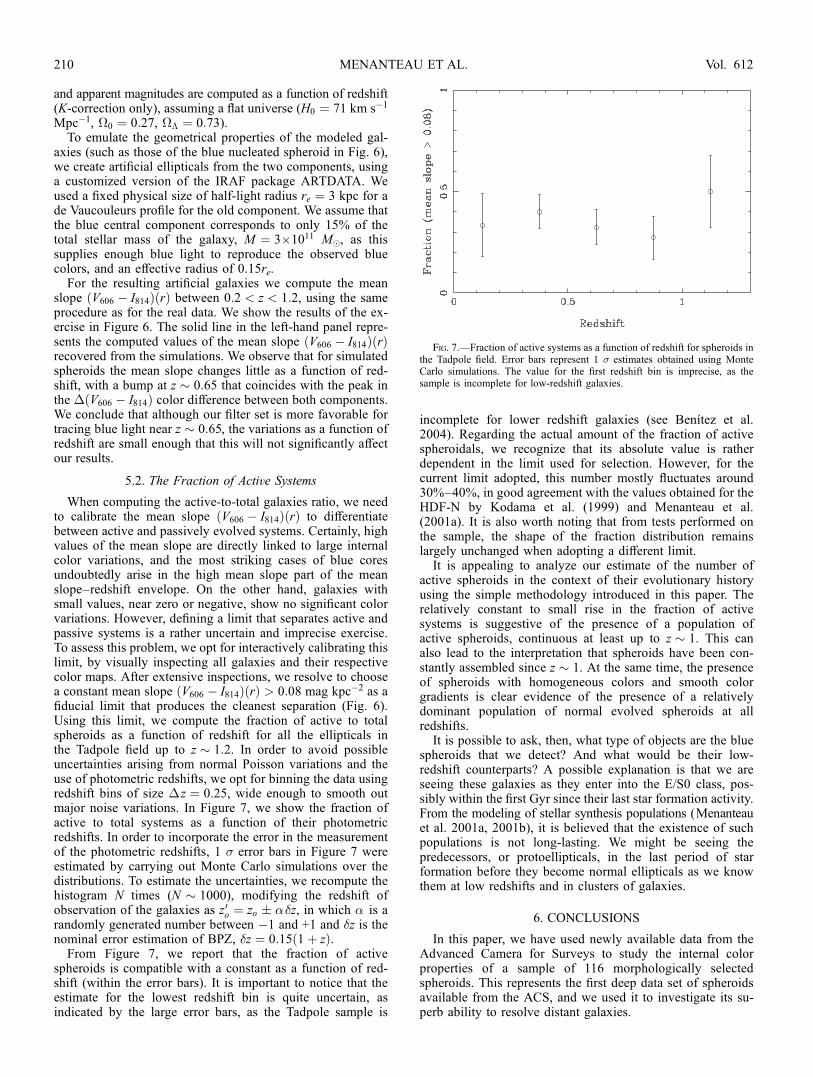
V606 � I814ð Þ rð Þ as a function of redshift for both the Tadpolefield and the HDF-N sample, using the same symbols as inFigure 5. We display the values for the HDF-N for com-pleteness, as this allows us to make consistency checks forvariations that could arise between samples, in part because ofthe use of photometric redshifts. Error bars show 1 � com-putations calculated by carrying out Monte Carlo simulationsover the data. To illustrate how the mean slope is used inprobing galaxies with blue cores, in Figure 6 we also showtwo galaxies of contrasting internal colors and the very dis-tinctive values of the mean slope they have. It is interesting tonote from this figure how galaxies tend to populate ratheruniformly the redshift space.
5.1. The Mean Slope V606 � I814ð Þ rð Þ Redshift DependenceIn order to reliably make use of the mean slope V606�ð
I814Þ rð Þ in tracing blue light in spheroids, we need to inves-tigate its variation as a function of redshift, introduced frommeasuring the mean slope using the V606 and I814 filters. Weattempt to reproduce through simulations the observed spa-tially resolved color properties of spheroids with blue nuclei.Our key assumption when modeling these spheroids is thatat intermediate redshifts they can be described using a two-component model: a young stellar central component (re-sponsible for the blue light) superimposed on an old system.We model the integrated V606 � I814 colors of both stellarcomponent, using spectral energy distributions (SED) fromthe Bruzual & Charlot (1993) (GISSEL96) library. For the oldstellar component we choose an SED corresponding to ex-ponentially declining star formation (e-folding time of 1 Gyr)at age 12 Gyr, which resembles the colors of a normal ellip-tical at z � 0. For the central region we employ the SED of arecent star-forming elliptical, as observed 1 Gyr after its for-mation. For each component the observed V606 � I814 colors
Fig. 6.—Left: Mean slope V606 � I814ð Þ rð Þ as a function of redshift for spheroids in the Tadpole field, shown as circles. For reference, the values withspectroscopic redshifts from the HDF-N are shown as triangles. The dotted line shows the limit used for selecting evolving systems as a function of redshift. Thesolid line shows the mean slope values obtained for simulated galaxies as a function of redshift. Middle: To illustrate how the mean slope V606 � I814ð Þ rð Þ traces corecolors, we show two examples of objects with positive/ high (top) and negative slopes (bottom), with their associated position in the mean slope vs. redshift space.Right: V606 � I814 color maps (top) and their corresponding V606 � I814ð Þ rð Þ extracted gradients (bottom), with their associated 1 � error bars. The solid line in theextracted color gradient represents the fitted slope used in the computation of the mean slope. [See the electronic edition of the Journal for a color version of thisfigure.]
RESOLVING SPHEROIDS WITH HST IN UGC 10214 209No. 1, 2004
and apparent magnitudes are computed as a function of redshift(K-correction only), assuming a flat universe (H0 ¼ 71 km s�1
Mpc�1, �0 ¼ 0:27, �� ¼ 0:73).To emulate the geometrical properties of the modeled gal-
axies (such as those of the blue nucleated spheroid in Fig. 6),we create artificial ellipticals from the two components, usinga customized version of the IRAF package ARTDATA. Weused a fixed physical size of half-light radius re ¼ 3 kpc for ade Vaucouleurs profile for the old component. We assume thatthe blue central component corresponds to only 15% of thetotal stellar mass of the galaxy, M ¼ 3 ; 1011 M�, as thissupplies enough blue light to reproduce the observed bluecolors, and an effective radius of 0.15re.
For the resulting artificial galaxies we compute the meanslope V606 � I814ð Þ rð Þ between 0:2 < z < 1:2, using the sameprocedure as for the real data. We show the results of the ex-ercise in Figure 6. The solid line in the left-hand panel repre-sents the computed values of the mean slope V606 � I814ð Þ rð Þrecovered from the simulations. We observe that for simulatedspheroids the mean slope changes little as a function of red-shift, with a bump at z � 0:65 that coincides with the peak inthe � V606 � I814ð Þ color difference between both components.We conclude that although our filter set is more favorable fortracing blue light near z � 0:65, the variations as a function ofredshift are small enough that this will not significantly affectour results.
5.2. The Fraction of Activve Systems
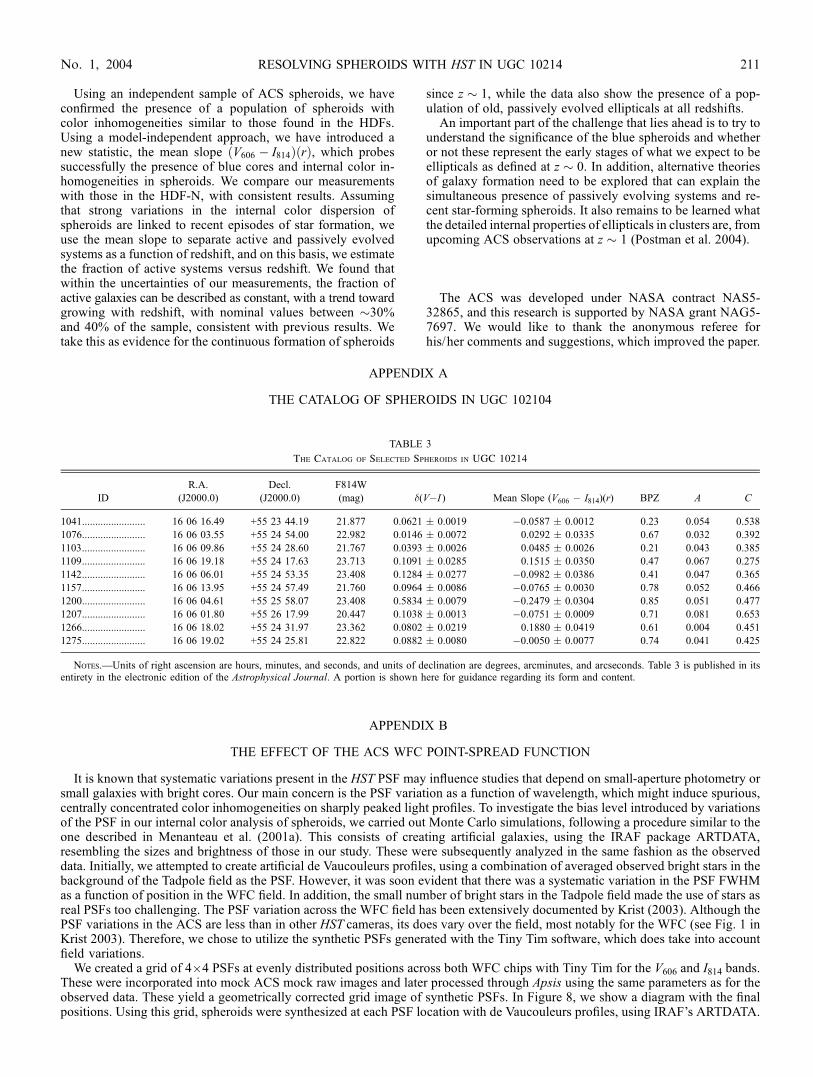
When computing the active-to-total galaxies ratio, we needto calibrate the mean slope V606 � I814ð Þ rð Þ to differentiatebetween active and passively evolved systems. Certainly, highvalues of the mean slope are directly linked to large internalcolor variations, and the most striking cases of blue coresundoubtedly arise in the high mean slope part of the meanslope–redshift envelope. On the other hand, galaxies withsmall values, near zero or negative, show no significant colorvariations. However, defining a limit that separates active andpassive systems is a rather uncertain and imprecise exercise.To assess this problem, we opt for interactively calibrating thislimit, by visually inspecting all galaxies and their respectivecolor maps. After extensive inspections, we resolve to choosea constant mean slope V606 � I814ð Þ rð Þ > 0:08 mag kpc�2 as afiducial limit that produces the cleanest separation (Fig. 6).Using this limit, we compute the fraction of active to totalspheroids as a function of redshift for all the ellipticals inthe Tadpole field up to z � 1:2. In order to avoid possibleuncertainties arising from normal Poisson variations and theuse of photometric redshifts, we opt for binning the data usingredshift bins of size �z ¼ 0:25, wide enough to smooth outmajor noise variations. In Figure 7, we show the fraction ofactive to total systems as a function of their photometricredshifts. In order to incorporate the error in the measurementof the photometric redshifts, 1 � error bars in Figure 7 wereestimated by carrying out Monte Carlo simulations over thedistributions. To estimate the uncertainties, we recompute thehistogram N times (N � 1000), modifying the redshift ofobservation of the galaxies as z0o ¼ zo � ��z, in which � is arandomly generated number between �1 and +1 and �z is thenominal error estimation of BPZ, �z ¼ 0:15 1þ zð Þ.
From Figure 7, we report that the fraction of activespheroids is compatible with a constant as a function of red-shift (within the error bars). It is important to notice that theestimate for the lowest redshift bin is quite uncertain, asindicated by the large error bars, as the Tadpole sample is
incomplete for lower redshift galaxies (see Benıtez et al.2004). Regarding the actual amount of the fraction of activespheroidals, we recognize that its absolute value is ratherdependent in the limit used for selection. However, for thecurrent limit adopted, this number mostly fluctuates around30%–40%, in good agreement with the values obtained for theHDF-N by Kodama et al. (1999) and Menanteau et al.(2001a). It is also worth noting that from tests performed onthe sample, the shape of the fraction distribution remainslargely unchanged when adopting a different limit.It is appealing to analyze our estimate of the number of
active spheroids in the context of their evolutionary historyusing the simple methodology introduced in this paper. Therelatively constant to small rise in the fraction of activesystems is suggestive of the presence of a population ofactive spheroids, continuous at least up to z � 1. This canalso lead to the interpretation that spheroids have been con-stantly assembled since z � 1. At the same time, the presenceof spheroids with homogeneous colors and smooth colorgradients is clear evidence of the presence of a relativelydominant population of normal evolved spheroids at allredshifts.It is possible to ask, then, what type of objects are the blue
spheroids that we detect? And what would be their low-redshift counterparts? A possible explanation is that we areseeing these galaxies as they enter into the E/S0 class, pos-sibly within the first Gyr since their last star formation activity.From the modeling of stellar synthesis populations (Menanteauet al. 2001a, 2001b), it is believed that the existence of suchpopulations is not long-lasting. We might be seeing thepredecessors, or protoellipticals, in the last period of starformation before they become normal ellipticals as we knowthem at low redshifts and in clusters of galaxies.
6. CONCLUSIONS
In this paper, we have used newly available data from theAdvanced Camera for Surveys to study the internal colorproperties of a sample of 116 morphologically selectedspheroids. This represents the first deep data set of spheroidsavailable from the ACS, and we used it to investigate its su-perb ability to resolve distant galaxies.
Fig. 7.—Fraction of active systems as a function of redshift for spheroids inthe Tadpole field. Error bars represent 1 � estimates obtained using MonteCarlo simulations. The value for the first redshift bin is imprecise, as thesample is incomplete for low-redshift galaxies.
MENANTEAU ET AL.210 Vol. 612
Using an independent sample of ACS spheroids, we haveconfirmed the presence of a population of spheroids withcolor inhomogeneities similar to those found in the HDFs.Using a model-independent approach, we have introduced anew statistic, the mean slope V606 � I814ð Þ rð Þ, which probessuccessfully the presence of blue cores and internal color in-homogeneities in spheroids. We compare our measurementswith those in the HDF-N, with consistent results. Assumingthat strong variations in the internal color dispersion ofspheroids are linked to recent episodes of star formation, weuse the mean slope to separate active and passively evolvedsystems as a function of redshift, and on this basis, we estimatethe fraction of active systems versus redshift. We found thatwithin the uncertainties of our measurements, the fraction ofactive galaxies can be described as constant, with a trend towardgrowing with redshift, with nominal values between �30%and 40% of the sample, consistent with previous results. Wetake this as evidence for the continuous formation of spheroids
since z � 1, while the data also show the presence of a pop-ulation of old, passively evolved ellipticals at all redshifts.
An important part of the challenge that lies ahead is to try tounderstand the significance of the blue spheroids and whetheror not these represent the early stages of what we expect to beellipticals as defined at z � 0. In addition, alternative theoriesof galaxy formation need to be explored that can explain thesimultaneous presence of passively evolving systems and re-cent star-forming spheroids. It also remains to be learned whatthe detailed internal properties of ellipticals in clusters are, fromupcoming ACS observations at z � 1 (Postman et al. 2004).
The ACS was developed under NASA contract NAS5-32865, and this research is supported by NASA grant NAG5-7697. We would like to thank the anonymous referee forhis/her comments and suggestions, which improved the paper.
APPENDIX A
THE CATALOG OF SPHEROIDS IN UGC 102104
APPENDIX B
THE EFFECT OF THE ACS WFC POINT-SPREAD FUNCTION
It is known that systematic variations present in the HST PSF may influence studies that depend on small-aperture photometry orsmall galaxies with bright cores. Our main concern is the PSF variation as a function of wavelength, which might induce spurious,centrally concentrated color inhomogeneities on sharply peaked light profiles. To investigate the bias level introduced by variationsof the PSF in our internal color analysis of spheroids, we carried out Monte Carlo simulations, following a procedure similar to theone described in Menanteau et al. (2001a). This consists of creating artificial galaxies, using the IRAF package ARTDATA,resembling the sizes and brightness of those in our study. These were subsequently analyzed in the same fashion as the observeddata. Initially, we attempted to create artificial de Vaucouleurs profiles, using a combination of averaged observed bright stars in thebackground of the Tadpole field as the PSF. However, it was soon evident that there was a systematic variation in the PSF FWHMas a function of position in the WFC field. In addition, the small number of bright stars in the Tadpole field made the use of stars asreal PSFs too challenging. The PSF variation across the WFC field has been extensively documented by Krist (2003). Although thePSF variations in the ACS are less than in other HST cameras, its does vary over the field, most notably for the WFC (see Fig. 1 inKrist 2003). Therefore, we chose to utilize the synthetic PSFs generated with the Tiny Tim software, which does take into accountfield variations.
We created a grid of 4 ; 4 PSFs at evenly distributed positions across both WFC chips with Tiny Tim for the V606 and I814 bands.These were incorporated into mock ACS mock raw images and later processed through Apsis using the same parameters as for theobserved data. These yield a geometrically corrected grid image of synthetic PSFs. In Figure 8, we show a diagram with the finalpositions. Using this grid, spheroids were synthesized at each PSF location with de Vaucouleurs profiles, using IRAF’s ARTDATA.
TABLE 3
The Catalog of Selected Spheroids in UGC 10214
ID
R.A.
(J2000.0)
Decl.
(J2000.0)
F814W
(mag) �(V�I ) Mean Slope (V606 � I814)(r) BPZ A C
1041........................ 16 06 16.49 +55 23 44.19 21.877 0.0621 � 0.0019 �0.0587 � 0.0012 0.23 0.054 0.538
1076........................ 16 06 03.55 +55 24 54.00 22.982 0.0146 � 0.0072 0.0292 � 0.0335 0.67 0.032 0.392
1103........................ 16 06 09.86 +55 24 28.60 21.767 0.0393 � 0.0026 0.0485 � 0.0026 0.21 0.043 0.385
1109........................ 16 06 19.18 +55 24 17.63 23.713 0.1091 � 0.0285 0.1515 � 0.0350 0.47 0.067 0.275
1142........................ 16 06 06.01 +55 24 53.35 23.408 0.1284 � 0.0277 �0.0982 � 0.0386 0.41 0.047 0.365
1157........................ 16 06 13.95 +55 24 57.49 21.760 0.0964 � 0.0086 �0.0765 � 0.0030 0.78 0.052 0.466
1200........................ 16 06 04.61 +55 25 58.07 23.408 0.5834 � 0.0079 �0.2479 � 0.0304 0.85 0.051 0.477
1207........................ 16 06 01.80 +55 26 17.99 20.447 0.1038 � 0.0013 �0.0751 � 0.0009 0.71 0.081 0.653
1266........................ 16 06 18.02 +55 24 31.97 23.362 0.0802 � 0.0219 0.1880 � 0.0419 0.61 0.004 0.451
1275........................ 16 06 19.02 +55 24 25.81 22.822 0.0882 � 0.0080 �0.0050 � 0.0077 0.74 0.041 0.425
Notes.—Units of right ascension are hours, minutes, and seconds, and units of declination are degrees, arcminutes, and arcseconds. Table 3 is published in itsentirety in the electronic edition of the Astrophysical Journal. A portion is shown here for guidance regarding its form and content.
RESOLVING SPHEROIDS WITH HST IN UGC 10214 211No. 1, 2004
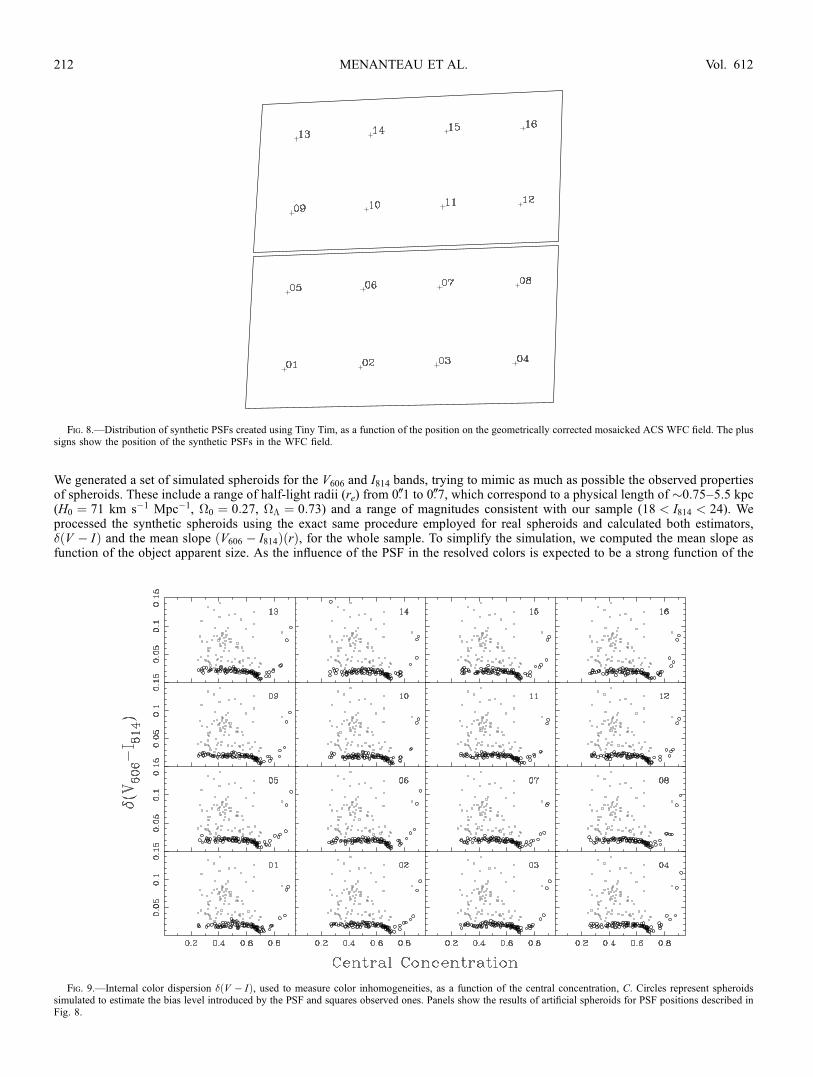
We generated a set of simulated spheroids for the V606 and I814 bands, trying to mimic as much as possible the observed propertiesof spheroids. These include a range of half-light radii (re) from 0B1 to 0B7, which correspond to a physical length of �0.75–5.5 kpc(H0 ¼ 71 km s�1 Mpc�1, �0 ¼ 0:27, �� ¼ 0:73) and a range of magnitudes consistent with our sample (18 < I814 < 24). Weprocessed the synthetic spheroids using the exact same procedure employed for real spheroids and calculated both estimators,� V � Ið Þ and the mean slope V606 � I814ð Þ rð Þ, for the whole sample. To simplify the simulation, we computed the mean slope asfunction of the object apparent size. As the influence of the PSF in the resolved colors is expected to be a strong function of the
Fig. 8.—Distribution of synthetic PSFs created using Tiny Tim, as a function of the position on the geometrically corrected mosaicked ACS WFC field. The plussigns show the position of the synthetic PSFs in the WFC field.
Fig. 9.—Internal color dispersion � V � Ið Þ, used to measure color inhomogeneities, as a function of the central concentration, C. Circles represent spheroidssimulated to estimate the bias level introduced by the PSF and squares observed ones. Panels show the results of artificial spheroids for PSF positions described inFig. 8.
MENANTEAU ET AL.212 Vol. 612
‘‘peakiness’’ of light distribution of the galaxy, we probed the influence of the PSF on real and simulated galaxies against thecentral concentration parameter (x 2.3).
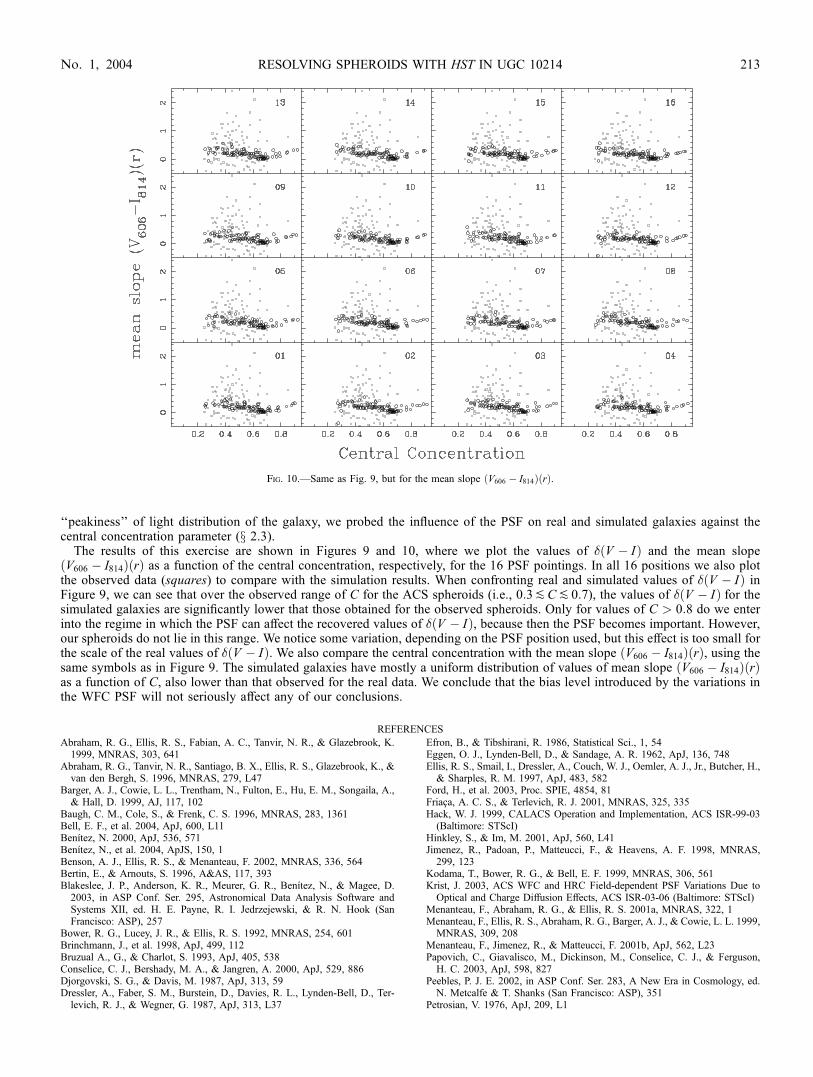
The results of this exercise are shown in Figures 9 and 10, where we plot the values of � V � Ið Þ and the mean slopeV606 � I814ð Þ rð Þ as a function of the central concentration, respectively, for the 16 PSF pointings. In all 16 positions we also plotthe observed data (squares) to compare with the simulation results. When confronting real and simulated values of � V � Ið Þ inFigure 9, we can see that over the observed range of C for the ACS spheroids (i.e., 0:3PCP 0:7), the values of � V � Ið Þ for thesimulated galaxies are significantly lower that those obtained for the observed spheroids. Only for values of C > 0:8 do we enterinto the regime in which the PSF can affect the recovered values of � V � Ið Þ, because then the PSF becomes important. However,our spheroids do not lie in this range. We notice some variation, depending on the PSF position used, but this effect is too small forthe scale of the real values of � V � Ið Þ. We also compare the central concentration with the mean slope V606 � I814ð Þ rð Þ, using thesame symbols as in Figure 9. The simulated galaxies have mostly a uniform distribution of values of mean slope V606 � I814ð Þ rð Þas a function of C, also lower than that observed for the real data. We conclude that the bias level introduced by the variations inthe WFC PSF will not seriously affect any of our conclusions.
REFERENCES
Abraham, R. G., Ellis, R. S., Fabian, A. C., Tanvir, N. R., & Glazebrook, K.1999, MNRAS, 303, 641
Abraham, R. G., Tanvir, N. R., Santiago, B. X., Ellis, R. S., Glazebrook, K., &van den Bergh, S. 1996, MNRAS, 279, L47
Barger, A. J., Cowie, L. L., Trentham, N., Fulton, E., Hu, E. M., Songaila, A.,& Hall, D. 1999, AJ, 117, 102
Baugh, C. M., Cole, S., & Frenk, C. S. 1996, MNRAS, 283, 1361Bell, E. F., et al. 2004, ApJ, 600, L11Benıtez, N. 2000, ApJ, 536, 571Benıtez, N., et al. 2004, ApJS, 150, 1Benson, A. J., Ellis, R. S., & Menanteau, F. 2002, MNRAS, 336, 564Bertin, E., & Arnouts, S. 1996, A&AS, 117, 393Blakeslee, J. P., Anderson, K. R., Meurer, G. R., Benıtez, N., & Magee, D.2003, in ASP Conf. Ser. 295, Astronomical Data Analysis Software andSystems XII, ed. H. E. Payne, R. I. Jedrzejewski, & R. N. Hook (SanFrancisco: ASP), 257
Bower, R. G., Lucey, J. R., & Ellis, R. S. 1992, MNRAS, 254, 601Brinchmann, J., et al. 1998, ApJ, 499, 112Bruzual A., G., & Charlot, S. 1993, ApJ, 405, 538Conselice, C. J., Bershady, M. A., & Jangren, A. 2000, ApJ, 529, 886Djorgovski, S. G., & Davis, M. 1987, ApJ, 313, 59Dressler, A., Faber, S. M., Burstein, D., Davies, R. L., Lynden-Bell, D., Ter-levich, R. J., & Wegner, G. 1987, ApJ, 313, L37
Efron, B., & Tibshirani, R. 1986, Statistical Sci., 1, 54Eggen, O. J., Lynden-Bell, D., & Sandage, A. R. 1962, ApJ, 136, 748Ellis, R. S., Smail, I., Dressler, A., Couch, W. J., Oemler, A. J., Jr., Butcher, H.,& Sharples, R. M. 1997, ApJ, 483, 582
Ford, H., et al. 2003, Proc. SPIE, 4854, 81Friaca, A. C. S., & Terlevich, R. J. 2001, MNRAS, 325, 335Hack, W. J. 1999, CALACS Operation and Implementation, ACS ISR-99-03(Baltimore: STScI)
Hinkley, S., & Im, M. 2001, ApJ, 560, L41Jimenez, R., Padoan, P., Matteucci, F., & Heavens, A. F. 1998, MNRAS,299, 123
Kodama, T., Bower, R. G., & Bell, E. F. 1999, MNRAS, 306, 561Krist, J. 2003, ACS WFC and HRC Field-dependent PSF Variations Due toOptical and Charge Diffusion Effects, ACS ISR-03-06 (Baltimore: STScI)
Menanteau, F., Abraham, R. G., & Ellis, R. S. 2001a, MNRAS, 322, 1Menanteau, F., Ellis, R. S., Abraham, R. G., Barger, A. J., & Cowie, L. L. 1999,MNRAS, 309, 208
Menanteau, F., Jimenez, R., & Matteucci, F. 2001b, ApJ, 562, L23Papovich, C., Giavalisco, M., Dickinson, M., Conselice, C. J., & Ferguson,H. C. 2003, ApJ, 598, 827
Peebles, P. J. E. 2002, in ASP Conf. Ser. 283, A New Era in Cosmology, ed.N. Metcalfe & T. Shanks (San Francisco: ASP), 351
Petrosian, V. 1976, ApJ, 209, L1
Fig. 10.—Same as Fig. 9, but for the mean slope V606 � I814ð Þ rð Þ.
RESOLVING SPHEROIDS WITH HST IN UGC 10214 213No. 1, 2004

Postman, M., et al. 2004, in Carnegie Observatories Astrophysics Series, Vol. 3,Clusters of Galaxies: Probes of Cosmological Structure and Galaxy Evolu-tion, ed. J. S. Mulchaey, A. Dressler, & A. Oemler (Pasadena: CarnegieObs.), http://www.ociw.edu/ociw/symposia/series/symposium3/proceedings/html.
Sandage, A., & Visvanathan, N. 1978, ApJ, 225, 742Tamura, N., Kobayashi, C., Arimoto, N., Kodama, T., & Ohta, K. 2000, AJ,119, 2134
Trager, S. C., Faber, S. M., Worthey, G., & Gonzalez, J. J. 2000, AJ, 120, 165
Tran, H. D., et al. 2003, ApJ, 585, 750Treu, T., & Stiavelli, M. 1999, ApJ, 524, L27Treu, T., Stiavelli, M., Casertano, S., Møller, P., & Bertin, G. 1999, MNRAS,308, 1037
van Dokkum, P. G., & Franx, M. 1996, MNRAS, 281, 985White, S. D. M., & Frenk, C. S. 1991, ApJ, 379, 52White, S. D. M., & Rees, M. J. 1978, MNRAS, 183, 341Zepf, S. E. 1997, Nature, 390, 377
MENANTEAU ET AL.214