Embed Size (px)
DESCRIPTION
Mills, E. 2010. "From Carbon to Light." Lumina Project Technical Report #5
Citation preview
THE LUMINA PROJECT http://light.lbl.gov
The Lumina Project includes an Off-Grid Lighting Technology Assessment activity to provide manufacturers, re-sellers, program managers, and policymakers with information to help ensure the delivery of products that maximize consumer acceptance and the market success of off-grid lighting solutions for the developing world. Periodic Research Notes present new results in a timely fashion between the issuance of more formal and lengthy Technical Reports. Our results should not be construed as product endorsements by the authors or sponsors. For a full archive of publications, see: http://light.lbl.gov/technology-assessment.html
Technical Report #5
From Carbon to Light
A New Framework for Estimating Greenhouse-Gas Reductions from Replacing Fuel-based Lighting with LED Systems
Prepared for the United Nations Framework Convention on Climate Change (UNFCCC)
Small Scale Working Group Clean Development Mechanism (CDM) Executive Board
Evan Mills, Ph.D.
April 9, 2010
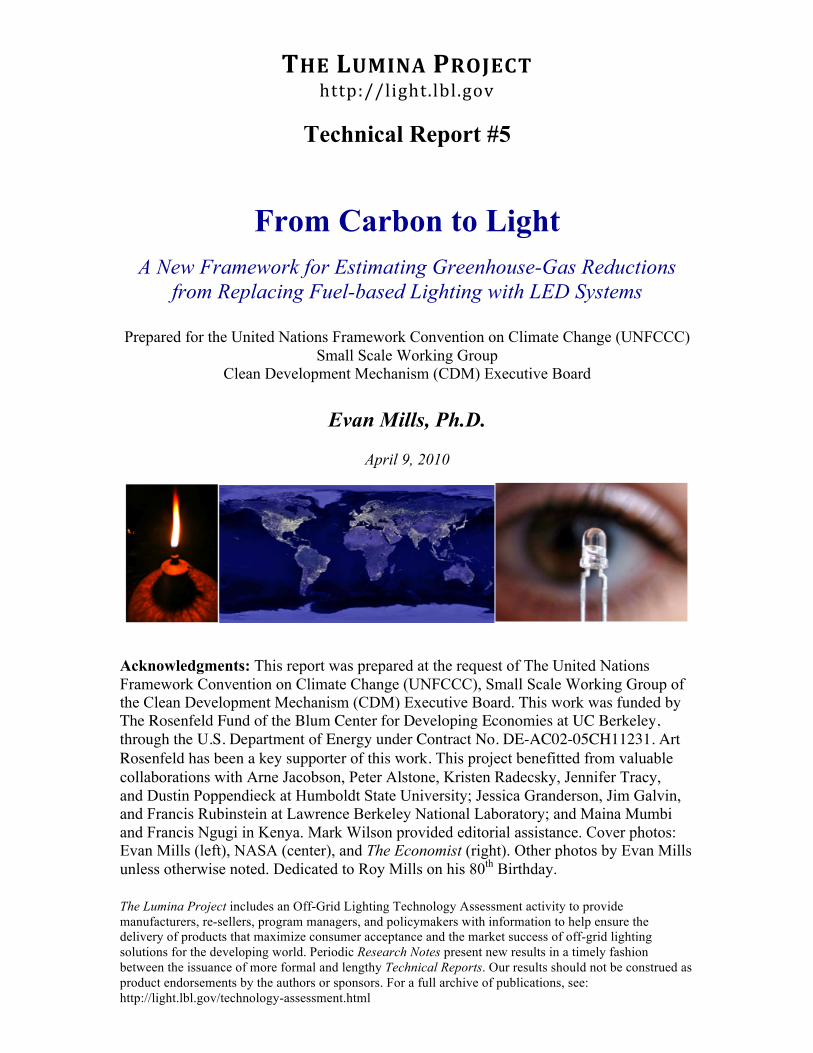
Acknowledgments: This report was prepared at the request of The United Nations Framework Convention on Climate Change (UNFCCC), Small Scale Working Group of the Clean Development Mechanism (CDM) Executive Board. This work was funded by The Rosenfeld Fund of the Blum Center for Developing Economies at UC Berkeley, through the U.S. Department of Energy under Contract No. DE-AC02-05CH11231. Art Rosenfeld has been a key supporter of this work. This project benefitted from valuable collaborations with Arne Jacobson, Peter Alstone, Kristen Radecsky, Jennifer Tracy, and Dustin Poppendieck at Humboldt State University; Jessica Granderson, Jim Galvin, and Francis Rubinstein at Lawrence Berkeley National Laboratory; and Maina Mumbi and Francis Ngugi in Kenya. Mark Wilson provided editorial assistance. Cover photos: Evan Mills (left), NASA (center), and The Economist (right). Other photos by Evan Mills unless otherwise noted. Dedicated to Roy Mills on his 80th Birthday.
2
Contents
Executive Summary .....................................................................................................3
Greenhouse-‐Gas Emissions from Fuel-‐Based Lighting...................................................9
Toward a New Methodology for Assessing CO2 Reductions from Integral Off-‐grid Lighting Alternatives ..................................................................................................19 Standardized Baseline Assumptions .............................................................................................................. 20 Replacement Technology Assumptions ........................................................................................................ 22 Performance Adjustments .................................................................................................................................. 24 Suppressed Demand for Lighting Services .................................................................................................. 27 Additionality ............................................................................................................................................................. 29 Leakage ....................................................................................................................................................................... 32 Monitoring ................................................................................................................................................................. 33 Market Factors ......................................................................................................................................................... 33 Risk Management ................................................................................................................................................... 34
Hypothetical Application of the Proposed Methodology ............................................34
Enabling Analyses ......................................................................................................36
Conclusions...............................................................................................................38
Reference ..................................................................................................................39
3
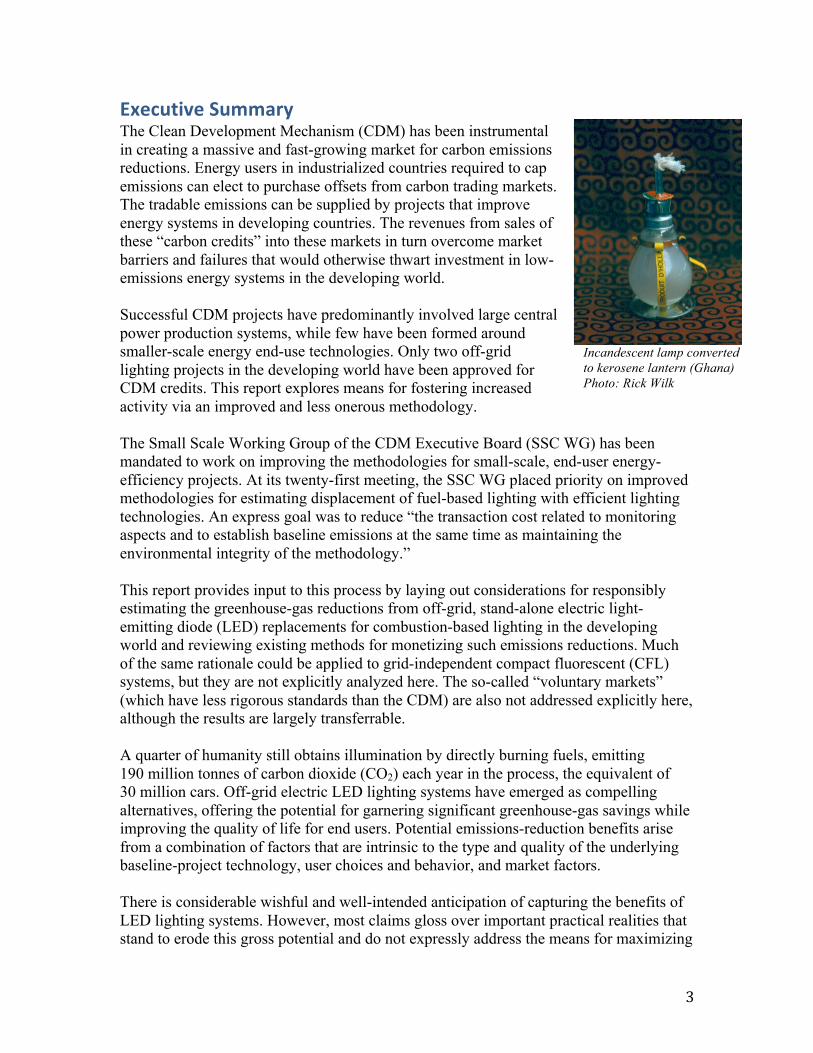
Executive Summary The Clean Development Mechanism (CDM) has been instrumental in creating a massive and fast-growing market for carbon emissions reductions. Energy users in industrialized countries required to cap emissions can elect to purchase offsets from carbon trading markets. The tradable emissions can be supplied by projects that improve energy systems in developing countries. The revenues from sales of these “carbon credits” into these markets in turn overcome market barriers and failures that would otherwise thwart investment in low-emissions energy systems in the developing world. Successful CDM projects have predominantly involved large central power production systems, while few have been formed around smaller-scale energy end-use technologies. Only two off-grid lighting projects in the developing world have been approved for CDM credits. This report explores means for fostering increased activity via an improved and less onerous methodology. The Small Scale Working Group of the CDM Executive Board (SSC WG) has been mandated to work on improving the methodologies for small-scale, end-user energy-efficiency projects. At its twenty-first meeting, the SSC WG placed priority on improved methodologies for estimating displacement of fuel-based lighting with efficient lighting technologies. An express goal was to reduce “the transaction cost related to monitoring aspects and to establish baseline emissions at the same time as maintaining the environmental integrity of the methodology.” This report provides input to this process by laying out considerations for responsibly estimating the greenhouse-gas reductions from off-grid, stand-alone electric light-emitting diode (LED) replacements for combustion-based lighting in the developing world and reviewing existing methods for monetizing such emissions reductions. Much of the same rationale could be applied to grid-independent compact fluorescent (CFL) systems, but they are not explicitly analyzed here. The so-called “voluntary markets” (which have less rigorous standards than the CDM) are also not addressed explicitly here, although the results are largely transferrable. A quarter of humanity still obtains illumination by directly burning fuels, emitting 190 million tonnes of carbon dioxide (CO2) each year in the process, the equivalent of 30 million cars. Off-grid electric LED lighting systems have emerged as compelling alternatives, offering the potential for garnering significant greenhouse-gas savings while improving the quality of life for end users. Potential emissions-reduction benefits arise from a combination of factors that are intrinsic to the type and quality of the underlying baseline-project technology, user choices and behavior, and market factors. There is considerable wishful and well-intended anticipation of capturing the benefits of LED lighting systems. However, most claims gloss over important practical realities that stand to erode this gross potential and do not expressly address the means for maximizing
Incandescent lamp converted to kerosene lantern (Ghana) Photo: Rick Wilk
4
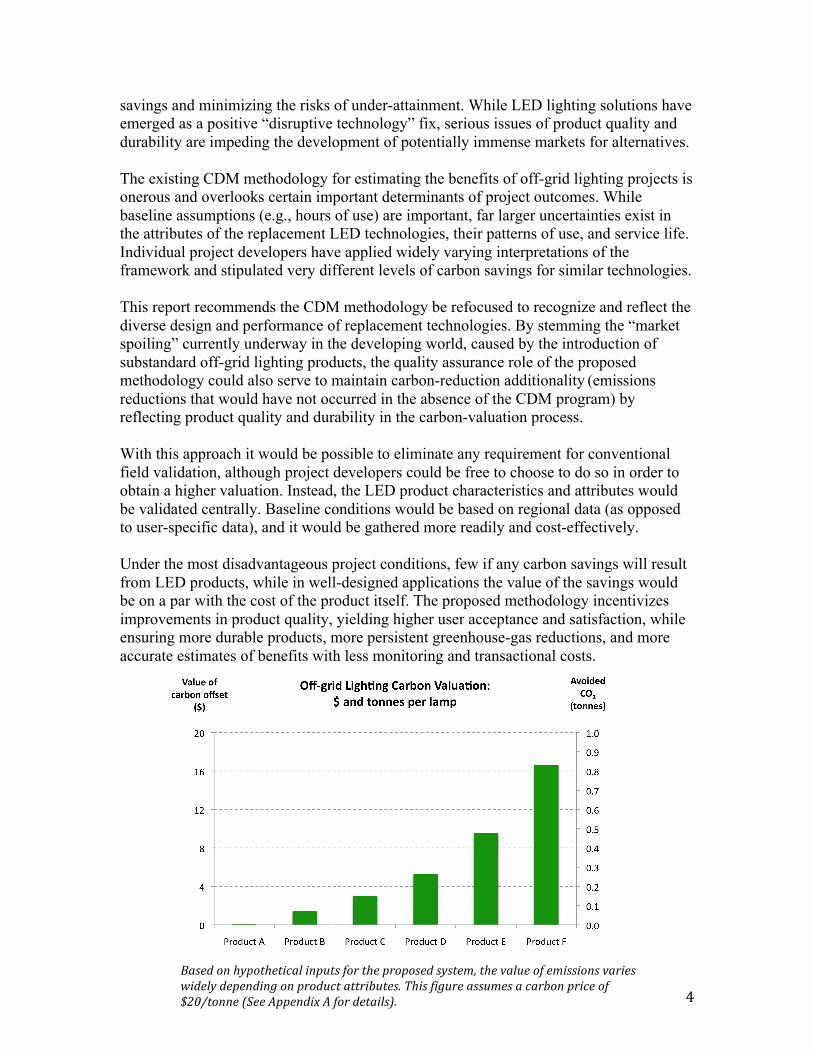
savings and minimizing the risks of under-attainment. While LED lighting solutions have emerged as a positive “disruptive technology” fix, serious issues of product quality and durability are impeding the development of potentially immense markets for alternatives. The existing CDM methodology for estimating the benefits of off-grid lighting projects is onerous and overlooks certain important determinants of project outcomes. While baseline assumptions (e.g., hours of use) are important, far larger uncertainties exist in the attributes of the replacement LED technologies, their patterns of use, and service life. Individual project developers have applied widely varying interpretations of the framework and stipulated very different levels of carbon savings for similar technologies. This report recommends the CDM methodology be refocused to recognize and reflect the diverse design and performance of replacement technologies. By stemming the “market spoiling” currently underway in the developing world, caused by the introduction of substandard off-grid lighting products, the quality assurance role of the proposed methodology could also serve to maintain carbon-reduction additionality (emissions reductions that would have not occurred in the absence of the CDM program) by reflecting product quality and durability in the carbon-valuation process. With this approach it would be possible to eliminate any requirement for conventional field validation, although project developers could be free to choose to do so in order to obtain a higher valuation. Instead, the LED product characteristics and attributes would be validated centrally. Baseline conditions would be based on regional data (as opposed to user-specific data), and it would be gathered more readily and cost-effectively. Under the most disadvantageous project conditions, few if any carbon savings will result from LED products, while in well-designed applications the value of the savings would be on a par with the cost of the product itself. The proposed methodology incentivizes improvements in product quality, yielding higher user acceptance and satisfaction, while ensuring more durable products, more persistent greenhouse-gas reductions, and more accurate estimates of benefits with less monitoring and transactional costs.
Based on hypothetical inputs for the proposed system, the value of emissions varies widely depending on product attributes. This figure assumes a carbon price of $20/tonne (See Appendix A for details).
5
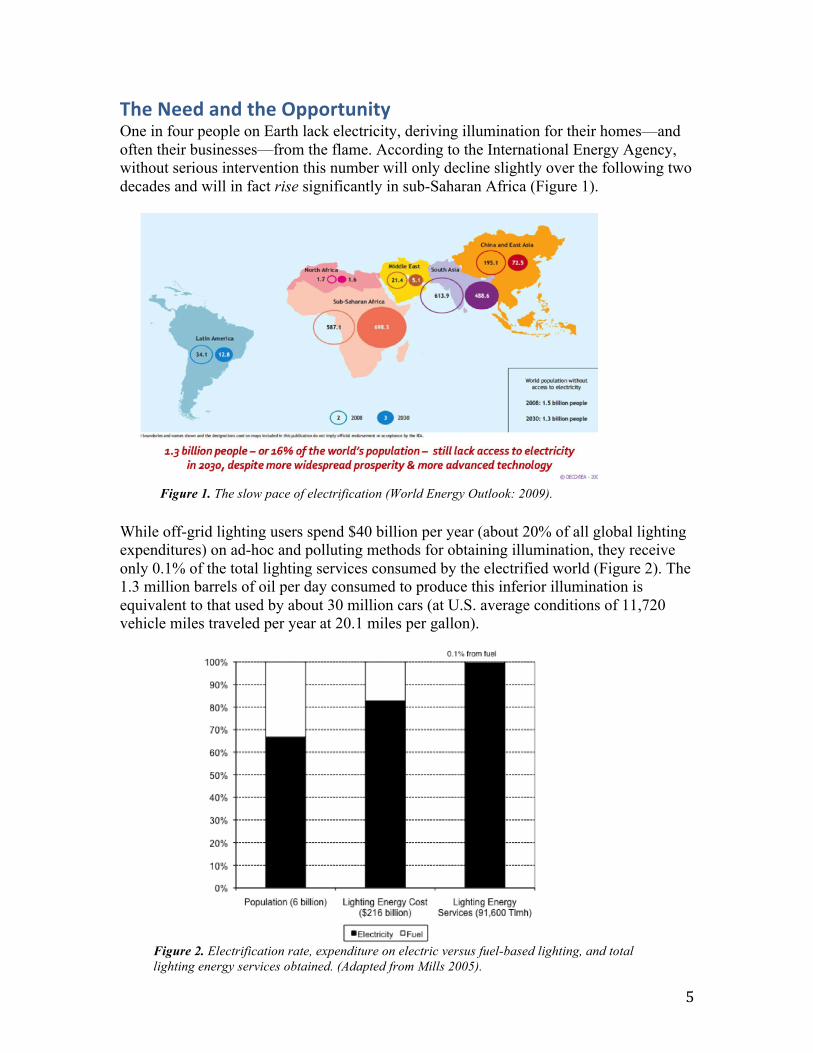
The Need and the Opportunity One in four people on Earth lack electricity, deriving illumination for their homes—and often their businesses—from the flame. According to the International Energy Agency, without serious intervention this number will only decline slightly over the following two decades and will in fact rise significantly in sub-Saharan Africa (Figure 1).
While off-grid lighting users spend $40 billion per year (about 20% of all global lighting expenditures) on ad-hoc and polluting methods for obtaining illumination, they receive only 0.1% of the total lighting services consumed by the electrified world (Figure 2). The 1.3 million barrels of oil per day consumed to produce this inferior illumination is equivalent to that used by about 30 million cars (at U.S. average conditions of 11,720 vehicle miles traveled per year at 20.1 miles per gallon).
Figure 1. The slow pace of electrification (World Energy Outlook: 2009).
Figure 2. Electrification rate, expenditure on electric versus fuel-based lighting, and total lighting energy services obtained. (Adapted from Mills 2005).
6
As such, the primary by-product of illuminating unelectrified homes and businesses in the developing world using fuels is, sadly, greenhouse-gas emissions and only secondly light. The current state of affairs contributes to poverty—with the average user spending about 5% of their income on lighting fuel—as well as to global warming. Other adverse impacts include suppressed productivity when fuel-based lighting is used in market or production contexts, adverse effects on health through burn risks and indoor air pollution (Apple et al. 2010), poor reading conditions, and reduced nighttime security. With a combination of new technologies and appropriate market-delivery solutions, this situation can be reversed to a profound degree.1 The single-most promising of these new technologies are solid-state light sources, or, as they are more commonly known LEDs (light-emitting diodes) (Lighting Africa 2010). They offer many attributes that are superior or are otherwise a more appropriate fit to developing-country lighting needs than is fluorescent lighting technology—which, prior to the advent of LED lighting has been rightfully promoted as the best way to improve efficiency in comparison to traditional incandescent light sources. Properly applied, the energy savings from LEDs compared to fluorescents can be on a par with those of fluorescents compared to incandescents. LEDs also offer a number of other attributes that are highly desirable in a developing-country context, including: ruggedness, absence of mercury, ability to run on low voltages, compact/portable size, and a form factor well-suited toward directing light on the required task with very high optical efficiencies. Although diffuse compared to lighting markets in the industrialized world, the existing fuel-based off-grid lighting market is present in well over 100 countries and has a widespread distributed delivery system (Figure 3). Elements of this market have also shown the ability to adopt new technologies rapidly (e.g., 90% of flashlights in one part of Kenya are now based on LEDs (Johnstone et al. 2009). Properly designed and manufactured, a wide diversity of LED lighting systems could displace large quantities of kerosene lighting (Figure 4). This shift would be driven by dramatically lower operating costs and a host of other end-user benefits. The efficiency of fuel-based lighting strategies can be as low as 0.04 lumens per watt, or less than 1/1000th
1 Note that many proponents of off-grid lighting conflate the documented health impacts and mortalities associated with fuelwood with those from lighting. However, while cookstoves no doubt pose a far greater threat to health and life than do lighting fuels, those from lighting are not trivial.
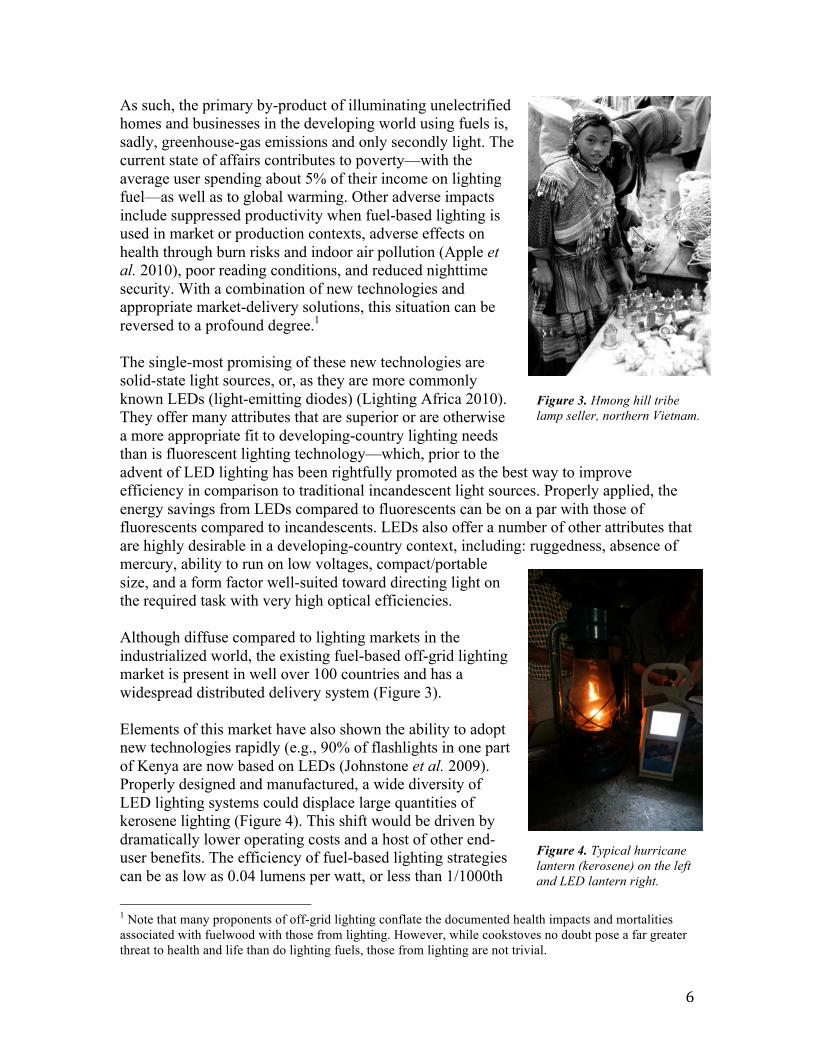
Figure 3. Hmong hill tribe lamp seller, northern Vietnam.
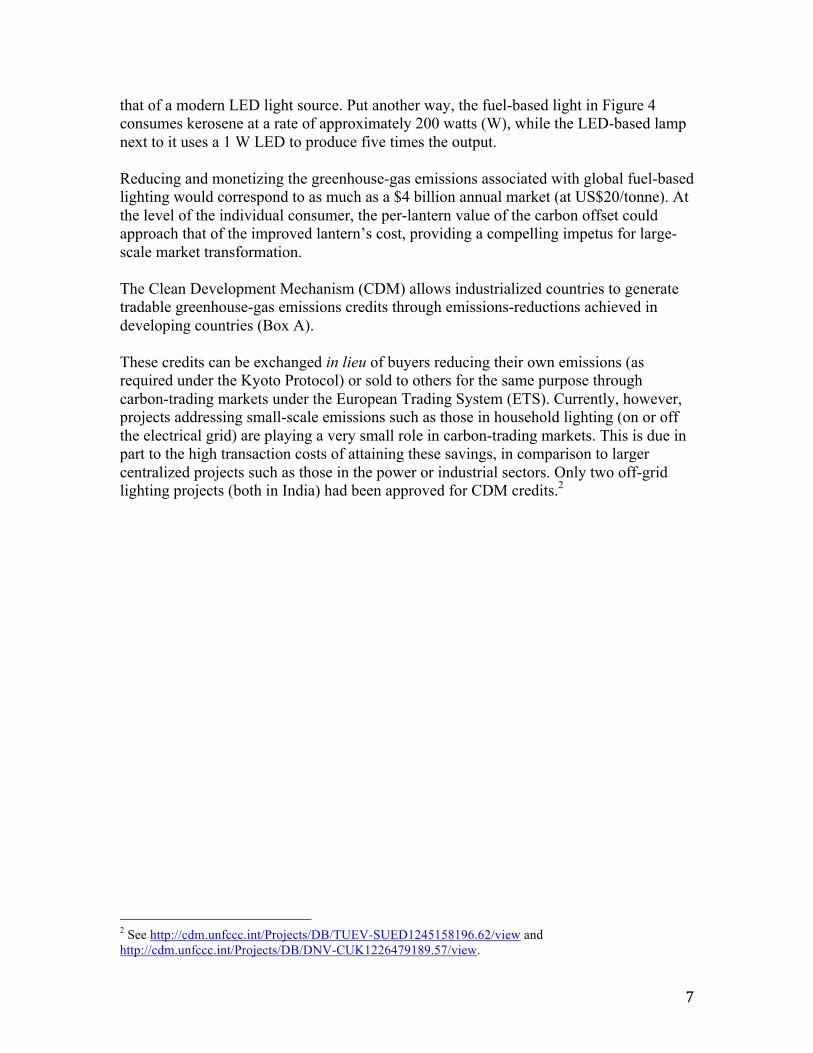
Figure 4. Typical hurricane lantern (kerosene) on the left and LED lantern right.
7
that of a modern LED light source. Put another way, the fuel-based light in Figure 4 consumes kerosene at a rate of approximately 200 watts (W), while the LED-based lamp next to it uses a 1 W LED to produce five times the output. Reducing and monetizing the greenhouse-gas emissions associated with global fuel-based lighting would correspond to as much as a $4 billion annual market (at US$20/tonne). At the level of the individual consumer, the per-lantern value of the carbon offset could approach that of the improved lantern’s cost, providing a compelling impetus for large-scale market transformation. The Clean Development Mechanism (CDM) allows industrialized countries to generate tradable greenhouse-gas emissions credits through emissions-reductions achieved in developing countries (Box A). These credits can be exchanged in lieu of buyers reducing their own emissions (as required under the Kyoto Protocol) or sold to others for the same purpose through carbon-trading markets under the European Trading System (ETS). Currently, however, projects addressing small-scale emissions such as those in household lighting (on or off the electrical grid) are playing a very small role in carbon-trading markets. This is due in part to the high transaction costs of attaining these savings, in comparison to larger centralized projects such as those in the power or industrial sectors. Only two off-grid lighting projects (both in India) had been approved for CDM credits.2
2 See http://cdm.unfccc.int/Projects/DB/TUEV-SUED1245158196.62/view and http://cdm.unfccc.int/Projects/DB/DNV-CUK1226479189.57/view.
8
Box A. The Clean Development Mechanism3
Binding Targets
The central feature of the Kyoto Protocol is its requirement that countries limit or reduce their greenhouse gas emissions. By setting such targets, emission reductions took on economic value. To help countries meet their emission targets, and to encourage the private sector and developing countries to contribute to emission-‐reduction efforts, negotiators of the Protocol included three market-‐based mechanisms: Emissions Trading, the Clean Development Mechanism, and Joint Implementation.
Clean Development Mechanism
The CDM allows emission-‐reduction (or emission-‐removal) projects in developing countries to earn certified emission reduction (CER) credits, each equivalent to one tonne of CO2. These CERs can be traded and sold and used by industrialized countries to a meet a part of their emission-‐reduction targets under the Kyoto Protocol.
The mechanism stimulates sustainable development and emission reductions, while giving industrialized countries some flexibility in how they meet their emission-‐reduction limitation targets.
The projects must qualify through a rigorous and public registration and issuance process designed to ensure real, measurable, and verifiable emission reductions that are additional to what would have occurred without the project. The mechanism is overseen by the CDM Executive Board, answerable ultimately to the countries that have ratified the Kyoto Protocol.
To be considered for registration, a project must first be approved by the Designated National Authorities (DNA).
Operational since the beginning of 2006, the mechanism has already registered more than 1,000 projects and is anticipated to produce CER credits amounting to more than 2.7 billion tonnes of CO2 equivalent in the first commitment period of the Kyoto Protocol: 2008–2012.
The mechanism is seen by many as a trailblazer. It is the first global, environmental investment and credit scheme of its kind, providing a standardized emissions offset instrument: CER credits.
3 This information is derived from the CDM website as of 23 February 2010. See http://cdm.unfccc.int/about/index.html.
9
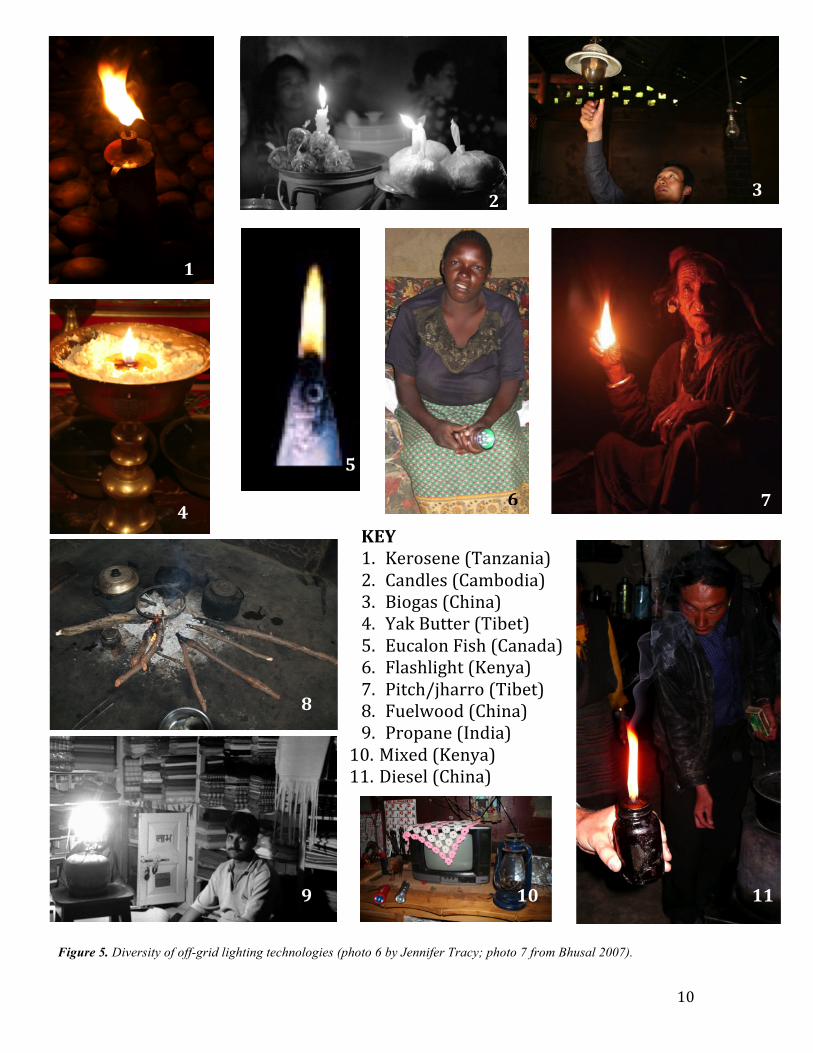
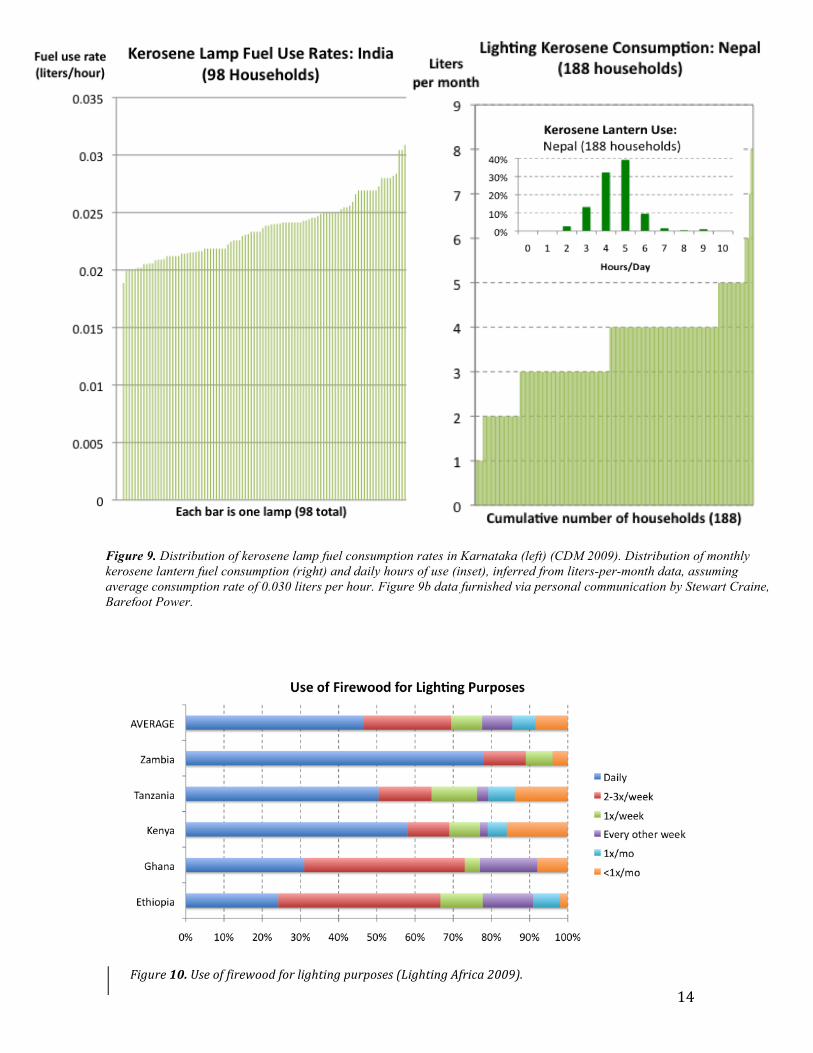
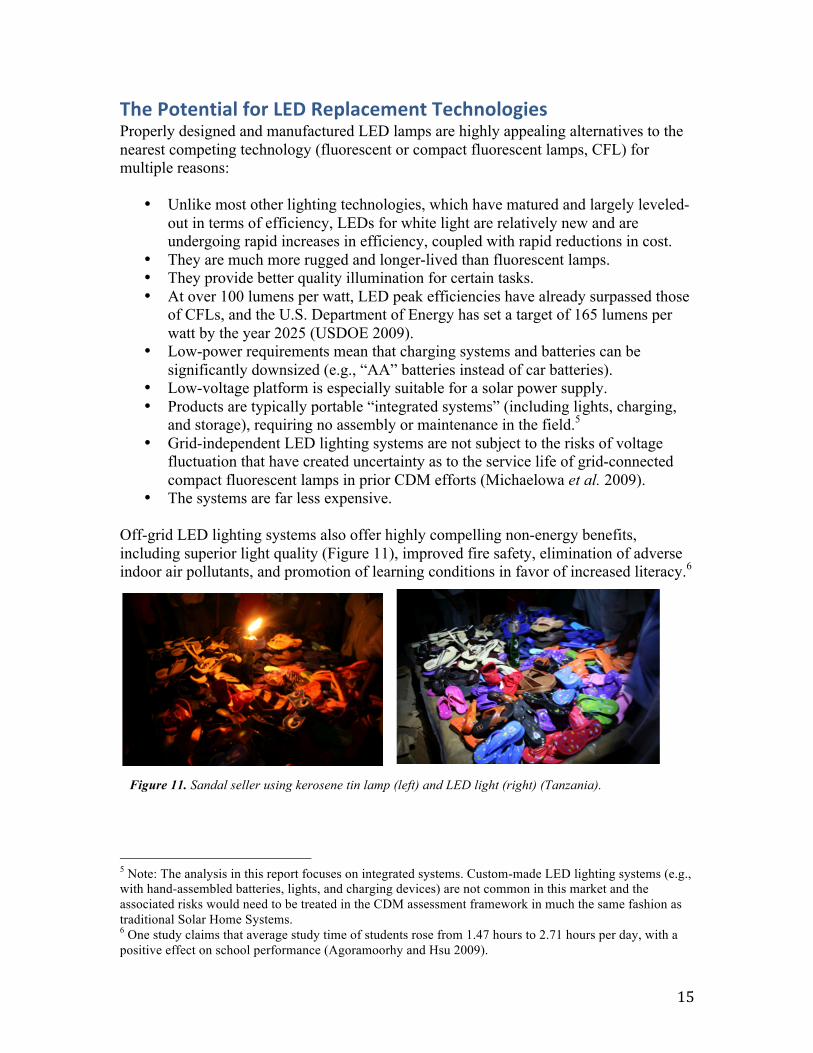
Greenhouse-‐Gas Emissions from Fuel-‐Based Lighting People without access to electricity grids (or distributed generation such as diesel sets or house- or village-scale renewable power) obtain light in a remarkable variety of ways (Figure 5). The predominant fuel is kerosene, but other ubiquitous sources include diesel, candles, various forms of biofuels, and even battery-powered televisions. Users commonly employ more than one type of fuel and consume them in a variety of types of lamps (Figure 6a-b). Patterns differ by country, and at far smaller scales. Each lamp-fuel combination results in a different carbon intensity (emissions per hour of utilization). Figure 7 provides an example limited to a family of kerosene-burning lamps. The one published global estimate of greenhouse-gas emissions from fuel-based lighting places the value at 190 million tonnes of CO2 per year (Mills 2005). This estimate could well be conservative, especially given the growth in the population of un-electrified people since it was made. The estimate did not explicitly include biomass, other greenhouse-gases, or the global warming potential of associated black carbon (“soot”). Non-household uses (Figure 8) were only roughly estimated, and results were not broken out by geography or demographic factors. A compilation of 28 surveys from around the world showed a variation of 3 to 30 liters per month of lighting fuel use (Mills 2005). The intensity of use also varies widely within countries and even specific demographics (Figure 9). The drivers of these wide differences are not primarily attributable to geography.4 For example, in Ghana (and no doubt elsewhere) night vendors use lamps with very large wicks that consume fuel at the rate of 0.06 liters per hour, and use-rates for these lamps varied by up to a factor of two depending on wick length. This, combined with very long hours of use, result in annual fuel use of about 180 liters as compared to approximately 20 liters for ordinary households using conventional lamps for shorter periods of time each day. A widely overlooked and unquantified source of greenhouse-gas emissions is the use of non-renewable biomass fuels for the provision of illumination. As seen in Figure 6a, nearly 20% of homes in Ethiopia report using these fuels for lighting (Lighting Africa 2009). Biofuel light sources include raw plant and wood fuels (from grass to resins), vegetable oil, biogas, yak butter, and animal oils. Wood cooking fires are used to an unknown degree for illumination globally, and at least in some contexts for this reason are burned longer than required for cooking. The Tanzania household survey reports that 7% of rural households use firewood as a primary source of lighting, and the value runs as high as 24% in one district (National Bureau of Statistics Tanzania 2002). The degree to which these fuels are sustainably produced versus net carbon producers has not been quantified. Of the five countries surveyed by the Lighting Africa Project, half the households report using fuelwood daily for illumination, and two-thirds report doing so two or three times a week (Figure 10).
4 However, geography can be taken into consideration for things like baseline lighting fuel mix, prevailing fuel prices, and willingness to pay for alternative technologies.
10
KEY 1. Kerosene (Tanzania) 2. Candles (Cambodia) 3. Biogas (China) 4. Yak Butter (Tibet) 5. Eucalon Fish (Canada) 6. Flashlight (Kenya) 7. Pitch/jharro (Tibet) 8. Fuelwood (China) 9. Propane (India) 10. Mixed (Kenya) 11. Diesel (China)
1
2 3
4 7 6
11 10 9
8
5
Figure 5. Diversity of off-grid lighting technologies (photo 6 by Jennifer Tracy; photo 7 from Bhusal 2007).
11
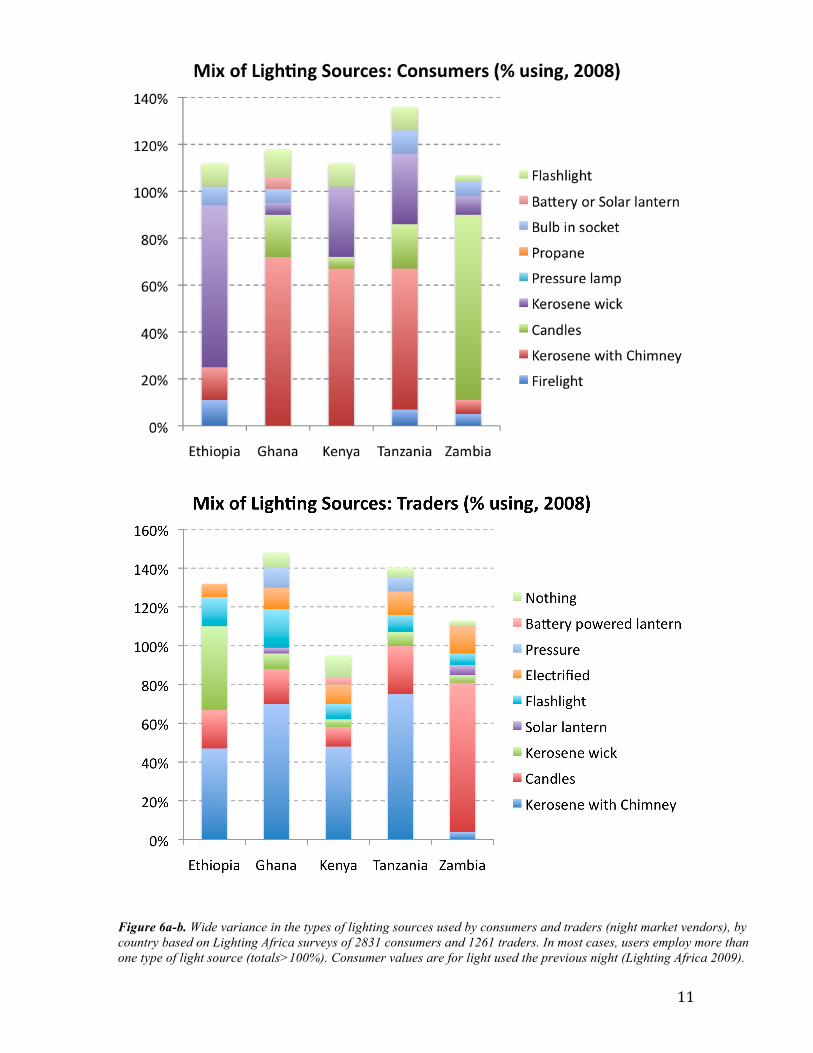
Figure 6a-b. Wide variance in the types of lighting sources used by consumers and traders (night market vendors), by country based on Lighting Africa surveys of 2831 consumers and 1261 traders. In most cases, users employ more than one type of light source (totals>100%). Consumer values are for light used the previous night (Lighting Africa 2009).
12
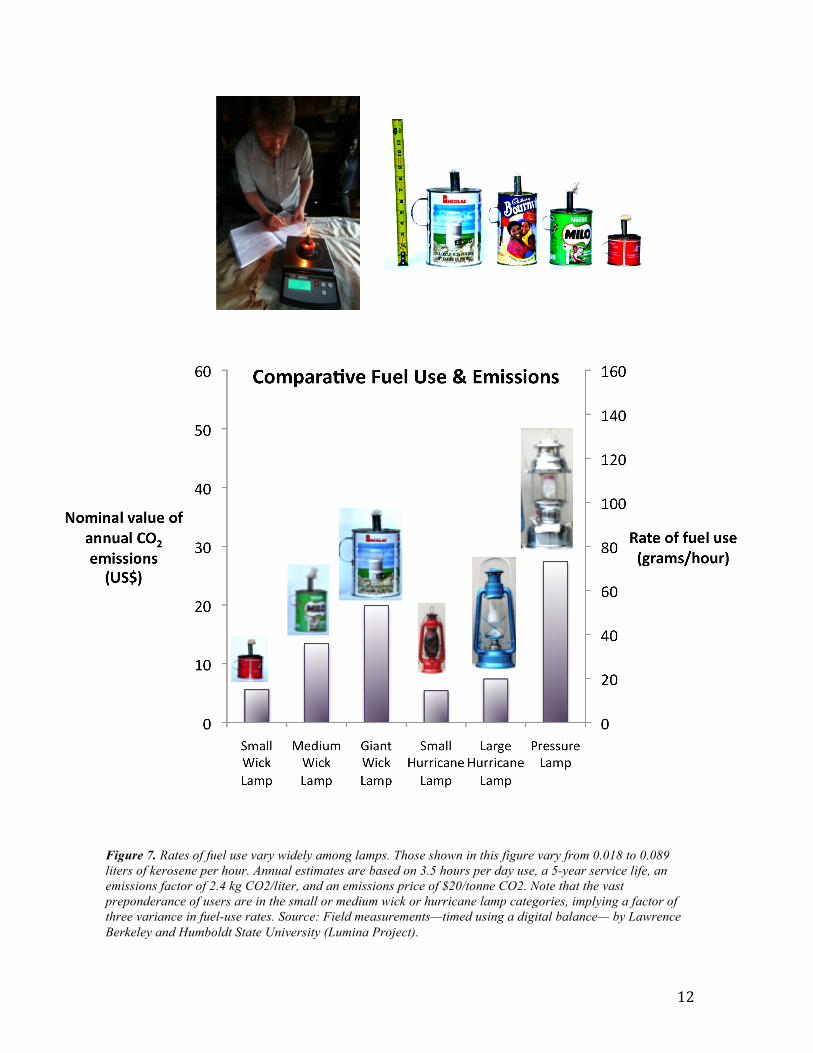
Figure 7. Rates of fuel use vary widely among lamps. Those shown in this figure vary from 0.018 to 0.089 liters of kerosene per hour. Annual estimates are based on 3.5 hours per day use, a 5-year service life, an emissions factor of 2.4 kg CO2/liter, and an emissions price of $20/tonne CO2. Note that the vast preponderance of users are in the small or medium wick or hurricane lamp categories, implying a factor of three variance in fuel-use rates. Source: Field measurements—timed using a digital balance— by Lawrence Berkeley and Humboldt State University (Lumina Project).
13
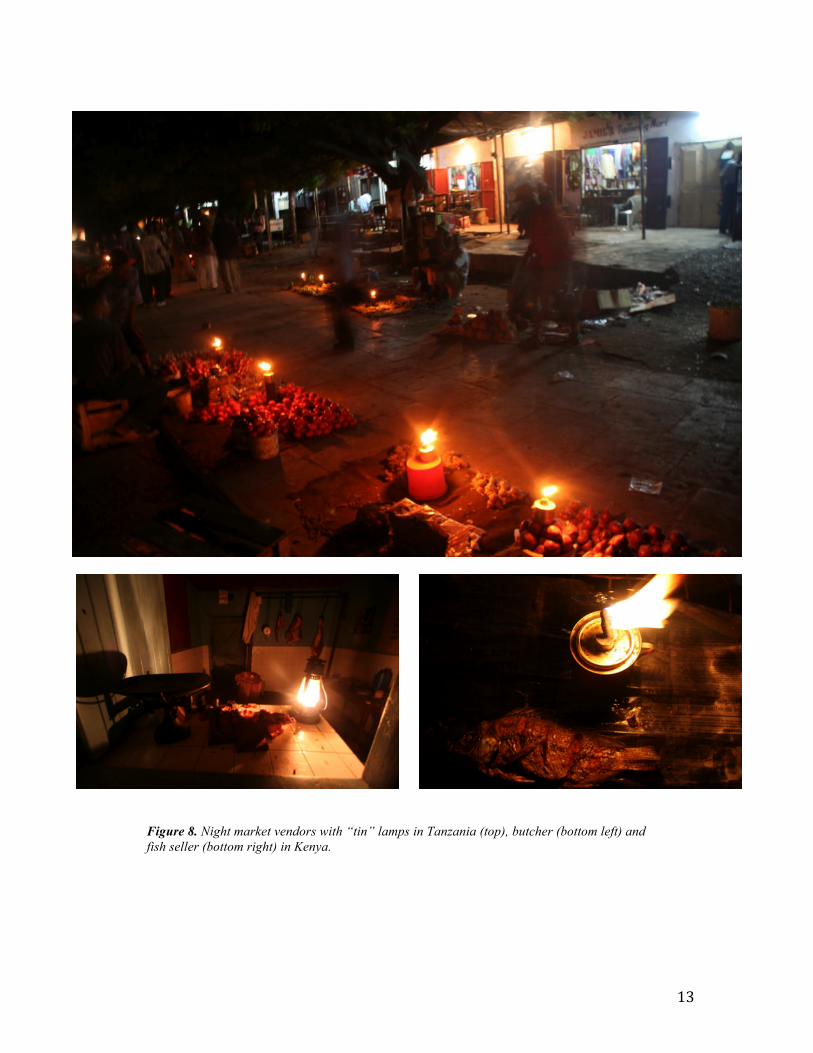
Figure 8. Night market vendors with “tin” lamps in Tanzania (top), butcher (bottom left) and fish seller (bottom right) in Kenya.
14
Figure 9. Distribution of kerosene lamp fuel consumption rates in Karnataka (left) (CDM 2009). Distribution of monthly kerosene lantern fuel consumption (right) and daily hours of use (inset), inferred from liters-per-month data, assuming average consumption rate of 0.030 liters per hour. Figure 9b data furnished via personal communication by Stewart Craine, Barefoot Power.
Figure 10. Use of firewood for lighting purposes (Lighting Africa 2009).
15
The Potential for LED Replacement Technologies Properly designed and manufactured LED lamps are highly appealing alternatives to the nearest competing technology (fluorescent or compact fluorescent lamps, CFL) for multiple reasons:
• Unlike most other lighting technologies, which have matured and largely leveled-out in terms of efficiency, LEDs for white light are relatively new and are undergoing rapid increases in efficiency, coupled with rapid reductions in cost.
• They are much more rugged and longer-lived than fluorescent lamps. • They provide better quality illumination for certain tasks. • At over 100 lumens per watt, LED peak efficiencies have already surpassed those
of CFLs, and the U.S. Department of Energy has set a target of 165 lumens per watt by the year 2025 (USDOE 2009).
• Low-power requirements mean that charging systems and batteries can be significantly downsized (e.g., “AA” batteries instead of car batteries).
• Low-voltage platform is especially suitable for a solar power supply. • Products are typically portable “integrated systems” (including lights, charging,
and storage), requiring no assembly or maintenance in the field.5 • Grid-independent LED lighting systems are not subject to the risks of voltage
fluctuation that have created uncertainty as to the service life of grid-connected compact fluorescent lamps in prior CDM efforts (Michaelowa et al. 2009).
• The systems are far less expensive.
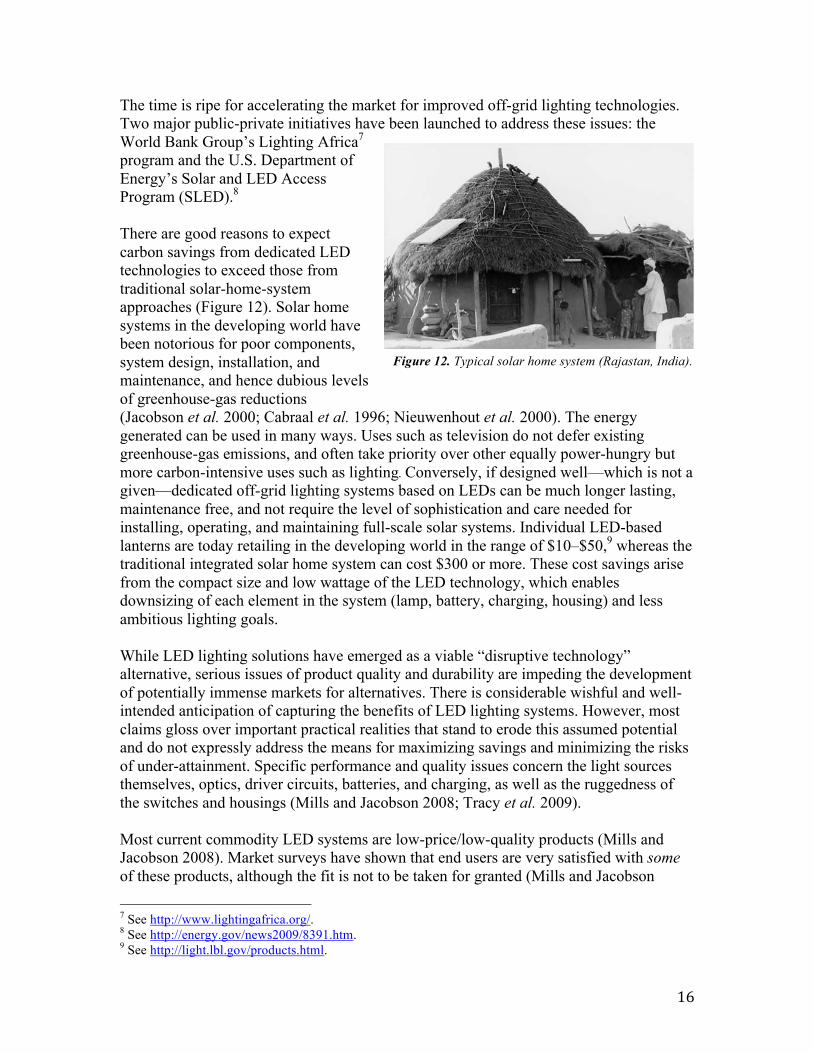
Off-grid LED lighting systems also offer highly compelling non-energy benefits, including superior light quality (Figure 11), improved fire safety, elimination of adverse indoor air pollutants, and promotion of learning conditions in favor of increased literacy.6
5 Note: The analysis in this report focuses on integrated systems. Custom-made LED lighting systems (e.g., with hand-assembled batteries, lights, and charging devices) are not common in this market and the associated risks would need to be treated in the CDM assessment framework in much the same fashion as traditional Solar Home Systems. 6 One study claims that average study time of students rose from 1.47 hours to 2.71 hours per day, with a positive effect on school performance (Agoramoorhy and Hsu 2009).
Figure 11. Sandal seller using kerosene tin lamp (left) and LED light (right) (Tanzania).
16
The time is ripe for accelerating the market for improved off-grid lighting technologies. Two major public-private initiatives have been launched to address these issues: the World Bank Group’s Lighting Africa7 program and the U.S. Department of Energy’s Solar and LED Access Program (SLED).8 There are good reasons to expect carbon savings from dedicated LED technologies to exceed those from traditional solar-home-system approaches (Figure 12). Solar home systems in the developing world have been notorious for poor components, system design, installation, and maintenance, and hence dubious levels of greenhouse-gas reductions (Jacobson et al. 2000; Cabraal et al. 1996; Nieuwenhout et al. 2000). The energy generated can be used in many ways. Uses such as television do not defer existing greenhouse-gas emissions, and often take priority over other equally power-hungry but more carbon-intensive uses such as lighting. Conversely, if designed well—which is not a given—dedicated off-grid lighting systems based on LEDs can be much longer lasting, maintenance free, and not require the level of sophistication and care needed for installing, operating, and maintaining full-scale solar systems. Individual LED-based lanterns are today retailing in the developing world in the range of $10–$50,9 whereas the traditional integrated solar home system can cost $300 or more. These cost savings arise from the compact size and low wattage of the LED technology, which enables downsizing of each element in the system (lamp, battery, charging, housing) and less ambitious lighting goals. While LED lighting solutions have emerged as a viable “disruptive technology” alternative, serious issues of product quality and durability are impeding the development of potentially immense markets for alternatives. There is considerable wishful and well-intended anticipation of capturing the benefits of LED lighting systems. However, most claims gloss over important practical realities that stand to erode this assumed potential and do not expressly address the means for maximizing savings and minimizing the risks of under-attainment. Specific performance and quality issues concern the light sources themselves, optics, driver circuits, batteries, and charging, as well as the ruggedness of the switches and housings (Mills and Jacobson 2008; Tracy et al. 2009). Most current commodity LED systems are low-price/low-quality products (Mills and Jacobson 2008). Market surveys have shown that end users are very satisfied with some of these products, although the fit is not to be taken for granted (Mills and Jacobson
7 See http://www.lightingafrica.org/. 8 See http://energy.gov/news2009/8391.htm. 9 See http://light.lbl.gov/products.html.
Figure 12. Typical solar home system (Rajastan, India).
17
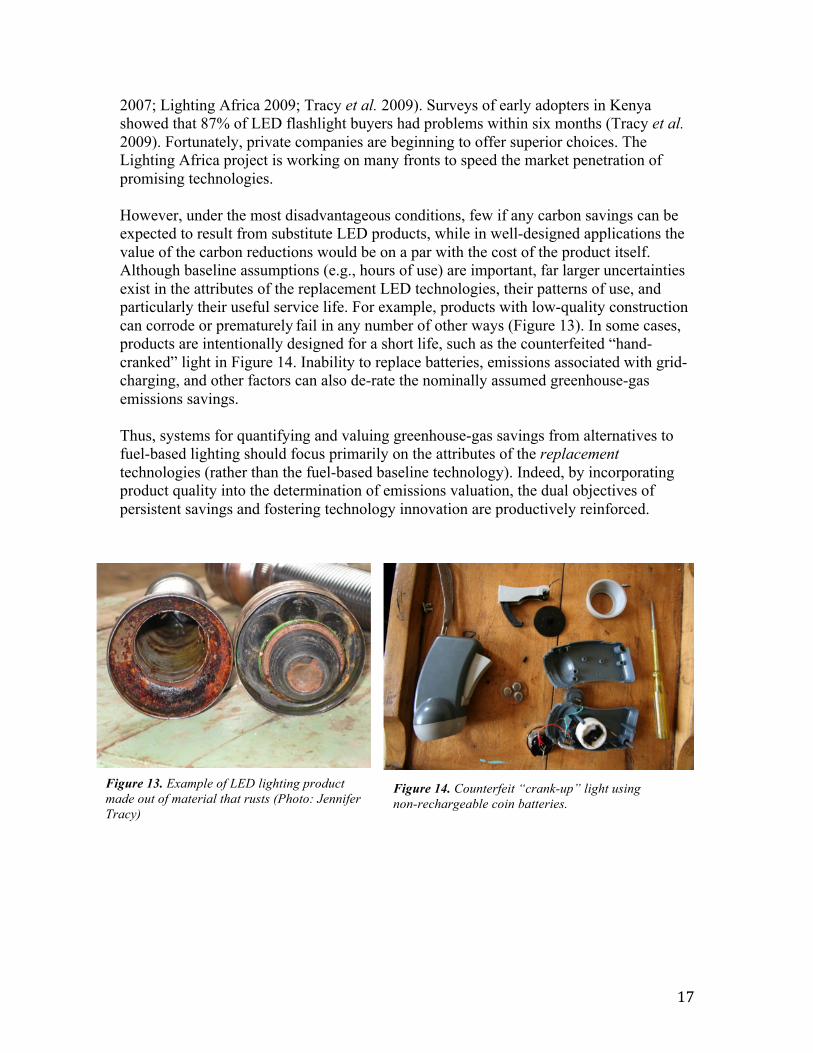
2007; Lighting Africa 2009; Tracy et al. 2009). Surveys of early adopters in Kenya showed that 87% of LED flashlight buyers had problems within six months (Tracy et al. 2009). Fortunately, private companies are beginning to offer superior choices. The Lighting Africa project is working on many fronts to speed the market penetration of promising technologies. However, under the most disadvantageous conditions, few if any carbon savings can be expected to result from substitute LED products, while in well-designed applications the value of the carbon reductions would be on a par with the cost of the product itself. Although baseline assumptions (e.g., hours of use) are important, far larger uncertainties exist in the attributes of the replacement LED technologies, their patterns of use, and particularly their useful service life. For example, products with low-quality construction can corrode or prematurely fail in any number of other ways (Figure 13). In some cases, products are intentionally designed for a short life, such as the counterfeited “hand-cranked” light in Figure 14. Inability to replace batteries, emissions associated with grid-charging, and other factors can also de-rate the nominally assumed greenhouse-gas emissions savings. Thus, systems for quantifying and valuing greenhouse-gas savings from alternatives to fuel-based lighting should focus primarily on the attributes of the replacement technologies (rather than the fuel-based baseline technology). Indeed, by incorporating product quality into the determination of emissions valuation, the dual objectives of persistent savings and fostering technology innovation are productively reinforced.
Figure 13. Example of LED lighting product made out of material that rusts (Photo: Jennifer Tracy)
Figure 14. Counterfeit “crank-up” light using non-rechargeable coin batteries.
18
Adequacy of Existing Carbon Accounting Frameworks The apparent simplicity of the flame and the compelling nature of the alternatives make the derivation of carbon savings seem straightforward. The temptation is to stipulate the savings as the difference between a baseline that is simply the product of an assumed fixed rate of fuel, a fixed level of use, and an assumed product life, and then compare the result to zero emissions for a replacement electric light. This simplified approach might be reduced as shown in the following example: Baseline = 0.025 liters/hour x 3.5 hr/day x 365 days/year x 10 yrs (lifetime) = 319 liters of kerosene Energy Saved = 319 liters of kerosene (100% offset) Carbon Reduction = 0.77 tonnes CO2 over the replacement product’s lifetime
It is notable that if such savings were to be valued at European Union Emission Trading System (EU-ETS) carbon market prices, the revenue could be substantial: about $15 (at current carbon prices), which is on a par with the ultimate retail cost of the lantern. Within the Clean Development Mechanism, the existing methodology for evaluating off-grid lighting projects is incorporated into the “Indicative simplified baseline and monitoring methodologies for selected small-scale CDM project activity categories,” I.A/Version 13 (AMS-I.A) (UNFCCC 2010). Following are some aspects of the existing methodology that could be improved:
• The language is highly technical in places (including complicated mathematical
formulas), which could create a deterrent to its use. • As the methodology attempts to cover to a very wide range of technologies and
end-use contexts, many passages are not applicable to off-grid lighting and thus impede the method’s use.
• The method seems to implicitly focus on the household sector. Non-household users (such as night market vendors, cottage industry, schools, clinics, and fishermen) are significant and should be accommodated. Often, a single light is moved between both locations.
• Suppressed demand is not addressed. • The methodology calls for measurement and verification that could be perceived
as too cumbersome by project developers, and in cases not possible (Michaelowa 2009).
• Section 7(c) Option 3 recommends a default daily usage value of 3.5 hours, which is reasonable, but that estimate should be reviewed more closely and allowances made for differing conditions.
• The requirement of measuring and verifying baseline lamp fuel-use rates is onerous and subject to considerable error and uncertainty (given the wide range of possible baseline lighting types and behaviors).
19
• The methodology treats the replacement technology as having a highly predictable set of uniform attributes, when in fact there may be many types of proposed replacements with varying attributes that affect the amount of greenhouse-gas emissions offsets.
• LED systems introduced under the programs may be treated uniformly, even if there is a material difference in the mix of specific products deployed under the program.
• Quality assurance of the replacement lamps is relegated to the post-deployment period, but it could be more effective if done before deployment.
• The methodology is silent on product service life, and has accepted dubiously long default values.
• The method does not accommodate the prevalent baseline case of electrified consumers that rely on fuel-based lighting during power outages.
• The case of centralized grid-charged replacement lights is not addressed. This is a significant limitation, as grid-based charging is the preferred strategy in locations where there is sufficient infrastructure (typically in the form of distributed mobile-phone-charging microenterprises). Thus, this provision inadvertently discriminates against one of the more popular technology options among end users.
• The method implicitly assumes perfect (100%) substitution of the electric light source for the fuel used in the baseline.
• The project “Boundary” is defined as a “geographical site,” which is probably not meaningful in the case of portable devices such as self-contained LED lighting systems.
When the aforementioned factors are regarded in a highly favorable manner—or disregarded altogether—projects will, not surprisingly be assumed to attain larger levels of carbon reductions than may be defensible. Silence on key factors also invites widely varying estimates of impacts. The two existing CDM projects for off-grid lighting differ by a factor of three in the stipulated per-lamp savings. Each of these factors is considered in the proposed new methodology. The particularly rapid rate at which LED technologies are changing, combined with extensive new market research yielding new information should be considered in regular updates.
Toward a New Methodology for Assessing CO2 Reductions from Integral Off-‐grid Lighting Alternatives Ideally, an effective approach for refining the existing methodology would be one that adheres to principles that simplify and improve the existing methodology, while recognizing the value of high-quality technologies (which will generate more certain carbon reductions over a longer timeframe). This is particularly challenging given the large but diffuse target populations, diversity of baseline conditions and replacement technologies, and the low potential revenues per participant, compared to many other carbon-reduction technologies.
20
Such principles could include:
1. The methodology is easy to understand and apply. 2. The methodology recognizes important technology, user, and market determinants
of outcomes. 3. Assumptions and variables can be independently verified. 4. Carbon valuation is linked to the quality of the project and the technologies. 5. The cost of implementation is not a barrier to its application.
The following approach is consistent with these objectives.
Standardized Baseline Assumptions In evaluating the acceptability of variance in default values, it should be recognized that there is always a distribution of values in practice (Figure 9), and taking the central value can accurately represent a population of lighting users or an array of lighting technologies. One of the analytical benefits of small-scale projects with large numbers of participants is that a given project will be highly randomized by many data points as compared to, for example, a single large power plant. Recently, a new CDM methodology (AMS II J) for CFL projects pioneered the concept of including default conservative operating parameters as an alternative to costly continuous monitoring (Michaelowa et al. 2009). While there is a 5-fold variance in the standardized hourly rates of emissions from fuel-based lighting products as seen in Figure 7, the vast majority of products are of the small-to-medium wick and hurricane lantern type, which places the variance at 2- to 3-fold. However, in practice there is significant overlap depending on how the wick is managed, wind conditions, compounded by unknowns in the average daily hours of use. Also, there will be a diversity of these fuel-based products in most markets, which has the effect of reducing the blended population-weighted averages. Self-reported values for these types of variables are not necessarily reliable.10 It can be argued that efforts to accurately measure these variables at the end-user level, especially over time, are futile. Most importantly, the effective variability of these products is far less than the performance uncertainties of replacement electric LED technologies. We propose offering users of the methodology a conservative, standardized set of basic defaults that could be selected in lieu of costly field assessments. The current CDM methodology for off-grid lighting (AMS-1.A) standardizes daily lantern usage, and we would also recommend standardizing the fuel-use rates to obtain a standardized amount of fuel used per month (per lantern).
10 In a recent study (Tracy et al. 2010), night watchmen reported an estimated time of 3.5 hours of flashlight use per night; however, preliminary results from digital data logging indicates that nightly time of use is closer to 1.5 hours on average. In another study (Radecsky et al. 2008), households also reported higher than actual measured rates of use.
21
Alternative values should be permitted if adequate research/monitoring/documentation is provided. Interested third parties, non-governmental organizations (NGOs), and governmental bodies could improve the accuracy and functioning of this market by conducting strategic surveys and research to improve the basis for alternate assumptions (thereby eliminating the transaction cost of doing so faced by private businesses attempting to operate in the market). Exemplars of elements of such surveys exist in the recent studies conducted in five Sub-Saharan countries by the International Finance Corporation (IFC) and the World Bank’s Lighting Africa project (Lighting Africa 2009). Following are the types of parameters we recommend including in the baseline analysis: • Pre-existing fuel-based technology
o Fuel-use rate (liters/hour) – There is a wide-range of fuel-based lighting sources, and limited testing has been conducted. Fuel-use rates range from 0.01 to 0.10 liters per hour, with most products operating in the 0.02 to 0.04 l/h range (i.e., the small/medium wick lamps and the kerosene lanterns, see Figures 6a-6b). A value of 0.025 is a reasonable conservative approximation in lieu of superior local data.11 Surveys conducted by Lighting Africa (2009) provide data on the mix of fuels, which could be used where available to develop improved country-specific estimates. Field verification of these values for a specific project is impractical and easily gamed by end-users.
o Utilization (hours/day) – There are limited data on hours-per-day utilization of fuel-based lighting. It certainly varies by income and user group, but also for less predictable reasons. A value of 3.5 hours per day (as currently used in the AMS-1.A framework) is a realistic or conservative approximation for most cases. Recent surveys of 5000 households across five sub-Saharan countries found average values of 3 to 5 hours for evenings only (excluding early-morning lighting) (Lighting Africa 2009). However, fixing this value would inadvertently create a disincentive for program developers to identify and target particularly high-use groups. Users of the methodology should thus have an opportunity to submit suitable alternative data for consideration.
o Utilization (days/year) – Here a default value of 365 days is reasonable. For unreliably electrified contexts, lower values must be used based on acceptable published information (presumably available directly from the power production authorities). For this purpose, it would be reasonable to take the average over a multi-year outage history for an appropriate region (city, sub-grid) rather than at the household level. A major challenge still would remain, however, in ascertaining whether a given buyer was using a light in a grid-connected context.
11 One of the two currently approved off-grid lighting projects conducted a baseline study of 98 homes and found the average to be 0.024 liters per hour. See http://cdm.unfccc.int/UserManagement/FileStorage/45VLX2N0KBF6I37POAUCSTMY9W8ZRE. Det Norske Veritas (DNV) cites the Petroleum Conservation Research Association (PCRA) http://www.pcra.org/English/domestic/comparison.htm in support of a baseline kerosene lamp fuel utilization rate assumption of 0.025 liters per hour.
22
o Fuel emissions factor (kilograms [kg] CO2 /liter) – These values are well known, and vary depending on the fuel being offset. A value of 2.4 kg CO2 per liter of kerosene is reasonable. In the case where biomass is the baseline fuel, it would be necessary to determine the net baseline emissions (if any). In practice, a variety of light sources may be replaced by the new technology. A context-specific blended fuel-mix could be proposed by users of the methodology. Where data are available in the open literature, UNFCCC may choose to develop official fuel mixes (emissions factors) for use as default values in specific regions or contexts.
o Suppressed demand multiplier – As discussed in greater detail below, there is clearly vast suppressed demand for illumination in the developing world. There is a “step function” when a fuel-based light user becomes well enough off to switch to the grid. A conservative approach would be to take the difference between a standardized flame lamp and the light provided by a standardized LED system. This could be further increased if there were a basis for assuming that the user would also add more points of light compared to the baseline. For example, assuming a standard lantern produces 25 lumens of light and an LED system produces 50 lumens, the adjustment would be a factor of two. If the typical user had two fuel-based lanterns under baseline conditions and increased to three under the program an additional 1.5x multiplier could be applied. This adjustment process is vulnerable to gaming.
o Dynamic baseline multiplier – A number of factors can be expected to alter baseline consumption of lighting fuels upward or downward during the service life of carbon-reducing products. These include oil price increases/decreases/subsidies, numbers of people per household, income, and electrification. If there is a basis for estimating these factors among the user population, the value can be specified as a net annual rate (e.g., 5%) and then compounded over the Adjusted Product Service Life (see below). At a minimum, in cases where there is increasing income, the consumption of lighting fuels will likely increase, and thus the baseline would grow during the time the alternative lamp was in service. A study of Ethiopian households estimated that kerosene use grows considerably faster than income (Mulugeta 2004).
Replacement Technology Assumptions Far greater uncertainties exist in the application of the alternative technologies, such as integrated LED lighting systems. We recommend again choosing a highly conservative set of default assumptions, and then applying performance-adjustment factors to reflect varying attributes that can determine the amounts of fuel-based lighting that are ultimately offset. We note that shifting the analysis to the replacement technology addresses considerable uncertainties overlooked in the existing AMS-1.A methodology, and does so through applying readily available data that does not involve costly and fallible house-by-house measurement and verification processes. In this case, verification can be performed at the point of sale or even further upstream in the product manufacture/delivery process. Importantly, this approach also incorporates incentives for technology and program delivery quality (which are absent from the current methodology).
23
• LED replacement technology
o Leakage factor (persistence in use of fuel-based light source) – While it is tempting to assume that replacement lighting systems will fully displace the baseline fuel on a one-to-one basis, this assumption is not easily justified. In practice, users are likely to move their original fuel-based light to a different location or to use it in conjunction with the new light source. A conservative default substitution efficacy of 50% may be applied. Because the baseline technologies are so inexpensive (e.g., $0.20 for a standard “tin” lamp) recovering and destroying the replaced technologies would not provide a credible basis for assuming perfect or near-perfect substitution. Even higher-quality “hurricane” lanterns are relatively inexpensive (~$5), and there is significant potential for otherwise gaming the system (e.g., turning in a new; unused tin lamp) combined with high transaction costs of verification over time. It could be argued that this relocated fuel-based light source is just reducing suppressed demand, and that no carbon penalty should be assessed.
o Number of fuel-based lamps replaced per LED – Well-designed LEDs may be able to replace multiple fuel-based lamps, thereby increasing the carbon offset considerably. A perhaps conservative default assumption of 1:1 should be assumed in lieu of acceptable alternate data from the applicant.
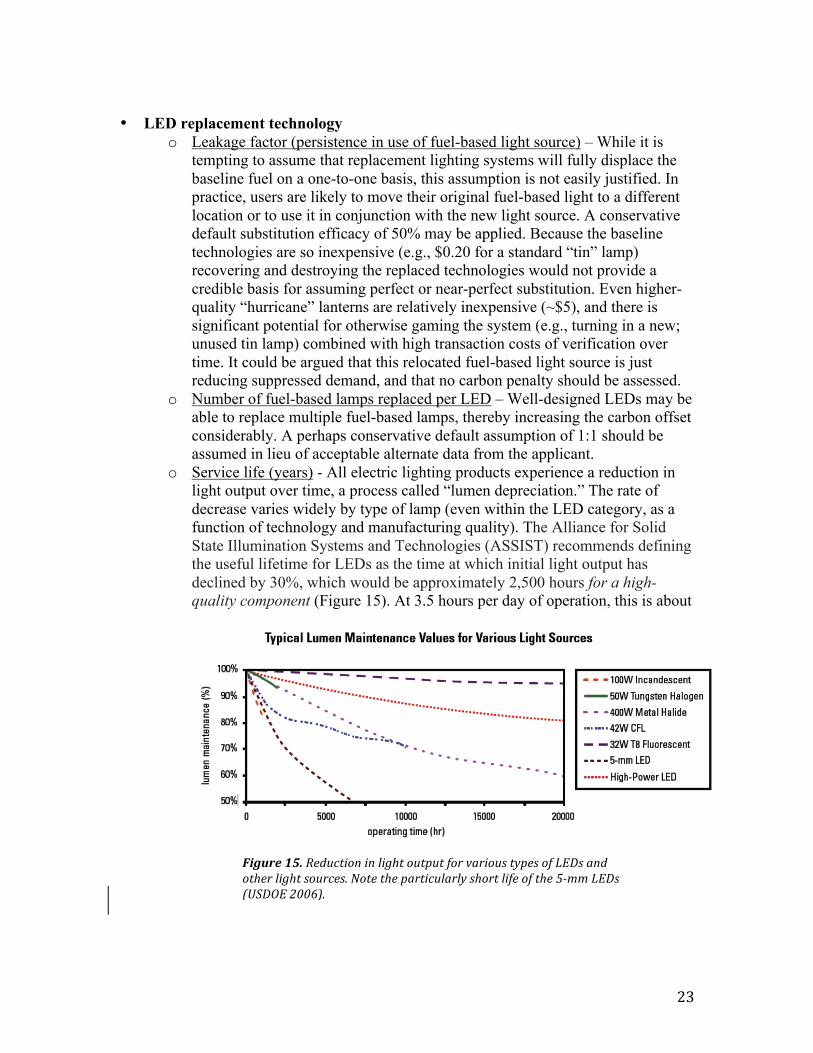
o Service life (years) - All electric lighting products experience a reduction in light output over time, a process called “lumen depreciation.” The rate of decrease varies widely by type of lamp (even within the LED category, as a function of technology and manufacturing quality). The Alliance for Solid State Illumination Systems and Technologies (ASSIST) recommends defining the useful lifetime for LEDs as the time at which initial light output has declined by 30%, which would be approximately 2,500 hours for a high-quality component (Figure 15). At 3.5 hours per day of operation, this is about
Figure 15. Reduction in light output for various types of LEDs and other light sources. Note the particularly short life of the 5-mm LEDs (USDOE 2006).
24
two years. Conversely the service life of larger “High-power” LEDs is on the order of ten-times this number (USDOE 2006). Given many other factors that can shorten product life, a more conservative assumption of seven years for products with high-power LEDs would be appropriate. A two-year service life should be assumed unless it is demonstrated that the superior technology is in use.
o Net-to-Gross factor – This is a value less than or equal to one (100%), which represents the fraction of products obtained through the program to the total obtained in or out of the program. While LED systems are entering the target markets already, they are of very limited use (virtually all flashlights) and of such exceptionally low quality that they garner negligible, if any, carbon reductions.
o Power conversion losses (for grid charging) – In many areas, end-users will prefer products that can be grid-charged, e.g., via cell-phone charging shops or other battery-charging methods. If the local grid uses fossil fuels and the charging efficiency is low, then a non-trivial amount of greenhouse-gas emissions will be emitted. This is the differential between power delivered to the AC adapter and that ultimately released by the battery to the light. A conservative default might be on the order of 25% of those from a standard kerosene lantern. High-efficiency charging can yield negligible losses.12 Conversely, if off-grid lights are used by electrified consumers during power outages, carbon savings may result if the alternative baseline technology choice is back-up fuel-based lanterns. In either case, grid-based emissions can be calculated using the CDM methodology known as “AMSI.D”.
Performance Adjustments The familiar methodological approach outlined above must be performed in the context of various uncertainties that are difficult (or costly) to measure or otherwise manage. Aside from these factors are a set of technology factors that collectively have far greater uncertainty, yet, fortunately, are easier to quantify and incorporate into an assessment of real-world energy savings and carbon offsets. These include factors influencing the product’s service life, a variety of technology factors that determine performance and level of offsets, and product quality and reliability factors that determine user acceptance and the level of utilization, as follows:
12 California has existing minimum efficiency standards for external power supplies, including those for cell phone chargers (CEC 2009). The U.S. Department of Energy has begun standards development for battery chargers and external power supplies,12 which could provide useful information and rating protocols for the off-grid lighting applications. EPRI also has an activity focused on these end uses: www.efficientpowersupplies.org/index.html. The ENERGY STAR program has a rating protocol for AC adaptors (including mobile phones) at www.energystar.gov. The best charger on their list as of 21 February 2010 is 96% efficient, and the worst 24% efficient. These losses must be combined with battery efficiencies and other losses in power management. More background information on the subject can be found at www.efficientproducts.org/product.php?productID=4.
25
• Service life modifiers – A number of factors may cause the product to last longer or shorter than the default value.
o "5mm" LEDs (shorter service life) – These LED technologies are relatively low-power (~0.2 watts) and, as noted above, are relatively short-lived. These are the most common types of LEDs used in off-grid lighting projects today. While high-quality components can be expected to last 2,500 hours, low-quality samples have exhibited only one-tenth of this life.
o "High-power" LEDs (longer service life) – These LED technologies have higher output (typically rated at 1 to 5 watts) and are relatively long-lived; that is, up to 50,000 hours. We propose capping the assumed service life at seven years.
o Replaceable battery – Rechargeable batteries have a limited life, which varies by the technology. Good-quality nickel-metal-hydride batteries can be expected to last perhaps two years in practice. If the battery compartment cannot be opened, then the battery end-of-life determines the entire product’s end of life.
o Charity distribution – It is often reported that products given to end users at no cost are not treated or maintained as well as purchased products. Thus, it is reasonable to assume that LED products received through charity mechanisms will have a shorter service life. We propose deflating the service life by 25%.
o Warranty or insurance – Absence of a warranty or other risk-guaranty product (e.g., carbon-offset insurance, or product/component performance insurance) may reflect the manufacturer or intermediary’s degree of confidence in the product and the user’s ability to get it repaired or replaced if it malfunctions. Absence of a warranty or insurance can form the basis of de-rating the default product lifetime, e.g., by 25%.
Adjusted product service life – The aforementioned factors together determine a real-world product service life, which could be longer or shorter than the default value. For example, a product with long-lasting LEDs that does not have a replaceable battery will have a shortened service life, irrespective of the good LEDs.
• Technology factors o Baseline fuel and technology – Default values may assume a fossil fuel as
baseline, but in some cases other energy sources are used. Biofuels could have higher or lower net emissions. Replacement lighting systems that primarily replace a battery-powered lighting baseline (e.g., traditional flashlights or “torches”) could be expected to save very little fuel, de-rating the baseline assumption by 90%, may be appropriate to account for this. However, a flashlight form-factor is not necessarily problematic if it provides effective hybrid modes of operation including ambient light or non-handheld task lighting that end-users deem adequate for replacing kerosene lights.
o Multifunction product (e.g., mobile phone charging) – Innovative lighting technologies being brought to market sometimes support non-lighting functions such as cell-phone charging or radios. In this case, there is competition between uses that displace fuel and those that do not. Less than a
26
1:1 offset of the baseline lighting may result. This effect will be strongest in larger solar home systems (SHS) where significant non-lighting loads are being met. Savings could be de-rated by 25% to account for this effect. As with all the conservative assumptions in this methodology, a project developer can always voluntarily opt to perform field measurement in order to document, and if justified by the data, obtain, a greater valuation of the carbon offsets.
o Charging strategy – Products charged via the grid (such as cell phone charging shops) will result in greenhouse-gas emissions associated with the electricity. There are three use cases, as follows:
Can only be charged off-grid Can only be charged via grid Can be grid-charged or independently charged
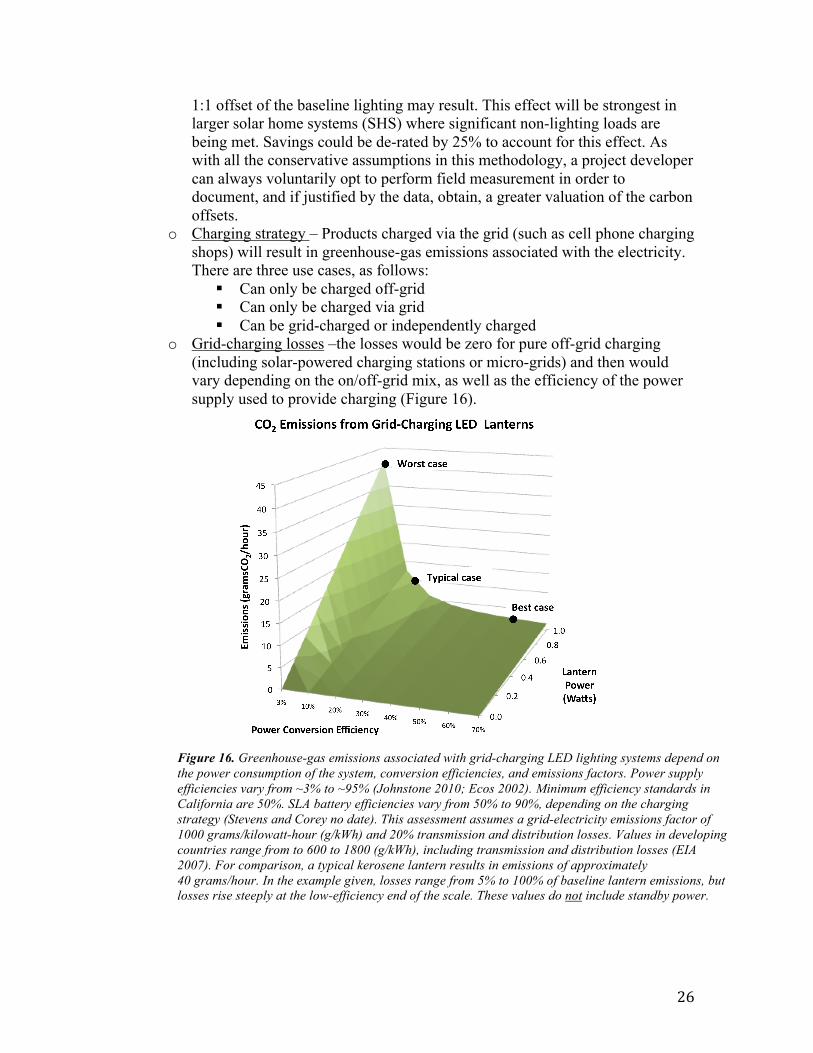
o Grid-charging losses –the losses would be zero for pure off-grid charging (including solar-powered charging stations or micro-grids) and then would vary depending on the on/off-grid mix, as well as the efficiency of the power supply used to provide charging (Figure 16).
Figure 16. Greenhouse-gas emissions associated with grid-charging LED lighting systems depend on the power consumption of the system, conversion efficiencies, and emissions factors. Power supply efficiencies vary from ~3% to ~95% (Johnstone 2010; Ecos 2002). Minimum efficiency standards in California are 50%. SLA battery efficiencies vary from 50% to 90%, depending on the charging strategy (Stevens and Corey no date). This assessment assumes a grid-electricity emissions factor of 1000 grams/kilowatt-hour (g/kWh) and 20% transmission and distribution losses. Values in developing countries range from to 600 to 1800 (g/kWh), including transmission and distribution losses (EIA 2007). For comparison, a typical kerosene lantern results in emissions of approximately 40 grams/hour. In the example given, losses range from 5% to 100% of baseline lantern emissions, but losses rise steeply at the low-efficiency end of the scale. These values do not include standby power.
27
• Quality Assurance o Truth-in-advertising certified – Research has shown that many off-grid
lighting products do not perform as advertised. Underperforming (or counterfeit) products will disappoint the user and are not likely to remain in use as long as accurately advertised ones. Default emissions values could be de-rated by 25% if there is evidence of failure to provide truth in advertising with regard to product performance.
o Quality certified – An independent product quality rating (e.g., that being developed by IFC and the World Bank Group’s Lighting Africa Project) would make it possible to differentiate among products on the basis of performance and durability, which are a determinant of how long the product is likely to remain in service. One of many examples of factors that would not otherwise be visible to a buyer would be the durability and lifetime of the embedded LEDs, which, as discussed above, could vary from weeks to years. Assuming a multi-level rating, de-rating factors on the order of 10% could be applied for the absence of any given level.
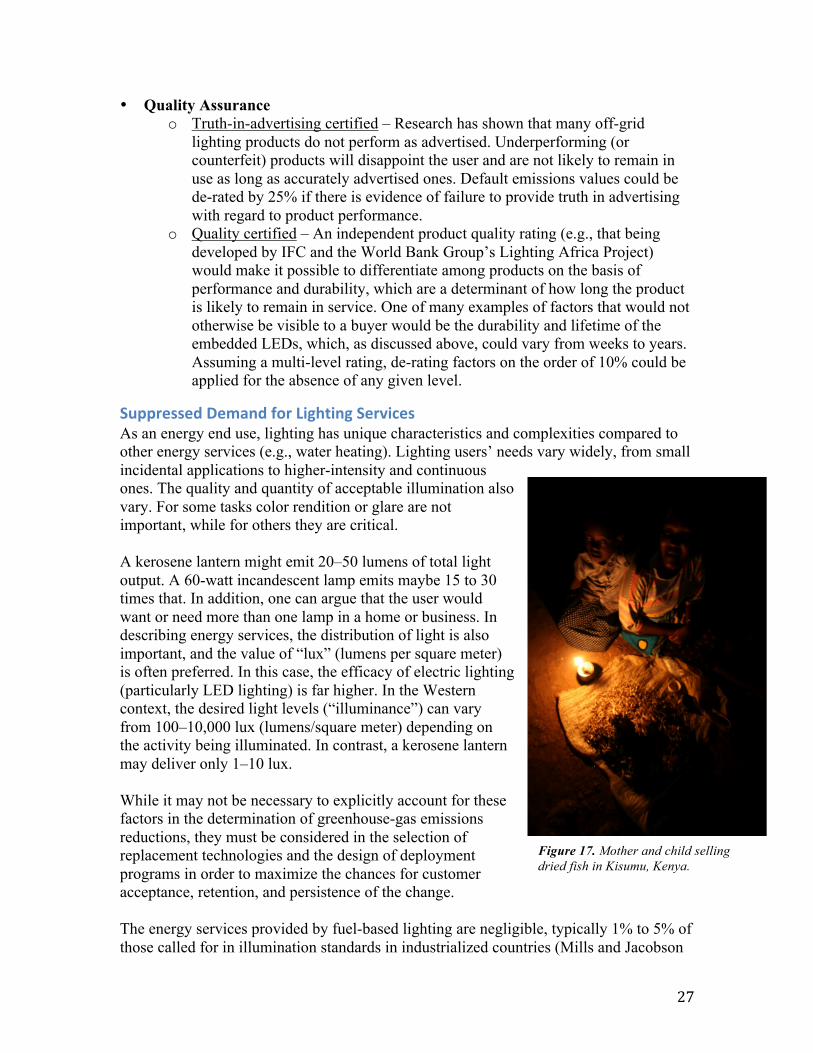
Suppressed Demand for Lighting Services As an energy end use, lighting has unique characteristics and complexities compared to other energy services (e.g., water heating). Lighting users’ needs vary widely, from small incidental applications to higher-intensity and continuous ones. The quality and quantity of acceptable illumination also vary. For some tasks color rendition or glare are not important, while for others they are critical. A kerosene lantern might emit 20–50 lumens of total light output. A 60-watt incandescent lamp emits maybe 15 to 30 times that. In addition, one can argue that the user would want or need more than one lamp in a home or business. In describing energy services, the distribution of light is also important, and the value of “lux” (lumens per square meter) is often preferred. In this case, the efficacy of electric lighting (particularly LED lighting) is far higher. In the Western context, the desired light levels (“illuminance”) can vary from 100–10,000 lux (lumens/square meter) depending on the activity being illuminated. In contrast, a kerosene lantern may deliver only 1–10 lux. While it may not be necessary to explicitly account for these factors in the determination of greenhouse-gas emissions reductions, they must be considered in the selection of replacement technologies and the design of deployment programs in order to maximize the chances for customer acceptance, retention, and persistence of the change. The energy services provided by fuel-based lighting are negligible, typically 1% to 5% of those called for in illumination standards in industrialized countries (Mills and Jacobson
Figure 17. Mother and child selling dried fish in Kisumu, Kenya.
28
2007). As can be seen from Figure 2 statistically and Figure 17 in a very human way, there is massive suppressed demand for lighting services in the developing world: a quarter of the world’s population consumes far less than 1% of the available illumination. This sad state of affairs is understandable, given that users of fuel-based lighting obtain less than a thousandth of the illumination energy services per unit of money spent on illumination as do those in industrialized countries. The poorest of the poor pay far more than the rich for each unit of illumination. Consumers surveyed in sub-Saharan Africa report two to three rooms kept dark in the evenings. Consumers and off-grid businesses report inadequate illumination and rank improved lighting highest among a set of improvements desired for their premises (Lighting Africa 2009). Conversely, a project in Malawi found that self-reported lighting use increase from 2.7 to 4.4 hours per day (63%) after the introduction of LED systems (Adkins et al. 2010). Household surveys conducted under a CDM project based in Karnataka, India, concluded that existing households had one to three lamps and would acquire an additional four lamps if they could afford them and the fuel (CDM 2009). They estimated that actual kerosene consumption was about one-seventh of what it would be if they could afford to operate more lamps for more hours each day. This would result in adjusting the actual pre-project lighting kerosene use of 0.1 liters per household per day to a level of 0.8. On a lamp-for-lamp basis, a high-quality LED lighting system of the type targeted toward users in developing countries can produce ten to one-hundred times the light levels as the baseline flame-based lantern. This applies to a small “task” area being lit. If users then aspired to extend that higher lighting level throughout their homes or businesses, the implied pent-up demand grows again many fold. The amount of lighting fuel required to replicate this expanded level of service would amount to many thousands of times that of current usage. Ascribing all of this suppressed demand to LED lighting systems would result in hundreds of dollars of notional carbon value for each lantern – tens of times the total price of that lantern. Mobilizing this funding would likely have perverse effects in the market. It would also be an unrealistic scenario, because when an end-user became well enough off to purchase such large amounts of kerosene, they would likely be switching to the electric grid. A more defensible treatment suppressed demand would be to consider and quantify two factors:
1. Estimate current suppressed demand due to technical factors. These would include curtailed use of the lantern due to kerosene availability and aversion to the indoor air pollution caused by the lanterns.
2. Estimate the growth in the fuel-based lighting baseline in the absence of the LED alternative, and index the growth to inflation as well as kerosene prices and associated subsidies that could boost (or shrink) demand for kerosene. Indices for kerosene prices could be based on price elasticities from the literature, presumably, or on new field research conducted expressly to determine the relationship. Linking corrections to these socioeconomic factors would also be a
29
more quantitatively rigorous approach insofar as the time horizon for growth in illumination consumption is not practically measurable.
One CDM project proposed converting the amount of light generated by the LED replacement technology to the kerosene that would otherwise have been used to provide that same amount of light (CDM 2008). In cases where the LED provides more light than the baseline technology, a measure of suppressed demand would be credited. A maximum cap should be applied so as not to emulate a situation that could never have been met with fuel-based lighting. If the baseline technology is a simple wick lamp, this might be on the order of 10 lumens; if it is a simple hurricane lantern it might be on the order of 50 lumens. In order to properly institute such a method, standardized independent testing should be conducted to verify manufacturer claims of LED lumen output. Moreover, because light output erodes over time (sometimes dramatically) a separate method would need to be adopted to “de-rate” the initial lumen output. It should be noted that there is a “ladder” of fuel-based lighting choices and levels of use, up which a household or business will progress as it achieves higher income and/or as the price of lighting fuel falls. For example, a user could upgrade from a wick to kerosene to pressurized lantern, while increasing the number of lanterns and hours of use. The upper limit is the point at which the user is well enough off to switch to grid-based electricity.
Additionality Low-power red LED indicator lights have been in the market for many decades, but high-power white LEDs for illumination purposes are quite new. Lighting systems based on white LEDs are beginning to penetrate markets in the developing world, and are arguably highly cost-effective. Thus, the question appropriately arises as to whether savings from programs under the CDM would yield net benefits and thereby meet the requirement of “additionality.” The economics of the baseline lighting systems and the total cost of ownership of the replacement systems will vary widely as a function of the following factors, and thus will determine the strength of market barriers to natural adoption. Baseline:
• Fuel mix • Energy taxes or subsidies • User income/affordability
Substitute Technology: • Direct first cost (e.g., at point of importation) • Import duties, taxes • Sales chain (distribution, markups, profits) • Operating costs, such as replacement batteries and charging
Fuel-price subsidies are particularly high in India13 and Indonesia, and they can create a significant barrier to the uptake of new lighting technologies by effectively increasing the
13 Households targeted by a CDM project in Karnataka were said to pay as little as 12 Rupees per liter ($0.25/liter) (CDM 2009), which is substantially lower than prices of $1–$2 per liter observed in sub-Saharan Africa.
30
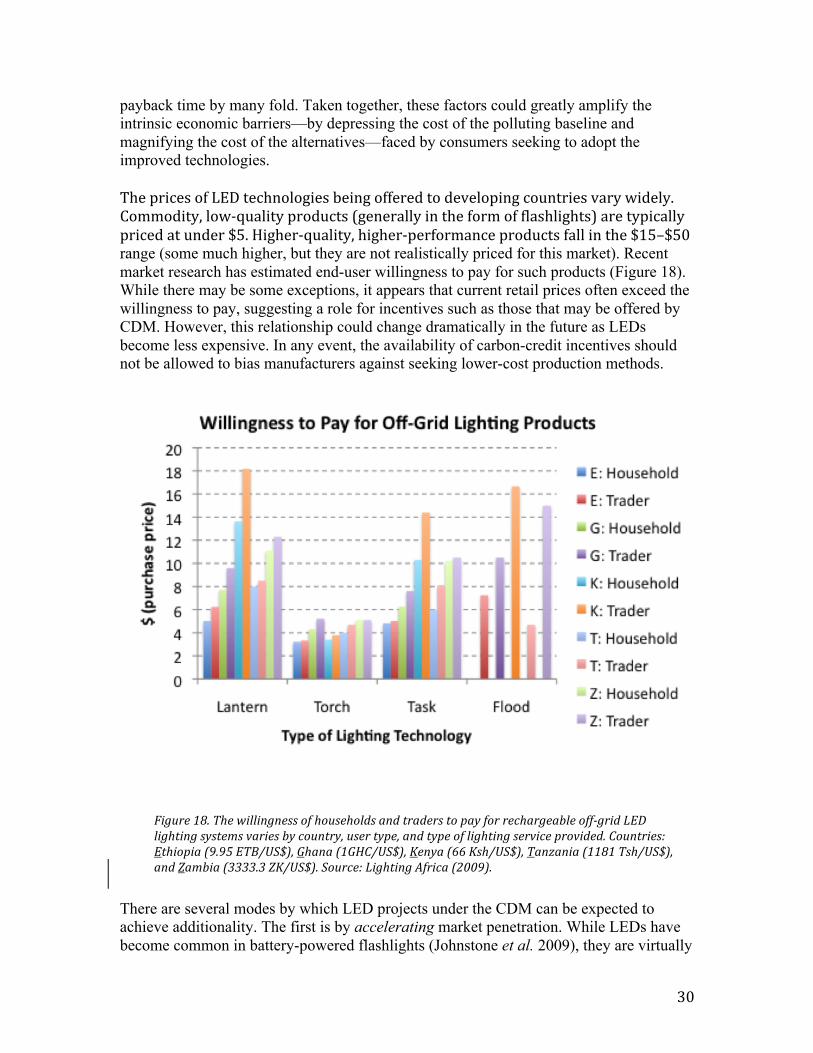
payback time by many fold. Taken together, these factors could greatly amplify the intrinsic economic barriers—by depressing the cost of the polluting baseline and magnifying the cost of the alternatives—faced by consumers seeking to adopt the improved technologies. The prices of LED technologies being offered to developing countries vary widely. Commodity, low-‐quality products (generally in the form of flashlights) are typically priced at under $5. Higher-‐quality, higher-‐performance products fall in the $15–$50 range (some much higher, but they are not realistically priced for this market). Recent market research has estimated end-user willingness to pay for such products (Figure 18). While there may be some exceptions, it appears that current retail prices often exceed the willingness to pay, suggesting a role for incentives such as those that may be offered by CDM. However, this relationship could change dramatically in the future as LEDs become less expensive. In any event, the availability of carbon-credit incentives should not be allowed to bias manufacturers against seeking lower-cost production methods.
There are several modes by which LED projects under the CDM can be expected to achieve additionality. The first is by accelerating market penetration. While LEDs have become common in battery-powered flashlights (Johnstone et al. 2009), they are virtually
Figure 18. The willingness of households and traders to pay for rechargeable off-grid LED lighting systems varies by country, user type, and type of lighting service provided. Countries: Ethiopia (9.95 ETB/US$), Ghana (1GHC/US$), Kenya (66 Ksh/US$), Tanzania (1181 Tsh/US$), and Zambia (3333.3 ZK/US$). Source: Lighting Africa (2009).
31
non-existent in other lighting contexts in which fuels are the baseline energy source. The extreme income sensitivity of the target audiences and the relatively high first cost compared to baseline technologies (which could be higher by 100-fold, e.g., $0.20 versus $20.00) suggests that baseline “unaided” market penetration may be quite slow. However, as LED prices fall they may cross a point at which demand is large without the benefit of carbon valuation. Import duties—arguably a market barrier in and of themselves—are present in many countries and compound the base cost barriers. A recent study found that the uptake rate of LED alternatives was very sensitive to income (Adkins et al. 2010). The second, and more important mode has to do with product quality. The current trend is toward very low-quality LED products (Mills and Jacobson 2007; Tracy et al. 2009), which are spoiling the market and thus slowing demand. In lieu of interventions aimed at restoring quality and end-user trust in these technologies, penetration will be very low and cumulative savings will be diminished due to the minimal service lives achieved before products fail. Conversely, products and programs that embed high quality standards will secure emissions that are strongly additional to those in the business-as-usual scenario. Many types of CDM projects claim emissions that are based on very long asset lives (e.g., 20–30 years), which of course increase uncertainties about the full lifetime emissions being attained. A third factor that argues for significant additionality for CDM-based off-grid lighting programs, at least in the near- to medium-term, owing to the need for such programs to create or improve local institutions, support financing mechanisms to overcome first-cost sensitivities, mount information and education campaigns to better equip sellers and buyers to engage, and create or improve supply chains for critical components (e.g., replacement batteries). Doing so can clearly accelerate market uptake (Adkins et al. 2010). Another contingency to be considered is a program recipient’s home or business eventually becoming electrified. A grid-based incandescent lamp14 would be responsible for about 10–100 grams of CO2 emissions per hour, which is the same order magnitude as the kerosene lanterns depicted in Figure 4 (but the electric light of course generates vastly more light). If the off-grid LED system ceased being used when an entire home became electrified, then there may no longer be carbon savings. On the other hand, in practice, the LED systems would probably be put into use by others (even in the same family) who remained off the grid. Moreover, the presence of the LED systems, especially where other modest functions were served (e.g., television and cell-phone charging) could defer for a period of time a consumer’s move to the grid. Important differentiators of LED product lifetime notwithstanding, LED lighting systems are generally much shorter-lived products, which entail less speculation and need for
14 This range is defined depending on lamp type and grid carbon emissions factors. A 100-watt incandescent lamp and an emissions factor of 1000g CO2/kilowatt-‐hours of electricity [kWhe] would correspond to about 100 grams CO2/hour, a 15-‐watt compact fluorescent lamp and an emissions factor of 500g CO2/kWhe would correspond to emissions of 8 grams CO2 per hour.
32
long-term monitoring to ensure that deemed lifetime performance is maintained in practice. Moreover, reputable LED systems are generally designed to be maintenance free (aside from occasional battery changes), thereby reducing uncertainties about durability. One criterion for additionality—that the improved products not be required by law—is clearly met in most cases. There will be exceptions and the CDM’s Small-Scale Working Group (SSWG) should monitor this for use in evaluating prospective projects. For example, in late 2009 Peru outlawed the use of kerosene for lighting and cooking.15 They are promoting integrated off-grid electric lighting in its place, probably through product-give-away programs (Centeno et al. 2009). Taken together, the aforementioned factors suggest that integrated LED lighting systems are far less susceptible to additionality problems than many technologies currently used within carbon markets. Given the short product lifecycle, baseline conditions and methodology assumptions can be revised regularly with little risk of inappropriately grandfathering legacy projects. That said, the technologies, their costs, and other market factors are changing rapidly. It would be prudent to revisit the issue of additionality regularly and to make adjustments to this aspect of the methodology as necessary.
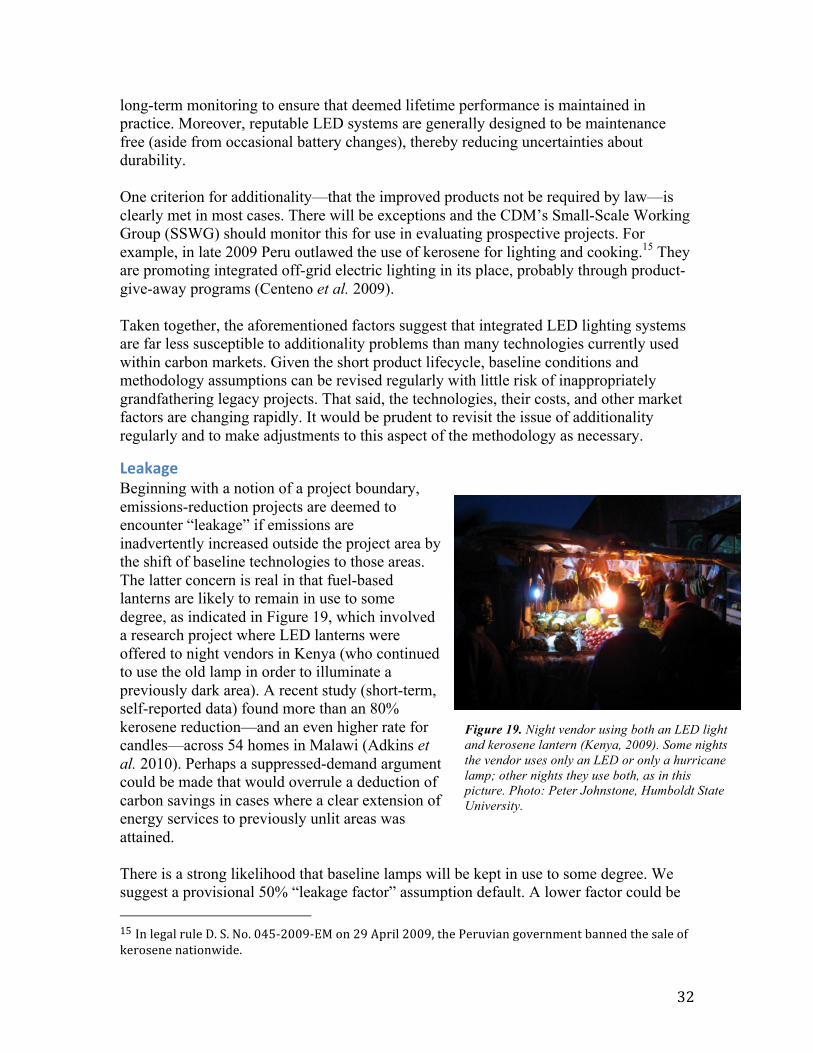
Leakage Beginning with a notion of a project boundary, emissions-reduction projects are deemed to encounter “leakage” if emissions are inadvertently increased outside the project area by the shift of baseline technologies to those areas. The latter concern is real in that fuel-based lanterns are likely to remain in use to some degree, as indicated in Figure 19, which involved a research project where LED lanterns were offered to night vendors in Kenya (who continued to use the old lamp in order to illuminate a previously dark area). A recent study (short-term, self-reported data) found more than an 80% kerosene reduction—and an even higher rate for candles—across 54 homes in Malawi (Adkins et al. 2010). Perhaps a suppressed-demand argument could be made that would overrule a deduction of carbon savings in cases where a clear extension of energy services to previously unlit areas was attained. There is a strong likelihood that baseline lamps will be kept in use to some degree. We suggest a provisional 50% “leakage factor” assumption default. A lower factor could be 15 In legal rule D. S. No. 045-‐2009-‐EM on 29 April 2009, the Peruvian government banned the sale of kerosene nationwide.
Figure 19. Night vendor using both an LED light and kerosene lantern (Kenya, 2009). Some nights the vendor uses only an LED or only a hurricane lamp; other nights they use both, as in this picture. Photo: Peter Johnstone, Humboldt State University.
33
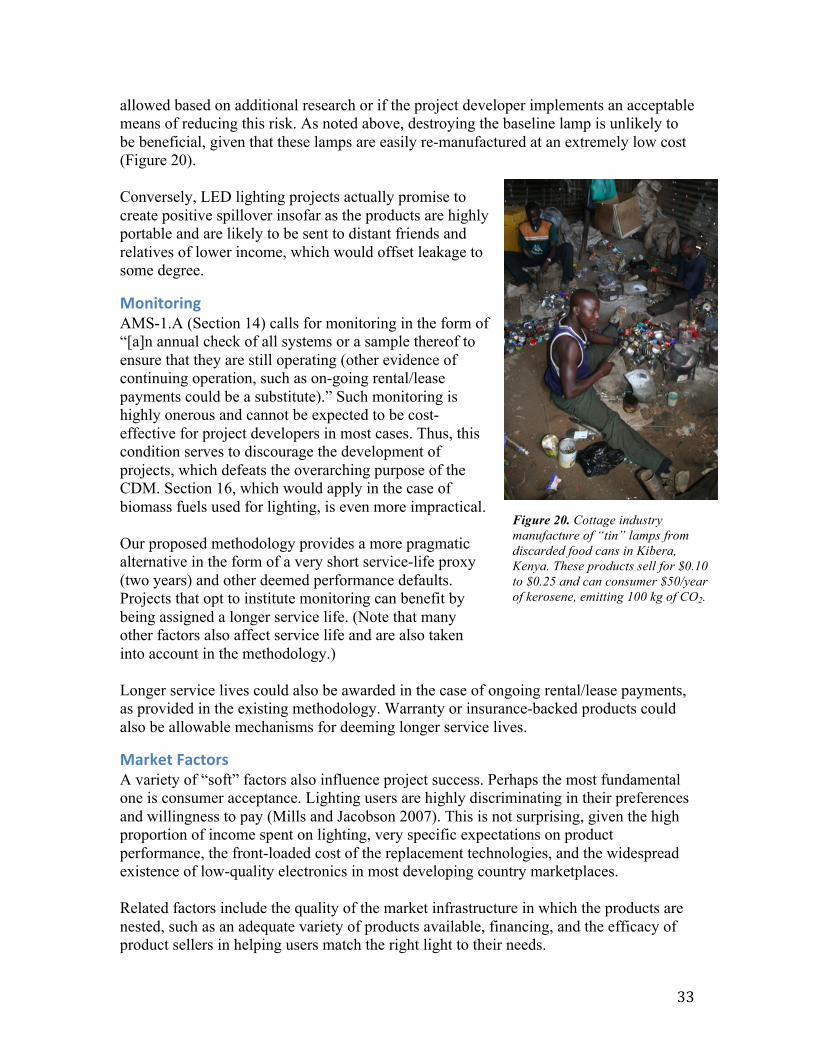
allowed based on additional research or if the project developer implements an acceptable means of reducing this risk. As noted above, destroying the baseline lamp is unlikely to be beneficial, given that these lamps are easily re-manufactured at an extremely low cost (Figure 20). Conversely, LED lighting projects actually promise to create positive spillover insofar as the products are highly portable and are likely to be sent to distant friends and relatives of lower income, which would offset leakage to some degree.
Monitoring AMS-1.A (Section 14) calls for monitoring in the form of “[a]n annual check of all systems or a sample thereof to ensure that they are still operating (other evidence of continuing operation, such as on-going rental/lease payments could be a substitute).” Such monitoring is highly onerous and cannot be expected to be cost-effective for project developers in most cases. Thus, this condition serves to discourage the development of projects, which defeats the overarching purpose of the CDM. Section 16, which would apply in the case of biomass fuels used for lighting, is even more impractical. Our proposed methodology provides a more pragmatic alternative in the form of a very short service-life proxy (two years) and other deemed performance defaults. Projects that opt to institute monitoring can benefit by being assigned a longer service life. (Note that many other factors also affect service life and are also taken into account in the methodology.) Longer service lives could also be awarded in the case of ongoing rental/lease payments, as provided in the existing methodology. Warranty or insurance-backed products could also be allowable mechanisms for deeming longer service lives.
Market Factors A variety of “soft” factors also influence project success. Perhaps the most fundamental one is consumer acceptance. Lighting users are highly discriminating in their preferences and willingness to pay (Mills and Jacobson 2007). This is not surprising, given the high proportion of income spent on lighting, very specific expectations on product performance, the front-loaded cost of the replacement technologies, and the widespread existence of low-quality electronics in most developing country marketplaces. Related factors include the quality of the market infrastructure in which the products are nested, such as an adequate variety of products available, financing, and the efficacy of product sellers in helping users match the right light to their needs.
Figure 20. Cottage industry manufacture of “tin” lamps from discarded food cans in Kibera, Kenya. These products sell for $0.10 to $0.25 and can consumer $50/year of kerosene, emitting 100 kg of CO2.
34
After-sales service and availability of replacement parts and warranty are also important. For grid-charged devices, the availability, reliability, and affordability of charging services are crucial. For well-manufactured products, the component with the shortest service life will commonly be the battery. Thus, availability of matching replacement batteries is important to ensure that products remain in service for their expected life. The relative prices and availability of alternatives will create an “elasticity” effect on demand for products. Conversely, delivery mechanisms (such as charity models) that circumvent traditional market processes can result in mistreatment of products and attenuated service life (and thus cumulative emissions reductions).
Risk Management Risk management can occur at various places in the value chain. The effort should begin at the point of manufacture. An in-house quality control, quality assurance system is important, and should be augmented by independent rating and labeling. In carbon markets, insurance products are emerging to manage non-delivery risks. Examples include Munich Re’s Kyoto Multi-risk product (Munich Re 2007). Insurance and warranty projects for the underlying technologies can also be appropriate, especially when proactively based on an engineering-based assessment of product quality.16 A number of insurers offer renewable-energy performance or energy-savings insurance instruments (Mills 2003; Mills 2009). Products have not been fashioned expressly for small-scale CDM projects, but may in the future. Micro-insurance is already used by nearly 80 million people globally (Mills 2009), and micro-finance by an even larger population. Application of these financial services to small-scale carbon abatement technologies is a natural extension. In this context, carbon-performance insurance for off-grid LED projects would represent an interesting market mechanism for managing risks of the attainment of emissions. Insurers would be compelled to conduct their own due-diligence of projects, which would introduce an additional layer (albeit unconventional) of quality assurance that could achieve some of the same objectives as conventional project monitoring. Claims “paid” with equivalent Certified Emissions Reductions (CER) could be of additional interest.
Hypothetical Application of the Proposed Methodology One of the benefits of the proposed methodology is that the majority of the input values can be determined before the technology is deployed. Many of the others can be verified by market observations that do not require visitations to individual users. Default values would be stipulated, and only over-ridden if acceptable data were provided. Research and surveys by disinterested parties could be periodically reviewed so 16 See http://www.insurance4renewables.com/
35
as to improve the default values or make them more case-specific. Large research and deployment programs currently underway (Lighting Africa and the Solar and LED Access Program) are producing extensive information of this sort, as exemplified by Lighting Africa’s surveys of thousands of households in Ethiopia, Ghana, Kenya, Tanzania, and Zambia (Lighting Africa 2009). For example, the majority of households in Zambia report that their flashlights and solar-powered lanterns last only one year or less (Lighting Africa 2009). These reports also provide information on lighting fuel mix by country (Figures 6a-b). For evaluating the persistence of specific LED products, disclosure of product returns and repairs under warranties may provide justification for extending service life assumptions. Appendix A provides a hypothetical implementation of the proposed methodology. Values used are for discussion purposes and do not necessarily reflect recommended levels. Figure 21 shows results for six hypothetical products, spanning a wide range of conditions. In the worst case, essentially no valuation is given for carbon emissions reductions. This hypothetical product uses shorter-lived “5mm” LED lights, has no performance warranty, has a non-replaceable battery, substitutes for a battery-powered baseline technology (a conventional flashlight), and has no evidence of truth in advertising or rating from an independent quality assurance protocol. In contrast, the best-case product produces carbon offsets valued at about US$17. The product employs long-lived “super-bright” LEDs, has a replaceable battery, provides a five-year warranty, and has been certified at the highest quality assurance level by an independent testing body. It should be noted that CDM projects are likely to incorporate multiple brands and/or models of LED lighting systems, each of which may score differently in the proposed methodology. The two existing CDM projects contain such mixes of products. It is important that the focus on the performance and quality of the LED systems is carried over to any units that are introduced during the project lifetime in the context of replacement/warranty claims.
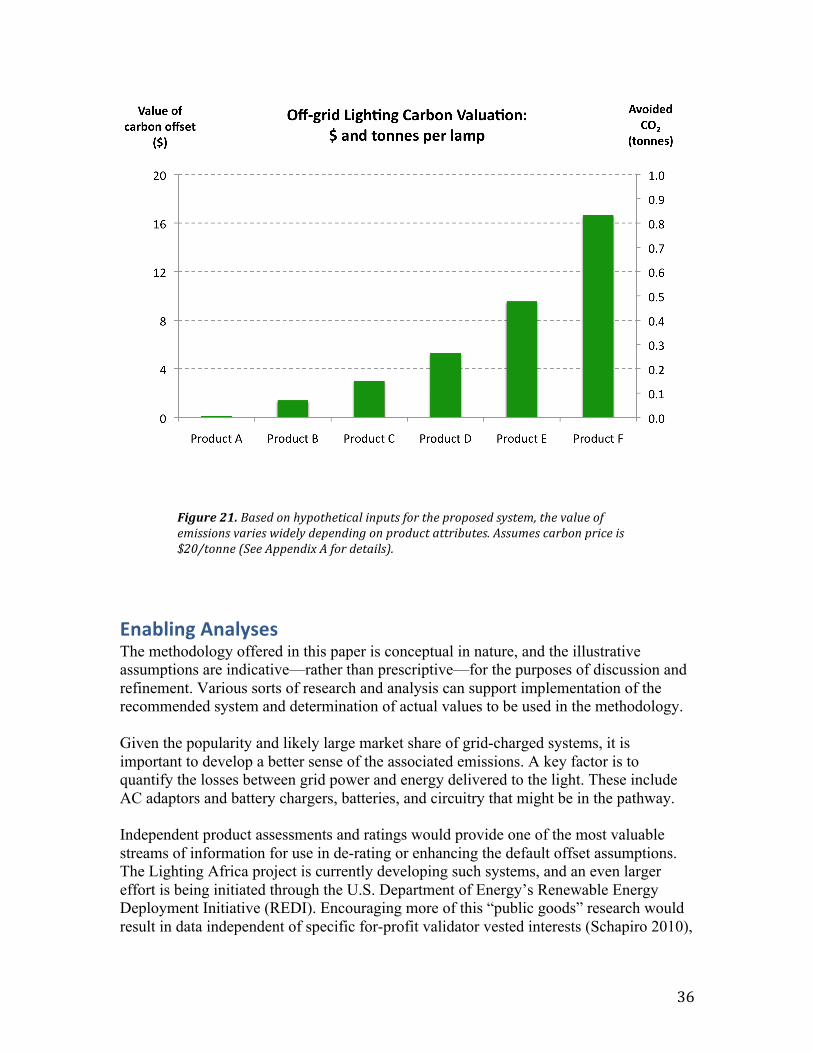
36
Enabling Analyses The methodology offered in this paper is conceptual in nature, and the illustrative assumptions are indicative—rather than prescriptive—for the purposes of discussion and refinement. Various sorts of research and analysis can support implementation of the recommended system and determination of actual values to be used in the methodology. Given the popularity and likely large market share of grid-charged systems, it is important to develop a better sense of the associated emissions. A key factor is to quantify the losses between grid power and energy delivered to the light. These include AC adaptors and battery chargers, batteries, and circuitry that might be in the pathway. Independent product assessments and ratings would provide one of the most valuable streams of information for use in de-rating or enhancing the default offset assumptions. The Lighting Africa project is currently developing such systems, and an even larger effort is being initiated through the U.S. Department of Energy’s Renewable Energy Deployment Initiative (REDI). Encouraging more of this “public goods” research would result in data independent of specific for-profit validator vested interests (Schapiro 2010),
Figure 21. Based on hypothetical inputs for the proposed system, the value of emissions varies widely depending on product attributes. Assumes carbon price is $20/tonne (See Appendix A for details).
37
while alleviating considerable financial disincentives from individual companies for whom collecting such data in support of a single project would be cost-prohibitive. Product labeling systems could prove to be a key tool for simplifying the application of the quality-assessment elements of the methodology proposed here. The presence of such systems would provide an objective set of metrics that could be used as a proxy for product quality and service life. Conversely, the presence of combined rating and labeling systems would induce project applicants to ensure and verify performance in advance of applying for CDM project qualification, which in turn, would result in higher-quality projects, deeper and more durable carbon reductions, and enhanced additionality compared to a business-as-usual pathway that is currently introducing many suboptimal products into these markets. If congruent with standard CDM practices, the embodied energy and associated greenhouse gases of off-grid products should be investigated and incorporated in the analytic framework.17 Improved estimates of baseline global carbon emissions from off-grid lighting would also help in characterizing the potential market. The one value in the literature (Mills 2005) should be updated and refined to include intervening demographic changes, new data and understandings about the technologies, and specific examination of biofuels in the provision of illumination. One factor that has not been previously evaluated is the perhaps significant role of “black carbon” (soot) in the overall climate-forcing impact of fuel-based lighting. Black carbon’s global warming potential is not counted in CDM projects. Improved data on the utilization of baseline technologies can help refine the default values and perhaps provide different authorized datasets for different geographies or demographics. The ability to collect field data on baseline and post-retrofit lighting utilization could provide a valuable basis for adjusting default assumptions. Low-cost light loggers have been developed and field-tested in off-grid lighting products, but not yet commercialized (Radecsky et al. 2008) (Figure 22). If non-intrusive data recovery (e.g., through short-range wireless networks) could be applied, then utilization assumptions could be validated at the project level at a lower cost than if in-person interviews were required. However, safeguards would be necessary to manage risks of gaming or fraud. Independently orchestrated surveys (e.g., conducted by governmental or non-governmental organizations for public-interest applications) would be less susceptible to these concerns.
17 A preliminary scoping estimate by Peter Johnstone at Humboldt State University (Personal Communication, February 20, 2010) indicates approximately 60 megajoules (MJ) of embodied primary energy in a 1W photovoltaic panel (two-‐thirds) and 3 AA batteries (one-‐third). Compared to the 39 MJ embodied energy each liter of kerosene, this would correspond to a very fast “payback time.” It should be noted that new LED systems with rechargeable batteries that replace conventional flashlights offset significant solid waste production in the form of non-‐rechargeable batteries.
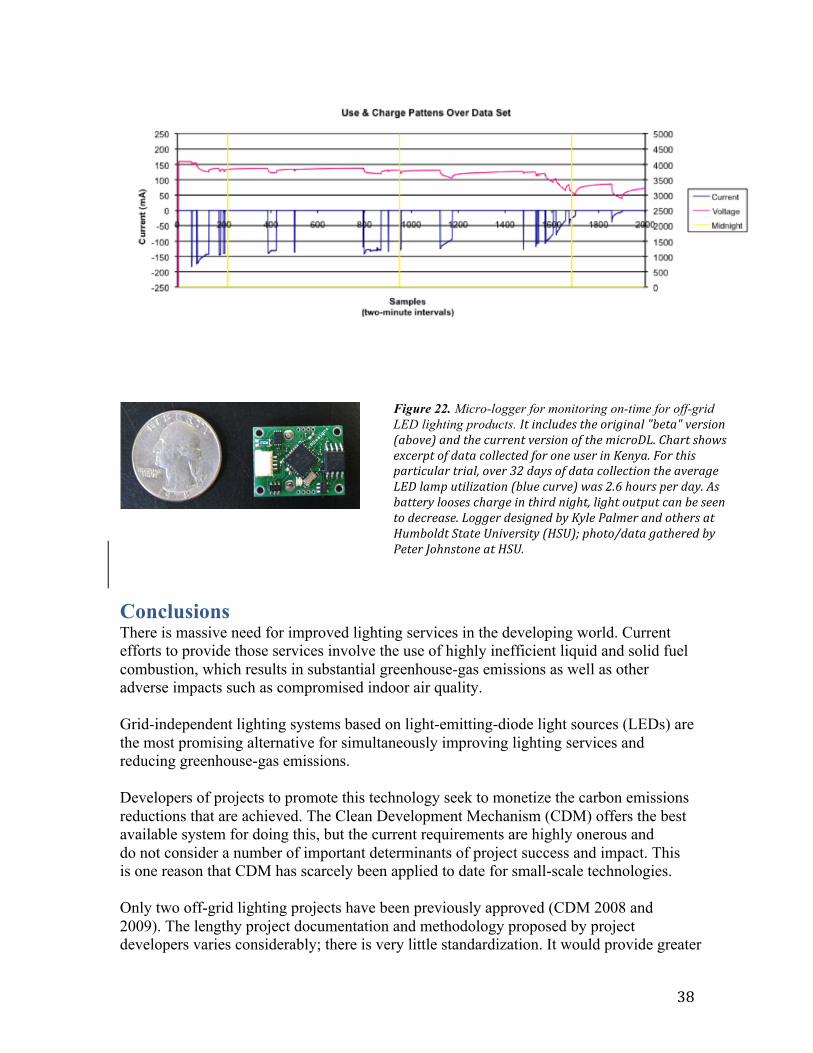
38
Conclusions There is massive need for improved lighting services in the developing world. Current efforts to provide those services involve the use of highly inefficient liquid and solid fuel combustion, which results in substantial greenhouse-gas emissions as well as other adverse impacts such as compromised indoor air quality. Grid-independent lighting systems based on light-emitting-diode light sources (LEDs) are the most promising alternative for simultaneously improving lighting services and reducing greenhouse-gas emissions. Developers of projects to promote this technology seek to monetize the carbon emissions reductions that are achieved. The Clean Development Mechanism (CDM) offers the best available system for doing this, but the current requirements are highly onerous and do not consider a number of important determinants of project success and impact. This is one reason that CDM has scarcely been applied to date for small-scale technologies. Only two off-grid lighting projects have been previously approved (CDM 2008 and 2009). The lengthy project documentation and methodology proposed by project developers varies considerably; there is very little standardization. It would provide greater
Figure 22. Micro-logger for monitoring on-time for off-grid LED lighting products. It includes the original "beta" version (above) and the current version of the microDL. Chart shows excerpt of data collected for one user in Kenya. For this particular trial, over 32 days of data collection the average LED lamp utilization (blue curve) was 2.6 hours per day. As battery looses charge in third night, light output can be seen to decrease. Logger designed by Kyle Palmer and others at Humboldt State University (HSU); photo/data gathered by Peter Johnstone at HSU.
39
transparency for policymakers and remove barriers for project developers if a more uniform and cost-effective methodology was implemented. The CDM is not a panacea. There exist a variety of issues that, while not intrinsic barriers to the deployment of improved off-grid lighting technologies, confound efforts to perfect a methodology within the bounds of CDM. Examples of these are accounting for use in weakly electrified consumers who use lamps during outages, treating biomass fuels used for lighting, accounting for grid-charging of otherwise off-grid products, quantifying suppressed demand, defining dynamic baselines, and adjusting for the additionality concerns associated with the degree to which these technologies would be adopted in the absence of the ability to monetize the carbon reductions. Moreover, the evolution of CDM protocols is not keeping pace with the rapid development of the technologies they are intended to support. Indeed, LED products are evolving even during current project evaluation and approval processes. A more accurate and effective CDM methodology can eliminate the need for costly field investigations by relying instead on certain deemed baseline parameters combined with consistent adjustments based on more readily available market data and quality assessment of the incoming LED technologies. These adjustments manifest largely with respect to effective product lifetime and thus its cumulative emissions reductions, and can lead to much more internally consistent estimates of carbon savings than is the case at present with divergent methods designed by project developers. Aside from its traditional role of directing capital from wealthy countries toward highly cost-effective carbon-reduction projects in the developing world, in the case of off-grid lighting systems the CDM can play a highly meaningful role in promoting improvements in the quality of products offered to the marketplace. The logical outcome would be significantly higher uptake and end-user satisfaction with improved lighting systems than could occur through sole reliance on existing imperfect market forces. Reference Adkins, E., S. Eapen, F. Kaluwile, G. Nair, and V. Modi. 2010. “Off-Grid Energy
Services for the Poor: Introducing LED Lighting in the Millennium Villages Project in Malawi.” Energy Policy 38:1087–1097.
Agoramoorthy, G., and M. Hsu. 2009. “Lighting the Lives of the Impoverished in India’s Rural and Tribal Drylands.” Human Ecology 37 (4): 513–517.
Apple, J., R. Vicente, A. Yarberry, N. Lohse, E. Mills, A. Jacobson, and D. Poppendieck. 2010. “Characterization of Particle Matter Size Distributions and Indoor Concentrations from Kerosene and Diesel Lamps.” Submitted to Indoor Air.
Bhusal, P. 2007. ENLIGHTEN: LEDs for Rural Lighting. E3Light Newsletter 5.
40
Caabral, Anil, Mac Cosgrove-Davies, and Loretta Schaeffer. (1996) "Best Practices for Household Electrification Programs: Lessons from Experiences in Selected Countries." World Bank Technical Paper No. 324, Asia Technical Department Series, Washington, D.C., USA.
California Energy Commission. 2009. “2009 Appliance Efficiency Regulations” (cell phone chargers discussed on page 166). CEC-400-2009-013. www.energy.ca.gov/appliances/index.html.
CDM. “Indicative simplified baseline and monitoring methodologies for selected small-scale CDM project activity categories” See http://cdm.unfccc.int/methodologies/SSCmethodologies/approved.html.
CDM. 2008. “Clean Development Mechanism Project Design Document – d. Light Rural Lighting Project, Version 2, 13/10/2008.”
CDM. 2009. “Clean Development Mechanism Project Design Document - Rural Education for Development Society (REDS) CDM Photovoltaic Lighting Project, Version 4, 4-Aug-09,” and associated baseline survey spreadsheet.
Centeno, Z. C., R. A. Cesar, and C. Franchini. 2009. “Project Pico Solar Lamps for Peruvian Amazonia.”
Ecos Consulting. 2002. “Power Supplies: A Hidden Opportunity for Energy Savings.” Prepared for that National Resources Defense Council.
EIA. 2007. “Voluntary Reporting of Greenhouse Gases: Appendix A: Electricity Emissions Factors.” U.S. Energy Information Administration, Form EIA-1605.
Jacobson, A., D. M. Kammen, R. Duke, and M. Hankins. 2000. “Field Performance Measurements of Amorphous Silicon Photovoltaic Modules in Kenya.” Proceedings of the American Solar Energy Society, Madison, Wisconsin, USA, June 16–21.
Johnstone, P. 2010. Private communication, preliminary measurements of AC adaptors used for off-grid lighting systems.
Johnstone, P., J. Tracy, and A. Jacobson. 2009. “Pilot Baseline Study – Report: Market Presence of Off-Grid Lighting Products in the Towns of Kericho, Brooke, and Talek.” Prepared for Lighting Africa.
Lighting Africa. 2009. “Lighting Africa Market Assessment Results: Quantitative Assessment.” Series includes Ethiopia, Ghana, Kenya, Tanzania, and Zambia. International Finance Corporation and the World Bank Group. (See www.lightingafrica.org/node/191/.)
Lighting Africa. 2010. “Briefing Notes: Light Emitting Diode (LED) Lighting Basics.” www.lightingafrica.org/files/Lighting_Africa_Briefing_Notes_21.Dec_.2009.pdf.
Michaelowa, A., D. Hayashi, and M. Marr. 2009. “Challenges for Energy Efficiency Improvements Under the CDM: The Case of Energy-Efficient Lighting.” Energy Efficiency 2:353–3678, DOI 10.1007/s12053-009-9052-z.
Mills, E. 2003. “Risk Transfer via Energy Savings Insurance.” Energy Policy 31:273–281. LBNL-48927. http://evanmills.lbl.gov/pubs/pdf/energy_savings_insurance.pdf.
Mills, E. 2005. “The Specter of Fuel-Based Lighting.” Science 308:1263–1264, 27 May. http://eetd.lbl.gov/newsletter/nl21/2fuel_lite.htm.
Mills, E. 2009. “From Risk to Opportunity: Insurer Responses to Climate Change.” Published by Ceres.
41
Mills, E., and A. Jacobson. 2007. “The Off-Grid Lighting Market in Western Kenya: LED Alternatives and Consumer Preferences in a Millennium Development Village.” Lumina Project Technical Report #2. http://light.lbl.gov/pubs/tr/lumina-tr2.pdf.
Mills, E., and A. Jacobson. 2008. “The Need for Independent Quality and Performance Testing for Emerging Off-grid White-LED Illumination Systems for Developing Countries.” Light & Engineering 16(2):5–24.
Mulugeta, E. 2004. “The Demand for Kerosene and per Capita Income in Eithiopia.” Ethiopian Journal of Economics 13(2). http://ajol.info/index.php/eje/article/view/39807.
Munich Re. 2007. “Topics: Cycle Management; Climate Neutrality: Kyoto Multi Risk Policy.” Munich Reinsurance Company. www.munichre.com/publications/302-05473_en.pdf.
National Bureau of Statistics Tanzania. 2002. “Household Budget Survey: 2000/01.” Nieuwenhout, F. D. J., A. van Dijk, V. A. P. van Dijk, D. Hirsch, P. E. Lasschuit, G. van
Roekel, H. Arriaza, M. Hankins, B. D. Sharma, and H. Wade. (2000) “Monitoring and Evaluation of Solar Home Systems: Experiences with applications of solar PV for households in developing countries.” ECN-C--00-089.
Radecsky, K., P. Johnstone, A. Jacobson, and E. Mills. 2008. “Solid-State Lighting on a Shoestring Budget: The Economics of Off-Grid Lighting for Small Businesses in Kenya.” Lumina Project Technical Report #3. http://light.lbl.gov/pubs/tr/lumina-tr3.pdf.
Schapiro, M. 2010. “Conning the Climate.” Harpers February, pp. 31–39. Stevens, J. W., and G. P. Corey. No date. “A Study of Lead-Acid Battery Efficiency Near
Top-of-Charge and the Impact on PV System Design.” Sandia National Laboratories.
Tracy, J., A. Jacobson, and E. Mills. 2010."Use Patterns of LED Flashlights in Kenya and a One-‐Year Cost Analysis of Flashlight Ownership." Lumina Project Research Note #5.
Tracy, J., A. Jacobson, and E. Mills. 2009. “Quality and Performance of LED Flashlights in Kenya: Common End User Preferences and Complaints.” Lumina Project Research Note #4.
U.S. Department of Energy. 2006. “Lifetime of White LEDs.” PNNL-SA-50957. U.S. Department of Energy. 2009. “Multi-Year Program Plan FY’09-FY’15: Solid-State
Lighting Research and Development.” UN Framework Convention on Climate Change. 2010. Approved Methodologies for
Small-Scale CDM Project Activities http://cdm.unfccc.int/methodologies/SSCmethodologies/approved.html.
World Energy Outlook. 2009. “Number of people without access to electricity in the Reference Scenario.” www.iea.org/country/graphs/weo_2009/fig2-10.jpg.
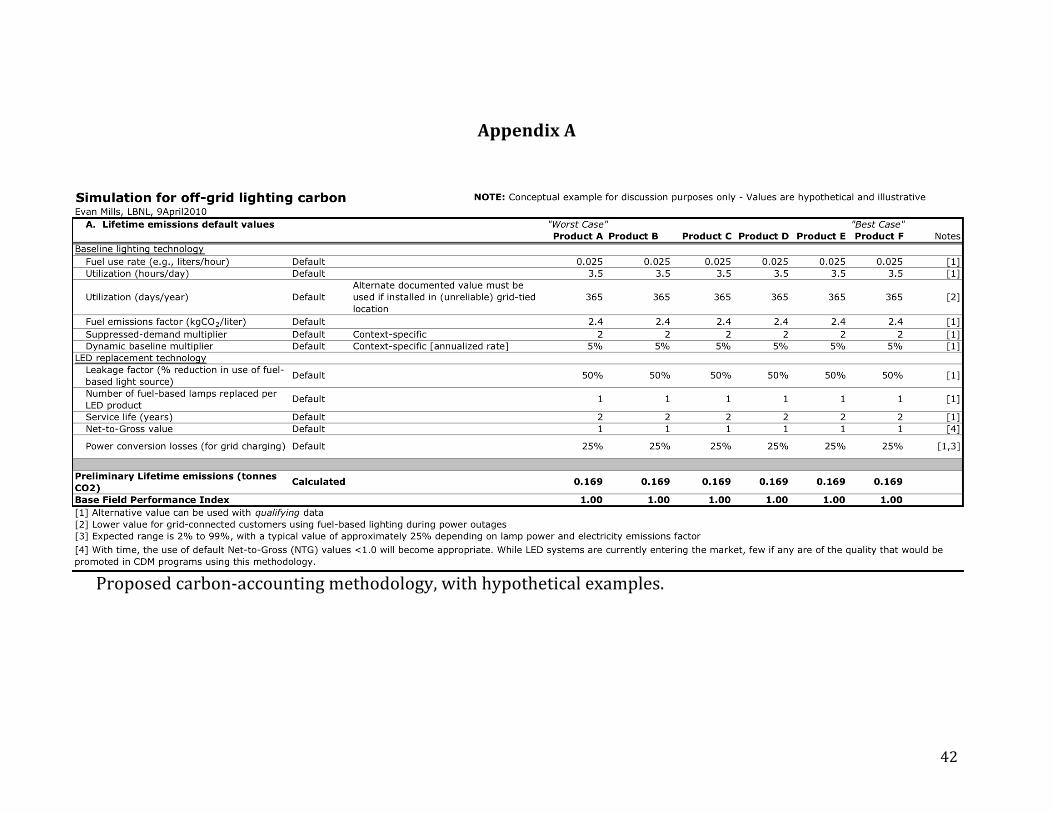
42
Appendix A
Proposed carbon-‐accounting methodology, with hypothetical examples.
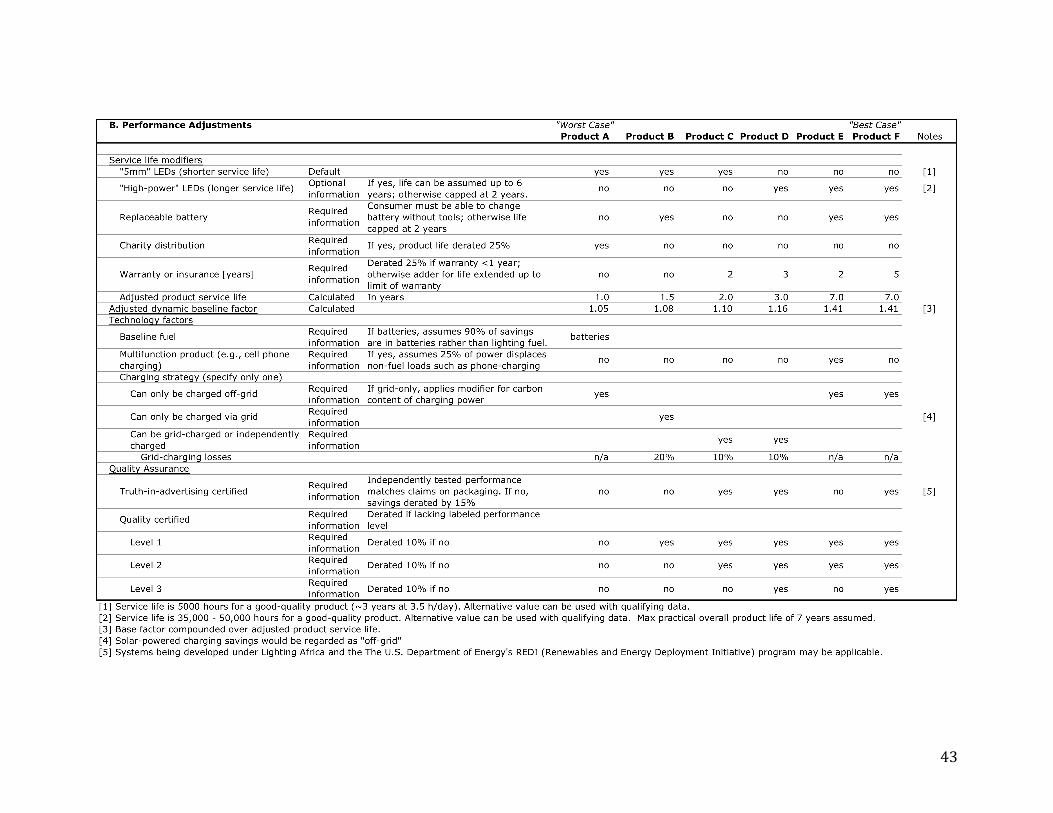
43
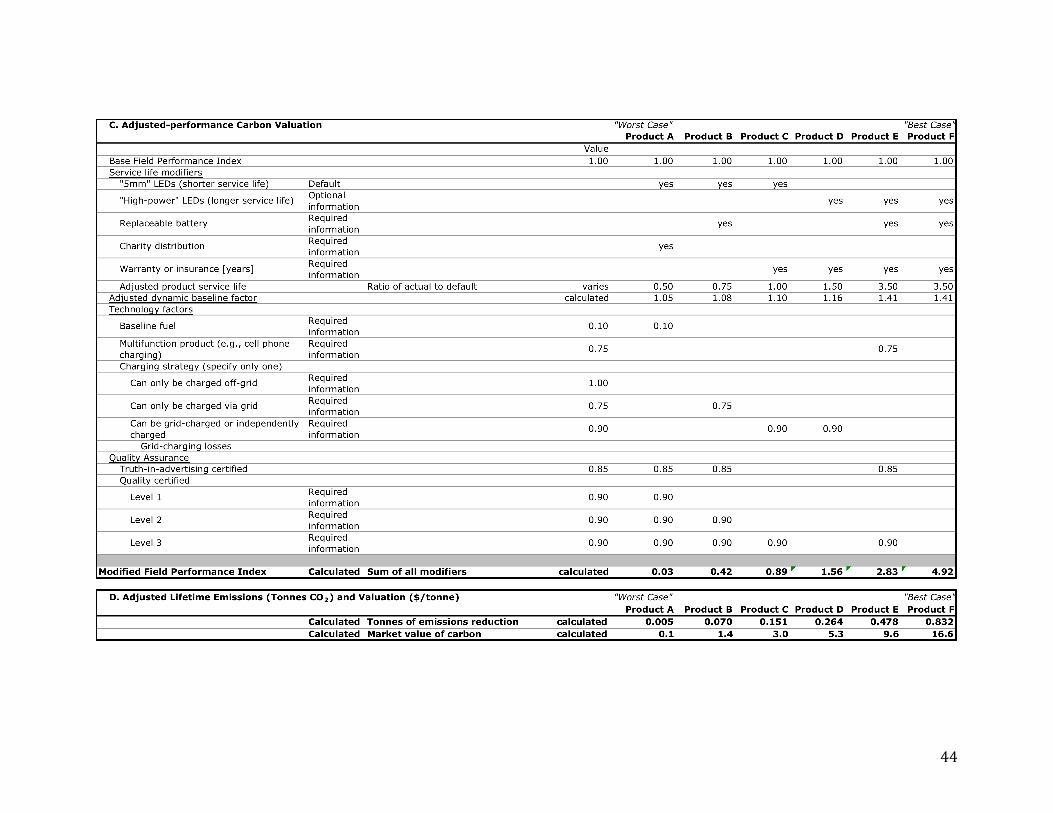
44
DISCLAIMER
This document was prepared as an account of work sponsored by the United States Government. While this document is believed to contain correct information, neither the United States Government nor any agency thereof, nor The Regents of the University of California, nor any of their employees, makes any warranty, express or implied, or assumes any legal responsibility for the accuracy, completeness, or usefulness of any information, apparatus, product, or process disclosed, or represents that its use would not infringe privately owned rights. Reference herein to any specific commercial product, process, or service by its trade name, trademark, manufacturer, or otherwise, does not necessarily constitute or imply its endorsement, recommendation, or favoring by the United States Government or any agency thereof, or The Regents of the University of California. The views and opinions of authors expressed herein do not necessarily state or reflect those of the United States Government or any agency thereof, or The Regents of the University of California.