Embed Size (px)
Citation preview

© 2013 Minitab, Inc.
From VOC to IPA:
This Beer’s For You!
Joel Smith
Statistician – Minitab Inc.
Image courtesy of amazon.com
© 2013 Minitab, Inc.
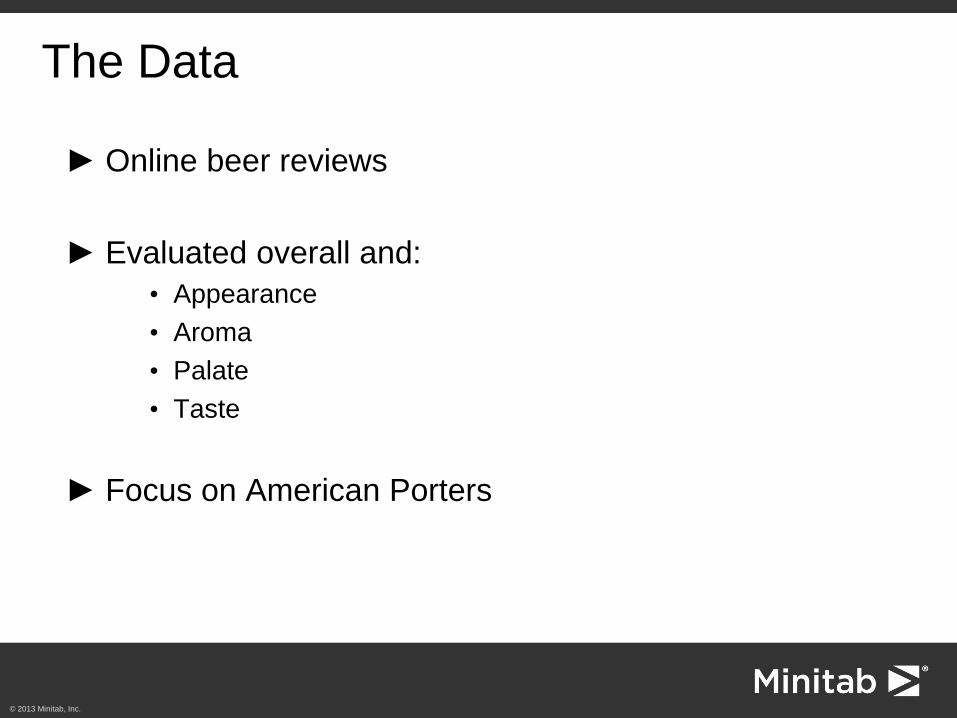
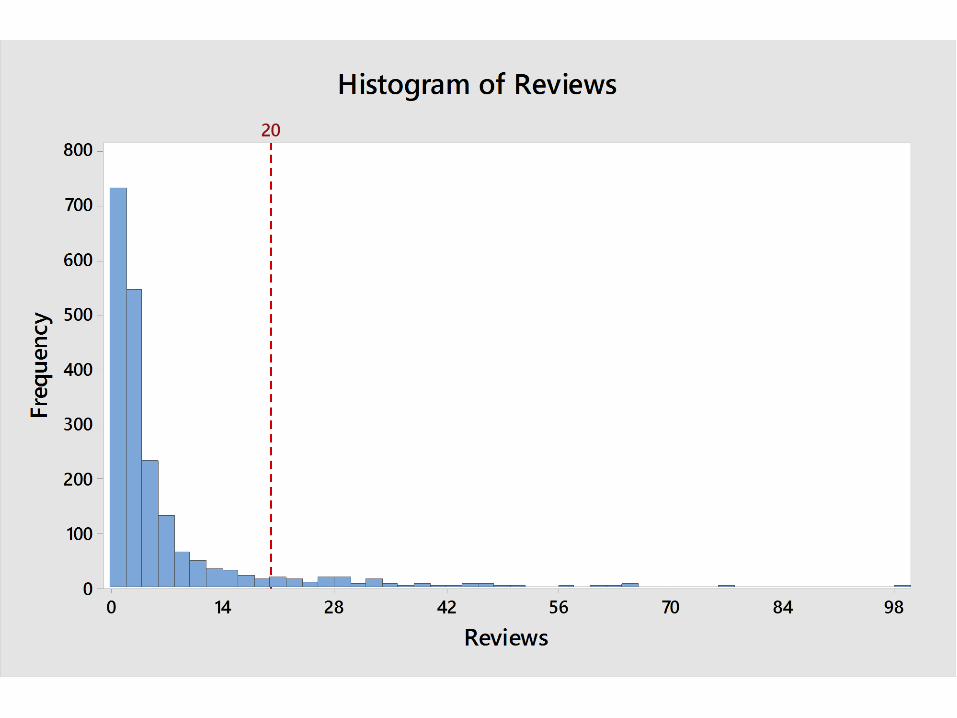
The Data
► Online beer reviews
► Evaluated overall and:
• Appearance
• Aroma
• Palate
• Taste
► Focus on American Porters
© 2013 Minitab, Inc.
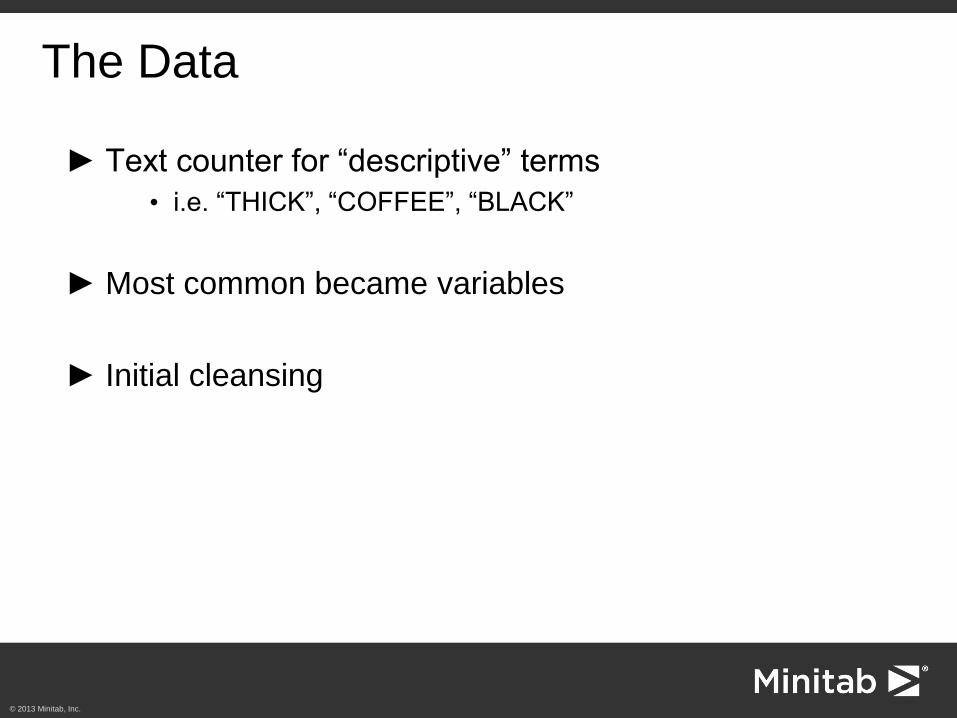
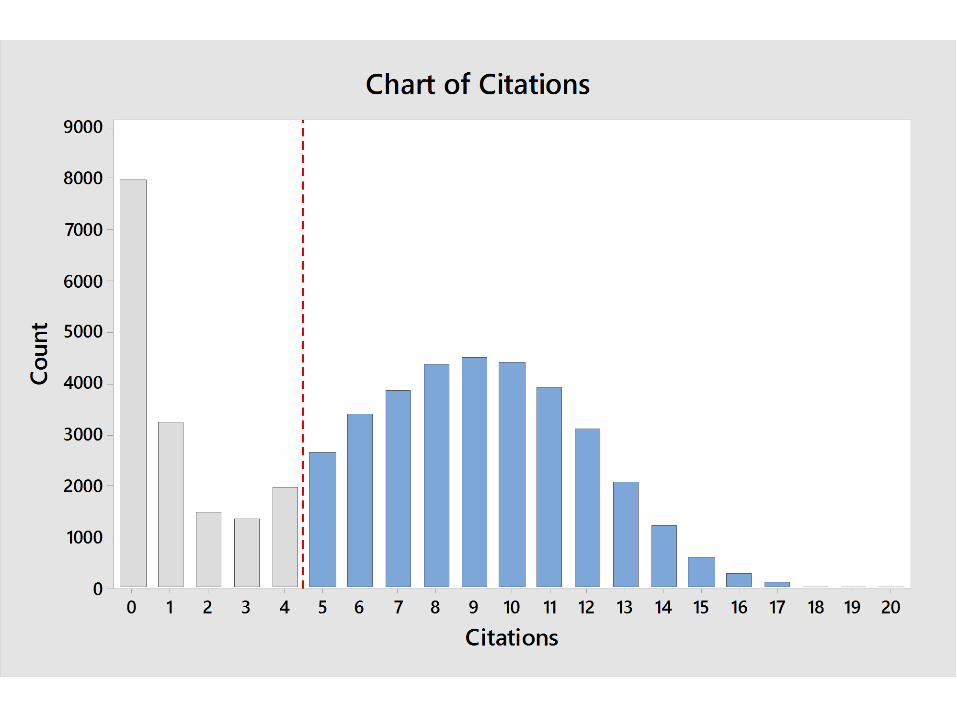
The Data
► Text counter for “descriptive” terms
• i.e. “THICK”, “COFFEE”, “BLACK”
► Most common became variables
► Initial cleansing
20191817161514131211109876543210
9000
8000
7000
6000
5000
4000
3000
2000
1000
0
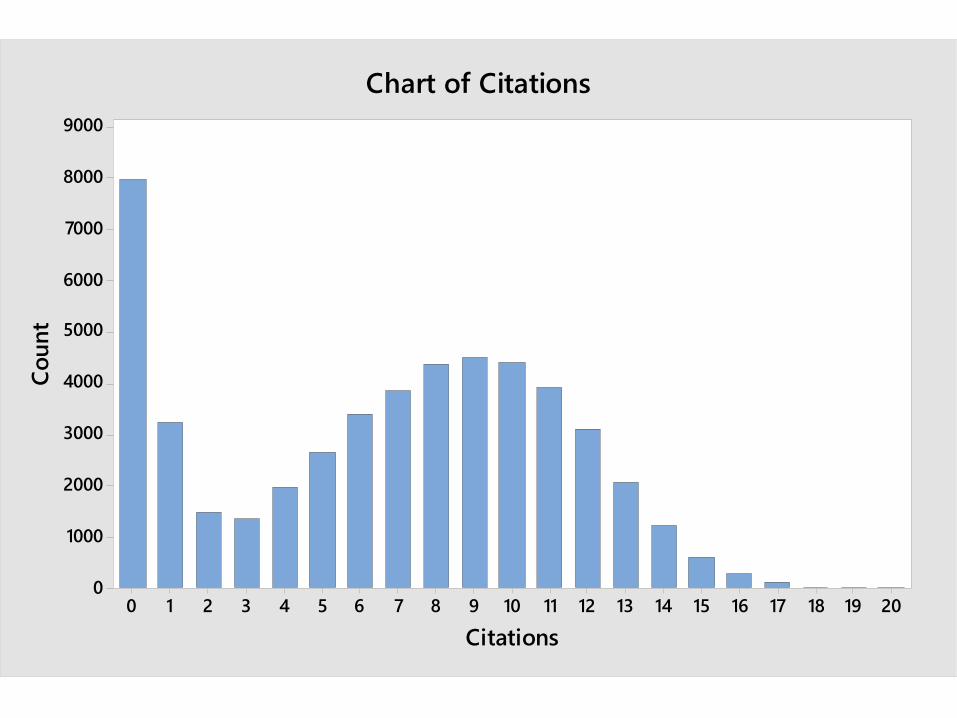
Citations
Co
un
t
Chart of Citations
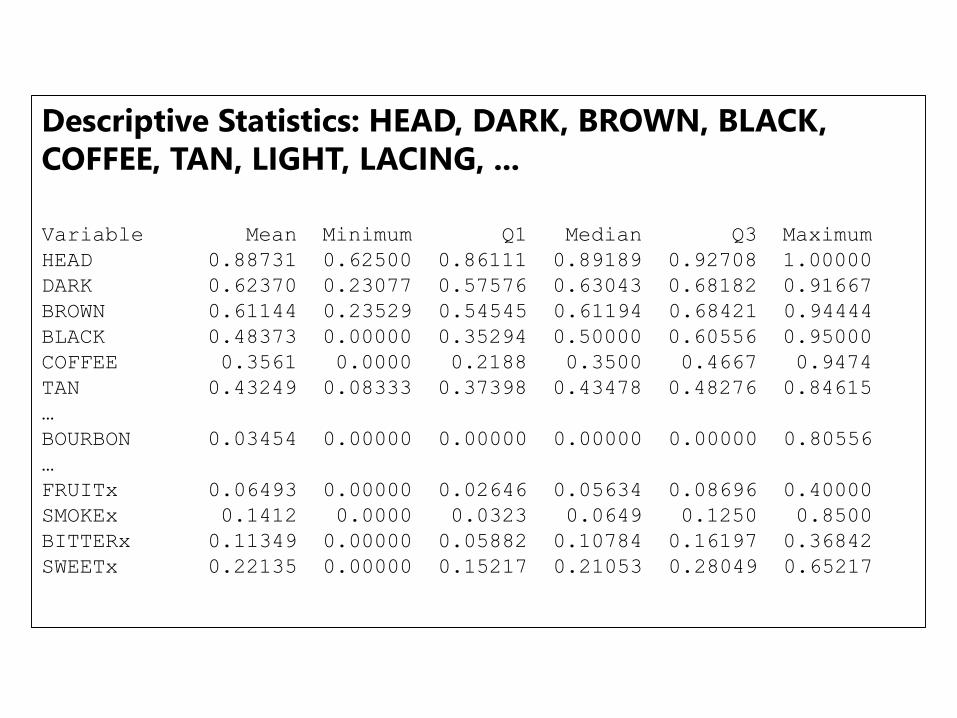
Descriptive Statistics: HEAD, DARK, BROWN, BLACK,
COFFEE, TAN, LIGHT, LACING, ...
Variable Mean Minimum Q1 Median Q3 Maximum
HEAD 0.88731 0.62500 0.86111 0.89189 0.92708 1.00000
DARK 0.62370 0.23077 0.57576 0.63043 0.68182 0.91667
BROWN 0.61144 0.23529 0.54545 0.61194 0.68421 0.94444
BLACK 0.48373 0.00000 0.35294 0.50000 0.60556 0.95000
COFFEE 0.3561 0.0000 0.2188 0.3500 0.4667 0.9474
TAN 0.43249 0.08333 0.37398 0.43478 0.48276 0.84615
…
BOURBON 0.03454 0.00000 0.00000 0.00000 0.00000 0.80556
…
FRUITx 0.06493 0.00000 0.02646 0.05634 0.08696 0.40000
SMOKEx 0.1412 0.0000 0.0323 0.0649 0.1250 0.8500
BITTERx 0.11349 0.00000 0.05882 0.10784 0.16197 0.36842
SWEETx 0.22135 0.00000 0.15217 0.21053 0.28049 0.65217
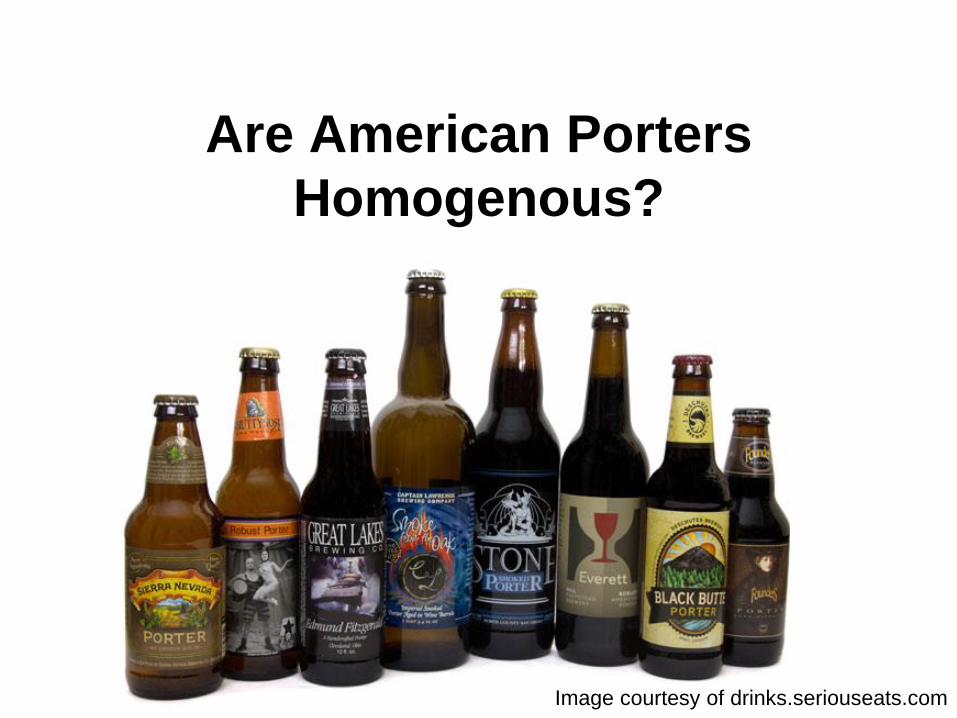
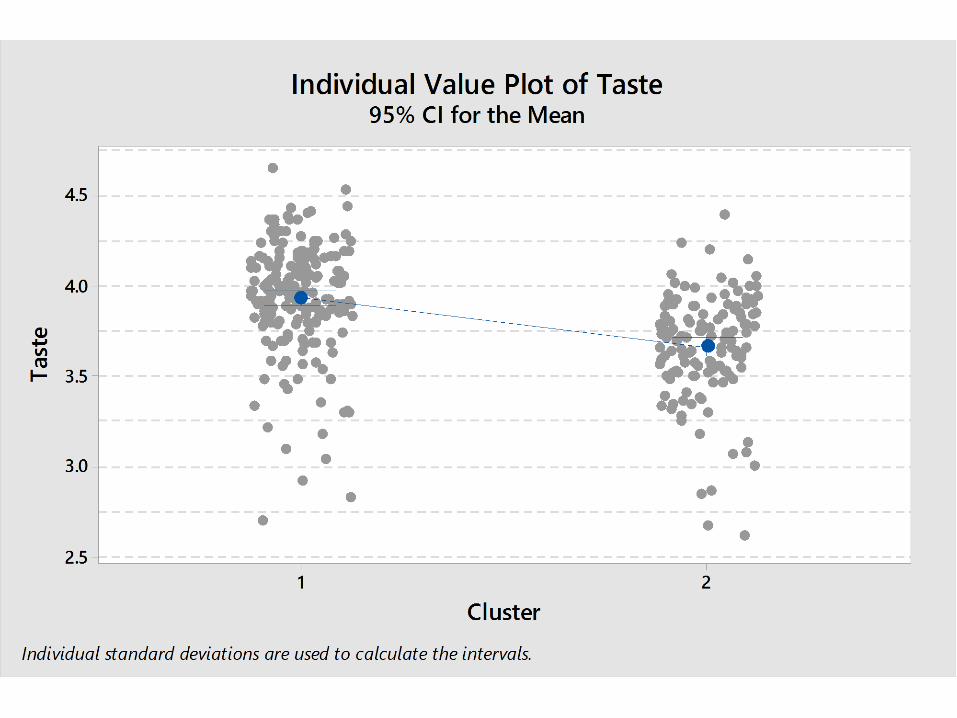
Are American Porters
Homogenous?
Image courtesy of drinks.seriouseats.com
© 2013 Minitab, Inc.
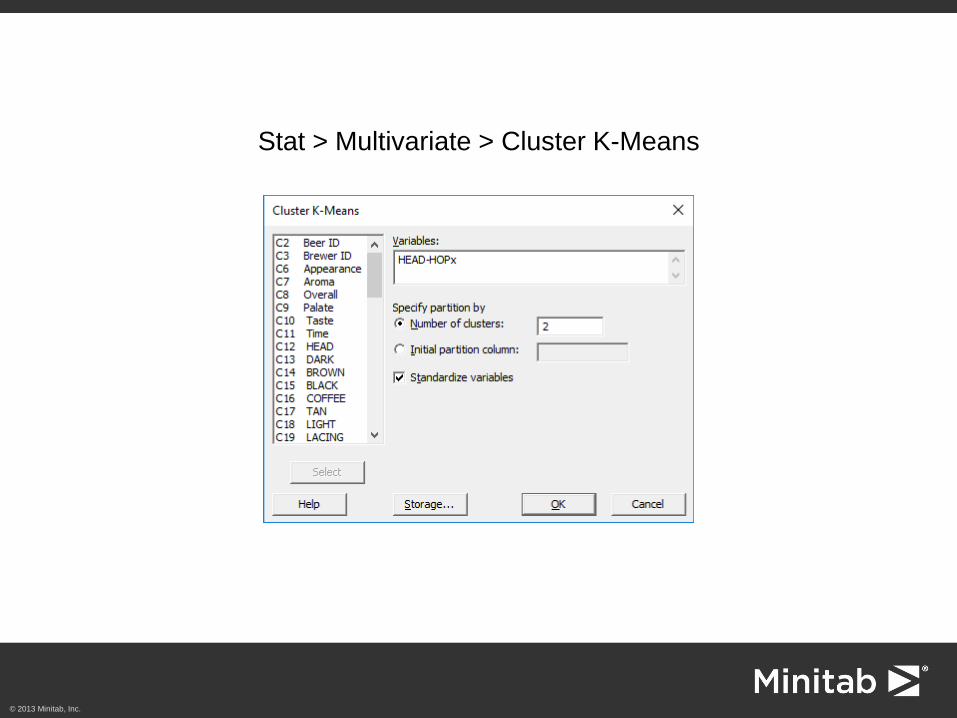
Stat > Multivariate > Cluster K-Means
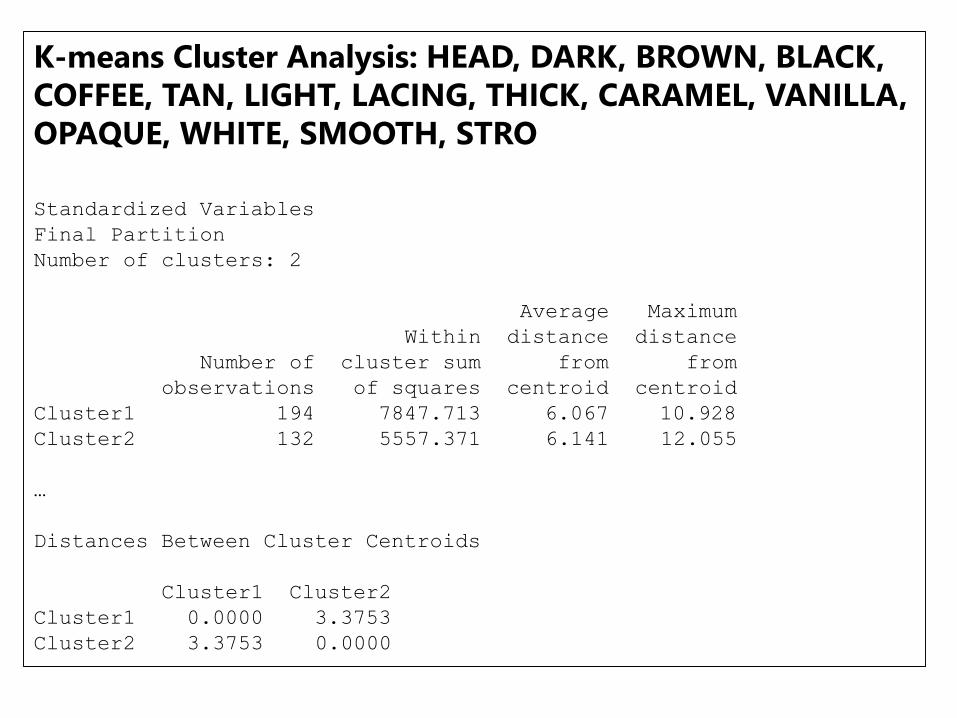
K-means Cluster Analysis: HEAD, DARK, BROWN, BLACK,
COFFEE, TAN, LIGHT, LACING, THICK, CARAMEL, VANILLA,
OPAQUE, WHITE, SMOOTH, STRO
Standardized Variables
Final Partition
Number of clusters: 2
Average Maximum
Within distance distance
Number of cluster sum from from
observations of squares centroid centroid
Cluster1 194 7847.713 6.067 10.928
Cluster2 132 5557.371 6.141 12.055
…
Distances Between Cluster Centroids
Cluster1 Cluster2
Cluster1 0.0000 3.3753
Cluster2 3.3753 0.0000
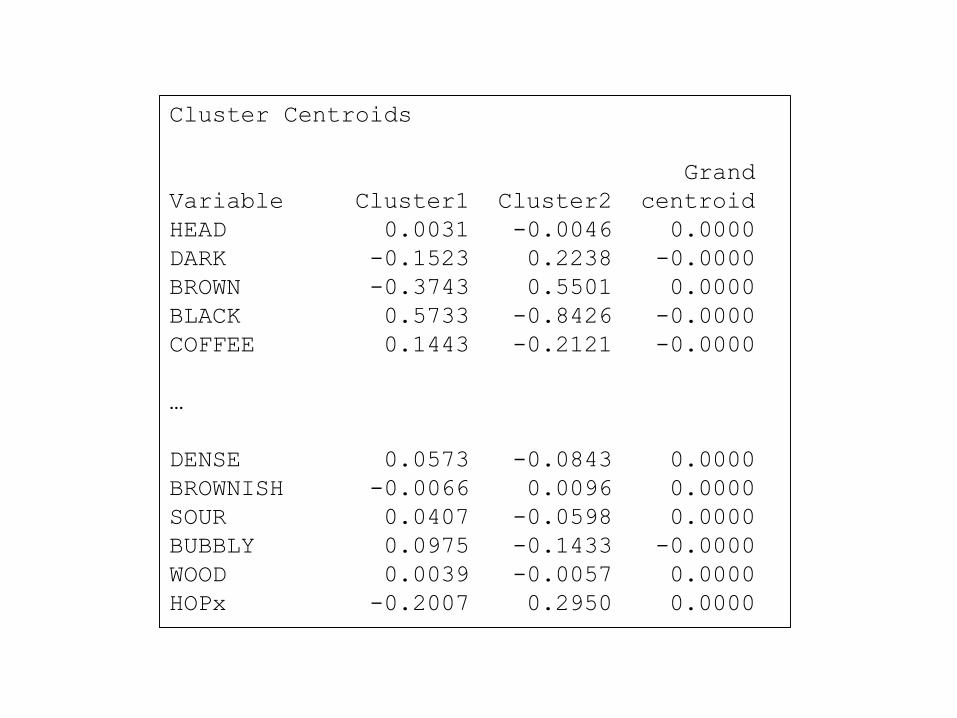
Cluster Centroids
Grand
Variable Cluster1 Cluster2 centroid
HEAD 0.0031 -0.0046 0.0000
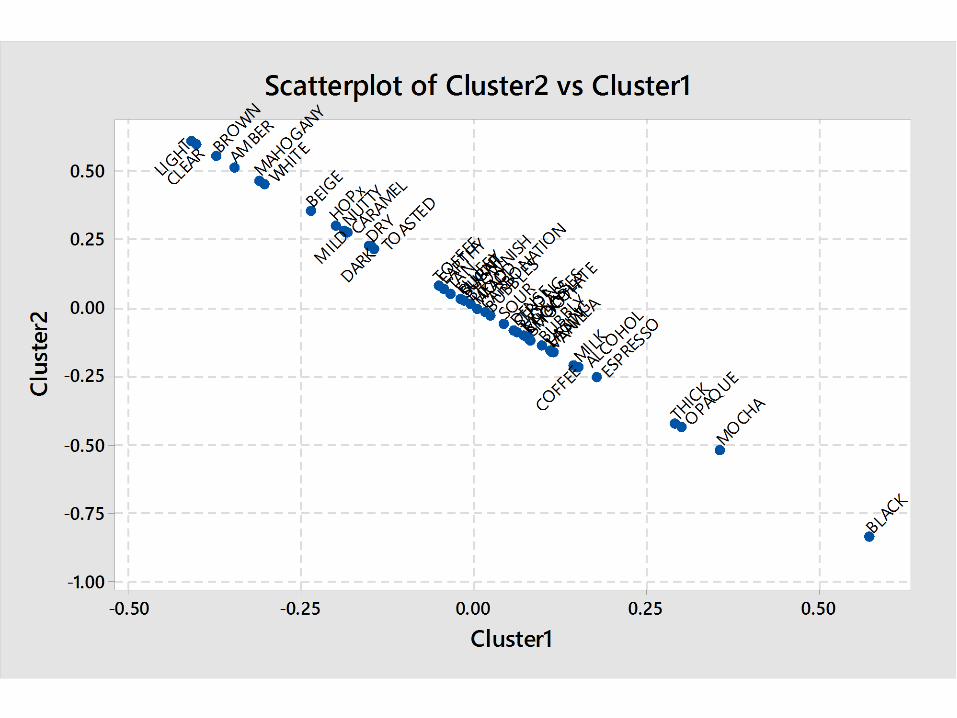
DARK -0.1523 0.2238 -0.0000
BROWN -0.3743 0.5501 0.0000
BLACK 0.5733 -0.8426 -0.0000
COFFEE 0.1443 -0.2121 -0.0000
…
DENSE 0.0573 -0.0843 0.0000
BROWNISH -0.0066 0.0096 0.0000
SOUR 0.0407 -0.0598 0.0000
BUBBLY 0.0975 -0.1433 -0.0000
WOOD 0.0039 -0.0057 0.0000
HOPx -0.2007 0.2950 0.0000
© 2013 Minitab, Inc.
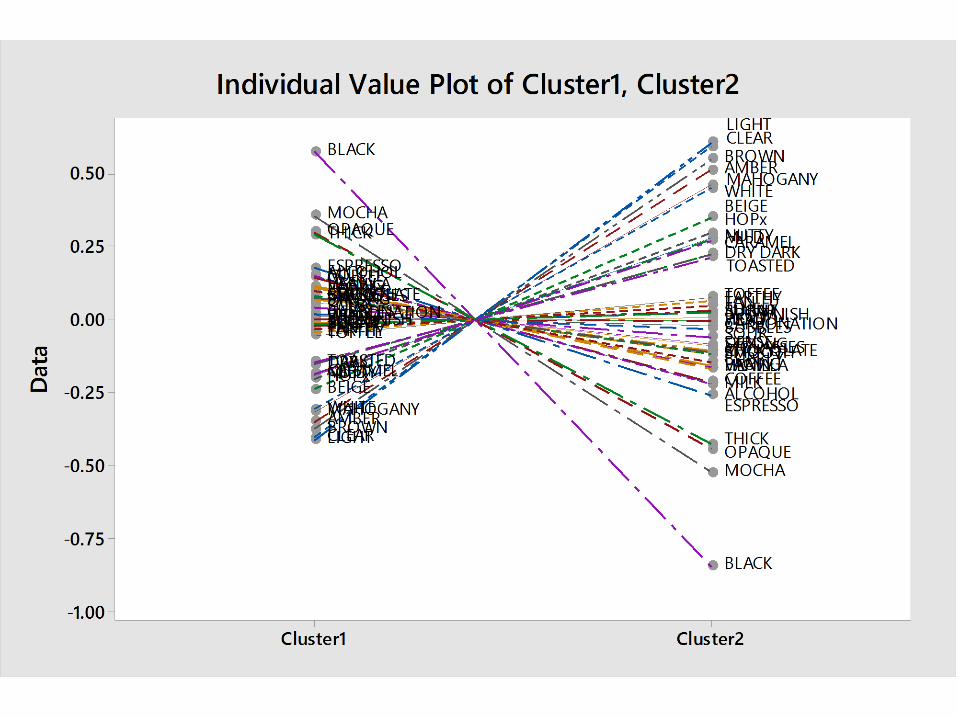
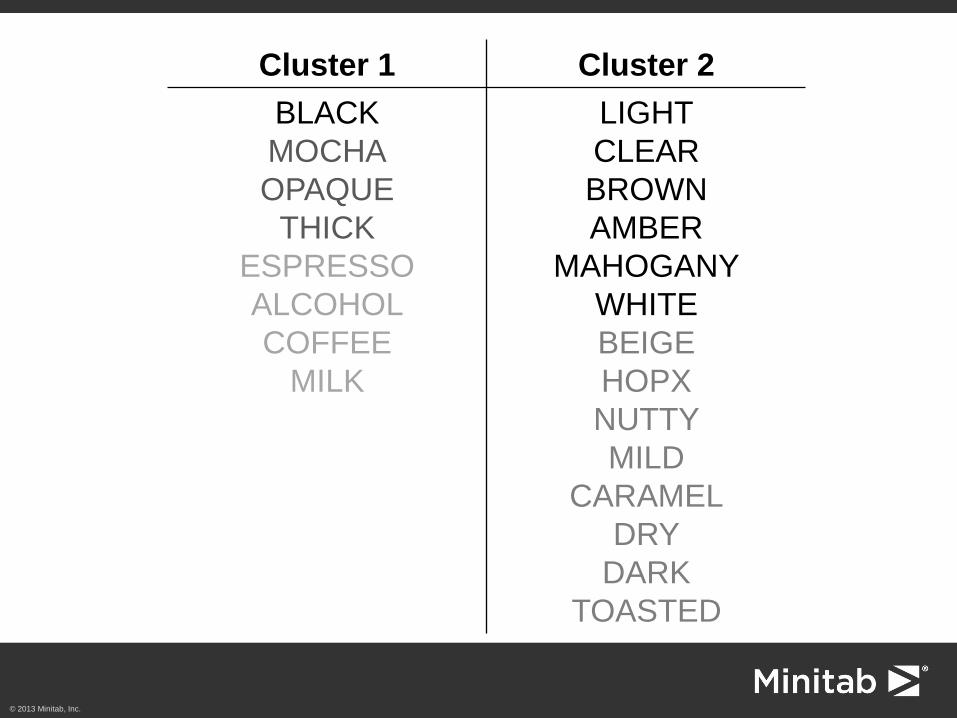
Cluster 1 Cluster 2
BLACK
MOCHA
OPAQUE
THICK
ESPRESSO
ALCOHOL
COFFEE
MILK
LIGHT
CLEAR
BROWN
AMBER
MAHOGANY
WHITE
BEIGE
HOPX
NUTTY
MILD
CARAMEL
DRY
DARK
TOASTED
What Are Customers
Differentiating?
Image courtesy of finedininglovers.com
© 2013 Minitab, Inc.
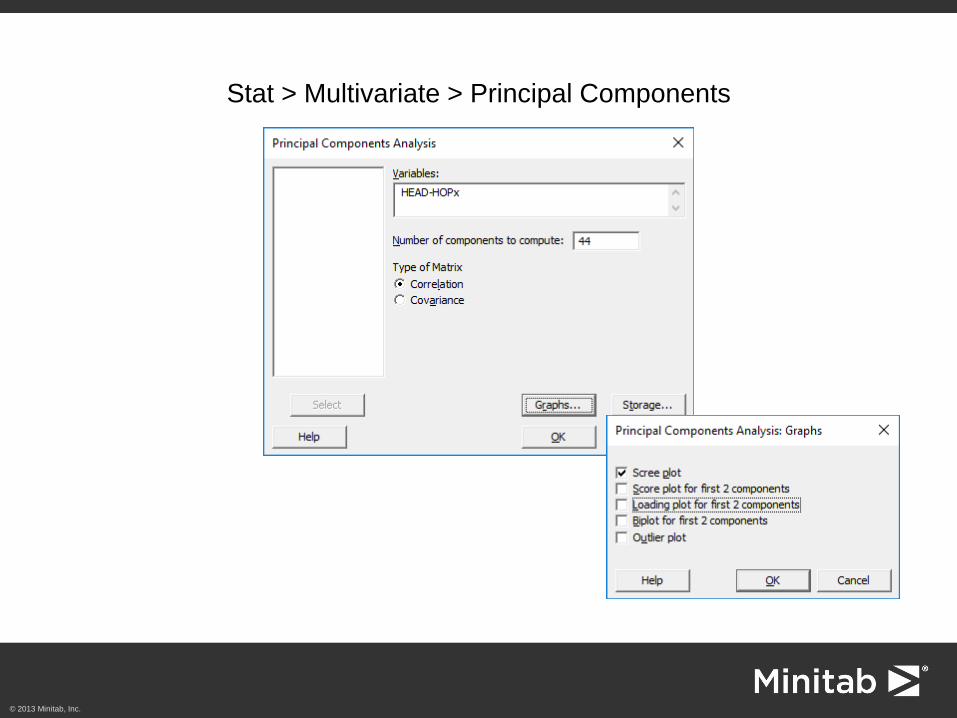
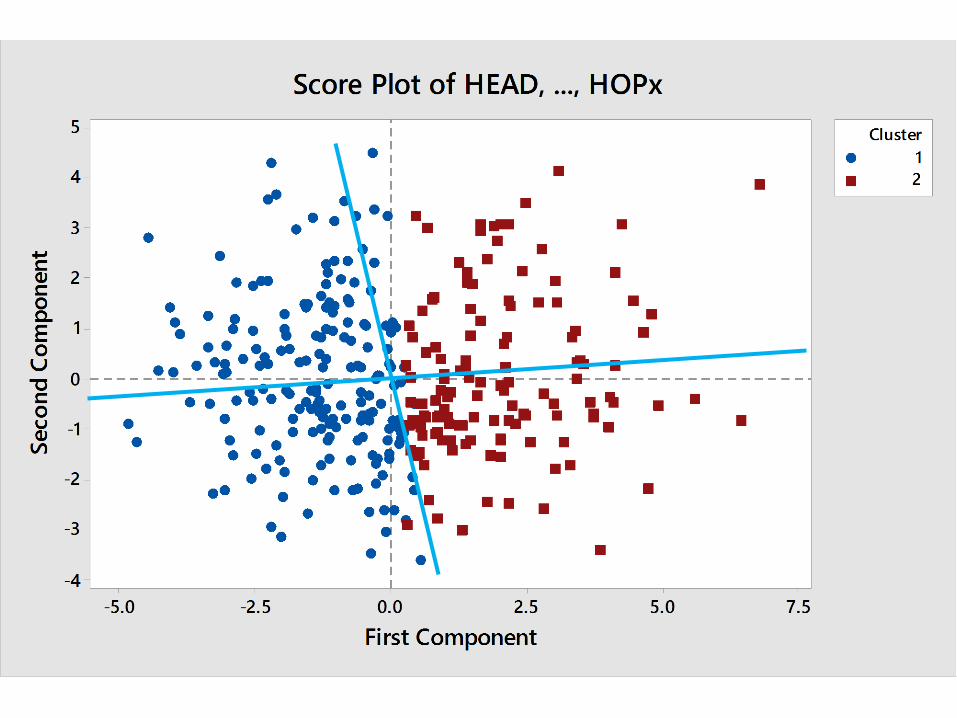
Stat > Multivariate > Principal Components
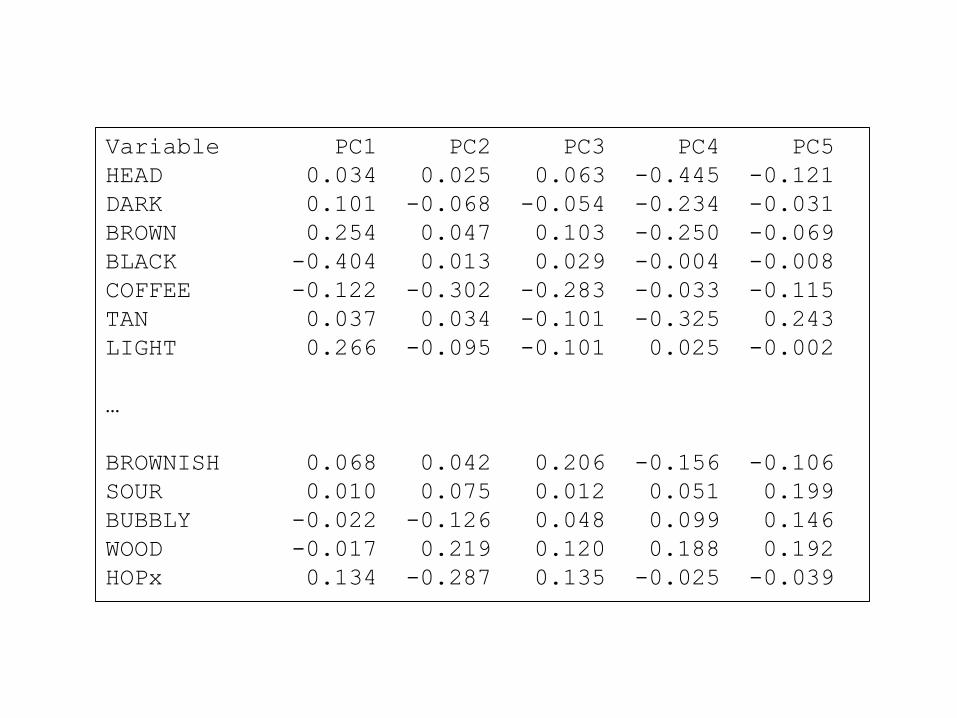
Variable PC1 PC2 PC3 PC4 PC5
HEAD 0.034 0.025 0.063 -0.445 -0.121
DARK 0.101 -0.068 -0.054 -0.234 -0.031
BROWN 0.254 0.047 0.103 -0.250 -0.069
BLACK -0.404 0.013 0.029 -0.004 -0.008
COFFEE -0.122 -0.302 -0.283 -0.033 -0.115
TAN 0.037 0.034 -0.101 -0.325 0.243
LIGHT 0.266 -0.095 -0.101 0.025 -0.002
…
BROWNISH 0.068 0.042 0.206 -0.156 -0.106
SOUR 0.010 0.075 0.012 0.051 0.199
BUBBLY -0.022 -0.126 0.048 0.099 0.146
WOOD -0.017 0.219 0.120 0.188 0.192
HOPx 0.134 -0.287 0.135 -0.025 -0.039
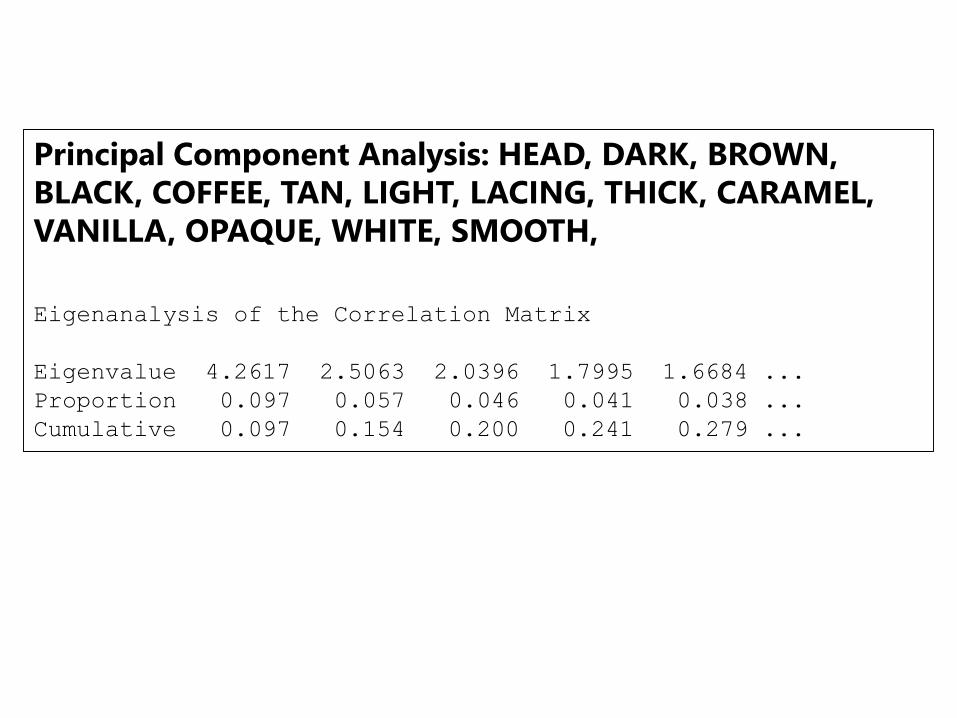
Principal Component Analysis: HEAD, DARK, BROWN,
BLACK, COFFEE, TAN, LIGHT, LACING, THICK, CARAMEL,
VANILLA, OPAQUE, WHITE, SMOOTH,
Eigenanalysis of the Correlation Matrix
Eigenvalue 4.2617 2.5063 2.0396 1.7995 1.6684 ...
Proportion 0.097 0.057 0.046 0.041 0.038 ...
Cumulative 0.097 0.154 0.200 0.241 0.279 ...
4035302520151051
4
3
2
1
0
Component Number
Eig
en
valu
e
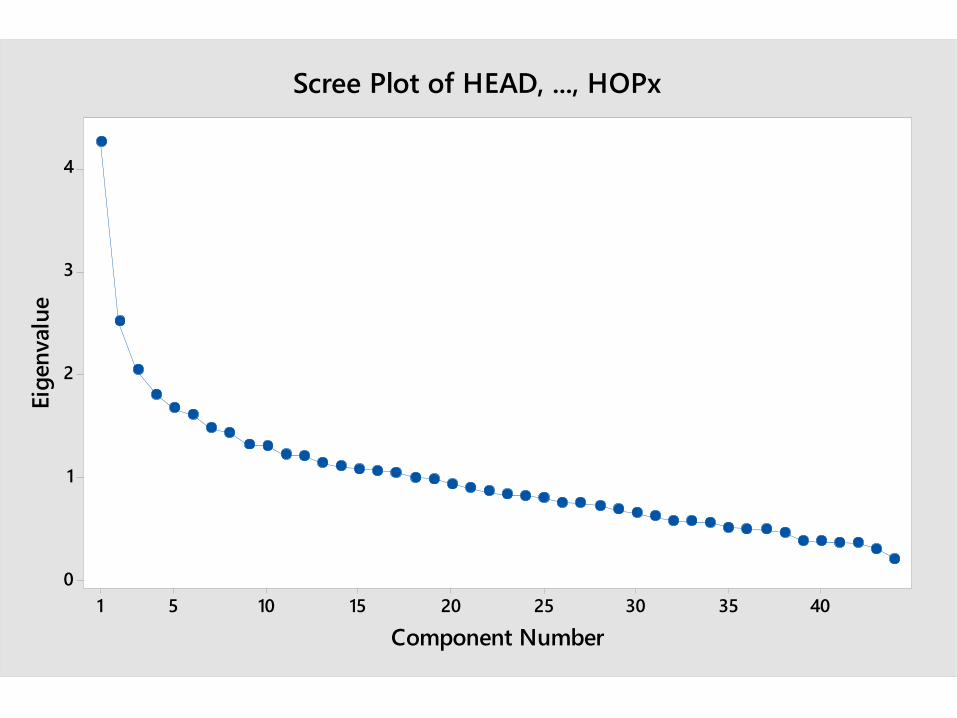
Scree Plot of HEAD, ..., HOPx
0.40.30.20.10.0-0.1-0.2-0.3-0.4-0.5
0.3
0.2
0.1
0.0
-0.1
-0.2
-0.3
-0.4
First Component
Seco
nd
Co
mp
on
en
t
HOPx
WOOD
BUBBLY
SOUR
BROWNISH
DENSE
SUGAR
NUTTY
FLUFFY
EARTHYESPRESSO
ALCOHOL
CHOCOLATE
STICKYHEAVY
AMBER
BEIGE
MOLASSES
MILK
TOASTEDDRY
BUBBLESMAHOGANY
TOFFEE
CLEAR
MILD
MOCHA
CARBONATION
BURNT
STRONG
SMOOTH
WHITE
OPAQUE
VANILLA
CARAMEL
THICK
LACING
LIGHT
TAN
COFFEE
BLACK
BROWN
DARK
HEAD
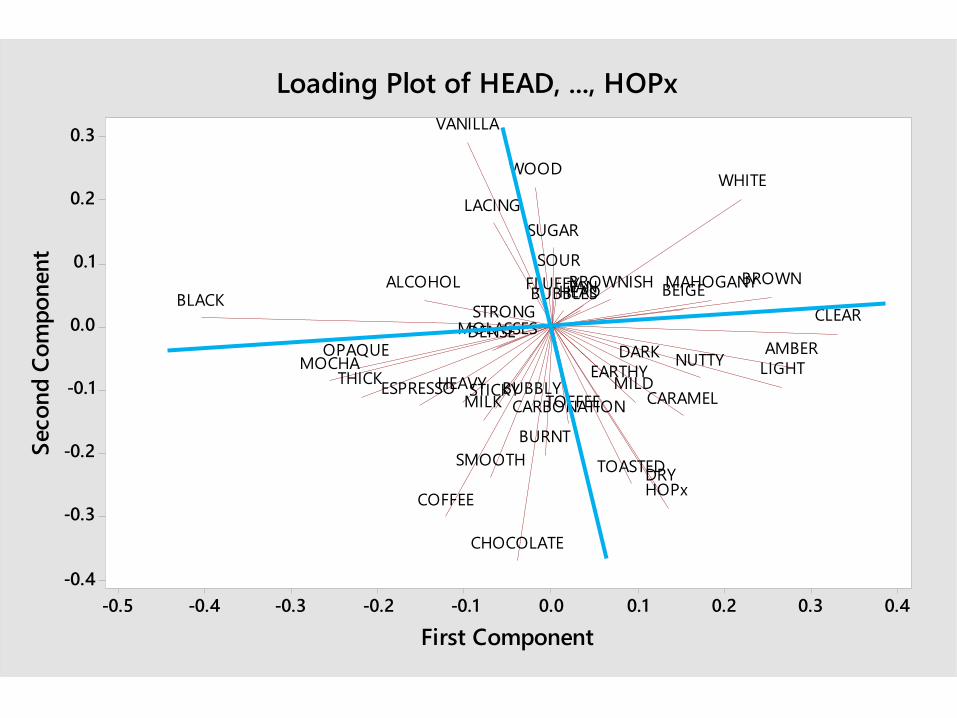
Loading Plot of HEAD, ..., HOPx
© 2013 Minitab, Inc.
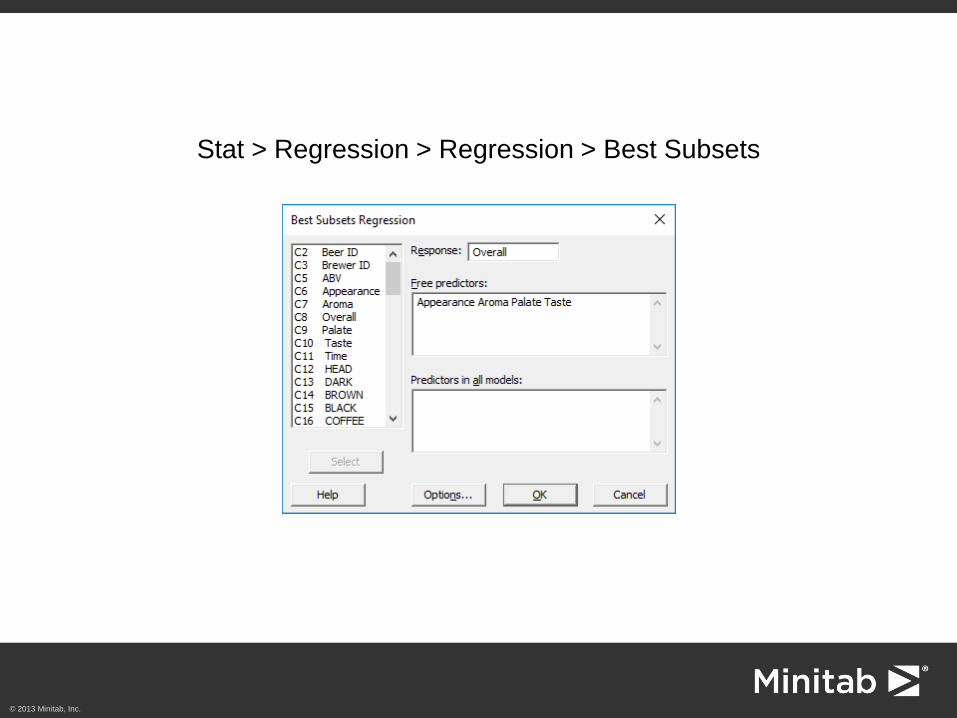
Stat > Regression > Regression > Best Subsets
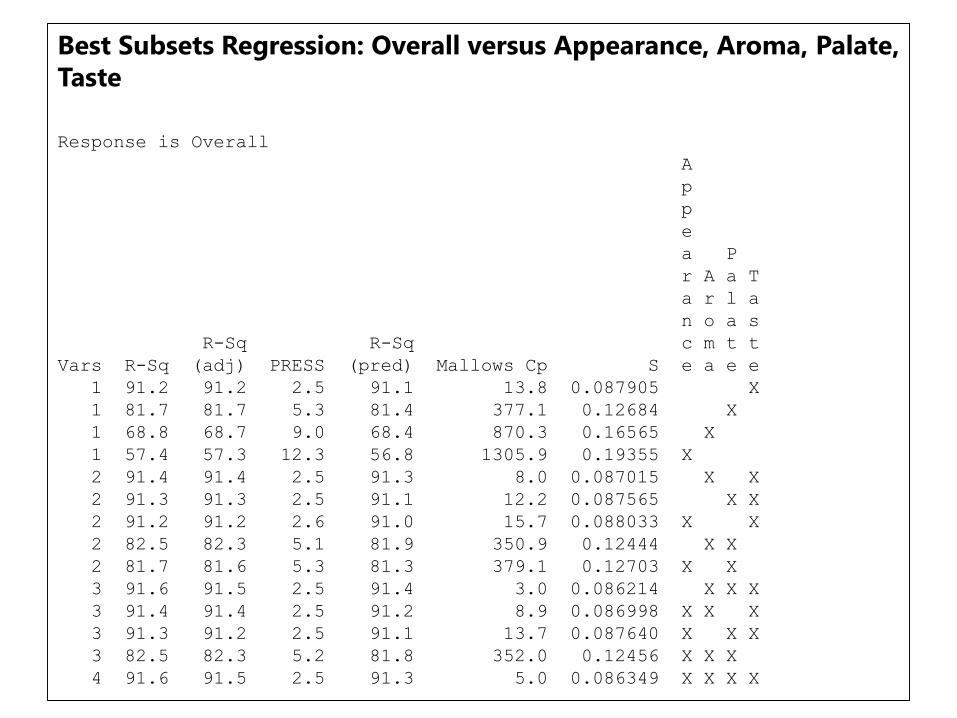
Best Subsets Regression: Overall versus Appearance, Aroma, Palate,
Taste
Response is Overall
A
p
p
e
a P
r A a T
a r l a
n o a s
R-Sq R-Sq c m t t
Vars R-Sq (adj) PRESS (pred) Mallows Cp S e a e e
1 91.2 91.2 2.5 91.1 13.8 0.087905 X
1 81.7 81.7 5.3 81.4 377.1 0.12684 X
1 68.8 68.7 9.0 68.4 870.3 0.16565 X
1 57.4 57.3 12.3 56.8 1305.9 0.19355 X
2 91.4 91.4 2.5 91.3 8.0 0.087015 X X
2 91.3 91.3 2.5 91.1 12.2 0.087565 X X
2 91.2 91.2 2.6 91.0 15.7 0.088033 X X
2 82.5 82.3 5.1 81.9 350.9 0.12444 X X
2 81.7 81.6 5.3 81.3 379.1 0.12703 X X
3 91.6 91.5 2.5 91.4 3.0 0.086214 X X X
3 91.4 91.4 2.5 91.2 8.9 0.086998 X X X
3 91.3 91.2 2.5 91.1 13.7 0.087640 X X X
3 82.5 82.3 5.2 81.8 352.0 0.12456 X X X
4 91.6 91.5 2.5 91.3 5.0 0.086349 X X X X
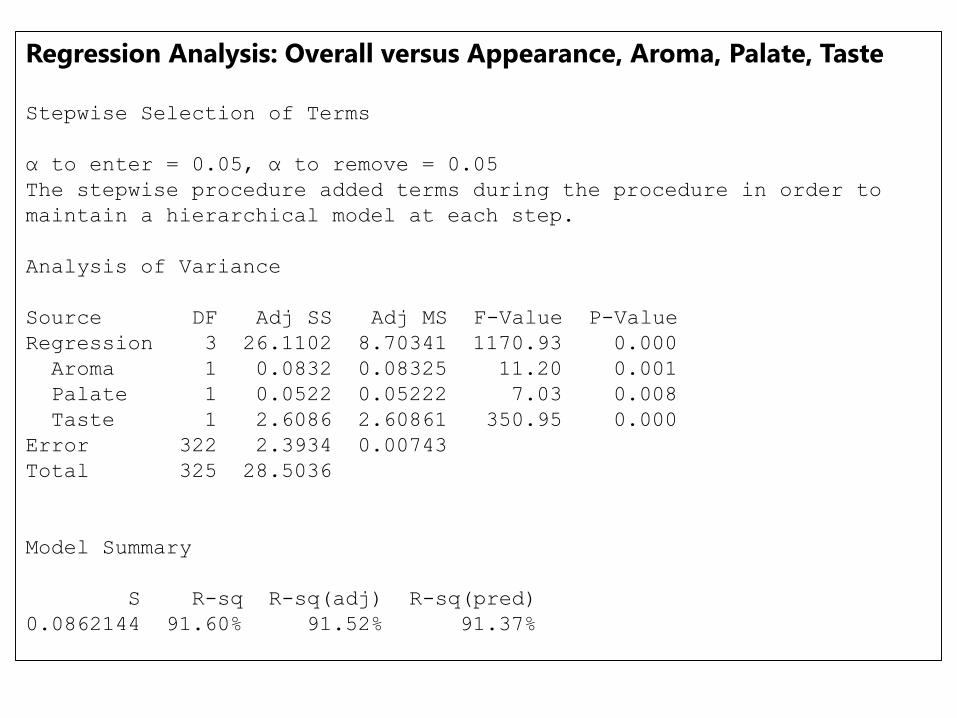
Regression Analysis: Overall versus Appearance, Aroma, Palate, Taste
Stepwise Selection of Terms
α to enter = 0.05, α to remove = 0.05
The stepwise procedure added terms during the procedure in order to
maintain a hierarchical model at each step.
Analysis of Variance
Source DF Adj SS Adj MS F-Value P-Value
Regression 3 26.1102 8.70341 1170.93 0.000
Aroma 1 0.0832 0.08325 11.20 0.001
Palate 1 0.0522 0.05222 7.03 0.008
Taste 1 2.6086 2.60861 350.95 0.000
Error 322 2.3934 0.00743
Total 325 28.5036
Model Summary
S R-sq R-sq(adj) R-sq(pred)
0.0862144 91.60% 91.52% 91.37%
What are the characteristics of
the best porter?
Image courtesy of beerandbrewing.com
© 2013 Minitab, Inc.
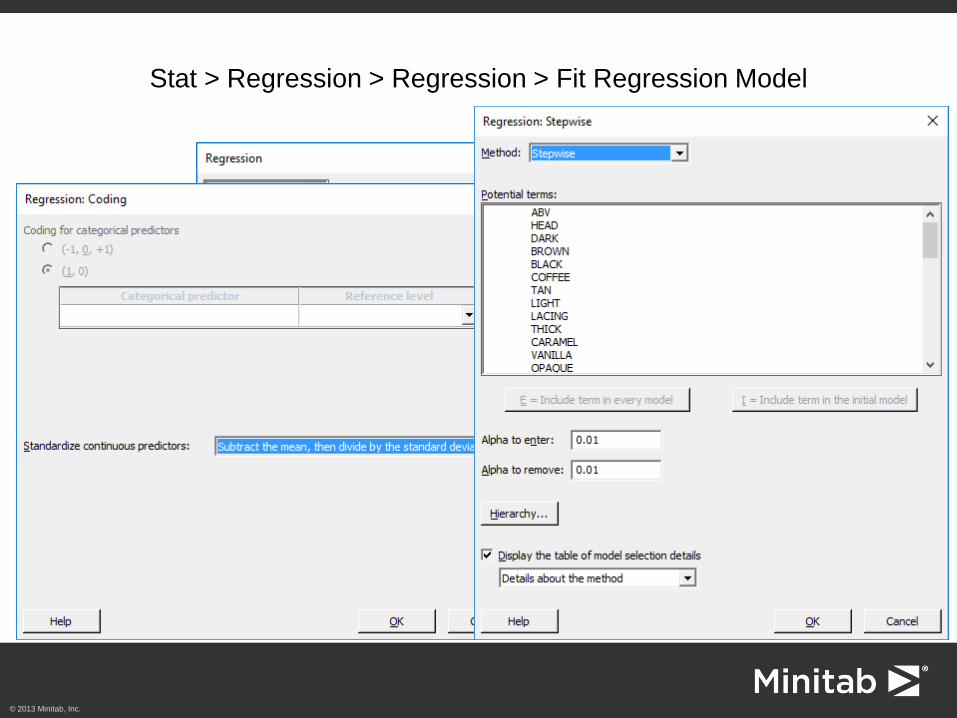
Stat > Regression > Regression > Fit Regression Model
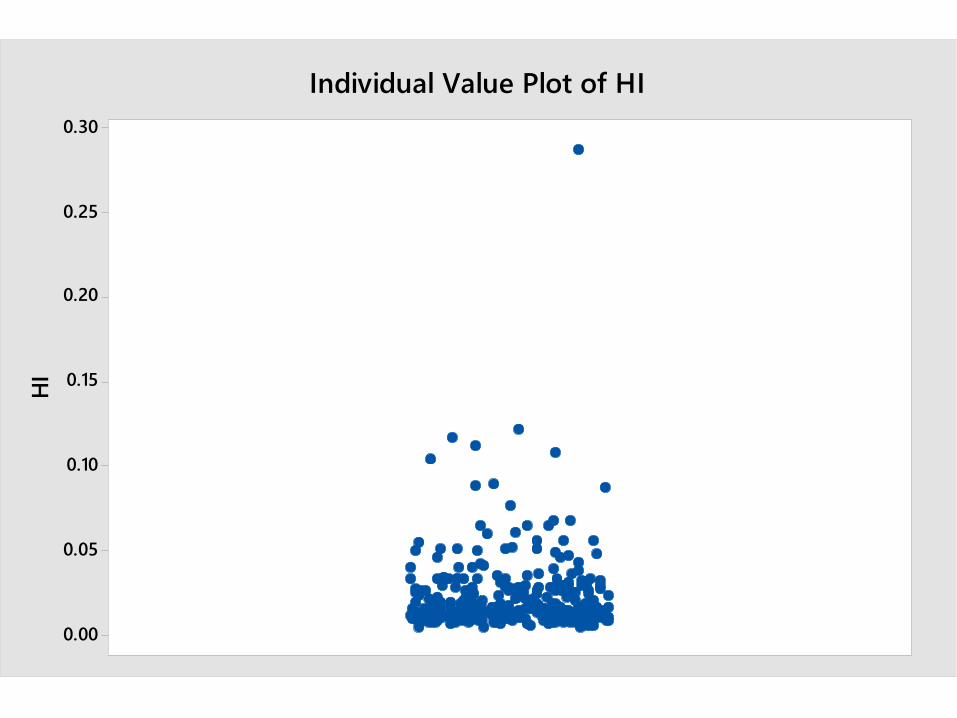
0.30
0.25
0.20
0.15
0.10
0.05
0.00
HI
Individual Value Plot of HI
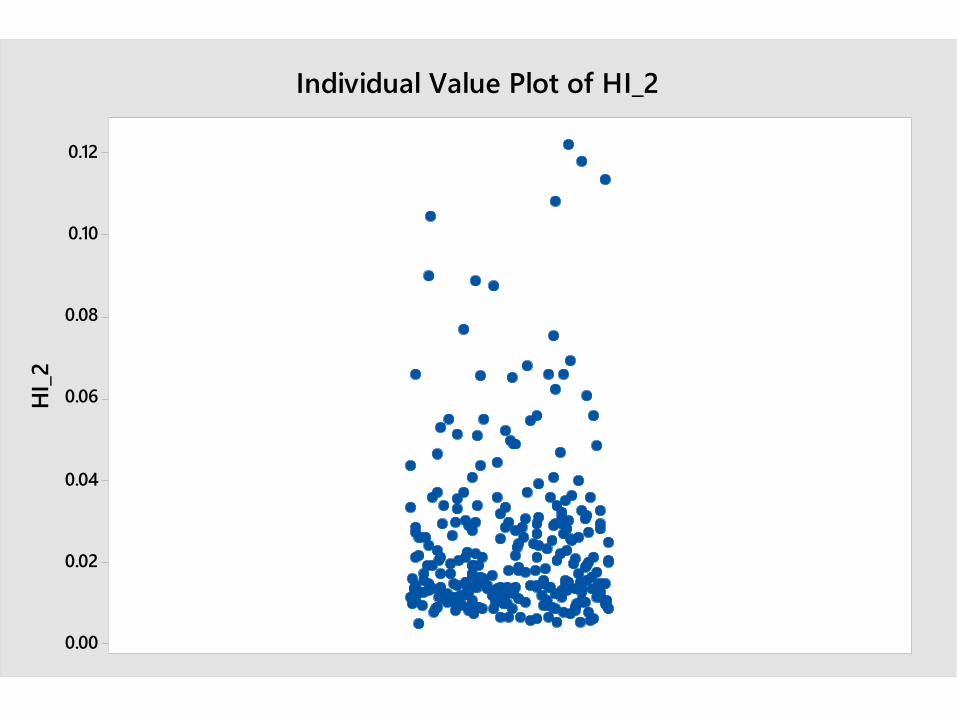
0.12
0.10
0.08
0.06
0.04
0.02
0.00
HI_
2
Individual Value Plot of HI_2
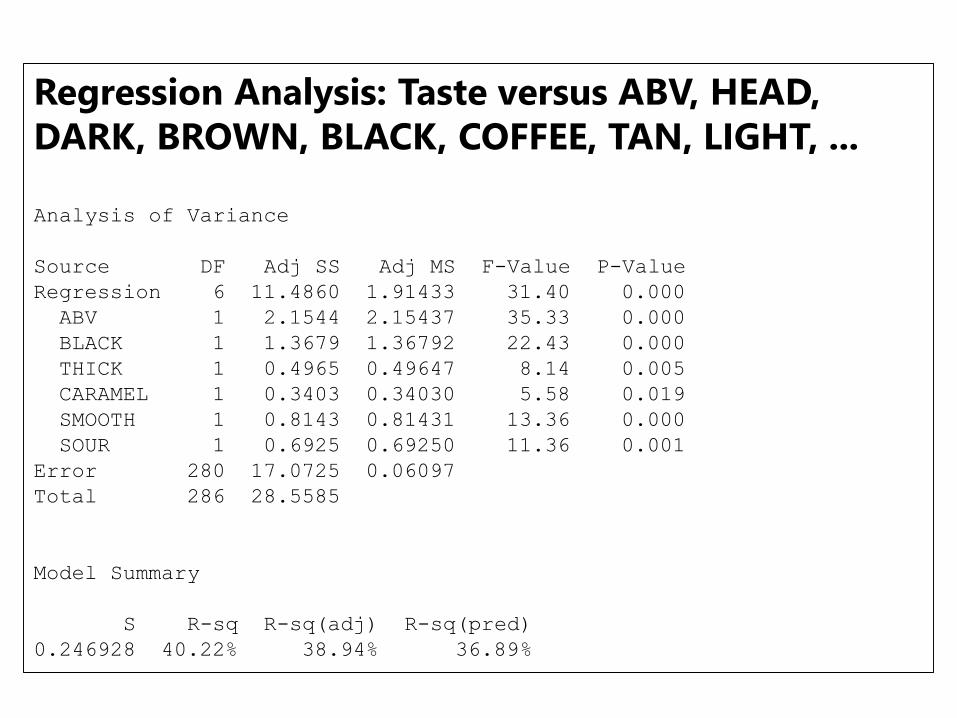
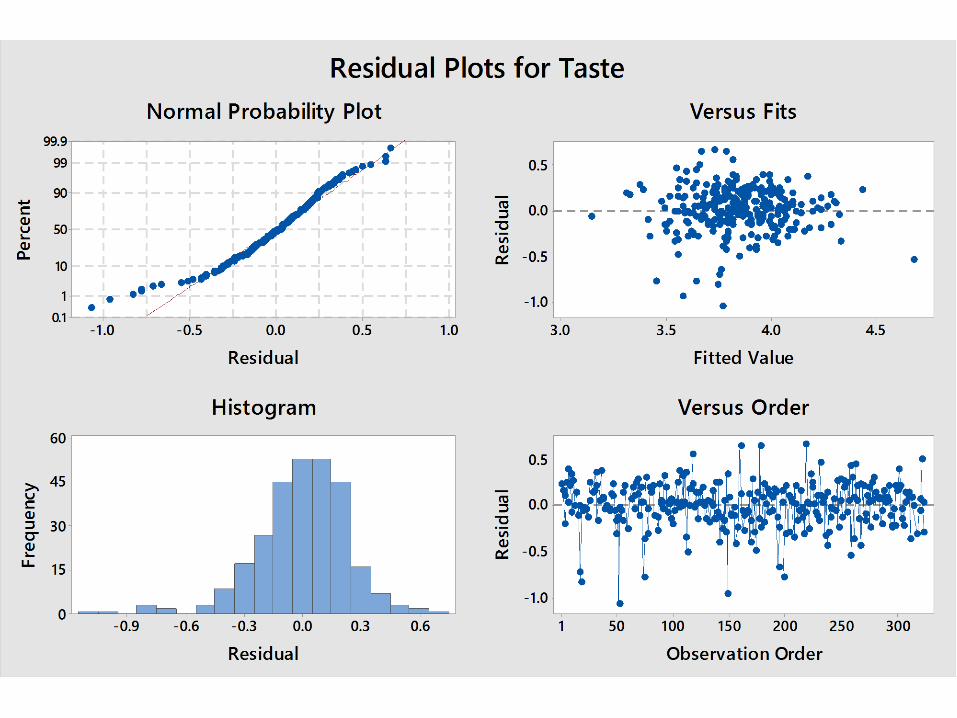
Regression Analysis: Taste versus ABV, HEAD,
DARK, BROWN, BLACK, COFFEE, TAN, LIGHT, ...
Analysis of Variance
Source DF Adj SS Adj MS F-Value P-Value
Regression 6 11.4860 1.91433 31.40 0.000
ABV 1 2.1544 2.15437 35.33 0.000
BLACK 1 1.3679 1.36792 22.43 0.000
THICK 1 0.4965 0.49647 8.14 0.005
CARAMEL 1 0.3403 0.34030 5.58 0.019
SMOOTH 1 0.8143 0.81431 13.36 0.000
SOUR 1 0.6925 0.69250 11.36 0.001
Error 280 17.0725 0.06097
Total 286 28.5585
Model Summary
S R-sq R-sq(adj) R-sq(pred)
0.246928 40.22% 38.94% 36.89%
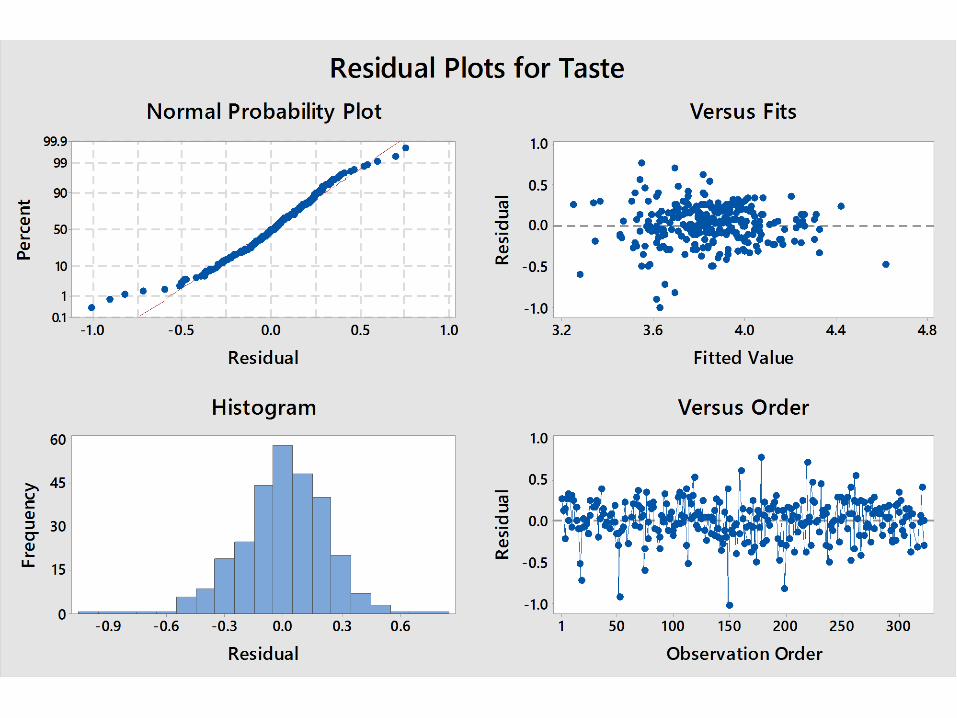
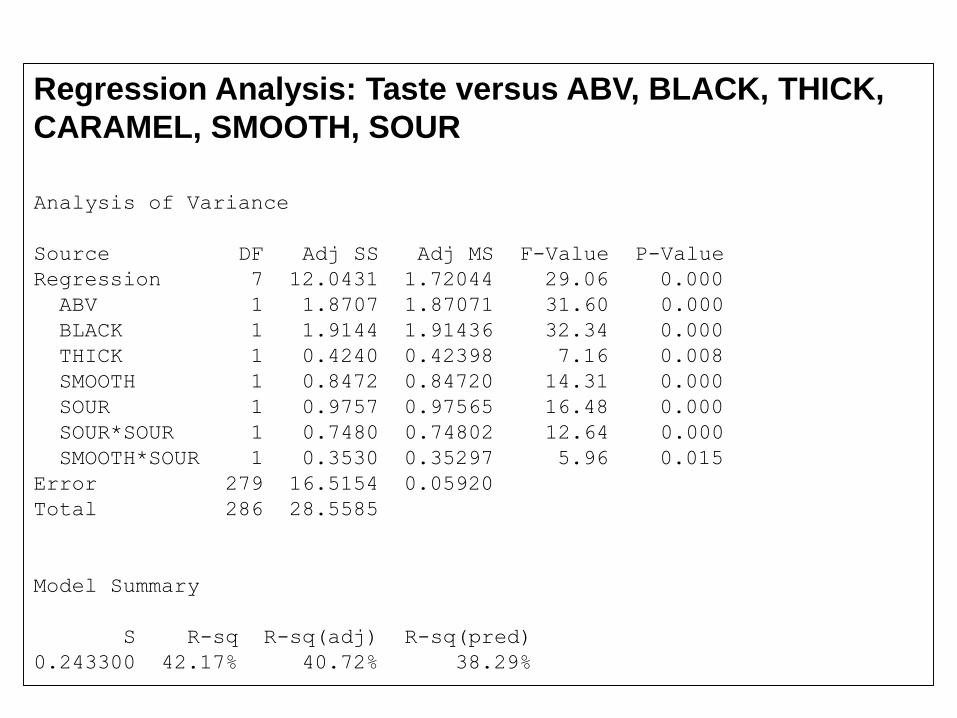
Regression Analysis: Taste versus ABV, BLACK, THICK,
CARAMEL, SMOOTH, SOUR
Analysis of Variance
Source DF Adj SS Adj MS F-Value P-Value
Regression 7 12.0431 1.72044 29.06 0.000
ABV 1 1.8707 1.87071 31.60 0.000
BLACK 1 1.9144 1.91436 32.34 0.000
THICK 1 0.4240 0.42398 7.16 0.008
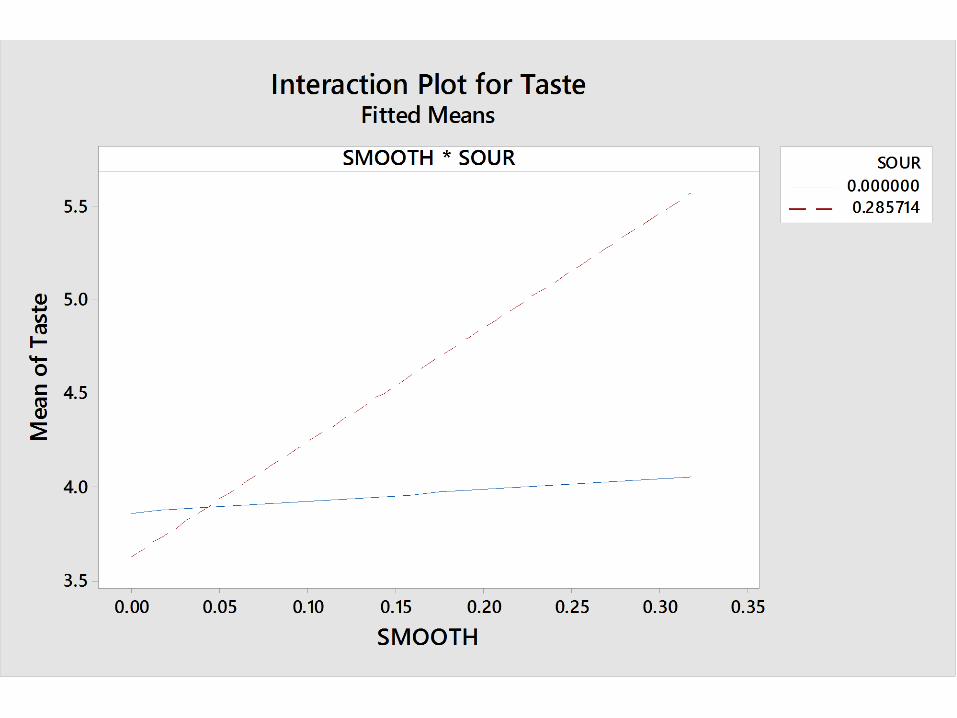
SMOOTH 1 0.8472 0.84720 14.31 0.000
SOUR 1 0.9757 0.97565 16.48 0.000
SOUR*SOUR 1 0.7480 0.74802 12.64 0.000
SMOOTH*SOUR 1 0.3530 0.35297 5.96 0.015
Error 279 16.5154 0.05920
Total 286 28.5585
Model Summary
S R-sq R-sq(adj) R-sq(pred)
0.243300 42.17% 40.72% 38.29%
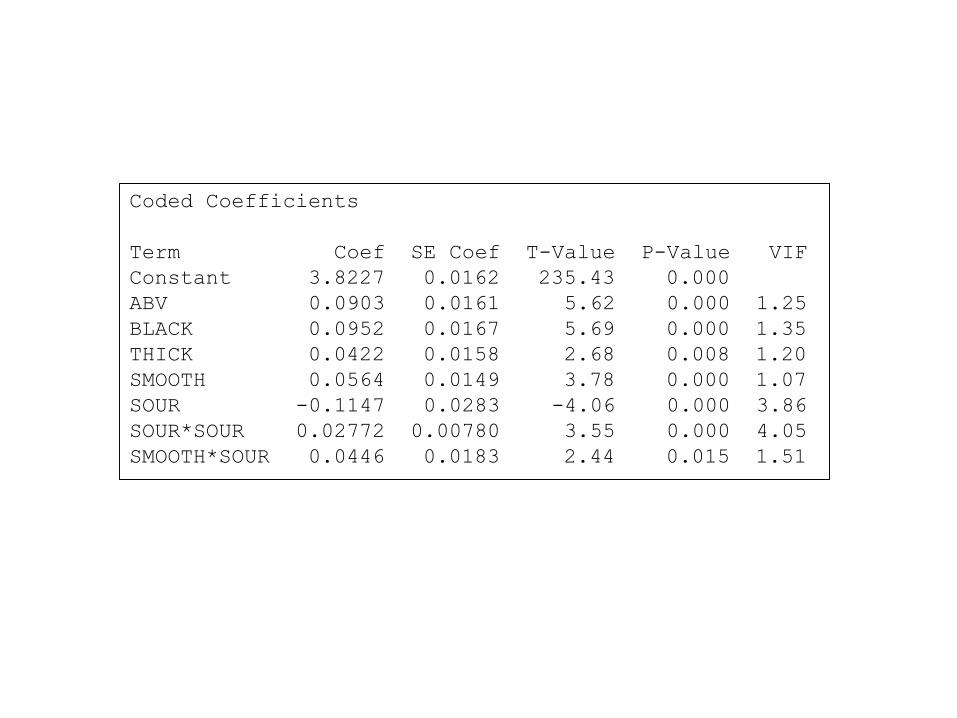
Coded Coefficients
Term Coef SE Coef T-Value P-Value VIF
Constant 3.8227 0.0162 235.43 0.000
ABV 0.0903 0.0161 5.62 0.000 1.25
BLACK 0.0952 0.0167 5.69 0.000 1.35
THICK 0.0422 0.0158 2.68 0.008 1.20
SMOOTH 0.0564 0.0149 3.78 0.000 1.07
SOUR -0.1147 0.0283 -4.06 0.000 3.86
SOUR*SOUR 0.02772 0.00780 3.55 0.000 4.05
SMOOTH*SOUR 0.0446 0.0183 2.44 0.015 1.51
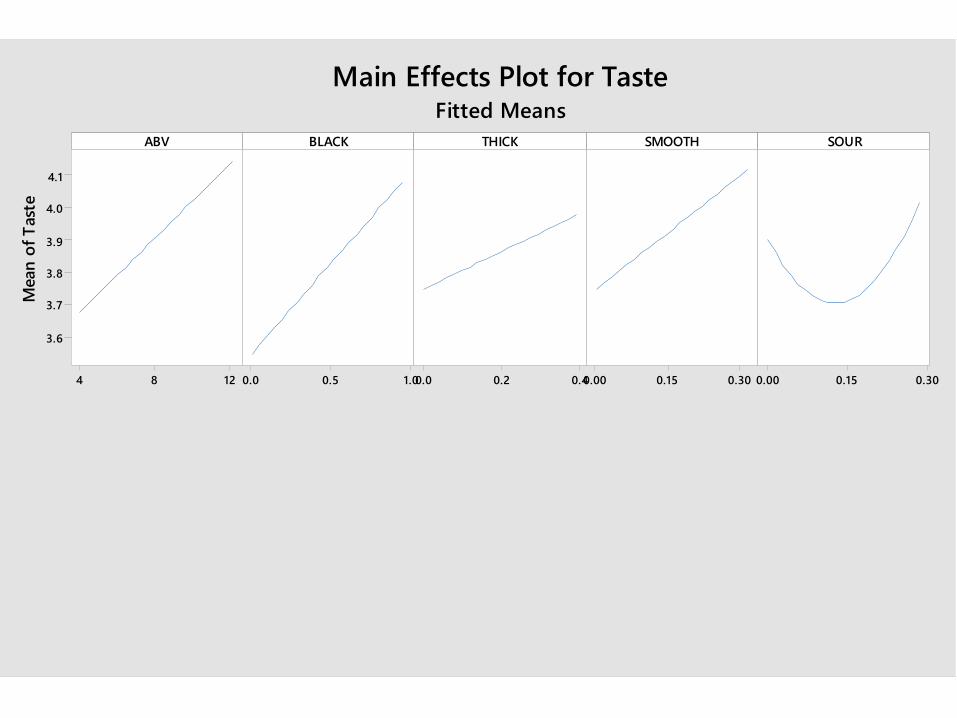
1284
4.1
4.0
3.9
3.8
3.7
3.6
1.00.50.0 0.40.20.0 0.300.150.00 0.300.150.00
ABV
Mean
of
Tast
e
BLACK THICK SMOOTH SOUR
Main Effects Plot for TasteFitted Means
12
8
4
0.300.150.00
1.00.50.0 0.300.150.00
1.0
0.5
0.00.4
0.2
0.0
0.30
0.15
0.00
1284
0.30
0.15
0.00
0.40.20.0
ABV
BLACK
THICK
SMOOTH
SOUR
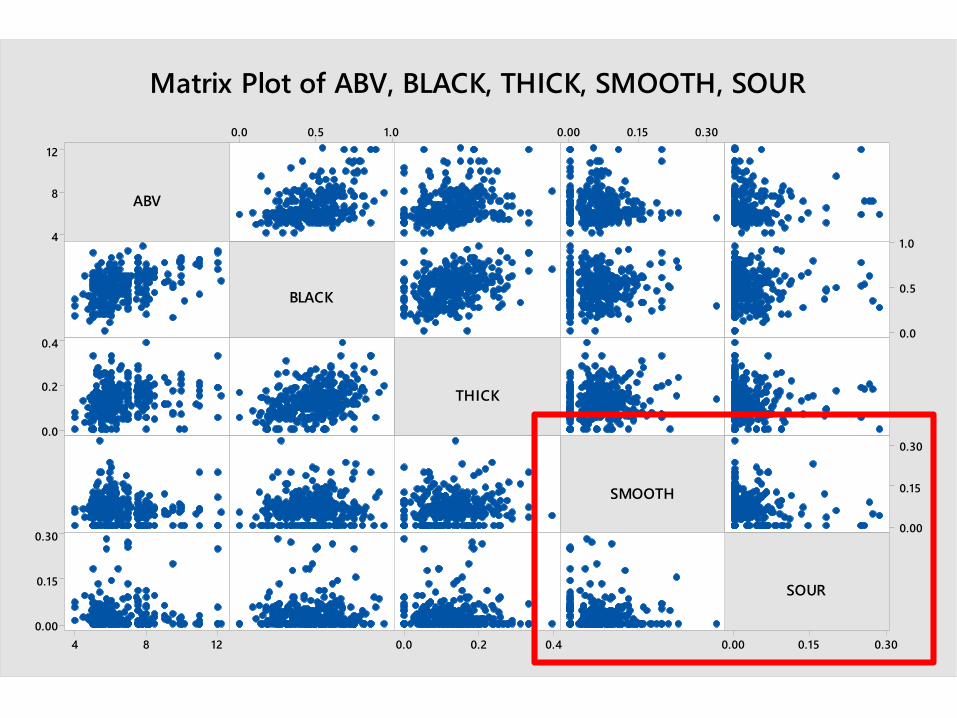
Matrix Plot of ABV, BLACK, THICK, SMOOTH, SOUR
12
8
4
0.300.150.00
1.00.50.0 0.300.150.00
1.0
0.5
0.00.4
0.2
0.0
0.30
0.15
0.00
1284
0.30
0.15
0.00
0.40.20.0
ABV
BLACK
THICK
SMOOTH
SOUR
Matrix Plot of ABV, BLACK, THICK, SMOOTH, SOUR
© 2013 Minitab, Inc.
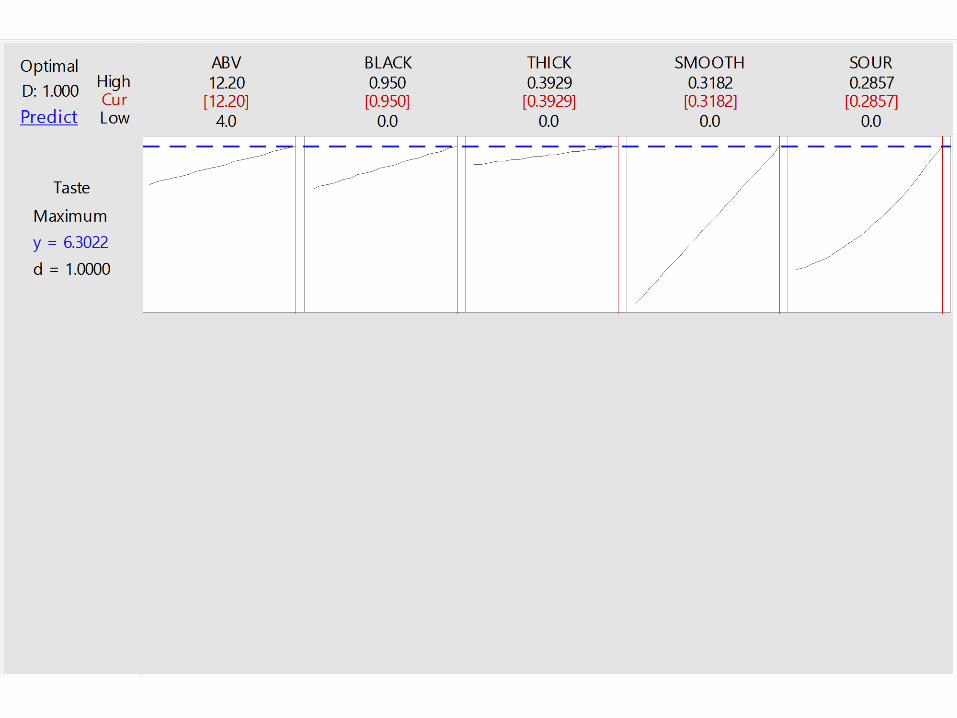
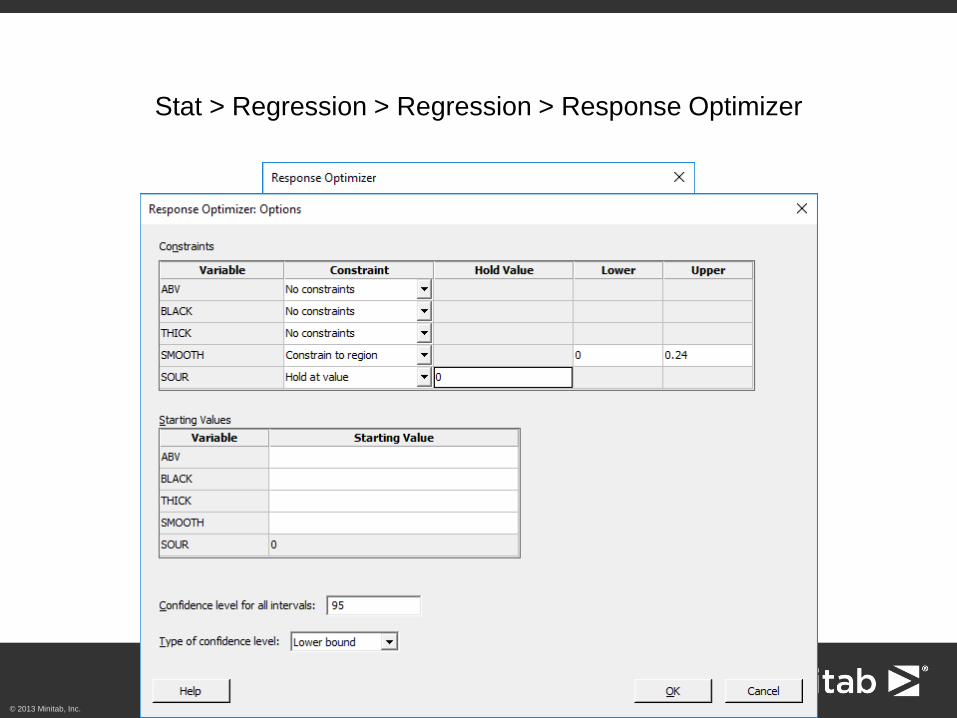
Stat > Regression > Regression > Response Optimizer
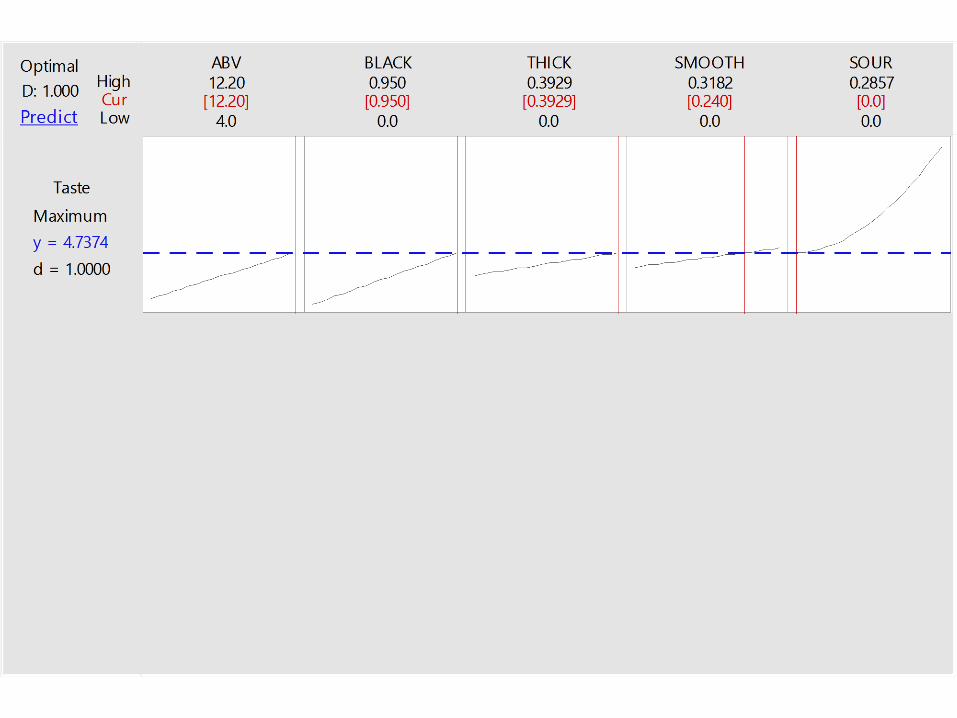
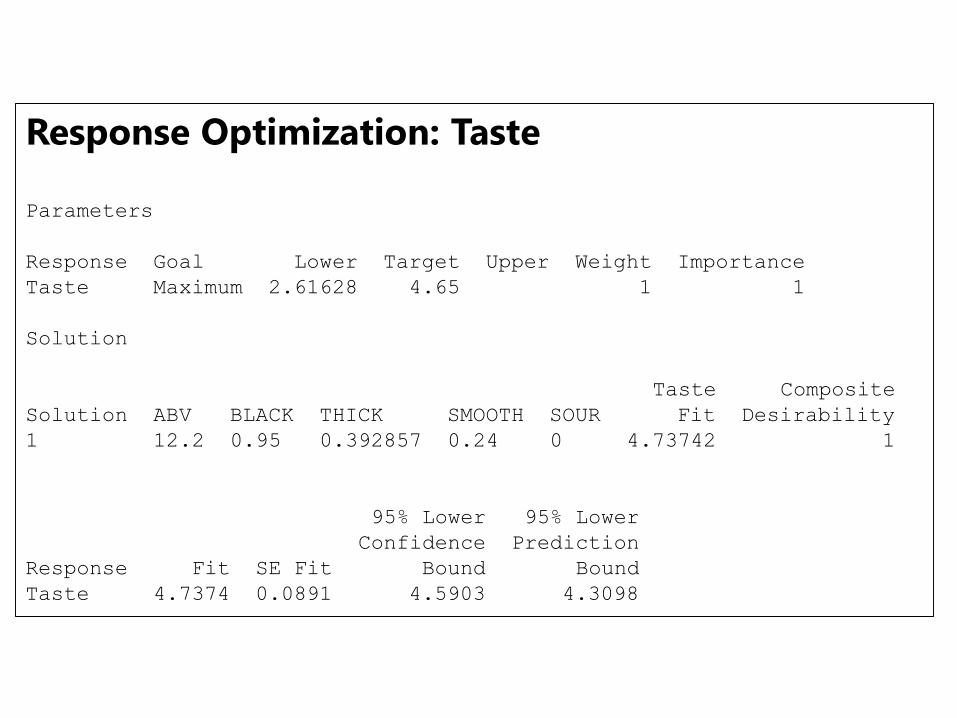
Response Optimization: Taste
Parameters
Response Goal Lower Target Upper Weight Importance
Taste Maximum 2.61628 4.65 1 1
Solution
Taste Composite
Solution ABV BLACK THICK SMOOTH SOUR Fit Desirability
1 12.2 0.95 0.392857 0.24 0 4.73742 1
95% Lower 95% Lower
Confidence Prediction
Response Fit SE Fit Bound Bound
Taste 4.7374 0.0891 4.5903 4.3098
So what does a great porter
taste like?
Image courtesy of deschutesbrewery.com
© 2013 Minitab, Inc.
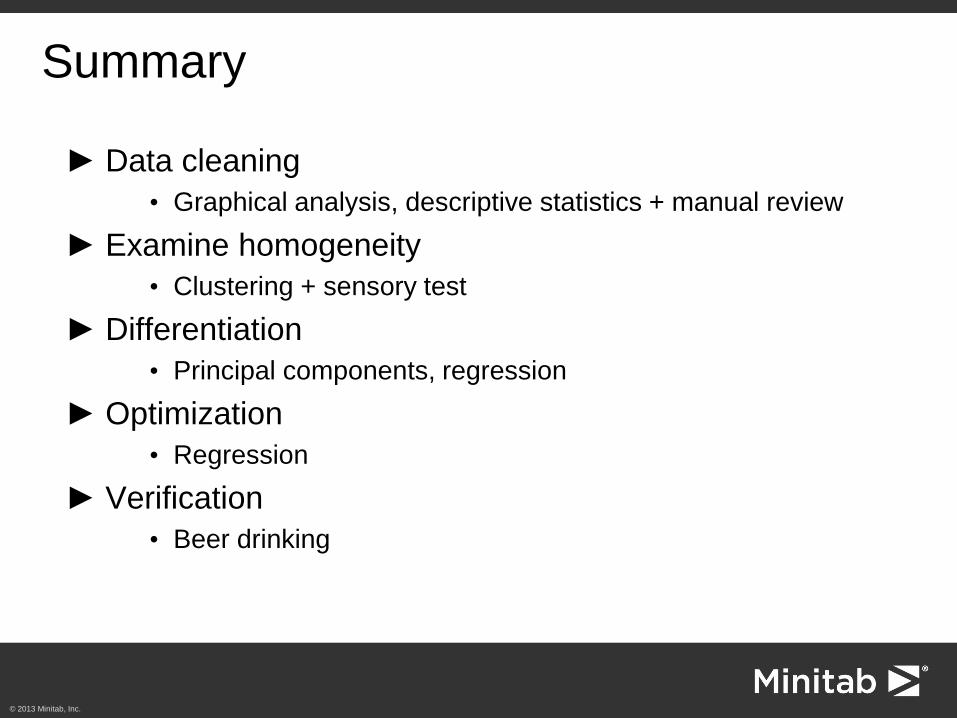
Summary
► Data cleaning
• Graphical analysis, descriptive statistics + manual review
► Examine homogeneity
• Clustering + sensory test
► Differentiation
• Principal components, regression
► Optimization
• Regression
► Verification
• Beer drinking
© 2013 Minitab, Inc.
From VOC to IPA:
This Beer’s For You!
Joel Smith
Statistician – Minitab Inc.