Embed Size (px)
Citation preview

Retrospective Theses and Dissertations Iowa State University Capstones, Theses andDissertations
1962
Functional development of epithelial tissue of thereticulo-rumen in calvesJohn David SuttonIowa State University
Follow this and additional works at: https://lib.dr.iastate.edu/rtd
Part of the Agriculture Commons, and the Animal Sciences Commons
This Dissertation is brought to you for free and open access by the Iowa State University Capstones, Theses and Dissertations at Iowa State UniversityDigital Repository. It has been accepted for inclusion in Retrospective Theses and Dissertations by an authorized administrator of Iowa State UniversityDigital Repository. For more information, please contact [email protected].
Recommended CitationSutton, John David, "Functional development of epithelial tissue of the reticulo-rumen in calves " (1962). Retrospective Theses andDissertations. 2078.https://lib.dr.iastate.edu/rtd/2078

This dissertation has been 62—4180 microfilmed exactly as received
SUTTON, John David, 1937-FUNCTIONAL DEVELOPMENT OF EPITHELIAL TISSUE OF THE RE TIC U LO-RUMEN IN CALVES.
Iowa State University of Science and Technology Ph.Et, 1962 Agriculture, animal culture
University Microfilms, Inc., Ann Arbor, Michigan

FUNCTIONAL DEVELOPMENT OF EPITHELIAL TISSUE
OF THE RETICULO-RUMEN IN CALVES
A Dissertation Submitted to the
Graduate Faculty In Partial Fulfillment of
The Requirements for the Degree of
DOCTOR OF PHILOSOPHY
Major Subject: Dairy Nutrition
by
John David Sutton
Approved:
In Charge 4jf Major Work
tment
Dean
Iowa State University Of Science and Technology
Ames, Iowa
1962
Signature was redacted for privacy.
Signature was redacted for privacy.
Signature was redacted for privacy.

il
TABLE OF CONTENTS
Page
INTRODUCTION .... 1
REVIEW OF LITERATURE ... 4
Structure of the Rumen 4 Absorption from the Rumen 10 Rumen Epithelial Metabolism 24
EXPERIMENTAL 28
Absorption 28 Metabolism 108
DISCUSSION 133
SUMMARY 165
LITERATURE CITED 168
ACKNOWLEDGEMENTS . 180
APPENDIX 182

1
INTRODUCTION
The mature ruminant is able to derive many of its nutri
ents from roughages because of the contribution made by the
extensive microbial population of the reticulo-rumen. The
roughages and other feed are fermented by the microorganisms.
The products of fermentation are either absorbed from the
forestomach or passed down to the gastrointestinal tract
where they may be further digested before being absorbed.
Volatile fatty acids (VFA), major end-products of fermenta
tion in the reticulo-rumen, are absorbed from the fore-
stomach and constitute an important source of energy for the
ruminant. However, at birth the reticulo-rumen is poorly
developed and contains no microorganisms. During the first
few weeks of life, when the microbial population is develop
ing, the young ruminant is dependent on milk or some similar,
easily digestible feed for its primary source of nutrients.
These feeds are digested in the ebomasum and intestine by
mechanisms similar to those of non-ruminants. Carbohydrates
are absorbed largely as monosaccharides rather than VFA.
The period during which milk is required by the calf is
much shorter than was previously believed. With careful man
agement and suitable concentrates at an early age, the period
of milk-feeding probably car. be reduced to -3 weeks. In view
of the high cost of milk or milk substitutes, this type of
management is important economically. It is also of great

2
academic interest.
The rapid development of the digestive ability Is a
reflection of many changes in the basic anatomy and physi
ology of the young ruminant. The forestomach Is the site of
the most obvious changes. Its capacity increases rapidly and
its walls develop the anatomical and histological character
istics of mature tissue. Closely associated with these struc
tural developments are the establishment of an extensive
microbial population in the first two compartments, a rise
in the level of VFA in both rumen contents and blood, and a
fall in blood glucose. Since so many changes are occurring
concurrently, it is Important to assess the interrelationships
among them. The establishment of a mature microbial popula
tion in the rumen is dependent upon the intake of solid feed.
The fermentation of the solid feed by the microorganisms pro
duces VFA which probably stimulate the histological develop
ment of the forestomach epithelium. The rise in the level of
VFA in the blood and the ability of the young ruminant to
derive its energy from solid feed only a few weeks after birth
indicate that the VFA can be absorbed from the forestomach and
metabolized at an early age.
Prior to the present studies, it was not known whether
the ability of the forestomach to absorb large quantities of
VFA is present from birth, nor whether a relationship exists
between the histological development and the absorptive
ability. A characteristic of tissue from the mature fore-

3
stomach is its ability to metabolize VFA, especially butyrate.
There is evidence that at birth this ability is only weakly
developed. Since it has been suggested that there may be a
relationship between the metabolic activity of the rumen wall
and its absorptive ability, there was basis for postulating
that absorption may be slow shortly after birth. Experiments
were undertaken, therefore, to determine whether in rumen
epithelium interrelationships exist among the histological
development, the ability to absorb VFA and the metabolic
activity of the tissue.
The objectives of the present studies were (a) to develop
techniques suitable for determining the ability of the retlc-
ulo-rumen in young calves to absorb VFA, (b) using these tech
niques, to investigate the effect of various factors on the
absorptive ability of the reticulo-rumen and (c) to determine
the effect of the diet of the calf on the ability of rumen
epithelium to metabolize VFA and glucose.

4
REVIEW OP LITERATURE
Structure of the Rumen
The stomach of the ruminant is very voluminous, occupy
ing approximately three-quarters of the abdominal cavity. It
is composed of the rumen, the reticulum, the omasum and the
abomasum or true stomach. The first two of these compart
ments, the rumen and reticulum, are continuous one with an
other dorsally and are separated ventrally by the retioulo-
ruminal fold (Sisson and Grossman, 1953, pp. 456-469). The
basic histology of the rumen, reticulum and omasum is quite
similar although the detailed structure of each compartment
differs (Trautmann and Fleblger, 1957, pp. 180-183). A
feature of the rumen is the presence over much of the surface
of many papillae. These papillae resemble superficially the
villi of the small intestine, but are considerably larger
(1 to 6 mm. long compared to 0.5 to 1.0 mm. for the villi).
They are formed from the mucosal layer only and so contain
no musculature. Dobson _et al. (1956) showed that the core of
the papillae (lamina propria) contains many blood and lymph
vessels which enter deeply into the epithelial layers in pro
cesses of the propria called papillary bodies. In these
papillary bodies the blood vessels are closely associated
with reticulin fibers and come into intimate contact with the
basal cells of the epithelium. While the epithelium is

5
several oells thick over most of the papilla, at the tips of
the papillary body it is reduced to three or four cells. The
structure of the papillary body and the thinness of the epi
thelium at its tips suggest that it may be important for
absorption.
The surface layer of the rumen consists of a stratified,
squamous, cornlfled epithelium. The structure of this epi
thelium has been compared to that of skin (Barcroft et al.,
1944b; Dobson et al., 1956; Hauser, 1929), but Henrlksson and
Habel (1961) considered that the differences between the two
tissues were so great that the comparison was of limited
value. The epithelium is divided into two main layers, the
stratum germinatlvum and the stratum corneum, separated by a
thin, discontinuous stratum granulesum (Barcroft et al..
1944b; Dobson et al., 1956; Henrlksson and Habel, 1961). The
germinatlvum consists of the stratum splnosum overlying a
basal layer of columnar cells. Dobson et al. (1956) stated
that the columnar cells contain many mitochondria lying
parallel to the length of the cell, but Llndhe' and Sperber
(1959) were unable to confirm this report as to the orienta
tion of the mitochondria. The stratum splnosum Is character
ized by the presence of many intercellular bridges (Dobson
et al.. 1956; Henrlksson and Habel, 1961; Lindhef and Sperber,
1959). Intercellular spaces are present In the splnosum and
granulosus (Dobson et al., 1956; Llndhe"and Sperber, 1959).
The stratum corneum consists of three main layers, a zone of

6
primarily swollen cells adjacent to the granulosum, a promi
nent band of squamous, keratinized cells and, at the surface,
a layer of secondarily swollen cells (Hauser, 1929). Not all
these layers are present in all cases and, perhaps as a conse
quence of this, the nomenclature is at present in a state of
some confusion.
The forestomach develops from gastric tissue (Lambert,
1948; Lewis, 1915; Pernkopf, 1931; Warner, 1958) and not from
the esophagus as previously thought (Sisson and Grossman,
1953, p. 456). Although the abomasum develops first, the
rumen soon becomes heavier than the abomasum in the fetus of
the lamb (Wallace, 1948) and of the calf (Becker et al., 1951).
The relative growth rate is reversed in late pregnancy so that
at birth the weight of the abomasum exceeds that of the rumen
(Godfrey, 1961a; Tamate et al., 1962a; Wallace, 1948; Wardrop
and Coombe, 1960). When young ruminants are given access to
solid feed as well as to milk, the tissue weight and capacity
of the forestomach develop rapidly, whereas the abomasum
changes little relative to body weight (Godfrey, 1961a; Kesler
et al'., 1951; Tamate, 1957; Tamate et al., 1962a; Wardrop and
Coombe, 1960). Stratification of the rumen epithelium begins
early in fetal life (45 days) in the bovine (Warner, 1958) and
by birth all the layers characterizing the mature epithelium
have formed but have not reached adult proportions (Tamate et
al., 1962b; Wardrop, 1961a). S a,all papillae are present at

7
birth, but there is no sign of papillary bodies. With the
Intake of solid feed the papillae increase in size and papil
lary bodies are apparent by 4 weeks (Tamate et al., 1962a,
1962b; Wardrop, 1961a). By the time the young ruminant is
about 2 months of age, the rumen epithelium has acquired the
principal adult characteristics, Including a thickening of the
corneum and the development of swollen cells, but there is some
disagreement in the reports by Henrlksson and Habel (1961),
Tamate et al. (1962b) and Wardrop (1961a) as to the develop
ment of the other strata.
It has long been realized that the anatomical and his
tological development of the rumen is retarded if the young
ruminant is not given access to solid feed. The extent of
this retardation le not yet clear. The work of Trautmann
(1932) with kids and of Wardrop (1961b) with lambs suggested
that the main anatomical and histological features develop on
diets of milk only, though at a slow rate. A preliminary
study by Blaxter jet al. (1952) with calves indicated that the
weight of the rumen tissue is unaffected by diet. However,
Brownlee (1956), Tamate et al. (1962a, 1962b) and Warner et
al. (1956) found there was very little rumen development in
calves fed only milk. Indeed, Tamate et al. (1962a) reported
a decrease in the size of the papillae between birth and 4
weeks. Harrison et al. (1960) found that when calves were
switched at 18 weeks of age from solid feed to an all milk

8
diet, papillae almost completely disappeared by 36 weeks of
age. This is especially strong evidence that milk does not
allow full rumen development. The stimulatory factor in solid
feed has been generally assumed to be its greater bulk com
pared to milk, but Warner et al. (1956) and Browniee (1956)
obtained extensive papillary development on diets of milk and
concentrate only. They concluded independently that absorb
able compounds or the energy content of the diet were more
important than bulk in Influencing mucosal development. Sub
sequent studies by Flatt et al. (1958), Sander et al. (1959)
and Tamate et al. (1962a) indicated that VFA, especially pro
pionate and butyrate, were stimulatory factors and that inert
bulk in the form of sponges gave rise to little papillary
development. Sander et, al. (1959) proposed that the effec
tiveness of VFA was related to the ability of the rumen epi
thelium to metabolize them. Studies by Henrlksson and Habel
(1961) and Tamate et al. (1962b) indicated that the histo
logical development resulting from VFA administration differed
little from that found when solid feed was ingested.
The finding that VFA, products of normal rumen fermenta
tion, stimulate development of the rumen moscosa may explain
the different degrees of stimulation found on milk diets.
Akssenowa (1932) and Trautmann and Schmitt (1933) reported
that small amounts of milk and partially digested abomasal
contents were frequently regurgitated into the rumen. Smith

9
(1960) reared calves on milk only; a considerable proportion
of the milk entered the rumen regularly In a few calves end
In these cases papillary development occurred. Smith's sug
gestion that this development resulted from fermentation of
the milk in the rumen is supported by the distinct but ab
normal papillary development found by Tamate et al. (1962a)
when milk was administered directly into the rumen of a
young calf. In view of the histological development of the
forestomach in pre-natal life (Wardrop, 1961a; Warner, 1958)
and the presence of papillae at birth (Tamate et al., 1962a;
Wardrop 1961a), it may be concluded that the basic features
of the rumen develop independently of nutritional factors.
The more detailed anatomical and histological features require
the presence of suitable stimulants from the environment.
The relationship of the histology of the rumen to ab
sorptive ability has been discussed In detail by few workers.
Colin (1873, pp. 98-99) and Ellenberger (1881) assumed the
presence of the squamous, stratified epithelium would largely
preclude absorption. However, Trautmann (1933) believed that
the keratinized layers would not be a barrier to absorption.
He further proposed that the discontinuity of the stratum
lucldum and stratum granulosus and the presence of the swollen
cells would greatly aid absorption. Barcroft et al. (1944b)
agreed with these conclusions and further emphasized the
Importance of the absence of sebaceous glands in the rumen as

10
compared to the skin. Dobson et, al. (1956) Illustrated the
great suitability of the papillary bodies for absorption and
remarked on the extensive blood supply and more limited lymph
vessels of the papillae. Henrlksson and Habel (1961) reported
the presence of paranuclear vacuoles in cells of the splnosum.
These vacuoles were not apparent at birth or in milk-fed
calves, but were especially numerous in the ventral portion
of the rumen wall when solid feed was included In the diet.
Henrlksson and Habel suggested from the occurrence of the
vacuoles that they may be related to absorption.
Absorption from the Rumen
Colin (1873, pp. 98-99) and Wllkens ( 1872) believed that
the rumen could not be an Important site of absorption due to
the nature of the epithelium. However, from the structure of
the papillae, VInk (1879) concluded that absorption could
occur from the rumen. Ellenberger (1881) concluded from In
vitro studies that absorption from the rumen and omasum was
very slow compared to that from the intestine and of little
significance. However, the tissues probably deteriorated
considerably under the experimental conditions and the re
sults are of doubtful value. Experiments by Gmeiner and his
group (1911) suggested that a variety of alcoholic liquids
such as rum, whiskey and warm beer were absorbed from the
rumen. Trautmann (1933) demonstrated that pilocarpine,

11
atropine and water were absorbed from all four stomach com
partments, though more slowly from the abomasum. These ex
periments gave no Indication that major nutrients might be
absorbed from the forestomach, although Trautmann (1933) and
Davey (1936) suggested from indirect evidence that it was
likely.
It had long been known that cellulose was fermented in
the rumen and that among the end-products were VFA. These VFA
were generally assumed to be waste products and Woodman (1930)
suggested that cellulose gave rise primarily to glucose which
was then used as the energy source.
In probably the first experiment proving the ability of
the forestomach to absorb nutrients, Aggazzotti (1910) found
that glucose could be absorbed from the omasum, but not from
the abomasum or reticulum, of anesthetized sheep. Rankin
(1942) reported rapid absorption of a dextrose solution from
the washed rumen and Schambye (1951) found that If glucose
were introduced In sufficient quantities into the normal rumen
contents, its appearance In portal blood could be demonstrated.
Woodman and Evans (1938) rejected Woodman's earlier
theory that glucose was a major end-product of rumen fermenta
tion, but did not venture an alternative. Phillipson and
McAnally (1942) demonstrated that glucose and other carbo
hydrates were rapidly fermented to VFA in the rumen. The VFA
were in high concentration and stable in rumen contents, yet
12
almost none were found in the abomasum. Philllpson and
MoAnally therefore proposed that VFA were absorbed from one
of the compartments of the forestomach. Proof of this theory
was furnished by the experiments of Barcroft et al. (1944a).
By measuring the arterlo-venous difference in the concentra
tion of VFA in the blood vessels of the digestive tract of
anesthetized sheep, they demonstrated absorption of VFA from
the rumen, reticulum, omasum and cecum, but not from the abo
masum or small intestine. The amount absorbed was calculated
to be sufficient to make a significant contribution to the
energy requirements of the animal. They also Introduced solu
tions of sodium acetate, propionate, or butyrate singly into
the 11gated, washed rumen and, using the same criterion as
before, concluded that the absorption rates were In the order
acetate > propionate > butyrate. Since this first demonstra
tion of VFA absorption from the rumen, numerous other in
vestigations using various techniques have been reported.
The details of the results have been disputed and are still
far from settled, but the basic conclusions that the VFA are
the principal end-products of digestion in the rumen and that
they can be absorbed readily by the forestomach are still
accepted.
Gray (1947, 1948) introduced mixtures of acetate and pro
pionate Into the washed rumen of conscious sheep and deter
mined absorption rates by measuring the change in concentra-

13
tion of each acid relative to a non-absorbable marker. He
concluded that the absorption of propionate was faster than
that of acetate. This disagreed with the results of Barcroft
et al. (1944a) but the answer appeared to lie in the results
obtained by further studies of the Cambridge group. Danlelll
et al. (1945), using the change in the concentration of VFA
in the rumen contents as the criterion of absorption, found
that the order of absorption of the three principal VFA was
as suggested by Barcroft et al. (1944a) when the rumen con
tents were alkaline (pH 7.5)• However from rumen contents
at a more acid reaction (pH 5.8) the higher homologues of the
VFA were absorbed faster. Kiddle et al. (1951) concluded that
the higher homologues of the VFA were not absorbed prefer
entially from rumen contents at an acid pH, but Gray et al.
(1951), Gray and Pilgrim (1951), Hungate et al. (1961),
Johnson (1951) and Pfander and Phillipson (1953) confirmed the
conclusions of Danlelll et al. (1945) and Gray (1947, 1948).
Although the specific absorption rate1 of acetate was slower
than that of the other VFA, its total absorption usually
exceeded that of the others since its rate of production was
greatest (Hungate et al., 1961; Johnson, 1951; Kiddle et al..
1951; Pfander and Phillipson, 1953). However, the work of
Gray et al. (1951) and Gray and Pilgrim (1951) indicated that
^-The absorption rate relative to the concentration in the rumen (Hungate et al., 1961),

14
on diets of wheaten hay or lucerne hay, the production of
propionate in the rumen exceeded that of acetate end their
belief as to the specific absorption rates of VFA was based
partially on these rates of production. Using radioactive
tracers, Gray et al. (1960) found that the rate of production
of VFA in the rumen of sheep fed chaffed wheaten hay was in
the order acetate > propionate > butyrate. This result does
not necessarily invalidate the belief that the specific ab
sorption rate of the higher homologues is greater (Hungate
et al., 1961).
Danlelll .et al. (1945) found that absorption was much
slower from alkaline rumen contents (pH 7.5) than from more
acid contents (pH 5.8). Although the pH of normal rumen con
tents rarely exceeds 7.0 (Phillipson, 1942), a number of
studies have been made at this pH. Gray (1948) could measure
no appreciable absorption at an alkaline pH and suggested that
the results of Danlelll _et al. ( 1945) were not outside the
range of experimental error. However, Masson and Phillipson
(1951) demonstrated conclusively that absorption could occur
from rumen contents at a pH greater than 7.0. More limited
results by Pfander and Phillipson (195-3) and Armstrong et al.
(1961) supported the contention of Danlelll .et al. ( 1945)
that absorption is reduced as the pH rises. Changes in the
rumen concentrations of the individual VFA measured by Masson
and Phillipson (1951) suggested that specific absorption rates

15
were In the order butyrate > propionate > acetate. Danlelll
et al. (1945) had concluded that the order of absorption at
alkaline pH was the reverse of this; measurements of blood
changes by Masson and Phillipson (1951) and of rumen changes
by Pfander and Phillipson (1953) and Armstrong et al. (1957)
tended to support this belief.
Considerable disagreement has been shown among the re
sults as to the specific rates of absorption of VFA. One
probable explanation of some of these differences was provided
by the work of Masson and Phillipson (1951). When they deter
mined absorption by measuring the disappearance of the VFA
from the rumen contents, they found butyrate to be absorbed
faster than the other two acids. However, in the blood of
the ruminai veins, the concentration of the VFA was in the
order acetate > propionate > butyrate. Since Kiddle et al.
(1951) concluded that lymph was not an important pathway of
VFA absorption, Masson and Phillipson (1951) proposed that
butyrate and perhaps propionate were metabolized by the rumen
epithelium. Kiddle et al. (1951) came to the same conclusion
from other, less strong evidence. Support for this theory
came from Pennington (1952) who showed In In vitro incubation
studies that rumen epithelium could metabolize the VFA in the
order butyrate > propionate > acetate. Thus the most valid
measurements of absorption rates would appear to be those
using disappearance of VFA from the rumen contents as their
main criterion. Annison et al. (1957) measured the change in

16
proportion of the individual VFA in the rumen contents, portal
blood and carotid blood simultaneously in conscious sheep in
the hope of providing more direct evidence of these proposals.
When absorption from normal rumen contents was studied,
butyrate was found in lower proportion in portal blood than
in rumen contents and ketone bodies were identified, support
ing the results by Phillipson and his group. When butyrate,
propionate and acetate were added separately to rumen contents
and the change In concentration of these acids in the rumen
followed, results suggested absorption was in the reverse
order to that proposed by Danlelll et al. (1945) and supported
by later workers. However, it appears that each study was
made only once, so the results are of limited significance.
Tsuda (1957a, 1957b) established a pouch from the dorsal
wall of the rumen of a goat and studied the absorption of
various compounds from it. His results in general confirmed
those obtained by other workers using the whole rumen. How
ever the value of the results from this technique must be
questioned, as considerable changes occurred In the epithelial
lining of the pouch. A similar problem caused Trautmann
(1933) to abandon the use of ruminai pouches for absorption
studies.
Another technique which has been tried to a very limited
degree is the use of the perfused rumen. The animal is killed
and the forestomach immediately Isolated and removed into a

17
water-bath, where it is perfused with oxygenated blood. Pro
duction and absorption of VFA are estimated by measuring
changes in their concentration in the rumen and perfusing
blood. McCarthy .et al. (1958) maintained blood flow rates
at 25 to 50 percent of normal, but Brown et al. (1960) could
only maintain flow at 5 to 10 percent of normal. Both groups
reported that the proportions of VFA accumulating in the
blood reflected their total production in the rumen and
neither group could consistently detect ketones in the
blood. However, in one set of trials, Brown et al. (1960)
added propionate and butyrate separateTy to the rumen con
tents. When propionate was added, its proportion in the per
fusing blood was greater than in the rumen. When butyrate
was added, It did not appear In relatively greater proportion
in the blood, but ketone production was detected. Thus under
these specific conditions, results similar to those obtained
In vivo were found• The usual criterion for accepting the
validity of results from perfusion studies is that they re
flect well-established results obtained in vivo. There is
sufficient unanimity among the in vivo results that: the re
sults of the perfusion trials should be regarded with some
caution.
If it be accepted that metabolism by rumen epithelium is
a real effect exerting a considerable influence on the pro
portions of VFA reaching the blood, there is a strong evidence

18
in the results with living ruminants, both conscious and
anesthetized, that the specific absorption rates of VFA from
acid rumen contents are in the order butyrate > propionate >
acetate. It further appears that, as the pH of the rumen
contents is raised, butyrate and perhaps propionate are
absorbed at a proportionally slower rate than acetate. From
results such as these, Danlelll et al. (1945) proposed that,
at an acid pH, VFA were absorbed in the form of the free acid
through lipoid membranes and that, when rumen contents were
more alkaline, VFA were absorbed primarily as the anion
through water-filled pores. More recent studies suggested
this theory may no longer be valid. There is strong evidence
(Pennington, 1952; Seto et al., 1955) that VFA are metabolized
by rumen epithelium in the order butyrate > propionate >
acetate. The theory of Danlelll et al. required that absorp
tion of VFA be by diffusion down a concentration gradient.
It is likely that the metabolism of VFA will affect the con
centration gradients and, since the rate of metabolism is
different for each acid, the concentration gradients will be
affected unequally. One cannot therefore assume, as did
Danlelll et al., that the different specific absorption rates
of the VFA reflect primarily the nature of the membrane sep
arating the rumen contents from the blood.
Even if the differential metabolism of the VFA does not
seriously affect the absorption rate, results of other experl-

19
mente cast doubt upon the applicability of the theory to
absorption at an alkaline pH. Danlelll et al. (1945) had
found that, at an alkaline pH, the specific absorption rate
of VFA Increased as the chain length decreased. Although
later work shows the absorption of butyrate to decrease more
than that of acetate as pH rises, Masson and Phillipson (1951)
found that the absorption rate of butyrate still exceeded that
of acetate at a pH of 7.0 to 7.5. Furthermore Dobson (1961,
p. 71) suggested that the results of Masson and Phillipson
(1951) and Dobson (1959) disproved the assumption of Danlelll
et al. that almost all the VFA was absorbed in the form of the
anion at this pH range. Masson and Phillipson (1951) reported
that for every two moles of VFA absorbed, one mole of bicar
bonate entered the rumen at a pH of 7.0 to 7.5. More precise
measurements by Dobson (1959) confirmed this and further
showed that every two moles of VFA absorbed were accompanied
by one mole of sodium. Dobson (1961, p. 71) suggested that
the increase In bicarbonate in the rumen reflects the con
version of carbon dioxide into bicarbonate with the accom
panying release of a hydrogen ion. This supply of hydrogen
ions allows the transformation of fatty acid anion into free
fatty acid, in which form it is absorbed. One half of the
VFA Is absorbed as the anion, accompanying the uptake of
sodium.
Of the factors other than the pH of the rumen contents

20
that affect the absorption of VFA little is known. The rumen
epithelium is permeable to a wide variety of compounds (Bar
croft et al., 1944b; Rankin, 1942; Trautmann, 1933; Tsuda,
1957b). Tsuda (1957b) found that the absorption of VFA from
a ruminai pouch continued until the concentration of VFA in
the pouch contents approximated that in the peripheral blood
and Masson and Phillipson (1951) and Ann!son et al. (1957)
noted that the absorption rate increased as the rumen concen
tration increased. These results suggest simple diffusion
Is the principal mechanism of absorption. Since the concen
tration of VFA in the rumen is normally several times greater
than that in the blood of the ruminai veins (Barcroft eit al.,
1944a; Masson and Phillipson, 1951), a suitable driving force
is present. If diffusion is the main process, absorption
rate should be closely related to the rate of blood flow
through the rumen wall, but no investigations into this effect
have been reported.
Few experiments have been designed to investigate the
possibility of active absorption of VFA. Dobson (1959) found
sodium to be actively absorbed against both concentration and
electrical gradients, but the degree of interdependence be-r
tween sodium and VFA in absorption is as yet undefined. A
few experiments have been conducted to investigate the effect
of metabolic inhibitors. Phillipson (1953-1954) reported,
without presenting experimental details, that absorption was

21
inhibited by fluoroacetate, but Tsuda (1957b) found no such
effect in rumen pouches. Neither worker found monolodoacetate
to affect absorption of VFA, although Seto et al. (1957) re
ported that it inhibited oxygen uptake by rumen epithelium
in vitro. Parthasarathy and Phillipson (1953) found mercuric
chloride inhibited the absorption of chloride and acetate,
but not of potassium or sodium. These few results do not
permit any definite conclusions. Absorption Is slower from
the rumen of a fasting than a feeding sheep (Pfander and
Phillipson, 1953). Armstrong et al. (1957) found that the
the addition to the rumen of butyrate and propionate, but
not acetate, increased the absorption rate in such conditions.
They proposed that this demonstrated the need for an actively
metabolizing epithelium to facilitate absorption since Pen
nington (1952) had shown that butyrate and propionate, but lit
tle acetate, were metabolized by rumen epithelium. However,
the slower absorption of acetate alone might also be related
to the very high levels of VFA with accompanying acidosis in
the peripheral blood reported by Armstrong et al. (1957).
None of the data reported require that absorption of VFA be
by any process other than diffusion, although there are sug
gestions that active transport mechanisms or an actively
metabolizing epithelium may be Involved at least Indirectly.
Almost all the studies of the absorptive properties of
the rumen have been conducted with adult ruminants with a

22
fully developed rumen. The most critical study of VFA
absorption from young ruminants was reported briefly by Flatt
et al. (1956). Calves were reared on various diets, though
results were reported as a mean for all diets. Absorption was
measured in calves with fiotulated rumens at from 3 to 15
weeks of age by introducing Into, the emptied rumens equimolar
solutions of acetate, propionate and butyrate and measuring
the loss of VFA in 1 hour. The mean absorption rates were
of the same order as those found by other workers for adult
sheep and the individual acids were absorbed in the order
butyrate > propionate > acetate. Similar results were ob
tained with laparotomlzed calves. Conrad et al. (1956)
measured the VFA concentration of the contents of the
reticulo-rumen and abomasum of calves reared on high rough
age diets and sacrificed when from 5 to 15 weeks of age. In
all cases they found a high concentration in the reticulo-
rumen and almost no VFA in the abomasum, strongly suggesting
VFA were absorbed from the forestomach. Conrad et, al. (1958b)
sought to define this observation more closely using calves
ranging in age from 4 to 7 months that were also reared on
high roughage diets. They determined the VFA concentration
In the gastrosplenic vein at periods during feeding and, from
blood flow measurements made In anesthlzed calves, estimated
that there was a considerable uptake of VFA from the rumen of
these calves. These two experiments (Conrad et al., 1956,

23
1958b) strongly suggested that young calves absorb significant
amounts of VFA from the forestomach when fed suitable diets.
However, since the gastrosplenic vein drains the spleen and
abomasum as well as the forestomach, the work did not com
pletely define the source of the VFA found in the gastro-
splenic blood.
Various other studies provide indirect evidence that VFA
are absorbed from the forestomach of ruminants from an early
age. Rumen VFA concentrations are very low at birth and
change little on a diet of milk only (Conrad et al., 1954;
Godfrey, 1961b; Wardrop and Coombe, 1961). When solid feed
is included in the diet, the VFA level of the rumen contents
increases to adult levels within 2 or 3 months (Conrad _et al.,
1954; Godfrey, 1961b; McCarthy and Kesler, 1956; Wardrop and
Coombe, 1961). An almost parallel rise in blood VFA concen
trations on solid diets (Conrad et al., 1958a; McCarthy and
Kesler, 1956; Held, 195-3) indicates that absorption takes
place. However, Conrad et al. ( 1958a) and McCarthy and Kesler
(1956) suggested from indirect evidence that the absorptive
ability of the rumen in the first two months may not be so
great as in the adult. Martin et al. (1959) reared calves
on purified diets, one containing chopped hay and the other
salts of acetate, propionate and butyrate. The VFA concen
tration of peripheral blood rose after feeding at all ages
from 3 to 12 weeks of age. The rise was greatest on the

24
diet containing salts of the VFA and the authors concluded
that this was reasonable evidence that VFA could be absorbed
from the rumen of calves as young as 3 weeks of age, although
the experiment did not exclude the possibility of absorption
from other areas of the tract.
Rumen Epithelial Metabolism
The suggestion by Phillipson and his co-workers (Kiddle
et al.. 1951; Masson and Phillipson, 1951) that certain appar
ent anomalies in their absorption studies might be explained
by metabolism of butyrate and perhaps propionate by rumen
epithelium led to the extensive investigations of Pennington
and later to those of Seto and his group in Japan. Pennington
(1952) and Seto .et al. (1955) showed that rumen epithelium
incubated in vitro metabolized VFA in the order butyrate >
propionate > acetate. Of several other tissues studied, only
epithelium from the reticulum and omasum, and liver tissue
had a similar affinity for butyrate. Butyrate, when metabol
ized preferentially by a tissue, was strongly ketogenic. Pen
nington (1954) showed that propionate uptake was markedly
enhanced by the presence of carbon dioxide in the atmosphere.
The explanation of the stimulatory effect of carbon dioxide
was furnished by Pennington and Sutherland (1956b). Pro
pionate apparently fixes carbon dioxide to form succinate;
by this means it can enter the tricarboxylic acid cycle and

25
so be metabolized. The tricarboxylic acid cycle is active in
rumen epithelium (Pennington, 1954; Pennington and Sutherland,
1956a; Seto and Umezu, 1959), but its significance is still
not clear. The addition of compounds known to inhibit the
tricarboxylic acid cycle has little effect on acetate or
butyrate uptake by epithelium (Seto et al., 1957). The re
sults of Pennington and Sutherland (1956b) strongly suggested
that propionate metabolism proceeds via the tricarboxylic acid
cycle. Since propionate suppressed ketone production from
acetate and butyrate (Pennington and Pfander, 195?; Seto et
al.. 1955, 1956) one would expect intermediates of this cycle
to be anti-ketogenie also, yet the opposite has been demon
strated (Pennington and Sutherland, 1956a; Seto et al., 1955).
It is still not clear whether the answer to the problem lies
in the observation by Seto et al. (1956) that succinate re
duced ketone production by butyrate when ATP was added to the
medium.
The results of these studies are in close agreement with
the theory of epithelial metabolism proposed by Masson and
Phillipson (1951) from quite different experiments. This is
strong evidence that the various reactions found in these
in vitro studies also occur to some degree in vivo.. Penning
ton (1952) showed that when butyrate or acetate, but not
propionate, was placed in the rumen of anesthetized sheep,
ketone bodies appeared in the venous blood of the rumen.
26
Annlson et al. (1957) noted a sharp rise in ketone bodies in
the portal blood when butyrate was added to the rumen. The
failure to find ketone production in studies with perfused
rumens (Brown et al., 1960; McCarthy et al., 1958) has already
been discussed. Propionate was metabolized in considerable
quantities when incubated alone with rumen epithelium (Pen
nington, 1952; Seto et al., 1955), but when acetate, pro
pionate and butyrate in equimolar proportions were Incubated
with epithelium, complex interrelationships among the three
VFA were found and the only acid to be significantly metabo
lized was butyrate (Pennington and Pfander, 1957). It is
thus clear that considerable caution is necessary before
applying the in vitro results to the living animal.
The only attempt to investigate metabolism by rumen epi
thelium of young calves is that by Knox et al. (1960). This
work was reported in more detail by Knox (i960). The metab
olism rate was determined by measuring the oxygen uptake by
epithelium from calves at 1 to 2 days and 3 to 5 weeks of
age and from mature steers. The new-born calves received
only colostrum; the older calves were fed hay and grain as
well as milk and their rumens showed marked papillary devel
opment. The tissues were incubated with VFA, singly and in
various combinations, and in glucose. Neither acetate nor
propionate stimulated much oxygen uptake by tissues from any
age group. The experiments with propionate are probably of

27
little value since propionate uptake is low unless carbon
dioxide is present (Pennington, 1952, 1954). Glucose alone
and butyrate both alone and with other VFA led to a marked
increase in oxygen uptake. This Increase was generally
greatest for the 3- to 5-week-old calves and least for the
new-born calves. Since the ability to metabolize butyrate
preferentially characterizes the tissue of the ruminant fore-
stomach (Pennington, 1952; Seto et al., 1955), these results
suggest that at birth young ruminants do not possess the
ability markedly, but it develops rapidly when calves receive
solid feed.

28
EXPERIMENTAL
Absorption
Development of animal techniques
No work on the absorption of VFA from the rumen had been
conducted at Iowa State University prior to the commencement
of this investigation. Early studies were therefore directed
toward evolving suitable techniques both with animals and in
the laboratory.
The technique of Huber et, al. (1961) for studying glucose
absorption provided the basis for the first studies. Three
calves were used in this group of trials. Calves 4743 and
4766 were reared on diets including concentrates and hay and
were aged between 10 and 25 weeks over the period of the
trials• The rumen of these calves can therefore be assumed
to have developed the major characteristics of the mature
rumen. Calf 4795 was reared on milk only and was aged between
2 and 7 weeks during the trials. No appreciable rumen devel
opment is likely to have occurred in this calf.
Twelve hours prior to treatment, all feed except water
was withdrawn from the calves. The treatment consisted of
the introduction of solutions of the sodium salts of VFA into
the rumen by means of a stomach tube. The sodium salts of
the VFA were dissolved 1:10 (w/v) in water. The pH of the
solution was adjusted to 6.6 with hydrochloric acid and the

29
temperature brought to 39° C. The solution was introduced at
a level of between 1 and 2 g. of the salt per kilogram body
weight of the calf, except in one trial when a level of
0.2 g./kg. was used. Samples of jugular blood were ta/ven
immediately prior to the introduction of the solution and at
various periods thereafter. It was hoped that the degree of
absorption of VFA from the rumen would be reflected by a pro
portional rise in the level of peripheral blood VFA. The
blood was obtained by use of a heparinized syringe; about 25
ml. were collected in a test tube containing 5 mg. of heparin.
The samples were stored in a refrigerator and later were
analyzed for VFA and glucose.
Summaries of the trials and results are given in Table 1
and complete data are tabulated in the Appendix, Table 27.
Representative results are illustrated in Figures 1 and 2.
In the fully ruminating calves, a rapid and often consider
able increase in the VFA of the jugular blood was found, the
peek being 5 minutes after administration of the test solution
for sodium propionate and sodium butyrate and 10 minutes for
sodium acetate. There followed a rather less rapid fall to
levels close to those prior to administration within 1 hour
in wo s t trials. When absorption in the milk-fed calf (4795)
was studied, results were very variable. Relative to the
response in fully ruminating calves, the maximum rise in blood
VFA levels was greater when the salts were administered at
2 g./kg. and less when administered at 1 g./kg. At both
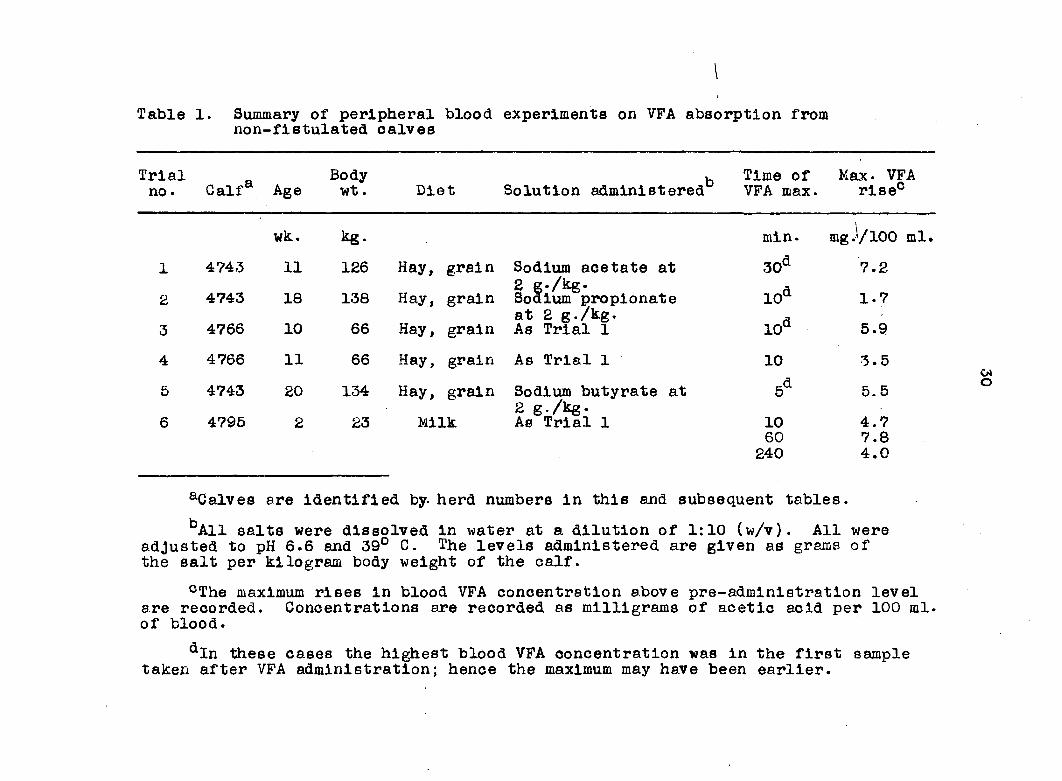
Table 1. Summary of peripheral blood experiments on VFA absorption from non-f1stulated calves
Trial no. Calf* Age
Body wt. Diet Solution administered^
Time of VFA max.
Max. VFA rise0
wk. kg- mln. mg J/100 ml. 1 4743 11 126 Hay, grain Sodium acetate at 30d 7.2 Hay, grain
2 g./kg. A 2 4743 18 138 Hay, grain Sodium propionate 10û 1.7
at 2 g./kg. a 3 4766 10 66 Hay, grain As Trial 1 10a 5.9
4 4766 11 66 Hay, grain As Trial 1 10 3.5
5 4743 20 134 Hay, grain Sodium butyrate at 5d 5.5 grain 2 g./kg.
6 4795 2 23 Milk As Trial 1 10 4.7 60 7.8 240 4.0
aCalves are Identified by. herd numbers in this and subsequent tables.
^All salts were dissolved in water at a dilution of 1:10 (w/v). All were adjusted to pH 6.6 and 39° C. The levels administered are given as grams of the salt per kilogram body weight of the calf.
°The maximum rises in blood VFA concentration above pre-admlnistratlon level are recorded. Concentrations are recorded as milligrams of acetic acid per 100 ml. of blood.
aIn these cases the highest blood VFA concentration was In the first sample taken after VFA administration; hence the maximum may have been earlier.

Table 1. (Continued)
Trial no • Calf Age
Body wt. Diet Solution administered
Time of VFA max.
Max. VFA rise
wk. kg. mln. mg./100 ml.
7 4795 4 25 Milk Sodium acetate at None
132 0.2 g./kg.
8 4743 21 132 Hay, grain Sodium acetate at 10 6.1 Hay, grain 1 g./kg. A
9 4743 22 140 Hay, grain Sodium propionate 5 4.3 Hay, grain at 1.17 g./kg. a
10 4743 25 148 Hay, grain Sodium butyrate at 5a 1.8 Hay, grain 1.34 g./kg.
11 4795 7 27 Milk Aa Trial 8 15 0.6 60 0.9
O)

Figure 1. Changes in VFA of jugular blood of calf 4743 following intraruminal administration of sodium acetate, propionate and butyrate at 1.00, 1.17 and 1.34 g./kg. body weight, respectively (blood VFA are expressed as acetic acid)

8.0 r
O 0
1
cJ
B O
2 >
O
3 UJ CD Z < X o
PROPIONATE
BUTYRATE
OJ Oa
-2.0 —1 0 5 10 15 30 60
MINUTES AFTER VFA ADMINISTRATION
120

Figure 2. Changes in VFA of Jugular blood of oalf 4795 following intraruminal administration of sodium acetate at 0.2, 1.0 and 2.0 g./kg. body weight (blood VFA are expressed as acetic acid)

8.0
S
O o
6.0
O Z o o
2.0 G/KG
4.0
5 >
Q O
3 2.0
1.0 G/KG CD
Z 0.2 G/KG
UJ O
< X O
-2 .0 120 60 30 0 5 10 15
MINUTES AFTER VFA ADMINISTRATION

36
levels of administration, the rise in VFA concentration in the
blood was more prolonged than in the ruminating calves and
there was evidence of more than one peak. Whether these
effects were due primarily to the age or to the diet differ
ence is not known. When only 0.2 g. of sodium acetate per
kilogram was administered, no effect on peripheral blood was
detected.
The glucose concentration of jugular blood was measured
in all trials and results are given in the Appendix, Table 27.
The only salt which consistently affected blood glucose was
sodium butyrate. In both trials when butyrate was adminis
tered, a very considerable fall in blood glucose occurred.
The results of these trials were very difficult to inter
pret and shed little light on rates of absorption. The blood
VFA changes did not clearly reflect the three different levels
of VFA administered Into the rumen. The two higher levels
administered probably resulted in rumen VFA concentrations
considerably higher than those expected normally, but when a
level likely to result In a more normal rumen concentration
was administered (0.2 g./kg. body weight) there was no sig
nificant effect on blood VFA. Furthermore the very rapid
attainment of peak levels of VFA in the blood and their
transient nature made both their determination inaccurate and
their interpretation uncertain.
One major failing of the first technique was the

37
inability to define conditions within the rumen. A 10-day-old
male HolsteIn calf (4799) was therefore fitted with a small
rumen fistula, so allowing direct access into the rumen. The
fistula, which was about 1 inch in diameter, was established
by means of a two-stage operation performed at the Iowa State
University Veterinary Clinic. The fistula was fitted with a
rubber cannula^ kept in position with a steel disc of 3-inch
diameter (Figures 3-5).
The calf was reared on whole milk until 8 weeks of age
when it was given access to alfalfa pellets and calf starter^
ad libitum. It was kept on metal screens to prevent consump
tion of bedding. A summary of the treatments and results is
given in Table 2; detailed results are presented in the
Appendix, Tables 28 and 29. Since the purpose of using this
animal was to develop techniques suitable for later use, no
pre-determined pattern of experiments was followed, each trial
or set of trials being determined by the results of the work
immediately preceding.
The procedures developed for measuring absorption in
volved emptying the rumen by aspiration with a vacuum pump.
^The cannula was obtained from South Australian Rubber Mills, Adelaide, South Australia.
^The starter was a regular mix fed at the University Dairy Farm. Its composition was: corn, 40^, oats, 27$; soybean meal, 20%) blackstrap molasses, 10%; iodized salt, 1%\ dicalcium phosphate, 2%\ trace mineral mix, 68g./l00 lbs.

Figure 3. Components of the saliva apparatus, rumen cannula, and cannula plug
Top: modified urethral catheter Upper center: cannula plug; A, water injection; B, saliva collection; C, sampling tube; D, pH control
Lower center (left to right): plastic nose disc ; steel disc; cannula
Bottom: 6-inch scale
Figure 4. Saliva apparatus, cannula and cannula plug assembled

39

Figure 5. Cannula and plug in situ during experiment
Figure 6. Calf in digestion stall during experiment; gravity flow vacuum system on right side of stall

41
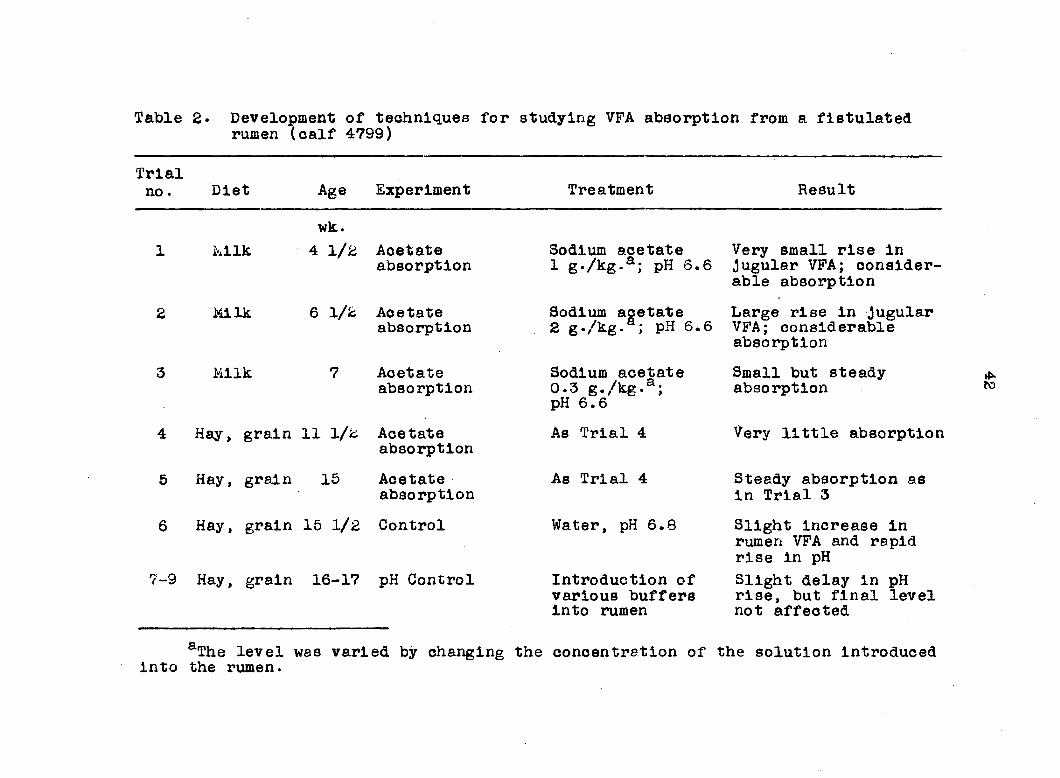
Table 2* Development of techniques for studying VFA absorption from a fietulated rumen (calf 4799)
Trial no. Diet Age Experiment Treatment Result
wk.
Mlk 4 1/2 Acetate absorption
Milk 6 1/2 Acetate absorption
Milk 7 Acetate absorption
4 Hay, grain 11 1/2 Acetate absorption
5 Hay, grain 15 Acetate absorption
6 Hay, grain 15 1/2 Control
7-9 Hay, grain 16-17 pH Control
Sodium acetate Very small rise in 1 g./kg.a; pH 6.6 jugular VFA; consider
able absorption
Sodium acetate Large rise in Jugular 2 g./kg- ; pH 6.6 VFA; considerable
absorption
Sodium acetate 0.3 g./kg.a; pH 6.6
As Trial 4
As Trial 4
Water, pH 6.8
Introduction of various buffers into rumen
Small but steady absorption
Very little absorption
Steady absorption as in Trial 3
Slight Increase in rumen VFA and rapid rise in pH
Slight delay in pH rise, but final level not affected
aThe level was varied by changing the concentration of the solution introduced into the rumen.

Table £• (Continued)
Trial no. Diet Age Experiment Treatment Result
10-12 Hay, grain 18-19 pH Control
13 Hay, grain 20 pH Control
14 Hay, grain 21
15 Hay, grain 23
16 Hay, grain 24
17 Hay, grain 25
pH Control
Effect of pH control measures on acetate absorption
Effect of pH control measures on acetate absorption
Effect of pH control measures on acetate absorption
Exclusion of saliva from rumen by use of catheter; acetate in Krebs-Ringer-phosphate
As Trials 10-12, but COp bubbled through rumen
Exclusion of saliva from rumen; addition of 10 N H3P04
Acetic acid in Krebs-Rlnger-phosphate; saliva excluded
As Trial 11, but rumen pH at 6.6 + 0.2 with 10 K H;5P04
Acetic acid in Krebs-Ringer-phosphate; no pH control
Rapid pH rise to about 7.4, then very slow rise to 8.0
Improved control, but only by very high rates of COg introduction
Complete control of rumen pH at 6.6 + 0.2
Rapid absorption of VFA; pH rose to 7.0 only
VFA absorption much as Trial 11; pH control successful
VFA absorption about half of previous trials; pH rose to 7.9 by 2 hours

44
A rigid, plexiglass tube was connected to a large suction flask
by a flexible Tygon tube. The plexiglass tube was 0.8 Inch in
diameter and of such length that all sections of the rumen and
reticulum could be reached when the tube was passed through
the rumen fistula. The walls of the tube were perforated
with small holes near the end. This reduced the possibility
that the wall of the rumen would be drawn against the end of
the tube by suction.
After the rumen was emptied of its normal contents, It
was rinsed with warm water and the sodium acetate solution
introduced. The amount and pH of the sodium acetate admin
istered closely followed those in the trials with non-
fistulated calves, although the salt was prepared at a lower
concentration, since it was introduced into an emptied rumen.
Polyethylene glycol (PEG) (mean mol. wt. 4,000, range 1,500-
6,000) was dissolved in the test solution as a non-absorbable
marker. Considerable work in Sweden (Sperber et al., 1953;
Hyden, 1955b) showed that PEG was not absorbed from or
destroyed In the digestive tract of several animals, includ
ing ruminants. Any decrease in VFA concentration relative to
a change in PEG concentration over the same period was assumed
to be a reflection of the absorption of the VFA. Rumen and
jugular blood samples were taken at intervals. The rumen
samples were aspirated into a 50 ml. beaker and the pH read
promptly. The samples were stored in a refrigerator for
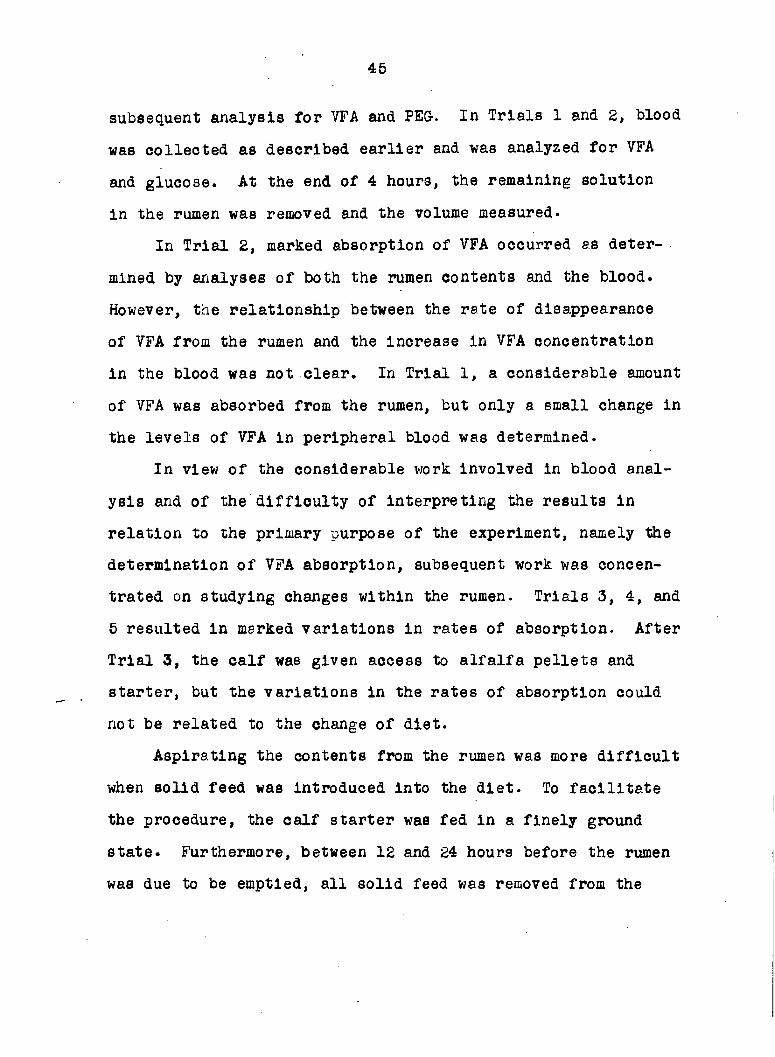
45
subsequent analysis for VFA and PEG-. In Trials 1 and 2, blood
was collected as described earlier and was analyzed for VFA
and glucose. At the end of 4 hours, the remaining solution
in the rumen was removed and the volume measured.
In Trial 2, marked absorption of VFA occurred as deter
mined by analyses of both the rumen contents and the blood.
However, the relationship between the rate of disappearance
of VFA from the rumen and the increase In VFA concentration
in the blood was not clear. In Trial 1, a considerable amount
of VFA was absorbed from the rumen, but only a small change in
the levels of VFA in peripheral blood was determined.
In view of the considerable work Involved in blood anal
ysis and of the difficulty of interpreting the results In
relation to the primary purpose of the experiment, namely the
determination of VFA absorption, subsequent work was concen
trated on studying changes within the rumen. Trials 3, 4, and
5 resulted in marked variations in rates of absorption. After
Trial 3, the calf was given access to alfalfa pellets and
starter, but the variations in the rates of absorption could
not be related to the change of diet.
Aspirating the contents from the rumen was more difficult
when solid feed was introduced into the diet. To facilitate
the procedure, the calf starter was fed in a finely ground
state. Furthermore, between 12 and 24 hours before the rumen
was due to be emptied, all solid feed was removed from the

46
calf; the rumen contents then became more liquid. By these
means, the rumen could be emptied without great difficulty.
Considerable rinsing of the rumen was required to remove all
feed particles. Most contents were removed 3 or 4 hours
before the trial and the rumen, after being rinsed, was filled
with warm saline. The calf was then left until the time for
the experiment. The rumen was again emptied and rinsed, and
the test solution was introduced. At the end of the trial,
after removal of the test solution, about 1 liter of rumen
contents was obtained from a steer fed hay end concentrates.
The contents were squeezed through cheesecloth end the result
ing fluid added to the empty rumen to assist re-establishment
of normal rumen function.
The pH of the rumer. samples was recorded. In all cases,
including Trial 6 in which water adjusted to pH 6.6 with
sodium hydroxide was introduced, a rise in pH occurred
(Appendix, Table 28). This rise was small in Trials 1 to 4,
a pH of about 7.5 being attained after 4 hours ; in subsequent
trials the rise was much more rapid and plateaued at 7.8 to
8.0 within 30 minutes. The slower rise of the pH in the
earlier trials was probably related to the fact that the calf
was very young and receiving no solid feed.
Since the reaction of the rumen contents has been shown
consistently to effect rates of absorption of VFA, trials
were initiated to attempt to control pH. Details of the
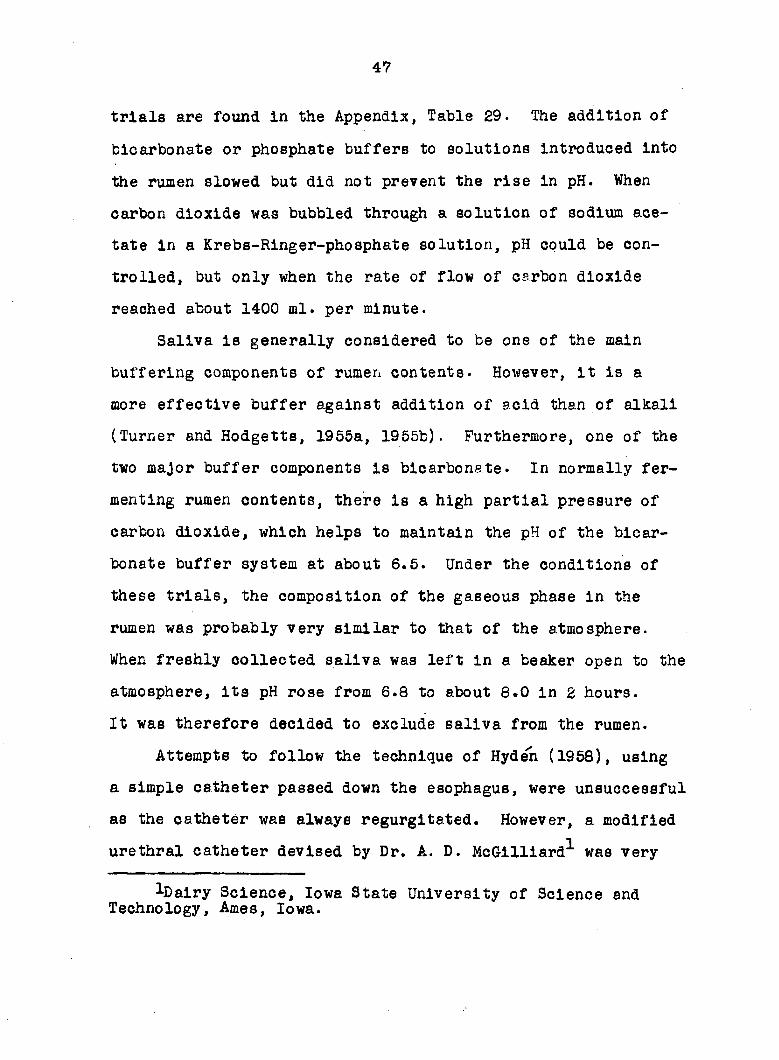
47
trials are found In the Appendix, Table 29. The addition of
bicarbonate or phosphate buffers to solutions Introduced Into
the rumen slowed but did not prevent the rise in pH. When
carbon dioxide was bubbled through a solution of sodium ace
tate In a Krebs-Ringer-phosphate solution, pH could be con
trolled, but only when the rate of flow of carbon dioxide
reached about 1400 ml. per minute.
Saliva is generally considered to be one of the main
buffering components of rumen contents. However, it is a
more effective buffer against addition of acid than of alkali
(Turner and Hodgetts, 1955a, 1955b). Furthermore, one of the
two major buffer components is bicarbonate. In normally fer
menting rumen contents, there is a high partial pressure of
carbon dioxide, which helps to maintain the pH of the bicar
bonate buffer system at about 6.5. Under the conditions of
these trials, the composition of the gaseous phase in the
rumen was probably very similar to that of the atmosphere.
When freshly collected saliva was left in a beaker open to the
atmosphere, its pH rose from 6.8 to about 8.0 in 2 hours.
It was therefore decided to exclude saliva from the rumen.
Attempts to follow the technique of Hydeh (1958), using
a simple catheter passed down the esophagus, were unsuccessful
as the catheter was always regurgitated. However, a modified
urethral catheter devised by Dr. A. D. McG-illlard1 was very
3-D airy Science, Iowa State University of Science and Technology, Ames, Iowa.

r
48
satisfactory. A 3-foot section of rubber tubing, 0.25 inch
in diameter, was glued into the cut end of a 30 ml. Bardex
urethral catheter^ (Figure 3). The catheter was passed back
wards down the nasal tract and esophagus and into the rumen.
It was connected by rubber tubes of suitable length to glass
tubes passed through a rubber stopper in the cannula (Figure
4). The balloon was adjusted carefully to a position 6-12
inches anterior to the cardia and inflated with 25 to 30 ml.
of water. Swallowing of the balloon was prevented by a
plastic disc fitting tightly round the rubber extension tube
at the nostril (Figures 6 and 7). With the catheter in posi
tion and the balloon inflated, saliva collecting anterior to
the balloon was removed through the fistula end of the cath
eter by gentle aspiration established by means of a gravity
flow bottle. A digestion stall was suitable both for re
stricting the calf and for providing a frame to support the
gravity flow bottle (Figure 6). This sytem worked satisfac
torily for all young calves, but, when 4 to 5 months old, some
calves learned to by-pass the balloon during regurgitation.
When, with the saliva apparatus in place, acetic acid
was introduced into the rumen in a Krebs-Rlnger-phosphate
buffered to pH 6.6, the pH of the solution rose within 30
minutes to 7.0 to 7.5; thereafter the pH either remained
^A Bardex hemostatic catheter, 8.76 mm. in dlamter; balloon of 30 ml. capacity.

Figure 7. Schematic diagram showing position of saliva apparatus in situ

50

51
constant or rose slowly to about 8.0 by 4 hours. There was no
sign that saliva was by-passing the catheter to reach the
rumen, so It was concluded that the incomplete control of
rumen pH afforded by this technique reflected the transfer of
substances across the rumen wall either into or out of the
rumen. When carbon dioxide was bubbled through the test
solution in the rumen with the saliva apparatus in place,
pH could be maintained at about 7.0, but, as in the earlier
trial, up to 1400 ml. of carbon dioxide per minute was re
quired.
A more practical method of reducing the pH is direct
addition of acid. The acid thought most suitable was phos
phoric, since phosphate has been shown to have little or no
effect on VPA absorption (Gray, 1948). Addition of about
5 ml. of 10 N phosphoric acid through the rumen fistula when
the pH of the rumen contents reached 6.8 maintained rumen pH
In the range of 6.6 + 0.2 when saliva was excluded from the
rumen. In all future trials this technique was followed,
except when the rise in rumen pH was slow. In the latter
case, suitably diluted phosphoric acid was used.
A cannula plug was designed to allow collection of
samples and addition of phosphoric acid during the course of
the trial. The plug Is shown in Figures 3 and 4. It was
made from a number 6 rubber stopper which was perforated by
four short glass tubes, each fitted with extensions made from

52
rubber tubing. Tubes A and B provided connections for the
esophageal catheter, A being for Injection of water into the
balloon and B for aspirating the saliva. The parts of tubes
C and D within the rumen were long enough to extend well into
the rumen contents. Tube C was used for the initial intro
duction of the test solution and for subsequent collection of
samples. Tube D was for the addition of phosphoric acid to
the rumen contents. A small cork disc was fitted to the end
of tube D to allow the tube to float on the rumen contents,
thus reducing the possibility of introducing the phosphoric
acid directly on to the rumen epithelium.
Trials 15, 16, and 17 with calf 4799 were designed to
study briefly possible effects on absorption of the various
pH control measures. When the only form of pH control was
phosphate buffer, the pH of the rumen contents rose rapidly
and absorption was low. When pH was more closely controlled
(Trials 15 and 16) absorption was approximately doubled, con
firming the importance of the techniques evolved. The pH in
Trial 15 did not rise so high as previously under such condi
tions. This probably explains the fact that absorption was
similar to that in Trial 16 In which additional pH control by
phosphoric acid was provided.
Procedure
The basic techniques used in subsequent studies of
absorption were based on those evolved in the preliminary

53
studies, but modifications were introduced at various times.
The techniques used In each trial will be outlined below,
details described previously being omitted.
Experiment 1: Effect of age and of diet on absorption
A small rumen fistula was established in each of four male
HoIsteln calves at 2 to 4 days of age. Flstulation was by a
one-stage operation performed at the Iowa State University
Veterinary Clinic. A rubber cannula was fitted in the fistula
immediately. All calves were kept on metal screens to prevent
consumption of bedding. The animals were divided into two
pairs, 4880 and 4906, and 7035 and 4938. One of each pair
(4906 and 4938) was assigned at random to a milk-only feeding
regime (M calves); the other (4880 and 7035) received limited
whole milk, with alfalfa pellets end finely ground calf
starter provided ad libitum (MHG calves).
All calves received colostrum for the first 4 days of
life. For the first, second, third and fourth week thereafter
M calves received milk dally at 8, 9, 10, and 11 percent of
body weight, respectively. For the fifth and subsequent weeks
milk was fed at 12 percent of body weight daily. Milk was
fed to the MHG calves for the first 3 weeks at the same rate
as to the M calves. From the fourth to the ninth week the
MHG calves were given milk daily at 10, 9, 8, 6, 4, and 2
percent of body weight, respectively. Milk was provided
daily at 2 percent of body weight during the remainder of the
experimental period. Milk was kept In the diet, when It would

54
normally be discontinued in calves receiving solid feed,
because only milk was provided to all calves over the 2-day
period when absorption studies were performed. It was
thought that the KHG calves would take more readily to the
milk if some were in the diet throughout.
The pellets and calf starter provided ad libitum for
the KHG calves were initially offered separately, but there
was some difficulty in getting the calves to eat the pellets.
The feed was therefore later mixed In a ratio of one part
pellets to two parts starter. MHG calves were given an
inoculum of 200 to 300 ml. of strained rumen Juice weekly
from 4 days of age to 3 weeks. It was hoped this might assist
early establishment of a mature microbial population. The
rumen Juice was obtained from flstulated steers fed hay and
grain.
In the first pair of calves absorption was studied on
two consecutive days when calves were 1, 4, 8, and 13 weeks
of age. Solid feed was removed from the pen of the MHG calf
on the day prior to the trial, and milk was fed at the same
rate as to the M calf for the next 2 days. The M calf re
mained on its normal feeding regime. On the morning of the
trial the calf was weighed. The rumen was emptied, the volume
and pH of the contents being recorded (Appendix, Table 30);
it was rinsed with warm water and filled with a volume of
warm saline approximating that of the contents removed.

55
Shortly after noon, the rumen was again emptied and the saliva
apparatus established. The calf was placed In a digestion
stall and the acetic acid solution introduced. Samples of the
test solution were taken before (0) and 5, 30, 60, 120, 180,
and 240 minutes after its introduction into the rumen. The
pH of the samples was recorded promptly; the samples were
stored In a refrigerator for subsequent analysis for VFA and
PEG. The pH of the rumen contents was maintained at 6.6 + 0.2
by addition of 1 or 10 N phosphoric acid. After 4 hours, the
remaining test solution was aspirated from the rumen; the
volume of this solution was recorded.
Overnight the calf was kept in its pen and fed milk- On
the second day the procedure was repeated, but, in addition,
jugular blood was collected before (0) and at 5, 10, 15, 30,
60, 120, and 240 minutes after introduction of the test solu
tion. The blood was subsequently analyzed for glucose and
VFA. Blood collection was facilitated by maintaining a small
polyethylene catheter in the Jugular vein throughout the
trial. Heparinlzed saline In the catheter prevented clotting.
At the end of the second day, the calf was returned to its
pen and normal feeding regime. The KHG calf was given a
rumen Inoculum of strained rumen contents from a fistulated
steer fed concentrates and hay. Saliva was collected on both
days; the volume was recorded and the saliva frozen for sub
sequent analysis (Jacobson et al., 1960; McGllllard, 1962).

56
The acetic acid solution introduced into the rumen was
a modified Krebs-Ringer-phosphate In which acetic acid re
placed sodium chloride (Table 3). This solution was equimolar
with blood and provided a VFA concentration near the maximum
Table 3. Composition of the test solution introduced into the rumen in Experiment 1
Component Molarity
CH3COOH,- pH 6.4 0.127 KC1 0.005 CaClo 0.003 KH0PO4 0.001 Mg§04•7HoO 0.001 Phosphate buffer, pH 6.6* 0.010
PEG at 60 mg./100 ml.
a3orensen phosphate buffer composed of 4 parts KaHgPO^ (9.5 g./l.) and 6 parts KHgP04 (9.1 g./l.).
of the range found In the normal rumen. pH was buffered at
6.6; PEG was included at 60 mg./100 ml. The solution was
administered at 20 ml./kg. body weight.
A similar solution was used in all subsequent studies
of absorption rates ; the concentration and type of VFA and
the pH of the solution were modified as experimental vari
ables.
A basically similar technique was used for the second
pair of calves ( 7035 and 4938), but certain modifications were

57
Introduced in the light of the results with the first pair.
The test solution was administered at a constant rate rela
tive to body weight in the first pair of calves. At the end
of 4 hours, little or no test solution remained in the rumen
of the MHG calf at 4, 8, and 13 weeks of age. This result
was assumed to be related to the great increase with age In
rumen capacity relative to body weight in calves receiving
solid feed. The rumen capacity of milk-fed calves changes
little relative to body weight (Tamate et al., 1962a; Warner
et al., 1956). Therefore, in the second pair of calves, the
test solution was administered at an Increasing rate relative
to body weight with age. This rate was on a linear scale
increasing from 1 liter at 45 kg. body weight to 3 liters at
80 kg. In addition, samples were only taken for a 3-hour
period before (0) and 5, 30, 60, 90, 120, 150, and 180
minutes after administration of the test solution. (For a
further discussion on this problem see Experiment 4.) Since
few data of value were obtained from the blood analyses In the
first trial, blood collection was discontinued. The general
features of the technique described for this second pair of
calves were followed in most subsequent trials.
Various details on the calves In this and subsequent
experiments are given in Table 30 In the Appendix.
Experiment 2: Absorption of VFA at older ages The
work of Browniee (1956), Tamate et al. (1962a, 1962b) and

58
Warner et al. (1956) Indicated that little or no development
^occurred In the structure of the rumen of calves reared on
milk only. However, Trautman (1932) and Wardrop (1961b) sug
gested that development, while slow, was basically similar to
that in young ruminants receiving solid feed. To study this
effect, one calf (4938) was maintained on the M treatment
until about 8 months of age. A second calf (4906) was main
tained on M until 19 weeks of age when it was switched to the
MHG treatment. Absorption was studied at 21, 2?, and 34 weeks
on 4938 and at 16, 21, 23, 26, 34, and 36 weeks on 4906.
The experimental technique used for the second pair of
calves in Experiment 1 was continued, although absorption was
studied on 1 day only at each age. The test solution was
administered at 40 ml./kg. body weight throughout.
Experiment 3: Second day depression in absorption rates
In almost all trials with MHG calves, absorption on the second
of two consecutive days was considerably reduced compared to
the first day. Limited investigations of this effect were
made.
A 16-week-old male Holsteln calf, 4933, was fitted with
a small rumen fistula. The calf received concentrates and
hay before being placed on experiment; after flstulation, it
was fed on the MHG regime and housed on metal screens. The
experimental procedure closely followed that described for
calves 4938 and 7035 In Experiment 1, except that the over

59
night treatment between the studies on first and second days
was altered as the experimental variable. The acetic acid
solution was administered at 40 ml./kg. body weight. The
experimental procedures in each trial are summarized in Table
4.
Experiment 4: The effect of varying the volume of rumen
contents Reference has already been made to the failure
to maintain an appreciable volume of test solution in the
rumen of the MHG calf, 4880, in the first experiment. A
series of trials was therefore performed with 4880 when be
tween 16 and 22 weeks of age to try to solve this problem.
The experimental period was reduced from 4 to -3 hours. It
was felt that this would allow sufficient time to make
absorption measurements and yet would reduce the problems
associated with the small volume of contents and the very low
VFA concentration In the last 1 or 2 hours.
In the first set of studies at 16, 17, and 18 weeks of
age, the acetic acid solution was introduced either at 20 ml./
kg. body weight or at a rate designed on a sliding scale to
give 1 liter at 45 kg. body weight to 3 liters at 80 kg.
This scale was designed to allow greater filling of the rumen
of MHG calves without overfilling the smaller rumen of M
calves. Preliminary studies into the effect of pH on absorp
tion were superimposed on these trials; therefore, the treat
ment effect was studied only with regard to residual volumes

Table 4. Summary of treatments In Experiment 3
Trial no. Age of calf Overnight treatment
wk.
1 17 Sodium chloride solution. Control.
2 18 Acetic acid In Krebs-Ringer-phosphate at pH 6.6 added to the rumen on four separate occasions.
3 19 As Trial 2, but butyric acid replaced acetic acid.
4 21 Butyric acid In Krebs-Rlnger-phosphate at pH 6.6 added to the rumen after the first run. A constant Infusion of a similar solution but containing double the concentration of butyric acid was maintained. The infusion was begun at 230 ml. per hour, but was finally increased to 470 ml. per hour in an attempt to reduce the pH of th^ rumen contents.
5 23 As Trial 4, but the infusion solution was 1 N butyric acid added at 100 ml. per hour.
6 26 As Trial 2, but sodium chloride replaced acetic acid.

61
after 3 hours, any effect on absorption being masked by the
pH variations. In the second series of trials at 20, 21, and
22 weeks of age, solutions were all at pH 6.6 and were intro
duced at 20, 40, and 60 ml./kg. The effect on both residual
volume and absorption rate was recorded.
Experiment 5: Effect of pH on absorption Preliminary
data were collected on the effect of pH on absorption in both
pairs of calves used in Experiment 1. In the first pair
(4880 and 4906), the effect of pH was superimposed upon
studies of the effect of different volumes of solution on
rates of absorption (Experiment 4). All calves were between
16 and 21 weeks of age. A summary of the trials is presented
in Table 5. The procedure followed with the first pair of
calves in this experiment was similar to that used for the
second pair of calves in Experiment 1. When absorption was
studied at an alkaline pH, sodium hydroxide replaced phos
phoric acid for control of rumen pH.
In the second pair of calves (7035 and 4938), various
modifications were introduced. It was attempted to determine
the volume of rumen contents at periods throughout the trial
by measuring the degree of dilution of PEG solutions intro
duced through the fistula. Five minutes were allowed for
distribution of the PEG throughout the rumen contents; the
abdominal region of the calf was massaged vigorously further
to aid this process. However, the volumes so calculated were

Table 5. Summary of treatments In Experiment 5
Trial Volume Calf and diet Age no.a pH Test solution pH control introduced
wk.
4880 - MHG 16 1
17 2
18 3
•4906 - M 16 4
17 5
18 6
6. 6 Acetic acid 6. 6 Acetic acid
5. 0 Acetic ac Id 5. 0 Acetic acid
8. 0 Acetic aoid 8. 0 Acetic acid
6. 6 Acetic acid 6. 6 Acetic acid
5. 0 Acetic acid 5. 0 Acetic acid
8. ,0 Acetic acid 8. 0 Acetic acid
liters
10 N H3P04 10 N H3PO4
3.97 1.94
10 N H3PO4 10 N H3PO4
2.06 4.32
I N NaOH 4.60 1 N NaOH 2.16
4.48 10 N H3PO4 4.48
10 N H3PO4 10 N H3PO4
4.80 4.80
1 N NaOH 4.68 1 N NaOH 4.68
*Two sets of results are listed for all trials. With calves 4880 and 4906, two studies were made on consecutive days for each trial. With calves 7035 and 4938, two studies, each at a different pH, were made In each trial on the same day.

Table 5. (Continued)
Calf and diet Age Trial no. pH Test solution pH control
Volume Introduced
wk. liters
7035 - MHG 16 7 5.5 7.5
Acetic acid Aoetlc acid
10 N H3PO4 1 N NaOH
4.0 4.0
18 8 5.5 7.5
VFA mix*3 VFA mix
5 N VFA mix° 4.64 4.64
21 9 7.5 5.5
VFA mix VFA mix
5 N VFA mix 5 N VFA mix
5.80 5.80
4938 - K 17 10 5.5 7.5
VFA mix VFA mix
5 N VFA mix 1 N NaOH
4.96 4.96
19 11 7.5 5.5
VFA mix VFA mix
1 N NaOH (1 N NaOH (5 N VFA mix
5.36 5.36
bAcetate, propionate and butyrate In 60:25:15 molar ratio in Krebs-Ringer-phoaphate.
cAcetate, propionate and butyrate in 60:25:15 mole.r ratio.

64
obviously too great, probably because the mixing was insuf
ficient. The method was therefore abandoned and a constant
change in volume between initial and final volumes was
assumed. In Trial 7, acetic acid was used as in the previous
trials. Thereafter, a mixture of VFA, namely acetic, pro
pionic and butyric in molar ratio of 60:25:15, replaced the
acetic acid; pH control at pH 5.5 was maintained by a 5 N
mixture of these acids. It was hoped that, by replacement
of 10 N phosphoric acid by the 5 N VFA mix, not only pH but
also rumen VFA concentration could be maintained at a con
stant level.
Absorption was studied on 1 day each week, not consecu
tive days. In each trial absorption was studied at two pH's.
The solution at one pH was introduced and samples taken
before (0) and at 5, 20, 40, 60, and 80 minutes after intro
duction. The rumen was then emptied and rinsed and the solu
tion at the second pH was introduced. Samples were taken as
in the first period. The VFA solution was introduced at the
acid pH first in Trials 7, 8, and 10, and at the alkaline pH
first in Trials 9 and 11. It was hoped that this would reduce
the effects on the results of any decrease in absorption dur
ing the course of the trial. Samples were analyzed for PEG
and for total and individual VFA.

65
Analytical techniques
Blood total VFA Analysis for total VFA was based on
the technique of Annlson (1954b) with various modifications
noted below. The protein precipitate was removed by centri-
fugatlon at about 1,000 x gravity and the supernatant fil
tered through Whatman's number 12 filter paper. The remain
ing precipitate was rinsed with about 20 ml. of ion-free water
and was re-centrlfuged; the supernatant was filtered and added
to the first fraction. The filtrate was made alkaline and
concentrated using a Rinco rotating evaporator under vacuum
from a water pump, the temperature of the flask being main
tained at 40° C. in a constant-temperature water bath. The
concentrated filtrate was adjusted to pH 2.8 and two 4-ml.
allquots were steam distilled in a Markham still. The first
200 ml. of distillate were collected and titrated against
0.01 N potassium hydroxide. Air, after being bubbled through
concentrated alkali, was bubbled through the distillate to
maintain carbon dioxide-free conditions. The titer determined
for 200 ml. of distilled steam was used as the blank.
Since the amount of VFA In blood is low, the choice of
the blank is quite critical, but no uniformity is found among
different workers (Annlson, 1954b; Reid, 1950; McClendon,
1944). A number of experiments were conducted to try to
clarify the situation. The recovery by steam distillation of
pure VFA at concentrations similar to those expected in

66
concentrated blood filtrates was determined (Table 6). Since
formate can be present In appreciable quantities In blood
(Annlson, 1954b), it is apparent from these results that some
error Is involved in using the second 100 ml. of distillate
Table 6. The recovery of pure VFA by steam distillation; each acid was 0.005 N, 5 ml. were distilled
VFA {% recovery) Ml. distillate Formic Acetic Propionic Butyric
100 92.5 99.1 100.0 100.0
200 . 99.1 100.0 100.0 100.0
as the blank. Studies of the rate of distillation of blood
suggested that almost all the acidic steam-volatile sub
stances were distilled In the first 150 ml. of distillate.
The titration values for further portions of distillate were
constant, although consistently very slightly higher than
values from distilled steam. Since this difference was so
slight and less than the error inherent in the procedure, it
was decided to use the steam titer as the blank rather than
prolong the distillation of the sample.
Results of several experiments on the rate of distilla
tion of pure VFA are summarized below:
1. The rate Increased as the chain-length of the acid
Increased.

67
2. The rate was not affected by the concentration of
VFA in the sample in a range of concentrations from
0.02 to 0.002 N.
.3. For a constant concentration, the rate was greatest
for the smallest volume of sample.
Thus for a given sample, the fastest distillation rate is
obtained with the smallest volume and, hence, greatest degree
of concentration obtainable.
Blood glucose The glucose concentration of heparin!zed
blood was determined according to the technique of Somogyl
(1945), as subsequently modified by Somogyl (1952)•
Rumen total VFA The technique used was a synthesis
of various procedures, but was based primarily on the pro
cedures of Annlson (1954a) for rumen juice and Annlson (1954b)
for blood.
A 4 ml. aliquot of the sample was diluted with an equal
volume of ion-free water to give a suitable VFA concentration
for distillation. Protein was precipitated from the solution
by the addition of 8 ml. of McAnally1 s reagent, a saturated
solution of magnesium sulfate containing 2.5 percent by volume
of sulfuric acid (McAnally, 1944). After standing 10 to 15
minutes, the solution was filtered through Whatman1 s number
40 filter paper into 25 ml. volumetric flasks. The filtrate
was adjusted to pH 2.8 with 5 N potassium hydroxide, using
bromphenol blue indicator, and made to volume. Two 10-ml.

68
aliquots were steam distilled in a Markham still. The first
£00 ml. of distillate were collected and titrated in carbon
dioxide-free conditions against 0.1 N potassium hydroxide,
using phenolphthalein indicator. Protein precipitation was
usually completed on the day the samples were taken; the
protein-free filtrates were stored under refrigeration until
analyzed. Filtrates could be stored in this manner for about
10 days with no appreciable effect on VFA values.
Determinations were made of the rates of distillation
of pure VFA at concentrations similar to those found in rumen
samples (Table 7). The results closely approximated those
Table 7. Rate of recovery of pure VFA by steam distillation; each acid was 0.05 N* 10 ml. were distilled
VFA (% recovery) Ml. distillate Formic Acetic Propionic Butyric
*5 41 64 83 91 50 65 87 97 99 75 79 95 99 100 100 87 98 100 125 92 99
150 95 100 175 97 200 98 225 99 250 99
275 100 300

69
obtained with pure VFA at concentrations found in concentrated
blood filtrates (Table 6). The slightly slower rates of dis
tillation recorded in Table 7 are probably due to the greater
volume distilled rather than to the higher concentration of
VFA.
Gas chromatographic analysis of VFA In some experi
ments the distilled VFA were analyzed by gas chromatography.
The technique of Raun (1961) was used.
Polyethylene glycol The sample collected from the
rumen was diluted to give a PEG concentration In the range
1 to 25 mg./100 ml. It was then processed according to the
method of Hyden (1955a). Turbidity was measured in a Klett-
Summerson photoelectric colorimeter, using a number 42 filter.
Protein precipitation was completed the day of collection.
Analysis for PEG was conducted as soon as possible thereafter
as solutions of polyethylene glycol tend to give low values
ir stored, especially if exposed to daylight (Corbett et al.,
1958) .
Results
All analyses in the present studies were conducted in
duplicate; results are reported as the mean of the two anal
yses.
Experiment 1: Effect of age and of diet on absorption
The results of this experiment are summarized in Tables 8 and
9, with detailed results in the Appendix, Table 31. Results

70
Table 8. Effect of age and of diet on absorption of acetic acid, expressed as maximum absorption rate (Experiment l)
Calf and diet Pair 1 Pair 2
Age Day 4880-MHG 4906-M 7035-MHG 4938-M
wk. mg./(l00 ml. x hr. )
1 1 22 23 37 18 2 45 18 34 10
4 1 243 33 82 19 2 181 34 39 21
8 1 278* 30 79 13 2 162 25 57 20
13 1 466 31 337 13 2 143 25 83 12
aSaliva entered the rumen.
Table 9. Effect of age and of diet on absorption of acetic acid, expressed as percent of acetic acid introduced into the rumen that was absorbed (Experiment 1)
Calf and diet Pair 1 Pair 2
Age Day 4880-MHG 4906-M 7035-MHG 4938-M
wk %
1 1 12 8 14 5 2 10 7 11 4
4 1 69 15 28 8 2 52 15 13 7
8 1 71 11 32 7 2 41a 12 19 7
13 1 75 11 90 3 2 47 12 29 5
aSallva entered the rumen.

71
for the studies on the first of two consecutive days are
shown graphically in Figures 8 to 11 and maximum absorption
rates are illustrated in Figure 12* Since various modifica
tions were introduced into the trials with the second pair of
calves as a result of difficulties met with the first pair,
one cannot directly compare the results obtained with the two
pairs.
The adjusted VFA concentration is not the absolute con
centration in the rumen, but the concentration adjusted for
change In concentration of PEG in the same time interval.
Since PEG is neither destroyed in the rumen nor absorbed from
it, any decrease in concentration of VFA relative to PEG over
the same period must be assumed to reflect either metabolism
or absorption of the VFA. The rumen was rinsed carefully,
reducing any danger of metabolism of VFA by microorganisms :
later experiments have shown that acetate is little metabo
lized by rumen epithelium. Therefore the change In adjusted
concentration of VFA Is assumed to represent absorption.
The maximum absorption rate was calculated by determin
ing the regression of adjusted VFA concentration on time.
It is expressed as milligrams of acetic acid absorbed per
100 ml. of solution in the rumen per hour. Examination of
Figures 8 to 11 shows that the absorption rate, when low,
was reasonably constant. However, at higher absorption rates,
the rate decreased toward the end of the trial. In such

Figure 8. Absorption of acetic acid from a modified Kreba-Rlnger solution introduced into the emptied rumen of MHG- calf 4880 at 1, 4, 8 and 13 weeks of age (absorption on only the first of two consecutive days Is depicted)
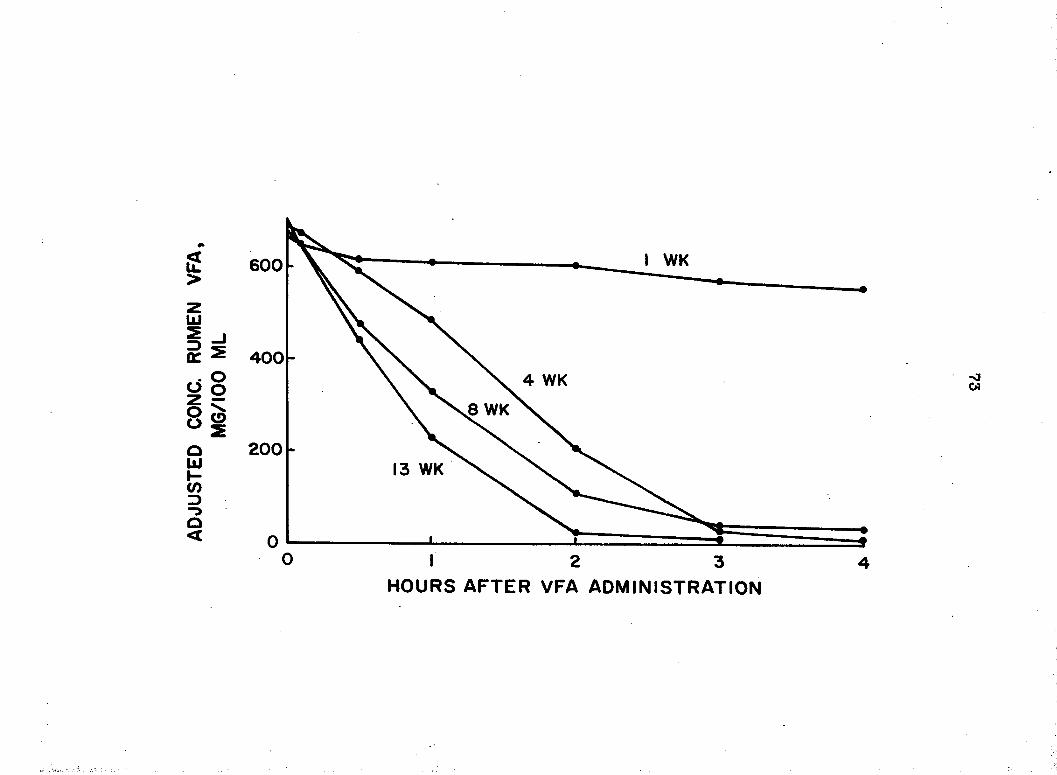
o 1 i 0 1 2 3 4
HOURS AFTER VFA ADMINISTRATION

Figure 9. Absorption of acetic acid from a modified Krebs-Ringer solution introduced into the emptied rumen of M calf 4906 at 1 and 13 weeks of age (absorption on only the first of two consecutive days is depicted; absorption at 4 and 8 weeks was very similar to that at 1 and 13 weeks and is not depicted)

2 >
600
UJ
dp
4 0 0
e> o
Û llJ h (ZD 3
<
200
CJl
I 2 3
HOURS AFTER VFA ADMINISTRATION 4

Figure 10. Absorption of acetic acid from a modified Krebe-Rlnger solution introduced into the emptied rumen of MHG calf 7035 at 1, 4, 8 and 13 weeks of age (absorption on only the first of two consecutive days is depicted)

5 >
UJ
îi yg
O O
02 Ul H CZ) 3 "3 O <
600 -
4 0 0 -
200 -
<i -vl
I 2 3
HOURS AFTER VFA ADMINISTRATION

Figure 11. Absorption of acetic acid from a modified Krebs-Ringer solution introduced into the emptied rumen of M calf 4938 at 1 and 13 weeks of age (absorption on only the first of two consecutive days Is depicted; absorption at 4 and 8 weeks was very similar to that at 1 and 13 weeks and is not depicted)

#»
< IL > 600 h
400
200
I
HOURS AFTER VFA
I WK
—I 1 2 3
ADMINISTRATION

Figure 12. The effect of diet and of age on the maximum absorption rate of acetic acid from a modified Krebs-Ringer solution introduced into the emptied rumen of calves at 1, 4, 8 and 13 weeks of age (rates are depicted only for the first of two consecutive days)

500
lil
< tr
1 1 t * cc
1 = < o 2 8 Z> \
i i <
400
300
200
100
0
7035, MHG
AGE,
i 10
WEEKS
4906, M 4938, M
« ' 15

82
cases the regression was calculated only for the period during
which the change in concentration of VFA was reasonably
linear; this covered at least a 2-hour period in all cases
except one, when only a 1.5-hour period could be used. The
decrease in the rate of absorption toward the end of the
trial in MHG calves was probably due, in part, to the decrease
in the concentration of VFA in the rumen during the trial;
Masson and Phillipson (1951) and Annison £t al. (1957) showed
that the absorption rate of VFA was proportional to the con
centration in the rumen. Furthermore, on a number of occa
sions, absorption was so great that the concentration of VFA
in the rumen approached zero within % or 3 hours. At such a
point absorption necessarily decreased.
A calculation of the total amount of VFA absorbed was
also made. The mean concentration of VFA and of PEG through
out each run was calculated from all determinations, not just
the initial and final concentration. From a knowledge of the
concentration of PEG and of the total volume at the end of
each trial, it was possible to calculate the total amount of
PEG remaining in the rumen and, by difference, the amount of
PEG passed down the tract. Relating the mean PEG concentra
tion to the total passage of PEG allowed an estimate of the
volume of contents passed, assuming a linear loss of rumen
contents throughout; by a similar calculation in reverse, an
estimation was made of the total amount of VFA passed. The

83
difference between the amount of VFA introduced into the rumen
and the sum of the amount passed down the tract and that re
maining in the rumen was assumed to represent the total amount
of VFA absorbed.
The maximum absorption rate was low in all calves at 1
week and in M calves no significant change was found up to 13
weeks. In sharp contrast to this, absorption increased
markedly in MHG calves by 13 weeks. The absorptive ability
of 4880 developed much faster than 7035, the biggest increase
coming between 1 and 4 weeks in 4880, and between 8 and 13
weeks in 7035.
In Table 9, absorption is recorded by relating the amount
of acetic acid absorbed to the amount originally introduced.
It will be seen that in MHG calves, on the first day at least
69 percent of the acetic acid was absorbed at 4, 8 and 13
weeks in 4880 and at 13 weeks in 7035. The majority of the
remaining acetic acid was passed to the lower gastrointestinal
tract and examination of the data in Table 31 of the Appendix
will show that in these particular trials the rumen was vir
tually free of VFA by the end of the experimental period. If
absorptive ability in such cases is measured by calculation
of the total amount of VFA absorbed, it will be underestimated
due to the limitations of both low VFA concentration and low
total volume of contents in the later stages. The maximum
absorption rate, being determined during the initial, linear

84
change in VFA concentration, is unaffected by the low concen
tration in the later stages of these trials. While it is pos
sible that the maximum absorption rate is affected by the total
volume of contents, brief experiments to investigate this were
inconclusive (Experiment 4). Thus it is felt that the maximum
absorption rate more closely reflects the absorptive ability
of the rumen.
The problem of how one should express absorptive ability
is well illustrated in comparing the results obtained with
4880 and 7035, the two MHG calves, at 13 weeks. The maximum
absorption rate was considerably greater for 4880, but 7035
received over twice as much acetic acid initially and absorbed
over twice as much acetate in 3 hours as did 4880 in 4 hours
(Appendix, Table 31). Just which rumen was the more effective
absorbing organ cannot be decided conclusively.
Absorption on the second day of each trial was almost
always less than on the first day in MHG animals; this effect
will be discussed later. However, the trends with regard to
the effects of age and of diet on absorption were similar to
those found on the first day. During the trial on the second
day at 8 weeks with 4880, the balloon of the esophageal
catheter burst, allowing saliva to enter the rumen. Rumen
pH was controlled successfully, but it is not known what
effect the presence of saliva may have had on absorption.
Blood VFA and glucose concentrations were measured on the

85
second day with calves 4880 and 4906. On no occasion was the
change in concentration of either blood component outside the
range expected from normal variation. The preliminary studies
with non-fistulated calves had suggested no glucose changes
might be expected. However, Annison _et al. (1957), Barcroft
et al. (1944a) and Masson and Phillipson (1951) demonstrated
a rise in peripheral blood VFA concentrations when acetate
was absorbed. Although the accuracy of blood VFA determina
tions was never considered to be entirely satisfactory in
the present trials, the Inability to detect any change was
not attributed to the failings of the analytical technique.
The rate of acetate absorption in these trials was calculated
to be at least as high as that expected from normally func
tioning rumens, and no explanation of the absence of a re
sponse in the blood is apparent.
No objective measurements of the development of rumen
papillae were made during the experiment, but the rumens were
examined visually before each trial. The rumen epithelium
of all calves was pink at 1 week and showed little papillary
development. The epithelium of M calves did not change
greatly during the course of the experiment, although small,
poorly developed papillae the size of pin-heads, were visible
at all ages. In contrast, the rumens of the MHG- animals
changed markedly with age. By 4 weeks, considerable papillary
development was evident, especially in 4880, and by 13 weeks
86
the epithelium closely resembled that of an adult rumen, being
well papillated and brown in color. The papillae of 7035
developed rather more slowly in the first 8 weeks. The epi
thelium was very dark, but the dark material flaked off in
tiny pieces following several rinses. The nature of the dark
material is not known. Only a small amount of the material
was found in the water used to rinse the rumen, yet the rumen
changed In color from dark brown to pink in the process of
rinsing. It was therefore assumed that the material was
either on the surface of the epithelium or in the superficial
layers. By 13 weeks the papillae were as large as those of
4880 and the epithelium appeared to be quite normally devel
oped.
A visual appraisal of the degree of development of the
rumen epithelium is open to the objection of being both in
accurate and subjective. However, the close agreement between
the structural development described and the absorption rate
measured is worthy of note.
Parakeratosis of the rumen is a term applied rather
unspecifically to a thickening and darkening of the epithe
lium (Jensen et al., 1958; Rhodes, 1961; Thompson et al..
1958). Various dietary factors have been suggested as con
tributing to the development of parakeratosis; all-pelleted
rations and feeds that have been heat-treated are often
blamed. Since all the solid feed received by MHG calves was

87
either pelleted or finely ground, there was the possibility
that parakeratosis might develop. Unless the dark, poorly
papillated rumen described for 7035 was a mild form of para
keratosis, no sign of such a condition was noted.
Experiment 2: Absorption at older 9ges Maximum
absorption rates measured in calves that were continued on
experiment for a longer period are presented in Table 10;
Table 10. Maximum absorption rate of acetic acid from the rumen of older calves (Experiment 2)
Calf 4938 Calf 4906 Age Diet Absorption Age Diet Absorption
wk. mg./(100 ml. x hr. ) wk. mg./(100 ml. x hr.)
16 M 21 21 M 17 21 MHG 48
23 MHG 142 27 M 28 27 MHG 191 34 M 16 34 MHG 110
36 MHG 248
^Switched to MHG at 19 weeks.
detailed results are given in the Appendix, Table 32. Some
results are shown graphically on Figures 13 and 14. While
calves 4906 and 4938 were continued on milk only, absorption
remained at the same low level as had been measured earlier.
At 19 weeks of age, 4906 was switched from the M to the MHG
treatment. The calf did not eat the solid feed readily for
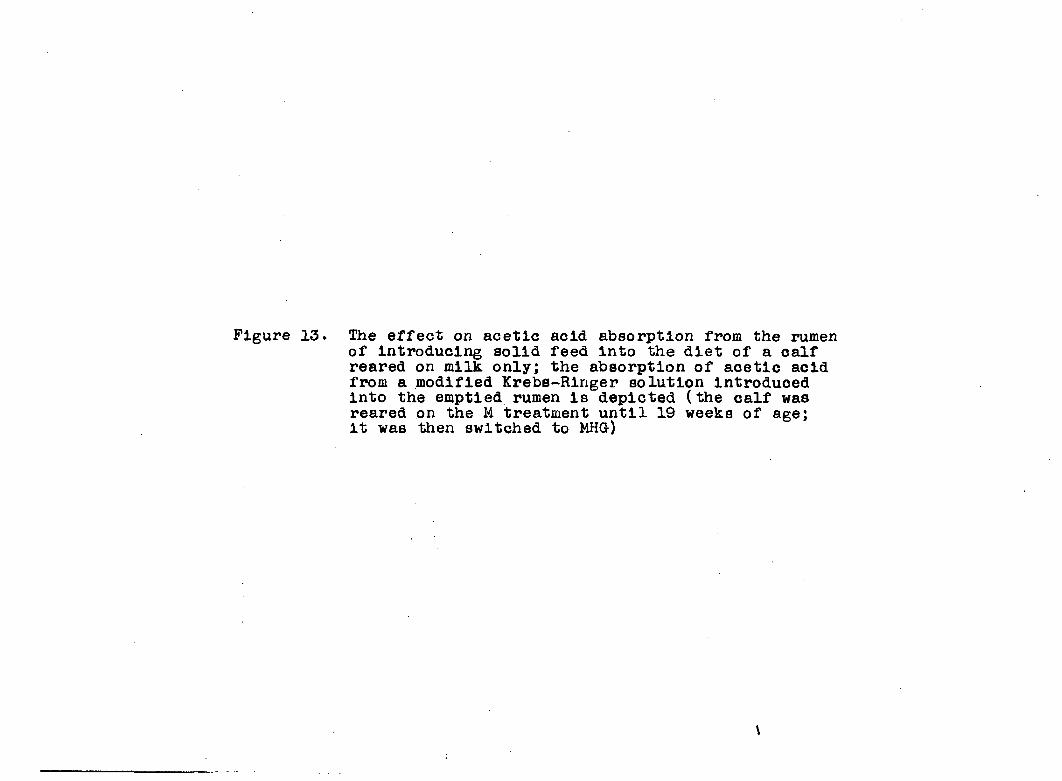
Figure 13. The effect on acetic acid absorption from the rumen of Introducing solid feed into the diet of a calf reared on milk only; the absorption of acetic acid from a modified Krebe-Rlnger solution Introduced into the emptied rumen is depicted (the calf was reared on the M treatment until 19 weeks of age; It wae then switched to MHG)
\

5 >
Z 111
Id
II o UJ h co ZD
Q <
600
400
200
HOURS
16 WK I WK 21 WK
oo to 23 WK
27 WK
36 WK
J i
2 3
ADMINISTRATION

Figure 14. The effect of diet on the maximum absorption rate of acetic acid from a modified Krebs-Rlnger solution introduced Into the emptied rumen (calf 4938 was maintained on the M treatment from birth until the end of the experiment; calf 4906 was reared on the M treatment until 19 weeks of age, It was then switched to MHG)

500 r
LLI
5 or
z 5 O X
i* s§
400 -
z 3 z X <
300 -
- 200 h e>
100 -
4938-M
CHANGED FROM M TO MHG
0 15 25
AGE, WEEKS
92
the first 2 weeks, so some feed was introduced into the rumen
through the fistula. About 1 liter of strained rumen Juice
was also added to the rumen every few days for the first 2
weeks to assist development of a mature microbial popula
tion . The rumen juice was obtained from a fistulated steer
fed hay and grain.
The maximum absorption rate in 4906 increased steadily
once the ration was changed; papillary development was also
observed. The rate of increase in absorptive ability was
intermediate between the rates found for 4880 and 70-35, the
two calves reared on MHG from birth (compare Figures 12 and
14).
The absorption rate at 34 weeks with 4906 was unexpected
ly low end the trial was repeated at -36 weeks. The cannula
fell out of the fistula the night before the 34-week trial,
and all the rumen contents were lost. This loss of rumen
contents is probably the reason for the low absorptive abil
ity, a conclusion supported by results of Experiment 3.
In Table 11 are recorded maximum absorption rates for
various calves aged from 1 to 34 weeks. The results are
obtained from all experiments in the present studies in which
the absorption of acetic acid from rumen contents at pH 6.6
was studied. Only the results from the first of two consecu
tive days, are included. Results do not include those from
4906 after it was switched from M to MHG.

93
Table 11. The effect of diet on maximum absorption rates in calves aged from 1 to 34 weeks®-
Diet Age MHG M
wk. mg./(lOO ml. x hr.)
1 30 21 4 163 26 8 179 22 13 402 22 16 301 21 17 255 18 238 19 192 21 264 17 26 215 27 28 34 16
aEach rate for all ages from 1 to 13 weeks is the mean two rates determined with two calves. Each rate after 13 weeks is from one determination only.
The absence of a significant change in absorption rate
In M calves from 1 to 34 weeks of age is quite apparent. In
MHG calves, the absorption rate reached a maximum at about
13 weeks of age. In these particular results, the rate
declined after 13 weeks and varied around a mean of 233 mg.
per 100 ml. per hour between 17 and 26 weeks. However, each
result after 13 weeks was obtained from only one trial; fur
thermore the results for the ages from 1 to 16 weeks were
obtained with different calves (4880 and 7035) from those for
the period from 17 to 26 weeks (4933). More experiments are

94
required to determine whether the decline in absorption rates
between 13 and 20 weeks of age was a real effect or merely
represented natural variation.
Experiment 3: Second day depression In absorption
Reference has already been made to the reduction in absorption
rate in i'iHG calves on the second of two consecutive days. The
effect is seen in Tables 8, 9, and 12. In only one trial in
volving MHG calves was absorption higher on the second day.
This was in 4880 at 1 week of age, when the absorption rate
was low and the rumen was essentially undeveloped.
It seemed likely that the reduction in absorption rate
was due either to some damage occasioned to the rumen by the
trial of the first day, or to the lack of actively fermenting
rumen contents for over 24 hours. The results of trials
further to define this problem are presented in Tables 13 and
14 and in the Appendix, Table 33.
The purpose of the experiment was to try to maintain in
the rumen a solution with a volume and VFA concentration
approximating those of natural contents. The results of this
part of thé experiment are given in Table 14. The periodic
addition of a Krebs-Rlnger solution containing VFA was success
ful in maintaining both volume and VFA concentration at levels
greater than those obtained by a single addition of a solution
of sodium chloride; however the levels were not so high as
found in the normal rumen. Absorption on the second day was

95
Table 12. Maximum absorption rates on second of two consecutive days, rate expressed as a percentage of that on the first®
Age
MHG diet Calf
4880 7035
M diet Calf
4906 4938
wk.
1 4 8 13
205
58* 31
92 48 72 25
78 103 83 81
56 111 154 92
aSaline Introduced into rumen at the end of the first day and mid-morning on the second day. Data are from Experiment 1.
^Saliva entered the rumen during the trial on the second day.
Table 13. Effect of various treatments on maximum absorption rates on two consecutive days In a MHG calf (Experiment 3)
Maximum absorption rate Solution In Day 2 x 2.00
Age rumen overnight Day 1 Day 2 Day 1
wk.
17 Sodium chloride 18 Acetic aclda 19 Butyric acid* 21 Butyric acid*
infusion 26 Sodium chloride8.
/(100 ml. x hr.) %
255 100 39 238 161 68 192 170 89
264 128 48 215 66 31
aBased on Krebs-Rlnger-phosphate, pH 6.6.

96
Table 14. Conditions maintained in rumen of calf 4933 overnight in Experiment 3
Volume of Rumen rumen contents
Time Rumen VFA Intro-Trial of day pH conc.a Removed duced°,o
mg./ 100 ml. liters —-
1. Sodium chloride 5:30 p.m. 4.00 (0.154 i'i) 10:00 a.m. 6.7 2.30 4.00
1:30 p.m. 7.5 0.85
%. Acetic acld^ 4:30 p. m. 6.6 680 4.00 (0.11-3 M) 9:45 p.m. 7.7 139 3.05 4.00
7:15 a.m. 7.7 54 2-35 4.00 10:15 a.m. 7.5 309 3.60 4.00 1:15 p.m. 7.7 247 2.76
3. Butyric acid5- 5:45 p .m. 6.6 680 4.25 (0.113 K) 10:15 p.m. 7.4 123 2.70 4.25
7:15 a.m. 7.8 58 2.50 . .4.25 11:00 a.m. 7.8 247 2.99 4.25 1:30 p.m. 7.8 284 2.74
4. Butyric acidd 5:45 p.m. 6.6 680 4.25' infusion Infusion (0.226 M) 230 ml./]
10:20 p.m. 7.7 240 6.16% 230 ml./]
7:45 a.m. 7.7 234 6.68?
aAs acetic acid.
^The solution introduced was that designated in the column headed 1 Trial1 unless otherwise noted."
°The calf was fed 9 lbs. of milk by nipple pail at about 5:30 p.m. and 7:00 a.m. in all trials.
dBased on Krebs-Rlnger-phosphate, pH 6.6.
80.113 M butyric acid in a Krebs-Ringer-phosphe.te, pH 6.6.
fVolume estimated by determining the degree of dilution of a solution of PEG- added to the rumen. The contents were not removed at these times.

97
Table 14. (Continued)
Trial Time of day
Rumen Rumen VFA pH conc.
Volume of rumen contents
Intro-Removed duced
4. Butyric scldc infusion (0.226 M) (continued)
5. Butyric acid infusion (1.0 to)
8:55
10:35
1:10
4:00
a * m •
a.m.
p.m.
p.m.
7:30 11:00
£L • IB « a.m.
2:30 p.m.
Sodium chloride^ 5:30 (0.127 to) 10:15
7:15 10:00 2:15
p.m. p »m « a.m. a.m. p.m.
mg./ 100 ml.
7.8 246 6.68?
7.6
6 - 6
10:00 p.m. 7.3
7.4 7.3
7.3
6.1 7.5 7.9 7.0 7.4
291 8.20
680
229
205 223
198 5.08
17 39 19 30
liters
Infusion 330 ml./hr.
Infusion 470 ml./hr.
4.80e Infusion 100 ml./hr. Infusion -95 ml./hr.
Infusion 85 ml./hr.
2.13 0.16-4.82 0.86
5.45 5.45 5.45 5.45
apparently stimulated by the presence of VFA. Infusion of
butyric acid was more successful in maintaining both volume
and VFA concentration, but the absorption rate on the second
day relative to that on the first was less than had been
achieved In the two preceding trials. In Trial 5, the over
night VFA concentration In the rumen was not increased by the
use of an infusion solution with a greater concentration of

98
VFA. Absorption was not studied in this trial. The periodic
addition of a Krebs-Ringer solution containing no added VFA
(Trial 6) did not stimulate VFA absorption any more than had
the single addition of saline In Trial 1. This result
strengthened the conclusion that the factor stimulating VFA
absorption on the second day was closely associated with the
presence of VFA in the rumen.
The first three trials were made at Intervals of 1 week;
the resulting frequent disturbance of the rumen may account
for the fall in absorption rate recorded on the first day in
each successive trial• The absorption rate on the second
day increased during this same period when a VFA solution was
substituted for the saline overnight. Thus the relative in
crease on the second day was due only in part to the decreased
rate on the first day.
There was no replication of these trials and all were
conducted on one calf (49-33), but the evidence is strong that
absorption was stimulated by the presence in the rumen of VFA,
but not of volume alone as represented by saline. The re
sults indicate that the reduced absorption rate on the second
day was due to the absence of the necessary stimulation nor
mally provided by actively fermenting rumen contents rather
than to any damage to the rumen due to the experiment. The
low absorption rate recorded for calf 4906 at 34 weeks follow
ing the loss of normal rumen contents prior to the trial is
further evidence supporting this theory.

99
Experiment 4. Effect of varying the volume of rumen
contents The volume of test solution introduced into the
rumen of calf 4880 In Experiment 1 (20 ml./kg. body weight)
was considerably lower than the volume of natural contents
removed at older ages (compare Tables 30 and 31 in the
Appendix). From Table 31 it can be seen that at the end of
4 hours little or no test solution remained In the rumen.
Under the same experimental conditions, at least 300 ml. of
test solution remained in the rumen after 4 hours in the M
calf (4906). It was thought that this difference between the
M and toHG calves reflected the different degrees of develop
ment of the two rumens.
The effect of reducing the length of the experimental
period and of increasing the volume of test solution intro
duced initially was studied. The trials were conducted with
a MHG calf (4880). The results are presented in Table 15.
When, in Trials 1 to 3, the period of the trial was reduced
from 4 to 3 hours, but the solution was introduced at the same
volume relative to body weight as before, at least 700 ml. of
solution remained in the rumen at the end of the experimental
period. When the test solution was Introduced at a higher
rate, about 40 ml./kg., almost double the volume remained in
the rumen at the end of 3 hours. At the higher level of
introduction, the volume of test solution more closely
approximated the volume of normal contents. Although,

Table 15. Effect of Introducing different volumes of solution into the rumen on the volume remaining after 3 hours and on absorption (Experiment 4)
Trial no. Day
Rumen volume Introduced Removed relative to after
pH body weight Introduced 3 hr.
Absorption VFA
Maximum absorption rate
Acetic acid absorbed In
3 hr.
ml./kg. liters liters mg./
(100 ml. x hr.) g-a
1 1 £
6.6 6.6
41 20
3.97 1.94
1.47 0.70
£ 1 2
5.0 5.0
20 42
2.06 4.32
1.12 2.62
3 1 2
8.0 8.0
43 20
4.60 2.16
2.66 1.28
4 1 6.6 40 5.04 2.75 233 23
5 1 6.6 20 2.68 1.38 376 15
6 1 6.6 60 8.76 5.10 238 41
^Absorption in Trials 1-3, is not recorded in this table as the effect of volume on absorption was masked by variations in pH.

101
relative to body weight, the volume of natural contents in
4906, the mllk-fed calf, was much less than 40 ml./kg., no
difficulty was experienced in introducing solutions at such
a level Into the rumen. Harrison et al. (1960) and Smith
(1959) also found that, in milk-fed calves, the capacity of
the rumen was much greater than the volume of the contents.
The volume of solution administered to 4880 in this
experiment was determined by extrapolation of the scale de
signed to give 1 liter at 45 kg. body weight to 3 liters at
80 kg. This scale was devised to try to take into account
the extensive increase in the volume of the rumen of. MHG
calves in the first few months of life. However, the rumen
volume probably increases less rapidly after the first 3 or 4
months of age (Harrison et al., 1960) and It was subsequently
decided that the rate of introduction should remain constant
once it reached 40 ml./kg. body weight.
The test solution was introduced at an increasing rate
relative to body weight In the second pair of calves (7035
and 4938) in Experiment 1. In this case, there was no con
sistent difference In the total loss of contents between the
two dietary treatments. In Experiment 2, when the test solu
tion was administered at 40 ml./kg. body weight, there was
again no consistent difference. Thus no definite conclusions
can be drawn as to the effect of diet on the rate of passage
of liquid from the rumen.

102
A brief trial to try to determine the effect of varying
the volume on the absorption of VFA gave Indecisive results
(Table 15). As volume was increased, the total amount of VFA
absorbed also increased, though not linearly. However, of
the total VFA introduced into the rumen, at least 67 percent
was absorbed In each trial. This further Illustrated one of
the restrictions of the technique, namely that when the
initial absorption rate was high, absorption and absorption
rate were reduced by the lack of available VFA before the
trial was completed.
Although there was a suggestion in the results that the
maximum absorption rate increased as the total volume de
creased, results were insufficient to draw any definite con
clusions on this aspect, or to allow any adjustments to be
made In the results of other experiments in which the volume
varied.
Experiment 5. Effect of pH on absorption Brief
trials were conducted to investigate the effect of pH on
absorption rates In MHG- (4880 and 70-35) and M (4906 and 4938)
calves. The trials with 4880 were superimposed on the main
point of investigation, which was to study means of maintain
ing a greater volume of solution in the rumen. Results are
presented in Tables 16, 17, 18 and 19.
The absorption rate increased as pH decreased In both
4880 and 4906. The extent of the change was difficult to

103
Table 16. Effect of pH on maximum absorption rate of acetic acid (Experiment 5)
Calf and diet 4880 - MiG 4906 - M
PH Day Trial no. Absorption
Trial no. Absorption
mg./(100 ml. x hr. ) mg./(100 ml. x hr.)
6.6 1 2
1 • L°la
4 21 23
5.0 1 2
2 313s 144
5 57 ' 72
6.0 1 2
3 143 fi 102*
6 14 6 .
aAcetlc acid solution introduced at 20 ml./kg. body weight. In all other cases, a volume of 40-43 ml./kg. was introduced.
determine since there was no replication and, in 4880, volumes
varied. The effect of pH in the h calf was considerable when
one compares the rate at pH 8.0 with that at pH 5.0.
The trials with 7035 and 4938 were concerned solely with
the effects of pH. Absorption at both pH's was studied on
the same day. The addition of 5 N VFA to the rumen as a
means of controlling pH was successful also in maintaining
the rumen VFA concentration at a reasonably constant level.
Absorption at each pH was studied for only 80 minutes, so
the loss in volume during the trial was much less than usual
(Appendix, Table 36). Thus both volume and VFA concentration

104
Table 17. Effect of pH on absorption rate8- of VFA (Experiment 5)
Calf and diet 7035 - MHG 4958 - M
Trial Trial pH Period no. Absorption no. Absorption
mg./(l00 ml. x hr.) mg./(l00 ml. x hr.)
5.5b 1 7 564 7.5 2 216
5.5° 1 8 631 10 61 7.5 2 162 9
7.5° 1 9 179 11 15 5.5 2 469 75
aSee p. 104for method of calculation.
bAcetic acid in Krebs-Ringer-phosphate at both pH values.
cAcetic, propionic and butyric acids in a 60:25:15 molar ratio in Krebs-Ringer-phosphate at both pH values.
varied less than in previous trials and the results were corre
spondingly more satisfactory.
Since VFA were added to the rumen during the trial, It
was Impossible to calculate the maximum absorption rate by
the usual means. To measure absorption, the total amount of
VFA absorbed In each 20-mlnute period was calculated, using
the same principles as have been described for other trials
(p. 82). A linear loss of rumen contents was assumed. In
addition, account was taken of the amount of VFA introduced
for pH control. The VFA absorbed in the 80-minute period was

105
Table 18. Absorption rate of VFA at acid pH relative to rate at alkaline pH (Experiment 5)
MG M Trial Relative Trial Relative
pH ratio no. ratea no. ratea
6.6/8.0 1 and 3 2.1 4 and 6 1.5
5.0/8.0 5 and 6 4.1
5.5/7.5 7 2.6
5.5/7.5 8 3.9 10 6-8
5.5/7.5 9 2.6 11 5.0
aRate at acid pH + rate at alkaline pH; ratios are calculated only for those trials in which the test solution was introduced at about 40 ml./kg. body weight.
determined by addition of the amounts for each 20-minute
period; the absorption rate was determined by relating the
total amount absorbed to the mean volume, assuming s linear
volume change, and adjusting it to 1 hour. The resulting'
absorption rate in milligrams of VFA (as acetic acid) per
100 ml. of solution per hour should closely approximate the
maximum absorption rate as calculated for other calves.
Although the trials with this second pair of calves
varied in so many respects from those with 4880 and 4906, the
same general trends were apparent (see Tables 17 and 18, and
for detailed results, Table 36 in the Appendix). Absorption
was greater in both calves at the more acid pH, but the

Table 19. Effect of pH on absorption of individual VFA (Experiment 5)
Calf and diet PH Trial no •
Mean VFA
conc. of in rumen VFA absorbed
Specific absorption rate8
Calf and diet PH Trial no • °2 c3 o
*>
- cr
c2 °3 °4 c2 C3 C4
m.moles/liter m •moles
7035 - MHG 5.5 8 66 23 11 271 144 109 4.11 6.26 9.91 9 73 24 14 284 148 91 3.89 6.17 6.50
7.5 8 58 20 13 64 47 35 1.10 2.35 2.69 9 54 18 10 133 65 33 2.46 3.61 3.30
4938 - k 5.5 10 67 23 11 26 21 10 0.39 0.91 0.91 11 63 24 13 4 35 37 0.06 1.46 2.85
7. 5 10 66 23 13 13 3 -8 0.20 0.13 11 67 27 17 4 2 9 0.06 0.07 0. 53
^Expressed as m.moles absorbed per (m.moles x liters in rumen).
bC^, C3 and C4 represent acetic, propionic end butyric pcids, respectively.

107
difference was greater on the M treatment. In Trials 8 and
10, the more acid solution was introduced first followed by
the alkaline solution; the order was reversed in Trials 9 and
11. It is possible that absorption decreases during the
course of a trial of this nature due to the physiological
stresses introduced. Such an effect was found by Masson and
Phllllpson (1951), but in their experiment the reduced absorp
tion rate was probably associated with the prolonged anes
thesia of the animals. The purpose of reversing the order of
introduction of the two solutions in the present trials was
to try to take this effect into account. In both the MHG and
the M calves, the ratio of absorption rate at the acid pH to
that at the alkaline pH was greater when the more acid solu
tion was introduced first. This suggested that absorption
did decrease with time, although the replication was insuffi
cient for the results to be considered conclusive.
In Trials 8, 9, 10, and 11 a mixture of VFA was used.
Examination of Table 19 shows that, with the MHG calf, absorp
tion of each component VFA was related to its concentration,
but that the specific absorption rate of acetate was less than
that of propionate and butyrate. pH did not affect the
specific absorption rates of individual VFA differentially.
The results with the M calf were more variable; this was prob
ably because the rates of absorption were too small to be
measured accurately by the technique.
108
Metabolism
Procedure
Collection of tissue Six male Holstein calves from
the University dairy herd were allocated at birth to the ex
periment. At 4 days of age, they were randomly allotted to
one of the two feeding regimes described for the absorption
studies. In this experiment the MHG- calves received long hay
and the calf starter was not finely ground. The M calves were
kept on metal screens to prevent consumption of bedding. When
16 weeks of age, the calves were sacrificed at the University
Meat Laboratory. Another male Holstein calf (5154) was
sacrificed at 12 weeks of age. This calf was fed milk re-
placers^ until 8 weeks of age as part of a different experi
ment; it was then fed whole milk until sacrificed. Before the
experiment with the calves was begun, rumen tissue was obtain
ed from a Hereford steer sent to the Meat Laboratory for
slaughter. The purpose of this was to gain experience with
the techniques. Various details of the calves used in the
experiment are listed in Table 37 of the Appendix.
The techniques used closely followed those of Pennington
(1952). All animals were sacrificed by stunning followed by
•'•The composition of the replacer fed for the first month was: dried skim milk, 15.1%; dried distilled solubles, 17.5$; lactose, 49.4>t; lard oil, 18.0$. In the second month the percentage composition was changed to 21.1, 24.6, 36.3, and 18.0, respectively.

109
bleeding. Samples of rumen epithelial tissue were obtained
as soon as the gastrointestinal tract was removed from the
animal. In the first five trials, a delay of 15 to 30 minutes
occurred between the time of sacrifice and removal of the
rumen. To reduce any deterioration in the tissue due to
this delay, the procedure was altered so that the rumen was
available between 5 and 14 minutes after sacrifice with the
last three calves. A hypodermic needle was inserted between
the muscle and epithelium of the anterior dorsal blind sac
in the region of the anterior pillar, and air was injected
between the two layers. The muscle layer of the inflated
area of the rumen wall was cut very carefully with a scalpel
leaving the'epithelium continuous. The muscle was stripped
from the epithelium which was then cut from the rumen and
washed quickly in cold tap water. It was placed in ice-cold
Krebs-Ringer solution, shaken vigorously by hand to try to
remove feed particles and, microorganisms, and transferred
to fresh, ice-cold Krebs-Ringer. This procedure for removal
of the tissue was satisfactory for MHG- calves, a period of
about 15 minutes being required. However, the tissue of M
calves proved much more difficult to separate because both
muscle and epithelium were very thin. The extra calf, 5154,
was sacrificed in order to try to improve the technique of
tissue collection from M calves. Despite careful work with
the tissue from 5154, the two layers had not been separated

110
after 15 minutes, so the whole tissue was transferred to iced
Krebs-Ringer solution and separation was completed in this
medium within a further 15 minutes. A similar technique was
used with M calf 5152. Since the layers were easier to sep
arate in situ, a block of ice was introduced into the rumen
of the last H calf (7054) and the tissue laid on the block.
This technique allowed rapid cooling of the tissue in. situ
and facilitated the separation of the two layers of the rumen
wall. Some rumen wall in which the epithelium and muscle were
not separated was also collected from 7054.
It was realized that these variations in technique would
complicate Interpretation of the results. However, it was
felt that any procedures that would reduce the possibility of
deterioration of the tissue were justified.
Incubation The tissue was taken to the laboratory in
the ice-cold Krebs-Ringer solution. • It wss again rinsed sjid
was cut into sections 0.5 to 1.0 cm. square. All the tissue
was pooled in ice-cold Krebs-Ringer. Approximately 2 g. por
tions were blotted gently, weighed, and added to 10 ml. of
ice-cold incubating medium in 25 ml. Erlenmeyer flasks.
The incubating medium was Krebs-Ringer-bicarbonate solu
tion, pH 7.2, containing 200 micromoles of substrate. The
substrates were acetic, propionic and butyric acids, separate
ly and as an equlmolar mix, and glucose. The VFA were ad
justed to pH 7.2. A control consisting of Krebs-Ringer-

Ill
bicarbonate with no added substrate was run with each trial.
Tissues were incubated in duplicate in all substrates and the
control. The unseparated muscle and epithelium was incubated
with butyrate, glucose and the control substrates. The flasks
were placed in a Dubnoff Incubator-Shaker at 39° C. and shaken
at 105 strokes per minute in an atmosphere of 95 percent
oxygen and 5 percent carbon dioxide for 3 hours.
The various alterations in the technique of preparing
the tissues were designed to reduce the time between sacrifice
of the animal and the beginning of incubation, and more
especially between sacrifice and the cooling of tissue in
iced Krebs-Ringer solution. A summary of the results of these
efforts is provided in Table 20.
Analytical techniques At the end of 3 hours, the
medium was filtered into 25 ml. volumetric•flasks. The tissue
was rinsed well with water and the washings added to the fil
tered medium, the whole being made to volume. The tissue was
dried to constant weight at 105° C. and the dry weight was
determined. The medium was analyzed for VFA, glucose and
ketone bodies. All analyses were performed in duplicate.
Total VFA VFA analysis was performed by a slight
modification of the technique described for the absorption
studies. To 20 ml. of the medium were added 1 ml. of 10 N
sulfuric acid and 3.9 g. of anhydrous magnesium sulfate. The
addition of the 10 N sulfuric acid and the anhydrous magnesium
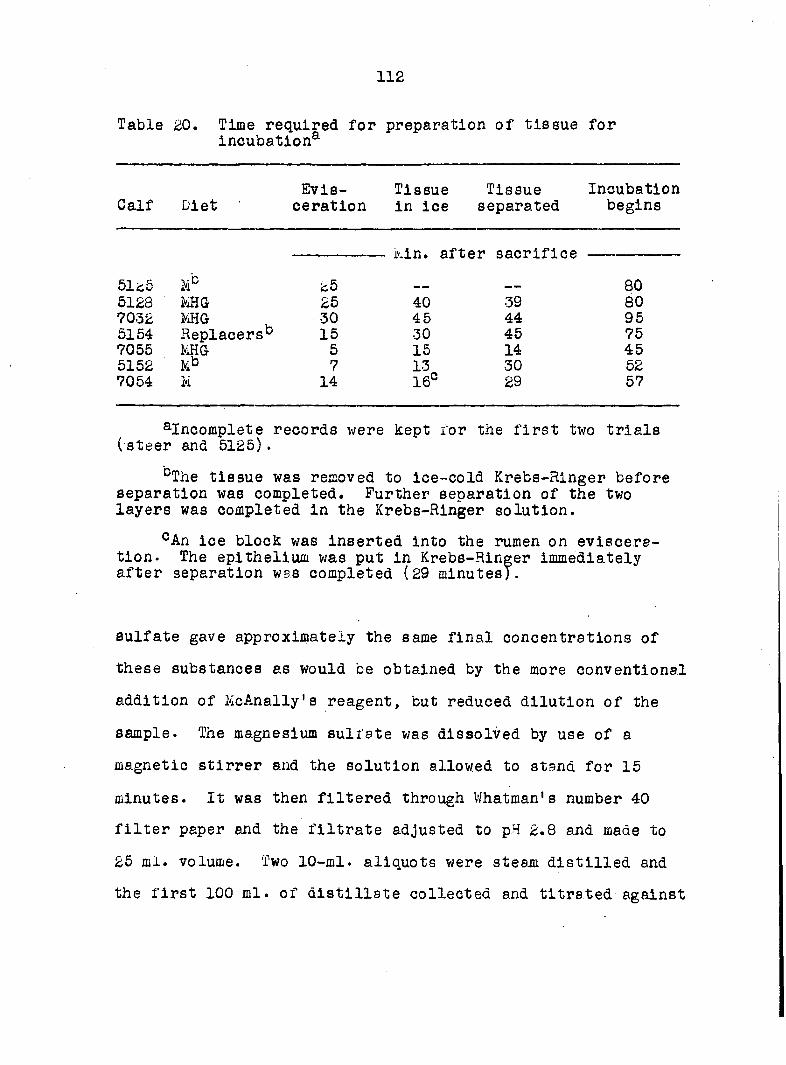
112
Table 20. Time required for preparation of tissue for incubation^
Evis- Tissue Tissue Incubation Calf Diet ceratlon in ice separated begins
kin. after sacrifice
51*5 25 • mm — — 80 5128 MHG 25 40 39 80 7032 KHG 30 45 44 95 5154 Replacera^ 15 30 45 75 7055 MHG 5 15 14 45 5152 Mb 7 !3 30 52 7054 M 14 16° 29 57
^Incomplete records were kept for the first two trials ( steer and 5125) .
DThe tissue was removed to ice-cold Krebs-Ringer before separation was completed. Further separation of the two layers was completed in the Krebs-Ringer solution.
cAn ice block was inserted into the rumen on evisceration. The epithelium was put in Krebs-Ringer immediately after separation was completed (29 minutes).
sulfate gave approximately the same final concentrations of
these substances as would be obtained by the more conventional
addition of KcAnally's reagent, but reduced dilution of the
sample. The magnesium sulfate was dissolved by use of a
magnetic stirrer and the solution allowed to stand for 15
minutes. It was then filtered through Whatman's number 40
filter paper and the filtrate adjusted to p.H 2.8 and made to
25 ml. volume. Two 10-ml. allquots were steam distilled and
the first 100 ml. of distillate collected and titrated against

113
0.02 K potassium hydroxide in carbon dioxide-free conditions.
Correction was made for the incomplete recovery of acetic acid
in the first 100 ml. of distillate (98 percent).
Glucose Glucose analyses were completed as
described under the absorption studies. Initially all samples
were analyzed in duplicate for glucose. Since no reading was
obtained for any sample except the glucose substrate, later
analyses were restricted to control and glucose substrates
only.
Ketone bodies Ketones were determined by a
modification of the technique of Reid (1960). Protein was
precipitated from 4 ml. of medium by addition of 8 ml. of
5 percent zinc sulfate and 6 ml. of 0.3 K barium hydroxide
according to the procedure of Somogyi (1945). The mixture
was centrifuged in capped centrifuge tubes and the supernant
decanted off. The precipitate was washed with a little ion-
free water-, recentrifuged, and the supernatant added to the
first fraction. The total supernatant was then made to %5
ml. volume. Removing the precipitate by the conventional
filtration procedure caused serious losses of acetone (10 to
15 percent). Use of capped centrifuge tubes reduced the
losses to 6 to 8 percent, of which only 3 to 4 percent could
be attributed to the precipitation procedures.
The distillation procedure of Reid (1960) was followed.
The three primary ketone bodies are transformed to acetone,

114
and are distilled and determined colorimetrically in this
form. Two separate fractions are distilled. The first frac
tion is derived from acetone and acetoacetate, but will hence
forth be referred to as the acetoacetate fraction. The second
fraction is derived from beta-hydroxybutyrate.
The determination of acetone in the distillates was
originally based on the technique of Greenberg and Lester
(1944), using %,4-dlnltrophenylhydrazlne. This method proved
quite satisfactory for pure ketone, but with certain samples,
especially glucose, propionate, butyrate and the VFA mix, an
unexpectedly high reading was obtained for the beta-hydroxy
butyrate fraction. It was further noticed that the sodium
hydroxide turned an orange-red rather than the usual purple,
a sign of the presence of aldehydes according to Mayes and
Robson (1957). It was first assumed that the color developed
due to some oxidation product of glucose, and indeed the color
was consistently obtained by oxidation and distillation of
glucose; however, no glucose was detected in the propionate,
butyrate or VFA mix samples by the Somogyl technique. The
interfering compound was not Identified, though aldehydes or
lactic acid were suspected.
In view of the difficulties with 2,4-dinltrophenyl-
hydrazine, salicylaldehyde was tried. When the technique
described by Reid (i960) was followed, crystals formed con
sistently in the alcoholic solution on cooling. When color

115
development In an aqueous medium was tried, no such difficulty
arose. The technique used was based on investigations by
Behner (1952). In the first two trials, a solution of 2.5
percent sallcylaldehyde in 1 N potassium hydroxide was pre
pared immediately before use. To the 5 ml. of distillate in
a screw-top test, tube were added 3 ml. of 8 N potassium
hydroxide and 2 ml. of sallcylaldehyde solution. In subse
quent trials, to increase the sensitivity of the technique,
a 3 percent solution of sallcylaldehyde in 2 N potassium
hydroxide was prepared. To the distillate were added 2 ml.
of 10 N potassium hydroxide and 3 ml. of sallcylaldehyde solu
tion. The tubes were placed In a constant temperature water
bath at 55° C. for 40 minutes, boiling bulbs being, placed on
the tubes to reduce evaporation. They were then placed in a
dark cupboard for about 16 hours (overnight) for color devel
opment. The absorption was read at 490 m.microns in a Beck-
man Model B spectrophotometer.
One disadvantage of the colorlmetrlc technique was that
color development was not complete even after 72 hours. How
ever the most rapid development of color took place in the
first few hours, and the rate of development after about 16
hours was sufficiently slow to permit accurate readings to
be made If the following precautions were taken. The samples
were kept in the dark at all times except when being trans
ferred to the absorption cuvettes and read. Also, only about

116
twenty tubes were prepared In one batch. This number of tubes
could be read within 20 to 30 minutes; no significant change
in color development was detected in this short period.
Beer's law was adhered to over the range 0 to 15 mg. of
acetone per liter of solution. This was true for standards
that had stood for various periods between 16 and 72 hours
after removal from the water bath.
A standard composed of acetone and beta-hydroxybutyric
acid, and a blank of distilled water, were taken through
the whole procedure, Including protein precipitation, with
each set of samples. The results for each set of samples were
corrected for the recovery of standards determined for that
particular set. Samples, standards and blanks were distilled
in duplicate. Blanks and standard acetone were run in trip
licate with each batch of samples in the colorimetric pro
cedure. Samples were diluted as necessary before distilla
tion to ensure that the acetone concentration in the distil
late fell within the range of 0 to 15 mg .• of acetone per
liter. Recoveries of standard acetone and beta-hydroxybuty
rate taken through thé whole procedure were 93.2 percent and
56.5 percent, respectively; the standard deviations were
+ 1.8 percent and + 1.4 percent, respectively. The recovery
of ceta-hydroxybutyrate, while low, was quite consistent.
The technique did not allow differentiation between ace
tone and acetoacetic acid. Reid (1960) obtained mean

117
recoveries of acetoacetic acid ranging from 92 to 104 percent.
The mean of this range approximated the mean for acetone re
covery, although the range was greater for acetoacetic acid.
In the present studies, the recovery of acetoacetate standards
was not determined; the concentrations determined for the
first fraction of distillate were corrected for the recovery
calculated from acetone standards.
Oxygen uptake Preliminary manometric studies were
conducted in the last three trials, the technique of Penning
ton (1954) being followed closely. Approximately 0.15 g. of
wet tissue was incubated in 3 ml. of Krebs-Ringer-phosphate,
pH 7.2, containing 30 mlcromoles of butyrate or glucose; a
control containing Krebs-Ringer with no added substrate was
also run. All substrates were run in duplicate. The tissues
and media were placed in the main compartment of a Warburg
manometry flask, in the center well of which were 0.2 ml. of
1 N potassium hydroxide and a slip of filter paper. The
flasks, after being attached to the manometers, were placed
In a water bath at 39° C. and gassed for 10 minutes with
oxygen. The manometers were then closed off and equilibrated
for 20 to 30 minutes before readings were begun. The tech
niques followed pre described in detail by Umbreit et al.
(1945). Various modifications were introduced and these will
be discussed under Results.
The dry weight of the tissue used in these studies was
determined as in the Incubation studies.

118
Results
The tissue of all MHG calves showed extensive papillary
development and appeared to be typical of rumen epithelium
from calves fed solid feed (Warner et al., 1956; Tamate ej; al.,
1962a). Both the muscle layer and epithelium were well devel
oped and easily separated. Care was taken to use only tissue
showing full papillary development; such tissue extended over
only a small portion of the anterior ventral and anterior
dorsal blind sacs around the anterior pillar.
The tissue of the l'i calves was very thin and white and-
possessed only tiny papillae. The difficulty of separating
the muscle from the epithelium has already been discussed.
The muscle of the mature rumen wall consists of two layers.
The fibers of the two layers run approximately at right-
angles to one another. Both layers were present in the rumens
of the k calves, but were very poorly developed. Whereas the
rumen tissue of the MHG calves could be separated as two com
plete sheets, the muscle of the M calves had to be separated
in thin strips of a few fibres each. The microscopic struc
ture of the tissue was not studied, but there was no reason
to think it should differ from that described by Warner et
al. (1956), Sander et al. (1959), and Tamate et al. (1962a,
1962b).
Incubation Results of all analyses are referred to
100 mg. dry weight of tissue. Since tissues were Incubated

119
In duplicate in each substrate, two results are given for each
treatment. It was expected that some substrate and product
would be retained in the tissues despite the rinsing. To
' try to estimate the amount of this retention, some epithelium
from MHG calves 7032 and 7055 was killed by being Immersed
in boiling water for 15 minutes before being incubated. These
dead tissues were incubated in butyrate, glucose and a con
trol with no added substrate. The procedures used were the
same as for the living tissue. The total amount of substrate
lost throughout the procedure was calculated (Table 21). The
Table 21. Retention of substrates in 2 g. of boiled epithelium
Butyrate Glucose Calf Sub- % re- Sub- % re-
and diet strate Retained tentlon strate Retained tention
— micromoles — — micromo les —
7032 - MHG 198 31 1 16 194 24 12 198 30 15 194 26 13
7055 - MHG 199 31 16 184 24 13 199 29 15 184 23 13
results were surprisingly consistent for both butyrate and
glucose. Butyrate was chosen as a substrate because any
metabolism of butyrate would be expected to result in ketone
production. Since no ketone bodies were found after incuba-

120
tion, it was assumed that all loss of substrate was due to
retention in the tissue. There is no res son to believe that
retention of acetate and propionate should differ signifi
cantly from that of butyrate. Results of all trials with liv
ing tissue were corrected for tissue retention. No estimate
was attempted with ketones, so the ketone results were not
corrected.
The retention of VFA was estimated to be' 5 percent by
Pennington (1952). Pennington did not state how his results
were determined. Pennington and Sutherland (1956a) calculated
that glucose retention was 3 percent; this value was obtained
by grinding the washed tissue in 'c N sulfuric acid and analyz
ing the extract for glucose. The values obtained by Penning
ton and his group for VFA and glucose retention were consider
ably lower than those found in the present studies, probably
reflecting the differences in the techniques. A decision as
to which technique gives the more valid estimate probably must
await the use of radioactive tracers.
The uptake of substrate is reported in Table 22. Some
VFA production was found in control flasks and the figures
for VFA uptake were corrected for this. VFA production also
occurred in glucose flasks, but never differed significantly
from the values obtained in control flasks. Hence the results
are not reported. There was no sign of glucose production
in any flasks, so glucose uptake is recorded only for those
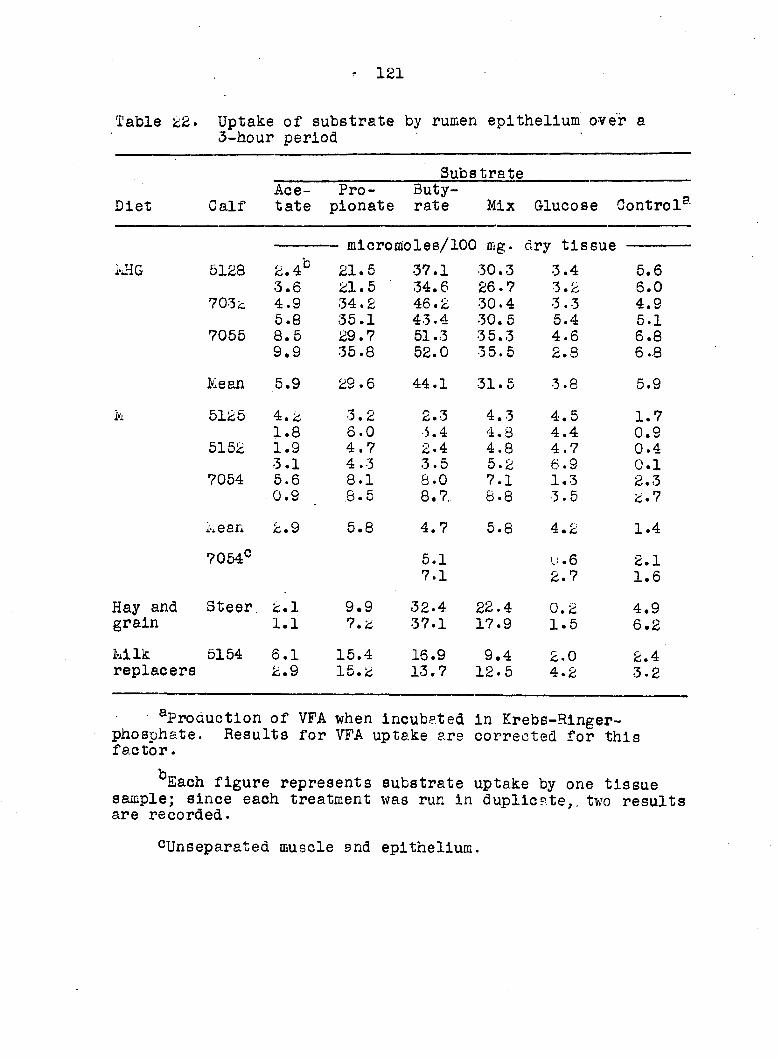
121
Table 22. Uptake of substrate by rumen epithelium over a 3-hour period
Substrate Ace- Pro- Buty-
Dlet Calf tate pionate rate Mix Glucose Control5'
— micromoles/100 mg. dry tissue
kHG 5128 2.4% 21.5 37.1 30.3 3.4 5.6 3.6 21.5 34.6 26.7 3.2 6.0
703c 4.9 34.2 46.2 30.4 3.3 4.9 5.8 35.1 43.4 30. 5 5.4 5.1
7055 8.5 29.7 51.3 35.3 4.6 6.8 9.9 35.8 52.0 35.5 2.8 6.8
Mean 5.9 29.6 44.1 31.5 3.8 5.9
k 5125 4 • is 3.2 2.3 4.3 4.5 1.7 1.8 6.0 •5.4 4.8 4.4 0.9
5152 1.9 4.7 2.4 4.8 4.7 0.4 3.1 4.3 3.5 5.2 6.9 0.1
7054 5.6 8.1 8.0 7.1 1.3 2.3 0.9 6.5 8.7.. 8.8 3.5 2.7
keen 2.9 5.8 4.7 5.8 4.2 1.4
7054° 5.1 0.6 2.1 7.1 2.7 1.6
Hay and Steer. %.l 9.9 32-4 22.4 0.2 4.9 grain 1.1 7.2 37.1 17.9 1.5 6.2
kilk 5154 6.1 15.4 16.9 9.4 2.0 2.4 replacera 2.9 15.2 13.7 12-5 4.2 3.2
^Production of VFA when incubated in Krebs-Ringer-phosphate. Results for VFA uptake are corrected for this factor.
bEach figure represents substrate uptake by one tissue sample; since each treatment was run in duplicate,. two results are recorded.
cUnseparated muscle and epithelium.

122
flasks containing glucose substrate. Ketone production is
reported in Tables 23, 24 and 25. Ketone bodies were produced
in control flasks and results for all other substrates were
corrected for this figure. More ketone bodies were usually
formed in control flasks than in flasks containing propionate
or glucose; in such cases, results for these latter substrates
are recorded as being negative, implying that ketone produc
tion was inhibited.
It is apparent that the epithelium of the M calves
utilized substantially less VFA than that of MHG calves. The
differences were quite clear-cut when propionate and butyrate
were sucstrates, but little acetate was used by either group
and the differences between groups for this substrate were
small. Uptake of acetate as finally computed was considerably
less than the calculated retention of VFA in the tissue.
Since there is doubt es to the true retention of substrate,
the figures for uptake of acetate are subject to some error.
Acetate is ketogenlc when metabolized under these conditions
(Pennington, 1952); examination of Table %5 will show that
when acetate was the substrate, ketone bodies were produced
to a small extent with tissue from all calves except, pos
sibly, 5125. There is thus little doubt that acetate was
metabolized, and the uptake of acetate computed cannot be
ascribed solely to underestimation of the degree of retention
of substrate.

123
Table 23. Acetoacetate production by rumen epithelium over a 3-hour period
Substrate Ace Pro Buty-
Control3 Diet Calf tate pionate rate Mix Glucose Control3
— mlcromoles/lOO mg. dry tissue
KHG 5128 1.0 -0.8 27.8 3.9 -0.9 1.2 1.5 -0,9 23.8 3.3 -0.7 1.0
7032 1.7 —1.8 29.7 0.7 -1.4 1.7 1.9 -1.8 29.0 1.3 -1.4 1.9
7055 1.8 -2-9 32.5 1.3 —1.8 2.8 2.0 -2.9 35. 5 1.6 -1.3 3.0
He an 1.7 -1.9 29.7 2.0 -1.2 1.9
h 51*. 5 0.1 0.1 0.3 0.2 -0.1 0.0 0.0 0.0 0.5 0.3 o.o 0.1
5152 0.2 -0.1 0.6 0.5 0.0 0.1 0.1 0.0 0.8 0.2 0.0 0.1
7054 0.2 -0.1 2.4 1.0 —0.1 0.1 0.1 -0.2 2.4 0.7 -0.2 0.1
Mean 0.1 —0 • 1 1.2 0.5 —0.1 0.1
7054b 2.4 -o.l 0.1 2.4 0.1 0.2
Hay and Steer 1.0 -0.9 16.6 2.8 —0.8 0.8 grain 0.7 -0.8 26.0 2.1 -0.8 1.0
Milk 5154 1.6 -0.7 10. fc 2.6 -0.7 0.3 replacera 0.9 -0.6 6.4 2.1 -0.6 0.5
afiesults for all suestrates ere corrected for acetoacetate production in control flasks.
br Unseparated rumen and epithelium.

124
Table 24. Beta-hydroxybutyrate production by rumen epithelium over a 3-hour period
Diet
Substrate
Calf Ace- Pro- Buty-tate plonate rate Mix Glucose Control®
— micromoles/100 mg. dry tissue
MHG 5128 0.2 0.0 9.0 7.6 -0.1 0.3 0.2 —0 « 1 8.2 6.1 0.2 0.4
7032 0.2 0.0 10.3 7.0 0.3 0.2 0.1 -0.1 8.3 6.8 0.3 0.2
7055 0.2 —0.1 8.7 8.4 0.3 0.5 0.2 0.1 7.4 7.7 0.5 0.5
kean 0.2 o.o 8.6 7.3 0.3 0.4
M 51%b 0.0 -0.1 0.0 0.2 -0.1 0.1 —0.1 o.o 0.1 0.1 0.0 0.1
51 b2 0.2 —0 • 1 0.3 0.6 -0.1 0.1 0.1 —0 • 1 0.3 0.2 0.2 0.1
7054 0.2 —0 « 1 0.5 1.3 -0.3 0.5 —0 * 1 -0.2 0.5 0.9 -0.1 0.1
Mean 0.1 -0.1 0.3 0.5 —0.1 0.2_
7054% 0.8 —0.2 0.1 0.7 0.1 0.3
Hay and Steer 0.1 —0.2 7.8 5.4 —0.1 0.3 grain o.o —0.2 8.9 4.1 -0.1 0.3
M lk 5154 0.3 -0.3 2.0 3.8 -0.2 0.1 replacera 0.3 —0.1 1.4 3.9 0.1 0.2
^Results for all substrates ere corrected for beta-hyaroxybutyrate production in control flasks.
^Unsepsrated muscle and epithelium.

125
Table 25. Total ketone body production by rumen epithelium over a 3-hour period
Substrate Ace- Pro- Buty-
Diet Calf tate pionate rate Mix Glucose Control®
micromoles/100 mg. dry tissue
MG 5128 1.2 -0.8 36.8 11.5 -1.0 1.5 1.6 — 1.0 32.0 9.5 -0.5 1.4
7032 1.9 -1.9 39.9 7.7 -1.1 2.0 2.1 -1.9 37.3 8.2 -1.1 2.2
7055 2.0 -3.0 41.2 9.7 -1.5 3.3 2.4 -2.8 42-8 9.3 —0.8 3.5
kean 1.9 —1.9 38.3 9.3 -1.0 2.3
5125 0.1 0.0 0.3 0.4 —0.1 0.1 — 0.1 0.0 0.7 0.4 0.0 0.1
5152 0.3 -0.1 1.0 1.1 —0.1 0.2 0.2 —0.2 1.0 0.3 0.2 0.1
7054 0.4 -0.2 2.9 2.3 -0.4 0.6 0.1 -0.4 2.9 1.7 -0.3 0.2
kean 0.2 -0.1 1.5 • 1.0 -0.1 0.2
7054b 3.2 -0.3 0.2 3.1 0.2 0.5
Hay and Steer 1.1 -1.1 24.4 8.3 -0.8 1.1 grain 0.8 -1.1 34.9 6.1 -0.9 1.3
iiilk 5154 1.9 -1.0 12.1 6.4 -0.8 0.4 replacers 1.2 -0.7 7.8 6.0 -0.5 0.7
®Resuits for all substrates are corrected for total ketone production in control flasks.
^Unseparated muscle and epithelium.

126
In all trials with MHG calves, the amount of each VFA
metabolized was, in descending order, butyrate, propionate
and acetate. This pattern was clear-cut and consistent, al
though the ratios did vary somewhat with different calves.
The degree of metabolism of the mixture was very similar to
that of propionate. The epithelium of the M calves resembled
that of the kHG group in utilizing very little acetate.
According to Duncan's multiple range test (Duncan, 1955), the
uptake of acetate by the epithelium of h calves was signifi
cantly less than that of propionate and of the mixture
(P < 0.05). The differences between outyrate, propionate
and the mixture were not significant.
Glucose uptake was very small by all tissues, and there
were no differences that could be attributed to the dietary
treatments. The values for glucose uptake were subject to
some error for the same reasons as were presented for acetate.
It can be seen from Table 23 that, when glucose was the sub-'
strate, there was usually a net inhibition of the production
of acetoacetate. This strongly suggests that glucose was
metabolized, at least to a small extent. However, acetoace
tate production from the epithelium of M calves was low and,
except when butyrate or mix was the substrate, the results
were not entirely outside the range of experimental error.
Ketone production (Tables ^3, 24 and 25) reflected the
greater metabolic rate of the MHG epithelia that was apparent

127
from VFA uptake. Assuming that two molecules of acetate or
one of butyrate are required to form one molecule of ketone,
it Is possible to compute the percentage of the VFA metabol
ized that was converted to ketones (Table 26). On the MHG
treatment, a high proportion of both the acetate and butyrate
appeared as ketone bodies, especially acetoacetate. Since- so
little acetate was metabolized, the results with this acid
were subject to some error. The epithelium from the X calves
was considerably less ketogenlc, although again these results
were subject to the error Introduced by the very low rate of
metabolism.
Under the conditions of the experiment, acetate, butyrate
and the mixture were all ketogenlc, but there were Interesting
differences in the type of ketone cody produced; results from
M and MHG calves were quite similar in this respect. Acetate
and butyrate gave rise primarily to acetoacetate; beta-
hydroxybutyrate usually constituted one-third or less of the
total ketones. In contrast, the VFA mixture produced the two
ketone components in approximately equimolar proportions.
The results obtained with the epithelium from the steer
were quite comparable to those from the MHG calves. The
metabolic rate was rather lower, a feature noted by Knox
(1960) when comparing the oxygen uptake of epithelium from
bovines at various ages. Pennington (1952) found that there
was very considerable variation in the ability of epithelium

128
Table 26. Percentate of metabolized acetate and butyrate that appeared as ketone bodies
Substrate utilized: Acetate Butyrate
Ketone Ac— B—OH— Total Ac— B—OH— Total produced: Acetate But.a ketones Acetate But. ketones
Diet Calf
MHG 5128 81 15 96 75 24 99 81 11 92 69 24 93
703% 70 7 77 64 22 86 66 5 71 67 19 86
7055 43 5 48 63 17 80 41 4 45 68 14 82
Mean 64 8 72 68 20 • 88
M 5125 6 0 6 13 0 13 4 0 4 16 4 20
5152 17 17 34 27 14 41 7 6 13 22 7 29
7054 8 6 14 30 6 36 31 0 31 28 6 34
Mean 12 5 17 23 6 29
7054b 48 15 63 33 10 43
Hay and Steer 92 . 12 104 51 24 75 grain 131 5 136 70 24. 94
Milk 5154 54 10 64 60 12 72 replacer 65 - 21 86 47 10 57
aBeta-hydroxybutyrate.
^Unseparated muscle and epithelium.

129
from different sheep to utilize each VFA. The low propionate
uptake in the steer compered to the MHG calves may be a re
flection of this variation rather than an effect of age.
Of considerable interest are the results from 5154, the
12-week-old calf. This calf received milk replscers until 8
weeks of age and was then fed whole milk; both diets were fed
by nipple pail. It was presumed that the calf would be rep
resentative of the M group, but examination of the results
shows that the general metabolic rate of this tissue was
intermediate between that of MHG- and M calves. Moreover the
pattern of VFA uptake, ketone production and percentage trans
formation of VFA into ketones were characteristic of the MHG-
tissue.
This calf differed In age and in its early dietary regime
from the M calves, but there was no reason to suspect that the
age difference explained the results. It seemed more likely
that the milk replacer, or milk, or both, entered the rumen
to a greater extent in this calf than had the milk in the M
calves. When opened, the rumen of 5154 contained a foul-
smelling, whitish liquid. The rumens of the M calves had few
contents and no unusually strong odor. Smith (1960) noted
that, In a few milk-fed calves, a small proportion of the milk
consistently entered the rumen. He reported limited papillary
development in such cases. Tamate e_t al. (1962a) also found
development of papillae when milk was introduced directly into

130
the rumen of a young calf. Such epithelial development was
probably stimulated by products of fermentation of the milk.
The epithelium of 5154 appeared to the eye to differ from that
of to calves only In being slightly thicker; no papillary
development had occurred.
There were definite indications In the results from both
MHG and >; calves that the overall metabolic re te of the
tissues increased as the experiment progressed. The changes
were small but consistent and are thought to reflect the
improvement in the technique for preparing the tissue. Thus
one may consider that the higher overall metabolic rate of the
last calves in both 14HG and h groups was closer to the true
rate of the tissue and reflected a lower degree of tissue
deterioration than occurred in the earlier tissues.
Tissue damage was felt to be especially probable In
tissue from the k calves In view of the difficulty of prepar
ing the tissue. In the last trial, therefore, a. section of
the rumen wall was cut from the rumen and pl'aced In ice-cold
Krebs-Rlnger; the epithelium was not separated from the
muscle, thus reducing tissue damage. Pennington (1952) found
that the metabolic rate of rumen muscle was rather less than
that of epithelium, but it was thought that, despite this dif
ference, any serious deterioration of the epithelial tissue
that occurred during Its preparation would become apparent by
comparing the results from separated and unseparated rumen

131
tissue. No large difference in the metabolic rates of the
two tissues was found, increasing confidence that the low
rate of metabolism recorded for the epithelium of M calves
closely reflected the.true state and was not the result of
tissue deterioration.
Manometry In the last three trials (calves 7055,
5152 and 7054) an attempt was made to follow the oxygen uptake
of rumen epithelium by incubating the tissue in a Krebs-
Ringer-phosphate containing glucose, butyrate, or no added
substrate (control). The results are recorded in Tables 38
and 39 in the Appendix. Oxygen uptake was studied for 3 hours
with tissue from calf 7055; the change in readings was fairly
constant although there was considerable variation in the sub
strate effect. In the second trial, readings were continued
for 4 hours as there appeared to be an increase in the rate of
oxygen uptake with time. This same effect was noted in the
third.trial and readings on this occasion were continued for
up to 12 hours. The results with these two calves, both on
the M treatment, were very unsatisfactory. The therraobarom
eter readings were not steady until about 90 minutes after
readings were begun, despite a 30-mlnute equilibration period
at the start. Since the rate of oxygen uptake for these
tissues from M calves was very low, the poor equilibration was
critical. Furthermore there were strong indications from the
results of the last trial that extensive microbial growth

132
occurred in flasks after several hours, since oxygen uptake
continued unabated in the glucose substrate when the epi
thelial tissue was removed after 7 hours. Thus equilibration
was not satisfactory for at least 2 hours after gassing of
the flasks was completed, yet the development of a microbial
population precluded long incubation times. The only conclu
sion pertinent to the metabolism of epithelium thst can be
drawn from the trials Is that they did cdnflrm in a crude way
the much greater metabolic rate of the tissue from MHG calves.

133
DISCUSSION
Investigations of the absorption of nutrients from the
gastrointestinal tract are usually concerned primarily with
either the nutrient absorbed, the mechanism of absorption, or
the properties of the absorptive organ. The present work was
designed to study the last of these aspects, but the results
also permitted tentative conclusions as to mechanisms of
absorption.
To define the absorptive ability of an organ, it is
necessary to determine not merely the rates of absorption,
but also the conditions under which the rates are obtained.
The present studies have confirmed the conclusions of other
workers that the rate of absorption of VFA from the rumen is
affected by many factors. These factors are difficult to
measure adequately due to the complex and constantly changing
nature of the rumen contents." In studying the absorptive
ability of the rumen, It is necessary, therefore, either to
attempt to measure many factors in the normal, or near-normal
rumen, or to simplify the rumen system.
In the present study, the technique of using as a cri
terion of absorption the appearance of VFA in peripheral blood
after their introduction into the intact rumen followed
neither of these two approaches. The only measurements made
were of the concentrations of VFA and glucose in jugular
blood; thus the conditions In the rumen were unknown. Fur

134
thermore, almost all of the propionate and butyrate that is
absorbed is metabolized by the rumen epithelium or the liver.
It is only in unusual circumstances that appreciable quan
tities of VFA other than acetate reach the peripheral blood.
Thus the technique not only precluded measurement of condi
tions likely to affect absorption rates but also permitted
only crude estimation of the absorption rates themselves. The
value of such a technique is probably limited to estimating
the absorption of acetic acid under conditions in which there
is no reason to suspect variable metabolism of this acid by
the body tissues.
The trials in which the above technique was used were
.preliminary, including many variables, such as age end diet of
the calves and type and level of VFA. Thus, not merely the
unsatisfactory nature of the technique but also the many
experimental variables restrict conclusions relative to treat
ment effects. One.constant feature in fully ruminating
animals was the large and transitory rise in blood VFA levels
following intra-ruminai introduction of the sodium salts of
VFA. The large amounts of VFA introduced (up to 2 g./kg. body
weight) probably resulted in rumen VFA concentrations five to
ten times the normal maximum. This may reasonably explain the
unusually high concentration appearing in the peripheral
blood, but not the very rapid fall. The latter must be
ascribed either to a reduced absorption rate or to an in

135
creased rate of extra-ruminal metabolism of VFA.
A slower rate of absorption would result if the concen
tration of VFA in the rumen decreased, such as occurs when
most of the VFA is absorbed. However, the amount of VFA in
troduced in the present experiments approximated the total
amount calculated to be absorbed in 24 hours in the adult
sheep (Annison et al., 1957; Pfander and Phillipson, 1953);
it is unlikely that such an amount was absorbed in 1 hour in
the present studies.
An increased rate of extra-ruminal metabolism of VFA
would probably be associated with some form of endocrine con
trol; hormones could conceivably also be operative In con
trolling absorptive rates. The possibility of endocrine con
trol of VFA levels In peripheral blood was considered by
Lindsay (1961). He suggested that the method of control was
such that levels of glucose end VFA in blood varied recipro
cally. In the present studies, the only significant change
in blood glucose levels was a large fall in response to buty
rate administration. Intra-ruminai administration of butyrate
affects blood glucose Inconsistently, sometimes causing hypo
glycemia and sometimes hyperglycemia. This variable effect is
not fully understood (Clark and kalan, 1956; Kronfeld et al.,
1959). The fact that the reciprocal relationship between
glucose and VFA postulated by Lindsay was not apparent in the
present trials does not exclude the possibility of endocrine
136
control.
The prolonged rise of VFA In the blood of the young,
milk-fed calf following intra-ruminai administration of VFA
suggests that the endocrine mechanism, even if present in
older calves, is not developed at birth. The detection of at
least two separate peaks of VFA in the blood of this very
young calf may indicate more than one site of absorption.
The first peak probably represented absorption from the
rumen. The second, prolonged peak suggests that some of the
VFA may have passed to the lower gastrointestinal tract before
being absorbed. Smyth and Taylor (1958) demonstrated the
absorption of VFA from the small Intestine of the rat, and
Barcroft et al. (1944a) showed VFA to be absorbed from the
cecum of the.sheep.
The drams tic response in the levels of VFA in peripheral
blood to intra-ruminal administration of VFA is of consider
able Interest. No comparable results have been reported, pos
sibly because other workers have not Introduced VFA into the
rumen at such high levels. Since the technique was not satis
factory for measuring absorption, further investigations of
these results were not made. However, more thorough study of
the factors involved not only might answer some of the imme
diate questions raised by these preliminary studies, but also
might indicate whether endocrine mechanisms are involved in
VFA absorption.
In view of the difficulties of attempting to determine

137
the absorptive ability of the rumen containing normal ingesta,
most workers have sought to simplify the rumen complex.
Phillipson and his group have developed the use of the ligated
rumen of anesthetized sheep (Masson and Phillipson, 1951);
McCarthy et al. (1958) Initiated studies of absorption from
the perfused rumen; and Tsuca (1957a, 19 57b) has attempted
the use of rumen pouches. These techniques can be criticized
for subjecting the rumen to unphysiological conditions, but
the factors likely to affect absorption can be more easily
followed in this type of preparation than in the rumen con
taining normal contents.
The technique developed for use with fistulated calves
in the present studies greatly reduced the surgical procedures
in comparison to the techniques mentioned above. Thus, apart
from being deprived of its normal rumen contents, the calf was
not in a grossly unphysiological state. The system was simple
and measurements of several variables likely to effect absorp
tion rates could be made. Since absorption was determined by
loss of VFA from the rumen rather than the appearance of the
acids in the blood, the complicating effect of metabolism by
rumen epithelium was avoided.
In the normal animal, materials from other parts of the
digestive tract can enter the rumen from the esophagus and
through the reticulo-omasal orifice. Only in calf 7035 at
1 and 4 weeks of age was there evidence of regurgitation of

138
contents through the re tic ulo-omasal orifice. On both occa
sions the trials were successfully repeated without regurgi
tation. The entry of saliva into the rumen contents was pre
vented by the esophageal catheter; from.the small changes in
the concentration of PEG in the rumen, it was apparent that
little, if any, saliva by-passed the catheter. Thus, the
dilution of the test solution by materials from other parts
of the tract was small. On the other hand, water and various
ions can pass freely across the rumen wall between the ruminai
contents and the blood. Therefore, PEG was employed to deter
mine whether decreases in the concentration of VFA were due
to absorption of the VFA or to transfer of water into the rumen
from the blood. The work of Sperber et al. (1953) and of
Hydén (1955b) indicates that PEG is a reliable marker in
studies of absorption from the gastrointestinal tract; no
evidence to the contrary was found in the trials reported
herein. The results showed that relatively little water
passed into the rumen from the blood, but, when absorption
rates were high, passage of water in the reverse direction wes
noted. The absorption of water was probably related to a
fall in the osmotic pressure of the rumen- contents due to the
high uptake of VFA. Perthasarathy and Phillipson (1953) re
ported absorption of water from rumen contents that were iso-
osmotlc or hypo-osmotic with respect to blood.
Simplification of the rumen system as in the present

139
technique permits greater control of the conditions in the
rumen and reduces the number of factors that have to be meas
ured. It must also be recognized that the process of simpli
fication usually involves the introduction of various unphyBi
ological conditions. The technique of Masson and Phillipson
(1951) required anesthesia. Results of Pfander and Phillipson
(195-5) suggested that the rates of absorption determined in
anesthetized sheep closely approximated those in the conscious
animal; hoivever, Barcroft et al. (1944a) noted that blood
pressure decreased throughout the trial, and Masson and
Phillipson (1951) found that rates' of absorption of VFA fell
as the experiment progressed. The use of the perfused rumen
introduces many physiological problems, and it is doubtful
whether conditions can be maintained in a sufficiently normal
state in such a large in vitro preparation for results to be
of great value. Trautmann ( 193-3) and Tsuda ( 1957a) reported
that, following the establishment of.a rumen sac, the epithe
lium of the sac underwent marked changes. In the light of the
results of the present studies, it is probable that such
changes would affect the absorptive properties of the epithe
lium.
The present technique avoided those grosser effects, but
the existence of other restrictions must be recognized. The
procedure of emptying the rumen of MHC- calves Involved with
holding solid feed for about £4 hours and replacement of the

140
normal rumen contents with saline for 3 to 4 hours prior to
the trial. Both of these procedures have been shown to reduce
the rate of VFA absorption. The exclusion of saliva from the
rumen, and the means employed to achieve this, could also have
affected rates of absorption. kcManus (1959) suggested that,
in the absence of saliva, the rate of VFA absorption from the
rumen might be reduced. However, he cited no direct evidence
of this, and when, in the present studies, saliva entered the
rumen accidentally in one trial, no effect on the rate of
absorption was apparent. The catheter used to prevent saliva
from entering the rumen probably caused distention of the
esophagus. Ash and Kay (1959) found that, under certain con
ditions, such a stimulus affected the motility of the retic-
ulo-rumen. Variations in rumen motility could conceivably
affect absorption rates indirectly by altering clood flow.
The large additions of phosphoric acid (up to 1.7 moles)
to the rumen in some of the present trials to control rumen
pH might be expected to affect absorption due to accumulation
of phosphate. However, in a few trials' in which VFA replaced
phosphoric acid, there was no appreciable difference in
absorption rates, supporting the conclusion of Gray (1948)
that the addition of phosphate to the rumen does not affect
VFA absorption. However, the use of VFA for pH control In
the present studies was more satisfactory since, not only did
it eliminate the possibility of extraneous effects by phos
141
phate, but it also allowed the maintenance of a relatively
constant concentration of VFA in the rumen.
To estimate the validity of the results obtained by use
of the present technique, it Is desirable to compare the re
sults with those from other studies. Unfortunately there are
very few comparable data. From the results of Conrad et al.
(1958b), it can be calculated that the 4-month-old Holsteln
calf used in their work absorbed about 540 g. of VFA (calcu
lated as acetic acid) in 24 hours. The volume of rumen con
tents of such a calf is about 12 liters (Harrison et al.,
1960; Kesler et al., 1951; Marshall and Becker, 1962). If
a dry matter percentage of sbout 65 is assumed (Hyden, 1961a)
the volume of liquid would be about 10 liters. Assuming that
the mean maximum absorption rated calculated for MHG calves
over 13 weeks of age in the present trials (233 mg. of acetic
acid per 100 ml. of rumen contents per hour) could be main
tained for an extended period, the total amount of VFA ab
sorbed in 24 hours would amount to 550 g. This figure is
remarkably close to that obtained by Conrad et al. (1958b).
Flatt et al. (1956) reported a mean absorption rate of
about 5.5 g. of VFA (as acetic acid.) per hour, or about 130
g. per day. This result was a mean from calves ranging in
age from 3 to 15 weeks and reared on a variety of diets. The
volume of liquid in the rumen of a Holsteln calf at 8 weeks
of age (the mean age of the calves studied by Flatt et al.)

142
Is about 5 liters (Kesler et al., 1951). The mean maximum
absorption rate for the two KHG calves at 8 weeks in the
present studies was 180 nig. of acetic acid per 100 ml. per
hour. This rate would result in the absorption in 24 hours
of 215 g. acetic acid, about 65 percent more than the absorp
tion calculated from the results of Flatt et al. (1956).
Mo other data with calves have been reported. The ab
sorption of VFA in the adult sheep is about 125 g. (as acetic
acid J per &4 hours (Annison et al., 1957; Pfander and Phillip
son, 195-3). If the mean maximum absorption r?te for older
calves calculated in the present studies is applied to these
sheep data, and if a liquid volume of ebout 4.5 liters is
assumed (Dobsoi., 1961, p. 74 - Hydén, 1961a), an absorption of
about 250 g. of acetate in &4 hours would result, which is
twice the figure calculated from the data of Annison et al.
(1957) and of Pfander and Phillipson (1955).
A comparison of rates obtained from young calves with
those from adult sheep is probably of limited significance
in view of the differences not merely in age cut also in
species. Absorption calculated in the present studies was .
similar to that calculated from the results of Conrad jst al.
(1958b) and somewhat higher than that of Flatt et al. (1956);
this is strong evidence that use of the emptied, partially
isolated rumen in the present studies resulted in values
within the range to be expected in the normal calf. The

143
tendency toward higher values in the present study may reflect
the high concentration of VFA introduced into the rumen, which
was near the maximum occurring in the normal rumen. Since the
mean concentration of VFA in the rumen over a 24-hour period
is lower, absorption probably would be reduced corresponding
ly.
Since no previous studies of absorption have been con
ducted with undeveloped rumens, the results from the M calves
cannot be compared with any standards. There is at present
no reason to suppose that the results from these calves are
any less valid than those from the MHG group.
The main limitation of the present technique is the in
ability to isolate the rumen from the lower gastrointestinal
tract. This resulted In the loss of considerable proportion
of the test solution through the reticulo-omasal orifice. No
method was devised to determine accurately the volume of con
tents throughout the trial, only the initial and final volumes
being known; It was necessary, therefore, to assume a con
stant rate of passage. There were indications that some error
was involved in this assumption, especially when the total
loss of contents was large. The effect of this limitation
was apparent in Experiment 5, where the absorption of a mix
ture of VFA from alkaline rumen contents in an M calf was
determined. Under these conditions, absorption rates were
low and the absorption of individual VFA could not be evalu

144
ated satisfactorily.
For many investigations of the absorptive ability of the
rumen, the restriction imposed on the present technique by the
inability entirely to isolate the rumen is more than compen
sated by the advantage of measuring absorption from an un-
anesthetized animal. Hyden (1961b) has evolved a very simi
lar technique; he also concluded that in many cases the
ability to study absorption in an animal in a normal, or near-
normal, condition is a great advantage. When periodical
measurements of absorption are required, as in the present
studies, the ability to conduct the experiments without ex
tensive surgery is especially valuable• The amount of in
formation that could be derived from an animal prepared in
this way would be greatly Increased by the development of a
reliable technique for measurement of blood flow through the
rumen vessels. This, combined with analyses of the blood for
VFA, would allow quantitative determinations of the amounts
of VFA reaching the blood. Annison et al. (195?) and Conrad
et al. (1958b) have attempted this type of approach, but both
groups of workers were forced to use blood flow data obtained
from animals other than those in which the VFA was measured.
To obtain greater precision, especially with regard to
ion fluxes across the rumen wall, it Is probably necessary
to isolate the retlculo-rumen from the remainder of the gastro
intestinal tract, a procedure that so far has required the use

145
of anesthesia (Masson arid Phillipson, 1951). If the restric
tions on the interpretation of the data imposed by the use of
anesthetics be accepted, a very accurate measurement of ion
fluxes across the rumen wall can be achieved by use of the
completely Isolated reticulo-rumen (Dobson, 1959). The pos
sibility of using a snail in vitro cell for studying the
transfer of ions across a membrane of rumen epithelium has
been examined by Dobson.^ Such a system would allow very
exact measurements. However, Dobson"*" has been unsuccessful
In establishing a preparation of this nature in which the
electrical potential across an in vitro membrane is the same
as that in vivo (Dobson, 1959; Dobson and Phillipson, 1958).
The difficulty in establishing such a small in vitro cell
emphasizes the problems to be expected in work with perfused,
isolated rumens and the reservations necessary in viewing the
results. The completely isolated reticulo-rumen and the in
vitro techniques, while permitting considerable sensitivity,
suffer from the disadvantage that the surgery required pre
cludes periodical observations on the same animal.
In the first trials in the present study In which condi
tions within the rumen were determined, there was no attempt
to control the pH of the test solution In the rumen. In the
^A. Dobson. 1959. In vitro techniques for studying absorption from the rumen. Rowett Research Institute, Bucks-burn, Aberdeenshire, Scotland. Private communication.

146
young, milk-fed calf the pH rose slowly. Within 2 or 3 weeks
after the introduction of solid feed into the diet, the pH of
the test solution introduced into the rumen increased within
about 15 minutes from about 6.5 to between 7.0 and 7.5. It
usually stabilized in this range when saliva was excluded from
the rumen, but occasionally rose slowly to about 8.0. Masson
and Phillipson (1951) noted an equally rapid shift to the same
range when solutions at pH values of between 8.5 and 9.5 were
introduced into a reticulo-rumen isolated from the remainder
of the digestive tract. Gray (1948) found a similar though
more gradual effect.
These observations indicate that the change in pH results
from a transfer of ions across the rumen wall. The transfer
must be of considerable magnitude since the test solution
introduced into the rumen in the present trials we s approxi
mately Isotonic with blood, and its volume was about one-third
of the total bloou volume, of the animal. The nature of the
mechanisms involved is at present unknown. Danielli et al.
(1945) suggested that, in the normal rumen, the absorption of
free fatty acid was a primary cause of the rise In pH. How
ever, in the present trials, the rise was also found when
water or a phosphate buffer alone was introduced into the
emptied rumen. hasson and Phillipson (1951) sought to asso
ciate the decrease in pH in their experiments with increases
in carbon dioxide and chloride In the rumen contents, but

147
concluded that further mechanisms must be involved.
When saliva was allowed to enter the rumen in the present
studies, the rapid rise of rumen pH to about 7.5 was followed
by a more gradual rise to between 7.8 and 8.0. It is likely
that this secondary rise reflected a rise in the pH of the
bicarbonate buffer system of saliva due to the low partial
pressure of carbon dioxide in the washed rumen. The occa
sional rise in the pH of the rumen contents to about 8.0,
even in the absence of saliva, suggests that some bicarbonate
passed from the blood into the rumen. A low partial pressure
of carbon dioxide In the rumen compared to the blood would
again account for the pH rise.
The results of the absorption studies clearly demonstrat
ed that the ability to absorb large quantities of acetic acid
Is not inherent In the rumen and does not develop In calves
on a diet of milk only. In this experiment the stimulus to
the increased absorptive ability was provided by the intake
of solid feed. Solid feed was similarly effective whether
first offered to the calf shortly after birth or at 18 weeks
of age, emphasizing that diet and not age was the crucial
factor. The inability of 1-week-old calves, and of older
calves fed milk only, to absorb large quantities of acetic
acid could conceivably be ascribed to an accumulation of the
acid in the blood due to an inability to metabolize VFA.
However, in no case was a significant change in the level of

148
VFA in peripheral blood detected, and it must be assumed that
the slight absorptive ability of the very young and of the
milk-fed calves is associated, either directly or indirectly,
with the poor structural development of the rumen wall.
The only results obtained in the present study as to the
relative ability of the MHG and M rumens to absorb VFA other
than acetate, were with calves ranging in age from 17 to 21
weeks. When the absorption of a mixture of VFA was studied
at pH 5.5, the specific absorption rate of butyrate and
propionate was only slightly faster than that of acetate in
both hHG and h calves. This slight difference between these
three VFA is in agreement with results with adult ruminants
by other workers. From the similarity of the specific absorp
tion rates of acetate, propionate and butyrate in animals on
two dietary regimes and at two ages, it may be reasonably
postulated that this relationship is true at. all stages of
rumen development.
The suggestion of Conrad et al. ( 1958a) and of McCarthy
and Kesler (1956) that the absorptive ability of the rumen
might be less in the young calf then in the adult was based
on very indirect evidence. The only direct investigation of
absorption from calves younger than 3 months (Flatt et al-,
1956) gave no indication that the absorptive ability wes re
duced in young calves. The results of the present study are,
therefore, the first to show not only that the capacity of the

149
rumen to absorb VFA Is poor at birth, but also that the
capacity develops only In the presence of a suitable stimu
lus.
The intake of solid feed stimulated not only the absorp
tive properties of the rumen., but also the papillary develop
ment. Results of other workers indicate that increase in the
size of papillae is accompanied by a number of other changes,
including the development of papillary bodies and thickening
of the stratum corneum. No doubt all these structural
changes, especially the large increase In surface area result
ing from papillary development, affect the absorptive ability
of the rumen, but they alone cannot account for the increased
absorption ra,tes In calves reared on solid feeds. In the
current study, absorption was reduced consistently when
saline replaced the normal rumen contents for several hours
in 1'iHG- calves. A similar effect was noted by Ash and Dobson
(1961, p. 73). Starvation, which probably affects the rumen
in a similar manner though to a lesser degree than replace
ment of thé contents with saline, also causes a reduced
absorption rate (Armstrong _et al., 1957; Pfander and Phillip-
son, 1953).
Results of the present study and work of Armstrong £t al.
(1957) indicate that the addition to the rumen of VFA, espe
cially butyrate and propionate, stimulates VFA absorption
from rumens deprived of actively fermenting contents for

150
several hours. No gross structural changes are likely to
have occurred in the rumen wall in this short period. Hence
the greater absorptive ability of the mature rumen must be
ascribed to factors in addition to the structural develop
ments. The factors were not directly identified, but they
appeared to ce stimulated by the presence of VFA in the rumen.
Danielli e_t al. (1945) reported that the specific absorp
tion rate of the VFA increased as the chain length increased
when absorption from acid rumen contents in adult sheep was
studied. In the present trials, this effect was found in
kKG- calves at about 4 months of age; the same trend was
apparent in K calves, although the results were less clear.
This suggests that the mechanism of absorption may be the
same in both KHG and k calves, although such a conclusion
is very tentative.
Absorption rates from solutions at alkaline pH values
were much less than from more acid solutions. This effect
was more pronounced in the M than in the MHG calves. The
significance of the difference between the dietary treatments
with respect to mechanisms of absorption is uncertain.
Danielli et al. (1945) suggested that the reduced absorption
at alkaline pH values reflected the lower permeability of the
membrane to anions. However, an equally important factor
may be the reduced rate of blood flow through the rumen wall
at the more alkaline pH (Dobson and Phillipson, 1956). There

151
was no indication in the current trials that, at an alkaline
pH, the specific absorption rate of butyrate was reduced
proportionately more than that of the other VFA as found by
Danielli et al. ( 194 5) and Pfander .and Phillipson (195-3).
However, it is doubtful whether the sensitivity of the present
technique was sufficient for this result to be considered
conclusive. Gray (1948) emphasized, for the same reason, the
caution with which the results of Danielli et al. (1945)
at alkaline pH values must be viewed.
The technique used to study the metabolism of VFA and of
glucose by rumen epithelium was based on that of Pennington
(195&). The main weakness of the technique is that it is
conducted in vitro : confirmation of the validity of these
results by in vivo techniques is still required. However,
the in vivo data of Kiddle et al. (1951) and of Ann!son et
al. (1957) lend indirect support to the in vitro results.
The main question with regard to the use of Pennington's
technique in the present trials arises from the structural
differences of the two types of tissue studied. The absorp
tion studies demonstrated that VFA were absorbed faster
through the rumen epithelium of the MHG than of the M calves.
This difference may have been due to a greater permeability
of the epithelium of the MHG calves or to some quite different
factor such as greater blood flow. If permeability of the
membrane was the important factor In the absorption studies,

152
the differences in metabolic activity of the two tissues
could be ascribed to the inability of the substrate to reach
the site of metabolism rather than to the lower metabolic
activity of the cells.
However, substrates could reach the epithelium from the
serosal as well as the mucosal surfaces, and it is felt that
differences in permeability could explain only partially the
very large differences in the metabolic activity of the two
tissues.
The problem of permeability would be reduced if the
epithelium were homogenized before its metabolic activity is
studied. However, the most satisfactory answer to the prob
lems posed by the present technique must await the results of
in vivo studies. Such studies would probably require radio
active tracers used in conjunction with an animal preparation
of the type used by Dobson (1959). He isolated the retlculo-
rumen of anesthetized sheep, and measured arterlo-venous dif^
ferences and changes in the ruminai contents• By this means
he was able to detect very small changes in the amounts of
inorganic ions in the blood and rumen.
A characteristic feature of the metabolism of VFA by
forestomach epithelium is the high rate of utilization of
butyrate and, to a lesser extent, of propionate. The only
other tissue found by Pennington (195k) to have s similar
affinity for butyrate was the liver. In both of these

153
tissues, a high proportion of the butyrste was converted to
ketone bodies. Tissues such as kidney cortex and heart, which
metabolized butyrate to a lesser extent, were relatively less
ketogenic. The experiments reported herein show that the
metabolism of VFA by rumen epithelium from a 16-week-old MHO-
cslf closely resembles that by adult rumen tissue. In con
trast, the metabolic pattern of the epithelium of b calves is
more comparable to that of the heart and kidney cortex.
In studies by Knox (i960), rumen epithelium from calves
1 or b days of age did not metabolize butyrate extensively,
whereas tissue from a 5-week-old calf receiving solid feed
utilized slightly more butyrate than did tissue from mature
steers. The results of the current study and of Knox (i960)
strongly suggest that the metabolic activity characteristic
of mature rumen epithelium is not present In the undeveloped
rumen tissue of calves at birth end of older calves reared on
milk only. The rate of development of metabolic activity
thus closely resembles that of structure and of absorptive
ability. The possible significance of this relationship will
be considered later.
The cause of the increase in metabolic activity of the
tissue of î'iHG- calves is not yet apparent. Henriksson and
Habel (1961) found a highly significant increase with age in
the thickness of the stratum germinativum in calves receiving
solid feed. Mlk-fed calves showed a much smaller increase.

154
These data indicated a resemblance between the high metabolic
activity of mature rumen tissue and the increase in the
stratum germinatlvum. However, the results of Tamate e_t al.
(196£b) with calves and of Wsrdrop (1961a) with lambs sug
gested a decrease rather than an increase in the thickness
of the germinativum with age. Thus more work is needed before
it can ce determined whether a greater proportion of living
cells, a greater activity of these cells, or both, is the
cause of the increase in metabolism.
Beta-hydroxybutyrate constituted less than one-quarter
of the total ketones produced from cutyrate in tissue from
both k and kHG calves. This Is in agreement with the work of
Pennington (195%) with epithelium from mature sheep. When
acetate was metabolized, beta-hydroxybutyrate was again the
smaller fraction. However, when an ecuimolar mix of VFA was
the substrate, beta-hydroxybutyrate and acetoacetate were
produced in almost equimolar proportions. Beta-hydroxybuty
rate is a. reduction product of acetoacetate- Krebs ( 1961)
found that, in certain tissues, a large proportion of the
acetoacetate is converted to its reduction product in the
presence of suitable hydrogen donors. One such donor is suc
cinate, which is formed from propionate in rumen epithelium
(Pennington and Sutherland, 1956b). The amount of aceto
acetate reduced varied from 100 percent In rat liver to none
In rat and pigeon skeletal muscle. Should the reduction occur
155
at least to a small extent In rumen epithelium, it could ex
plain the change in relative proportions of the ketone frac
tions formed in the presence of propionate.
Propionate and glucose were anti-ketogenlc In the present
experiments. This result is in accord with the work of Pen
nington (1952),' Pennington and Sutherland ( 1956a) and Seto
et al. (1955). The explanation of this effect is not obvious
since pyruvate and certain acids of the tricarboxylic acid
cycle, intermediates in the usual pathways of metabolism of
glucose and propionate, stimulate ketone production in rumen
epithelium (Pennington and Sutherland, 1956a; Seto et al.,
1955, 1956). Pennington and Sutherland (1956a) suggested that
this apparent anomaly might be explained by differential
permeability of the cells towards these acids. Another pos
sibility is that alternative metabolic pathways are followed.
Ketone production from the equlmolar mix was less than
from butyrate alone. This was probably due partly to the
lower amount of butyrate present and partly to the anti
ketogenic effect of propionate. In view of the complex inter
actions of the three VFA (Pennington and Pfander, 1957), the
relative Importance of these two effects probably can be deter
mined only by the use of radioactive tracers.
It is of Interest to speculate as to the importance of
the high metabolic rate of rumen epithelium. It is not yet
known whether active processes are Involved in VFA absorption.

156
However, there is an indication In the present study and in
other work that high rates of absorption ere attained only in
association with an actively metabolizing epithelium. Dobson
(1959) showed that sodium and, under certain conditions,
chloride are transferred across the rumen wall against their
electrochemical gradients. It is thus possible that the
metabolism of VFA provides energy for maintaining the absorp
tive abilities of the rumen. A further possibility is that
VFA, or the energy resulting from their metabolism, are re
quired for maintaining the structure of the rumen wall.
Abrasion of•the epithelium by the rumen contents probably is
considerable. Thus continuous renewal of the epithelial
layers of the wall is necessary• The ketones produced by
rumen epithelium may be of considerable importance in the
metabolism of the ruminant, rather than waste products as
generally assumed. Pennington (1952) estimated that the
ketogenie activity of epithelial tissue is as great as that
of liver tissue in sheep. Since the weight of the forestomach
epitnelium is approximately one-half that of the liver, it Is
apparent that the output of ketones from the epithelium could
be significant. Krebs (1961) showed that many tissues can
utilize ketones effectively as sources of energy. Certain
tissues, such as rat and sheep heart, metabolized acetoacetate
more readily than glucose. Ruminant tissues showed no greater
ability to metabolize ketones than did tissue from non-

157
ruminants. Whether the ketones produced by rumen epithelium
are merely by-products of butyrate metabolism, or whether
they are closely integrated In the over-all energy metabolism
of the ruminant, is not yet known.
The most interesting result from the present studies has
been the demonstration of the relationship between the struc
ture, the absorptive ability, and the metabolic activity of
the rumen epithelium. This relationship was clarified because
the studies were conducted with young animals in which these
factors were undergoing change. Results of the present study
suggest that by 3 to 4 months of a? e the epithelium of the
calf rumen is essentially mature. The only previous studies
of the absorptive and metabolic properties, respectively,
of ruminants younger than 3 months were those of Flatt et_ al.
(1956) and of Knox (1950). All other work in this field has
been conducted with animals that were probably mature with
respect to rumen development. The properties of the mature
epithelium are relatively stable and such change's as do occur
are difficult to interpret. Thus Pfander and Phillipson
(1953) noted that the rate of absorption of VFA varied appre
ciably in the adult sheep, but were unable to explain the
cause of many of the variations.
In the mature rumen the structure is likely to change
little under normal conditions, although parakeratosis may
be induced on certain feeding regimes. Hence, although It

158
has been generally assumed that the presence of the papillae
in the rumen aids absorption, evidence of this he s not been
forthcoming. Conrad et al. (1958a) suggested that VFA absorp
tion might be impaired In the very young ruminant and implied
that this might be related to immaturity of the papillary
development. However, the evidence in support of this sug
gestion was meager.
If the relatively unchanging nature of the structure of
the mature epithelium explains, at least In part, the lack of
previous evidence of a relationship between structure and
absorption, so also the Inability to detect changes in the
rate of epithelial metabolism may account for the absence
of evidence supporting the proposal of Armstrong jet al.
(1957) that the absorption of VFA requires an actively
metabolizing rumen epithelium. The only work showing vari
ations in the metabolic activity of rumen epithelium due to
factors other than random variation is that by Knox (1960).
At the time Knox reported his results, no evidence of the
absorptive ability of the immature rumen was available ; hence,
the possible significance of the results with respect to
absorption was not apparent.
The present results did not demonstrate the nature of
the relationship between the structural end functional aspects
of the development of rumen epithelium. However, when con
sidered with results of other workers, they permit the formu

159
lation of a reasonable hypothesis as to its nature. In the
current studies, the rumen developed structurally only when
solid feed was introduced into the diet. The work of Sander
et al. (1959) and of Tamate et al. (1962a, 1962b) strongly
suggest that the stimulus was not provided by the solid feed
itself, but by propionic and butyric acids, major end-products
of its fermentation. Pennington (1952) and Seto et al. (1955)
demonstrated that VFA, especially propionate and butyrete,
stimulate metabolism by mature rumen epithelium. The results
reported herein and those of Knox (1950) are in agreement
with these results and further demonstrate that structurally
immature rumen tissue is much less able to metabolize VFA.
Armstrong et al. (195?) suggested that the increased VFA up
take that resulted from the addition to the rumen of propion
ate and butyrate, was related to the ability of the epithelium
to metabolize these two VFA. In the present studies, acetate
as well as butyrate stimulated VFA absorption. The stimulus
provided by acetate by no means disproves the theory of Arm-
• strong et al. (195?). Although utilized less than propionate
and butyrate, acetate undoubtedly was metabolized "by rumen
epithelium in both the present studies and in the studies of
Pennington ( 1952) and of Seto et al. (1955). A further ob
servation relevant to the present problem was the discovery
by Dobson and Phlllipson (1956) that the addition of VFA to
the rumen stimulated blood flow in this organ.

160
The unifying feature in all these results is the stimu
latory effect of VFA. Although there is no direct evidence
as to the mode of action of VFA, it is proposed that they
exert their effects by stimulating metabolism by rumen epi
thelium. Sander et al. (1958) suggested that VFA stimulate
the development of rumen epithelium in young calves by in
creasing the metabolic rate of the tissue, by increasing
blood flow, or oy a combination of these effects. In In vitro
studies by Pennington (1954), oxygen uptake by rumen epi
thelium was stimulated by the presence of VFA, especially
butyrate and propionate. An increase in oxygen consumption
by rumen tissue would probably stimulate blood flow, explain
ing the results of Dobson and Phillipson (1956). The combina
tion of increased metabolic activity and greater blood flow
could account for the development of rumen epithelium in the
presence of VFA. Since no evidence has been reported that
VFA are actively absorbed, there is no reason to suppose that
the increased rate of metabolism by rumen epithelium In the
presence of VFA can exert a direct effect on VFA absorption.
However, the greater blood flow induced indirectly by the
increased metabolic activity could well account for the ob
served stimulation of absorption in the mature rumen.
According to the theory Just proposed, the development
of the greater potential absorptive ability of the mature
rumen is dependent on the histological development resulting

161
from the metabolism of VFA. Full realization of the potential
requires the presence of VFA to stimulate epithelial metabol
ism and so an increased rate of blood flow•
It is hoped thet the studies reported herein have added
a little to the knowledge of the functional processes of the
rumen. Whether or not they have succeeded in this, they
almost certainly heve raised further problems that may stimu
late research by others. Very limited studies with VFA other
than acetate were conducted in the present trials. Although
It would ce of interest to determine the rates of absorption
of propionate and of cutyrate from immature rumens, It is un
likely that the results will differ greatly from those found
for acetate.
Some of the most interesting aspects arising from the
present studies concern the possible Interrelationships among
blood flow, epithelial metabolism and absorptive acility, fur
ther study of which will require the development of techniques
permitting simultaneous measurement of at least two of these
three factors. The desirability of being able to determine
blood flow in the rumen vessels, or at lesst in the portal
vein, has already been discussed. Such measurements, combined
with absorption studies of the type developed In the present
experiments, would demonstrate whether a relationship exists
between blood flow and absorption rate. If absorption of a
mixture of VFA were studied by this technique, it would also

162
be possible, by comparing the ratio of VFA absorbed with that
reaching the blood, to estimate the amount of metabolism of
VFA by rumen epithelium.
The use of a biopsy capsule to sample rumen epithelium,
immediately before, or even during, an absorption study would
permit a more direct determination of the relationship between
absorptive ability and metabolic activity. The metabolic
activity of rumen samples obtained by this means could be
determined by studying their oxygen uptake. Such studies
require less tissue than the technique of measuring substrate
utilization used in the present work. The use of the biopsy
technique, combined with studies of absorption and of blood
flow, would indicate whether the reduced absorption found in
kiHG calves following starvation is associated with a decrease
in blood flow, in tissue metabolism, or in both. It could
also be applied to study of the mode of action of VFA in
stimulating VFA absorption in these circumstances.
The determination of the metabolic activity of tissue
samples obtained by biopsy still would not answer the question
of whether the results determined in vitro are applicable to
the living animal. The possibility of using arterio-venous
differences In VFA and oxygen concentrations has already been
discussed. This technique, especially if used In conjunction
with radioactive tracers, would permit the simultaneous deter
mination in vivo of absorption rates, metabolic activity, and

162
be possible, by comparing the ratio of VFA absorbed with that
reaching the blood, to estimate the amount of metabolism of
VFA by rumen epithelium.
The use of a biopsy capsule to sample rumen epithelium
immediately before, or even during, an absorption study would
permit a more direct determination of the relationship between
absorptive ability and metabolic activity. The metabolic
activity of rumen samples obtained by this means could be
determined by studying their oxygen uptake. Such studies
require less tissue than the technique of measuring substrate
utilization used in the present work. The use of the biopsy
technique, combined with studies of absorption and of blood
flow, would indicate whether the reduced absorption found in
kiHG- calves following starvation is associated with a decrease
In clooâ flow, in tissue metabolism, or in both. It could
also be applied to study of the mode of action of VFA in
stimulating VFA absorption in these circumstances.
The determination of the metabolic activity of tissue
samples obtained by biopsy still would not answer the question
of whether the results determined in vitro are applicable to
the living animal. The possibility of using arterlo-venous
differences in VFA and oxygen concentrations has already been
discussed. This technique, especially if used in conjunction
with radioactive tracers, would permit the simultaneous deter
mination in vivo of absorption rates, metabolic activity, and

163
blood flow rates, and so answer many of the questions aris
ing from the present studies.
It must be recognized that, If the relationship between
blood flow, absorption rates, and tissue metabolism is as
close as has been proposed in the present discussion, the ex
periments suggested will probably be adequate only to demon
strate the existence of the relationship, not its nature.
Investigations of the cause-and-effect relations among these
three factors must then be pursued with Improved techniques.
One final explanatory note is required. According to the
title of this thesis, the object of study was the epithelium
of the reticulo-rumen, not of the rumen alone, yet with few
exceptions the rumen only has been referred.to and discussed.
The reticulum and rumen, although distinguishable by their
epithelial structure, form a single vessel partially separated
ventrally by a muscular fold. Fluids introduced into one of
these compartments rapidly enters the other due to the con
tinual mixing movements of the reticulo-rumen. Thus, unless
absorption through very small areas is studied es when rumen
sacs ere used, it is Impossible to distinguish the absorptive
properties of the rumen from those of the reticulum. The
metabolic studies, on the other hand, were conducted with
rumen tissue only. According to the results of Pennington
(195k), the metabolic activity of the reticulum is very sim
ilar to that of the rumen, but It should not be assumed,

164
without further investigation, that this was also true in the
present studies.

165
SUMMARY
In preliminary attempts to measure the absorption of
VFA, solutions of their sodium salts were Introduced by stom
ach tube into the rumen of calves ranging in age from 2 to 25
weeks.- The subsequent change in the VFA concentration of
Jugular blood was determined. A large rise in levels of VFA
in the blood within 5-10 minutes after administration of the
test solution was found in most cases, indicating that exten
sive absorption occurred; however, the subsequent rapid fall
to pre-adminlstratlon levels within 1 hour was difficult to
Interpret with respect to absorption.
The establishment of a small rumen fistula in calves be
tween 2 and 4 days of age permitted the development of a satis
factory technique for measuring VFA absorption. To study ab
sorption rates, the rumen was emptied and rinsed, and a mod
ified Krebs-Ringer-phosphste solution containing 680 mg. of
acetic acid per 100 ml., and buffered to pH 6.6, was intro
duced . Polyethylene glycol was included as a non-absorbable
marker. The pH of the solution was kept constant by exclud
ing saliva from the rumen by means of a modified urethral
catheter and by adding 1-10 N H3PO4. Rumen samples were
collected periodically for 3-4 hours.
Two Holstein calves were fed milk, hay, and starter
(MHG) and two milk only (M). On MHG, maximum absorption rates
(milligrams of acid per 100 ml. per hour) at 1,4, 8, and 13

166
weeks of age, respectively, were 22, 243, 278, and 466 for
one calf and 37, 82, 79, and 337 for the other. Rates for M
calves were 23, 33, 30, and 31, and 18, 19, 13, and 13. One
calf was switched at 19 weeks from ivi to MHG; maximum absorp
tion rates at 16, 21, 23, 27, and 36 weeks, respectively,
were 21, 48, 142, 191, and 248. Absorption rates did not
increase in a calf on M to 34 weeks.
When, In MHG calves, the rumen was empty or was filled
with saline for at least 24 hours,' the subsequent rete of
absorption was depressed. Replacement of saline with a solu
tion of VFA reduced the depression.
Absorption was slower from solutions at pH 7.5-8.0 than
from more acid solutions (pH 5.0-5.5) in MHG and in M calves.
The absorption rate of VFA decreased as the chain length de
creased at acid pH's in MHG and M calves and at alkaline pH's
in MHG calves; results at alkaline pH's with M calves were
inconclusive.
In studies of the metabolic activity of the rumen epi
thelium, three Holsteln calves were fed MHG and three M.
The calves were sacrificed at 16 weeks of age. Epithelium
from the anterior dorsal sac was stripped from the muscle and
placed in ice-cold Krebe-Ringer. Two-gram samples were Incu
bated for 3 hours in Krebs-Rlnger-blcrrbonete, buffered to
pH 7.2, In a 95:5 atmosphere of oxygen and carbon dioxide.
Two hundred micromo les of acetate, propionate, butyrate, an
167
equlmolar mixture of these three, or glucose were added to the
medium• Mean uptake of these substrates in 3 hours was
(micromoles per 100 mg. of dry tissue) 5.9, 29.6, 44.1, 31.5,
and 3.8, respectively, on MHG- and 2.9, 5.8, 4.7, 5.8, and 4.2,
respectively, on M. Ketones were produced from acetate,
butyrate and the equlmolar mix. Percentage conversion of ace
tate and butyrate to ketones was 72 and 88, respectively, on
MHG and 17 and 29, respectively, on M.
The similarity of the rates of development of the struc
ture, the absorptive ability, and the metabolic activity of
rumen epithelium is discussed with respect to possible
mechanisms of VFA absorption.

168
LITERATURE CITED
Aggazzotti, A. 1910. Esperlenze sulla funzlone aseorbente degll stomacl nel ruminant!. La Cllnlca Veterlnsrla. -33 : 54-75.
Akssenowa, M. J. 1932. Zur Physiologie des Mag en s der Wlederk&uer. Wise. Arch. Landw. Abt. B: Tlererna.hr. u. Tierzucht. 7:295-304.
Ann!son, E.'F. 1954a. Some observations on volatile fatty acids in the sheep's rumen. Biochem. J. 57:400-405.
. 1954b. Studies on the volatile fatty acids of sheep blood with special reference to formic acid. Biochem. J. 58:670-680.
, K. J. Hill, and D. Lewis. 1957. Studies on the portal blood of sheep. II. Absorption of volatile fatty acids from the rumen of the sheep• Biochem. J. 66: 592- 599.
Armstrong, D. G., K. L. Blaxter, and N. M. Graham. 1957. The heat increments of mixtures of steam-volatile fatty acids in fasting sheep. Brit. J. Nutr. 11:392-408.
, , and . 1961. The heat Increment in fasting sheep of acetic acid partially neutralized with sodium hydroxide. Brit. J. Nutr. 15:169-175.
Ash, R. W. and A. Dobson. 1961. Effect of replacement of normal rumen contents with saline on the absorption of volatile fatty acids. (Unpublished) Original not available ; cited in Dobson, A. 1961. Absorption from the rumen. p. 73. In Lewis, D., ed. Digestive physiology and nutrition of the ruminant. pp. 68-75. Butterworths and Co., Ltd. London.
and R. N. B. Kay. 1959. Stimulation and inhibition of reticulum contractions and parotid secretion from the forestomach of conscious sheep. J. Physiol. 149: 43-57.
Bahner, F. 1952. Die Reaction des Acetone mit Sslicylalde-hyd. Biochemische Zeltechr. 323:327—337.
Barcroft, J., R. A. McAnally, and A. T. Philllpson. 1944a. Absorption of volatile fatty acids from the alimentary tract of the sheep and other animals. J. Exptl. Biol. 20:120-129-

169
, , and . 1944b. The absorption of sodium ortho-iodo-hippurate from the rumen of lambs. J. Exptl. Biol. 20:152-134.
Becker, R. B., P. T. D. Arnold, and S. P. Marshall. 1951. Development of the bovine stomach during fetal life. J. Dairy Sci. 34:329-332.
Blaxter, X. L., L. K. Hutcheson, J. M• Robertson, and A. L. Wilson. 19 52. The influence of diet on the development of the alimentary tract of the calf. (Abstract) Brit. J. Nutr. 6:i-ii.
Brown, R• E., G. L. Davis, J. R. Staubus, and ¥. 0. Kelson. 1960. Production and absorption of volatile fatty acids in the perfused rumen. J. Dairy Sci. 43 :178c-1795.
Brownlee, A. 1956. The development of rumen papillae in cattle fed on different diets. Brit. Vet. J. 112: 369-375.
Clark, R. and J• R. Maian. 1956. Alterations in the blood sugar and ketone levels caused by dosing acetate, propionate and butyrate into the rumen of the sheep. Onderstepoort J. Vet. Res. 27:101-109.
Colin, G. 1873 • Traité' de physiologie comparée des animaux. 2nd ed- Vol. 2. Librairie J.-B. Eailliêre et Fils. Paris, France.
Conrad, H. R. , J. Yj. Hibbs, ana II. Frank. 1958e. High roughage system for raising dairy calves based on early development of rumen function. IX. Effect of rumen inoculations and chlortetracycline on rumen function of calves fed high roughage pellets. J. Dairy Sci. 41: 1248-1261.
, , and W. D. Pound en. 19 54. The influence of the ration and early rumen development on the volatile fatty acid content of rumen juice and blood sugar levels in high roughage fed calves. (Abstract) J. Dairy Sci. 37:664.
, , and . 1955 . Absorption of rumen volatile fatty acids from the forestomach of young dairy calves fed high roughage rations. J. Dairy Sci. 39: 97-98.
170
, H. R. Smith, H. J. Vandersall, W. D. Pounden, and J. W. Hlbbs. 1958b. Estimating gastrosplenic blood flow and volatile fatty acid absorption from the fore-stomachs of calves. J. Dairy Sci. 41:1094-1099.
Corbett, J. L., J. F. D. Greenhalgh, P. E. Gwynn, and D. Walker. 1958. Excretion of chromium sesquioxlde and polyethyleneglycol by dairy cows. Brit. J. Nutr. 12:266-276.
Danielli, J. F., M. W. S. Hitchcock, R. A. Marshall, and A. T. Phlllipson. 194 5. The mechanism of absorption from the rumen as exemplified by the behavior of acetic, propionic and butyric acids. J. Exptl. Biol. 22:75-84.
Davey, D. G. 1936. Notes on the osmotic pressure of the contents of the stomach compartments of the sheep. J. Agri. Sci. 26:328-330.
Dobson, A. 1959. Active transport through the epithelium of the retlculo-rumen sac. J. Physiol. 146:235-251.
. 1961. Absorption from the rumen. In Lewis, D., ed. Digestive physiology and nutrition of the ruminant, pp. 68-75. Butterworths and Co., Ltd. London.
and A. T. Phlllipson. 1956. The Influence of the contents of the rumen and of adrenaline upon its blood supply. J. Physiol. 133:76P-77P.
and . 1958. The absorption of chloride ions from the retlculo-rumen sac. J. Physiol. 140: 94-104.
Dobson, M. J., W. C. B. Brown, A. Dobson, and A. T. Phillip-son. 1956. A histological study of the organization of the rumen epithelium of sheep. Quart. J. Exptl. Physiol. 41:247-253.
Duncan, D. B. 1955. Multiple range and multiple F tests. Biometrics. 11:1-42.
Ellenberger, W. 1881. Zur Anatomle und Physiologie des dritten Magens der Wlederkâuer. Arch. wlss. u. prakt. Tierheilk. 7:17-58.
Flatt, W. P., R. G. Warner, and J. K. Loosll. 1956. Absorption of volatile fatty acids from the retlculo-rumen of young dairy calves. (Abstract) J. Dairy Sci. 39:928.

171
, , and . 1958. Influence of purified materials on the development of the ruminant stomach. J. Dairy Sci. 41:1593-1600.
Gmelner, Initials,,not given . 1911. Die klinische Unter-suchung der Magen der Wiederk&uer. MÙnch. tlerârztl. Wochenschr. 55:729-735.
Godfrey, N. W. 1961a. The functional development of the calf. I. Growth of the stomach of the calf. J. Agrl. Sci. 57:173-175.
. 1961b. The functional development of the calf. II. Development of rumen function in the calf. J. Agrl. Sci. 57:177-183.
Gray, F. V. 1947. The absorption of volatile fatty acids from the rumen. J. Exptl. Biol. 24:1-10.
. 1948. The absorption of volatile fatty acids from the rumen. II. The influence of pH on absorption. J. Exptl. Biol. 25:135-144.
, G. B. Jones, and A. F. Pilgrim. 1960. The rates of production of volatile fatty acids in the rumen. Austral. J. Agrl. Res. 11:383-388.
and A. F. Pilgrim. 1951. Fermentation in the rumen of the sheep. II. The production and absorption of volatile fatty acids during fermentation of wheaten hay and lucerne hay in the rumen. J. Exptl. Biol. 28:83-90.
, , and R. A. Weller. 1951. Fermentation in the rumen of the sheep. I. The production of volatile fatty acids and methane during the fermentation of wheaten hay and lucerne hay in vitro by micro-organisms from the rumen. J. Exptl. Biol. 28: 74-82.
Greenberg, L. A. and D. Lester. 1944. A micromethod for the determination of acetone and ketone bodies. J. Biological Chem. 154:177-190.
Harrison, H. N., R. G. Warner, E. G. Sander, and J. K. Loosli. 1960. Changes in the tissue and volume of the stomachs of calves following the removal of dry feed or consumption of inert bulk. J. Dairy Sci.. 43:1301-1312.
Hauser, H. 1929. Uber ^nteressante Erscheinungen am Eplthel der Wlederkâuervormagen. Zeitschr. mlkroskop.-anatomische Forsch. 17:533-612»

172
Henriksson, K. B. and R. E. Habel. 1961. The morphology and sulfhydryl and disulfide reactions of the epithelium of the bovine forestomach during post-natal development. Anatomical Record. 139:499-507.
Ruber, J. T., N. L. Jacobson, A. D. McGllliard, and R. S. Allen. 1961. Utilization of carbohydrates introduced directly into the omaso-abomasal area of the stomach of cattle of various ages. J. Dairy Sci. 44:321-330.
Hungate, R. E., R. A. Mah, and M. Simensen. 1961. Rates of production of individual volatile fatty acids in the rumen of lactating cows. Appl. Microbiol. 9:554-561.
Hydën, S. 1955a. A turbidimetric method for the determination of higher polyethylene glycols in biological materials. Kungl. Lantbrukshogsk. Ann. 22:139-145.
. 1955b. The recovery of polyethylene glycol after passage through the digestive tract. Kungl. Lantbrukshogsk. Ann. 22:411-424.
. 1958. Description of two methods for the collection of saliva in sheep and goats. Kungl. Lantbrukshogsk. Ann. 24:55-75.
. 1961a. Determination of the amount of fluid in the reticulo-rumen of the sheep and its rate of passage to the omasum. Kungl. Lantbrukshogsk. Ann. 27:51-79.
• 1961b. Observations on the absorption of inorganic ions from the reticulo-rumen of the sheep. Kungl. Lantbrukshogsk. Ann. 27:273-285.
Jacobson, N. L., A. D. McGilliard, J. T. Ruber, and J. D. Sutton. 1960. Functional development of the digestive system of the calf. Cornell Nutr. Conf. for Feed Manuf. Proc. 1960:24-29.
Jensen, R., J. C. Flint, R. H. Udall, A. W. Deem, and C. L. Seger. 1958. Parakeratosis of the rumens of lambs fattened on pelleted feed. Amer. J. Vet. Res. 19: 277-282.
Johnson, R. B. 1951. The relative rates of absorption of the volatile acids from the rumen and their relationship to ketosis. Cornell Veterinarian. 41:115-121.

173
Keeler, E. h., M. Ronnlng, and G. B. Knodt. 1951. Some physical characteristics of the tissue and contents of the rumen, abomasum and intestines in male Holstein calves of various ages. J. Animal Sci. 10:969-974.
Kiddle, P., R. A. Marshall, and A. T. Phillipson. 1951. A comparison of the mixtures of acetic, propionic and butyric acids in the rumen and in the blood leaving the rumen. J. Physiol. 113:207-217.
Knox, K. L. 1960. In vitro metabolism of short-chain fatty acids in bovine rumen epithelial tissue. Unpublished M. S. Thesis. Library, Colorado State University. Fort Collins,. Colorado.
, E. E. Flamboe, R. M. Johnson, and G. W. Ward. 1960. In vitro metabolism of short-chain fatty acids in bovine rumen epithelial tissue. (Abstract) Federation Proc. 19:323.
Krebs, H. A. 1961. The physiological role of the ketone bodies. Blochem. J. 80:225-233.
Kronfeld, D. C., L. A. Campbell, L. L. Hooper, and S. J. Galllgan. 1959. Acidosis and plasma glucose in sheep given butyrate. Amer. J. Vet. Res. 20:430-433.
Lambert, p. S. 1948. The development of the stomach in the ruminant. Brit. Vet. J. 104:302-310.
Lewis, F. T. 1915. The comparative embryology of the mammalian stomach. Anatomical Record. 9:102-103.
Llndhe", B. and I. Sperber. 1959. A note on the structure of rumen epithelium. Kungl. Lantbrukshogsk. Ann. 25:321-325.
Lindsay, D. B. 1961. Endocrine control of metabolism in ruminants. In Lewis, D., ed. Digestive physiology and nutrition of the ruminant, pp. 235-241. Butterworths and Co., Ltd. London.
Marshall, S. P. and R. B. Becker. 1962. Effect of roughages on the calf's stomach development. (Abstract) J. Dairy Sci. 45:292.
Martin, W. G., H. A. Ramsey, G. Matrone, and G. H. Wise. 1959. Responses of young calves to a diet containing salts of volatile fatty acids. J. Dairy Sci. 42: 1377-1386.

174
Masson, M. J. and A. T. Phillipson. 1951. The absorption of acetate, propionate and butyrate from the rumen of sheep. J. Physiol. 113:189-206.
Mayes, P. A. and W. Robson. 1957. The determination of ketone bodies. Blochem. J. 67:11-15.
McAnally, R. A. 1944. The determination of total volatile acids in blood. J. Exptl. Biol. 20:130-131.
McCarthy, R. D. and E. M. Kesler. 1956. Relation between age of calf, blood glucose, blood and rumen levels of volatile fatty acids, and in vitro cellulose digestion. J. Dairy Sci. 39:1280-1287.
, J. C. Shaw, J. L. McCarthy, S. Lakshmanan, and J. B. Holter. 1958. Production and absorption of organic acids by the perfused goat rumen. Soc. Exptl. Biol. Med. Proc• 99:556-559.
McClendon, J. F. 1944. Microdetermlnation of volatile fatty acids in blood. J. Biological Chem. 154:357-360.
McMilliard, A. D. 1962. Saliva secretion in the young bovine. (Unpublished data.) Dairy Science, Iowa State University of Science and Technology. Ames, Iowa.
McManus, W. R. 1959. Relationship between pH and volatile fatty acid and diversion of saliva from the actively fermenting rumen of sheep. Nature. 184:1572r1573.
Parthasarathy, M. J. and A. T. phillipson. 1953. The movement of potassium, sodium, chloride and water across the rumen epithelium of the sheep. J. Physiol. 121:452-469.
Pennington, R. J. 1952. The metabolism of short-chain fatty acids in the sheep. I. Fatty acid utilization and ketone body production by rumen epithelium and other tissues. Blochem. J. 51:251-258.
. 1954. The metabolism of short-chain fatty acids in the sheep. II. Further studies with rumen epithelium. Blochem. J. 56:410-416.
and W. H. Pfander. 1957. The metabolism of short-chain fatty acids in the sheep. V. Some interrelationships in the metabolism of fatty acids and glucose by sheep-rumen epithelial tissue. Blochem. J. 65:109-111.
t !
175
and T. M. Sutherland. 1956a. Ketone-body production from various substrates by sheep-rumen epithelium. Blochem. J. 6-3:353-361.
and . 1956b. The metabolism of short-chain fatty acids in the sheep• IV. The pathway of propionate metabolism in rumen epithelial tissue. Blochem. J. 63: 618-628.
Pernkopf, E. 1931. Die Entwicklung des Vorderdarmes, lnsbesondere des Magens der Wlederk&uer. Zeltschr. Anatomle u- Entwicklungsgesch. 94:490-622.
Pfander, W. H. and A. T. Phillipson. 1953. The rates of absorption of acetic, propionic and n-butyric acids. J. Physiol. 122:102-110.
Phillipson, A. T. 1942. The fluctuation of pH and organic acids in the rumen of the sheep. J. Exptl. Biol. 19: 186-198.
• 1953-1954. (Absorption from the rumen of sheep.) (Unpublished report.) Original not available; cited in Singleton, A. G. 1953. Ruminant digestion. Nature. 172:835.
and R. A. McAnally. 1942. Studies on the fate of carbohydrates in the rumen of the sheep. J. Exptl. Biol. 19:199-214.
Rankin, A. D. 1942. Studies on absorption from the rumen. (Abstract) Federation Proc. 1:70.
Raun, N. S. 1961. Dietary factors affecting volatile fatty acid production in the rumen. Unpublished Ph. D. Thesis. Library, Iowa State University of Science and Technology. Ames, Iowa.
Reid, R. L. 1950. Studies on the carbohydrate metabolism of sheep. II. The uptake by the tissues of glucose and acetic acid from the peripheral circulation. Austral. J. Agri. Res. 1:338-354.
. 1953. Studies on the carbohydrate metabolism of sheep. VI. Interrelationships between changes in the distribution and levels of glucose and in the levels of volatile fatty acid In the blood of lambs. Austral. J. Agri. Res. 4:213-223.

176
1960. The determination of ketone bodies in blood. Analyst. 85:265-271.
Rhodes, R. W. 1961. Influence of nutrient additions, physical form of the ration, and interval of feeding on performance of lambs. Unpublished Ph. D. Thesis. Library, Iowa State University of Science and Technology. Ames, Iowa.
Sander, E, G., R. G. Warner, H. N. Harrison, and J. K. Loosll. 1959. The stimulatory effect of sodium butyrate and sodium propionate on the development of rumen mucosa in the young calf. J. Dairy Sci. 42:1600-1605.
Schambye, P. 1951. Volatile acids and glucose in portal blood of sheep. III. The influence of orally administered glucose.. Nord. Vet-Med. 3:1003-1014.
Seto, K., T. Tsuda, K. Ambo, and M. Umezu. 1957. The metabolism of the lower fatty acids in the mucous membrane of the rumen of ruminants. III. The oxidation of the lower fatty acids in the rumen mucous membrane. (Translated title.) Seikagaku. 29:17-21. Original not available; abstracted in Chemical Abstracts. 54: 7851. 1960.
, , and M. Umezu. 1955. The mechanism of the ketone bodies production with rumen epithelium. I. The ketone bodies production from volatile fatty acids with rumen epithelium and the Influence of substrates concerned with the citric acid cycle on their production. Tohoku J. Agr. Res. 6:91-98.
' , , and . 1956. The metabolism of volatile fatty acids in rumen epithelium. II. (Translated title.) Seikagaku. 28:143-146. Original available but not translated; abstracted in Chemical Abstracts. 53:19101. 1959.
and M. Umezu. 1959. The metabolism of volatile fatty acids with rumen epithelium. IV. On the mode of presence of T.C.A. cycle in rumen epithelium. Tohoku J. Agri. Res. 9:151-158.
Sisson, S. and J. D. Grossman. 1953. The anatomy of domestic animals. 4th ed. W. B. Saunders Co. Philadelphia.
Smith, R. H. 1959. The development and function of the rumen in milk-fed calves. J. Agri. Sci. 52:72-78.

177
• 1960. The rumen In milk-fed calves. National Inatit. for Res. in Dairying, Shinfield, England. Report, 1960.
Smyth, D. H. and G. B. Taylor. 1958. Intestinal transfer of short-chain fatty acids in vitro. J. Physiol. 141: 7-3-80.
Somogyi, k. 1945. Determination of blood sugar. J. Biological Chem. 160:69-73.
. 1952. Notes on sugar determination. J. Biological Chem. 195:19-23.
Sperber, I., S. Hydén, and J. Ekman. 1953. The use of polyethylene glycol as a reference substance in the study of ruminant digestion. Kungl. Lantbrukshogsk. Ann. 20:337-344.
Tamete, H. 1957. The anatomical studies of the stomach of the goat. II. The post-natal changes in the capacities and the relative sizes of the four divisions of the stomach. Tohoku J. Agri. Res. 8:65-77.
, A. D. he Gil Hard, K. L. Jacobson, and R. Getty. 1962a. The effect of various dietaries on the anatomical development of the stomach of the calf. To be published in J. Dairy Sci. ca. 1962.
, , , and . 1962b. The effect of various diets on the histological development of the stomach in the calf. To be published in Tohoku J. Agri. Res. ca. 1962.
Thompson, G. B., L. D. Kintner, and V,r. H. Pfander. 1958. Some effects of ration preparation on alterations of the rumen mucous membrane. (Abstract) J. Animal Sci. 17:1220.
Trautmann, A. 1932. Beitrage zur Physiologie des Wiederkâuer-magens. (|I. Der Einfluss der Nahrung auf die Ausbildung der Vormagen belm jugendlichen Wiederkauer. Wise. Arch. Landw. Abt. B: Tierernahr u. Tierzucht. 9:400-420.
, 1933. „ Beitrage zur Physiologie des||Wiederkauermag-ens. VI. Uber die Resorption im Widerekauermagen. Wlss. Arch. Landw. Abt. B: Tierernahr u. Tierzucht. 9:178-193.
and J. Fiebiger. 1957. Fundamentals of the histology of domestic animals. Translated and revised from the eighth and ninth German edition, 1949, by R. E. Habel and E. L. Biberstein. Comstock Publishing Associates. Ithaca, New York.

178
and J. Schmltt. 1933. Beitrâge zur Physiologie des Wlederkâuermagens. IV. uber den regelmassleen Ruckfluss von Milch aus dem Labmagen In die Vormlgen belm jugendllchen Wlederkluer. Wlss. Arch. Landw. Abt. B: Tierernahr. u. Tierzucht. 9:11-18.
Tsuda, T. 1957a. Studies on the absorption from the rumen. I. Surgical operation of forming the miniature rumen. Tohoku J. Agri. Res. 7:231-239.
. 1957b. Studies on the absorption from the rumen. II. Absorption of several organic substances from the miniature rumen of the goat. Tohoku J. Agri. Res. 7:241-256.
Turner, A. W. and V. E. Hodgetts. 1955a. Buffer systems in the rumen of the sheep. I. pH and bicarbonate concentration in relationship to pGOo. Austral. J. Agri. Res. 6:115-124.
and . 1955b. Buffer systems In the rumen of the sheep. II. Buffering properties in relationship to composition. Austral. J. Agri. Res. 6:125-144.
Umbrelt, W. W., R. H. Burris, and J. F. Stauffer. 1945. Manometrlc techniques and related methods for the study of tissue metabolism. Burgess Publishing Co. Minneapolis, Minn.
Vink, Initials not given . 1879. Wiederkauen des Rindviehs. Original not available;cited in Trautmann, A. 1933. Beitrage zur Physiologie des Wlederkâuermagens. VI. Uber die Resorption In Wiederk&uermagen. Wlss. Arch. Landw. Abt. B: Tierernahr. u. Tierzucht. 9:180.
Wallace, L. R. 1948. The growth of lambs before and after birth in relation to the level of nutrition. J. Agri. Sci. 38;243-302.
Wardrop, I. D. 1961a. Some preliminary observations on the histological development of the forestomachs of the lamb. I. Histological changes due to age in the period from 46 days of foetal life to 77 days of post-natal life. J. Agri. Sci. 57:335-341.
. 1961b. Some preliminary observations__on the histological development of the forestomachs of the lamb. II. The effects of diet on the histological development of the forestomachs of the lamb during post-natal life. J. Agri. Sci. 57:343-346.
179
and J. B. Coombe. 1960. The post-natal growth of the visceral organs of the lamb. I. The growth of the visceral organs of the grazing lamb from birth to sixteen weeks of age. J. Agri. Sci. 54:140-143.
and . 1961. The development of rumen function in the lamb. Austral. J. Agri. Res. 12:661-680.
Warner, E. D. 1958. The organogenesis and early histogenesis of the bovine stomach. Amer. J. Anat. 102:33-63.
Warner, R. G., W. P. Flatt, and J. K. Loo s11. 1956. Dietary factors influencing the development of the ruminant stomach. J. Agri. Food Chem. 4:788-792.
Wilkens, Initials not given . 1872. Untersuchungen tiber den Magen der wiederkHuenden Haustlere. Verlag Wiegandt u. Hempel. Berlin. Original not available ; cited in Trautma n, A. 1933. Beitr&ge zur Physiologie des Wlederkauermagens. VI. Uber die Resorption im Wieder-kâuermagen. Wlss. Arch. Landw. Abt. B: Tlerern6.hr. u. Tierzucht. 9:180.
Woodman, H. E. 1930. The role of cellulose In nutrition. Biological Rev. 1:273-295.
and R. E. Evans. 1938. The mechanism of cellulose digestion In the ruminant organism. IV. Further observations from in vitro studies of the behaviour of rumen bacteria and their bearing on the problem of the nutritive value of cellulose. J. Agri. Sci. 28:43-63.

180
ACKNOWLEDGEMENTS
The author Is sincerely grateful to Dr. N. L. Jacobson
for his stimulating interest and guidance throughout the
project; he is especially appreciative of the critical evalu
ation of the experiments and of this thesis.
The constant advice, aid and interest of Dr. A. D.
McGilllard have been sincerely appreciated. The author is
particularly grateful for his original approach to many of
the problems arising during the course of this study.
The author greatly appreciates the advice of Dr. R. S.
Allen in developing the analytical techniques.
The patient and skilled laboratory assistance of Mrs.
Marlene Richard has been of the greatest value.
The author is grateful to many others for their assist
ance: Mr. Joseph Rust for supervising the care of the
experimental animals; Dr. R. M. Melampy for the use of the
Dubnoff Incubator-Shaker; Dr. W. Burroughs for the use of
the manometry equipment; Dr. B. W. Kingrey and Dr. F. C.
Neal for their skillful establishment of rumen fistulas In
very young calves; and the staff of the University Meat
Laboratory for their cooperation in the collection of rumen
epithelium.
The author is sincerely grateful to his wife, Eva, for
her continued encouragement and patience, and for typing the
original draft of this thesis.

181
The studies were supported in part by Grant H-4969 from
the Department of Health, Education and Welfare, National
Institutes of Health, Bethesda, Maryland ; this aid is grate
fully acknowledged.
The donation of the heparin by the American Cynamld Co.,
Agricultural Division, Princeton, New Jersey, through the
courtesy of Dr. Ralph F. Elliott, and of some of the poly
ethylene glycol by Dow Chemical Co., Midland, Michigan, are
appreciated.

182
V
APPENDIX

Table 27. VFA and glucose concentration in peripheral blood following intra-ruminal introduction of VFA solutions
Trial and calf no.: Treatment :
L : 4743
Acetate —2 g./kg. VFAaGluco se
2 : 4743
Propionate 2 g-Ag.
3 : 4766
Acetate & K-Ag.
4 : 4766
Acetate £ K'Afi-
5 : 4743
Butyrate 2 g-Ag»
6 : 4795
Acetate 2 g. Aft-
VFA Glucose VFA Glucose VFA Glucose VFA Glucose VFA Glucose
min. after admin. mg./100 ml.
0 4.2 41 4.5 54 4.7 — 3.1 56 5.5 55 4.4 91
5 — — — — — — 5.2 55 11.0 53 7.9 87 10 — — 6.2 61 10.6 44 6.6 54 8.6 48 9.1 92 15 — — — — — — 5.9 54 6.9 43 8.0 99
20 w—» MB 4.3 51 9.0 51 — — — — — — — — — —
30 11.4 44 5.1 43 9.1 43 4.4 54 6.2 36 10.9 87 60 7.6 42 4.4 43 7.7 50 — — — — 5.7 16 12.2 101 90 6.7 45 4.6 49. 6.9 52 — — — — — — •' « •• — — — —
120 5.7 41 4.7 51 6.2 56 — — 5.8 28 6.1 112
180 5.3 43 4.6 50 6.4 49 240 — — — — — — — — — — 58 — — — — 5.2 33 8.4 91 300 5.6 38 4.2 51 5.8 47 — — — — — — ••• - • — — — —
480 5.1 43 — — 57 5.5 44 — — — —
aAs milligrams of acetic acid per 100 ml. of blood.

Table 27. (Continued)
Trial and calf no.: 7 : 4795 8 : 4743 9 : 4743 10 : 4743 11 : 4795 Treatment: Acetate Acetate Propionate Butyrate Acetate
Q'% g"/kg. 1 g-/k#. 1.17 g./kg. 1.34 g./kg. 1 g./kg.
VFA Glucose VFA Glucose VFA Glucose VFA Glucose VFA Glucose
mln. after admin. : mg. 100 ml.
0 2 1/2 5 10 15
20 30 60 90 120
180 240 300 480
4.9 63 5.2 45 6.0 43 6.2 43 4.9 60
5.3 69 9.2 47 10.3 44 8.0 47 5.5 68 4.6 73 11.3 44 9.3 41 7.6 41 5.5 67 5.2 71 10.4 44 8.7 37 7.0 36 5. 5 68
4.7 71 8.0 45 6.3 43 5.2 32 5.7 70 4.9 70 6.5 45 5.4 49 5.2 27 5.8 75
4.6 62 6.2 42 5.0 48 5.2 34 5.6 67
4.8 74 5.6 40 4.9 52 4.9 38 5.5 71 — —
H CD

Table 28. Results of trials on development of procedures with flstulated calves (calf 4799)
Trial no.: Treatment : Acetate
1 g./kg.
2 Acetate 2 g'Ag.
3 4 Acetate Acetate 0.3 g./kg. 0.3 g./kg.
Blood? Blood Rumen Rumen® Blood*5 glu- Rumen Rumen Blood glu- Rumen Rumen Rumen Rumen pH VFA VFA cose pH VFA VFA cose pH VFA pH VFA
min. after mg./ mg./ admin. — mg ./100 ml — mg. /100 ml. — 100 ml. 100 ml
0 6.6 3288 5.65 76 6.6 6241 5.09 83 6.7 939 6.6 975 5 6.4 3240 5.51 76 6.8 6167 8.73 84 6.8 894 6 .9 957 10 6.4 3242 6.16 85 6.9 5968 13.53 86 15 6.5 3231 6.25 84 6.9 5680 14.95 81
30 6.4 3068 6.07 88 7.1 5225 18.40 86 7.2 865 7.1 922 60 6.4 3005 5.67 74 7.2 4628 22.13 76 7.4 818 7.3 902 120 6.9 2522 5.23 73 7.4 3872 10.62 91 7.6 721 7.4 892 240 7.2 1848 5.06 66 7.6 3163 5.90 96 7.4 706 7.4 891
aRumen VFA concentration adjusted for PEG. Recorded as milligrams of acetic acid per 100 ml. of solution.
Milligrams of acetic acid per 100 ml. of blood.
0Milligrams of glucose per 100 ml. of blood.

Table 28. (Continued)
Trial no. Treatment :
Acetate 0.3 g./kg. Water Rumen Rumen Rumen Rumen Rumen pH VFA pH VFA pH
15
Acetate in
16 Acetate in
phosphate buffer; phosphate buffer; saliva excluded; saliva excluded 10 N H3PO4 added
Rumen VFA
Rumen pH
Rumen VFA
17 Acetate in
phosphate buffer
Rumen pH
Rumen VFA
min. after mg./ mg./ mg./ mg./ mg./ admin. 100 ml. 100 ml. 100 ml. 100 ml. 100 m]
0 6.6 918 6.9 6 6.4 706 6.5 704 6.4 715 5 7.6 904 7.8 11 6.7 698 6.8 690 6.6 703 10 15
30 8.0 782 7.7 12 6.8 627 6.4 633 7.2 639 60 8.1 782 7.9 16 7.0 548 6.4 574 7.5 608 120 7.9 726 7.9 25 6.9 386 6.5 394 7.9 505 180 6.3 272 8.0 446 240 8.1 553 7.9 74 7.0 158 6.5 181 8.0 409

Table 29. pH of rumen contents during attempts to control rumen pH (calf 4799)
Trial no. : Treatment :
7a 7b 8a 8b 8c 8d Acetic acid Acetic acid Strained Strained in phosphate Acetic acid in phosphate rumen rumen Phosphate
buffer in water buffer juice juice buffer
min. after admin.
0 6.6 6.8 6.5 6.7 6.4 6.8 5 6.9 7.2 6.8 6.8 7.4 7.1 10 \ 15 7.2 7.6 7.2 7.3 7.4 7.3 20 30 7.3 7.8 7.4 7.8 7.6 7.4 45 50 7.9 60 7.8 7.7 8.0 7.8 7.7 SO 12u 135 150 165 180 210 240 255 310 375 430
7.8

Table 29. (Continued)
Trial no.: 8e 8f eg 9 10 Treatment: Acetic acid Acetic acid Acetic acid Acetic acid in Acetic acid in
in in phosphate in Krebs-Rlnger- Krebs-Ringer-phosphate bicarbonate bicarbonate phosphate; phosphate; buffer buffer buffer gassed with COg saliva excluded
mln. after ml. COg admin. per min.a
0 6.5 6.7 6.9 6.7 500 6.7 5 6.9 6.9 7.5 6.9 7.1 10 15 7.0 7.3 7.6 7.1 7«2 20 30 7.3 7.5 7.8 7.4 7.4 45 7.4 50 60 7.6 7.7 7.9 7.5 7.5 90 7.6 1400 120 7.0 7.8 135 7.0 150 7.2 0 165 7.4 180 210 240 255 310 375 430
aFlow rate of carbon dioxide is shown only at times when the rate was changed.

Table 29. (Continued)
Trial no.: 11 12 13 14 Treatment: As Trial 10.
As Trial 10, but 10 N H%P0, but gassed added
As Trial 10 As Trial 10 with COg periodically
min. after ml. COg ml. admin. per min. a h3p04
0 6.8 6.6 6.7 500 6.7 5 7.1 6.9 6.8 6.9 10 7.0 5 15 7.2 7.0 6.9 7.1 20 6.9 5 30 7.4 7.1 7.0 6.7 45 7.2 7.1 6.8 50 60 7.4 7.2 7.2 730 6.9 4 90 7.3 7.4 7.0 6.8 3.5 120 7.3 7.4 7.0 1400 6.8 5 135 6.9 6.6 150 7.3 7.5 7.0 0. 6.7 165 7.2 1440b 6.9 180 7.5 6 .9 6.8 6 210 7.4 7.5 240 7.4 7.6° 255 7.7 310 7.8 375 7.9 -
430 7.9
Flow at 1440 ml./min. for 2 mln. periods every 10 min.
0Saliva allowed to enter rumen after 240 min.

190
Table 30. Descriptive data for calves used in Experiments 1 to 5&
Date of Body Rumen contents*3 Calf birth Diet Age weight Vol. pH
4880 10:22:59 MHG
4906 12:19:59 M
MG
7035 3:25:60 MHG
wk kg- liters
1 40 0.52 6.7 4 1/2 47 0.69 7.6 8 1/2 62 2.74 6.5 13 1/2 85 3.82 7.3 16
1/2 97 3.65 7.2
17 103 0.22° 7.8 18 108 4.75 7.0 20 126 7.30 7.5 21 134 6.10 7.3 22 146 5.70 7.0
1 1/2 46 0.82 7.3 4 49 0.65 6.7 8 67 0.50 7.1 13 93 0.32 5.3 16 112 Trace0 7.7 17 120 0.51 • 5.1 18 117 1.20 6.2 21 123 0.10 7.1 23 134 3.37 7.1 27 150 7.65 — —
34 198 Trace0 — —
36 199 8.50 6.4
1 1/2 47 Trace 4 1/2 53 1.39 6.5 8 1/2 64 2.42 5.8 13 1/2 88 4.50 6.9 16 100 5.90 6.8 18 116 7.20 7.5 21 145 10.50 7.3
aAll calves were male Holsteins.
Rumen contents were removed mid-morning on the day of the trial. Solid feed was removed from the pens of MHG calves 18-24 hrs. prior to these determinations.
Cannula lost sometime during the night and rumen contents spilled.

191
Table 30. (Continued)
Date of Calf birth Diet Age
Body Rumen contents weight Vol. pH
4938 4:2:60 M
4933 2:18:60 MHG
wk • kg- liters
1 1/2 47 0.63 7.4 4 1/2 53 1.22 7.3 8 1/2 68 0.70 7.3 13 1/2 100 1.53 7.2 17 124 ... 0.04 7,9 19 134 1.85 7.5 21 138 Trace — —
27 156 1.0*0 7.6 34 164 0.28 4.9
17 99 2.50 6.8 18 100 4.62 7.1 19 106 5.21 7.2 21 120 4.95 6.6 26 138 6.50 6.9

Table 31. Results of Experiment 1; calf 4880 - MHG
Age (wk.): Day :
1 4 8 13 Age (wk.): Day : 1 2 1 2 1 2a 1 2
Adjusted VFA gone. (mg./100 ml.)
Min. after admin. 0 668 655 689 686 662 676 702 696 5 649 671 669 666 642 664 644 676 30 617 662 593 591 474 573 442 605 60 612 656 483 518 329 472 228 552 120 602 607 203 223 107 355 25 429 180 571 551 29 181 40 263 10 273 240 557 505 13 104 36 242 c 101
Vol- of sol.(liters): Introduced 0. 80 0.80 0.94 0.94 1. 23 1. 23 1. 71 1. 71 Passed down tracta 0. 67 0.72 0.70 0.99 1. 09 1. 57 1. 75 1. 74 Remaining at 4 hr. 0. 21 0.12 Trace Trace 0. 02 0. 72 0. 00 0. 10
Acetic acid: Introduced (g.) 5. 34 5.23 6.50 6.48 8. 17 8. 34 12. 00 11. 90 Absorbed (g«Te 0. 63 0. 55 4.49 3.36 5. 82 3. 43 8. 49 5. 54
Absorption (mg./kg. body wt./hr.) 40 3.4 23.8 17.9 23. 4 13. 4 27. 5 16. 3 pH control: 10 N H3P04 (ml.) 0 1.0 11.5 5.0 35. 0 18. 0 40. 0 14. 0
aSaliva entered the rumen due to a faulty catheter.
Acetic acid concentration adjusted for changes in PEG concentration. See p. 71.
cRumen completely empty.
•See p. 82 for method of calculation.
eSee p. 82 for method of calculation.

Table 31. (Continued) calf 4906 - M
Age (wk.): Day:
Adjusted VFA conc. (mg./lOO ml.) kin. after admin.
0 673 667 702 5 683 713 683 30 671 672 681 60 657 661 660 120 626 647 640 180 605 633 597 240 596 607 555
Vol. of solution (liters): Introduced Passed down tract Remaining at 4 hr
Acetic acid: Introduced (g.) Absorbed (g.)
Absorption (mg./kg. body wt./hr.) pH control: 10 N H3P04 (ml.)
0.92 0.92 0.98 0.57 0.32 0.59 0.40 0.65 0.43
6.22 6.16 6.90 0.50 0.42 1.04
2.7 2.3 5.3
0.0 0.7 1.0
8 13 2 18 12
706 691 683 674 629 600 562
0.98 0.61 0.46
6.95 1.04
5.3
0.7
696 703 689 674 674 616 586
1.33 0.68 0.70
9.29 1.04
3.9
2 . 0
689 687 662 667 626 609 587
1.33 0.64 0.70
9.19 1.06
4 .0
1.0
692 697 688 681 654 617 575
1.85 1.27 0.68
12.80 1.36
3.6
3.0
692 692 684 678 650 629 589
1.85 0.76 1.19
12.80 1.49
4.0
2 .0

Table 31. (Continued) calf 7035 - MHG
Age (wk.) Day:
Adjusted VFA conc. (mg./lOO ml.)
Min. after admin. 0 5 30 60 90 120 150 180
Vol. of solution (liters): Introduced Passed down tract Remaining at 3 hr.
Acetic acid: Introduced (g.) Absorbed (g.)
Absorption (mg./kg. body wt./hr.) pH control: 10 N H3P04 (ml.) 0 0 6.0
690 687 701 666 688 679 652 678 664 639 665 626 615 646 602 605 626 519 576 604 489 561 594 451
1. 13 1. 13 1 .46 0. 61 0. 38 0 .69 0. 50 0. 78 0 .78
7. 80 7. 76 10 .24 1. 11 0. 86 28 .5
7. 9 6. 2 17 .9
13 8 2 12 1 2
696 689 689 667 674 635 657 589 632 550 613 512 596 475 575 434
1.44 2.08 0.80 0.74 0.70 1.36
9.99 14.33 1.26 4.55
7.9 23.8
0 0
671 679 637 666 501 638 312 588 164 557 75 507 25 468 11 425
.08 3 .45 3 .45
.94 0 .74 1 .71
.30 1 .48 1 .80
.39 23 .15 23 .43
.68 20 .87 6 .80
.9. 79 .1 25 .8
65 14
692 697 662 636 598 581 552 530
2 0 1
14 ' 2
13
0

Table 31. (Continued) calf 4938 - M
Age ( wk. ) : 1 4 8 13 Day: 12121212
Adjusted VFA conc. (mg./lOO ml.)
Min. after admin. 0 687 681 685 684 683 675 674 669 5 679 674 671 683 671 669 681 662 30 667 664 665 669 674 660 673 622 60 668 649 654 646 658-0 648
> 1% 673 640
90 652 657 655 657 Z658 / 651
0 648
> 1% 663 643
120 643 651 644 630 Z658 / 651
0 648
> 1% 657 627 150 628 654 624 638 / 645 618 649 629 180 631 642 613 619 630 609 645 626
Vol. of solution (liters) :
Introduced Passed down tract Remaining at 3 hr.
Acetic acid: Introduced (g.) Absorbed (g-T
Absorption (mg./kg. body wt./hr.) pH control: 10 N H3P04 (ml.)
1.13 0.91 0.24
1.13 0.88 0.28
1.46 0.68 0.80
1.46 0.66 0.82
2.31 0.56 1.80
2.31 1.24 1.06
4.15 2.17 2.30
4.15 2.29 2.05
7.76 0.39
7.70 0.33
10.00 0.76
9.99 0.68
15.78 1.11
15.59 1.09
27.94 0.81
27.73 1.49
2.8 2.3 4.7 4.3 5.4 5.3 2-7 5.0
0 0 0 0 0 0 0 0

Table 32. Results of Experiment 2a
Calf: 4958 4906 Age (wk.): 21 27 34 16 21 23 27 34 36
Adjusted VFA conc. (mg./100 ml.)
Min. after admin. 0 691 669 720 676 688 673 677 663 664 5 662 653 718 694 689 688 679 654 656 30 663 649 717 682 666 617 588 606 509 60 654 642 695 672 645 553 492 566 404 90 633 625 698 658 626 477 400 525 305 120 642 606 700 657 591 411 312 454 222 150 626 595 683 645 568 344 235 388 162 180 610 570 666 626 553 267 172 333 117
Vol. of solution (liters):
.96 Introduced 5. 52 6.24 6 .66 4. 48 4. 92 5 .36 6. 00 7.92 7 .96 Passed down tract 2. 75 4.02 6 .00 1. 86 2-14 2 .78 2. 83 4.25 2 .77 Remaining at 3 hr. 2. 80 2.69 1 .59 2. 69 3. 58 2 .51 3. 79 4.08 5 .10
Acetic acid: Introduced (g.) 38. 14 41.75 47 .95 30. 28 33. 85 36 .07 40. 62 52.51 52 .85 Absorbed (g.) 3. 61 4.36 2 .03 1. 59 5. 3 16 .3 24. 2 19.2 37 .5
Absorption (mg./kg. 32.3 62 .8 body wt./hr.) 8. 7 9.3 4 .1 4. 7 14. 4 40 .6 53. 8 32.3 62 .8
pH control: 10 M H3PO4 (ml.) 0 5.5 4 .0 0 14 54 108 73 170
aSee footnotes c, d and e in Table 31.

Table 33. Results of Experiment 3 (oalf 4933 on MHG diet)a
Trial no.: 1 2 3 4,6 Treatment: Sodium Acetic Butyric Butyric acid Sodium ,
chloride0 acid13 acldb infusion chloride Day: 1212121212
Adjusted VFA conc. (mg./100 ml.)
Mln. after admin. 0 688 685 681 681 669 669 689 680 670 671 5 659 664 658 669 634 653 665 643 656 649 30 541 641 543 605 571 575 530 588 551 621 60 395 600 421 527 462 506 383 535 431 594 90 276 557 302 446 358 420 259 470 290 556 120 176 498 207 365 273 329 168 397 180 519 150 117 441 140 288 191 242 106 338 100 496 180 66 370 95 195 132 156 61 268 59 455
Vol• of solution (liters):
Introduced 3.96 3.96 4.00 4.00 4.24 4.24 4.80 4.80 5.52 5.52 Passed down tract 2.22 3.32 1.97 3.03 1.90 2.75 2.03 1.90 1.51 2.78 Remaining at 3 hr. 1.09 0.79 1.62 0.85 2.09 1.19 1.58 2.68 2.67 2.76
Acetic acid: Introduced (g.) 27.24 27.13 27.24 27.24 28.37 28.37 33.07 32.64 36.98 37.04 Absorbed (g.) 18.88 7.40 18.47 12.39 18.36 14.85 24.67 16.17 29.40 9.19
Absorption (mg./kg. body wt./hr.) 63.5 24.9 61.8 41.3 57.7 46.7 68.5 44.9 71.0 22.2 pH control: 10 N H3PO4 (ml.) 88 25 79 49 65 53 77 54 101 25
aSee footnotes b, d and e in Table 31.
bin Krebs-Ringer-phosphate lacking sodium chloride.
cIn water.
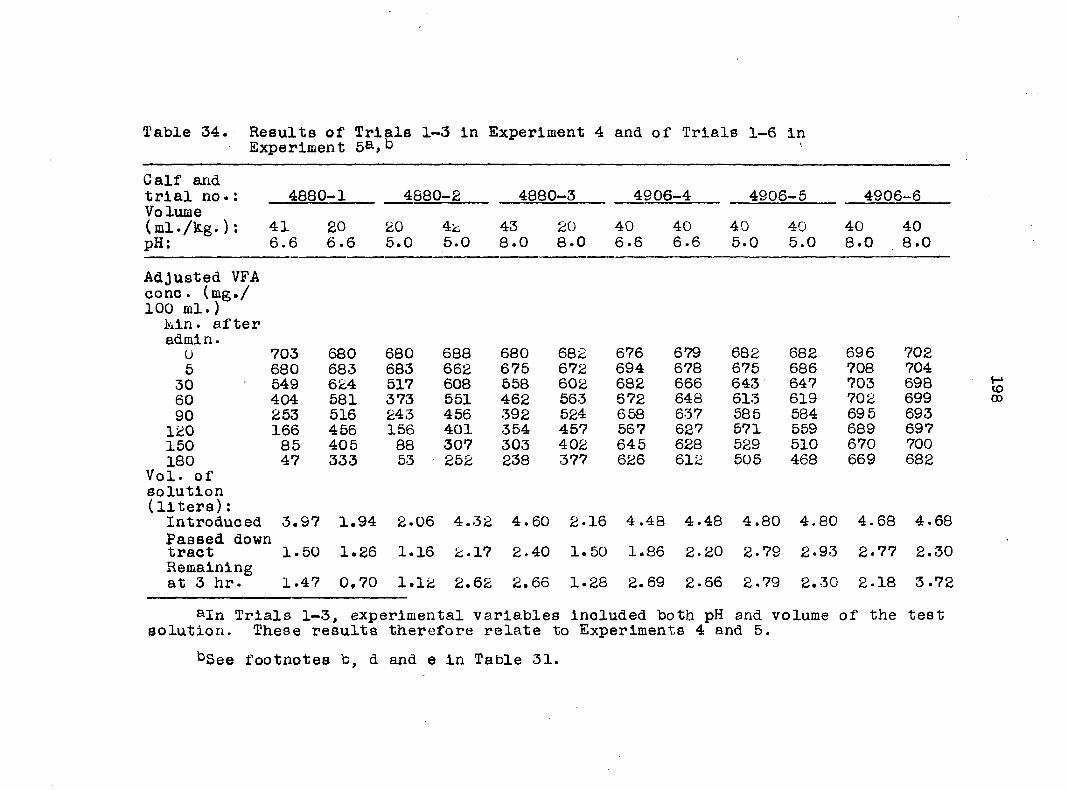
Table 34. Results of Trials 1-3 in Experiment 4 and of Trials 1-6 In Experiment 5&,b 1
Calf and trial no.: 488C 1-1 488C 1-2 4880-3 4906 1-4 4906 i-5 4906 i-6 Volume (ml./kg.) : 41 20 20 42 43 20 40 40 40 40 40 40 pH: 6.6 6.6 5.0 5.0 8.0 8.0 6.6 6.6 5.0 5.0 8.0 8.0
Adjusted VFA conc. (mg./ 100 ml.) kin. after admin.
u 703 680 680 688 680 682 676 679 682 682 696 702 5 680 683 683 662 675 672 694 678 675 686 708 704 30 549 624 517 608 558 602 682 666 643 647 703 698 60 404 581 373 551 462 563 672 648 613 619 702 699 90 253 516 243 456 392 524 658 637 585 584 695 693 120 166 456 156 401 354 457 567 627 571 559 689 697 150 85 405 88 307 303 402 645 628 529 510 670 700 180 47 333 53 • 252 238 377 626 612 505 468 669 682
Vol. of solution (liters): Introduced 3.97 1.94 2.06 4.32 4.60 2.16 4.48 4.48 4.80 4.80 4.68 4.68 Passed down tract 1.50 1.26 1.16 2.17 2.40 1.50 1.86 2.20 2.79 2-93 2.77 2.30 Remaining at 3 hr. 1.47 0,70 1.12 2.62 2.66 1.28 2.69 2-66 2.79 2.30 2.18 3.72
aIn Trials 1-3, experimental variables included both pH and volume of the test solution. These results therefore relate to Experiments 4 and 5.
kSee footnotes b, d and e In Table 31.

Table 34. (Continued)
Calf and trial no. : 4880-1 4880-2 4880-3 4906-4 4906-5 4906-6 Volume (ml./kg. ) : 41 20 20 42 43 20 40 40 40 40 40 40 pH; 6.6 6.6 5.0 5.0 8.0 8.0 6.6 6.6 5.0 5.0 8.0 8.0
Acetic acid: Introduced (g.) 27.91 13.19 14.01 29.72 31.28 14.73 30.29 30.42 31.82 32.74 32.57 32.85 Absorbed (g.) 21.85 4.67 10.16 14.70 16.00 4.70 1.59 2-35 4.36 7.06 0.63 0.63
Absorption (mg./kg. body wt./ hr.) 75.1 16.0 32.9 47.6 49.4 14.5 4.7 7.0 12.1 19.6 1.8 1.8 pH control: 10 N H3PO4 (ml.) 65 14 80 70 — — — 2 21 25 1 M NaOH (ml.) — — — — 30 43 — — — — 50 47

200
Table 35. Results of Trials 4, 5 and 6 In Experiment 4a
Trial no • : 4 5 6 Volume (ml./kg.): 40 20 60
Adjusted VFA conc. (mg./lOO ml.) Mln. after admin.
0 685 681 692 5 660 650 612 30 548 420 566 60 432 239 455 90 333 129 333 120 255 71 272 150 176 40 196 180- 125 33 120
Vol. of solution (liters): Introduced 5.04 2.68 8.76 Passed down tract 2.29 1.30 3.66 Remaining at 3 hr. 2.75 1.38 5.10
Acetic acid: Introduced (g.) 34. 52 18.25 60.62 Absorbed (g.) 22.95 14.63 40.90
Absorption (mg./kg. body wt./hr.) 60.7 36.4 93.4 pH control: 10 N H3P04 (ml.) 85 75 145
aSee footnotes b, d and e In Table 31.

Table 36. Results of Trials 7-11 in Experiment 5
Calf and trial no•: 7035-7 703£ i-8 7035-9 4938 -10 4938 l-ll pH: 5.5 7.5 5.5 7.5 5.5 7.5 5.5 7.5 7.5 5. 5
VFA absorption (g.)a Period (mln. after admin.)
0-20 7.80 4.32 7.08 2.52 4.02 3.96 0.96 0.06 1.20 0.30 20-40 7.56 2.70 7.74 2.94 9.60 4.38 0.60 -0.24 1.14 -0.60 40-60 6.18 2.10 9.60 1.92 9.78 2.70 0.90 0.66 0.90 0.84 60-80 2.46 1.20 6.54 1.38 7.68 2.70 0.90 0.00 1.32 0.36 Total 24.00 10.32 30.96 8.76 33.08 13.74 3.36 0.48 4.56 0.90
Vol. of solution (liters): Introdueed 4.00 4.00 4.64 4.64 5.80 5.80 4 ;96 4.96 5.36 5.36 Remaining at 80 mln. 2.38 3.18 2.78 3.56 5.64 4.17 3.34 3.29 3.83 4.12
VFA absorbed (mg./kg. body wt./hr.) 180 78 200 57 171 71 20 3 26 5 pH control: 1 N NaOH (ml.) — — 23 21 10 21 10 N H3P04 (ml.) 5 N VFA mix (ml.)
109 3 10 N H3P04 (ml.) 5 N VFA mix (ml.) — — 80 105 8 5 — — 5
aSee p. 104 for method of calculation.

202
Table 37. Descriptive data for calves used in studies of rumen epithelial metabolism8.
Calfk Date of birth Diet Age Sacrifice
Body wt.
wk. kg.
5125 7:9:61 M 16 138
5128 7:12:61 MHG 16 102
7032 7:30:61 MHG 16 127
5154 9:11:61 Replacers0 12 74
7055 8:30:61 MHG 16 94
5152 9:5:61 M 16 78
7054 1:4:62 M 16 82
aAll calves were male Hols teins.
Calves are listed in the order in which they were sacrificed.
°The composition of the replacers is given on p. 108, footnote 1.

203
Table 38. Oxygen uptake by rumen epithelial tissue8
uau and Time Thermo- Control Butyrate Glucose diet period barometer 1 2 1 2 1 2
hr.
7055 0-1/2 12 31 24 32 64 39 48 MHG 1/2-1 12 41 35 41 100 69 82
1-1 1/2 15 62 51 57 143 95 117 1 1/2-2 17 85 69 74 184 127 144
2-2 1/2 19 98 81 84 218 152 187 2 1/2-3 17 108 89 92 246 173 216
515% 0-1/2 + 10 +1 +2 3 6 +1 1 M 1/2-1 +13 0 +2 7 13 1 5
1-1 1/2 +12 3 +2 12 16 + 5 4 1 l/;d-2 - + 11 7 0 17 23 + 2 8
2- 2 1/2 +10 14 4 25 32 +2 12 2 1/2-3 +9 20 6 36 44 4 18
3- 3 1/2 +6 26 11 46 52 8 25 3 1/2-4 +4 36 9 58 51 16 31
7054 0-1/2 6 4 3 9 8 2 3 M 1/2-1 7 9 3 9 11 3 4
1-1 1/2 17 19 9 22 24 10 10 1 1/2-2 22 31 17 31 34 17 17
2-2 1/2 22 37 20 34 40 20 20 2 1/2-3 22 44 23 40 47 24 24
3-3 1/2 26 56 32 49 60 32 32 3 1/2-4 30 70 41 59 72 40 41
4-4 1/2 35 85 53 76 86 52 50 4 1/2-5 36 98 63 82 97 61 60
5-5 1/2 37 104 70 91 106 69 68 5 1/2-6 38 116 79 103 120 81 78
6-6 1/2 42 130 87 121 134 96 94 6 1/2-7% 47 146 100 132 148 117 112
Results expressed as cumulative change in manometer readings. All changes are negative (oxygen uptake) unless shown otherwise.
%At this stage the epithelium was removed from flasks no. 2 of all treatments. All manometers were freshly gassed with oxygen and equilibrated; readings were taken as before•

204
Table 38 (Continued)
Calf and Time Thermo- Control Butyrate Glucose diet period barometer 1 2 1 2 1 2
hr.
7054 9-9 1/2 0 26 5 17 5 52 40 M 9 1/2-10 10 47 15 40 12 111 95
10-10 1/2 13 68 22 58 19 172 158 10 1/2-11 25 101 43 88 33 245 250
Table 39 . Oxygen uptake by rumen wall*' b
Calf and Time Thermo- Control Butyrate Glucose diet period barometer 1 2C 1 2 1 2
hr.
7054 0-1/2 6 6 8 12 6 11 to 1/2-1 7 11 13 17 13 19
1-1 1/2 17 20 25 34 29 33 1 1/2-2 22 31 37 49 38 48
2-2 1/2 22 35 44 58 44 57 2 1/2-3 22 41 53 68 50 67
3-3 1/2 26 51 65 84 64 82 3 1/2-4 30 65 78 104 77 97
4-4 1/2 35 79 94 123 91 115 4 1/2-5 36 89 108 141 102 129
5-5 1/2 37 90 119 155 113 144 5 1/2-6 38 101 133 171 129 160
aResults expressed as cumulative change in manometer readings. All changes are negative (oxygen uptake) unless shown otherwise.
Epithelium and muscle.
CA leak developed in this manometer.