Embed Size (px)
Citation preview

FUNDAMENTALS AND CHARACTERIZATION OF FUNGALLY
MODIFIED POLYSACCHARIDES FOR THE PRODUCTION OF
BIO-PLASTICS
by
Arturo Rodriguez Uribe
A thesis submitted in conformity with the requirements for the
degree of Doctor in Philosophy
Graduate Department of Forestry
University of Toronto
© Copyright by Arturo Rodriguez
2010
FUNDAMENTALS AND CHARACTERIZATION OF FUNGALLY
MODIFIED POLYSACCHARIDES FOR THE PRODUCTION OF
BIO-PLASTICS
Arturo Rodriguez Uribe
Ph D thesis, Graduate Department of Forestry
University of Toronto, 2010
Abstract
Starch and microbial exo-polysaccharides produced by prokaryotes (i.e. Eubacteria
and Archaebacteria) and eukaryotes (i.e. phytoplankton, fungi, and algae) are
recognized as a permanent source of biopolymers for the packaging industry.
However, the unsuitable mechanical properties for thermoplastic applications and/or
high cost of production have restricted their generalized use.
Fungal isolates of the genus Ophiostoma are able to produce exo-polysaccharides or
protein-like compounds in a medium containing starch as the substrate. Various
analytical techniques were used as an approach to investigate the interaction
between starch and the fungal extracellular metabolites and the effect of the
molecular-structural modifications on the functional properties of the materials.
Native starches were used as control in all experiments.
Analyses performed by dynamic mechanical thermal analysis (DMTA), which provides
information related to the viscoelastic properties, showed that the storage modulus
(E') increased substantially after the modification of the starch showing a process of
chain stiffness. The determination of the glass transition temperature (Tg) by tan
and loss modulus (E'') peaks showed various thermal transitions indicating a complex
molecular aggregation due to the potential presence of dissimilar amorphous
polymers. Experiments performed in DSC confirmed the presence of the various
thermal transitions associated to the Tg of these materials. The first derivative of
mass loss with respect to temperature during the thermogravimetric (TG) analysis
was slightly lower compared with native starches (at ~630 and 650°C). However,
II

modified starches can withstand high temperatures showing residues up to 20% at
1000°C.
Studies on the characterization of the flow properties of the polymers by capillary
rheology showed in both samples a shear thinning behavior. The double logarithmic
plot of the shear rate vs. shear viscosity produced a straight line and in consequence
a power law equation was used to describe the rheological behavior (( = K'n). The
results showed that in order to achieve the same shear rate (') in both samples
(modified and native starches) it is necessary to apply a higher shear stress () in
the fungal treated materials. As a result, the consistency power law index (n)
decreased and the consistency value increased (K). The practical consequence is that
the melting point of these polysaccharides shifted to higher temperatures.
By using various analytical techniques (including chromatography, spectroscopy,
spectrometry) it was found that these phenomena may be due to the interaction of
starch with protein-like or exo-polysaccharides or both which may influence the
viscosity, bind adjacent molecules (i.e. network-like) and restrict the molecular
motion. Evidences of the presence of pendant groups attached to high molecular
weight compounds were also found. This information will give guidance to further
structural studies and it is intended to pave the way for a variety of industrial
applications.
III

Acknowledgment
This thesis could not have been completed without the constant encouragement, advice,
financial support, and unconditional help of my supervisor Dr. M. Sain from which I am
very greatly indebted.
I would also like to thank to Mexican Council of Science and Technology and BIOCAR
Canada Foundation and an NSERC strategic grant for financial support.
I am grateful to my advisory committee members: Dr. D. N. Roy, Dr. Martin Hubbes, Dr.
Charles Q. Jia, and Dr. Sally Krigstin for all support and invaluable comments to the
drafts of this thesis.
I would also like to thank the professors who shaped my academy formation: Dr. Ning
Yan, Dr. Sandy Smith, Dr. Andy Kenney, Dr. T. Blake. I am especially grateful to Dr.
Robert Jeng for his support in laboratory matters.
Also my especial thanks to Deborah Paes, because not everything can be solved in the
laboratory. Thanks to the University of Toronto, great institutions are made of great
people. I would like to thank to all the people in the international school of graduate
studies (SGS). There were many people which directly or indirectly played important
roles in my personal and professional development as well as in the performance of my
experiments. Thanks to the Dean T. Smith, Mary-Rose Naudi, Ian Kennedy, John
McCarron, Shiang Law, Tony Ung, my classmates and coworkers and all the staff in the
laboratories.
This work is also dedicated with all my love to my wife Sofia Ocana Alonso and my
daughter Sofia Rodriguez Ocana. I need to thank all their support, comprehension, and
company during these years, both are a blessing for me.
IV
Table of contents
Abstract …………………………………………………………………………………………………………….……… ii
Acknowledgment ……………………………………………………………………………………………..……….iv
Table of contents………………………………………………………………………………………………………..v
List of figures …………………………………………………………………………………………………..……. iX
List of tables ……………………………………………………………………………………………………………xvii
List of abbreviations ………………………………………………………………………………………………xviii
List of symbols ………………………………………………………………………………………………………….xx
1. Introduction ……………………………… …………………………………………………………..…………..1
1.1. Motivation of the study ……………. ……………………………………………………………..…1
1.2. Molecular, physical, and functional properties of starch ………………………….. 4
1.2.1. Molecular structure of starch …………………………………………………..……… 4
1.2.1.1. Minor components of starch ……………………………………………...6
1.2.1.2. Comparison between cereal and tuber starches ………………...8
1.3. Exopolysaccharides and other fungal metabolites ……………………………..…...9
1.3.1. Microbial metabolites and other industrial uses ……………………..….….9
1.3.1.1. Enzymatic conversion of starch ……………………………………….… 9
1.3.1.2. Microbial metabolites: the case of Ophiostoma spp. ………..11
1.4. Objectives and approach ……………………………………………………………………… …19
1.4.1. Objectives ………………………………………………………………………………..19
1.4.2. Approach ……………………………………………………………………………………... 21
1.4.3. Structure of thesis ………………………………………………………………………..22
2. Experimental …………………………………………………………………………………………………….24
2.1. Production of polymers …………………………………………………………………………….24
2.2. Protein determination ……………………………………………………………………………….25
3. Results and analysis ………………………………………………………………………………………..26
3.1. Morphology and chemical analyses.………………………………………………………….26
3.1.1. Morphology (SEM and FT-Raman confocal analysis) ……………..…..26
3.1.1.1. Introduction …………………………………….…………………………………26
3.1.2. Materials and methods ………………………………………………………………….27
3.1.3. Results and discussion ………………………………………………………………….27
3.1.4. Conclusions to the section.…………………………………………………………… 32
3.2. XRD-analysis ………………………………………………………………………………………….32
3.2.1. Abstract …………………………………………………………………………………………32
V

3.2.2. Introduction ……………………………………………………………………………… .32
3.2.3. Materials and methods …………………………………………………………………..34
3.2.4. Results and discussion …………………………………………………………… .….34
3.2.5. Conclusions …………………………………………………………………………………...35
3.3. FT-IR (ATR) ……………………………………………………………………………………………..35
3.3.1. Abstract ……………………………..…………………………………………………………..35
3.3.2. Introduction ……………………………………..…………………………………………..36
3.3.3. Materials and methods ………………………..…………………………………………37
3.3.4. Results and discussion ……………………..………………………………….……….38
3.3.4.1. FTIR (ATR) ……………………………..………………………………………….38
3.3.4.2. FTIR (ATR) ……………………………………………………………………………43
3.3.5. Conclusions ………………………………………..……………………………………………46
3.4. FT-Raman ……………………………………………………………………….………………………….47
3.4.1. Abstract ………………………………………………………………………………………….47
3.4.2. Introduction …………………………………………………………………………………….48
3.4.3. Materials and methods ……………………………………………………………………48
3.4.4. Results and discussion ……………………………………………………………………49
3.4.5. Conclusions ……………………………………………………………………………………..58
3.5. Liquid state NMR……………………………………………………………………………………… ..59
3.5.1. Abstract …………………………………………………………………………………………..59
3.5.2. Introduction ……………………………………………………………………………………..59
3.5.3. Materials and methods ……………………………………………………………….… 60
3.5.4. Results and discussion ………………………………………………………………….. .60
3.5.5. Conclusions …………………………………………………………………………… …..….63
3.6. Solid state and liquid state NMR ……………………………………………………… ..…… 63
3.6.1. Abstract ……………………………………………………………………………………… ….63
3.6.2. Introduction ……………………………………………………………………………………..64
3.6.3. Materials and methods ……………………………………………………………… ….64
3.6.4. Results and discussion …………………………………………………………………….65
3.6.5. Conclusions …………………………………………………………………………………….68
3.7. MALDI-TOF MS ……………………………………………………………………………………… … 68
3.7.1. Abstract ……………………………………………………………………………………………68
3.7.2. Introduction …………………………………………………………………………… ………68
3.7.3. Materials and methods ………………………………………………………………….69
3.7.3.1. Sample preparation …………………………………………………………….69
VI

3.7.3.2. Instrumental conditions ……………………………………………… … 69
3.7.4. Results and discussion …………………………………………………………………..69
3.7.5. Conclusions …………………………………………………………………………………… 71
3.8. HPAEC-PAD …………………………………………………………………………………………….. 72
3.8.1. Abstract ……………………………….………………………………………………………..72
3.8.2. Introduction ………………………………………………………………………………….72
3.8.3. Materials and methods ……………………………………………………………….. .73
3.8.3.1. Polymer production and sample preparation …………………..73
3.8.3.2. Instrumental conditions …………………………………………………..74
3.8.4. Results and discussion ………………………………………………………………….75
3.8.4.1. Oligo and polysaccharides …………………………………………………75
3.8.4.2. Sugars- composition ………………………………………………………….80
3.8.5. Conclusions ……………………………………………………………………………………84
3.9. Viscoelastic properties ………………………………………………………………………………85
3.9.1. Abstract ……………………………………………………………………………………….…85
3.9.2. Introduction …………………………………………………………………………………. 86
3.9.2.1. Dynamic mechanical thermal analysis of polymers .………..86
3.9.2.2. Basic definitions……………………………………. ……………..…………86
3.9.2.3. DMTA basic principles……………….…………………………………………93
3.9.2.4. DMTA of starch …………………………………………………………………..93
3.9.3. Materials and methods ………………………….……………………………………..94
3.9.3.1. Formation of films by casting method…………………………….. .94
3.9.3.2. Extrusion of materials.………………………………………………………. 95
3.9.3.3. DMTA conditions …………………………..………………………………….. 96
3.9.4. Results and discussion…… ………………………………………………………….. 97
3.9.4.1. Samples produced by film casting method ……………………….97
3.9.4.1.1. Determination of the linear viscoelatic region (LVR)…. 97
3.9.4.1.2. Creep compliance test…………………………………………………100
3.9.4.2. DMTA-Samples produced by casting method…………………..103
3.9.4.3. DMTA- Samples produced by extrusion……………………………105
3.9.4.4. DMTA-starch/clay/glycerol samples ……….. …………………107
3.9.5. Conclusions
3.10. Thermal properties …………………………………………………………..111
3.10.1. TG (thermogravimetry).…………………………………………………… 111
3.10.1.1. Abstract …………………………………………………………………………… 111
VII
3.10.1.2. Introduction………………………………………………………………………. 111
3.10.1.3. Fundamentals of TG ………………………………………………………… 112
3.10.1.3.1. General reaction of decomposition.……………………….113
3.10.1.3.2. Definitions ………………………………………………………………114
3.10.1.3.3. Theory …………………………………………………………………….115
3.10.1.3.3.1. Reaction rate and extent of decomposition.116
3.10.1.3.3.2. Reaction rate and temperature ………………….120
3.10.1.4. Materials and methods ……………………………………………………. 120
3.10.1.5. Results and discussion……………………………………………………… 120
3.10.1.6. Conclusions ………………………………………………………….…………….125
3.10.2. DSC……………………………………………………………………………………..126
3.10.2.1. Abstract ………………………………………………………………………………126
3.10.2.2. Introduction ………………………………………………………………………..126
3.10.2.3. Materials and methods ……………………………………………………….129
3.10.2.4. Results and discussion ……………………………………………………….130
3.10.2.5. Conclusions ………………………………………………………………………..136
3.11. Rheology …………………………………………………………………………………………137
3.11.1. Introduction ……………………………………………………………………….137
3.11.2. Materials and methods ……………………………………………………….137
3.11.2.1. Sample preparation …………………………………………………………….137
3.11.2.2. Instrumental conditions ……………………………………………………. 138
3.11.3. Results and discussion …………………………………………………………138
3.11.4. Conclusions ……………………………………………………………………… 142
3.12. Mechanical properties ……………………………………………………………………..142
3.12.1. Abstract …………………………………………………………………………….. 142
3.12.2. Introduction …………………………………….………………………………….143
3.12.3. Materials and methods ……………………………………………………….150
3.12.3.1. Sample preparation ……………………………………………………………. 150
3.12.3.2. Extrusion ……………………………………………………………………………. 151
3.12.3.3. Injection molding …………………………………………………………………152
3.12.4. Results and discussion ……………………………….………………………152
3.12.5. Conclusions ……………………………………………………………..…….……154
4. General conclusions ………………………………………………………………………….…………….154
5. Future work ……………………………………………………………………………………………………….156
6. References ………………………………………………………………………………………….…………….157
VIII

List of Figures
Figure 1— Confocal FT-Raman microscope observations of a variety of used commercial potato starch; Scale= 10 micros Figure 2- SEM image showing the porosity at the surface of the granules Scale=6.1 m p……………………………………………………………………………………………………………………………………28
Figure 3- SEM micrographs showing granular aggregation in native starches Scale 20 m
Figure 4- Confocal microscope FT-Raman- amylose-iodine complexing denoting the amylose fractions within the granules-Scale 20 m
p…………………………………………………………………………………………29 Figure 5- Confocal microscope FT-Raman- amylose-iodine complexing denoting thick layers of amylose fractions within the granules-Scale 20 m
p. ………………………………………………………………………………………………………………………………….30
Figure 6- Optical images of modified starch granules
Figure 7-SEM images of modified starch granules
p…………………………………………………………………………………………………………….……………………..31
Figure 8--PXRD patterns of granular native starches (GNS), native gelatinized starches (NS), modified gelatinized starches (DMS), and granular modified starches (GMS)
p…………………………………………………………………………………………………………………………………….35
IX

Figure 9- FT-IR spectrum of modified starches- (detection of the peak associated to double bonds probably in C=O vibrations) p…………………………………………………………………………………………………………………………………….40
Figure 10- FT-IR spectrum of exopolysaccharides (EPSs) produced in absence
of substrate (detection of the peak associated to double bonds probably in
C=O vibrations)
Figure 11--FT-IR spectrum of granular modified starches (G-MS) (detection of the peaks at ~800 and 1240 cm-1)
p…………………………………………………………………………………………………………………………………….41
Figure 12- FT-IR spectrum of exopolysaccharides (EPSs) produced in absence of substrate (detection of peaks at 800 and 1240 cm-1) p…………………………………………………………………………………………………………………………………… 42
Figure 13-FT-IR spectrum of modified starches- separation of water-like and water insoluble fractions
p…………………………………………………………………………………………………………………………………….43
Figure 14---Attenuated total reflectance (ATR) spectrum of native-starch/glycerol/clay composites (top) and clay spectra (below) Figure 15--Attenuated total reflectance (ATR) spectrum of two different samples of modified starch clay glycerol composites showing complementary information related to new molecular interactions p…………………………………………………………………………………………………………………………………….45
Figure 16 -FT-Raman spectrum of the substrate, modified starches, and exopolysaccharides produced by the microorganisms in absence of substrate
p…………………………………………………………………………………………………………………………………….51
X

Figure 17-A-B –Oostergetel and Van Bruggen model of the amylopectin clusters, branching and molecular pattern (A); the left-handed three-dimensional helical structure of amylopectin (B). It’s been explained by the authors of this model [53] that neighboring helices are shifted relative to each other by half the helical pitch (indicated by 0 and ½). Figure 18-- Substitutions occurring in amorphous regions of the amylopectin molecules near the branching points [53]
p…………………………………………………………………………………………………………………………………….52
Figure 19- FT-Raman spectrum of Polyplast® samples- laser source 532 nm 20 mW; spectral range 70, 1555 -1525, 2740-2710, 3700 cm-1; integration time 20 sec Figure 20- Spectra of native and modified granular starches (cd2c/MSP): laser source 532 nm 20 mW; spectral range 1525-2740 cm-1; integration time 30 sec p…………………………………………………………………………………………………………………………………….55
Figure 21-FT-Raman scanning of the surface (3D) of the substrate (native starch) p…………………………………………………………………………………………………………………………………….57
Figure 22-FT-Raman scanning of the surface (3D) of the modified starch
p…………………………………………………………………………………………………………………………………….58
Figure 23-- 300 MHz 1H NMR spectrum of Polyplast® polymers showing solvated, probably pendant groups, in D2O p…………………………………………………………………………………………………………………………………….62
Figure 24-300 MHz 1H NMR spectrum of EPS produce by the fungi in absence of starch salvation in D2O p…………………………………………………………………………………………………………………………………….63
XI
Figure 25-MALDI-TOF MS spectrum of native starch- p…………………………………………………………………………………………………………………………………….70
Figure 26- MALDI-TOF MS spectrum of modified starches p…………………………………………………………………………………………………………………………………….71
Figure 27- Chromatographic profiles of modified starches synthesized from
tapioca starch at the 3rd day of modification (CarboPac PA1)
p…………………………………………………………………………………………………………………………………….77
Figure 28-Chromatographic profiles of modified starches synthesized from potato starch at the 3rd day of modification (CarboPac PA1) Figure 29- Chromatographic profiles of modified starches synthesized form corn starch at the 3rd day of modification (CarboPac PA1) Figure 30- Chromatogram profile of modified starches- detail of peak separation performed with a CarboPac PA200 column (peak separation corresponding to peak no. 4 in Fig. 55) p…………………………………………………………………………………………………………………………………….78
Figure 31-- Chromatographic profiles of modified starches synthesized from corn starch after the 3rd day of modification (CarboPac PA1) Figure 32- Chromatographic profile of modified starch synthesized from PDB
(CarboPac PA1)
Figure 33-Exo-polysaccharides (EPSs) produced by the fungi in yeast extract
(CarboPac PA1) –no substrate involved
p…………………………………………………………………………………………………………………………………….79
XII

Figure 34-- Chromatographic profiles obtained for fermented starches (corn, tapioca, or potato) with increase in the spore concentration Figure 35-- Chromatographic profiles modified starch (from tapioca, potato, or corn) produced in Na+NO2
-, Na+NO3-, HPO4
-2(NH4)2, or NH4+NO3
-. The effect of the different nitrogen sources was similar. Figure 36-Chromatogram of one of the substrates (the example native starch (Carbo Pac PA1) p…………………………………………………………………………………………………………………………………….80
Figure 37- Chart showing the retention time of the various used standards
p…………………………………………………………………………………………………………………………………….81
Figure 38-Chromatogram showing the sugar separation of hydrolyzed mod. starch from tapioca starch. Separation by CarboPac PA1 Figure 39-Chromatogram showing the sugar separation of hydrolyzed mod starch from potato starch. Separation by CarboPac PA1
p…………………………………………………………………………………………………………………………………….82
Figure 40- Chromatogram showing the sugar separation of hydrolyzed
modified corn starch. Separation by CarboPac PA1
Figure 41-Chromatogram of hydrolyzed fungal exo-polysaccharides (EPSs)
produced in absence of substrates. Separation by CarboPac PA1
Figure 42--Chromatogram of hydrolyzed mod. starch from amylopectin. Separation by CarboPac PA1
p…………………………………………………………………………………………………………………………………….83
XIII

Figure 43-Chromatogram of hydrolyzed modified starches from PDB.
Separation by CarboPac PA1
Figure 44-Chromatogram of one of the standards -D-Glucose. Separation by CarboPac PA1 p…………………………………………………………………………………………………………………………………….84
Figure 45--Linear viscoelastic region (LVR) determined by DMA in films produced by casting method with modified starches Figure 46- Linear viscoelastic region (LVR) determined by DMA in films produced by casting method with native starches p…………………………………………………………………………………………………………………………………….99
Figure 47-Creep compliance determined during the LVR test in native starch films
Figure 48- Creep compliance determined during the LVR test in modified
starch films
p………………………………………………………………………………………………………………………………….101
Figure 49-Stress relaxation curves for native starch films
Figure 50-Stress relaxation modulus in modified starch films
p………………………………………………………………………………………………………………………………….102
Figure 51- DMTA spectrum of native starch films produced by casting method
Figure 52-DMTA spectrum of modified starch films produced by casting method p………………………………………………………………………………………………………………………………….104
XIV

Figure 53- DMTA curve profiles of native starch glycerol composites produced
by extrusion
p………………………………………………………………………………………………………………………………….105
Figure 54-DMTA curve profiles of modified starch glycerol composites
produced by extrusion
Figure 55-DMTA curve profiles of modified starch-glycerol composites produced after extrusion
p………………………………………………………………………………………………………………………………….106
Figure 56---DMTA curve profiles of native starch-glycerol-clay composites
p………………………………………………………………………………………………………………………………….108
Figure 57-DMTA curve profiles of modified starch-glycerol- clay composites p………………………………………………………………………………………………………………………………….109
Figure 58- TG-DTG plot of native starches showing the degradation point at the 1st derivative Figure 59- TG-DTG plot of modified starches showing the degradation point at the 1st derivative
p………………………………………………………………………………………………………………………………….123
Figure 60-TG-DTG plots showing successive derivatives for modified starches showing a clear double thermal transition peak
Figure 61-TG-DTG-successive derivatives obtained by TG in native starches showing the lack of thermal transitions p………………………………………………………………………………………………………………………………….124
Figure 62- Successive derivatives modified starches showing high energy consumption during the transitions at the point of thermal degradation
p………………………………………………………………………………………………………………………………….125
XV
Figure 63- DSC thermograms of the unmodified substrate (native starch). Peaks induced with 0.6 M KCl (granular starch)
Figure 64- DSC thermograms of modified polysaccharides
p………………………………………………………………………………………………………………………………….133
Figure 65- DSC thermograms of native starch-films Figure 66- DSC thermograms of modified starch films
p………………………………………………………………………………………………………………………………….134
Figure 67-DSC thermograms of native starch films Figure 68-DSC thermograms of modified starch films
p………………………………………………………………………………………………………………………………….135
Figure 69- Plots of shear viscosity vs. shear rate (TP-native starch; TP-EPSs-Modified starches)
p………………………………………………………………………………………………………………………………….140
Figure 70-Shear stress vs. shear rate (TP-native starch; TP-EPSs-Modified starches)
p………………………………………………………………………………………………………………………………….141
Figure 71- Tensile strength (MPa) and elongation at break (%) of modified
and native starch glycerol and clay composites
p………………………………………………………………………………………………………………………………….154
XVI

List of Tables
Table 1
Chemical composition and physical characteristics of two different sources of common starches
type A (cereal-corn) and type B (tuber-potato) ……………………………………………………………………… 9
Table 2 FT-IR data: GMS (granular modified starches); DMS (gelatinized modified starches); GNS/NS (granular or gelatinized native starches)…………………………………………………….…………………………….33 Table 3
Assignment of the most important Raman bands of the native and modified starches
………………………………………………………………………………………………………………………………………….………….53
Table 4
Solid state NMR, chemical shifts for the different carbons of native and modified
starches……………………………………………………………..………………………………………………………………………..67
Table 5
Solid state NMR averaged associated area by carbon type ………………………………………………………67
Table 6-
Extrusion temperature profiles for samples finally tested ………………………………………………………..96
TABLE 7
Commonly Used Kinetic Equations …………………………………………………………..………………………………119
Table 8
DSC melting parameters for the substrate and modified
starches………………………………………………………………………………………………….………………………………….131
Table 8
Calculated K values for modified and native starches (Capillary rheometer) from the power law
equation …………………………………………………………………………………………………………..……………………….141
XVII
List of abbreviations
DMTA- dynamic mechanical thermal analysis
DMA- dynamic mechanical analysis
TA- thermal analysis
TG- thermogravimetry
TG-DTG- thermogravimetry and successive derivatives
DSC- differential scanning calorimetry
FTIR- Fourier transform infrared
FTIR-ATR- attenuated total reflectance
FT-Raman- Fourier transformed Raman spectroscopy
NMR- nuclear magnetic resonance 1H NMR- proton nuclear magnetic resonance
SS CP/MAS 13C NMR- solid state cross polarization magic angle spinning 13C NMR
MALDI-TOF MS- matrix assisted laser induced time of flight mass spectrometry
HPAEC-PAD- high performance anion exchange chromatography-PAD
PAD-pulsed amperometric detection
DSC- differential scanning calorimetry
SEM—scanning electron microscopy
DP- Degree of polymerization
LVR- linear viscoelastic region
Mw—Molecular weight
XRD— X-Ray diffraction
CL—crystalline lamellae
AL—amorphous lamellae
AV—amylose lipid complex
mc—moisture content
EC—enzyme commission numbers (http://www.brenda-enzymes.info/index.php4)
EPS(s)—exopolysaccharide (s)
LPLs—lysophospholipids
FFAs—free fatty acids
PHAs—polyhydroxyalkanoaes
TPS—thermoplastic starch by using a suitable plasticizer (e.g. glycerol)
RH—relative humidity
mp—melting point
XVIII
TS—tensile strength
EM—elastic modulus
ASTM— American standards of testing materials
XIX

XX
List of symbols
E— Young modulus
h— Inelastic behavior
L— elongation
Lo— initial length
L— increment in elongation
F— Force
E'— storage modulus
E''— loss modulus
tan —loss factor defined as tan = E''/ E'
' — strain rate
— shear stress
— strain
ŋ — viscosity
—shear stress (engineering stress)
n— power low index in a power law relation = K'n
K— consistency index in = K'n
tan —damping factor (tan =E”/E’)
J(t)—creep compliance
E(t)—relaxation modulus
Tg — glass transition temperature
Cp—heat capacity
g mol-1— grams per mole
Da—Daltons
ppm—parts per million
m—microns
%E—percentage of elongation at break
MPa—mega Pascal
A— Ampers
Vf— free volume
E* or G*—complex modulus
* or*—complex stress
*or*—complex strain
k — constant in the Hook’s relation (F= - k*displacement)

1. Introduction
1.1. Motivation of the study
The increased release and accumulation of synthetic plastics—especially
packaging—into the waste stream around the world, has driven the demand
for bio-degradable polymers [1, 2]. These materials are mainly targeted to
single use, disposable packaging, consumer goods, pharmaceutical capsules,
disposable nonwovens, coatings for paper and paperboard, and some non-
packaging markets [3]. The approach of composting as an ecological
alternative to manage most of these materials is currently supported by most
researches around the world, industry, international markets, and
municipal/national facilities [4]. Moreover, their importance increases since
not all synthetic plastics are recovered and not all of those bearing recycling
symbols are recycled for economic or technical reasons [5].
Starch has become one of the most promising candidates among the various
alternatives to substitute synthetic plastics, especially for packaging because
it is an inexpensive material and behaves as a thermoplastic [2, 6].
Therefore, numerous studies have been conducted to optimize the
performance of the starch-based polymers [7-16]. However, starch
thermoplastics have not come into a practical and widespread use mainly
because their susceptibility to water and low compatibility with most
polymers—synthetic, photo- or bio-degradable. The alternatives to improve
the properties of native starches include chemical and physical modifications,
but also starches may be converted to more useful forms by using enzymes;
however, usually related with the starch fragmentation [17]. Overall, the
final goals in the area of biodegradable polymers based on starch are related
to the improvement of the processability (i.e., extrusion, injection molding)
and compatibility with other thermoplastic polymers, as well as the reduction
of the water intake by using cost-effective and environmentally safe
methodologies.
1

The chemical conversion of starch has widely been explored (esters, ethers,
or grafted starches). For example, a number of authors have reported the
preparation of esterified starches of high degree of substitution (DS), in the
presence of organic solvents, or systems of solvents, used to achieve
homogeneous modification of the starch. Such modifications produce
thermoplastic starches, but the treatments are not economic and/or
environmentally efficient due to the toxic and/or expensive solvents used
under high alkaline conditions and temperatures, conditions which are
unsuitable for industrial scale [18-25]. Therefore, physical or enzymatic
treatments of starch become more attractive alternatives in pursuing such
objectives.
To date there are two ways in which starch is modified by using physical
means to produce thermoplastic derivatives: starch is used as a filler in
blends with synthetic or biodegradable polymers or starch is extruded in the
presence of a suitable plasticizer to form a thermoplastic mass [26, 27]. The
use of starch as a filler is one of the most investigated processes to decrease
the use of synthetic plastics or to lower the price of biodegradable polymers
[28-35]. In this method, the starch and the polymers are extruded or
injection molded to produce thermoplastic composites. The disadvantages of
this method are: the inferior properties of the materials when the amount of
starch exceeds 10%, the low interfacial affinity with most polymers
(synthetic or biodegradable, i.e., PLA), and the inaccessibility of the
encapsulated starch to biodegrading agents such as water, light, air, and
microorganisms. This problem may be solved in part by reducing the particle
size of the components in the composite by a strong destructurization
occurring with the gelatinization of the starch (thermomechanical input and
water content) during the extrusion which may lead to a more or less
continuous phase more susceptible to biodegradation [26].
The second alternative and one of the most studied methods is to process
starch by extrusion or injection molding in the presence of inexpensive
2
plasticizers (normally water or glycerol) to produce a thermoplastic mass.
These materials are relatively inexpensive, totally safe and biodegradable.
Their properties can be improved or modified by reactive extrusion or by
extruding the starch with fillers like mineral clay [36-38].
Microbial exo-polysaccharides (EPSs) produced by both prokaryotes
(Eubacteria and Archaebacteria) and eukaryotes (phytoplankton, fungi, and
algae) which are rich sources of enzymes, are also being intensively
investigated as a permanent source of polysaccharides for industrial
applications. They present a wide rage of chemical structures, but with
exception of polyhydroxyalkanoaes (PHAs), most of them have not yet
acquired appreciable significance in packaging or similar applications [28, 39-
41].
A recent study, published by Jeng et al. [42], is of critical significance. The
study basically showed that it is possible to modify and enhance the
properties of starch by using bio-catalysis or fermentation. The particular
fungal species used by these authors were Ophiostoma spp. It was reported
that these fungi have the ability to produce polysaccharides of high molecular
weight in culture media. When the medium is supplied with any source of
starch the recovered polysaccharides exhibit better functional properties than
native starches. It was also observed the lag or null degradation of the starch
source at prolonged reactions times. These observations may be attributed in
a first instance to the lack of degrading enzymes. The reported increase in
the molecular weight may be due to the production of EPSs and protein-like
compounds [42, 43]. However, the overall influence of the fungal treatment
on the functional properties of the recovered polysaccharides has not been
sufficiently explored.
This work forms an essential part of a larger study aimed at producing bio-
plastics using the biosynthetic pathway as described previously [44, 45]. The
specific purpose of this study was to investigate some of the functional
3

properties of these materials such as the viscoelasticity and rheology. The
description of certain chemical properties is used to support and explain the
dynamic mechanical and rheological observations. Since the study of the
details of the bio-synthetic pathway is ongoing, the information elucidated in
this work can be used to give insights related to the process by which these
polysaccharides are produced.
Some of the analytical techniques used during this study include dynamic
mechanical thermal analysis (DMTA), differential scanning calorimetry (DSC),
thermogravimetric analysis (TG), Fourier transform infrared (FTIR), FT-
Raman, capillary rheology, solid and liquid state NMR, etc.
1.2. Molecular, physical, and functional properties of starch
1.2.1. Molecular structure of starch
The molecular composition and architecture of the starch granules are the
main properties influencing the processing conditions, final products, and the
performance of starch-derived materials. These features also determine the
interaction of the enzymes with the substrate (chemical reactions, whether
enzyme-catalyzed or not, proceed mainly through the formation and
cleavage of chemical bonds). In order to discuss these relationships and
bring them forward it is necessary to briefly review these topics.
Starch is a natural polymer easily isolated in huge quantities from
agricultural staples such as corn, potato, or tapioca roots. It occurs naturally
in semi-crystalline granules of different sizes, size distribution, and shapes
mainly composed of two -D-gluco-polysaccharides with different
architectures; amylose and amylopectin, in a ratio of ~30% to 70%
respectively. This ratio can be altered substantially by selective breeding or
by biotechnological methods, e.g., waxy maize is 99% amylopectin, and the
different amylomaize varieties can be classified according to the percentage
4

of amylose; i.e., amylomaize V contains 50-60%, VI 60-70%, and VIII 70-
80% [2, 46].
Amylose is basically a helical (non- or slightly branched) polymer with
molecular weights (Mw) around 1X10⁵ g mol-1 and it is found within the
granules in amorphous regions. The chains show spiral-shaped single or
double helixes with a rotation in the (1-4)-link and with six glucose units per
rotation. Amylopectin is a highly branched polymer with Mw in the range of
1X10⁷ to 1X10⁹ g mol-1. The branches occur at C-6 hydroxyl group of a given
anhydroglucose unit, and 4 to 6% of the CH2OH groups are substituted. The
average degreed of polymerization (DP) of the branches is ~30 glucose units.
The branches are localized every 20 to 70 glucose units giving the
appearance of a grape-branched like structure called ‘cluster’. The branching
molecular aggregation is responsible for the two different X-ray diffraction
(XRD) patterns reported for cereals (i.e. corn type-A) and tubers (i.e. potato
type B). The crystalline structure is normally determined by the length and
density of the branches of the amylopectin molecules which are part of the so
called cluster-structure [46].
Granules (~20 to 100 m) are composed of alternating semi-crystalline rings
or shells (~1200-4000 Å). Crystalline layers are about 50 Å and increases up
to 70 to 80 Å at the end of the growth ring. The amorphous layers of
amylopectin regions are probably less than 40 Å. Amorphous regions may be
formed by -1-6 branching regions. The rings are visible by atomic force
microscopy (AFM) or by optical microscopes with a resolution in micrometer
(m). The smallest visible structures by AFM are the so called ‘blockets’
which have been associated to the crystalline fractions forming the ‘clusters’.
The size of the blockets is reported up to 4000 Å (the size of one growth
ring). Blockets have been defined as ‘semi-crystalline globular structures’
surrounded by a soft matrix (amorphous amylose) and disordered regions of
amylopectin fractions.
5

The ‘blockets’, are formed by ‘stacks’. Within each crystalline stack, there are
arrays of amylopectin or ‘clusters’ arranged in the form of crystalline lamellae
(CL) which are double helices zones (5-6 nm), and amorphous lamellae (AL)
formed by branching zones (4nm), giving a total of a ~9 nm periodicity. The
gaps between neighboring clusters (~5 nm) are filled with amylose and in
some cases amylose-lipid complexes (AV). Neighbor clusters merge together
to form a three-dimensional structure—the super three-dimensional helix
model [47].
The lamellae responsible for the crystalline regions are formed by three
discrete components: the backbone which support the double helices, parallel
‘rigid’ double-helical units (~5-6 nm), and amorphous regions (more flexible
un-branched regions, also called ‘spacers’ or side chains) with sizes of ~4 nm
[48, 49]. The size of the crystalline lamellae is ~9 nm. It has been by
observed simultaneous appearance and disappearance of the 9 nm and 1.6
nm reflections in small angle X-ray scattering under hydration and
dehydration experiments. The hydration produces the 9 nm reflection due to
the smectic periodicity. With a ~10% mc (moisture content) solid state NMR
spectra show a set of sharp and strong peaks at ~100 ppm (three peaks in
starches type A, and two in type B) associated to the crystalline regions.
Neither dehydrated native granules (<5% mc) nor the amorphous
dehydrated starches show these signals. The same phenomenon occur for
highly hydrated starches (~20% mc <). These authors suggested that under
dry conditions the starches may be in a pure glassy form (<5% mc), while
mc of ~10 % allow the formation of crystalline regions. These particular
structures of intermediate order are known as liquid crystals; SCLCP (side
chain liquid crystal polymer). The degree of mobility of these three
components, coupled with the helix-coil transition, may be used to explain
physicochemical and structural properties of starch such as gelatinization,
dehydration or molecular composition [48-53].
6
1.2.1.1. Minor components of starch
Minor components may also be present in different proportions: lipids
(~1.0% in cereal endosperm and 0.1 % in potato tuber), proteins (~0.25%
average; 0.5% in cereal endosperm and 0.05% in potato tuber), and silica
and phosphates are also present in low concentrations (potato starch
granules are highly phosphorylated). Phosphate groups in potato starch are
located in the center of the granules [2, 27, 54].
Cereal starches contain integral lipids in the form of lysophospholipids (LPLs)
and free fatty acids (FFAs) which have been found in association with the
amylose fraction. The lipids form a hydrophobic core in the helical molecule
of amylose. LPL can be as high as 2% by weight in high amylose starches.
The surface of starch granules can also present lipids such as triglycerides,
glycolipids, phospholipids and free fatty acids. These materials are generated
from the amyloplast membrane and non-starchy sources. The presence of
LPL and FFA depend also on the starch source [46].
The chemical signal appearing at 25-35 ppm in the 13C CP/MAS NMR (Cross
Polarization Magic Angle Spinning NMR) spectrum for native corn starch has
been associated directly with the presence of amylose-lipid complexes. The
presence of these complexes in the starch granules is also shown by the
lower iodine binding capacity of defatted amylose helices than the
corresponding lipid-extracted material. Moreover, lipids could be localized in
specific zones known as V-type starch structures. The content of lipids based
on amylose content can be as high as 50% or higher which is the case of oat
starches. These fractions are highly susceptible to enzymatic (fungal or
microbial) attack, and they will be removed firstly during the process or
modification [55].
In the granules, proteins have been reported to be localized either in the
surface or in the core of the granules, and mostly near the hilum. Isolated
7
starch granules may contain up to ~0.6% protein. Regardless of its origin, it
seems that proteins are located in the surface of the granules and at the
matrix of the granules formed by the amylose-amylopectin. Proteins seem to
affect the functionality of the granules, i.e., the grain hardness in wheat
starch is probably due to the friabilin. The molecular weight of the proteins
located at the surface is less (~15-30 Da) than those located at the core of
the granules (~50-150 Da). Proteins with higher molecular weight are
probably located at the hilum of the granules. Proteins include the enzymes
of starch bio-synthesis which may contribute to the flavor of the starch such
as starch synthase involved in the starch synthesis [54, 56].
Starches can also contain minerals such as calcium, magnesium, phosphorus,
potassium and sodium (in percentage less than 0.4%). Phosphorous may be
present in form of phosphate monoesters, phospholipids and inorganic
phosphates. Phosphate monoester is present in potato starch in quantities
not exceeding the 0.1%. Although in low concentrations, proteins, inorganic
materials and lipids can influence at different degrees the technical properties
of the starch [46, 55].
1.2.1.2. Comparison between cereal and tuber starches
The general properties of two different starch sources are provided in Table
1. Between these two starches there are clear differences in the size of the
granules and chemical composition which can directly affect the processing
conditions[2, 27, 46].
8

Table 1
Chemical composition and physical characteristics dry weight basis of two
different sources of common starches type A (cereal-corn) and type B (tuber-
potato) (11, 47, 54).
Corn Potato
Amylose (%) 27 ±1 23 ±2
Amylopectin (%) 72±1 76±3
Lipid content (%) 0.63 0.03
Protein content (%) 0.30 0.05
Phosphorous content (%) 0.02 0.08
Moisture content (%) 12-13 18-19
Granular size (m) 15 30-100
Crystallinity (%) 40 25
1.3. Exopolysaccharides and other fungal metabolites
1.3.1. Microbial metabolites and industrial uses
Microorganisms such as bacteria and fungi are a rich source of internal and
external metabolites such as enzymes, polysaccharides and/or protein-like
polymers. Since this work is based on the production of polysaccharides from
starch by specific fungal isolates, it is of interest for this work to briefly
discuss the industrial use of some of these microbial metabolites— and
particularly those already identified in the genus Ophiostoma spp. It is also of
special interest is the process by which these metabolites modify or convert
the different substrates. In general, enzymes have been used to degrade,
but also to produce thermoplastic starches. Microorganisms have also been
used to improve the properties of these substrates.
9
1.3.1.1. Enzymatic conversion of starch
Hydrolases such as - (EC 3.2.1.1; enzyme commission numbers)
(http://www.brenda-enzymes.info/index.php4) and -amylase (EC 3.2.1.2),
glucoamylase (EC 3.2.1.3 - glucan 1,4-alpha-glucosidase), pullulanase (EC
3.2.1.41) and isoamylase (EC 3.2.1.68) are the industrial enzymes used for
the production of a wide range of low molecular weight derivatives from
starch such as dextrose, maltodextrins, glucose, and maltose syrups, as well
as substrates for culture media [17].
In general, -amylase randomly hydrolyzes the glycosidic linkages along the
starch backbone, -amylase produces the equivalent to maltose units from
the end of a starch molecule, and glucoamylase produce one glucose unit at
a time. Glucoamylase attacks the starch molecules from the non-reducing
end-groups. At 37oC, with limited water content this enzyme converts a mass
of 10-50% of the starch granule to glucose. On the other hand, pullulanase
and iso-amylase are debranching enzymes which attack the 1, 6-linkage—the
size of the molecules obtained by fragmentation with these enzymes from
the amylopectin molecules correspond to the length of the branches. The
temperature at which bioconversion of the starch is conducted depends on
the source and the type of enzyme. For example, reactions in -amyloases
from bacteria are performed at 90-100oC, -amylase from fungi normally at
50-60oC, pullulanase 50-60oC [57].
Enzymatic activity seems to change with the starch source, morphology
(crystallinity), and the methods used during the starch conversion. Enzymes
such as glucoamylase and isoamylase first attach to the active sites of the
substrate before product formation. The enzymes can penetrate through the
pores of the starch granules and then bind to the internal starch molecules.
The physical damage due to these enzymes can be seen as pin-holes on the
surface of the starch granules by scanning electron micrographs (SEM) [58].
During this process, the enzymes release glucose from internal molecules.
10

Therefore, the process of hydrolysis depends not only on the porosity
pattern, but also on the chemical structure of the granules [59, 60].
The different amylolitic patterns among the dissimilar crystalline types may
be due to the variation in the location of their amylopectin branch points. The
A-chains (DP 6-12) (therefore the branch linkages in the crystalline lamellae)
of the A-type starches may be more susceptible to enzyme hydrolysis than
B-chains in B-type starches. In B-type starches, more branch points may be
found merged in amorphous regions providing an apparent crystalline
structure more resistant to hydrolysis.
Other related phenomena occur at the branching points. Based on the
degradation of hydroxyl propyl di-tapioca, hydroxyl propyl potato,
methylated potato, cationic waxy corn, and cationic potato starches by -
amylase and pullulanase, it has been found that the substitutions are located
near or at the branching points in the amorphous regions of the amylopectin
molecules (branching points are amorphous, more flexible un-branched
regions, also called ‘spacers’ or side chains, with sizes of ~4 nm which are in
alternating order with the crystalline regions composed of parallel double
helices with the size of ~5-6 nm). It has also been demonstrated that the
amylase fractions are easily accessible for hydroxypropylation, and these
amorphous regions are easily accessed by acid or enzymatic activities.
-amylolysis is affected by the size, type and arrangement of starch
molecules in the amorphous and crystalline lamellae and their interactions
with non-starch components. Crystalline regions may be formed by chain
association after initial hydrolysis hindering the further accessibility of -
amylase to the glucosidic bonds. It is common to find reports of a fast initial
hydrolysis followed by a lag enzymatic degradation. In potato starch (type B)
the size and location of the blockets; bigger than in A-type starches and
located mostly at the surface, may influence the enzymatic pattern [54].
Enzymes (i.e., lipases) are also being used to produce esterification of starch
11

by using long chain fatty acids and by using new methods based on
microwave radiation [41].
1.3.1.2. Microbial metabolites: the case of Ophiostoma spp.
Polysaccharides (PSs) (exopolysaccharides, EPSs; encapsulated
polysaccharides, ECPSs; and structural polysaccharides; EPs) from
prokaryotes (Eubacteria and Archeabacteria) or eukaryotes (algae,
phytoplankton, and fungi) are important biological products of growing
interest for a variety of food and non-food industrial uses such as rheological
modifiers as well as bioactive molecules for therapeutic uses among others
[1].
Structural polysaccharides provide support and give coherence to the
microbial cells. The term exopolysaccharides (EPSs) is used to describe
polysaccharides produced during the growth of the microorganisms and may
occur as ECPSs or as slimy substance surrounding the medium of the cell
which are used by microorganisms to propagate, avoid desiccation,
protection, and as a fixation mechanism, some of them may also have
pathogenic activities [61-63]. In bacteria, EPSs are a protective barrier
against bacteriophage and are produced to resist desiccation and survive
under dry conditions [64]. There is one more possibility in which EPSs are
used as the food source.
The chemical structure of EPSs may be study to support theories associated
to biosynthesis and functionality [65]. EPSs according to their molecular
structure can be divided in homopolymers (i.e., cellulose, dextran, levan,
curdlan, pullulan) and heteropolymers (i.e., gellan, xanthan).
Heteropolysaccharides produced by lactic acid bacteria may be branched and
constituted by different ratios of D-glucose, D-galactose, and L-rhamnose,
and in some cases by glucoronic acid, acetylated amino sugars moieties, and
non-carbohydrate substituents like phosphate or acetate groups [65, 66].
12

Some techniques used to study the chemical structure of microbial
polysaccharides are UV, 1H and 13C solid and liquid state NMR, GC-MS, FTIR,
FT-Raman [67].
Polysaccharides from microbial origin may find or have found applications in
pharmaceuticals, cancer therapy, drug delivery, oil and metal recovery in the
mining industry, waste recovery, detergents, textiles, adhesives, paper,
paint, food, and beverage industries. Alginates, a filamentous or granular
polymer produced by Pseudomonas aeruginosa and Azotobacter vinelandii
bacteria, is a viscous gum that occur in the cell walls of brown algae.
Emulsans produced by Acinetobacter calcoaceticus have found applications as
substrates to produce enzymatic reactions, encapsulate fertilizers, pesticides,
and nutrients, as coatings of roots of seedlings and plants to prevent
desiccation, and as hypo-allergic wound-healing tissue. There are also some
reports in which these materials are used for their metal binding properties
[68]. Gellan gum, used in the food industry, is a water-soluble
polysaccharide produced by bacterium Sphingomonas elodea or S.
paucimobilis, it is used as immobilizing (solidifying) agent of microorganisms
propagated in culture media. Hyaluronic acid (from Streptococus equii and S.
zooepidermicus) is used as ocular, skin, and wound protectant (i.e.,
lubricants), as synovial fluid, and cosmetics. Xanthan (from Xanthomonas
campestris bacterium) (E 415) is widely used as additive in the food industry
as a rheology modifier: as thickening, stabilizing agent and in free gluten
formulations, also as a tertiary crude-oil recovery, in paints, pesticide and
detergent formulations, cosmetics, pharmaceuticals, printing inks, is also
used in combination with guar gum. Cellulose from bacteria (Acetobacter
spp.) is used as temporary skin to heal burns or surgical wounds, in dietary
formulations in combination with vitamins and minerals, as micro membranes
for filtration, as acoustic membranes in audio-visual equipment. Curdlan
secreted by Bacteria Alcalinenes faecalis var. myxogenes, Rhizobium meliloti
and Agrobacterium radiobacter is a polymer used for biodegradable materials
for medical and other important uses. Curdlan is also a gelling and
13

immobilizing agent, it is being tested in combination with zidovudine (AZT)
as antiretroviral (anti AIDS-drug). Succinoglycans (acid glucans) produced by
bacteria of the genera Pseudomonas, Rhizobium, and others have been found
similar applications to curdlan. Dextran (from bacteria Leuconostoc
mesenteroides, Leuconostoc dextranicum, Lactobacillus brevis, and
Lactobacillus hilgardii) has been used as antithrombotic and blood reducer
viscosity and to lower the cholesterol, also in sieving technologies, and as a
micro-carrier in tissue culture (cross-linked dextran) [69].
“Bioplastics” (poly 3-hydroxyalkanoates; PHAs) natural polyesters produced
by bacteria have been intended for plastic bottles, fibers, latex, and in
general for packaging (Biopol® by ICI Ltd). However, the high production
costs prohibits such uses, and PHAs are being used for the manufacture of
medical devices and for therapeutic applications such as thread for sutures,
implants, urological stents, neutral- and cardiovascular-tissue engineering,
fracture fixation devices, in the treatment of narcolepsy and alcohol
addiction, drug-delivery vehicles, cell microencapsulation, support of
hypophyseal cells, or as precursors of molecules with anti-rheumatic,
analgesic, radiopotentiator, chemopreventive, antihelmintic or anti-tumoral
properties (those containing aromatic monomers or those linked to
nucleosides) [70].
Screening of thermophilic and hyperthermophilic bacteria from deep-sea
hydrothermal basins has produced bacteria like Pseudomonas, Alteromonas,
and Vibrio which have been used so far to produce extracellular polymers
(exopolysaccharides; EPSs) in aerobic-carbohydrate-based media. Some
properties studied so far are metal binding capabilities and biological
activities like antitumor, immunostimulatory, and anticoagulant activities.
The anticoagulant activity has been linked to the high sulfate content of
some of these polysaccharides. The uronic acid content in these
polysaccharides varies from 10 to 40%, and posses molecular weights up to
14

1X10⁶ g mol-1. These bacteria may be also a rich source of thermostable
enzymes.
Alteromonas strain 1545 (bacteria), isolated from the epidermis of the
polychaete Alvinella pompejana found in the hydrothermal vents of the
Pacific Ocean (one of the most heat tolerant organisms on earth) produces
under laboratory conditions an anionic EPS, which may consist of glucose,
galactose, glucoronic, and galacturonic acids along with a 4, 6-O-(1-
carboxyethylidene)-galactose residue. Some studies performed on this new
polysaccharide include its rheology, and it has been proposed as a thickening
agent. A polysaccharide secreted by a bacterium (Alteromonoas strain 1644)
isolated from Alvinellide—the polychaete Paralvinella sulfincola also from the
hydrothermal vents of the East Pacific— may be composed of four neutral
sugars and four acidic sugars. Three of the uronic acid residues form a
trisaccharide unit and the last one carries a lactate group. In solution, the a
gel is formed which shows strong selectivity between monovalent and
divalent ions, as well as a great affinity for the divalent ions, higher than
predicted by electrostatic theories, with the exception of Mg2+.
A polymer produced by Alteromonas macleodii subsp. fijiensis, which is an
aerobic, mesophilic, heterotrophic bacterium isolated from a diluted
hydrothermal vent fluid at a depth of 2600 m in a rift system of the North Fiji
basin, is a hexasaccharide with three linked uronic acids and with a side
chain ended by a 4, 6-O-(1-carboxyethylidene)-mannose residue. This
polymer may be used as thickening material and present a shear-thinning
behavior. Gelation properties observed in the presence of calcium can be
explained on the basis of intermolecular Ca2+ bridges formed between
carboxyl oxygen atoms of the glucuronosyl and galacturonosyl residues. A
high metal-binding maximum capacity (up to 316 mg Pb(II)/g polymer) was
observed in a single metal system, indicating that this polymer may have
potential for use in applications in wastewater treatment and
biodetoxification of heavy metal-polluted water. This polymer is hydrophobic,
15
and has been intended to encourage bone healing by adhering onto the
osteoblastic cells. Alteromonas infernus can produce water soluble EPS in
presence of glucose with high attraction for heavy metals such as lead,
cadmium, and zinc. Sulfated and depolymerized of materials may be used as
anticoagulant agents. The EPS produced by Pseudoalteromonas strain 721 is
an octasaccharide with two side chains. This material produces gelatinization
after thermal treatment. This material after gelatinized with NaCl exhibits
viscoelastic behavior.
An aerobic, heterotropic, and mesophilic bacterium (Vibrio diabolicus)
isolated from the polychaete Alv. pompejana found in the deep-sea
hydrothermal field of the East Pacific produces EPS in presence of glucose
characterized by equal amounts of uronic acid and hexosamine (N-acetyl
glucosamine and N-acetyl galactosamine. Structural studies recently
conducted on this polymer demonstrated that it consists of a linear
tetrasaccharide repeating unit. The role of this novel bacteria polysaccharide
in bone regeneration has recently been successfully investigated [71, 72].
Extremophiles are organisms that live and evolve in extreme environments of
temperature, alkalinity, salt concentration, pressure, etc., and fall into a
number of different classes and domini belonging to Archea as well as
Bacteria. They include thermophiles, acidophiles, alkaliphiles, psychrophiles,
barophiles, radiophiles, etc. Extremophile organisms are studied as new
sources of bioactive molecules, and industrial interest. Thermophilic bacteria
— which grow between 60°C and 80°C — belong to the genus Bacillus,
Clostridium, Thermoanaerobacters, Thermus, Fervidobacter, Thermotoga,
and Aquifex. Hyperthemophiles—which can withstand temperatures up to
110°C belong to the Archaea consisting in two major kingdoms and short
phylogenetic branches. Lipids from archeal membranes are known to be
extremely stable materials, and have been proposed for use in drug delivery.
It has been also thought that these materials may be intended for the
production of biodegradable materials. Of special interest is the production of
16

enzymes from these microorganisms. Many materials produced by
thermophilic strains are being studied and characterized like Bacillus spp. a
thermophilic bacterium or Halophilic archaea (e.g., various strains of
Haloarcula japonica)[73, 74]. A thermophilic strain reported by Moriello et al.
[62] produce up to 90 mg/l of EPSs at temperatures of 60°C at pH of 7.0.
Metal and non-metal substrates (teflon, nylon, polycarbonate, and
polyacrylate) have been used as substratum for propagating marine
microorganisms. The complete characterization of the biofilms generated
during this process is in progress, but some researchers have already
generated some rheological and chemical information related to these
materials and the microorganisms. Many bacteria (like lactic acid bacteria)
are characterized by their ability to convert large proportions of their carbon
feed, fermentable sugars, to lactic acid and EPSs. One interesting property is
that many of these EPSs are water soluble or when suspended or dissolved in
aqueous solution provide thickening and gelling properties which may be of
enormous importance in the food and other industries.
EPSs occur in fungi as a fixation system to the substrate, and some of them
may have biological activities or pathogenic effects over the host. Some
species like Pleurotus produce up to 28 g dry weight of EPSs per liter of
culture media. These EPSs have been used for biomedical applications [75].
Selbmann et al. [76] studied the ability of one-hundred and five fungal
strains from 46 species to produce EPSs. They found the highest yields in
Botryosphaeria rhodina DABAC-P82 which in optimal growth conditions of
nitrogen sources (NaNO3) and pH (3.7) produced 2.0 g l-1 after 24 h of
fermentation. The polysaccharides were characterized as
homopolysaccharides of glucose with molecular weights of 4.87X10⁶ Da, and
the potential presence of -1-3 and -1-6 linkages.
17
It has been found that modifying the culture conditions of the fungus
Antrodia cinnamomea — which is used for therapeutic purposes — the
production of biomass and EPSs can be controlled up to certain point. It has
been reported by Lin and Sung [77] a maximum EPSs production of 0.49 g/l.
Ophiostoma spp. is known to produce exo-polysaccharides (EPS) and various
enzymes which have been linked to the pathogenic activity of the fungus. In
synthetic media, different biological activities have been reported depending
on the source of carbon [42, 78, 79]. For various substrates, Przybył et al.
[78] reported the presence of different ‘hydrolytic’ (cellulolytic) endo- and
exo-enzymes in Ascomycetes fungi of the genus Ophisotoma novo-ulmi, O.
ulmi and fast-waxy such as cellulase, polygalacturonase, xylanase, pectinase,
endogluconase, -glucosidase, exo-galactase, exo-glucanase, -galactosidase
and -galactosidase. It is interesting to note that Binz and Canevascini [79],
tested these microorganisms among other substrates for the production of
extra-cellular enzymes in the presence of starch. Their research focused
more on the pathogenic activity of the enzymes, and they reported higher -
glucosidase activity.
Recently, Jeng et al. [42] reported the production of EPSs and or protein-like
polymers in culture media by these fungi in synthetic media containing
various sources of starch. Specifically, they found that the potato starch
contained in the potato dextrose broth (PDB) was not consumed by the fungi.
Instead, they recovered a mass of polymer partially soluble in water, and
with relatively high molecular weight (average molecular weight 1.5X10⁶ Da).
It has been reported that the enzymes used in industry to induce the starch
hydrolysis (-amylase, -amylase, glucoamylase and pullulanase) are
different from those reported in these fungal species [80, 81].
The paper of Jeng et al. [42] also presents results showing that the partial
hydrolysis of EPSs from PDB by 1,4--glucosidase (glucoamylase) and -
18

glucosidase, while -glucosidase partially hydrolyses the yeast polymer, but
the hydrolysis was not present when they used glucosidase.
Sain and Jeng [44] and Huang et al. [43] have reported the synthesis of
starch-like polymers by biosynthetic pathways and the production of films
based on these materials were shown to be highly hydrophobic. They also
reported that this films were stronger compared with films made with non-
modified starches. Specifically, water absorbance was reported for modified
potato, corn, tapioca or rice starches as low as 1 g(H2O)/ g (polymer), while
for unmodified starches this value increased to 8 g(H2O)/ g (polymer). For
films made with the starch-like polymers, the values shown for peak stress
and elongation at break were up to 8 MPa and 10 mm, respectively, while for
films prepared with native starches the values found were 0.3 MPa and 50
mm respectively. The elongation at break was lower in modified starches,
after the modification, the starch gained in rigidity. These authors also
reported the following results for films based on pure amylopectin: water
absorbance, around 5 g(H2O)/ g (polymer); elongation at break of 20 mm;
and peak stress around 1 MPa (values located between the results obtained
for materials made with modified and unmodified starches). The elongation
at break was also higher in amylopectin films compared to that showed for
the starch-like polymers.
1.4. Objectives and approach
1.4.1. Objectives
The literature survey showed that one of the best alternatives to future
biodegradable materials for short-time applications is starch. However, there
are significant drawbacks, such as high water absorption that limits the
current widespread adoption of starch-derived polymers. In addition, it was
found that there is a requirement to develop non-chemical and inexpensive
modifications to enhance the functional properties of starch.
19

It has also been shown in the literature review that microorganisms,
including bacteria and fungi, are able to produce various enzymes and
exopolysaccharides (EPSs) which may be used to induce modifications to
various substrates. The modification of the starch by using isolates of
Ophisotoma spp. is a new research alternative for starch modification.
However, there is a lack and the need of information related to the functional
and chemical properties of these materials.
Since the study of the biosynthetic pathway that control starch modification
by these fungal isolates is an ongoing process, the focus of this work is to
investigate links between the mechanical and structural properties of this
novel material. The results are used to give insights to the process by which
these specific fungal isolates produce the modification. With a better
description of the molecular structure of these materials a better
understanding of the mechanisms of the biosynthesis can be achieved. The
main objectives were as follow:
Study of the dynamic mechanical and thermal properties of modified
starches (known under the commercial name of Polyplast®) to detect
changes in the glass transition temperature (Tg) and susceptibility to
degradation by heat as compared to unmodified starch.
Study of the rheological properties of modified starches (Polyplast®)
to explain their behavior under extrusion and/or injection molding
conditions and to further improve these processes.
Study of the chemical properties by spectroscopic, spectrometric, and
chromatographic methods to provide insights related to the chemical
structure of these polysaccharides and to support the results obtained
by thermal and rheological analyses.
20

Study of the influence of the chemical structure on the mechanical
properties of modified starches.
1.4.2. Approach
To determine the chemical, physical, and mechanical properties of these
materials (Polyplast®) polymers, the following analyses were performed:
Thermal properties (TA) were determined by dynamic mechanical
thermal analysis (DMTA), thermogravimetry (TG), and differential
scanning calorimetry (DSC). These analyses were performed in order
to study important parameters such as the determination of the glass
transition temperature (Tg). The Tg value determined via DMA or DSC,
is one of the most important parameters in the chemical
characterization of the polymers, since the Tg links the chemical and
functional properties. The degradation temperature and other
degradation properties of the biopolymers were studied by TG.
o In order to measure the Tg by DMTA spectra, two different
samples were used: films plasticized with glycerol and produced
by the casting method, and films produced by hot press method
after the extrusion of Polyplast®-glycerol to produce the
respective thermoplastic polymer. In all cases native starch was
used as control. The mechanical properties of these materials
were corroborated by using a universal mechanical testing
instrument and the appropriate standard (ASTM D638, Type I
dog-bone specimens).
Composites produced with micro-clay were produced in
order to investigate its interaction with the modified
starch polymers (Polyplast®). The composites were also
analyzed by DMTA. The mechanical properties of these
21

The flow properties were studied by using a capillary rehometer.
Information related to the shear viscosity and shear rate is generated
using this instrument. The determination of these parameters is
important since the capillary rehometer mimics the process by which
the material is forced through a nozzle similar to an extrusion process.
Spectroscopic analyses (FT-IR, FT-Raman, 1H NMR, 13NMR, as well as
XRD) were performed in order to study the molecular structure of the
the materials. To determine the sugar and polymer composition the
following techniques are used: high performance anion exchange
chromatography with pulsed amperometric detection (HPAEC-PAD)
and matrix assisted laser desorption/ionization time of flight mass
spectrometry (MALDI-TOF MS).
Important morphological features of modified starches were
determined using scanning electron micrographs and optical
microscopy.
22

1.4.3. Structure of thesis
According to this brief introductory chapter, the thesis is separated into five
chapters:
Chapter one reviews important topics related to the molecular
structure of starch and its influence on the enzymatic and microbial
modes of action. It gives also a quick introduction to this project,
including its objectives and significance.
Chapter 2 explains the process followed to produce the
polysaccharides which are used through this work.
The third chapter show the results obtained through the various
analytical techniques starting from the chemical and microscopic
analyses, followed by viscoelastic and thermal properties, and finally
the mechanical properties.
General conclusions are reported in section 4.
The future work is briefly described in section 5.
The sources used to support this investigation are listed in section 6.
23
2. Experimental
2.1. Production of bio-polymers
Native potato, and tapioca starches were obtained from Jack Hua Company
Limited (Thailand) and Wind Mill imported by Western Rice Mills LTD,
Canada), respectively. Potato dextrose broth (PDB) was from Sigma-Aldrich.
Corn starch was from CASCO Co. Canada. Production of modified starches
were carried out according to the methods followed by Jeng et al. [42] and
Huang et al. [43]. Modified starches were produced by fermentation with
isolates of the fungus Ophiostoma.
The process consisted in the production of the stock culture and further
inoculation the culture media containing the starch. The basal culture
medium used for preculture and culture production, was with minor
modifications, the method described by Selbmann et al. [76]. The growth
medium contained 2 g of yeast extract, 10 g of glucose, 1 g of KH2PO4, 0.1 g
of MgSO4.H2O, 1 g of ZnSO4 solution (36 mg in 100 mL of distilled water),
and 1 g of FeCl3.6 H2O solution (48 mg in 100 mL of distilled water), per liter
of distilled water. The pH of the medium was 4.5± 0.5. This stock solution
was incubated for 72 hours (or until mycelia dry weight of 7-8 g per liter was
obtained) in a shaker at 150 rpm at room temperature.
For the production of the polysaccharides (bio-plastics), objective of this
study, 20 g (dry weight) of corn, potato, or tapioca starch were feed to one
liter of culture growth (prepared with the same formulation as stated
previously). Potato dextrose broth (PDB) was used as specified by the
provider. The growth medium was sterilized by autoclaving for 20 minutes at
121oC (250oF). The process was subsequently improved to reach a mass
production of ~300 g of polysaccharides per liter of culture media. The
recovery of polysaccharides was performed either by using ethanol (99%) or
24

by ultracentrifugation (see the referred articles). Spores were removed from
the solution by using ultracentrifugation at 16000 X g for 20 min. The
polysaccharides were recovered by precipitation with two volumes of ethanol
(98%) at room temperature from the cell free solutions. Polymers were
freeze-dried and weighed for yield determination.
Since the processing conditions have been constantly changed to improve the
mass production, the overall results shown in this work represent an average
of a minimum of 10 different batches all with the same properties. To ensure
quality control, the batches were analyzed by spectroscopic and thermal
properties. These polysaccharides were used with minor changes according
to the requirements of the different techniques during the chemical analyses.
Details when necessary are provided for each particular technique.
2.2. Protein determination
The presence of protein (~0.2%) was confirmed from free cell starch-
polymer samples by using crystallized bovine albumin (Sigma Co., U.S.A.) as
standard and Coomassive brilliant blue R-250 as the dye reagent, method
from Bio-Rad Bradfor Protein Assay with BSA (bovine serum almbumin; Bio
Rad Co., Technical note 1069) at a UV adsorption of 595 nm. Therefore,
further analyses were performed with relatively pure polysaccharides.
25
3. Results and analysis
3.1. Morphology and chemical analyses
3.1.1. Morphology (SEM and FT-Raman confocal analysis)
3.1.1.1. Introduction
In the structure of the starch granules, pores, channels, or voids can be
observed by using scanning electron microscopy. These structures may allow
the dispersion or flow of water, solvents, chemical or enzymatic reagents in
starch. The removal of channel-associated proteins, would also allow for new
and important starch derivatives [82-84]. Proteins located in the channels
may interfere with the flow of the different solutions. The removal of proteins
with enzymes e.g. proteases, may allow for better internal reactions. During
enzymatic treatments of the starch granules pin-holes on the surface and
strong internal degradation are produced [82]. The crystalline areas are less
accessible to chemical or enzymatic substitutions, but they may be affected
in first instance near to the branching points as noted above. Cross-linked
corn starch hydroxypropyl ethers, for example, were found to be substituted
at these points. Substitutions may introduce bulky molecules which interfere
with the tendency of the amylopectin to retrograde in solution. Therefore,
substituted amylopectins may remain more time in solution. Methyl
substituents in potato starch have also been reported in the amorphous
regions of the amylopectin clusters. In 2-nitropropyl starch the susbstituents
are almost exclusively bound to the amylose molecule. This could indicate a
relationship with initial complex-building between the starch and the reagent.
Enzymatic and acid hydrolysis of cationic waxy corn starch showed that
cationization in an aqueous slurry predominantly occurs in the amorphous
areas of the granule, and especially near the branching points of the
amylopectin molecules, on the surface, and inside of the channels.
26

3.1.2. Materials and methods
The morphology of the starch granules after fungal treatment was examined
by using a Hitachi S800 scanning electron microscope at an accelerating
voltage of 10kV. The samples were coated with platinum-palladium for the
analyses. The confocal optical microscope Senterra (Bruker Optics USA) was
used for the visual inspection of the samples.
3.1.3. Results and discussion
Starch occurs as discrete semi-crystalline granules of various sizes, size
distribution and shapes. The size of the granules varies from ~20 to 80 m.
Fig. 1 shows an optical microscopic image (confocal microscope FT-Raman)
of some granules (potato from Maple Smell, Summer Star Trading Co. LTD
Toronto, Canada). The pith of the granule can be observed at the centre and
the alternating growth rings in dark and white contours. The width of the
alternating rings or shells is ~1200-4000 Å/~0.1 to 0.5m.. Scanning
electron micrographs (SEM) showed the presence of pores in the surface
(Fig.2).
The granular aggregation is shown in Fig. 3. It is interesting to note in this
micrograph that the granules adopt the shape according the neighboring
granules saving room within the main structure that holds the granules (i.e.,
kernels in corn). Figs. 4 and 5 show the complexing of amylose-iodine and
therefore the regions of amylose distribution within the starch granules.
These images were obtained by using an optical microscope with a resolution
of 1 m (FT-Raman confocal optical instrument). The smallest structures
detected by AFM were observed in small round structures of 300 nm (3000
Å). These structures are probably the so called “blockets”. Each blocket is
formed by concentric layers of 40-70 nm (400-700 Å) [51, 52].
27

Figure 1- Confocal FT-Raman microscope observations of a variety of used commercial potato starch; Scale= 10 microns
Figure 2- SEM image showing the porosity at the surface of the granules Scale=6.1 m
28
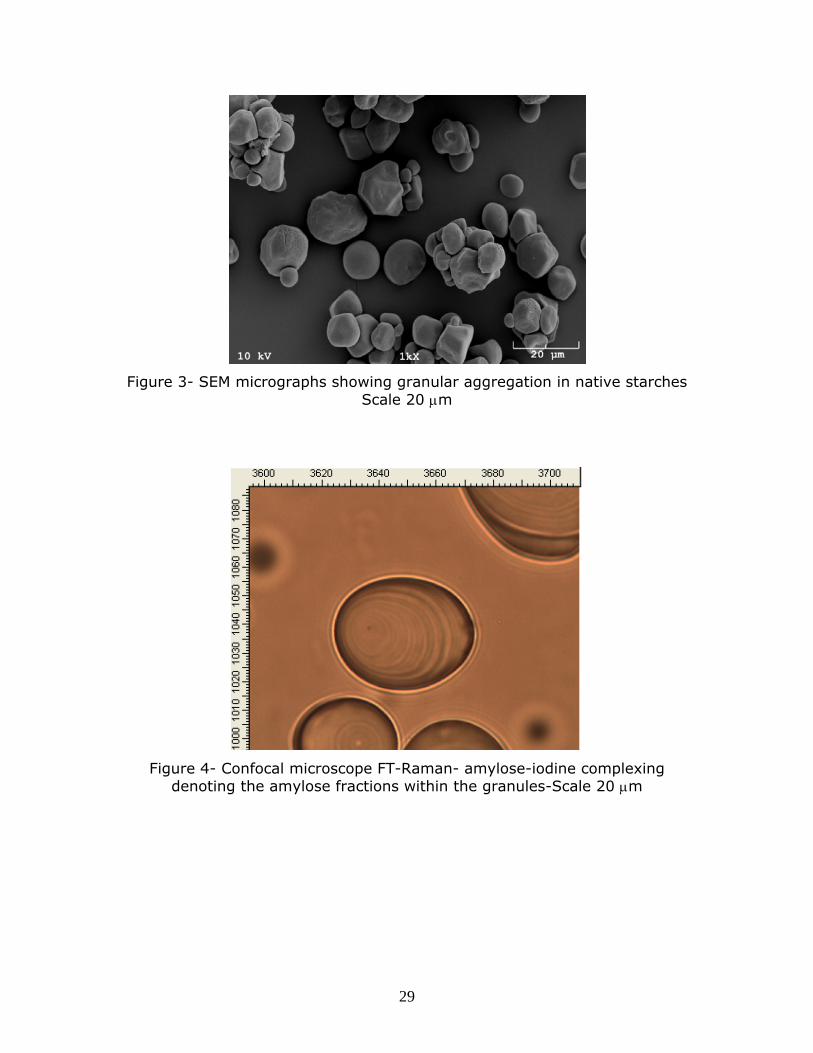
Figure 3- SEM micrographs showing granular aggregation in native starches Scale 20 m
Figure 4- Confocal microscope FT-Raman- amylose-iodine complexing denoting the amylose fractions within the granules-Scale 20 m
29

Figure 5- Confocal microscope FT-Raman- amylose-iodine complexing denoting thick layers of amylose fractions within the granules-Scale 20 m
It is possible to observe from the micrograph of NS the porous nature of the
native starch granules as well as a smooth surface. Electronic micrographs of
native and treated starch granules are shown in Fig. 6. These images show
that the fungal treatment may result in the damage and/or blocking of the
pores as well as in a visible rough appearance of the surface, this is believed
to be caused by the deposition of some polysaccharides within the granules.
Chemical analyses of the starches suggest that the hydrolysis should occur
primarily at the amorphous areas of the granules. Some of these patterns
are coincident with a typical enzymatic degradation [58, 83]. Fig. 7 also
shows that modified starch granules are physically affected after the
modification. The granules are affected on the surface and others collapsed
or showed visible damage at the pith.
30

Figure 6- Optical images of modified starch granules
.
Figure 7-SEM images of modified starch granules
31

3.1.3.1. Conclusion to this section
Some important structural features of the starch granules can be determined
by SEM and FT-Raman confocal optical microscopy such as the crystalline
pattern and surface porosity. The amylose fraction in these particular starch
sample seems to be located in specific growth rings (and it is distributed
randomly within the granules), feature which may influence the enzymatic
activity. Although no evidences of damage to the crystalline regions of
modified starch granules were obtained by XRD analysis, the scanning of the
granular surface of the granules showed visible damage associated with
typical patterns of enzymatic activity.
3.2. XRD
3.2.1. Abstract
X-ray diffraction patterns of modified starches did not show changes in the
crystalline composition respecting native starches. Gelatinized and dried
starches showed the lack of crystalline regions due to the disruption of the
amylopectin ordering regions.
3.2.2. Introduction
By using small angle X-ray scattering Oostergetel and van Bruggen[53]
proposed a model for the organization or architecture of the amylopectin
molecules in which these molecules form a three-dimensional tetragonal
super-helix structure which was estimated to be 40 to 70 nm by using small
angle X-ray scattering. The organization of the amylopectin molecules is
complex. It is believed that one hypermolecule of amylopectin carries just
one reducing end. The branches in the amylopectin occur at the C-6 position.
They are on average 30 glucose units. There are branches which are not
32

substituted in the C-6 position (A-type branches) and substituted branches
(B-type). The branches may be occurring in pairs which twist together in a
helical fashion. Six of these double chains form an individual crystalline
structure and lead to progressive accumulation of structures up to the
formation of the three-dimensional structure. What occurs in this process has
not been totally explained and the denomination of some of the cumulated
structures were given the name of ‘stacks’.
It has been clearly observed by X-ray diffraction that there is a constant 9
nm in periodicity due to the crystalline regions of starch [48, 49]. Based on
the X-ray diffraction patterns there are three allomorphs identified with
cereal (type-A), tuber (type-B) and pea starches (type-C). B-type starches
are produced if the central cavity of the crystalline hexagon (the middle
channel) is filled with some water molecules, whereas the type-A crystals
have another double-helix within the middle channel giving rise to a densely
packed crystallite. Type-C is a combination of A- and B- allomorphs.
The lamellae responsible for the crystalline regions, are formed by three
discrete components the backbone which supports the double helices,
parallel ‘rigid’ double-helical (menogenic) units (~5-6 nm) and amorphous
regions (more flexible un-branched regions, also called ‘spacers’ or side
chains) with sizes of ~4 nm. It has been observed by Waigh et al [48] that a
simultaneous appearance and disappearance of the 9 nm and 1.6 nm
reflections in small angle X-ray scattering occurs under hydration and
dehydration experiments. The hydration produces the 9 nm reflection due to
the smectic periodicity. With a ~10% mc solid state NMR spectra show a set
of 4 sharp with a doublet or triplet at ~100 ppm (Three peaks in starches
type A, and two in type B) associated to the crystalline regions—crystallinity
in corn is ~40% and 20% in potato starch. Neither dehydrated native
granules (<5% mc) nor the amorphous dehydrated starches show these
signals. The same phenomenon occur for highly hydrated starches (~20%
mc <). These authors suggested that under dry conditions the starches may
33

be in a pure glassy form (<5% mc), while moisture contents of ~10 % allow
the formation of crystalline regions. These particular structures of
intermediate order are known as liquid crystals; SCLCP (side chain liquid
crystal polymer). The degree of mobility of these three components, coupled
with the helix-coil transition, may be used to explain physicochemical and
structural properties like gelatinization, dehydration or molecular
composition.
3.2.3. Materials and methods
Starch granules were examined by using a Hitachi S800 scanning electron
microscope. The granules were mounted on an aluminum stub using double-
sided adhesive tape. The stubs were platinum-palladium coated and the
starch was viewed at an accelerating voltage of 10kV.
X-ray diffraction patterns (PXRD) of the starch samples were obtained using
a Shimadzu S6000 diffractometer operating at 40V and 30 mA (Cu Ka
radiation of 0.154 nm). The samples were tested without prior treatment.
The intensity was measured from 5 to 40° as a function of 2and at scanning
speed of 0.5/min and step size of 0.05°.
3.2.4. Results and discussion
PXRD patterns of analyzed starch samples as shown in Fig. 8. GMS (granular
modified starch), GNS (granular native starch), DMS (gelatinized modified
starch), NS (gelatinized native starch). Gelatinizes starches showed the
pattern of amorphous materials, and the patterns of GMS and GNS were
similar showing some crystallinity. Hence, no new crystalline formation or
degradation in the amylopectin fraction occurred after the modification in the
starch granules (GMS or DMS). Moreover, both starches showed a peak at
approximately 9°C after gelatinization which may be characteristic of
amylose resistant regions of starch
34

Figure 8--PXRD patterns of granular native starches (GNS), native gelatinized starches (NS), modified gelatinized starches (DMS), and granular modified
starches (GMS)
3.2.5. Conclusions
The modification of granular starches do not affect the crystalline regions of
the starch. Therefore, the modification may be occurring on the amylose
fraction and due to the deposition of fungal exo-metabolites.
3.3. FT-IR (ATR)
3.3.1. Abstract
FT-IR spectroscopy was used to study the chemical properties of modified
starches. These polymers were produced from commercial starches as shown
in section 3 (cf. “Starch-like exopolysaccharide produced by the filamentous
fungi Ophiostoma sp.” Jeng et al., 2007, Forest Pathology, 37, 80-95).
35
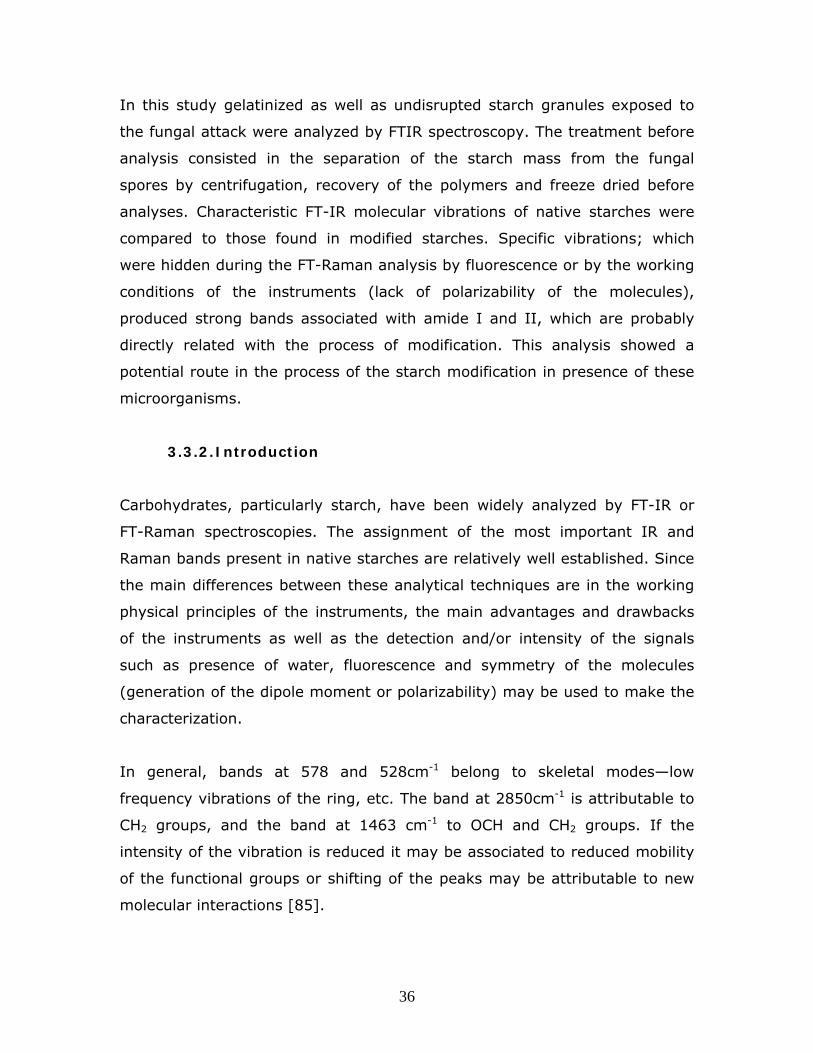
In this study gelatinized as well as undisrupted starch granules exposed to
the fungal attack were analyzed by FTIR spectroscopy. The treatment before
analysis consisted in the separation of the starch mass from the fungal
spores by centrifugation, recovery of the polymers and freeze dried before
analyses. Characteristic FT-IR molecular vibrations of native starches were
compared to those found in modified starches. Specific vibrations; which
were hidden during the FT-Raman analysis by fluorescence or by the working
conditions of the instruments (lack of polarizability of the molecules),
produced strong bands associated with amide I and II, which are probably
directly related with the process of modification. This analysis showed a
potential route in the process of the starch modification in presence of these
microorganisms.
3.3.2. Introduction
Carbohydrates, particularly starch, have been widely analyzed by FT-IR or
FT-Raman spectroscopies. The assignment of the most important IR and
Raman bands present in native starches are relatively well established. Since
the main differences between these analytical techniques are in the working
physical principles of the instruments, the main advantages and drawbacks
of the instruments as well as the detection and/or intensity of the signals
such as presence of water, fluorescence and symmetry of the molecules
(generation of the dipole moment or polarizability) may be used to make the
characterization.
In general, bands at 578 and 528cm-1 belong to skeletal modes—low
frequency vibrations of the ring, etc. The band at 2850cm-1 is attributable to
CH2 groups, and the band at 1463 cm-1 to OCH and CH2 groups. If the
intensity of the vibration is reduced it may be associated to reduced mobility
of the functional groups or shifting of the peaks may be attributable to new
molecular interactions [85].
36
Carbohydrates have many strong bands in the 1160-1000 cm-1 region
involving stretching of the C-O bonds of C-O-C groups. The strong absorption
near 3350 cm-1 is associated to OH stretch. The shape of this curve is
affected mostly by hydrogen bonds. There is medium-weak CH stretch band
near 2900 cm-1 and multiple medium bands in the 1460-1200 cm-1 region
involving CH2 deformation, CH and CH2 wag, and OH in-plane deformation.
The medium weak bands in the 960-730 cm-1 region have been the most
studied resonances in the characterization of the different types of
carbohydrates. In the pyranose type sugars, bands associated to in-phase
ring stretch at 770± 14 cm-1 and resonances involving COC out-of-phase
stretch in the ring have been also reported at 917 ± 13 cm-1. and
anomers have been also reported at 844 ± 8 cm-1 and 891 ± 7 cm-1
respectively.
3.3.3. Materials and methods
Spectrophotometers used in this study were: FT-IR model Tensor 27 from
Bruker Optics, USA. KBr pellets or ATR mode were utilized for the analysis by
FT-IR. The samples were analyzed with a resolution of 4cm-1 and an average
scanning time of 1 min. The spectral resolution for samples tested in the
Tensor 27 (KBr pellets) was within the range 4000 to 400 cm-1. The spectral
resolution for samples tested in the ATR mode was within the range 4000 to
600 cm-1.
The FT-Raman spectra were collected on a Senterra from Bruker Optics
(USA) at operating wavelengths of 785 (at 100mW) and 532 (at 20 mW).
Data for Raman mapping over the starch granules were collected randomly
over an areas no bigger than 50.0X50.0 microns (the size of the potato
starch granules analyzed was around 40 m, while the starch granular size of
corn and tapioca averaged ~10 m). Resolutions allowed with this instrument
were ~9-12 cm-1 (with one spectral range of 70, 3500) and ~3-5 cm-1 (with
37

various spectral ranges). Data were processed using the integrated software
Opus version 6.0.
3.3.4. Results and discussion
3.3.4.1. FTIR
FT-IR and FT-Raman are routinely used in research and for process control
[86]. In particular, these techniques have been widely used since many
decades ago to study the structural variations of starch subjected to chemical
or physical modifications [87, 88]. Potential variations in the chemical
structure of starch after the fermentation were first studied by FT-IR
spectroscopy. The results are shown in Table 2. IR bands between 2800-
3000 cm-1 are related to stretching of CH2, and bands around 2920 and 2850
cm-1 are generated due to the asymmetric and symmetric stretching of
methylene, respectively. Bands associated to C-O stretching at 900-1260
cm-1 showed a broader absorption band range in modified starches, some
chemical interaction may also be occurring at this bonding position. Peaks at
1472-1466 cm-1 arise due to scissoring vibrations of CH2. The scissoring
bands showed variations with interchain interactions, packing arrangement
and ordering of methylene groups [89]. These bands showed drastic changes
in the position after the starch fermentation. The shifting of the band at
2927 to 2922 cm-1 showed a slight variation, and suggests a lower molecular
mobility after the fermentation. The band associated to O-H stretching [89-
95] also showed the shifting from 3447 to 3421 cm-1, indicating also a lower
molecular mobility. The band located at 1636 cm-1 in native starches shifted
within a broader spectral range from 1649 to 1623 cm-1.
38

Table 2- FT-IR data: GMS (granular modified starches); DMS (gelatinized
modified starches); GNS/NS (granular or gelatinized native starches)
W cm-1
GMS W- cm-1
DMS W cm-1
GNS/NS Assignments for the starch molecule
based on its molecular structure and comparison with general
vibrations
Assignments of functional groups for spectral peaks wavenumbers in cm-1
3421 3424 3447 O-H stretching - 2964 2963 - 2962 ± 10 C-H stretches of alkenes in CH3
asymmetric vibrations 2922 2923 2927 C-H asymmetrical stretch vibrations
in CH2 2926 ± 10 C-H asymmetrical stretch in alkanes in CH2 vibrations 2925± 5 CH3 symmetric stretch in benzene rings (low probable)
2882 - - - 2872 ± 10 C-H stretches of alkenes in CH3 symmetric vibrations
2852 2853 2853 C-H symmetric vibrations in methylene
2855±10 C-H stretches of alkenes in CH2 symmetric vibrations
1649-1623 1629-1619
1636 H2O entrained in the sample; O-H bending vibration
Also may show C=O stretching and C–N stretching
1566 - - Aromatic ring in lignin and others 1470-1460 1465 1459 Scissoring vibrations of CH2 C–H bending in alkyl groups
1441 - - C-H bending 1418 1418 1420 - C-H deformation
1400 - - C-H deformation 1366 1384 1375 - C-H vibrations 1339 - 1344
(small shoulder)
-
1262 1262 - - 1280-1185 C-O-H deformation and C-O stretching in phenolic compounds. N-H bending in amine III
- - 1256 (small
shoulder)
C-O-H deformation in starch
- 1237 - - C-O-H deformation due to new inter- and intramolecular bonding
1165-1153 1175 1162 - 1144 -
1107-1080 1086 1090
O-C stretch within the anhydroglucose ring
- - 1041 - - -
1017 (1055-984)
1023 1021 C-O stretch in the ring -
923 929 926 C-O bending in starch - 863 863 858 C-H bending 810-750 out of plane C-H bending bands in mea-
substituted benzene rings - 846 - -
799 803 805 (small shoulder)
- out-out-plane C-H bending in mono- and disubstituted benzene rings 810-750 with ring bend (690±10) 860-790 no ring bend
764 764 763 - Possible C-H rocking 752 - - 740 - -
707 717-707 712 - - 661 661 - 1350±50 and 650±10 OH bends in benzene rings 614 622 613 - Probably due to halogenated compounds, which
are found in this range and up 575 571 573 - - 533 531-518 526 - - 479 490-455 - - - 436 426 - - -
39

The Figures from 9 to 12 show the different spectra of EPSs
(exopolysaccharides) and GMS/DMS (granular or gelatinized modified
starches) which were recurrent in the multiple samples tested. New peaks
with high intensity were depicted at ~2964±5, 1745, 1262 and 800 cm-1.
The peak at ~2964±5 cm-1 was associated with to Va(C-H) vibrations in CH3
(Va; asymmetric stretching vibrations). The band at 2855±10 cm-1 was
associated to Vs(C-H) (Vs; symmetric stretching vibrations) in CH2. The band
at ~ 2925 ±5 cm-1 corresponds to Va(C-H) in CH2. Double bonds may be
associated to the chemical vibration at 1745 cm-1. A peak with high intensity
also arose at the region of C-O-C stretching (bands at ~1000 and 900 cm-1)
in GMS or DMS from tapioca starches. The spectrum corresponding to EPS
which were produced in the absence of starch displayed the peak at ~1747
cm-1 which may be associated to the presence of double bonds (Figs. 9, 10
and shoulder in 11 and 12). The peaks appearing at ~1262 and 800cm-1
were further localized in water soluble fractions of modified starches, but not
in water insoluble fractions (Fig. 13). Hence, the two different spectra may
be attributed to two different stages in the process of modification.
4000 3500 3000 2500 2000 1500 1000 500
0.00
0.01
0.02
0.03
0.04
0.05
0.06
Abs
orb
ance
uni
ts
Wavenumber cm-1
1745
2854
2925
1081
3421
1465
1261
Figure 9- FT-IR spectrum of modified starches- (detection of the peak associated to double bonds probably in C=O vibrations)
40

4000 3500 3000 2500 2000 1500 1000 500-0.01
0.00
0.01
0.02
0.03
0.04
0.05
0.06
0.07
0.08
Abs
orb
anc
e u
nits
Wavenumber cm-1
1747
Figure 10- FT-IR spectrum of exopolysaccharides (EPSs) produced in absence of substrate (detection of the peak associated to double bonds probably in
C=O vibrations)
4000 3500 3000 2500 2000 1500 1000 500-0.002
0.000
0.002
0.004
0.006
0.008
0.010
0.012
0.014
0.016
0.018
Abs
orb
anc
e u
nits
Wavenumber cm-1
800
1260
2855
29252964
Figure 11--FT-IR spectrum of granular modified starches (G-MS) (detection of the peaks at ~800 and 1240 cm-1)
41

4000 3500 3000 2500 2000 1500 1000 500
0.00
0.01
0.02
0.03
0.04
0.05
Abs
orb
ance
uni
ts
Wavenumber cm-1
Figure 12- FT-IR spectrum of exopolysaccharides (EPSs) produced in absence of substrate (detection of peaks at 800 and 1240 cm-1)
A clear separation of the peaks at 800 and 1240 cm-1 was achieved in two
different fractions of the starch one soluble and the water insoluble. Both
fractions are depicted in their respective FTIR spectra in Figure 13. In the
spectrum of the “water insoluble” fraction it was observed the presence of
two characteristic peaks at 800 and 1260 cm-1. The vibrations, related to CH2
and CH3 stretching, were also consistent through the process of modification.
These vibrations appeared with lower intensity or just slightly depicted in the
fractions denoted as “water soluble”. It was also possible to observe the
change profile of the vibrations related to C-O-C (1055-984 cm-1) in these
water soluble fractions. Two distinctive spectra were taken for the EPS
polymers. It was also possible to observe the two peaks at ~1260 and 800
cm-1. However, the shoulder at ~1740 showed higher intensity, and in
general, the spectral profile presented broader peaks.
42

Water insoluble fraction
1259
7972916
2849
2961
Water soluble fraction
500100015002000250030003500
Wavenumber cm-1
0.00
00.
005
0.01
00.
015
0.02
00.
025
0.03
00.
035
Abs
orba
nce
Uni
ts
Figure 13-FT-IR spectrum of modified starches- separation of water-like and water insoluble fractions
3.3.4.2. FTIR (ATR)
As it was shown before, in starch the IR bands between 2800-3000 cm-1 are
related to the stretching of CH2, and bands around 2920 and 2850 cm-1 are
generated due to asymmetric and symmetric stretching of methylene,
respectively. Peaks at 1480-1450 cm-1 arise due to scissoring vibrations of
CH2. These scissoring bands are sensitive to variations with inter-chain
interactions, packing arrangement and ordering of methylene chains. The
band at approximately 1650 cm-1 is associated with water strongly bonded to
the starch molecules. The band at 960-1100 cm-1 is related to C-O-C
stretching in the glucopyranose ring.
43

The spectrum of native-starch/clay/glycerol composites and pure clay are
shown in Fig. 14 (see section 3.9.4.4). It was observed that the band at
~1023 cm-1 remained without change from native to modified starches. It is
also interesting to note the disappearance of one of the bands of the
spectrum of clay at ~3600 cm-1 in both starch composites (native and
modified) which suggests some molecular interactions.
Fig. 15 shows the ATR spectra of two samples of modified-
starch/clay/glycerol composites. In these samples new bands were observed
in the region of CH2 at 3000-2800 cm-1 and ~1470cm-1 (branching points of
starch), at ~1590, 1545 and 1655 cm-1. The band near the 1650 cm-1
attributed to water strongly attached to the starch did not showed a drastic
change in native/starch-clay-glycerol composites, but shifted in
modified/starch-clay-glycerol composites showing also a strong band. In a
recent study, it was found by solid state 13C NMR a larger anisotropic
interaction in the chemical shift associated to C6 and the broadening of the
CH2 band by FT-Raman spectroscopy (as it was shown by solid state NMR).
To investigate the source of these bands, the analysis of exo-polysaccharides
(EPSs) and protein-like compounds were analyzed by FTIR. The spectra of
the protein fraction showed bands at ~1650, 1540 cm-1 as well as strong
bands at ~1440cm-1 corresponding probably to more complex vibrations
associated to OH groups. A comparison with a known protein showed that
these bands correspond to amide I and II respectively. However, the band at
1650 and 1450 cm-1 were also detected in EPSs (spectra not shown).
44

100020003000
0.0
0.8
100020003000
0.0
0.4
Wavenumber cm-1
AT
R U
nits
Figure 14---Attenuated total reflectance (ATR) spectrum of native-starch/glycerol/clay composites (top) and clay spectra (below)
3697
32743307
2921
1651
1544
1454
1023998
100015002000250030003500
1590
16592880
29252954
3311
1023
100015002000250030003500
Wavenumber cm-1
AT
R U
nits
Figure 15--Attenuated total reflectance (ATR) spectrum of two different samples of modified starch clay glycerol composites showing complementary information related to new molecular interactions
45
3.3.5. Conclusions
The increase in mechanical properties of starches modified by fungal isolates
of the genus Ophiostoma has been reported in previous studies [21, 24]. In
this study, some of the potential sources of the functional properties of these
polysaccharides were investigated. Analysis of the glass transition
temperature (Tg) by DMTA on various specimens of modified starches showed
that various thermal transitions and new chemical bonds are produced due to
the fungal modification of the starch. These thermal relaxations may be
attributed to exopolysaccharides or protein-like compounds produced by the
fungi during the process of modification. Moreover, while native-
starch/clay/glycerol composites displayed a separation of the glycerol phase,
the samples prepared with modified starches showed a better affinity
towards the filler (kaolin clay) which was used as a reinforcing material.
Finally, it was found that the increase in the stiffness of the modified starches
is due to the reduction of the molecular motion produced by cross-link type
bonds occurring mainly at C6 (the branching points).
The FTIR spectra of modified starches and EPSs produced by the fungi in
absence of starch overlapped indicating similar chemical composition. New
peaks found in modified starches indicate the chemical molecular
modifications. These peaks can be associated to the CH2 stretching vibrations
at the methylene groups in C6 and double bounds. Also new peaks at 800
and 1250 cm-1 were detected. However, these peaks cannot at the moment
be associated with any particular molecular vibration.
46

3.4. FT-Raman
3.4.1. Abstract
The tracking in the process of the starch modification in presence of
Ophisotoma spp. was intended by using FT-Raman spectroscopy. Some
important changes in the chemical structure of starch were observed.
However, change in some characteristic bands associated to the process of
liquefaction (480cm-1) or saccharification (910-935 cm-1 region and 1127 cm-
1) were not observed within the 3rd day of modification. However, a broad
band was detected at the CH symmetric stretching vibration suggesting
strong molecular interactions at the methylene group, but not appreciable
degradation was observed in the X-ray diffraction pattern of modified
starches. Although, some bands at the region of double and triple bonds
were detected, just the band at ~2629 cm-1 was consistent within the
variation of ±5cm-1. Therefore, it is concluded that the presence of some
chemicals are influencing the stronger molecular interactions in these
materials.
Raman scattering is inherently an inefficient process, a practical obstacle to
Raman studies is interference from fluorescence or phosphorescence.
Troublesome fluorescence can arise either from impurities or from the
intrinsic relaxation process resulting from an electronic absorption of the
sample in resonance Raman spectroscopy. Crystalline regions of starch or
packing of the material could produce delays in this process yielding a curved
spectrum (as occur with potato and tapioca or corn starches). The Raman
spectrum yielded a curved profile in corn or tapioca starch granules while the
respective spectrum taken from potato produced a flat base line. These
variables can also influence the intensity of the Raman bands when the
molecular excitation is produced with a laser at 532 nm. The effects were
reduced by using an excitation wavelength of 785 nm. However, the mapping
47

spectrum of native starches produced particular spectral deformation not
found in native starches.
It was concluded that fluorescent substances remained in the starches
samples after the modification and that the functional groups sensibly
affected the CH symmetric and asymmetric modes, particularly the CH
symmetric stretching at the C6 in the glucopyranose ring.
3.4.2. Introduction
For FT-Raman spectroscopy the most important bands found in native
starches include the strong adsorption at 3000-3500 cm-1 and ~2910 cm-1
related to OH and CH stretching modes. The relatively low intensity signals at
1460, 1380 1339 and 1262 cm-1 include respectively the CH2 symmetric
deformation, CH2 scissoring and COH deformation, CH2 twist and COH
bending, and CH2OH (side chain) related mode. A series of signals between
1130 and 1050 would include COH deformations. The band at 940 ±6 cm-1 is
related to the skeletal mode involving the -1-4-glucose linkage (COC). The
signal at 866 cm-1 is associated to CH and CH2 deformation. The strong
resonance located between 614 and 440 cm-1 belong to the skeletal mode
related to C-C stretch in the ring.
3.4.3. Materials and methods
FT-Raman spectra were recorded by using a Senterra spectrometer from
Bruker Optics. This model incorporates a dual laser Raman spectrometer
module and a confocal microscope module. The confocal capability allowed
for visual inspection of the samples as well as spectral analyses. Two lasers
are integrated to this instrument 785- and 532-nm which were used at 100
and 20 mW respectively. The time of scanning was 30 seconds for all
samples. In serial mapping, spectra were obtained sequentially from a series
of positions using point-by-point scanning through a squared grid of ~150
48

m. Two wavenumer resolutions were used 3.5-5 cm-1 and 9-12 cm-1. The
3.5-5 cm-1 resolution allowed to record within different spectral ranges: 70,
1555; 1525, 2740; 2710, 3700; 70, 1555 and 1525, 2740; 70, 1555 and
2710, 3700; 1525, 2740 and 2710, 3700; 1525, 2740 and 2710, 3700; 70,
1555 and 1525, 2740 and 2710, 3700 cm-1. And just one spectral range of
70, 4500 cm-1 for 9-12 cm-1. All data was processed using the integrated
software Opus version 6.0. Calibration of frequency and intensity was
performed automatically with the integrated method SurCal®. Spectral
shape correction was also applied to the spectra. This special feature divides
the sample spectrum with a reference spectrum. The reference sample is a
fluorescence standard which produces the typical broadband curve of light.
The spectra taken when this feature is activated in the spectrometer will be
background corrected, reducing therefore the effects of fluorescence.
Comparison of relative frequencies of peaks and respective assignments were
performed according to the literature.
3.4.4. Results and discussion
Amylose and amylopectin form the starch granules, and are made up of -(1-
4)-linked D-glucose residues. Amylose is a linear polymer, whereas
amylopectin has a dense (1-6) branching pattern. Depending on the starch
source, the granules are considered to occur in three crystalline forms,
differentiated by their X-ray diffraction patterns. The A-form is found in
cereal starch, whereas the B-form occurs in tuber starches; the C-form is
rare and has been observed in, for example, tapioca, pea, and banana
starches. It seems that the A-, B-, and C-structures are very similar, and are
probably different hydrates having the same chain conformation. Many of the
spectral similarities and/or differences probably occur due to the different
interatomic distances between the molecules and/or intensity of hydrogen
bonds produced by interacting external molecules such as water. The
molecular motion of crystalline to amorphous allomorphs or new molecular
49

interactions of the starch molecules are sensitive to spectroscopic methods
such as FT-IR and FT-Raman.
In particular for this study, the FT-Raman spectra showed clear modifications
of the O-H and C-H stretching regions of the starch molecules after the
fungal modification, and also important spectral differences between native
and modified starches were observed in the region below 1500cm-1.
The Raman spectra of carbohydrates, particularly starch, have been analyzed
by Raman spectroscopy. Since the assignment of the most important IR and
Raman bands present in native starches are relatively well established, the
variations in peak intensity and shifting of the bands can be used for in situ
characterization of the materials (Table 6). The advantages and/or
drawbacks of the instrument (fluorescence and symmetry of the molecules;
generation of the dipole moment or polarizability) may also be used for
materials characterization. For FT-Raman spectroscopy the most important
bands found in native starches include the strong adsorption at 3000-3500
cm-1 and ~2910 cm-1 related to OH and CH stretching modes. The relatively
low intensity signals at 1460, 1380 1339 and 1262 cm-1 include respectively
the CH2 symmetric deformation, CH2 scissoring and COH deformation, CH2
twist and COH bending, and CH2OH (side chain) related mode. A series of
signals between 1130 and 1050 cm-1 would include COH deformations. The
band at 940 ±6 cm-1 is related to the skeletal mode involving the -1-4-
glucose linkage (COC). The signal at 866 is associated to CH and CH2
deformation. The strong resonance located between 614 and 440 cm-1 is
generally associated to the skeletal mode related to C-C stretch in the ring
[93, 96, 97].
The use of two different laser sources at different conditions (532 nm/20 mW
and 785 nm/100 mw with resolutions between 3-4 cm-1 and 9-12 cm-1) it
was possible to obtain important information related to the molecular
composition of modified starches. By comparing the Raman spectrum of
50
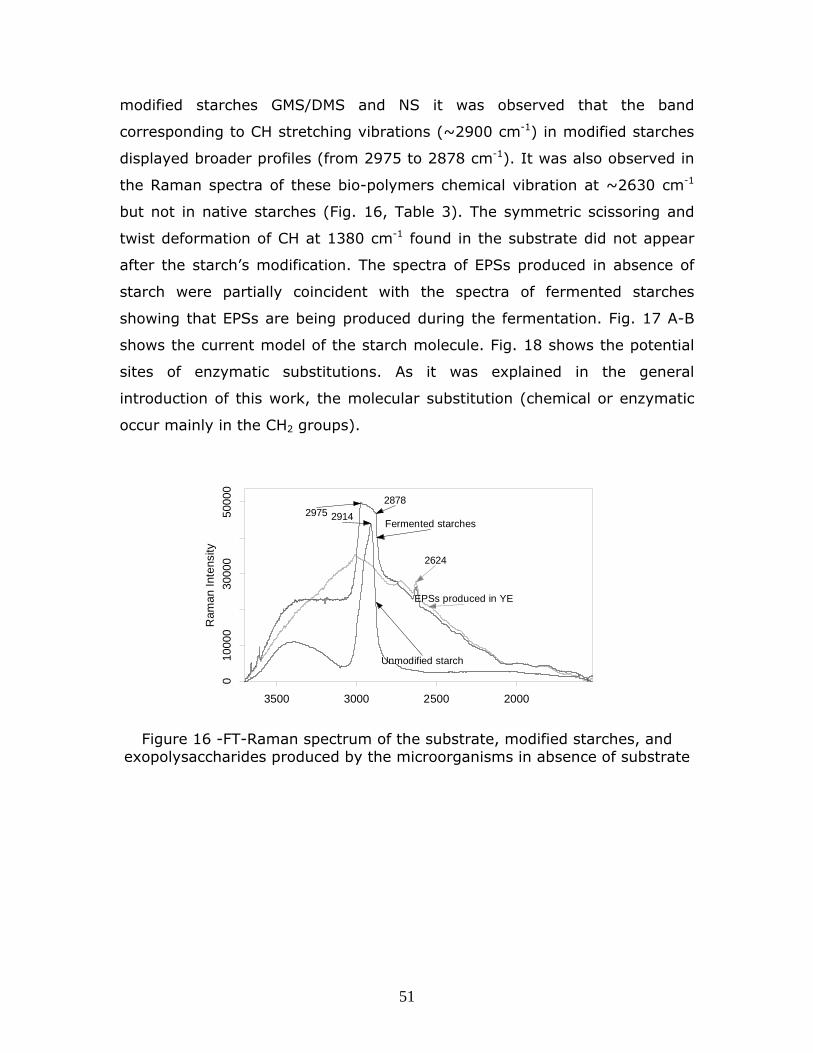
modified starches GMS/DMS and NS it was observed that the band
corresponding to CH stretching vibrations (~2900 cm-1) in modified starches
displayed broader profiles (from 2975 to 2878 cm-1). It was also observed in
the Raman spectra of these bio-polymers chemical vibration at ~2630 cm-1
but not in native starches (Fig. 16, Table 3). The symmetric scissoring and
twist deformation of CH at 1380 cm-1 found in the substrate did not appear
after the starch’s modification. The spectra of EPSs produced in absence of
starch were partially coincident with the spectra of fermented starches
showing that EPSs are being produced during the fermentation. Fig. 17 A-B
shows the current model of the starch molecule. Fig. 18 shows the potential
sites of enzymatic substitutions. As it was explained in the general
introduction of this work, the molecular substitution (chemical or enzymatic
occur mainly in the CH2 groups).
Fermented starches2975
2878
Unmodified starch
2914
2624
EPSs produced in YE
2000250030003500
010
000
3000
050
000
Ram
an I
nten
sity
Figure 16 -FT-Raman spectrum of the substrate, modified starches, and exopolysaccharides produced by the microorganisms in absence of substrate
51

Figure 17-A-B –Oostergetel and Van Bruggen model of the amylopectin clusters, branching and molecular pattern (A); the left-handed three-
dimensional helical structure of amylopectin (B). It’s been explained by the authors of this model [53] that neighboring helices are shifted relative to
each other by half the helical pitch (indicated by 0 and ½).
Figure 18-- Substitutions occurring in amorphous regions of the amylopectin molecules near the branching points [53]
52

Table 3-
Assignment of the most important Raman bands of the native and modified
star
Spectral assignment Nativ ches -1
fied starches
m-1
ches
e star
cm
Modi
c
Skeletal modes of pyranose ring
CH and CH2 deformation 866
85 (not consistent)
volving 1-4-glycosidic 940
COH deformation
d mode
CH2 twist, COH bending 1380 326
ring, CH and COH 1380
407
CH2 symmetric deformation 1460
OH stretching modes 3000-3500 Broader vibration
441
478
576
614
8
Skeletal mode in
linkage (COC)
1052
1082
1126
CH2OH (side chain) relate 1262
1
CH2 scisso
deformation 1
1697
2629
CH stretching modes 2910 2878-2977
53

The spectrum of modified starches (cd2c/MSP) samples is shown in Figure
19. The main spectral feature is the presence of fluorescence (probably due
to protein-like compounds). The bands at ~3365 and 2911 cm-1 associated
with the OH and CH stretching appeared with high intensity. The band with a
relatively medium intensity at ~2626 cm-1 was consistent in various samples
of modified starches. In this sample (undisrupted modified starch granules;
cd2c) the spectral features corresponding to the starch fingerprint region
seem to remain unaltered. However, detailed spectral features of modified
versus native starches, shown in Fig. 20 suggested also important spectral
variations.
The band observed in Fig. 19 at ~3390 cm-1 was related to OH and the
vibration associated to the CH stretching (between ~2970 and 2880 cm-1)
displayed broader profiles than native starches. The vibration at ~2626 cm-1,
slightly depicted in these images, was recurrent in most samples of modified
starches. The spectral range linked to double and triple bonds (2800-1600
cm-1) is shown in Fig. 20. It was observed the presence of at least 4 intense
resonances at ~2627, 2404, 1979 and 1694 cm-1. Most of the lines occurring
at the fingerprint region shifted slightly, and new bands appeared. Important
modifications in these spectra probably occurred at the CH2 scissoring, CH
and COH deformation, as well as at the CH2 symmetric deformations.
54

3358
2911
2624
50010001500200025003000350040004500
010
000
2000
030
000
4000
050
000
6000
0
Ram
an I
nten
sity
Figure 19- FT-Raman spectrum of Polyplast® samples- laser source 532 nm 20 mW; spectral range 70, 1555 -1525, 2740-2710, 3700 cm-1; integration
time 20 sec
2404
2627
1979
1695
160018002000220024002600
02
00
40
06
00
80
01
00
0
Ra
ma
n I
nte
nsi
ty
Figure 20- Spectra of native and modified granular starches (cd2c/MSP): laser source 532 nm 20 mW; spectral range 1525-2740 cm-1; integration
time 30 sec (noisy due to fluorescence)
55

Samples of modified starches obtained from gelatinized granules (ap3d/MPS)
were separated into two fractions based on their behavior in presence of
water. The spectrum corresponding to water insoluble fractions and the
water soluble fractions were strongly affected by fluorescence. Comparable
phenomenon was observed for PDB polymers. However, it was found a
strong vibration at the CH2 stretching region and the peak at 2630 cm-1, and
also at the bands associated to OH and CH after the modification. The
presence of the peaks at ~ 3570, 3560, 3519, 3469, 3196, 2903, 2825,
2807 and 2634 cm-1 was confirmed in several samples.
Visible Raman spectroscopy was also used to prove the presence of the
different starch morphologies after the modification. In-plane the substrate
structure (xy-axis) and the strain fluctuation (zy-axis) in native as well as
modified starch granules (cd2c) are shown in Figs. 21 and 22. The three-
dimensional (3D) plot results from a spatial-resolved measurement in the
xyz-axis. The physical units of the x-axis and z-axis are length units (e.g.
wavenumber and micron) and the y-axis shows the absorption intensity
versus the space. A surface area (not higher than ~30X30 micron) was
mapped using a visible Raman spectrometer excited with a Nd-YAG (at 532
nm, 20 mW in the sample). The analysis was performed randomly in all the
cases. Plots from native starch showed the typical spectral resonances in the
xy-axis together with a low projected intensity over the y-axis. The yz- plots
displayed a regular distribution without fluctuations. Modified starches
showed significant alterations in the spectra profile. The 3D (xyz) in its yz
spectral axis displayed two bands with prominent intensity projected over the
y-axis. It is interesting to note that both samples of modified starches
showed such fluctuations, however, more pronounced in cd2c samples. A
detailed analysis of the xy profile is also shown between 1500 and 400 cm-1,
for both samples cd2c/MSP and native starches. The main features in this
direction were not lost. Some weak resonances appeared after the
modification suggesting the lack and/or the presence of difference bonds
(bands at ~ 1209, 1198, double bands at ~780-756 and 719-7190 cm-1, and
56

619 cm-1). In general the shifting of the peaks over the xy profile was
observed through all the spectral range, but mostly in the region between
800 and 600 cm-1. The Raman depth profile showed an important structural
modification near the surface of the starch granules (Figs. 21 and 22).
500 1000 1500
0.0
2.0x10³
4.0x10³
6.0x10³
Wavenumber cm -1R
aman
inte
nsity
Figure 21-FT-Raman scanning of the surface (3D) of the substrate (native starch)
57

500 1000 1500
01x1032x1033x1034x1035x103
Wavenumber cm -1
Ra
ma
n in
ten
sity
Figure 22-FT-Raman scanning of the surface (3D) of the modified starch
3.4.5. Conclusions
In general, it was observed in samples of modified starches the strong
influence of florescence probably due to the presence of carbon double and
triple bonds. The effects of fluorescence were stronger when using the laser
at 532 nm. However, this laser intensity gave the opportunity to observe
some bands not detected with the laser at 785 nm, i.e., the bands associated
to the OH and CH stretching and the detection of vibrations at the region of
double and triple bonds. In general, there was low variation at the
wavenumber value and intensity of the peaks at the finger print region of the
starch. The signals between 1130 and 1050 including COH deformations did
not shifted considerably from samples cd2c to ap3d. The band at 940 ±6
cm-1 related to the skeletal mode involving the -1-4-glycodidic linkage
(COC) was not clearly observed in the starch samples, neither in native nor
in modified starches, instead a slight shoulder appeared in this band. The
signal at 866 associated with the CH and CH2 deformation also shifted to
both sides (left or right) in samples of modified starches. The strong
resonance located between 614 and 440 cm-1 associated to the skeletal mode
58

C-O-C stretch in the ring did not show significant variations after the
modification.
These results are relevant due to the high yields produced after the
modification without undergoing in the starch degradation. Results obtained
from the three dimensional analysis indicated that the modification can be
also carried out over the surface of the starch granules. In addition the
Raman microscope allowed for the visual inspection of modified starches and
it was observed an important structural change. Finally, the images showed a
good dispersion of modified starch granules within the PLA matrix.
3.5. Liquid state NMR
3.5.1. Abstract
The use of 1H NMR of 300 MHz produced probably partial information related
to the chemical structure of modified starches. This information may be
related to the presence of pendant groups strongly solvated in the D2O. The
attachment of these groups may occur via methylen groups.
3.5.2. Introduction
The use of 1H NMR has been restricted to the detection of functional or
solvated groups appearing in polymers of high molecular weight. In general,
most advances in the interpretation of the molecular structure of starch and
its derivatives have been made with solid state NMR. Cross polarization
magic angle spinning (CP/MAS) 13C-NMR present broad lines, which have
been associated to the different positions in the glucose units, located at
~63ppm (C6; CH2-OH); 72 ppm (C2, 3, 5; CH-OH); a smaller line in 84 ppm
(C4; CH-O); and 103 ppm (C1 anomeric; C-O-C) [98, 99].
59

CP/MAS 13C NMR is sensitive to substances at low humidity content (rigid
state with low molecular mobility). This technique has been used to obtain
structural information of granular starches. The spectrum shows the position
of each one of the resonances at the respective carbons located in the
glucopyranose ring. At low humidity content the CP/MAS 13C NMR spectra of
granular starch exhibits a triplet in the signal assigned to carbon C1 in cereal
starches and a doublet in the case of tuber starch. Although the reasons for
the detection of these multiplicities have not been explained in detail, they
have been indeed associated with the presence of crystalline regions in
granular starches, and in specific with the 9 nm periodicity of the
amylopectin branches.
3.5.3. Materials and methods
NMR measurements were carried out on a Varian Mercury 300 MHz—1H, 19F,
13C, 31—5-mm gradient probe, deuterium gradient shimming, 100 sample
autochanger (SMS). Samples were dissolved directly in deuterium oxide. FID
files were also subjected to standard Fourier transformation and phasing.
3.5.4. Results and discussion
Water soluble samples were used for NMR analyses. The 1H liquid NMR
spectrum obtained for modified starches is shown in Fig. 23. In general, it
was observed that these starches had low solubility in water. The main
features of this spectrum were the chemical shifts at ~ 5.39, 3.82, 3.64 and
the triplet centered at ~3.94 ppm. Based on the 1H NMR spectra for D-
glucose and starch it is possible to highlight that the 1H liquid NMR spectrum
obtained from these water soluble fractions of modified starches are not
related to the type of native starch or starch derivatives from which they
were produced. Going back to the solid state NMR results, they showed that
modified starches are still formed by glucose units, but they also showed that
the molecules in such modified starches are subjected to strong molecular
60

interactions, mainly at the C6 site. Two alternatives, the potential presence
of two distinctive polymers (one of them produced by the starch
modification) and the other one the incorporation of specific functional
groups to the glucose ring in the starch molecules. The first alternative
implies that modified starches are a mixture of two polymers. On the other
hand, differences in molecular weight (shown by HPAEC-PAD or MALDI-TOF)
and captured in the liquid NMR spectrum may be produced by some new
functional groups. Such functional groups were strongly solvated in D2O, and
they are probably attached or reacting at the C6 site in the glucose ring. A
further simplification of the polymer probably occurred due to the removal of
a part of the coupling protons by deuteration.
As it is well known, proton chemical shifts fall within a range from 0 to 14
ppm. For mono-substituted functional groups, i.e., saturated hydrocarbons,
resonances occur generally between 1.0 and 4.0 ppm, while resonances for
olefinic protons appear in the region of 5.0 to 6.5 ppm. These values are
never exact and should be taken within the experimental limits. Olefins (-
C=CH-) are normally seen between 4.5 and 6.5 ppm. OH groups were
probably deuterated, whereas the set of overlapped resonances between 3.5
and 4 could be associated with a broad range of functional groups. However,
some specific groups attached to particular molecules of high molecular
weight in certain solvents have shown splitting into triads, as occurs with the
carboxyl group in some solvents) [100]. The 1H liquid NMR spectrum of
carboxyl methyl proton of poly(methyl methacrylate) in C6D6 is similar to that
shown in this study in which the proton of the functional group was solvated
in D2O. This empirical interpretation allows this particular functional group to
be related to a polymer of high molecular weight with random structure, but
showing patterns in the distribution of the functional groups with steric
structures meso-meso (centered at 394 ppm), meso-racemo (3.82 ppm) and
racemo-racemo (364 ppm).
61

The spectrum of exopolysaccharides (EPSs) produced by the fungus in
absence of starch is shown in Fig. 24. It basically shows the same pattern or
sets of peaks with a better resolution due to the averaging of anisotropic
NMR interactions (spin-spin and spin-matrix interactions).
5.5 5.0 4.5 4.0 3.5
Chemical Shift (ppm)
0.005
0.010
0.015
0.020
0.025
Nor
mal
ized
Inte
nsity
5.39
3.97
3.94
3.91
3.83
3.64
5.5 5.0 4.5 4.0 3.5
Chemical Shift (ppm)
0.005
0.010
0.015
0.020
0.025
Nor
mal
ized
Inte
nsity
5.39
3.97
3.94
3.91
3.83
3.64
Figure 23-- 300 MHz 1H NMR spectrum of Polyplast® polymers showing solvated, probably pendant groups, in D2O
62

Figure 24-300 MHz 1H NMR spectrum of EPS produce by the fungi in absence of starch salvation in D2O
3.5.5. Conclusions
These analyses were not conclusive, however, it can be inferred that the
modified starch chains bear functional groups able to be solvated and
detected by NMR spectroscopy. A rough approximation may be related with
the presence of carboxylic groups. The presence of double bonds and
specially of CO double bonds was corroborated by FTIR and FT-Raman.
3.6. Solid state NMR
3.6.1. Abstract
Results obtained from solid state NMR, FT-Raman, and chromatography
suggest that the functional properties of modified starches can be attributed
either to the presence of extracellular exo-polysaccharides or intermolecular
bonds occurring at the C6 in the glucopyranose ring.
63

3.6.2. Introduction
The use of 1H NMR has been restricted to the detection of functional or
solvated groups appearing in polymers of high molecular weight. In general,
most advances in the interpretation of the molecular structure of starch and
its derivatives have been made with solid state NMR. Cross polarization
magic angle spinning (CP/MAS) 13C-NMR posses broad lines, which have been
associated to the different positions in the glucose units, located at ~63ppm
(C6; CH2-OH); 72 ppm (C2, 3, 5; CH-OH); a smaller line in 84 ppm (C4; CH-
O); and 103 ppm (C1 anomeric; C-O-C) [98, 99].
CP/MAS 13C NMR is sensitive to substances at low humidity content (rigid
state with low molecular mobility). This technique has been used to obtain
structural information of granular starches. The spectrum shows the position
of each one of the resonances at the respective carbons located in the
glucopyranose ring. At low humidity content the CP/MAS 13C NMR spectra of
granular starch exhibits a triplet in the signal assigned to carbon C1 in cereal
starches and a doublet in the case of tubers. Although the reasons for the
detection of these multiplicities have not been explained in detail, they have
been indeed associated with the presence of crystalline regions in granular
starches, and in specific with the 9 nm periodicity of the amylopectin
branches.
3.6.3. Materials and methods
Solid state 13C CP/MAS (cross polarization magic angle spinning) spectra
were collected in a Bruker advance DSX 200 MH at room temperature by
using a standard Bruker wide-band MAS probe. Resonance frequency of 200
13 mHz. 4 mm bore superconducting magnet. Dry samples were packed in 4
mm zirconia rotors, with sealed Kel-Fe caps and spun at 5 kHz. 13C CP
MAS/NMR spectra with 3 ms CP contact time, 5 s recycle delay. The free
induction decay was subjected to standard Fourier transformation and
64
phasing. The chemical shifts were externally referenced to the solid
adamantane peak at 38.56 ppm. A total of 5000 scans were averaged for
each spectrum.
3.6.4. Results and discussion
The single chemical shift found between at ~60 ppm corresponds to C6. The
wide distribution of the chemical shift centered at ~72 ppm is attributed to
the hexapyranose ring carbons (C-2, 3, 4, 5). The peak at 80-84 ppm is
related to amorphous fractions of starch associated to the C4. The chemical
shifts observed as a triplet is associated to crystalline regions of starch (A-
type), and the other resonances seen as shoulders between the interval from
90 from 108 ppm are attributed to the presence of amorphous regions of C1.
The lamellae responsible for the crystalline regions, are formed by three
discrete components the backbone which support the double helices, parallel
‘rigid’ double-helical (menogenic) units (~5-6 nm) and amorphous regions
(more flexible un-branched regions, also called ‘spacers’ or side chains) with
sizes of ~4 nm. The size of the crystalline lamellae is ~9 nm. It has been
observed by Waigh et al. [49] that a simultaneous appearance and
disappearance of the 9 nm and 1.6 nm reflections in small angle X-ray
scattering under hydration and dehydration experiments. The hydration
produces the 9 nm reflection due to the smectic periodicity. With a ~10% mc
solid state NMR spectra show a set of sharp and strong peaks at ~100 ppm
(triplet in A-type, and doublet in type B starches) associated with the
crystalline regions. Neither dehydrated native granules (<5% mc) nor the
amorphous dehydrated starches show these signals. The same phenomenon
occurs for highly hydrated starches (~20% mc; moisture content <). Under
dry conditions the starches may be in a pure glassy form (<5% mc), while
moisture contents of ~10 % allows the formation of crystalline regions.
These particular structures of intermediate order are known as liquid crystals
SCLCP (side chain liquid crystal polymer). The degree of mobility of these
three components, coupled with the helix-coil transition, may be used to
65

explain physicochemical and structural properties of starch such as
gelatinization, dehydration or molecular composition. The signals seen as a
shoulder of C-2, 3, 5 at ~76 ppm can be related to amorphous domains of
amylose residues.
It can be observed from these data that the C4 resonance shifted to a lower
field and the resonance of C6 moved to a higher energy field due to
molecular shielding. This phenomenon was observed even in the early stages
of the modification. By measuring the area of the chemical shifts by the
MestReC 4.8.6.0 for Win XPM software, the main differences were found at C
2, 3, 5 and C6 which showed dramatic reductions and increases of the
respective areas suggesting the reduction of the glucopyranose rings and the
intermolecular bonding via C6, phenomena which may be related to the
reduction of the molecular motion of the starch chains.
The solid state CP/MAS 13C NMR results are shown in Table 7. Table 8
shows the associated area of the chemical shifts before and after the
modification for tapioca starch. It can be observed from these data that the
C4 resonance shifted to a lower field and the resonance of C6 moved to a
higher energy field due to molecular shielding. This phenomenon was
observed even in early stages of the modification. By measuring the area of
the chemical shifts by the MestReC 4.8.6.0 for Win XPM software, the main
differences were found at C 2, 3, 5 and C6 which showed dramatic reductions
and increase of the respective areas suggesting the reduction of the
glucopyranose rings and the intermolecular bonding via C6, phenomenon
which may be related with the reduction of the molecular motion of the
starch chains.
66

Table 6
Solid state NMR. Chemical shifts for the different carbon of native and modified starches (three different sources produced the same results;
corn, tapioca, or potato)
Starch sample C1 C4 C3,2,5 C6
NS 101.60 80.84 72.58 62.35
MS-7 103.47
82.38
72.50 60.54
MS-3 103.36 82.18 73.30 60.36
NT=native starch, MS-3=starch at the 3rd day of modification, MS-7=starch at the 7th day of modification
Table 5
SOLID STATE NMR. AVERAGED ASSOCIATED AREA BY CARBON TYPE (THREE DIFFERENT SOURCES PRODUCED THE SAME RESULTS; CORN, TAPIOCA, OR POTATO)
Carbon type
Associated area (%) Native Modified Starch Starch
C1 16 17
C4 7 7
C2,3,4,5 70 55
C6 7 21
67

3.6.5. Conclusions
It was observed from these data that the C4 resonance shifted to a lower
field and the resonance of C6 moved to a higher energy field due to
molecular shielding. This phenomenon was observed even in the early stages
of the modification. By measuring the area of the chemical shifts by the
MestReC 4.8.6.0 for Win XPM software, the main differences were found at C
2, 3, 5 and C6 which showed dramatic reductions and increase of the
respective areas suggesting the reduction of the glucopyranose rings and the
intermolecular bonding via C6, phenomenon which may be related with the
reduction of the molecular motion of the starch chains.
3.7. MALDI-TOF MS
3.7.1. Abstract
High molecular weight derived polymers have been analyzed by SEC [43].
However, this technique does not provide details related to chemical
composition of the polysaccharides. A good approximation is the use of
matrix-assisted laser desorption ionization mass spectrometry (MALDI-TOF).
A good separation of relatively low molecular weight components was
achieved with this technique. Based on the spectrometric separation it is
possible to conclude that the starch molecules were affected in the molecular
weight and therefore in their molecular composition.
3.7.2. Introduction
Matrix-assisted laser desorption/ionization time-of-flight mass
spectrometry, MALDI-TOF MS, was used by Broberg et al. [101] to study the
chain length distribution of amylopectin. The results were comparable with
those obtained by high-performance anion-exchange chromatography with
pulsed amperometric detection (HPAEC-PAD). MALDI-TOF MS was, however,
68

reported to be a more sensitive technique and provided more detailed
information on the molecular mass of the unit chains [102].
3.7.3. Materials and methods
3.7.3.1. Sample preparation
Matrices for the separation of these polymers were prepared with 1, 8, 9-
anthracenetriol (or dithranol), 2, 5-dihydroxybenzoic acid, trans-3-
indoleacrylic acid, and 2-(4-hydroxyphenylazo) benzoic acid. Also different
alkali metal salts (LiCl, NaCl, KCl) or silver salts such as silver trifluoroacetate
(AgTFA) were used to form matrix-cationization agent mixtures. Two sample
preparation methods were used: by spotting and thin layer.
3.7.3.2. Instrumental conditions
An Applied Biosystems/MDS SCIEX 4800 MALDI TOF/TOF analyzer was used
in this study. To determine the mass spectra of the different components of
the starch matrices (native and modified), the instrument was set as MS
linear low mass positive range of 500 - 5000 dalton (low MS linear mode with
150 cm ion path length). Mass spectra were averaged over 400 shots using
an Nd:YAG 200-Hz laser at a wavelength of 355 nm. The laser firing rate was
200 Hz. After laser strikes the sample, the sample stage and sample plate
were supplied with an acceleration voltage (0 to 25 KV) at a predetermined
delay time.
3.7.4. Results and discussion
The matrix combination and sample preparation showed a good separation in
both materials (native and modified starches) were 2, 5-dihydrobenzoic-KCl
and the thin layer method [101]. Although no higher resolution was
69

achieved, the spectra were able to show the main differences between the
two samples.
In the mass spectrum of native starches, the unit chains appeared duplicated
with a difference of 18 m/z which may correspond to the loss of a water
molecule. In addition, it can be observed that as the m/z increased the peak
area decreased, but the m/z difference between pairs of peaks remained in
160 m/z (Fig. 25).
On the other hand, the difference between sets of peaks in fermented
starches was 200 m/z and the difference the pair of peaks was ~50 m/z (Fig.
26). The spectral differences also showed in this spectrum peaks (1036,
1240 m/z, etc.) possibly related to the production of EPSs or starch-derived
products. The peak at 1240 m/z, in Fig. 26 for example, may correspond to
a DP ~7. Also, the peak shown in Fig. 8, section 3.1.2.1 is probably a non-
related starch-derived product with a probable DP of 7.
800.0 1041.8 1283.6 1525.4 1767.2 2009.0
Mass (m/z)
20
40
60
80
100
20
40
60
80
100
Re
lativ
e ab
und
ance
Re
lativ
e ab
und
ance 996
10161158
117613391321
9961016
11581176
13391321
800.0 1041.8 1283.6 1525.4 1767.2 2009.0
Mass (m/z)
Figure 25-MALDI-TOF MS spectrum of native starch-
70
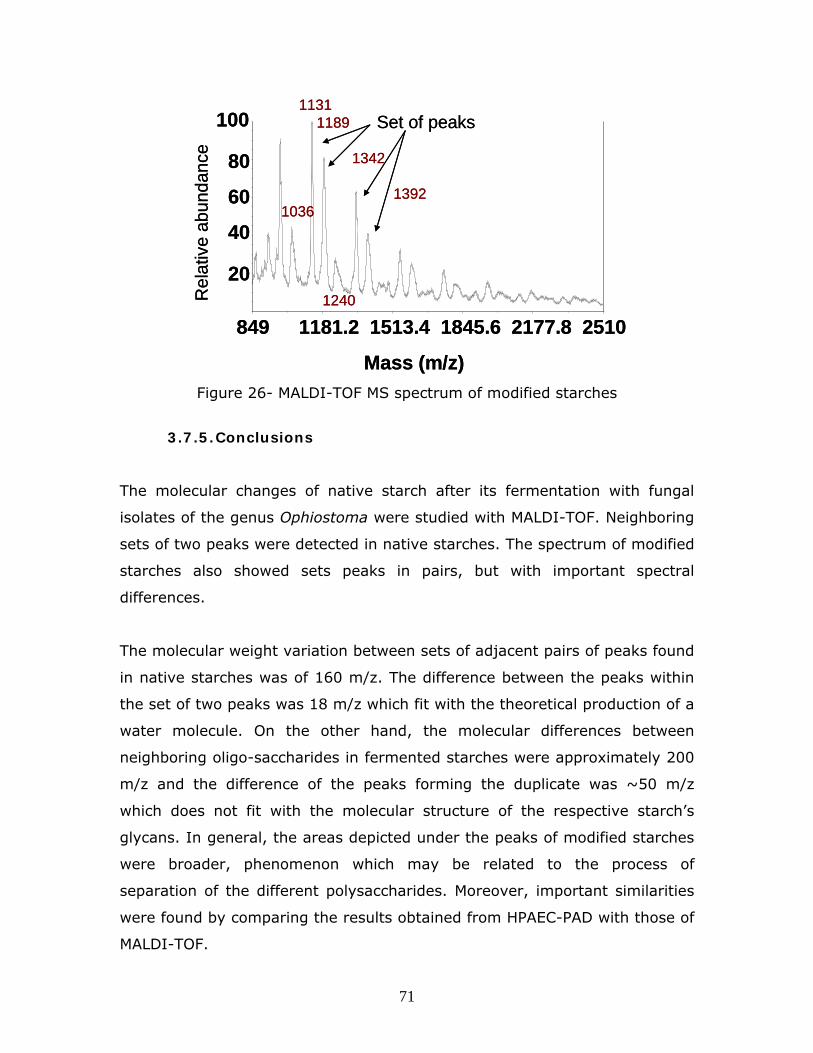
849 1181.2 1513.4 1845.6 2177.8 2510
Mass (m/z)
20
40
60
80
100
Rel
ativ
e ab
unda
nce
Set of peaks1131
1189
1342
13921036
1240
849 1181.2 1513.4 1845.6 2177.8 2510
Mass (m/z)
20
40
60
80
100
Rel
ativ
e ab
unda
nce
Set of peaks1131
1189
1342
13921036
1240
Figure 26- MALDI-TOF MS spectrum of modified starches
3.7.5. Conclusions
The molecular changes of native starch after its fermentation with fungal
isolates of the genus Ophiostoma were studied with MALDI-TOF. Neighboring
sets of two peaks were detected in native starches. The spectrum of modified
starches also showed sets peaks in pairs, but with important spectral
differences.
The molecular weight variation between sets of adjacent pairs of peaks found
in native starches was of 160 m/z. The difference between the peaks within
the set of two peaks was 18 m/z which fit with the theoretical production of a
water molecule. On the other hand, the molecular differences between
neighboring oligo-saccharides in fermented starches were approximately 200
m/z and the difference of the peaks forming the duplicate was ~50 m/z
which does not fit with the molecular structure of the respective starch’s
glycans. In general, the areas depicted under the peaks of modified starches
were broader, phenomenon which may be related to the process of
separation of the different polysaccharides. Moreover, important similarities
were found by comparing the results obtained from HPAEC-PAD with those of
MALDI-TOF.
71
3.8. HPAEC-PAD
3.8.1. Abstract
High molecular weight derived polymers have been analyzed by SEC[43].
However, this technique does not provide details related to chemical
composition of the polysaccharides. A good approximation is the use of high
performance anion exchange chromatography with pulsed amperometric
detection (HPAEC-PAD). A good separation of relatively low molecular weight
components was achieved with this technique. Based on the chromatographic
separation it is possible to infer the presence of two dissimilar
polysaccharides forming the matrix of modified starches.
3.8.2. Introduction
High-performance anion exchange chromatography with pulsed
amperometric detection (HPAEC-PAD) and matrix-assisted laser
desorption/ionization time-of-flight mass spectrometry (MALDI-TOF MS) are
well established methods to determine the chain length distribution of
amylopectin and short chains of amylose and related products [101, 103-
106].
Sugars or different related compounds (methylated aldoses, deoxysugars,
amino sugars, N-acetylated amino sugars, acidic sugars, etc.) are separated
from the matrix by following an acidity trend of the OH groups: 1-OH>2-
OH>6-OH>3-OH>4-OH. For example, the substitution of the anomeric
group, as in the case of 1-O-methylated glucose, produces a poor retention
time in the column, while all other derivatives exhibit higher retention times.
By the other hand, oligo- and polysaccharides are separated based on their
size, chemical composition, and linkage type [106, 107]. Therefore, sugars
with close molecular weight can be separated with great sensitivity.
72
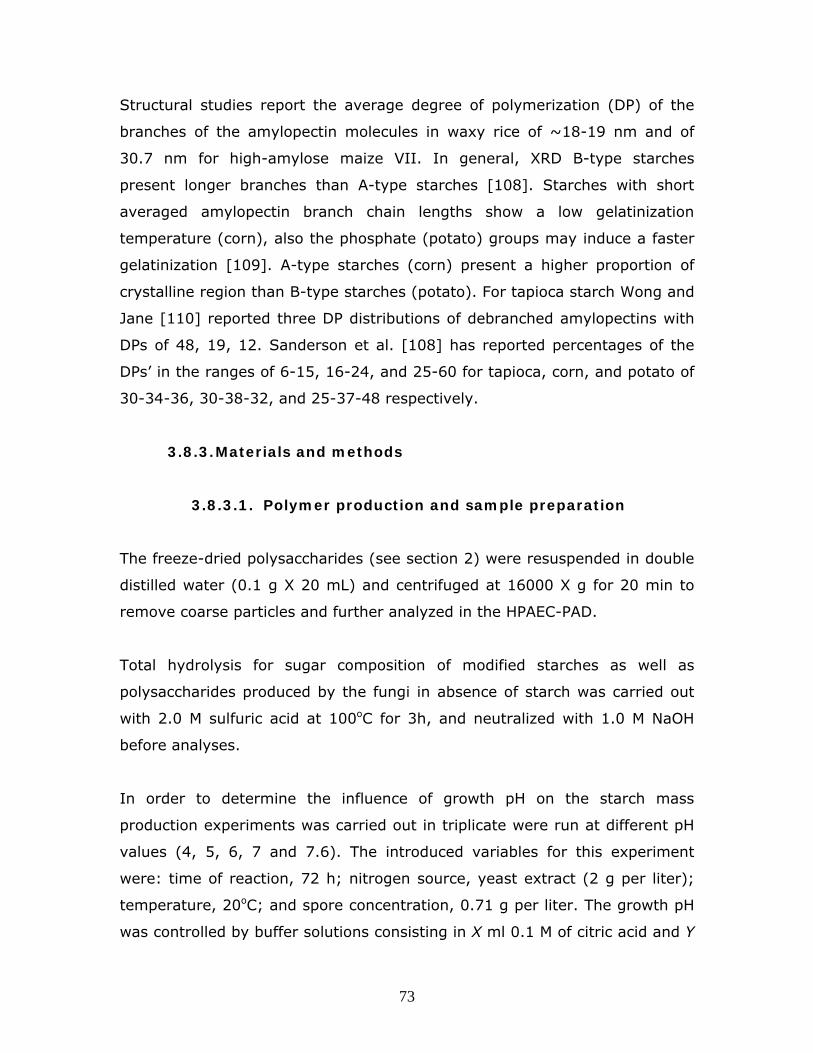
Structural studies report the average degree of polymerization (DP) of the
branches of the amylopectin molecules in waxy rice of ~18-19 nm and of
30.7 nm for high-amylose maize VII. In general, XRD B-type starches
present longer branches than A-type starches [108]. Starches with short
averaged amylopectin branch chain lengths show a low gelatinization
temperature (corn), also the phosphate (potato) groups may induce a faster
gelatinization [109]. A-type starches (corn) present a higher proportion of
crystalline region than B-type starches (potato). For tapioca starch Wong and
Jane [110] reported three DP distributions of debranched amylopectins with
DPs of 48, 19, 12. Sanderson et al. [108] has reported percentages of the
DPs’ in the ranges of 6-15, 16-24, and 25-60 for tapioca, corn, and potato of
30-34-36, 30-38-32, and 25-37-48 respectively.
3.8.3. Materials and methods
3.8.3.1. Polymer production and sample preparation
The freeze-dried polysaccharides (see section 2) were resuspended in double
distilled water (0.1 g X 20 mL) and centrifuged at 16000 X g for 20 min to
remove coarse particles and further analyzed in the HPAEC-PAD.
Total hydrolysis for sugar composition of modified starches as well as
polysaccharides produced by the fungi in absence of starch was carried out
with 2.0 M sulfuric acid at 100oC for 3h, and neutralized with 1.0 M NaOH
before analyses.
In order to determine the influence of growth pH on the starch mass
production experiments was carried out in triplicate were run at different pH
values (4, 5, 6, 7 and 7.6). The introduced variables for this experiment
were: time of reaction, 72 h; nitrogen source, yeast extract (2 g per liter);
temperature, 20oC; and spore concentration, 0.71 g per liter. The growth pH
was controlled by buffer solutions consisting in X ml 0.1 M of citric acid and Y
73

ml 0.2 M Na2HPO. The influence of the cultivation temperature on the
production of modified starch polymers was investigated by controlling the
growth temperatures at 15, 20, 25, 30 and 35oC. For temperature
experiments the settings were: pH 4; 72 h; yeas extract, 2 g/l; spore
concentration, 0.71 g/l; at 72 h. The effect of spore concentration was
measured by performing the following experiment: spore concentrations,
0.71, 1.3, 1.8, 2.23, and 3.47 g/l; temperature, 20oC; YE 2 g/l; pH 4; and
time of reaction 72 h. The influence of various nitrogen sources over the
starch mass change was assessed by using various YE, Urea, NaNO2, NaNO3,
HPO4(NH4)2 and NH4NO3. The starch mass load for all experiments was 20 g
per liter of culture media
3.8.3.2. Instrumental conditions
HPAEC-PAD was performed on a DIONEX DX-500 (Sunnyvale, CA, USA)
equipped with ED-40 electrochemical detector, a GP-50 gradient pump and
an AS-3500 autosampler. Samples (~1.0 mg/mL deionised water) were place
in a rotary shaker for 24 h at 160 rpm., then centrifuged (16000 X g for 20
min) to remove coarse particles, dialyzed against distilled water for 72 h at
4°C (tubing Fisher brand®, wall thickness 30mm, dry cylinder diameter 25.5
mm for molecular weight separation between 6,000 and 8, 000 g/mol,
membrane with a retention capacity of 15, 000 to 20, 000 Mw) and then
injected (25mL) onto CarboPac anion-exchange columns PA1 and PA200 with
respective guard columns. A triple-potential waveform was applied using the
following settings: E1_0.01 V (volts), t1_0-480 ms; E2__0.60 V, t2_481-780
ms; E3_-0.6 V, t3_781-1020 ms. The flow rate was 1.0 mL/min. Reagents
were prepared with sodium hydroxide solution (50% w/w, low carbonate,
analytical grade) and sodium acetate (CH3COONa FW/PM 82.03). Eluents
were: (A) 100 mM sodium hydroxide; (B) 100mM sodium hydroxide, 500 mM
sodium acetate. Eluentes were prepared with degassed water, sonicated
before use and determined with helium gas during the testing. The system
was equilibrated with the eluent A for 10 min before each run. The separation
74
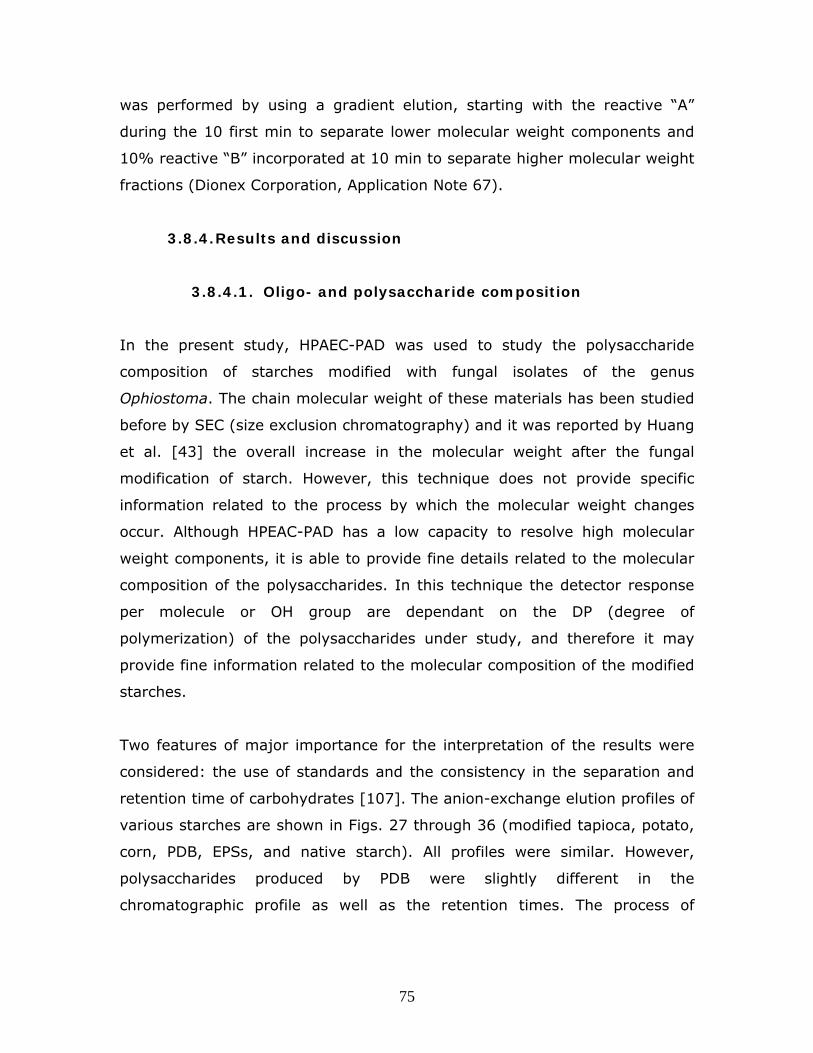
was performed by using a gradient elution, starting with the reactive “A”
during the 10 first min to separate lower molecular weight components and
10% reactive “B” incorporated at 10 min to separate higher molecular weight
fractions (Dionex Corporation, Application Note 67).
3.8.4. Results and discussion
3.8.4.1. Oligo- and polysaccharide composition
In the present study, HPAEC-PAD was used to study the polysaccharide
composition of starches modified with fungal isolates of the genus
Ophiostoma. The chain molecular weight of these materials has been studied
before by SEC (size exclusion chromatography) and it was reported by Huang
et al. [43] the overall increase in the molecular weight after the fungal
modification of starch. However, this technique does not provide specific
information related to the process by which the molecular weight changes
occur. Although HPEAC-PAD has a low capacity to resolve high molecular
weight components, it is able to provide fine details related to the molecular
composition of the polysaccharides. In this technique the detector response
per molecule or OH group are dependant on the DP (degree of
polymerization) of the polysaccharides under study, and therefore it may
provide fine information related to the molecular composition of the modified
starches.
Two features of major importance for the interpretation of the results were
considered: the use of standards and the consistency in the separation and
retention time of carbohydrates [107]. The anion-exchange elution profiles of
various starches are shown in Figs. 27 through 36 (modified tapioca, potato,
corn, PDB, EPSs, and native starch). All profiles were similar. However,
polysaccharides produced by PDB were slightly different in the
chromatographic profile as well as the retention times. The process of
75

production of EPSs by the fungi in the absence of starch has been reported
before [42].
The relative degree of polymerization (DP) of oligosaccharides separated in
samples of modified starches was determined by using glucose, maltotriose,
maltopenatose and maltohepatose. The average retention times of the
standards D-glucose, maltotriose, maltopentaose, and maltoheptaose were
1.9, 6.5, 10.7, and 14.8±0.01 min respectively (Fig. 37). It was observed
that there was a linear relationship between the retention time and the DP.
Oligosaccharides derived from native starches showed consistency with the
standards as it can be seen from peaks 5 through 10 (Fig. 63). Initial peaks
(shown in letters, Glc=glucose) may be due to the presence of minor
components such as low molecular weight lipids, proteins, or phosphates
[56], which were not detected after the modification of the starch.
The high sensitivity of this technique allowed the separation of the matrix of
modified starches as shown in the chromatograms. The peaks at the near 2,
6, 11, and 16 min can be associated with oligosaccharides with DPs of 3, 5,
and 7 (Fig. 27). Clearly shown, there are various peaks with random
molecular weights distributed within the chromatogram. The peak at the near
3 min showed a higher intensity compared with the one associated to glucose
units, which were associated with the peak number 1 at ~2.0 min.
The peak with an apparent DP of 4 in modified corn starches (Fig. 29) was
further split into two peaks (Fig. 30). These results show that there is a
strong molecular attraction between two different molecular fractions. In
general the chromatographic profile strongly suggests the presence of
dissimilar polysaccharides in the matrix. In order to be separated, these
polymers must show a higher degree of ionization in the alkaline medium
and/or a better affinity for the stationary phase than the starch fraction. The
chromatogram from potato dextrose broth (PDB) also showed important
variations with respect to the regular sequence of starch derivatives. It is
76

interesting to note that the peaks at the retention times 3, 12, 16, and 20
min detected in modified PDB are consistent with the peaks detected in Fig.
53.
Fig. 32 shows the chromatogram of EPSs produced by the fungi in absence of
starch. The peak at ~10 min was found in samples of modified starches
produced in excess of spores and in samples produced in a culture media
supplied with Na+NO2-, Na+NO3
-, HPO4-2(NH4)2, or NH4
+NO3-, which in general,
inhibited the process of oligosaccharide production and the chromatogram
acquired a profile similar to that found in EPSs suggesting the increase in the
production of this polymer.
0.0200
0.0400
0.0594
1.0 4.0 8.0 12.0 16.0 20.0 24.0 28.2
µC
min
1
2
3
45
6 7
8 9
100.0200
0.0400
0.0594
1.0 4.0 8.0 12.0 16.0 20.0 24.0 28.2
µC
min
1
2
3
45
6 7
8 9
10
Figure 27- Chromatographic profiles of modified starches synthesized from tapioca starch on the 3rd day of modification (CarboPac PA1)
77

0.0050
0.0100
0.0150
0.0200
0.0250
0.0326
0.8 4.0 8.0 12.0 16.0 20.0 22.4
µC min
12
34
5
67 8
0.0050
0.0100
0.0150
0.0200
0.0250
0.0326
0.8 4.0 8.0 12.0 16.0 20.0 22.4
µC min
12
34
5
67 8
Figure 28-Chromatographic profiles of modified starches synthesized from potato starch on the 3rd day of modification (CarboPac PA1)
0.0100
0.0300
0.0500
0.0645
0.6 4.0 8.0 12.0 16.0 20.0 24.0 27.7
µC
min
1
2
3
4
56
7
0.0100
0.0300
0.0500
0.0645
0.6 4.0 8.0 12.0 16.0 20.0 24.0 27.7
µC
min
1
2
3
4
56
7
Figure 29- Chromatographic profiles of modified starches synthesized form corn starch on the 3rd day of modification (CarboPac PA1)
0.0025
0.0050
0.0100
0.0140
0.0 2.5 7.5 12.5 17.5 22.3
µC
min
0.0025
0.0050
0.0100
0.0140
0.0 2.5 7.5 12.5 17.5 22.3
µC
min
Figure 30- Chromatogram profile of modified starches- detail of peak separation performed with a CarboPac PA200 column (peak separation
corresponding to peak no. 4 in Fig. 55)
78
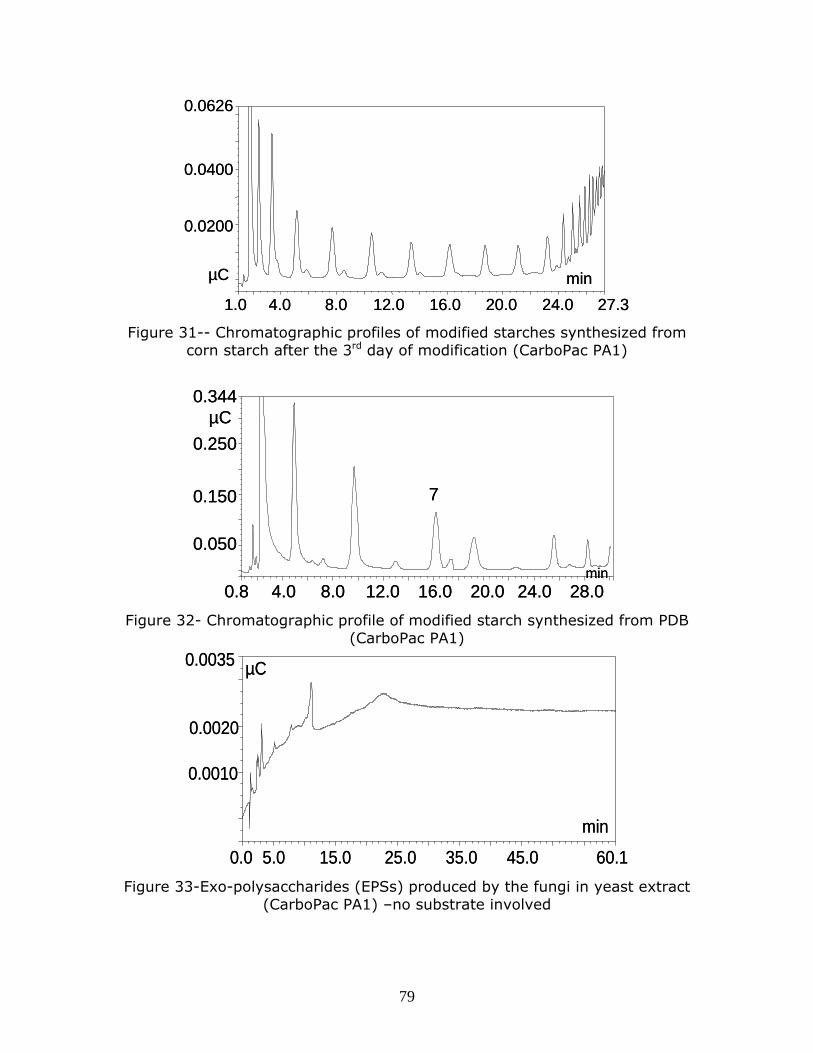
0.0200
0.0400
0.0626
1.0 4.0 8.0 12.0 16.0 20.0 24.0 27.3
µC min
0.0200
0.0400
0.0626
1.0 4.0 8.0 12.0 16.0 20.0 24.0 27.3
µC min
Figure 31-- Chromatographic profiles of modified starches synthesized from corn starch after the 3rd day of modification (CarboPac PA1)
0.050
0.150
0.250
0.344
0.8 4.0 8.0 12.0 16.0 20.0 24.0 28.0
µC
min
7
0.050
0.150
0.250
0.344
0.8 4.0 8.0 12.0 16.0 20.0 24.0 28.0
µC
min
7
Figure 32- Chromatographic profile of modified starch synthesized from PDB (CarboPac PA1)
0.0010
0.0020
0.0035
0.0 5.0 15.0 25.0 35.0 45.0 60.1
µC
min
0.0010
0.0020
0.0035
0.0 5.0 15.0 25.0 35.0 45.0 60.1
µC
min
Figure 33-Exo-polysaccharides (EPSs) produced by the fungi in yeast extract (CarboPac PA1) –no substrate involved
79
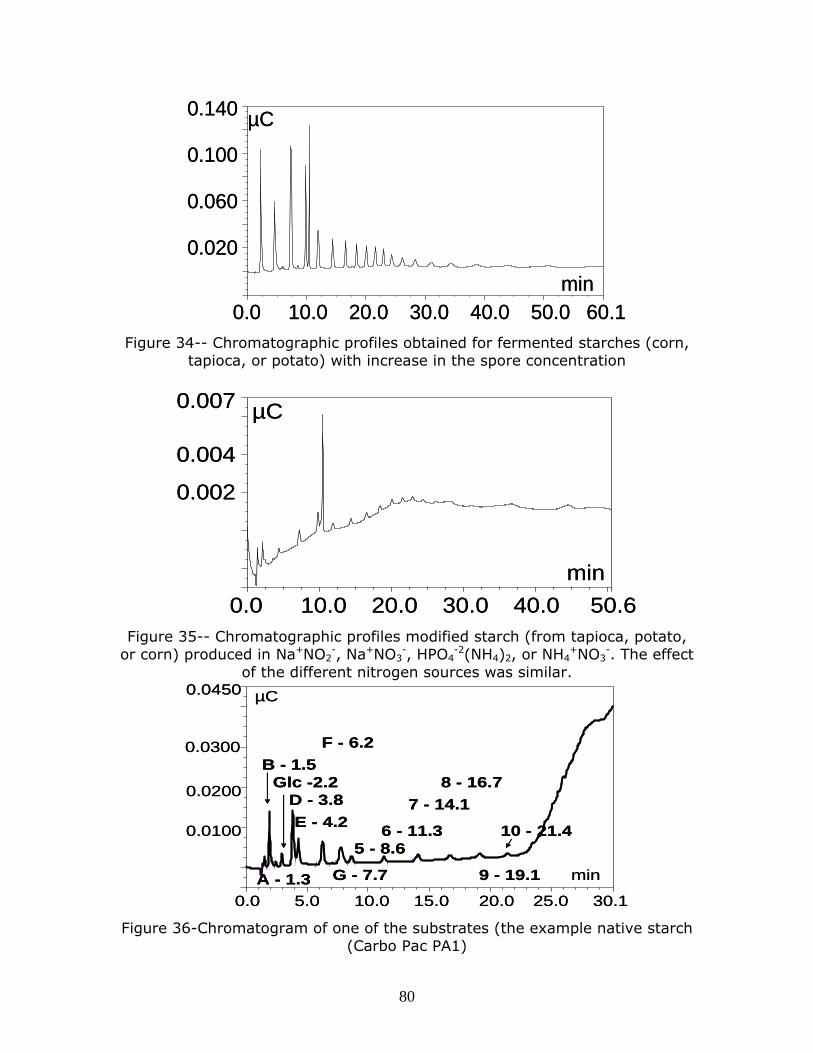
0.020
0.060
0.100
0.140
0.0 10.0 20.0 30.0 40.0 50.0 60.1
µC
min
0.020
0.060
0.100
0.140
0.0 10.0 20.0 30.0 40.0 50.0 60.1
µC
min
Figure 34-- Chromatographic profiles obtained for fermented starches (corn, tapioca, or potato) with increase in the spore concentration
0.002
0.004
0.007
0.0 10.0 20.0 30.0 40.0 50.6
µC
min
0.002
0.004
0.007
0.0 10.0 20.0 30.0 40.0 50.6
µC
min
Figure 35-- Chromatographic profiles modified starch (from tapioca, potato, or corn) produced in Na+NO2
-, Na+NO3-, HPO4
-2(NH4)2, or NH4+NO3
-. The effect of the different nitrogen sources was similar.
0.0100
0.0200
0.0300
0.0450
0.0 5.0 10.0 15.0 20.0 25.0 30.1
µC
minA - 1.3
B - 1.5Glc -2.2
D - 3.8
E - 4.2
F - 6.2
G - 7.7
5 - 8.66 - 11.3
7 - 14.1
8 - 16.7
9 - 19.1
10 - 21.40.0100
0.0200
0.0300
0.0450
0.0 5.0 10.0 15.0 20.0 25.0 30.1
µC
minA - 1.3
B - 1.5Glc -2.2
D - 3.8
E - 4.2
F - 6.2
G - 7.7
5 - 8.66 - 11.3
7 - 14.1
8 - 16.7
9 - 19.1
10 - 21.4
Figure 36-Chromatogram of one of the substrates (the example native starch (Carbo Pac PA1)
80

0
2
4
6
8
10
12
14
16
Glucose Maltotriose Maltopentaose Maltoheptaose
Ret
enti
on
tim
e
Figure 37- Chart showing the retention time of the various used standards
3.8.4.2. Sugar composition
Exopolysaccharides (EPSs) produced by the fungi in the absence of starch
were hydrolyzed for sugar identification as well as modified tapioca or PDB
starches. The process of production of EPSs by the fungi in absence of starch
has been reported before [42]. The chromatograms for various hydrolyzed
samples of modified starches (potato, tapioca, corn, potato from PDB, and
amylopectin), exopolysaccharides (EPSs) produced by the fungi in absence of
starch, and native starch are shown in Figs. 38-44.
In general, it was found that polysaccharides produced by the fungi in the
absence of starch are formed by two different basic units, while modified PDB
and tapioca showed 4 peaks. Modified amylopectin, potato, and corn starches
showed two peaks. Moreover, peaks appearing after 2 min in PDB and
tapioca starches had similar retention times to those found in hydrolyzed
EPSs. The retention times of the peaks found in corn, potato, and
amylopectin were lower than those found in EPSs. The standard at the same
conditions appeared at ~2.5 min. However, when the various samples were
added to the samples of modified starches the standard peak of glucose
81

shifted to ~2 min. Therefore, in all samples of modified starches the peak at
~2 min can be associated with glucose.
0.0200
0.0400
0.0600
0.0900
0.0 2.5 5.0 7.5
µC
1 - 1.433
4 - 2.683
0.0200
0.0400
0.0600
0.0900
0.0 2.5 5.0 7.5
µC
1 - 1.433
4 - 2.683
Figure 38-Chromatogram showing the separation of hydrolyzed mod. starch from tapioca starch. Separation by CarboPac PA1
0.025
0.050
0.075
0.100
0.140
0.0 2.5 5.0 7.5
µC
1 - 1.517
0.025
0.050
0.075
0.100
0.140
0.0 2.5 5.0 7.5
µC
1 - 1.517
Figure 39-Chromatogram showing the sugar separation of hydrolyzed modified starch from potato starch. Separation by CarboPac PA1
82
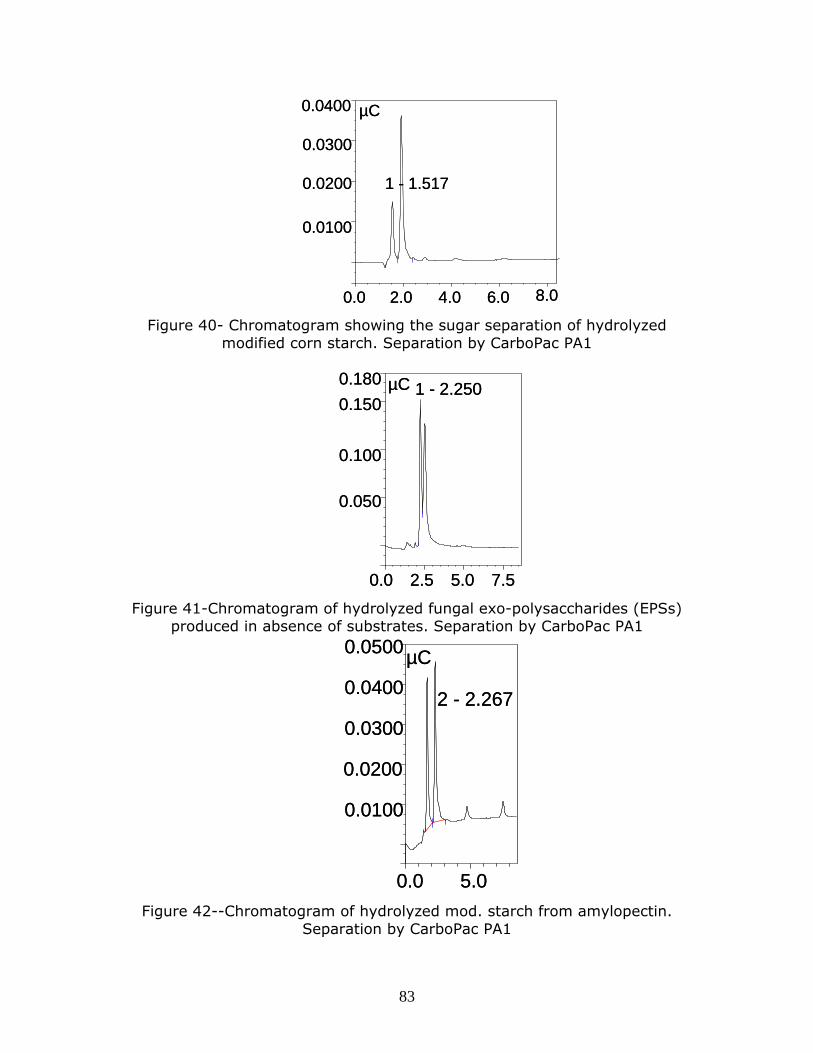
0.0100
0.0200
0.0300
0.0400
0.0 2.0 4.0 6.0 8.0
µC
1 - 1.517
0.0100
0.0200
0.0300
0.0400
0.0 2.0 4.0 6.0 8.0
µC
1 - 1.517
Figure 40- Chromatogram showing the sugar separation of hydrolyzed modified corn starch. Separation by CarboPac PA1
0.050
0.100
0.150
0.180
0.0 2.5 5.0 7.5
µC 1 - 2.250
0.050
0.100
0.150
0.180
0.0 2.5 5.0 7.5
µC 1 - 2.250
Figure 41-Chromatogram of hydrolyzed fungal exo-polysaccharides (EPSs) produced in absence of substrates. Separation by CarboPac PA1
0.0100
0.0200
0.0300
0.0400
0.0500
0.0 5.0
µC
2 - 2.267
0.0100
0.0200
0.0300
0.0400
0.0500
0.0 5.0
µC
2 - 2.267
Figure 42--Chromatogram of hydrolyzed mod. starch from amylopectin. Separation by CarboPac PA1
83

0.050
0.100
0.150
0.200
0.0 2.5 5.0 7.5
µC
0.050
0.100
0.150
0.200
0.0 2.5 5.0 7.5
µC
Figure 43-Chromatogram of hydrolyzed modified starches from PDB. Separation by CarboPac PA1
0.0200
0.0400
0.0600
0.0900
0.0 2.0 4.0 6.0 8.0
µC
min
0.0200
0.0400
0.0600
0.0900
0.0 2.0 4.0 6.0 8.0
µC
min
Figure 44-Chromatogram of one of the standards -D-Glucose. Separation by CarboPac PA1
3.8.5. Conclusions
HPAEC-PAD allowed a clear separation of dissimilar polysaccharides by
chemical composition. The polysaccharides produced during the fermentation
of starch showed to be strongly attached to the starch-like fractions. Such
components showed a better attraction towards the column compared with
the starch-like fraction and were, therefore, separated under the alkaline
conditions. The analysis of sugars showed that modified starches are
composed of at least two basic units, one of which was related to D-glucose.
84

It has been reported before by Huang et al. [43] the increases in the
molecular weight of these polymers by SEC (size exclusion chromatography).
However, SEC does not provide details related to the process of modification.
This technique together with MALDI-TOF MS allowed a fine separation of the
polymers involved. However, the separation is performed just at the low
molecular weight range with degrees of polymerization (DP) of ~10 to 40
glucose units.
3.9. Viscoelastic and mechanical properties
3.9.1. Abstract
Three different samples of thermoplastic fungal/modified starches were
prepared. One sample was produced by using the casting method with 40-
wt% glycerol and in excess of water as the plasticizers. The other two
samples were produced by extrusion. One set was produced solely in
presence of 40wt% of glycerol, and the other set was filled with 30 wt% of
Hallocote® 466 hydrasperse as reinforcing material. Similar samples of
native starches were used as control. The materials were characterized using
dynamic mechanical thermal analysis (DMTA).
In comparison with the native starch/glycerol composites, modified starches
exhibited a considerable increase in the storage modulus showing a process
of chain stiffening and the presence of multiple thermal transitions detected
by tan and loss modulus peaks. It was also observed that the presence of
clay produced a separation of the thermal transition in native starch/glycerol
composites, but not in samples prepared with modified starches which also
showed the shifting of the glass transition (Tg) at higher temperatures
suggesting a better thermal stability.
85
3.9.2. Introduction
3.9.2.1. Dynamic mechanical thermal analysis of polymers
Polymeric materials, synthetic or natural, are used extensively because of
their properties and low cost. For most applications, the most important
information when working with polymers (and with any other material) is to
have some basic knowledge of the mechanical behavior and how the
mechanical properties can vary with temperature and time of load (rheology,
creeping). In general, the mechanical properties are considered the most
important of all physical and chemical properties of polymers. The dynamic
mechanical properties provide information of one of the most fundamentals
properties of polymers, the glass transition temperature (Tg). The Tg can be
obtained by storage modulus (E') onset, loss modulus peak (E"), or tan
peak.
3.9.2.2. Basic definitions
Continuum mechanics of solids can be studied in solids through viscoelastic
properties (dynamic mechanical analysis) and the flow properties of liquids
by their Newtonian or non-Newtonian behavior (rheology) [111]. In both
cases, the materials are subjected to a deformation by an external force. The
viscoelastic behavior of different solid materials such as synthetic polymers,
wood and its derived products, and thermoplastic starches can be described
based on systems of springs and dashpots (a damper factor), which
represent the elastic and viscous or non-elastic behaviors respectively. Some
well known models to describe the visoelastic properties are the Maxwell
(consisting of a dashpot and a spring in series), Voigt (model which is a
dashpot and a spring in parallel), and the Four-element formed by a
combination of the Maxwell and Voigt models [111].
86

The slope of any graph of stress vs. strain within the elastic region yields a
straight line, and it corresponds to the Young’s modulus (E) of the material
which physically represents the stiffness of the materials. More complex
models exist to describe the mechanical properties of materials with more
complex deformation behaviors. In the Voigt model alone, for example, it is
difficult to separate the effects of the elastic behavior (E) from those
produced by the viscous or inelastic behavior (h) represented by the dashpot
(the damping factor).
A typical engineered stress () vs. strain () curve obtained at constant
temperature during a tensile test depicts the elastic properties of the solid
sample by the linear region [112]. The strain is usually calculated by using
the Cauchy engineering strain (eq. 1), but the Henchy or true strain, Kinetic
theory of rubber strain, Kirchhoff strain, or Murnaghan strain can also be
used for more accuracy. In the Cauchy test, for example, the strain is
determined by dividing the increment of the elongation (L) by the original
length of the sample (L) (L/L) and multiplied by 100 to express the result
as a percentage. The slope taken in the elastic or Hookean region is the
modulus or the Young’s modulus (E) which is associated with the stiffness of
the material. Clearly, E is dependent on the speed of the applied stress and
temperature. Different stresses will cause very different strains in the
materials. Also, by increasing the temperature the materials will pass
through its glass transition (Tg), melting (Tm), or degradation points at which
the modulus will drop abruptly due to the molecular motion or degradation.
The general definition of modulus using the Cauchy engineering strain
definition is defined by eq. 1 [111]:
E=tensile stress/tensile strain= /=(F/Ao)/(L/Lo)=(FLo)/(AoL)-------- eq. 1
Where F is force, Lo the length of the sample, L the elongation of the sample
after applying the force, and Ao is the transversal area of the sample.
87

The Hookean theory is used to represent the elastic behavior in solid
materials with viscoelastic behavior. The Hook’s law linearly relates the
deformation or strain to the stress by a constant specific to the spring. As the
spring constant increase, the material becomes stiffer, and the slop of the
strain-stress curve increases showing the increment of the E. In other words,
E is equivalent to the slope of the linear region of the strain-stress curve, and
it is also the constant “k” in the Hook’s relation (Force= - k*displacement).
For a squared triangle taking the hypotenuse in the linear region, the tangent
of the angle is equivalent to E, which can be defined as the relation of strain
to stress. In practice, the increase in modulus in polymers may be to the
increase in density cross-linking, crystallinity, and with the molecular
orientation in the direction of the testing, as well as with the addition of
certain percentages of fillers. The modulus will decrease with an increase in
temperature and plasticizer content since these variables increase the
molecular motion and produce the slippage of the neighboring molecules
inducing lower stiffness. Also, stiffness of the sample will appear higher if the
rate of testing (the speed of the stress) increases, and will decrease if the
test speed decreases. Viscous properties are represented by the curved
region or non-linear region. This region represents the Newtonian behavior or
the material’s ability to flow (rheology properties).
The viscous fraction is represented by the dashpot in the aforementioned
models. In a Newtonian fluid, the plot of shear stress () vs. strain rate ()
results in a straight line. The strain-stress variables are directly related by
the viscosity (ŋ). Many oils and liquids are Newtonian fluids; their viscosities
do not change with increasing shear rates. However, many materials are not
Newtonian liquids, since their respective plots of shear stress vs. strain rate
are not linear. For example, polymers, food products, suspensions, and
slurries are dependent on viscosity — pseudoplastic fluids get thinner as
shear rates increase; dilatants fluids increase their viscosity as shear rates
increase; plastic fluids have a yield point with pseudoplastic behavior; and
thixotrophic and rheopectic fluids exhibit viscosity-time-dependant with
88

nonlinear behavior. At molecular level, the dashpot represents the resistance
of the chains to uncoiling, whereas the spring represents the thermal
vibration of chains segments that will tend to seek the lowest energy
arrangement.
At the glass transition (Tg) of the polymer where polymer changes from
glassy to rubbery, the chains gain enough mobility to slide by each other.
The free volume (Vf) determines the ability of the molecules to move below
the Tg, or to flow above this transition point. Below the Tg some phenomena
associated with the elastic region occur like creeping, but many times the low
motion limits the ability of the instruments to measure it. On the other hand,
the free volume theory explains most of the phenomena found in starch
including aging or annealing.
Many important and interesting phenomena occur at the Tg transition. As the
polymer approaches its Tg the molecular motion reaches its peak, and all
molecular phenomena become temperature dependent. By exceeding the Tg,
the molecular structure of amorphous polymers are highly dependent on
their molecular weights and chemical structure. Per example, the chain
length and branching pattern may limit or facilitate the degree of molecular
motion. Plasticizers are common materials used to modify the rheological and
therefore molecular behavior of the polymers.
In general, the most important function of the plasticizers in a polymer is to
lower the Tg by “diluting” the polymer. These effects also decrease the
recovery or the polymer to its original shape after releasing the force which
produces the deformation. A special case is found in cross-linked polymers
which show a very specific curve with a flat equilibrium region, because the
crosslink do not allow the polymers to flow.
As mentioned, a polymer exhibits both elastic (spring-like) and viscous
(dashpot-like) behavior, but polymers also present a time dependant
89
behavior or “memory”. The behavior of the polymers is also dependant of the
temperature (free volume theory). The free volume theory is of extreme
importance for explaining the dynamic mechanical thermal analyses (DMA)
principles since the molecular motion is studied as a function of the
temperature [111]. The main objective of this instrument is to determine the
Tg of the materials either by storage modulus (E') onset or peaks produced
by tan and loss modulus (E").
3.9.2.3. Basic principles of DMTA
In DMA an oscillatory (sinusoidal) strain is produced by a sinusoidal stress.
The force to produce the deformation must be enough to allow the recovery
of the material within its elastic region. In the DMA an elongation is specified
and the force is assigned by the instrument to produce that deformation. This
will be reproducible if the strain is kept within the viscoelastic region. The
limiting extremes in viscoelastic materials are the elastic or Hookean
behavior and viscous or Newtonian behavior. These limits apply to the DMA
analyses. The user of the DMA chooses a strain (deformation) within the
elastic region of the material and performs the test at increasing
temperatures. Since the temperature will produce the material’s internal
molecular motion the instrument adjust the force to maintain the fixed strain.
By passing the Tg the material will not recover completely within the elastic
region under the applied stress, and the instrument will record the molecular
motion as a loss of energy. The Tg will appear as a Gaussian or Lorentzian
curve depending mostly of the molecular weight distribution [111].
For a material, which obeys Hooke’s law, the resulting stress will be
proportional to the amplitude of the applied strain. The strain in this case will
be in phase with the stress, i.e., the phase shift (phase angle ) between
stress and strain will be 0°. For an ideal fluid, which obeys Newton’s law, the
stress will be proportional to the strain rate. The stress signal will lead the
90

strain signal by 90°. Viscoelastic materials exhibit a phase angle between 0°
and 90°.
The “modulus” generated during an oscillating experiment in the DMA is
referred as complex modulus (E* or G*)—which is defined based on the
complex stress (* or*) and the complex strain (*or*). The complex
modulus is a measure of the material’s resistance to deformation and it
encompasses both the viscous and the elastic properties. The elastic
modulus, or storage modulus (E' or G’) and the viscous modulus, or loss
modulus (E” or G”), are defined based on the complex stress and strain. The
tan is defined as the ratio of the loss to storage modulus (tan =E”/E' or
tan = G”/G’). A summary of the calculations are as described in eq. 2 to 8:
Complex Modulus defined for a viscoelastic material (nomenclature for
compression or bending clamps):
E* = */ or E* = E' + iE” ---------------------------------------- eq. 2
Complex Modulus (nomenclature for shear mode clamps):
G* = or G* = G'+ iG” ------------------------------------------- eq. 3
Storage Modulus (tension, Compression or Bending):
E’ = ’or E' = E* cos ------------------------------------------------ eq. 4
Storage Modulus (shear):
G’ = ’ or G’ = G* cos ---------------------------------------------- eq. 5
Loss Modulus (tension, Compression or Bending):
91

E” = ” or E” = E* sin -------------------------------------------- eq. 6
Loss Modulus (shear):
G” = ” or G” = G* sin ----------------------------------------------- eq. 7
Damping produced by the viscous region of the material:
tan =E"/E’ or tan = G”/G’ --------------------------------------------- eq. 8
When the oscillatory force in the DMA is applied to a visco-elastic material
the signal of the strain undergoes de-phasing (deformation in degrees
defined by 90°>°). By measuring both the amplitude of the deformation
at the peak of the sine wave (the wave period; stiffness) and the lag
between the stress-strain sine waves, quantities like modulus, the viscosity,
and the damping can be calculated, and described based on the material’s
response to the oscillating force. From this, it is possible to calculate
properties like the tendency to flow (viscosity), from the phase lag and the
stiffness (modulus) from the sample recovery. These properties are
associated with the ability to lose energy as heat (damping) and the ability to
recover from deformation (elasticity). It is also possible to study the
relaxation of the polymer chains and the changes in the free volume of the
polymer, which describe the changes in the sample.
One advantage of the DMA is that it is possible to obtain the modulus each
time a sine wave is applied, allowing a sweep across a temperature or
frequency range. It is possible then to run an experiment at a fixed
frequency (per example 1Hz or 1cycle/second) and record the modulus every
second. This can be done while varying the temperature at some rate like
1°C to 10°C/min, recording the modulus as a function of temperature (over a
range of 200°C). Similarly, it is possible to scan a wide frequency range or
shear rate range of 0.001 to 200 Hz. Most instruments have allowable ranges
for amplitude, force, and stress of 0.5 to 10000, 0 to 18, and 0 to 1E6 MPa
92
respectively. The DMA is a very sensitive technique which allows the
measurement of transitions not apparent in other thermal methods such as
DSC. This sensitivity allows the DMA to detect the Tg of highly crosslinked
thermosets or thin coatings.
Dynamic Mechanical Thermal Analysis (DMTA) is the most sensitive
technique to determine the glass transition temperature (Tg) of polymers.
Moreover, the Tg is the most important parameter to link the mechanical with
molecular properties of the polymers.
3.9.2.4. DMTA of starch
By using the shear mode of the DMA, Xie et al. [113] determined the glass
transition temperature (Tg) of starch plasticized with 45% of water by tan
peak at 68.6 °C; with onset at approximately 61°C and offset at ~70°C. The
storage modulus (G') didn’t show a clear onset, and the loss modulus (G")
showed also a peak at 60-70°C. At temperatures of 60°C G' remained almost
constant, but decreased abruptly above this temperature. G" initially
increased slightly with increasing temperatures, but also dropped abruptly by
passing the peak. The complex viscosity (ŋ*) decreased stately with
temperature, showing also a sharp loss of viscosity after passing the 60°C.
The softening of starch particles during the gelatinization produced the
decrease of G' and G", the slight decrease in both moduli was attributed to
initial water diffusion within the starch granules. The authors also noticed
that ŋ*viscosity remained almost the same while approaching to the Tg, and
dropped abruptly after passing this point. They also report that the best
operating conditions of the instrument was at 1Hz, block thickness 3mm, and
heating rate of 2°C/min. The tan peak and the endothermic peak obtained
at a heating rate of 2°C/min in the DSC were reported to be coincident. By
using the cantilever mode in the DMA at 1Hz and heating rate of 1.5°C/min.
Similar findings were reported by Averous et al. [114].
93

It is widely known that the Tg by DSC is highly dependent on the water
content, and the same appears to be truth for DMA. By using sealed pans
withstanding up to 30 bar, Stepto [115] report the endothermic peak
associated to the Tg for starches hydrated at 12% and 42% to be 150 and
75C respectively.
Wilhelm et al. [85] also reported the production of starch-clay composites.
They analyzed these materials by dynamic mechanical analysis (DMA) and
other techniques, and reported two relaxation processes in un-plasticized
films and three in plasticized materials for the DMA results. One relaxation
process at approximately -110°C in unplasticized films was associated with
the rotation of the hydroxymethyl groups and oscillations of the sugar rings
about the glycosidic bonds, the other to water loss. The relaxation processes
found in plasticized films were associated with two phases that originated
from partial miscibility of glycerol and starch (-78°C), other to amylose-
glycerol rich phase, and the other to the starch-rich phase-glycerol. The
shifting in the Tg by tan peak was explained based on the formation of
hydrogen bonding among the different components of the composites, i.e.:
clay-water-starch. The antiplastization of sorbitol in starch composites was
also reported as the presence of an extra thermal peak in DMA by Gaudin et
al. [116].
3.9.3. Materials and methods
3.9.3.1. Formation of films by the casting method
The modification of starch was performed according to the methods of Jeng
et al. [42]. The starch samples (modified and native; 4 g/100g of water)
were diluted in a beaker of 400 mL, then 40% (total dry basis) of glycerol
was added. The solution was placed in a heater equipped with a stirrer. The
temperature used was 70°C at the heating/stirring time of approximately 1
h. The solution was then cooled and poured on a Petri dish. Water was
94

evaporated from the moulds in a ventilated oven at 40°C overnight. Dry films
were conditioned in open polyethylene bags and stored at 20°C and a RH
50% for one week before the analysis [43, 117].
3.9.3.2. Extrusion of the materials
Two samples were extruded: modified starch/glycerol and modified
starch/glycerol/clay. The amount of glycerol and clay was 40 and 30%
respectively base on starch dry weight. Similar samples were produced with
native starch and used as control. Glycerol was from Aldrich. HALLOCOTE®
466 hydrasperse clay from HallStarch Co. was from L.V. LOMAS LTEE.
The dry fractions were pre-mixed. Then the plasticizer was added and
blended in a commercial food processor. After it was sufficiently blended, the
mixture was placed in a plastic bucket covered with a hermetic lid and
allowed to stand overnight.
The extrusion was carried out in a laboratory co-rotating twin screw extruder
ONYX TEC-25/40 designed with 10 heating zones and 3 vents. The technical
parameters of this apparatus and conditions during the extrusion are listed
below:
1. screw nominal diameter 25 mm
2. twin-screw centre distance 21.2 mm
3. speed of revolution (Max) 500 r/min
4. L/D 40 (length to diameter ratio)
5. Output 2-15 kg/h (according to the materials and formulary system)
6. whole power 11.4 kw (kilo watts)
7. driving motor power 5.5 kw
8. main motor centre high 1050 mm
9. main motor outside size 2400X600X1650
10.main motor weight 700 kg
95

11.up to 600 rpm (starch sample: 120 rpm)
12.Feeder up to 25 rpm (starch sample: 8 rpm)
13.S feeder 15 rpm (not used)
14.Pressure Motor 0.02 Mpa
15.Energy imput 4.1 A (Ampers)
The blends were extruded by using the digital feeder settings incorporated
into the extruder. Feed rates were determined for each blend by weighing
the amount of blend transported from the hopper to the barrel over a fixed
time interval (this value was ~28 g/min). The vents were maintained open to
allow the release of any humidity evaporated during the extrusion. The
extrusion was carried out by using a 2 in X 3 mm exit slit die to obtain the
product in rods which were cooled and immediately pelletized. The
temperature in the barrel varied according to the samples, but it was on
average ~140oC. The profile of temperature during the extrusion is provided
in Table. 6.
Table 6 Extrusion temperature profiles for samples finally tested MS=Modified starch, NS=native starch
Zone Temp. profile (oC) 1 2 3 4 5 6 7 8 9 10 MS 130 130 135 140 140 140 145 150 155 160 NS 130 130 130 135 135 140 140 140 140 140
3.9.3.3. DMTA conditions
The dynamic mechanical thermal analysis was conducted using a Q800
Dynamic Analyzer (TA Instruments USA) with tensile clamps at a single
frequency-scanning mode of 1 Hz and heating rate of 2°C/min over a
temperature range of 40 to 150°C. A dynamic strain of 15 m was applied to
all samples, 0.4 for Poisson ratio, 125% force track, and 5 min of soak time.
The data collected consisted of storage modulus (E'), loss modulus (E"), and
loss factor (tan .
96

A pre-fabricated die of 10 X 20 mm was used to cut the films and keep the
dimensions constant. The thickness was fixed at 0.40 mm by using metallic
prefabricated stoppers in the case of hot press mold films. The thickness in
the case of films prepared by casting methods was specified by weight during
their preparation. All films were coated with silicone oil to prevent a fast
dehydration. The tests were performed repetitively until a reproducible
values were obtained (the tests were performed at least in triplicate). Data
storage and analyses were carried out with the incorporated software
Universal Analysis 2000 TA Instruments Version 4.5A and Advantage for Q
Series Version 2.5.0.256 TA Instruments.
The generation of the stress-strain curve for the determination of the linear
viscoelastic region (LVR) was determined by using a preload force of 0.1N, at
40°C, force ramp rate of 0.25N/min, and maximum force of 5N. During this
determination the instrument was set for the determination of the creep
compliance [J(t)] and relaxation modulus [E(t)]. The creep compliance was
determined with a static force of 0.01 N for 5 min.
3.9.4. Results and discussion
3.9.4.1. Samples produced by film casting method
(starch/glycerol composites)
3.9.4.1.1. Determination of the linear viscoelastic region
(LVR)
The stress vs. strain curve of the films determined using the DMA showed in
general similar results compared to those results obtained using the Instron.
The elastic region associated to the Young’s modulus is shown in Figs. 45 and
46. These plots were obtained at constant temperature (40oC), with a ramp
force of 0.25 N/min and maximum force of 10 N. The modulus of elasticity
(E) measured from the slop of the stress-strain curve of modified starch films
97

was of ~6.7 MPa, while the same value for native starch films was less than
1.3 MPa. Modified starch films showed an elastoplastic behavior within a
short strain range, and an abrupt transition region between the Hookean
behavior and permanent deformation. Native starch films behave more like a
non-linear elastic material (like rubber).
The stress-strain curve of films produced with native starches showed a non-
linear elastic or more viscous behavior. In this case, a tangent to the baseline
was used to calculate the Young’s modulus (E). The stress-strain curve of
those films produced with modified starches clearly showed a definite LVR
and a more defined elastic behavior of the material at low strain
deformations. It can also be observed an abrupt inflexion in the transition
region of permanent deformation can also be observed. In this case E was
directly associated with the slope determined at the elastic region of the
curve.
0.0 0.5 1.0 1.5 2.0 2.5 3.0 3.5 4.0
0
2
4
6
8
Str
ess
(MP
a)
Strain (%)
Figure 45--Linear viscoelastic region (LVR) determined by DMA in films produced by casting method with modified starches
98

0 2 4 6 8 1
0
1
2
3
4
5
0
Str
ess/
MP
a
Strain/%
NSF
Non-linear elastic
Figure 46- Linear viscoelastic region (LVR) determined by DMA in films
produced by casting method with native starches
3.9.4.1.2. Creep compliance test
DMA can also provide useful information related to the mechanical behavior
of the materials. As detailed in the methods, two transient modes (creep and
stress relaxation) and a multi strain experiment (stress/strain plot) were
used for the determination of creep compliance [J(t)], stress relaxation
modulus [E(t)], and evaluation of the linear visco-elastic region (LVR)
respectively.
Creep compliance and recovery behavior are shown in Figs. 47 to 50. Creep
compliance was taken with a static force of 0.01N for 5 min at 40°C (Figs. 47
and 48). For the sample of native starch films two regions (primary and
secondary) can be observed for the deformation spectrum (insert of the Fig.
99

47). The primary region shown in this graph corresponds to the early stage
of loading when the creep rate decreases rapidly with time. The secondary
region of deformation also had a linear response with time and the creep rate
decreased more slowly. The recovery region had a similar trend.
Modified starches showed non-linear response as shown in Fig. 48. These
starches showed just one region under the applied load and a lag recovery
showing the molecular resistance to comply with the initial molecular
arrangement after the load was removed. Moreover, the deformation was
higher in samples of native starches at the same applied force, showing also
the tendency of modified starches to oppose the deformation.
On the other hand the maximum relaxation modulus in native starch films
was 3X10⁴ MPa, but only of 1100 MPa in samples of modified starches. These
values are directly related with the stiffness of the materials which was lower
in native starch films. In most cases, the plot of the relaxation modulus vs.
time showed instantaneous equilibrium in native starch films after the
applied force ceased, but in the case of modified starches didn’t reached the
equilibrium, as shown in Figs. 49 and 50.
100

0 1 2 3 4 50
1x10⁹
2x10⁹
3x10⁹
4x10⁹
1.2 1.3 1.40
1x10 9
2x10 9
Prim ary
SecondaryE lastic recovery
D eform ation
Cre
ep c
ompl
ianc
e (µ
m²/
N)
Time (min)
Figure 47-Creep compliance determined during the LVR test in native starch films
0 1 2 3 4 5
0.0
2.0x10⁸
4.0x10⁸
6.0x10⁸
1.5 2.0 2.50
1x10⁸
2x10⁸
3x10⁸
4x10⁸
Region of elastic recovery
Cre
ep c
ompl
ianc
e (µ
m²/
N)
Time (min)
Figure 48- Creep compliance determined during the LVR test in modified starch films
101
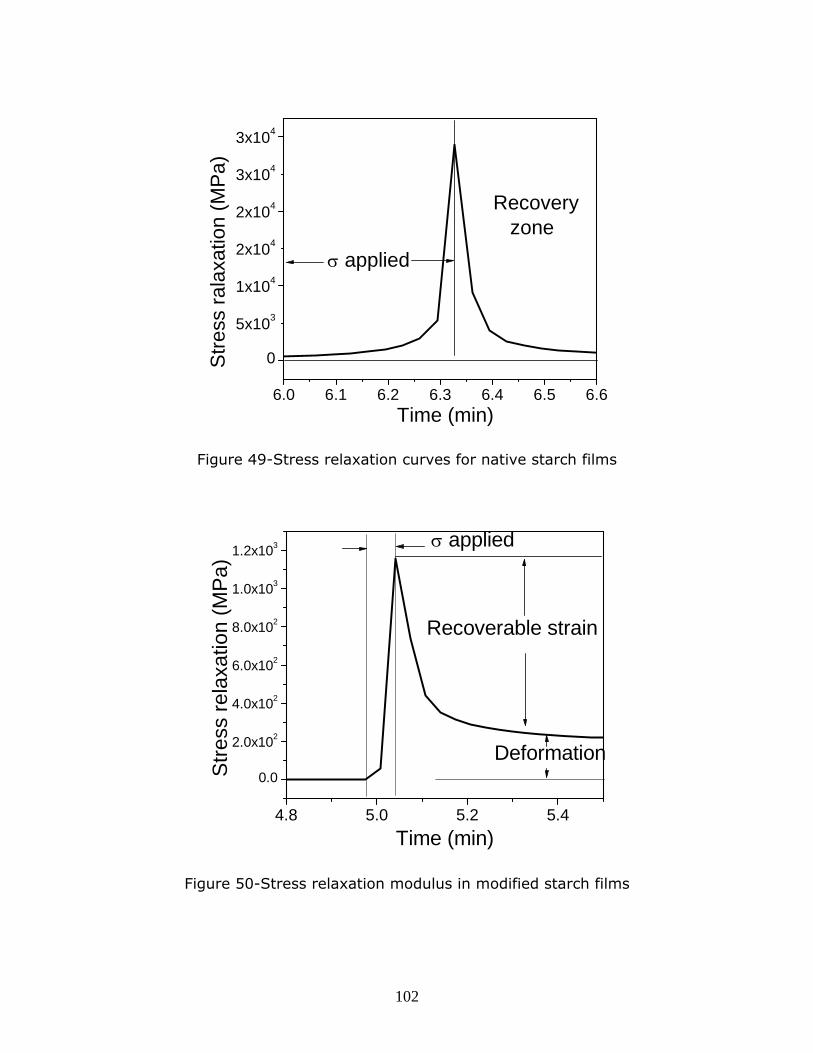
6.0 6.1 6.2 6.3 6.4 6.5 6.6
0
5x10³
1x10⁴
2x10⁴
2x10⁴
3x10⁴
3x10⁴
Str
ess
rala
xatio
n (M
Pa)
Time (min)
applied
Recovery zone
Figure 49-Stress relaxation curves for native starch films
4.8 5.0 5.2 5.4
0.0
2.0x10²
4.0x10²
6.0x10²
8.0x10²
1.0x10³
1.2x10³
Str
ess
rela
xatio
n (M
Pa)
Time (min)
Deformation
applied
Recoverable strain
Figure 50-Stress relaxation modulus in modified starch films
102

3.9.4.2. DMTA-Samples produced by film casting
(starch/glycerol composites)
Figures 51 and 52 depict the DMTA curve profiles of the films. In general
these spectra confirmed the presence of two separated fractions showing
different Tg transitions. The first drop in the curve from 130 to 150°C may be
due to water evaporation. The differences in the thermal transitions between
native and modified starches are clearly observed. Overall, the storage
modulus (E') and the loss modulus (E") decreased continuously with
increasing temperatures (up to 160°C), but composites prepared with
modified starches showed higher values of E' compared with native starch
films showing a process of chain stiffness.
The tan curve peaked at approximately at 90°C in native starch films.
However, in modified starch films two thermal transitions were observed at
~90 and 120°C by loss factor. By comparing both spectra, the peak at 90°C
in modified starch samples can be associated to the starch-rich fraction and
the peak at 120°C to thermal resistant fractions of modified starches.
103

20 40 60 80 100 120 140 160
0
20
40
60
80
100
120
TemperatureoC
E' a
nd E
'' (M
Pa)
E'
E''
Tan
0.24
0.28
0.32
0.36
0.40
Ta
n
NS
Figure 51- DMTA spectrum of native starch films produced by casting method
20 40 60 80 100 120 140 1600
50
100
150
200
250
Temperature oC
E'a
nd E
" (M
PaP
)
0.20
0.22
0.24
0.26
0.28
0.30
Tan
Tan
E'
E"
Figure 52-DMTA spectrum of modified starch films produced by casting
method
104

3.9.4.3. DMTA- samples produced by extrusion
(starch/glycerol composites)
Samples of extruded native and modified starches are shown in Figs. 53-55.
Similar to the previous analyses, native starches showed one thermal
transition by tan peak and modified starches two main thermal transitions
by tan peak.
Moreover, the loss modulus (E") curve profile of modified starch composites
showed a peak at ~60°C. The peak at 120°C was recurrent in both samples
of modified starches suggesting the presence of thermal resistant fractions
induced during the modification of the starch. The shoulder at 120°C in the
tan curve of modified starches and the irregular transition after passing the
maximum Tg not only confirmed the molecular heterogeneity of modified
starches, but also show that the Tg of the polymers can gradually shift to
higher temperatures showing higher thermal and molecular stability.
20 40 60 80 100 120
0
100
200
300
400
Temperature ( o C)
Sto
rage
(E
') an
d lo
ss (
E")
mod
ulus
0.28
0.32
0.36
0.40
0.44
0.48
Tan
Figure 53- DMTA curve profiles of native starch glycerol composites produced by extrusion
105

40 60 80 100 120 140 1600
200
400
600
800
1000
Temperature oC
Mod
ulus
(M
Pa)
E'
E"
Tan
0.20
0.25
0.30
0.35
0.40
0.45
Tan
= E
"/E'
Modified starch
Figure 54-DMTA curve profiles of modified starch glycerol composites produced by extrusion-
20 40 60 80 100 120 140 160
0.0
5.0x10²
1.0x10³
1.5x10³
2.0x10³
Temperature ( o C)
Sto
rag
e (
E')
an
d lo
ss (
E")
mo
du
lus
0.2
0.3
0.4
0.5
Tan
E"
E'
Tan
Figure 55-DMTA curve profiles of modified starch-glycerol composites produced after extrusion
106

3.9.4.4. DMTA- samples produced by extrusion
(starch/glycerol/clay composites)
Various mineral clays have been used to modify the chemical properties of
thermoplastic starches [85, 89, 118-129]. Figures 56 and 57 depict the
DMTA curve profiles of both samples under study: modified- and native-
starch/clay/glycerol composites. Overall, the same tendency was observed in
these experiments. The storage modulus (E') and the loss modulus (E")
decreased continuously with increasing temperatures (up to 160°C), but in
general, composites prepared with modified starches showed higher values of
E' compared with native starch composites showing a process of chain
stiffness. It was also observed that the incorporation of clay increased the
temperature of the glass transition temperature (Tg) by ~10°C and also the
storage modulus (E') by approximately three times (at the same conditions
of sample preparation and testing conditions).
The tan curve in native starch composites peaked at approximately 60 and
90°C. The peak at 90°C can be associated to a starch-rich fraction in both
samples. Since the peak at ~60°C was not detected in native starch-glycerol
composites, it can be assumed that this thermal relaxation is due to a
separated glycerol-rich phase originated from the partial miscibility of starch
with this plasticizer in presence of the clay [130].
In the case of modified starch composites, two main thermal transitions were
also detected at ~90 and 130°C (Fig. 52). A similar thermal transition was
detected in composites prepared in absence of clay (Fig. 4) at 110°C showing
that this broad shoulder was produced by the fungal modification of the
starch. However, it can also be observed that the temperature of this
transition shifted toward higher temperatures indicating that the clay
restricted the chain mobility of these fractions of the modified
polysaccharides.
107

Furthermore this shoulder may be also explained due to the intrinsic
molecular properties of the materials. Since the temperature will produce the
material’s internal molecular motion, the material softens and its length
increases, the instrument then adjusts the force to maintain the fixed strain
(elongation). As the polymer approaches the Tg the curve increases showing
the molecular resistance to change. As the maximum Tg is reached the
molecules lose strength (the material softens). After passing the Tg the
phenomenon becomes thermal dependent and the shape of the curve will be
depicted based on the molecular composition of the polymers, i.e.,
crystallinity if any, branching entanglement, etc.
20 40 60 80 100 120 140 160
0
200
400
600
800
1000
Temperature/oC
E' a
nd E
" (M
Pa) E'
E"
Tg by tan peak
0.25
0.30
0.35
0.40
0.45
0.50
0.55
0.60
0.65
Ta
n
Figure 56---DMTA curve profiles of native starch-glycerol-clay composites
108

20 40 60 80 100 120 140 160
0
500
1000
1500
2000
2500
3000
Temperature/oC
E' a
nd
E"
(MP
a)
E'Tg by tan peak
0.0
0.1
0.2
0.3
0.4
0.5
0.6
0.7
0.8
Tan
Tg by E" peak
Figure 57-DMTA curve profiles of modified starch-glycerol- clay composites
3.9.5. Conclusions
In general, the decrease of the storage modulus results from the inability of
the material to store energy. The loss modulus decreases more slowly
depending on the ability of the molecules to lose energy. The storage
modulus (E') is a measure of the stiffness of the sample. The stiffness can be
affected by various factors, i.e., the presence of different chemical species
acting like fillers or to increasing the cross-linking density. The loss modulus
(E") is related with the energy that cannot be recovered. In thermoplastic
starches this value can be associated with the diffusion of the plasticizers
through the starch mass. Also, the shape of the tan curve change
systematically with the amorphous content or molecular weight distribution
of the polymers involved as well as with the plasticizer content and type, i.e.,
the excess of plasticizer (i.e. water or glycerol) may produce sharper peaks.
109

Furthermore the shoulder at ~120oC detected in modified starch composites
may be also explained due to the intrinsic molecular properties of the
materials. Since the temperature will produce the material’s internal
molecular motion, the material softens and its length increases, the
instrument then adjust the force to maintain the fixed strain (elongation). As
the polymer approaches the Tg the curve increases showing the molecular
resistance to change. As the maximum Tg is reached the molecules lose
strength (the material softens). After passing the Tg the phenomenon
become thermal dependent and the shape of the curve will be depicted based
on the molecular composition of the polymers, i.e., crystallinity if any,
branching entanglement, etc. Moreover, the free volume theory indicates
that the molecular segments will not move randomly, but in specific
directions when an external stress is applied [111]. The resistance to change,
therefore, is due to the strongest molecular binding.
110

3.10. Thermal properties
3.10.1. TG (thermogravimetry)
3.10.1.1. Abstract
The thermal behavior of modified starches (MS) was described based on a
comparative analysis with native starches (NS). Thermogravimetric analyses
(TG) with successive derivatives (DTG) performed under non-isothermal
conditions, in an atmosphere of flowing nitrogen were used for this study.
Results obtained from NS samples showed a single peak dominating both the
TG (DTG) plots. A double thermal transition event was detected in samples of
MS. The interval of thermal decomposition (Ti–Tf; lowest onset temperature
of initial and final mass change) was carried out within a narrow interval of
temperatures in NS (610–640°C). Residues higher than 10% were recorded
for MS at temperatures of 1000°C. The presence of the double thermal
transition in MS and the shapes of the TG and DTG are discussed based on
the fundamentals that describe this technique.
3.10.1.2. Introduction
Starch is used mostly in food applications. The thermal properties of these
materials are of extreme importance for this industry. Depending on the
nature of the substituents and the degree of substitution (DS) the properties
of modified starches can be varied extensively, i.e. viscosity, association
behavior, film forming, thermal stability, or mechanical properties. Enzymatic
modifications of granular or gelatinized starches may also lead to the partial
molecular depolymerization and/or substitutions which may produce starch
derivatives with new and interesting industrial properties.
111

The starch structural differences should also be sensitive to the TG Such
structural differences should be Since the ratio amylose to amylopectin
depends on the starch source, the thermogravimetric (TG) curves have been
also used to investigate the differences among the various starch sources,
and it has been reported that the spectra of the degradation is sensitive to
the starch’s structural properties such as the ratio of amylose to amylopectin,
morphology as well as the processing conditions and/or modifications [131-
133]. However, the results are not conclusive compared with the previous
mentioned techniques.
In this study we investigate the properties of starch modified by specific
fungal strains by thermogravimetry (TG), and we also analyze the second
and the successive derivatives as a recurse to investigate the influence of the
starch structure and/or fungal modification on the shape of the plots.
3.10.1.3. Fundamentals of thermogravimetry (TG)
The Nomenclature Committee of the International Confederation for Thermal
Analysis (ICTA) thermogravimetry (TG) is defined as a technique by which
the mass loss of the sample is measured while it is subjected to a controlled
temperature program (normally heating the sample to a specific increasing
rate).
It is implicitly understood that this technique, unlike the complementary
techniques such as differential scanning calorimetry (DSC), cannot give any
information about reactions that do not involve mass change like
polymorphic transformations and double decomposition reactions. TG,
therefore, may not be useful for identification of a substance or mixture of
substances. On the other hand, when a positive identification has been made
by X-ray powder diffraction or some other method, TG can be used to
estimate or investigate the presence of a substance in a mixture or the purity
of a single substance.
112

The thermogravimetric curve is obtained by using a thermobalance. With this
instrument, the temperature range over which a reaction involving weight
change can be determined. This range depends not only on thermodynamic
and kinetic factors, but also on procedural variables, such as heating rate,
crucible geometry, atmosphere, sample weight, and sample preparation.
The thermogravimetric curve can be presented either as the TG curve, which
is a plot of the mass against time or temperature, with the mass loss on the
ordinate plotted downward, or as the derivative thermogravimetric (DTG)
curves, which are plots of the first derivative of the rate of change of mass
with respect to time or temperature.
3.10.1.3.1. General reaction of thermal decomposition
The more detailed explanation of thermal degradation can be found in
Treatise on Analytical Chemistry [134]. The basic reaction that controls the
spectra of the thermal decomposition as explained in this treatise is as
follows:
A(s) —> B(s) + C(g) (1)
This reaction can be described as the decomposition of a solid sample (s) in
another solid and the corresponding gas fraction (g). Therefore, any given
thermo analytical method necessarily involves the control of the following
variables: reaction rate and reaction environment.
In general, the instrument settings, which may affect the results, are: the
heating rate and the furnace atmosphere and geometry, as well as the flow-
rate of the gas supplied. The results can also be affected by the geometry
and material of pan (i.e., aluminum, metal). Some variations may also arise
113

due to the intrinsic properties of the samples: the mass, particle size, sample
history or pre-treatment, molecular packing, thermal conductivity, and heat
of reaction. For example, when comparing two similar samples which differ
just in the pre-treatment most of these variables do not diminish the results,
and the thermal spectra will depict the differences between the two samples.
Overall, the shapes of the TG and DTG depend on the procedural,
thermodynamic, and kinetic factors.
3.10.1.3.2. Definitions
The following quantities are involved in the determination of the thermal
spectra:
t = time
T = temperature
R = universal gas constant = 8.31434 J mol-1 K-1
k =Boltzmann’s constant = 1.380 X 10⁻²³ J K-1
h = Plank’s constant = 6.626 X 10⁻³⁴ J s
= extent of reaction.
The fraction of gas () may be defined as the fraction of total volume of gas
evolved or a fraction of total weight loss. Where two or more gases are
evolved the extent of reaction is due to the individual contributions to the
total volume of gas, for example, CO2 and O2 can be expressed as CO2 and
O2. Normally the fraction of gas goes from zero to a total of 1. In order to
detect the nature of the gases, some instruments incorporate infrared
systems.
114

3.10.1.3.3. Theory
The relationship between rate of reaction and extent of reaction is generally
expressed in the form
d/dt=f()k (2)
where = extent of reaction
d/dt = rate of reaction
f() = some function of
k = a temperature-dependent quantity.
Reaction rate may also be influenced by the presence of other gases other
than the product gases. However, such influence can be reduced or assumed
negligible by using either vacuum or an inert gas. Therefore, this Eq. 1 is
assumed to be sufficient to describe the kinetic behavior of decomposing
solids. Thus, two things must be determined:
f(), i.e., the relationship between reaction rate and the extent of
decomposition
How k changes with temperature, i.e., the relationship between
reaction rate and the temperature.
3.10.1.3.3.1. Relationship between reaction rate and
the extent of decomposition
The shape of a plot of “”against “t” (under non-isothermal or isothermal
conditions) is determined by the integral of the extent of reaction (Eq. 3).
(3) if
115
(4) then
(5) Thus the shape of the plot of against t is determined by g(). It should be
noted that Eq. 3 can be applied equally to iso- and non-isothermal results.
However, the simplest case is the isothermal analysis (Eq. 5).
The decomposition of a solid usually starts with the formation of small
localized areas of product called nuclei, which grow larger, forming an
interface between product and reactant that proceeds into the bulk of the
solid, gradually consuming the whole of the solid particle. Nuclei normally
form on the surface of the reactant. Various steps have been described
during this process such as surface desorption, surface decomposition, and
nucleation, followed by an induction period attributable to the rate of the
nuclei formation. The reaction is then preceded by a fast rate of
decomposition which reaches a maximum showing a decelaratory trend.
The generation of growth nuclei, establishes the existence of a reaction
interface and the subsequent growth of the interface; thus the form of f(a)
and g(a), is governed by
the type of nucleation
the geometry of the reactant particle
the influence of diffusion
The type of nucleation depends upon the relative magnitudes of DGn, the
free energy for nucleation, and DGg, the free energy for the growth of nuclei.
When Gg<<Gn, the growth of existing nuclei predominates over the
formation of new ones. This type of nucleation gives rise to sigma-shaped
decomposition curve because as the nuclei grow the rate of decomposition
increases until the growing nuclei begins to overlap, after which the rate of
116

decomposition progressively decreases. One of the most important general
expressions derived for g() and which corresponds to this type of behavior
is the Avrami-Erofe’ev equations:
(6)
Where “n” can take the values of 2, 3, or 4, and it may be 1 (first order
equation) and in this case the nucleation and reactant geometry do not apply
and individual molecules may decompose at random, or individual particles
nucleate and rapidly decompose at random which may be the case of
gaseous or liquid samples.
If DGg=DGn then a large number of diffuse nuclei form, none of which grow
to a visible size. Thus, the acceleratory period is reduced or completely
absent covered with small nuclei. The interface then proceeds at a constant
speed (under isothermal conditions) into the bulk of the solid. This behavior
may be described by the equation derived by Mampel:
1-(1-)1/n=kt (7)
where n has the value 2 or 3, and is the number of dimensions in which the
interface advances.
For the simple case of one-dimension diffusion the equation
2=kt (8)
has been shown to apply. For two-dimensional diffusion out of a cylindrical
particle the equation
(1-)In (1-) + =kt (9)
can be used. For three-dimensional diffusion out of a sphere the equation:
117

[1-(1-)1/3]2=kt (10)
or
(-2/3)-(1-)2/3=kt (11)
can be used.
The g() values discussed so far are summarized in Table 1. It should be
noted that the t referred to in these equations is measured from the start of
the decomposition process, i.e., after the end of the induction period if one
exists. Errors may arise because it is not always easy to accurately estimate
the point from which t should be measured. Also, some g(a)’s in Table 1 are
multiplied by a constant. This is because the differential form of the equation,
f(a), is assumed to give the correct value for k (as for heterogeneous
kinetics); thus, integrating f() according to Eq. 5 gives rise to a constant
that must be included when analyzing data using the integral form of the
kinetic equations (Table 7) [134].
118

Table 7
Commonly Used Kinetic Equations
Sigmoid Rate
Equations
F(a)=(da/dt)/k g(a)=kt Lab
el
1 Avrami-Erofe’ve (1-)[-In(1-)]1/2 2[-In(1-)]1/2 A2
2 (1-)[-In(1-)]2/3 3[-In(1-)]1/3 A3
3 (1-)[-In(1-)]3/4 4[-In(1-)]1/4
Deceleratory
4 First order (1-) -In(1-) F1
Based on
Geometric Models
5 Contracting area (1-)1/2 2[1-(1-)1/2] R2
6 Contracting
volume
(1-)2/3 3[1-(1-)1/3] R3
Based on diffusion
mechanism
7 One-dimensional
diffusion
-1 1/22 D1
8 Two-dimensional
diffusion
[-In(1-)]-1 (1-)In(1-)+ D2
9 Three-dimensional
diffusion
[1-(1-)1/3]-1(1-)2/3 3/2[1-(1-)1/3]2 D3
10 Ginstling-
Brounshtein
[(1-)-1/3-1]-1 3/2[1-2/3-(1-)2/3] D4
There is also another three types of nucleation: constant rate of nucleation,
continuously rate of nucleation, and instantaneous nucleation, all of which
give rise to an equation of the general form
-In(1-)=ktm (12)
119

where the value of m is determined by the type of nucleation, the number of
dimensions in which nuclei growth occurs, and wheter the reaction is phase
boundary or diffusion controlled. Table 2 provides values of m for Equation 8.
3.10.1.3.3.2. Relationship between reaction rate and
temperature
This relation is based on the on the Arrhenius equation. In general, the rate
of any given chemical reaction will increase with temperature [134].
3.10.1.4. Materials and methods
The equipment used consisted of a TG-DTG (thermo-gravimetry-differential
thermal analysis) unit from TA instruments model Q500. The integrated
software provided the TG and successive DTG derivative signals. The purge
gas flow rate was set at 100 mL min-1. Rising temperature experiments were
conducted in which the heating rate was 5oC/min for all experiments. With
the aim of avoiding the oxidation of the species, the thermal decomposition
was performed in an atmosphere of flowing nitrogen at 100 ml min-1. The
maximum temperature was set to 1000oC.
3.10.1.5. Results and discussion
TG and successive DTG have been largely used to study of the mechanisms
of degradation of starch and its derivatives. Although, just one-reaction
process has been observed in different starch sources, it has been shown
that particular species can be readily differentiated by the comparison of
their respective decomposition temperature intervals; Ti-Tf, where Ti is the
lowest temperature at which the onset of a mass change can be detected for
a given set of experimental conditions and Tf is the lowest temperature at
which the onset of the mass change has been completed [132].
120
TG curves and respective first derivatives of weight against temperature
(%/oC) (DTG) for native as well as modified starches at 1000oC are shown in
Figures 58 and 59. The curve of mass loss against temperature showed
apparently a single-stage of decomposition (Ti-Tf) in both samples of native
starches and modified starches. DTG plots of modified starches showed at
this zone of weight/loss transition the maximum temperature of ~307oC;
value which was slightly higher in native starches ~318oC. The percentages
of residual mass recorded at these temperatures were ~40% and ~50% for
NS and MS respectively. The weight loss in MS did not go to 100% even at
temperatures above 1000oC. Instead, remaining masses higher than 10%
were recorded for different samples of MS, including modified tapioca
(branching type C), potato (type B) or corn (type A) starches.
In contrast, the plot in Fig. 58 shows the complete degradation of native
starches at ~600oC. It was deduced at this point that some heat resistant
chemical species are being formed in the modified starches. Some examples
of such materials potentially formed include carbonaceous char- or graphite-
like residues or ionic structures which can derive inorganic compounds during
the process of degradation. For some samples of modified starches it was
found a slight gain in weight at temperatures over the 1000oC (in air at
elevated temperatures a polymer will eventually oxidize with subsequent
chain scission and degradation giving rise purely to a 100% gaseous mass,
the weight gain during the combustion in presence of air is an erroneous
result, due to the formation of oxide-like compounds) [134].
A plot of time against temperature appears always as a straight line with the
slope of the curve indicating the heating rate employed. The variations due
to the reaction of the material under increasing temperatures cannot be
easily appreciated due that the instrument automatically adjusts the heating
rate. However, differences in exothermic or endothermic heat capacity with
respect to the constant heating rate can be observed in successive
121

derivatives of weight (%/oC and 2nd derivative %/oC2) and times (min/oC and
min/oC2) versus temperature (oC).
The rate of mass change versus the temperature is shown in Fig. 60 (1st and
2nd derivatives of weight versus the temperature). The %/oC2 displayed the
minute separation of two endothermic peak events not observable in native
starches. Successive derivatives of time versus the temperature (min/oC and
min/oC2) for modified starches as well as native starches are shown in
Figures 61 and 62. The maximum fluctuations were observed in samples of
modified starches.
The first stage of discontinuity observed before the 100oC in the TG plots of
native starches was related to the loss of water. The loss of water in a first
stage of the heating was not observed in modified starches. For some
samples of modified starches (not shown in the Figures), the lack of phasing
with respect to the initial mass weight loss was probably due to the
environment of the decomposition (i.e., the presence of volatile products of
decomposition in the sample which probably induced their initial behavior). in
contrast, it is possible at this point that modified starches do not take
excessive water from the surronding environment, phenomenon which in
principle is due to the molecular arrangement of modified starch. The
presence of pendant groups or compounds of different molecular weights
may be the reason for this phenomenon as it was shown by 1H NMR, HPAEC-
PAD, and MALDI-TOF MS (chapters related to chemical characterization).
122

0 200 400 600 800 1000
0
20
40
60
80
100
Temperature /oC
Mas
s lo
ss/%
317oC
42%
Tf ,~ 610-640oC
0
2
Der
iv.
mas
s lo
ss (
%/°
C)T
i
Figure 58- TG-DTG plot of native starches showing the degradation point at the 1st derivative
200 400 600 800 1000
0
20
40
60
80
100
Temperature /oC
Mas
s lo
ss /%
309oC~60%
0
2
Der
iv. m
ass
loss
/(%
/o C)
640-660oC~6-15% residual material
Figure 59- TG-DTG plot of modified starches showing the degradation point at the 1st derivative
123

250 300 350
0
2
Temperature/oC
Der
iv. m
ass/
(%
/oC
)
-0.20
-0.15
-0.10
-0.05
0.00
0.05
0.10
0.15
2n
d Der
iv. m
ass
(%/o C
2)
Figure 60-TG-DTG plots showing successive derivatives for modified starches showing a clear double thermal transition peak
100 200 300 400 5000.05
0.10
0.15
0.20
Temperature/oC
De
riv ti
me
/(m
in/o
C)
-0.10
-0.05
0.00
0.05
0.10 2nd D
eriv. time
/(min/ oC
2)
Figure 61-TG-DTG-successive derivatives obtained by TG in native starches showing the lack of thermal transitions
124
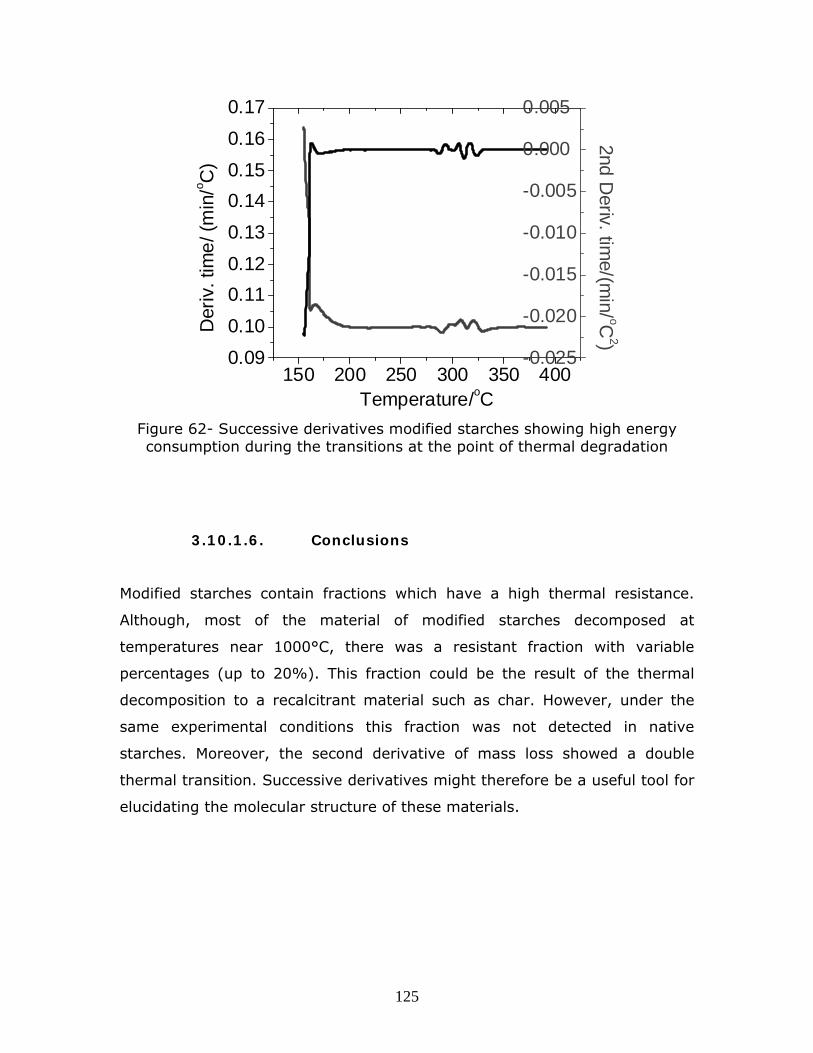
150 200 250 300 350 4000.09
0.10
0.11
0.12
0.13
0.14
0.15
0.16
0.17
Temperature/oC
Der
iv. t
ime
/ (m
in/o C
)
-0.025
-0.020
-0.015
-0.010
-0.005
0.000
0.005
2nd D
eriv. time/(m
in/ oC2)
Figure 62- Successive derivatives modified starches showing high energy consumption during the transitions at the point of thermal degradation
3.10.1.6. Conclusions
Modified starches contain fractions which have a high thermal resistance.
Although, most of the material of modified starches decomposed at
temperatures near 1000°C, there was a resistant fraction with variable
percentages (up to 20%). This fraction could be the result of the thermal
decomposition to a recalcitrant material such as char. However, under the
same experimental conditions this fraction was not detected in native
starches. Moreover, the second derivative of mass loss showed a double
thermal transition. Successive derivatives might therefore be a useful tool for
elucidating the molecular structure of these materials.
125

3.10.2. DSC
3.10.2.1. Abstract
The thermal behavior of modified starches (MS) produced by biosynthetic
pathway is described based on a comparative analysis with native starches
(NS). MS were produced by fermentation in presence of Ophiostoma spp.
cultures. Differential scanning calorimetry (DSC) were used for this study. NS
results showed a single peak dominating the DSC plots. A double thermal
transition event was detected in samples of MS showing the presence of a
double glass transition temperature (Tg).
3.10.2.2. Introduction
Starch is the dominant food component in most diets around the world. This
material has been also widely studied and used for the production of edible
films as well as for the production of biodegradable materials for packaging
or production of disposable materials. Starch in contrast to other abundant
polysaccharides like cellulose, can be processed by extrusion or injection
molding in presence of common and non-toxic plasticizers like water or
glycerol. The functional properties of starch are intimately connected with the
unique chemical composition and architecture present in the native starch
granules. The deposition of the elements within the granules during the
starch synthesis is complex and not totally explained. However, there are
some general features in which most of the specialized researchers agree.
According to x-ray diffraction analyses, cereal starches are described as
having A-type molecular structure and tuber starches B-type. It has been
determined that the differences arise due to the presence or absence of
central double chains within the central cavity formed by a hexagonal array
of double helices which form the crystalline structure (or lamellae) in the
amylopectin molecules.
126
In the absence of the central chains (B-type starches) the central cavity may
be filled with water molecules. The application of heat in excess of water to
fully bring about one of the most important characteristics of starch, namely
gelatinization. Almost all food preparations involve gelatinization as does the
production of thermoplastic starches by extrusion or injection. During this
phenomenon the granules swell, lose molecular order, and the viscosity of
the solution increases. In the DSC spectra, in excess of water (>40-50%)
one sharp peak is observed between 60 and 80oC, but as the water content is
lowered the peak broadens and shift to higher temperatures (between 100
and 130°C). Amylose-lipid complexes may also produce a thermal
discontinuity in the DSC curve, but unfortunately there is no a general
agreement in the association of this transition with a particular peak.
DSC has also been used to determine the specific Tm (melting point) and Tg
(glass transition temperature) transition points of both granular and
amorphous starchy materials. Many authors have reported results with wide
variations which could be attributed to the measurement conditions,
plasticizer type and content as well as to the complex behavior of starch
physical morphology. In addition, the heat conductivity of granular starch can
be also increased with salt solutions, such as KCl, in such cases there was a
shift of the detected endothermic peaks towards lower temperatures. In
general, all results are entirely dependent on the moisture content (mc), or
plasticizer as well as thermal conductivity. Both phenomena (Tg and Tm) are
thermodynamically irreversible and they are not well differentiated from each
other. For example, waxy maize tested in aluminum pans at ~13% mc has
presented an endothermic heat flow at ~60oC with onset at ~40oC. This peak
was considered as a change of heat capacity associated with the Tg. When
this sample was tightly packed in stainless steel O-ring pans by ultra-sound
bath the thermal plot showed a double transition event with peaks at 170
and 190oC. In O-ring pans loaded with ~26 mg of sample at ~56% water
content the observed endothermic transitions were 4 at ~70, 90, 110 and
127

130oC. The origin of these peaks was not explained by the respective authors
[135].
On the other hand, rice starch tested in aluminum sample pans at ~60% mc
produce a strong peak at ~70oC which was related to the gelatinization
temperature of the starch (onset temperature ~60oC and final temperature
90oC) [136]. Two peaks in waxy wheat found at ~65 and 105oC (starch
tested at mc of 50% in aluminum pans) were related to the starch
gelatinization and the dissociation of amylose-lipid complexes respectively
[137]. Blends of different starches do exhibit two different heat flow
transitions [138]. Gelatinized starches also exhibit one endothermic peak
associated to Tg [139].
Gelatinization is a complex process which includes the disruption of the
crystalline regions (Tm) within the granules, while the phenomenon of the Tg
occurs just to amorphous materials. The differences in temperatures for the
endothermic peaks among different starch samples are associated therefore
to the starch composition (amylase to amylopectin ratio), granular
architecture (crystalline to amorphous ratio) and Mw (molecular weight) as
well as polydisperisty of the chains [140-142]. In sealed DSC pans with
potato starch one peak is reported by Septo [6]. The endothermic transition
was detected at ~75oC with 45% moisture content (mc) and ~150oC at 12%
mc.
In polymer theory, Tg is the glass-rubbery transition that occurs in
amorphous polymers and Tm (melting point) occurs when the ordered
regions of a polymer fall apart upon heating. However, Tg of dry starch is
inaccessible owing to the thermal degradation of starch before reaching it.
Upon heating in excess of water, the starch granules collapse together with
the crystalline regions. This last phenomenon has been associated with the
gelatinization process. Plasticizers (water, glycerol, sorbitol, sugars, etc.) do
affect the thermal transitions upon starch heating and lower the Tg
128

temperature. Starch thermal transitions in presence of water have been
studied for a long time due to its importance in the food industry.
Theoretically, water may induce the glass-rubbery transition (Tg) of
amorphous regions of starch before the melting of crystals, but the frontier
between Tg and Tm is not well defined. Poutanen and Forssell [143] reported
that the Tg in water can be found by two methods, the free-volume approach
and the thermodynamic theory.
The free-volume approach (assuming the glassy state is an iso-free volume
state) consists of studying the plasticizing effect at different water contents
and by studying the oligomeric behavior with extrapolation to molar mass.
The applicability of the free volume approach may be limited as the
dependence of free volume on molecular weight, intermolecular forces, chain
flexibility, chain geometry and structural detail such as the bulkiness of side
groups is not taken into account. With respect to biopolymers such as starch,
intermolecular interactions and hydrogen bonding may play a significant role
in plasticization behavior. The free volume approach therefore, may be useful
in some cases. The second method associated with the Tg of the amylopectin-
water system is based on the thermodynamic theory (assuming continuity of
the excess entropy of mixing at Tg). Both methods finally depend also on the
Cp (heat capacity) measured by DSC (differential scanning calorimetry).
Therefore, the thermal transitions measured by DSC can describe in
relatively detail physical and chemical changes related to Tg or Tm of starch. A
third method not described by the thereafter authors which can provide more
detail and great accuracy is DTMA (dynamic thermal mechanical analysis).
3.10.2.3. Materials and methods
Differential scanning calorimetry (DSC) thermograms were acquired to study
the course profile of the gelatinization process in both starches; modified and
unmodified, in presence of KCl to increase thermal conductivity in the starch
samples. DSC was performed with a Q1000 unit from TA Instruments fitted
129

with a cooler system and nitrogen gas as purge. All samples were tested by
triplicate in aluminum pans with 30 l volume capacity-PE No.-BO169320,
and empty pan as reference. Samples were made up as starch slurries. The
maximum temperature reached 250oC at a heating rate of 5oC/min, with size
samples of 5-7 mg. DSC data parameters collected with the software
integrated (TA Instruments; Universal Analysis) included: onset temperature
(TON), maximum peak at melting point (TM), final melting temperature (TC),
melting temperature interval or the start and conclusion temperatures (TR)
and change heat capacity (Cp) at the measured melting point. TR is defined
as the point at which the DSC trace line first ceases in following a straight
line and finally recovers the base line. The onset temperature was taken at
the first inflection point on the trace curve line of the DSC endotherm. The
maximum endothermic peak temperature is normally used for the
determination of the enthalpy of gelatinization.
3.10.2.4. Results and discussion
DSC parameters are shown in Table 8: Onset (TON), maximum peak at
melting point (TM), final melting temperature (TC), melting temperature
interval (TR), heat capacity (Cp); the enthalpy of fusion (Hfus) can be
deduced from Cp at the recorded temperatures as shown in the Table. The
main differences observed for modified starches in powder form with respect
to the rest of the samples. However, one of the most interesting results was
recorded from films manufactured with modified starches. Before film
formation the TR was ~64 and after the manufacture of the films this value
was lower than films manufactured with native starches suggesting a better
molecular packing during film formation. Similar effect was found for TON, TM,
TC and the maximum endothermic heat flow. The Cp was as low as 8.2 J/(g oC) in modified starches in powder form, however, after film formation this
value is similar to that found for films manufactured with starch granules
being of ~70 J/(g oC). Similar results were consequently observed with the
respective melting temperatures. The melting temperatures of granular
130

native starches and films did not show such a sensitive variation. It is
possible to infer a high degree of disturbance after the modification,
however, the film formation showed a high level of molecular organization
comparable to native starches.
Table 8- DSC melting parameters for the substrate and modified starches
Samples DSC melting parameters
TR
(oC)
TON (oC) TM (oC) TC (
oC) Cp [J/(g oC)] measured at the
respective melting temperatures
in oC
Modified
starch(powder
form)
64.2 35.9 74.9
83.8
100.2 ~8.2
~9.9
Unmodified
starch in KCl
(granular form)
17.4 103.1 108.6 120.4 ~23.4
Modified starch
films in KCl
16.4 103.7 107.4
108.2
120.2 ~68.4
~66.7
Unmodified
starch films in
KCl
18.5 101.5 106.7 120.9 ~72.3
Figures 63 and 64 show the endothermic curve profiles for native as well as
modified starches in powder form gelatinized with a solution 0.6 M of KCl.
Native starches exhibited a narrower endothermic peak with a maximum
temperature of ~108oC, while modified starches displayed the two peaks at
~74 and 84oC. Onset transition temperatures were found at ~36oC in
modified starches while this same transition was located at around 103oC in
unmodified starches. The peak at the maximum endothermic heat flow for
modified starches was observed at lower intensity. In presence of DMSO,
modified starch samples also slightly displayed two maximum peak transition
points at ~73.57 and 81.20oC. The thermal transitions were smother
comparer with starches gelatinized in KCl and the melting temperature
interval was broader.
131

The endothermic profiles obtained from films manufactured with modified as
well as unmodified starches and analyzed in presence of 0.6 M KCl are shown
in Figures 65 and 66. The endothermal course profiles recorded on films
manufactured with native starches displayed an abrupt transition at ~102oC,
which is also the onset temperature for this sample, while the films from
modified starches showed a smoother transition at the onset value of
~103oC. Again, the temperature course profile in the case of modified
starches showed the two thermal transition peaks at the tip of the curve with
very close temperatures.
The water loss measured by DSC in modified and native starches films is
shown in Figures 67 and 68. The films were conditioned at constant weight at
laboratory conditions (65% RH-relative humidity-, 20oC) for 3 weeks. The
water bending curve due to water evaporation recorded for MS was much
lower compared to films fabricated with NS. In general modified starches
tend to adsorb less water at the same conditions of relative humidity.
132

20 40 60 80 100 120 140
-14
-12
-10
-8
-6
-4
-2
0
Hea
t flo
w (
mW
)
Temperature (oC)
End
othe
rmic
~108oC-14 mW
Figure 63- DSC thermograms of the unmodified substrate (native starch). Peaks induced with 0.6 M KCl (granular starch)
20 40 60 80 100 120 140-8
-6
-4
-2
0
He
at fl
ow
(m
W)
Temperature (oC)
endo
ther
mic
~83oC-6.4 mW
~74oC-7 mW
Figure 64- DSC thermograms of modified starch
133

20 40 60 80 100 120 140
-50
-40
-30
-20
-10
0
He
at fl
ow (
Mw
)
Temperature (oC)
~102oC-6.8 Mw
~107oC-52 Mw
Figure 65- DSC thermograms of native starch-films
20 40 60 80 100 120 140-40
-35
-30
-25
-20
-15
-10
-5
0
Hea
t flo
w (
mW
)
Temperature (oC)
End
othe
rmic
107oC-35 mW
108.5oC-35 mW
109 oC-34.5 mW
Figure 66- DSC thermograms of modified starch films
134

50 100 150 200
-12
-10
-8
-6
-4
-2
0
2
Hea
t flo
w (
mW
)
Temperature (oC)
~122oC-11.5 mW
Figure 67-DSC thermograms of native starch films
0 50 100 150 200
-3
-2
He
at fl
ow
(m
W)
Temperature (oC)
~106 oC-2.8 mW
~170oC-3.21 mw
Figure 68-DSC thermograms of modified starch films
135
3.10.2.5. Conclusions
Two thermal transitions were detected in samples of modified starches
and one in the respective native counterpart. Even after film formation, this
double transition was detected in the chromatograms taken from modified
starches. The analysis also showed that native starches are more susceptible
to water absorption. This technique is by far less sensitive than DMTA to
detect the glass transition temperature of the polymers. Even though, the
results support the findings of the viscoelatic tests (mentioned in chapter
3.9).
136

3.11. Rheology
3.11.1. Introduction
The rheological behavior of melted thermoplastic starches under
extrusion conditions is of great interest for the control operations and
properties’ design of extrudates. From the transport phenomena point of
view, rheological behavior represents the most important property for all
starch derived products, including bio-plastics. A difference of other
properties like thermal conductivity, heat capacity, or density, viscosity of
starches can greatly vary due to the effects of plasticizer type and content.
The production of thermoplastic starches produced at low water contents is
of increasing importance, since higher plasticizer contents cause distortions
and shrinkages which causes problems in the final products[6]. Available
data on rheological behavior of food pastes is widely available [144] as well
as comprehensive studies related to the parameters influencing the melting
behavior of thermoplastic materials intended as substitutes for petroleum
based plastics obtained by in-line and off-line capillary rheometers [145,
146].
3.11.2. Materials and methods
3.11.2.1. Sample preparation
The water content of the starches at the moment of the extrusion was ~7%
in MS and 11% in NS. It was determined by weighting a known mass in an
oven at 100°C for 2 hours prior to the mixing of starch with 40% glycerol.
The mass production was on average 1.5 kg/hour for MS and 2.3 kg for NS.
The average temperature extrusion profiles established experimentally were
by maintaining constant the speed screws (120 rpm) and the glycerol
content (40%) were: 120/120/130/130/130/140/140/140/150/160°C for
137
MS, and 110/110/120/120/120/130/130/135/150/150°C for NS. At the same
motor current energy used; ~2.7 A which is the difference in electrical
current between the loaded and unloaded barrel, the mass flow rate was
lower for extrudates of MS (0.00045 kg/s) than NS (0.0007 kg/s).
3.11.3. Instrumental conditions
The rheological properties were measured by using a twin bore capillary
rheometer Rosand RH2000— radius 15 mm and barrel length 250mm—, and
Flowmaster® software for data analysis. The apparent wall shear stress (w-
ap) was corrected for entrance and exit pressure losses by Bagleys’s
correction to give the true wall shear stress (w), and the apparent wall shear
rate (w-ap) was corrected by Rabinowitsch-Weissenberg equation to give the
true wall shear rate (w). The ENS and EMS pellets were melted, equilibrated
for 5 min, and extruded at 150°C and 160°C repectively. The differences
between the materials will be discussed based on the Power Law Model, and
used to describe the behavior of shear thinning fluids. The two parameter
data (w, w) was adjusted by the squares method with the Flowmaster®
software to a power law relation and given by:
Kn
where K is the consistency coefficient and n is the power law index.
Viscosities reported at 40% glycerol content were true apparent and true
viscosities () obtained from wall shear stresses and shear rates:
=/=Kn-1
The SME in the capillary was calculated by using the following relation:
SMEcap=Pcap Av/m’
Where A is the barrel area, v the plunger speed, m’ the mass flow[147].
3.11.4. Results and discussion
Fig. 69 shows the results for shear viscosity (Pa.s) as a function of shear
rate (s-1) for the two thermoplastic (TP) materials: modified starches (TP-
138

EPSs) and native starches (TP-native starches) (see also Fig. 70). It can be
seen that, for both samples the shear viscosity decreased and the shear
stress (kPa) increased with increasing shear rate. A strong power law
dependence of viscosity on shear rate is observed as it is normal for these
materials. The dependence was linear on double-logarithmic plots indicating
the power law model can be used to describe the rheological behavior of both
starch-based materials [147].
n=Kn-1
where n is the melt viscosity, K is the consistency, g is the shear rate, and n
is the pseudoplasitc index. The corresponding consistency and pseudoplastic
index; normally determined by the intercept and the slope of each single
straight line in the double-log plots, were determined by using the software
provided. Again, for both materials, the values obtained are between zero
and 1 showing the typical shear thinning behavior associated whit starch-
based materials. However, the shear viscosity and shear stress were sensibly
higher in TP-EPSs. Although the shear stress is similar at low shear rates, it
was observed that the shear stress increased faster with the increase in
shear rate. These results are in accordance with the higher temperatures
required for the extrusion of EPSs-glycerol mixture and melting of TP-EPSs
during the rheological tests used for thermoplastics based on EPSs.
The log-log plot of shear stress vs. shear rate showed that TP-EPSs present a
higher dependence on shear viscosity than TP-native starches. The linear
fitted logarithmic plots for TP-EPSs showed a slope of ~72o, while this value
for TP-native starches was of ~63o showing clearly a higher dependence of
TP-EPSs on shear rate (the behavior of the plot of a pure solvent; low
molecular weight, may be expressed by a straight line inclined at 45o in the
log-log coordinates, showing the typical Newtonian character), phenomenon
which is related to a more marked non-Newtonian behavior of TP-EPSs.
139

Shear-thinning curves may exhibit three distinct regions: a lower Newtonian
region where the apparent viscosity (), called limiting viscosity at zero shear
rate, is constant; a middle region where the apparent viscosity () changes
with the shear rate (decreasing for shear-thinning fluids) which can be
adjusted to the power low equation; and an upper Newtonian region where
the slope of the curve (∞) is constant with changing shear rates, also called
limiting viscosity at infinite shear rate. The power law relation also relates the
stress ( by a constant K (the consistency index) and the power low index
(n) to the shear rate () by:
= n or In () = In (K)+n In ()
The K values at different points of the flow curve are shown in Table 9. This
value was higher in EMS at low shear rates, and the power law index
decreases abruptly with the increase in shear stress.
101 102 103 104102
103
104
She
ar v
isco
sity
(P
a.s)
Shear rate /s
TP-EPSs
TP-Native starch
Figure 69- Plots of shear viscosity vs. shear rate (TP-native starch; TP-EPSs-Modified starches)
140

5.0x10² 1.0x10³ 1.5x10³ 2.0x10³ 2.5x10³ 3.0x10³
2.0x10²
4.0x10²
6.0x10²
8.0x10²
1.0x10³
She
ar s
tres
s (k
Pa)
Shear rate /s
TP-EPSs
TP-native starch
Figure 70-Shear stress vs. shear rate
(TP-native starch; TP-EPSs-Modified starches) Table 9- Calculated K values for modified and native starches
Shear stress (kPa) Shear rate (/s) n Calculated K value
(= n) TP-Modified starch
52.519 20.000 0.611 8.45 109.71 69.314 0.588 9.01 223.21 237.98 0.567 10.0 475.72 835.39 0.545 12.1 889.27 2895.7 0.523 13.7
TP-native starch 42.888 20.000 0.428 11.9 71.991 69.314 0.487 9.13 132.19 238.01 0.546 6.65 280.01 835.36 0.606 4.75 575.19 2895.3 0.667 2.82
141

3.11.5. Conclusions
The flow properties of exopolysaccharides (EPS) produced by Ophiostoma
spp. in the presence of starch were tested and compared to native starches
(NS). Rheological behaviors of extruded native (ENS) and extruded EPS (E-
EPS) with 40% glycerol content were evaluated in an off-line twin capillary
rheometer to mimic the flow properties of the extrusion conditions. Both
starches showed shear-thinning behavior, but E-EPS showed higher
plasticity. Consistency coefficients K determined by the power law model
were significantly higher at low shear rates in E-EPS, and the power low
index decreased abruptly at higher shear rates than 500/s-1. Mechanical
properties showed that E-EPS are stiffer materials than ENS.
3.12. Mechanical properties
3.12.1. Abstract
The mechanical properties of starch composites were briefly investigated.
The materials were produced by using the standards ASTM D638, Type I and
D638-5-IMP-ASTM. The results were similar. The results from modified
starches showed a more complex behavior than native starches. However, a
tendency was followed similar to that reported in previous studies by Huang
et al. [43] in which the tensile strength (and therefore the modulus) was
higher in modified starches compared with native starches. In addition, in
this section, the interactions between starch and clay in the presence of
glycerol were analyzed. It was found that, contrary to native
starch/clay/glycerol composites, in composites prepared with modified
starches the clay did not increase the elongation at break. These results
support the information obtained for the viscoelastic as well as chemical
properties.
142
3.12.2. Introduction
By itself, starch is a poor choice as a replacement for any plastic. The
hydrophobic nature of thermoplastic starches makes them susceptible to
moisture attack and as a result the dimensional changes produce important
modifications in the mechanical properties. In addition, retrogradation and
crystallization of the mobile molecules increase the complexity of the system
and it is more difficult to control the variables during a specific process.
The ratio of amylose to amylopectin also affect profoundly the properties of
the different starch sources (corn, tapioca, potato, etc.). The long, linear
chains of amylose readily associate through extensive hydrogen bonding
facilitated by the stereoregularity of the backbone and the wealth of the
hydroxyl functionality (4 per anhydroglucose moiety) giving good film
forming properties, while the ultramolecular high molecular weight of
amylopectin is associated to extensity crosslinking network formation.
The starch molecular association based on hydroxyl groups, and the
branching pattern of amylopectin also have a great impact on the rheological
behavior of the starch. It does not flow in presence of heat like a
conventional thermoplastic polymer. Phenomenon which has been associated
as having a lower degradation point than the glass transition temperature
(Tg) or the melting point (mp). In order to reduce the Tg of starch it is
necessary the use of a plasticizer. For example, to produce films by casting
method or to process starch by extrusion or injection molding it is necessary
to induce the disruption of the granules—and the crystalline regions—in
presence of a suitable plasticizer (phenomenon widely familiar known as the
gelatinization of starch).
The addition of plasticizer to starch is accepted as the means for lowering the
glass-rubber transition temperature (Tg) below the decomposition
temperature to make it more flexible. Glycerol and water are the most widely
143
used plasticizers. Glycerol is frequently used because is a non volatile
material and can remain in the mass after the extrusion. A number of studies
on the effects of plasticizers on starch have been carried out with the aim of
enhancing the properties of the thermoplastic starches.
Various authors have used a combination of glycols to plasticize various
sources of commercial starches (corn, tapioca and potato). The influence of
plasticizer content on the Tg of the starch-based materials has been explored
i.e. by Lourdin and co-workers [148]. These authors pointed out that the
efficiency of the plasticizer is governed by its ability to form favorable
interactions (probably hydrogen bonding) with starch. Moreover, the
flexibility of thermoplastic starches depends on the plasticizer content and
type. Even though, the properties of these starches cannot match the
efficiency of synthetic plastics. Therefore, further modifications are still
needed.
The use of reinforcing materials in the starch matrix is an effective method to
obtain high-performance starch derived products, i.e. there is an increased
use of cellulosic fibers, micro and nano-particles (clay or fibers) as the load-
bearing constituent in developing new and inexpensive biodegradable
materials due to their high modulus and high aspect ratio. However, it has
been observed an uneven distribution of the glycerol in the starch matrix and
its accumulation on the reinforcing phase resulting in poor mechanical
properties.
Myllarinen et al. [117] measured the effect of water and glycerol content on
the Tg of amylose and amylopectin films. They also obtained information on
the mechanical properties of films prepared at various contents of glycerol at
constant relative humidity (RH) and temperature. To produce the films,
amylose and amylopectin with different percentages of glycerol (10, 15, 20
or 30% starch dry basis) were dissolved in water at 140oC under pressure for
30 minutes and constant stirring. Films were produced by casting method,
144

stored at 20oC at RH 50% for one week before testing. Tg was measured with
DSC and was taken as the midpoint of the change in heat capacity (Cp).
Mechanical properties of stress and strain of the films (20X80 mm) were
measured by using the standard method ISO 1184-1983. The results showed
a slow decrease of Tg in presence of glycerol, and water was a better
plasticizer. Brittleness increased (reduction of %E) with the reduction of
glycerol. Overall, amylose films were stronger than amylopectin films.
Lawton [149] reported the production by the casting method of starch-
poly(vinyl-alcohol) films with the following formulation: 41% starch, 41%
PVA, 15% glycerol and 3% poly(ethylene-co-acrylic acid). The use of
different starches was reported: native corn starch, high amylose corn starch
(50 and 70% amylose), wheat starch, potato starch and tapioca starch. The
films were aged between 7 and 168 days before testing or stored at a
relative humidity (RH) of ~93% for 7 days. Tensile strength (TS), percent
elongation at break (%E), tear resistance and impact strength were tested
for the characterization of these materials. This author reported the following
results: an increase in percentage of %E and a decrease in TS as RH
increased, higher amylose films showed the greatest stability in %E, the
larger decrease of TS occurred at RHs between ~15 and 30% followed by a
linear decrease of TS as RH increased, tear resistance was low for all almost
all the range of RHs (from 15 to 93%), results for the impact strength of the
films were similar (waxy corn starch films presented lower properties), aging
for 28 days did not affected significantly the impact strength, however all
films (except high amylose starches) showed a significant decrease in %E
after aging for 168 days, TS increased with aging (~35MPa). A general
conclusion was that films prepared with high amylose starches were more
consistent over the entire range of conditions. Loss of tear resistance at
higher RHs was due to the molecular mobility, increase of TS and the
decrease of %E with aging is due to the loss of plasticizer content.
145

The behavior of the glycerol varies according to the composite formulation.
Starch-clay-glycerol films produced by the hot press method were recently
reported by Zhang et al. [123]. These authors used modified and pristine
clays. Micrographs showed an irregular distribution of the materials in the
composite. They suggested that the spacing among the materials in modified
clay films was due to the aggregation among the starch molecules, while the
spacing found in films with pristine clays was due to the presence of glycerol.
In spite of the starch source the same trend is shown for other films
prepared by the casting method. Films produced with cassava starch showed
and increase in strength in presence of higher amounts of amylose. With the
increase in glycerol concentration an observed an increase in the fracture
stress and water vapor permeability, and the stiffness decreased were
observed [150].
Godbillot et al. [151] report a maximum of 20% glycerol at a ~44% RH in
plasticized wheat starch films also produced by casting method. They
reported phase separation above this percentage and attachment of
excessive moisture to the starch and to the free glycerol molecules.
Laohakunjit and Noomhom [152] reported critical values of plasticizer at
which rice starch can be dissolved to produce starch films with improved
properties, i.e., 35% glycerol, 45% sorbitol; polyethylene glycol was reported
not suitable for film formation. In overall, the properties of films are similar
to those reported in the general literature. The TS was reported lower for
higher concentrations of plasticizer and the %E resulted higher. TS was lower
in glycerol plasticized films compared with sorbitol, but the elongation was
reported higher. The water and oxygen transmission rates increased with
plasticizer concentrations. Similar results related to the effects of glycerol
content on the TS, %E and water transmission rate were reported by Lopez
et al. [153] for films prepared with acetylated corn starch. Doungiai and
146

Sanguansr [154] also presented similar results for plasticized sorbitol tapioca
starches.
Montaño-Leyva et al. [155] also reported similar results for films prepared by
casting method by using wheat starch (durum). TS, %E, EM (elastic
modulus), solubilities were reported for two different glycerol concentrations
(25 and 40%). The films were transparent (amorphous starches). With 25%
glycerol the films turned brittle and the reported values were: TS=42-50
MPa, E=1.4-2.7%, EM 31-34 MPa). Films with 40% glycerol presented TS of
11-17 MPa, E=4-41%, EM=4-11.3 MPa). It can be observed that these
properties are affected by the glycerol concentration, in spite of the starch
source this trend is observed in all starches. By XRD analysis, these authors
reported a semi-crystalline structure. In general, the preparation of the
samples with 25% glycerol of TPS results very difficult. And the manipulation
of starch based materials plasticized with glycerol-water is in fact also very
difficult due to the sticky surface of the films, insufficient tenacity and
foaming [156].
Bertuzzi et al. [157] reported the production of films with high amylose corn
starches. The films were produced at low temperatures. The gelatinization
temperature was reduced by pre-treating the starch with alkaline solutions.
Films forming suspensions showed thixotropic behavior. The apparent
viscosity of films forming gels increased exponentially under the increase in
amylose content and the Arrhenius law represented variations with
temperature. The alkaline treatment of high amylose corn starches previous
to gelatinization produced low solubility and opacity and an increase in
crystalline regions reaching an asymptotic value after 60 min. Water
absorption and film opacity increased with the increase of glycerol content
(effect observed at 30% glycerol concentration). Opacity can be attributed to
the formation of crystalline fractions of retrograded amylose molecules.
147

Jansson and Thuvander [158] prepared starch films by using the casting
method with hydroxyl propylated potato starch mixed with 30% glycerol and
water (18% starch based on water). The mixing was carried out for 30 min
at 90oC until dispersion of the starch molecules. Bars of 7X70mm2 were
produced with variable thickness from 0.3 to 2.6 mm. The Tg was taken by
using DSC and DMA and was reported at ~38oC. The films were characterized
in terms of stiffness, strength and failure strain as well as by fracture
toughness which were measured by single edge notch tests. In these
particular experiments, stiffness increased as thickness increased from 0.3 to
1.0 mm. As thickness increased further, the stiffness decreased. This
behavior was attributed to the differences in molecular stretching produced in
response to water evaporation. This explanation is in accordance with the
process by which starch molecules retrograde in presence of water, and form
crystalline regions. As the water evaporates slowly in thicker films, the starch
molecules have lag periods of relaxation and therefore form more crystalline
regions. It was speculated that the higher values in stiffness may be due to
an equal rates in the molecular relaxation versus water evaporation. This
induced artificial stretching may produce a molecular deformation in direction
in the plane of the film. The strain at failure was reported to decrease with
the increase in thickness.
The TS increased with the thickness up to ~1.0 mm (up to 4 MPa) beyond
this point this property decreased (1.5 MPa). The explanation would be
similar to that offered for the behavior observed of the stiffness. The
formation of oriented crystalline fractions (filaments) may induce higher
tensile strengths. Such fractions may be formed by the aligning of the
molecules in the direction of the stress while heating the amorphous material
above its Tg (but below its melting point). The stress would be produced
during the evaporation of the water from the films. Oriented material may be
at least five times stronger than the unoriented material. In general, when
liquids compose of complex molecules or ions (e.g., sucrose or silicates and a
vast number of organic polymers) are cooled rapidly a glass may be formed.
148

Glasses are thus examples of non-crystalline solids. Glasses do not show a
sharply-defined thermal transition peak, but soften over a temperature
interval. The strain at failure (or fracture) was reported to increase with
increasing thickness up to ~1.0 mm, and decreased with the further increase
in thickness. The measured fracture toughness showed similar results.
Fracture toughness showed an increment when the film reached ~1.0mm
thickness.
Pushpadass et al. [159] reported the extrusion of corn starch (at 20%
moisture content based on starch dry basis) in presence of glycerol in a ratio
of 3:1 (~35%) with the further preparation of films. They used stearic acid
sucrose and urea at varying concentrations as secondary plasticizers for the
starch-glycerol mixture. The extrusion was carried out at 110 and 120oC
(barrel temperature). The physical and mechanical properties of the films
were studied by SEM and tensile testing. Tg was determined by DSC. The
interaction between functional groups of starch and plasticizers were
determined by FTIR. Water transmission rate was determined by using the
standard ASTM E96-95. SEM images showed the presence of partially melted
starch granules in the extruded material. The TS was 0.9 to 3.2 MPa, strain
at break 26.9 to 56.2% and Young’s modulus of starch films ranged from 4.5
to 67. 7 MPa. DSC displayed two Tg values in the temperature ranges of 0.1
to 1oC and 9.6 to 12oC (up to know just one peak for Tg had been reported
for glycerol plasticized starches). Multiple endotherms were observed in
thermoplastic extrudates. The gelatinization enthalpies of the extrudates
varied from 0 to 1.7 J/g and it was associated this variation to the extrusion
temperature and plasticizer content. The shift in the FTIR spectral bands
were related to bonding interactions between the starch and plasticizers. The
water transmission rate was reported between 10.9 and 15.7 g mm h-1 m-2
kPa-1, variation which was also associated to the extrusion temperature and
type of plasticizer.
149

Averous et al. [114] reported the production of TPS –wheat starch-glycerol-
water-cellulosic fibers-. These materials were extruded in a single screw
designed machine and further used for injection moulding. Extrusion was
carried out at 150oC and injection at 130oC with an injection pressure of 1000
bar and holding time of 23s. Mechanical properties were measured in an
injection moulded dumbbell parts. Thermomechanical properties were
analyzed by the DMA in the dual cantilever geometry at a frequency of 1Hz
and a heating rate of 1.5oC/min. Plasticized wheat starch had a maximum
strength of 3 MPa which showed an increase in presence of fibers. The strain
at break decreased and the elastic modulus increased as normal. Plots of
storage modulus and tan versus temperature showed the shifting towards
higher modulus and temperatures respectively for reinforces materials.
In general, it can be seen that native starches (~ 30% amylose, 70%
amylopectin) may be extruded between 100 and 150oC, the screw speed
varies with the type of extruder and should be set accordingly to the need of
the extrusion, but some values can be range from 40 to 120 rpm. Injection
molded parts can be prepared according to the standard ASTM D 638, Type I
dog-bone shaped to measure the properties. The temperatures in the barrel
can be kept up to 170oC at 90 bar.
3.12.3. Materials and methods
3.12.3.1. Sample preparation
Native corn starch used in this study was obtained from Casco Inc. Canada.
the results reported are the average of 20 different batches. Production of
modified starches and preparation of films were carried out according to the
methods followed by Jeng et al. [42]. Glycerol was from Aldrich.
HALLOCOTE® 466 hydrasperse clay from HallStarch Co. was from L.V.
LOMAS LTEE.
150

The dry fractions (starches and 30% clay base on starch dry weight) were
premixed followed by the addition of glycerol (40%) and rigorous mixing with
a commercial food blender. The mixture were then stored in plastic buckets
with hermetic lids before extrusion.
3.12.3.2. Extrusion
The process of extrusion was carried out with a laboratory twin-screw
extruder ONYX TEC-25/40, with a screw nominal diameter of 5 mm, twin-
screw centre distance 21.2 mm, L/D 40, ten heating zones, and three
venting ports.
Although, it was variable, the averaged speed in the feeder was
approximately 8 rpm and the screw speed 120 rpm. The energy input was
~4.1 A. The melting averaged temperature varied from 120 to 140 from
native and modified starches respectively. The venting ports were kept open
to allow complete removal of any moisture. The resulting extrudates,
obtained in rods of 3 mm, were immediately cut into pellets, cooling with air
and stored in plastic bags for further processing in the injection molding
machine. The extrusion conditions (speed of the feeder, speed screw,
temperatures, energy input) for the mixtures of native starch-or modified
starch-glycerol clay were similar.
In general, the following heating spectrum was follow for the extrusion of all
materials: screw speed (rpm) 120, temperature (°C)
120/120/130/130/130/140/140/140/150/160°C for modified starches, and
110/110/120/120/120/130/130/135/150/150°C for native starches,
residence time 200-400 (s), motor energy input 4±1 A.
151

3.12.3.3. Injection molding
Pellets after the extrusion were used to produce standardized ASTM D638
Type I dog-bone specimens by using a conventional injection molding
equipment ENGEL, Ludwing ES 80/28. Experimental molding conditions
were: barrel temperature: 140/145/150°C; die temperature: 150 for native
starches 160°C for modified starches; injection pressure, 100 bar; mould
temperature 60°C. The specimens were conditioned at 50% RH, at 2oC 24
hours before testing [117]. Maximum tensile strength, strain rupture, and
elastic modulus were performed on a universal mechanical testing system
Instron series 3360 model 3367 with 30kN (6,750 lbf) capacity.
Films were also produced by casting method and hot press method after
extrusion. These specimens were produced by using a die type D638-5-IMP-
ASTM. A strain rate of 2.5 mm/min was used. Film thickness was measured
with a micrometer at four random positions on each film specimen to an
accuracy of ± 0.02 mm. Tensile tests were carried out in an Instron series
3360, model 3367 with jaws of 2kN capacity.
3.12.4. Results and discussion
A significant improvement of the mechanical properties was observed in
samples loaded with clay even at the high load of this filler. Significant
increase in the tensile strength was also seen in samples of modified starches
prepared in presence of glycerol with respect to native starches. The
elongation at break decreased from native to modified starches in both
composites prepared with glycerol and glycerol/clay, but remained almost
equal from modified-starch/glycerol to modified-starch/clay/glycerol
composites, indicating a small effect in the rheology of these materials. This
effect can be also observed in the tensile strength increased which increased
substantially. By the other hand, the elongation at break increased form
native-starch/glycerol to native-starch/glycerol/clay composites influencing
152

notoriously the flow properties of native starches, effect which can be
attributed to the phase separation of the glycerol in presence of clay as
shown by DMTA analyses (Fig 71).
In native starches/clay/glycerol composites, the enhancement of the
properties of the composites suggests that the stiffness increases with the
silicate content the matrix. This is due to the well known
intercalated/exfoliated of the clay in the matrix of polymers. The increase in
the tensile strength is directly related with smaller particles which may allow
a good dispersion and can migrate throughout the system. The size and the
good dispersion of the clay will not restrict the migration and dispersion of
the glycerol. The reduction of strain in native starches in presence of clay has
been attributed to the agglomeration of the filler and therefore to the
restriction of the migration of the glycerol thus forming a separated phase
[126].
However, in the samples of modified starches, this phenomenon was not
observed. On the contrary an increase in the thermal stability was described
suggesting a good intercalation of clay-modified starch. Moreover, the
elongation at break did not increase after the incorporation of the clay
indicating the chemical reaction of the modified starch with the layers of clay.
A good dispersion of the clay may be due to the more available polar groups
found in modified starches.
It is interesting to note that at 40% glycerol modified starches showed a very
low elongation at break, but above this percentage this value increased
abruptly.
153
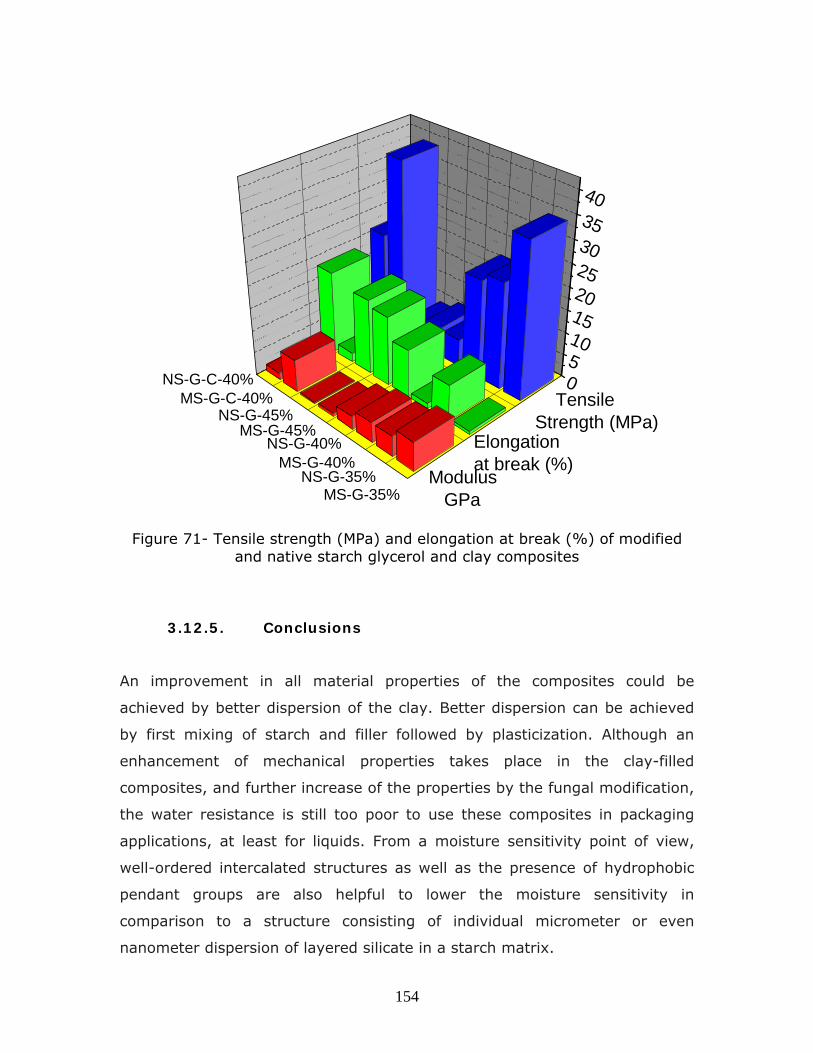
0510
15
20
25
30
35
40
MS-G-45%NS-G-45%
NS-G-40%MS-G-40%
NS-G-35%MS-G-35%
MS-G-C-40%NS-G-C-40%
Modulus GPa
Elongationat break (%)
Tensile Strength (MPa)
Figure 71- Tensile strength (MPa) and elongation at break (%) of modified and native starch glycerol and clay composites
3.12.5. Conclusions
An improvement in all material properties of the composites could be
achieved by better dispersion of the clay. Better dispersion can be achieved
by first mixing of starch and filler followed by plasticization. Although an
enhancement of mechanical properties takes place in the clay-filled
composites, and further increase of the properties by the fungal modification,
the water resistance is still too poor to use these composites in packaging
applications, at least for liquids. From a moisture sensitivity point of view,
well-ordered intercalated structures as well as the presence of hydrophobic
pendant groups are also helpful to lower the moisture sensitivity in
comparison to a structure consisting of individual micrometer or even
nanometer dispersion of layered silicate in a starch matrix.
154

4. General conclusions
The analysis of the structural properties of the fungal produced polymers
showed important variation with respect to the substrate. These properties in
overall influenced the functional properties of the polysaccharides.
The glass transition temperature (Tg) of starch films manufactured with
modified starches were investigated by mechanical dynamic analysis (DMA)
and differential scanning calorimeter (DSC). After the starch modification the
tan curve shown by DMA revealed two thermal transitions, phase changes
which were associated to the Tg of different polymers. The Tg by DSC
confirmed the findings of the DMA. The storage modulus of modified starches
(E’) was at least three-fold the strength of native starches. In addition, the
thermogravimetric analyses (TG) showed that complete degradation occurred
at ~630oC in native starches. However, after the modification, almost 20% of
the modified starches supported temperatures up to 1000oC. The second
derivative of the mass loss vs. temperature (2nd Deriv.) showed also two
thermal transitions in modified starches. X-ray diffraction analyses showed
that the crystalline regions of the starch granules remain intact after the
modification. Scanning electron micrographs (SEM) showed the physical
damage of the granules produced by the fungal enzymes as well as the
presence of inclusions blocking the granular’s surface porosity. Analyses by
solid state 13 CP/MAS NMR FTIR, and FT-Raman showed the substitution of
the branching points of the starch.
The various phase transitions (Tg) found in the DMA and DSC, therefore, may
correspond to variations in the molecular weight of the starch chains, as it
was shown by MALDI-TOF analyses. Degradation of the starch may occur
mainly in the amylose fractions. The analyses also showed the potential
presence of exopolysacchrides and protein-like compounds in the mass of
modified starches.
155

5. Future work
The chemical characterization of these materials and/or the description of the
biosynthetic pathway is still of great interest for the future improvement of
the process of production of these materials. In general applied and
fundamental work in the development of these biodegradable polymers for
packaging applications, production by extrusion and reactive extrusion,
injection molding applications, research to improve the processing and
binding properties of starch (starch-PVC, starch polyurethanes, etc., or
fillers). Also, of great importance is the effect of various nano-particles on
the functional properties of these materials.
156
6. References
[1] V. Siracusa, P. Rocculi, S. Romani, M. Rosa: Biodegradable polymers for food
packaging: a review. 2008, 19, 634-643. [2] L. Avérous, P. Halley: Biocomposites based on plasticized starch. Biofuels
Bioprod Bioref, 2009, 3, 329-343. [3] R. Narayan, Biodegradable plastics, in Opportunities For innovation in
Biotechnology, N. i. o. S. T. (NIST), Editor. 1993, National institute of Standards & Technology (NIST).
[4] R. Narayan, C. Pettigrew: ASTM standards help difine and grow a new biodegradable plastic industry. 1999, XII, 36-42.
[5] A. H. Tullo: From refuse to reuse. Chem Eng News 2007, 85, 15-20. [6] R. Septo: The Processing of Starch as a Thermoplastic. 2003, 201, 203-212. [7] A. J. Carvalho, A. A. Curvelo, A. Gandini: Surface modification of thermoplastic
starch: reactions with isocyanates, epoxy functions and steraroyl chloride. Ind Crops Prod, 2005, 21, 331-336.
[8] J. Guan, K. M. Eskridge, M. A. Hanna: Acetylated starch-polylactic acid loose-fill packaging materials. Ind. Crops Prod, 2005, 22, 109-123.
[9] Y. Lu, L. Tighzert, F. Berzin, S. Rondot: Innovative plasticized starch films modified with waterborne polyurethane from renewable resources. 2005, 61, 174-182.
[10] T. Qunyi, Z. Ganwei: Rapid synthesis of a superabsorbent from a saponified starch and acrylonitrile/AMPS graft compolymers. 2005, 62, 74-79.
[11] G. F. Fanta, F. C. Felker, R. L. Shogren: Graft polymerization of acrylonitrile onto spherocrystals formed from jet cooked cornstarch. Carbohydr Polym, 2004, 56, 77-84.
[12] M. Bengtsson, K. Koch, P. Gatenholm: Surface octanoylation of high-amylose potato starch films. Carbohydr Polym, 2003, 54, 1-11.
[13] L. Zhang, J. Gao, R. Tian, J. Yu, W. Wang: J Appl Polym Sci, 2003, 88, 146. [14] G. Chang, L. Kiho: Carbohydr Polym, 2002, 48, 125-130. [15] V. Athawale, V. Lele: Synthesis and characterization of graft copolymers of
maize starch and methacrylonitrile. Carbohydr Polym, 2000, 41, 407-416. [16] D. Rutot, P. Degee, R. Narayan, P. Dubois: 2000, 7, 215-225. [17] D. Peters: Carbohydrates for fermentation. 2006, 1, 806–814. [18] A. Hebeish, M. Beliakova, A. Bayazeed: Improved synthesis of poly(MAA)-
starch graft copolymers. Appl Polym Sci, 1998, 68, 1709-1715. [19] J. Gao, J. Yu, W. Wang, L. Chang, R. Tian: Graft copolymerization of starch-AN
initiated by potassium permanganate. J Appl Polym Sci, 1998, 68, 1965–1972. [20] J. Aburto, S. Thiebaud, I. Alric, E. Borredon, D. Bikiaris, J. Prinos, C.
Panayiotou: Properties of octanoated starch and its blends with polyethylene. Carbohdr Polym, 1997, 34, 101-112.
157

[21] S. Thiebaud, J. Aburto, I. Alric, E. Borredon, D. Bikiaris, J. Prinos, C. Panayiotou: Properties of fatty acid esters of starch and their blends with LDPE. 1997, 65, 705-721.
[22] G. F. Fanta, R. Shogren: Modification of starch-poly(methyl acrylate) graft copolymers by steam jet cooking. J Appl Polym Sci, 1997, 65, 1021-1029.
[23] S. Rath, R. Singh: Flocculation characteristics of grafted and ungrafted starch, amylose, and amylopectin. 1997, 66, 1721-1729.
[24] T. Maharana, B. Singh: 2006, 100, 3229. [25] Y. Sugahara, T. Ohta: 2001, 82, 1437-1343. [26] A. De Graaf, A. Karman, L. Janseen: Material Properties and Glass Transition
Temperatures of Different Thermoplastic Starches After Extrusion Processing. Starch/Stärke, 2003, 55, 80-86.
[27] R. Ellis, M. Cochrane, M. Dale, C. Duffus, A. Lynn, I. Morrison, R. Prentice, J. Swanton, S. Tiller: Starch production and industrial use. J Sci Food Agric 1998, 77, 289-311.
[28] N. Follain, C. Joly, P. Dole, C. Bliard: Mechanical properties of starch-based materials. I. short review and complementary experimental analysis,. J Appl Polym Sci, 2005, 97, 1783-1794.
[29] I. Danjaji, R. Nawang, U. Ishiaku, H. Ismail, Z. Ishak: J Appl Polym Sci, 2001, 79, 29-37.
[30] A. De Graaf, P. Jannssen: Properties and manufacturing of a new starch plastic. Polym Eng Sci, 2001, 41, 584-594.
[31] D. Garlotta, W. M. Doane, R. L. Shogren, J. W. Lawton, J. Willett: Mechanical and thermal properties of starch-filled poly(D-, L-, lactic acid)/poly(hydroxyl ester ether) biodedgradable blends. J Appl Polym Sci, 2003, 88, 1775-1786.
[32] W. Liu, Y. Wang, Z. Sun: 2004, 92, 484-. [33] T. Ohkita, S. Lee: 2005, 97, 1107-1114. [34] W. Ban, J. Song, S. Argyropoulos, L. Lucia: 2006, 100, 2542-2548. [35] D. Bielinkski, L. Pysklo, L. Slusorsky, G. Janowska, G. Levandowicz:
Preliminary studies on the surface layer of starch. Macromol Symp, 2003, 194, 233-239.
[36] J. Willett, V. Finkenstadt: Initiator effects in reactive extrusion of starch-polyacrylamide graft copolymers. J Appl PolymSci, 2006, 99, 52-58.
[37] S. Kalambur, S. Rizvi: Biodegradable and functionality superior starch-polyester nanocomposites from reactive exgtrusion. 2005, 96, 1072-1082.
[38] F. Xie, L. Yu, H. Liu, L. Chen: Starch Modification Using Reactive Extrusion. Starch/Stärke, 2006, 58, 131-139.
[39] J. M. Luengo, B. García, A. Sandoval, G. Naharro, E. R. Olivera: Bioplastics from microorganisms. 2003, 6, 251-260.
[40] K. Sudesh, T. Iwata: Sustainability of Biobased and Biodegradable Plastics. 2008, 36, 433-442.
[41] A. Rajan, T. Abraham: Enzymatic modification of cassava starch by bacterial lipase. 2006, 29, 65-71.
[42] R. Jeng, C. Huang, M. Sain, M. Hubbes, A. Rodriguez, A. Saville: Starch-like exopolysaccharides produced by the filamentous fungi ophiostoma ulmi and O. novo-ulmi. 2007, 37, 80-95.
158

[43] C. Huang, R. Jeng, M. Sain, B. Saville, M. Hubbes: Production, characterization, and mechanical properties of starch modified by Ophiostoma spp. Bioresources, 2006, 1, 234-239.
[44] M. Sain, R. Jeng: Disclosure documents, Biocap-NSERC Report. Laboratory of Pathology, Faculty of Forestry, University of Toronto, Canada. 2006, 1.
[45] M. Sain, R. Jeng, M. Hubbes: US Patent Appl. No. 11/764683. 2007. [46] A. Buléon, P. Colonna, V. Planchot, S. Ball: Starch granules: structure and
biosynthesis. Int J Biol Macromol 1998, 23, 85-112. [47] J. Szymonska, F. Krok: Potato starch granule nanostructure studied by high
resolution non-contact AFM. Int. J. Biol. Macromol 2003, 33, 1–7. [48] T. A. Waigh, K. L. Kato, A. M. Donald, M. J. Gidley, C. J. Clarke, C. Riekel:
Side-Chain Liquid-Crystalline Model for Starch. Starch/Stärke, 2000, 52, 450–460.
[49] T. A. Waigh, A. M. Donald, F. Heidelbach, C. Riekel, M. J. Gidley: Analysis of the Native Structure of Starch Granules with Small Angle X-Ray Microfocus Scattering. Biopolymers 1999, 49, 91–105.
[50] M. J. Ridout, A. P. Gunning, M. L. Parker, R. H. Wilson, V. J. Morris: Using AFM to image the internal structure of starch granules. 2002, 50, 123-132.
[51] M. J. Ridout, M. L. Parker, C. L. Hedley, T. Y. Bogracheva, V. J. Morris: Atomic force microscopy of pea starch granules: granule architecture of wild-type parent, r and rb single mutants, and the rrb double mutant. 2003, 338, 2135 - 2147.
[52] F. Krok, J. Szymonska, P. Tomasik, M. Szymonski: Non-contact AFM investigation of influence of freezing process on the surface structure of potato starch granule. Appl Surf Sci, 2000, 157, 382-386.
[53] T. Oostergetel, J. van Bruggen: The crystalline domains in potato starch granules are arranged in a helical fashion. 1993, 21, 7-12.
[54] K. Gotlieb, A. Capelle: Starch derivatization: Fascinating and unique industrial opportunities. Wageningen Academic Publishers The Netherlands 2005158.
[55] R. F. Tester, J. Karkalas, X. Qi: Sarch-composition, fine structure and architecture. 2004, 39, 151-165.
[56] P. M. Baldwin: Starch Granule-Associated Proteins and Polypeptides: A Review. Starch - Stärke 2001, 53, 475-503.
[57] G. D. Haki, S. K. Rakshit: Developments in industrially important thermostable enzymes: a review. Bioresour Technol, 2003, 89, 17–34.
[58] S. O'Brien, Y. Wang: Susceptibility of annealed starches to hydrolysis by a-amylase and glucoamylase. 2008, 72, 597-607.
[59] H. Li, Z. Chi, X. Duan, L. Wang, J. Sheng, L. Wu: Glucoamylase production by the marine yeast Aureobasidium pullulans N13d and hydrolysis of potato starch granules by the enzyme. Process Biochem, 2007, 42, 462-465.
[60] V. Sharma, K. Rausch, M. Tumbleson, V. Singh: Comparison Between Granular Starch Hydrolyzing Enzyme and Conventional Enzymes for Ethanol Production from Maize Starch with Different Amylose:Amylpectin Ratios. 2007, 59, 549-556.
[61] I. Skwortsov, V. Ignatov: Extracellular polysaccharides and polysaccharide-containing biopolymers from Azospirillum species: properties and the possible role in interaction with plant roots,. 1998, 165, 223-229.
159

[62] V. Moriello, L. Lama, A. Poli, C. Gugliandolo, T. Maugeri, A. Gambacorta, B. Nicolaus: Production of exopolysaccharides from a thermophilic microorganism isolated from a marine hot spring in flegrean areas. 2003, 30, 95-101.
[63] M. M. Girard, C. Schaffer-Lequart: Gelation and resistance to shearing of fermented milk: role of exopolysaccharides, International Dairy Journal. 2007, 17, 666-673.
[64] R. De Philippis, M. Vincenzini: Exocellular polysaccharides from cyanobacteria and their possible applications. FEMS Reviews, 1998, 22, 151-175.
[65] L. Harding, V. Marshall, Y. Hernandez, Y. Gu, M. Maqsood, N. Mclay, A. Laws: Structural characterization of a highly branched exopolysaccharide produced by Lactobacillus delbrueckii subsp. bulgaricus NCFB2074. Carbohydr. Res, 2005, 340, 1170-1111.
[66] M. Girard, C. Schaffer-Lequart: Gelation and resistance to shearing of fermented milk: role of exopolysaccharides. Int Dairy J, 2007, 17, 666-673.
[67] Z. Chi, C. Su, W. Lu: A new exopolysaccharide produced by marine Cyanothece sp. 113. Bioresour Technol, 2007, 96, 1329-1332.
[68] C. Lamelas, M. Benedetti, K. Wilkinson, V. Slaveykova: Characterization of H+ and Cd+ binding properties of the bacterial exopolysaccharides. Chemosphere, 2006, 65, 1362-1370.
[69] A. Kumar, K. Mody, B. Jha: Bacterial exopolysaccharides- a perception,. J Basic Microbiol, 2007, 47, 103-117.
[70] J. Luengo, B. Garcia, A. Sandoval, G. Naharro, E. Olivera: Bioplastics from microorganisms. 2004, 6, 251-260.
[71] J. Guezennec: Deep-sea hydrothermal vents: A new source of innovative bacterial exopolysaccharides of biotechnological interest? J Ind Microbiol, 2002, 29, 204-208.
[72] H. Ruijssenaars, F. Stingele, S. Hartmans: Biodegradability of Food-Associated Extracellular Polysaccharides. 2000, 40, 194-199.
[73] B. Nicolaus, V. Moriello, L. Lama, A. Poli, A. Gambacorta: Polysaccharides from extremophilic microorganims. 2003, 34, 159-169.
[74] A. Laws, Y. Gu, V. Marshall: Biosynthesis, characterization, and design of bacterial exopolysaccharides from lactic acid bacteria. Biotechnol Adv, 2001, 19, 597-625.
[75] F. Rosado, S. Germano, E. Carbonero, S. Da Costa, M. Lacomini, C. Kemmelmeier: Biomass and exopolysaccharides producion in submerged cultures of Pleurotus ostreatoroseus Sing. and Pleurotus ostreatus Florida (Jack.:Fr.) Krumer. 2003, 43, 230-237.
[76] L. Selbmann, F. Stingele, M. Petruccioli: Exopolysaccharide production by filamentous fungi: the example of Botryosphaeria rhodina. 2003, 84, 135-145.
[77] E. Lin, S. Sung: Cultivation conditions influence exopolysaccharide production by the edible Basidiomycete Antrodia cinnamomea in submerged culture. Int J Food Microbiol, 2006, 108, 182-187.
[78] K. Przyby, H. Dahm, A. Ciesielska, K. Molinski: Cellulolytic activity and virulence of Ophiostoma ulmi and O. novo-ulmi isolates. 2006, 36, 58-67.
160

[79] T. Binz, G. Canevascini: Xylanases from the Dutch elm disease pathogens Ophiostoma ulmi and Ophiostoma novo-ulmi. Physiol Mol Plant Pathol, 1996, 49, 159-175.
[80] M. Polakivic, J. Bryjak: Modelling of potato starch saccharification by an Aspergilus niger glucoamylase. 2004, 18, 57-63.
[81] L. Huang, B. Jin, P. Lant, J. Zhou: Simultaneous saccharification and fermentation of potato starch wastewater to lactic acid by Rhizopus oryzae and Rhizopus arrhizus. Biochem Eng J, 2005, 23, 265-276.
[82] S. O'Brien, Y. Wang: Susceptibility of annealed starches to hydrolysis by -amylase and glucoamylase. 2007, 72, 597-607.
[83] K. Kasemwong, K. Plyachomkwan, R. Wansuksri, K. Sriroth: Granule Sizes of Canna (Canna edulis) Starches and their Reactivity Toward Hydration. Starch/Starke, 2008, 60, 624-633.
[84] H. S. Kim, C. H. Kerry: Channels within soft wheat starch A- and B-type granules. 2008, 48, 159-172.
[85] H. M. Wilhelm, M. R. Sierakiwski, G. P. Souza, F. Wypych: Starch films reinforced with mineral clay. Carbohydr Polym, 2003, 52, 101-110.
[86] M. Cerna, A. Barros, A. Nunes, S. Rocha, I. Delgadillo, J. Copikova, M. Coimbra: Use of FT-IR spectroscopy as a tool for the analysis of polysaccharide food additives. Carbohydr Polym, 2003, 51, 383-389.
[87] R. Wilson, M. Kalichevsky, S. Ring, P. Belton: A Fourier-transform infrared study of the gelation and retrogradation of waxy-maize starch. Carbohydr Res, 1987, 166, 162-165.
[88] E. Mills, M. Parker, N. Wellner, G. Toole, K. Feeney, P. Shewry: Chemical imaging: the distribution of ions and molecules in developing and mature wheat grain. 2005, 41, 193-201.
[89] J. Pandey, R. Singh: Green nanocomposites form renewable resources: effect of plasticizer on the structure and material properties of clay-filled starch. 2005, 57, 8-15.
[90] M. Lutfor, S. Sidik, W. Yunus, M. Ab-Rhaman, A. Mansor, H. Jelas: Preparation and swelling of polymeric absorbent constaining hydroxamic acid group form polymer grafted starch. 2001, 45, 96-100.
[91] J. Martin, A. Solla, M. Coimbra, L. Gil: Metabolic distiction of Ulmus minor xylem tissues after inoculation with Ophiostoma novo-ulmi. 2005, 66, 2458-2467.
[92] J. Fang, P. Fowler, J. Tomkinson, C. Hill: The preparation and characterization of a series of chemically modified potato starches. Carbohydr Polym, 2002, 47, 245-252.
[93] L. Thygesen, M. Lokkey, E. Micklander, S. Engelsen: Vibrational microscopy of food. Raman vs. FT-IR. Trends in Food Sci Technol, 2003, 14, 50-57.
[94] M. Xiaofei, Y. Jiugao, F. Jin: Urea and formamide as a mixed plasticizer for thermoplastic starch. Polym Int, 2004, 53, 1780-1785.
[95] M. Huang, J. Yu, X. Ma: Studies on the properties of montomorillonite-reiforced thermoplastic starch composites. Polymer 2004, 45, 7017-7023.
[96] J. Cael, J. Koenig, J. Blackwell: J Carbohydr Res, 1973, 29, 123-127.
161

[97] P. M. Fechner, S. Wartewig, A. Kiesow, A. Heilmann, P. Kleinebudde, R. H. H. Neubert: Influence of Water on Molecular and Morphological Structure of Various Starches and Starch Derivatives. Starch/Stärke, 2005, 57, 605–615.
[98] C. G. Mothe, M. G. Machado, M. I. Tavares: Solid state 13C-NMR and study of the subproducts obtained from corn industry. 2002, 84, 1680-1685.
[99] M. Tavares, A. Bathista, E. Silva, P. Costa, N. Filho, J. Nogueira: 13C-NMR study of Dipteryx Alata Vogel Starch. 2004, 92, 2151-2154.
[100] K. Matsuzaki, U. Toshiyuki, A. Tetsuo: NMR Spectroscopy and Stereoregularity of Polymers. 1996 275.
[101] S. Broberg, K. Koch, R. Andersson, L. Kenne: A comparison between MALDI-TOF mass spectrometry and HPAEC-PAD analysis of debranched starch. Carbohydr Polym, 2000, 43, 285-289.
[102] M. Mohr, K. Bornse, H. Widmer: Matrix assisted laser desorption ionization mass spectrometry: improved matrix for oligosaccharides. 1995, 9, 809-814.
[103] C. Corradini, F. Bianchi, D. Matteuzzi, A. Amoretti, M. Rossi, S. Zanoni: High-performance anion-exchange chromatography coupled with pulsed amperometric detection and capillary zone electrophoresis with indirect
ultra violet detection as powerful tools to evaluate prebiotic properties of fructooligosaccharides and inulin. J Chromatogr A, 2004, 1054, 165–173.
[104] K. Koch, R. Andersson, P. Aman: Quantitative analysis of amylopectin unit chains by means of highperformance anion-exchange chromatography with pulsed amperometric detection. J Chromatogr A, 1998, 800, 199–206.
[105] J. Sanderson, R. Daniels, A. Donald, A. Blennow, S. Engelsen: Exploratory SAXS and HPAEC-PAD studies of starches from diverse plant genotypes. 2004, 64, 433-443.
[106] I. Hanashiro, A. J., S. Hizukuri: A periodic distribution of the chain lenght of amylopectins as reveled by high-performance anion-exchange chromatography. Bioresour Technol, 1996, 283, 151-159.
[107] R. Cataldi, I. Thomas: Carbohydrate analysis by high-performance anion-exchange chromatography with pulsed amperometric detection. J Anal Chem, 2000, 368, 739-758.
[108] J. Sanderson, R. Daniels, A. Donald, A. Blennow, S. Engelsen: Exploratory SAXS and HPAEC-PAD studies of starches form diverse plant genotypes. 2006, 64, 433-443.
[109] J. Jane, Y. Chen, L. Lee, A. McPherson, K. Wong, M. Radosavljevic, T. Kasemsuwan: Effects of Amylopectin Branch Chain Length and Amylose Content on the Gelatinization and Pasting Properties of Starch. Cereal Chem, 1999, 76, 629-637.
[110] K. Wong, J. Jane: Quantitative analysis of debranched amylopectin by HPAEC-PAD wiht a postcolumn enzyme reactor. J Liq Chromatogr Relat Technol, 1997, 20, 297-310.
[111] H. Menard: Dynamic mechanical analysis: a practical introduction. 2008, USA, 202p.
[112] Editor, Atlas of stress strain curves. 2002, Ohio: ASM International. 821. [113] F. Xie, L. Yu, L. Chen, L. Li: A new study of starch gelatinization under stress
using dynamic mechanical analysis. Carbohydr Polym, 2008, 72, 229-234.
162

[114] L. Averous, C. Fringant, L. Moro: Starch-Based Biodegradable Materials Suitable for Thermoforming Packaging. Starch/Starke 2001, 53, 368-371.
[115] R. Septo: The Processing of Starch as a Thermoplastic. 2003, 201, 203-212. [116] S. Gaudin, D. Lourdin, D. Le botlan, L. Ilari, P. Colonna: Plasticization and
mobility in starch-sorbitol films. J Cereal Sci, 1999, 29, 273-284. [117] P. Myllarinen, R. Partanen, J. Seppala, P. Forssell: Effect of glycerol on behavior
of amylose and amylopectin films. 2002, 50, 355-361. [118] X. Tang, S. Alavi, T. Herald: Effects of plasticizers on the structure and properties
of starch-clay nanocomposites films. 2008, 74, 552-558. [119] D. Wood, B. Chiou, M. Glenn, D. Hoffmann, T. Yee, S. Iman, W. Orts: Fine
Structure of Starch-Clay Composites as Biopolymers, Microscopy and Microanalysis. Microscopy Micoanal 2008, 14, 1500-1503.
[120] B. S. Chiou, E. Yee, G. M. Glenn, W. J. Orts: Rheology of starch-clay nanocomposites. Carbohydr Polym, 2005, 59, 467-475.
[121] L. Vertuccio, G. Gorrasi, A. Sorrrentino, V. Vittoria: Nano-clay reinforced PCL/Starch blends obtained by high energy ball milling. Carbohydr Polym, 2009, 75, 172-179.
[122] N. Lilichenko, R. Maksimov, J. Zicans, R. Meri, E. Plume: A biodegradable polymer nanocomposite: mechanical and barrier properties. Mech Compos Mat 2008, 44, 45-56.
[123] Q. Zhang, Z. Yu, X. Xie, K. Naito, Y. Kagawa: Preparation and crystalline morphology of biodegradable starch/clay nanocomposites. Polym Degrad Stab, 2007, 48, 7193-7200.
[124] P. Kampeerapappun, D. Aht-ong, D. Pentrakoon: Preparation of cassava starch/montmorillonite composite film. Carbohdr Polym, 2007, 67, 155-163.
[125] J. Chen, J. Evans: Thermoplastic starch-clay nanocomposites and their characteristics. Carbohydr Polym, 2005, 61, 455-463.
[126] K. Dean, D. L. Yu, Y. Wu: Preparation and characterization of melt-extruded thermoplastic starch/clay nanocomposites. Compos Sci. Technol, 2007, 67, 413-421.
[127] K. Dean, M. Do, E. Petinakis, L. Yu: Key interactions in biodegradable thermoplastic starch/poly(vinyl) alcohol/montmorillonite micro- and nanocomposites. Compos Technol, 2008, 68, 1453-1462.
[128] D. Chaudhary: Understanding amylose crystallinity in starch-clay nanocomposites. J Polym Sci Part B: Polym Phys, 2008, 46, 979-987.
[129] J. Yu, X. Wang, P. Wu: Effect of glycerol on water vapor sorption and mechanical properties of starch/clay composite Films. Starch/Stärke 2008, 60, 257-262.
[130] N. Wang, X. Zhang, N. Han, S. Bai: Effect of citric acid and processing on the performance of thermoplastic starch/montmorillonite nanocomposites. Carbohydr Polym, 2009, 76, 68-73.
[131] E. Rudnik, G. Matuschek, N. Milanov, A. Kettrup: Thermal stability and degradation of starch derivatives. 2006, 85, 267-270.
[132] P. Aggarwal, D. Dollimore: A comparative study of the degradation of different starches using thermal analysis. Talanta 1996, 43, 1527-1530.
163

[133] D. Schlemmer, E. De-Oliveira, M. Sales: Polyestyrene/thermoplastic starch blends with different plasticizers. 2007, 87, 635-638..
[134] J. Bhatty, D. Dollimore, J. Dunn, W. Irwin, M. Ish-Shalom, J. Jordan, M. Reading, J. Sharp, J. Sthal: Treatease on analytical chemistry, Part I, Thermal Methods. 1993, 13, 406.
[135] L. Yu, L. Christie: Measurement of starch thermal transitions using differential scanning calorimetry. Carbohdr Polym. 2001, 46, 179-183.
[136] V. Derycke, G. Vandeputte, R. Vermeylen, W. De Man, B. Goderis, M. Koch, J. Delcour: Starch gelatinization and amylose-lipid interactions during rice parboiling investigated by temperature resolved wide angle X-ray scattering and differential scanning calorimetry. J Cereal Sci, 2005, 42, 334-337.
[137] L. Wasserman, M. Signorelli, A. Schiraldi, V. Yuryev, G. Boggini, S. Bertini: Preparation of wheat resistant starch. J Therm Anal Calorim, 2007, 87, 153-157.
[138] S. Puncha-arnon, W. Pathipanawat, C. Puttanlek, V. Rungsardthong, D. Uttapap: Effects of relative granule size and gelatinization temperature on paste and gel properties of starch blends. 2008, 41, 552-557.
[139] T. Tran, K. Piyachomkwan, K. Sriroth: Gelatinization and Thermal Properties of Modified Cassava Starches. Starch/Stärke, 2007, 59, 46–55.
[140] A. Hagenimana, P. Pu, X. Ding: 2005, 38, 257. [141] S. Berland, P. Relkin, B. Launay: 2003, 71, 311-316. [142] L. Elfstrand, A. Eliasson, M. Jonsson, M. Reslow, M. Wahlgren: From Starch to
Starch Microspheres: Factors Controlling the Microspheres Quality. Starch/Stärke, 2006, 58, 381-386.
[143] K. Poutanen, P. Forssell: Modification of Starch Properties wiht Plasticizers. 1996, 4, 128-132.
[144] A. Sandoval, J. Barreiro: Off-line rheometry of corn starch: Effects of temperature, moisture content and shear rate. 2007, 40, 43-48.
[145] O. Martin, L. Everous, G. Valle: In-line determination of plasticized wheat starch viscoelastic behavior impact of processing. 2003, 53, 169-182.
[146] W. Aichholzer, H. Fritz: Rheological Characterization of Thermoplastic Starch Materials. Starch/Stärke 1998, 50, 77-83.
[147] S. Kalambur, S. Rizvi: Rheological Behavior of Starch-Polycrapolactone (PCL) Nanocomposite Melts Synthesized by Reactive Extrusion. Polym Eng Sci, 2006650-658.
[148] D. Lourdin, H. Bizot, P. Colonna: "Antiplasticization" in starch-glycerol films? J Appl Polym Sci 1998, 63, 1047-1053.
[149] J. W. Lawton: Effect of starch type on the properties of starch containing films. Carbohydr Polym, 1996, 29, 203-208.
[150] A. Dias, M. Suzana, B. Adelaide, M. Grossmann: Effect of glycerol and amylose enrichment on cassava starch film properties. J Food Eng, 2007, 78, 941–946.
[151] L. Godbillot, P. Dole, C. Joly, B. Roge, M. Mathlouthi: Analysis of water binding in starch plasticized films. 2006, 96, 380–386.
[152] N. Laohakunjit, A. Noomhorm: Effect of Plasticizers on Mechanical and Barrier Properties of Rice Starch Film. Starch/Stärke, 2004, 56, 348–356.
[153] O. Lopez, M. Garcia, N. Zaritzky: Film forming capacity of chemically modified corn starches. 2008, 73, 573–581.
164

165
[154] D. Thirathumthavorn, S. Charoenrein: Aging Effects on Sorbitol- and Non-Crystallizing Sorbitol-Plasticized Tapioca Starch Films. 2007, 59, 493- 497.
[155] B. Montaño, P. Torres, B. Ramírez, M. Plascencia, F. Brown: Physical and Mechanical Properties of Durum Wheat (<B><I>Triticum durum</I></B>) Starch Films Prepared with A- and B-type Granules. Starch - Stärke 2008, 60, 559-567.
[156] M. Thunwal, V. Kuthanova, A. Boldizar, M. Rigdahl: Film blowing of thermoplastic starch. 2008, 71, 583– 590.
[157] M. A. Bertuzzi, M. Armada, J. C. Gottifredi: Physicochemical characterization of starch based films. J Food Eng, 2007, 82, 17–25.
[158] A. Jansson, F. Thuvander: Influence of thickness on the mechanical properties for starch films. Carbohydr Polym, 2004, 56, 499–503.
[159] H. Pushpadass, D. Marx, H. Mildford: Effects of Extrusion Temperature and Plasticizers on the Physical and Functional Properties of Starch Films. Starch - Stärke 2008, 60, 527-538.