Embed Size (px)
Citation preview
ISBN: 978-0-415-66958-0
9 780415 669580
90000
Environmental Engineering
As the world’s population has increased, sources of clean water have decreased, shifting the focus toward pollution reduction and control. Disposal of wastes and wastewater without treatment is no longer an option. Fundamentals of Wastewater Treatment and Engineering introduces readers to the essential concepts of wastewater treatment, as well as the engineering design of unit processes for the sustainable treatment of municipal wastewater.
Filling the need for a textbook focused on wastewater, it first covers history, current practices, emerging concerns, and pertinent regulations and then examines the basic principles of reaction kinetics, reactor design, and environmental microbiology, along with natural purification processes. The text also details the design of unit processes for primary, secondary, and advanced treatment as well as solids processing and removal. Using detailed calculations, it discusses energy production from wastewater.
Comprehensive and accessible, the book addresses each design concept with the help of an underlying theory, followed by a mathematical model or formulation. Worked-out problems demonstrate how the mathematical formulations are applied in design. Throughout, the text incorporates recent advances in treatment technologies.
Based on a course taught by the author for the past 18 years, the book is designed for undergraduate and graduate students who have some knowledge of environmental chemistry and fluid mechanics. Readers will get a strong grounding in the principles and learn how to design the unit processes used in municipal wastewater treatment operations. Profes-sionals in the wastewater industry will also find this a handy reference.
Dr. Rumana Riffat is a professor in the Civil and Environmental Engineer-ing Department at George Washington University in Washington, D.C. Her research interests are in wastewater treatment, specifically anaerobic treatment of wastewater and biosolids, as well as nutrient removal.
FUN
DA
MEN
TALS O
F WA
STEWATER
TREATM
ENT A
ND
ENG
INEER
ING
RIFFAT FUNDAMENTALS OF
WASTEWATERTREATMENT ANDENGINEERING
RUMANA RIFFAT
w w w . s p o n p r e s s . c o m
Y117901
A S P O N P R E S S B O O K
Y117901 cvr mech.indd 1 7/24/12 10:20 AM

FUNDAMENTALS OF
WASTEWATERTREATMENT AND
ENGINEERING

A SPON PRESS BOOK
FUNDAMENTALS OF
WASTEWATERTREATMENT AND
ENGINEERING
RUMANA RIFFAT
Co-published by IWA Publishing
Alliance House, 12 Caxton Street, London SW1H 0QS, UK
Tel. +44 (0)20 7654 5500, Fax +44 (0)20 7654 5555
www.iwapublishing.com
ISBN13 9781780401317
CRC PressTaylor & Francis Group6000 Broken Sound Parkway NW, Suite 300Boca Raton, FL 33487-2742
© 2013 by Taylor & Francis Group, LLCCRC Press is an imprint of Taylor & Francis Group, an Informa business
No claim to original U.S. Government worksVersion Date: 20120727
International Standard Book Number-13: 978-0-203-81571-7 (eBook - PDF)
This book contains information obtained from authentic and highly regarded sources. Reasonable efforts have been made to publish reliable data and information, but the author and publisher cannot assume responsibility for the validity of all materials or the consequences of their use. The authors and publishers have attempted to trace the copyright holders of all material reproduced in this publication and apologize to copyright holders if permission to publish in this form has not been obtained. If any copyright material has not been acknowledged please write and let us know so we may rectify in any future reprint.
Except as permitted under U.S. Copyright Law, no part of this book may be reprinted, reproduced, transmitted, or utilized in any form by any electronic, mechanical, or other means, now known or hereafter invented, including photocopying, micro-filming, and recording, or in any information storage or retrieval system, without written permission from the publishers.
For permission to photocopy or use material electronically from this work, please access www.copyright.com (http://www.copyright.com/) or contact the Copyright Clearance Center, Inc. (CCC), 222 Rosewood Drive, Danvers, MA 01923, 978-750-8400. CCC is a not-for-profit organization that provides licenses and registration for a variety of users. For organizations that have been granted a photocopy license by the CCC, a separate system of payment has been arranged.
Trademark Notice: Product or corporate names may be trademarks or registered trademarks, and are used only for identi-fication and explanation without intent to infringe.
Visit the Taylor & Francis Web site athttp://www.taylorandfrancis.com
and the CRC Press Web site athttp://www.crcpress.com

v
This book is dedicated to my husband, Wahid Sajjad, who has been my best friend forever;to my children, Roshan and Mehran, who I hope will use this book someday;and to my parents, Salma and Muhammad Chishty, who have taught me the two most important things in life—compassion and humility.

vii
Contents
Preface xvAcknowledgments xviiAbout the author xixList of symbols xxiList of abbreviations xxiii
1 Sustainablewastewatertreatmentandengineering 1
1.1 Introduction and history 11.2 Current practice 31.3 Emerging issues 41.4 Future directions 41.5 Regulatory requirements 7
1.5.1 U.S. regulations 71.5.2 European Union regulations 91.5.3 United Kingdom regulations 10
References 11
2 Reactionkineticsandchemicalreactors 13
2.1 Reaction kinetics 132.2 How to find the order of a reaction 142.3 Zero order reaction 162.4 First order reaction 182.5 Second order reaction 192.6 Reactors 19
2.6.1 Conversion of a reactant 202.6.2 Detention time in reactor 20
2.7 Batch reactor 212.7.1 Design equation 21
2.8 Plug flow reactor (PFR) 232.8.1 Design equation 25
viii Contents
2.9 Continuous-flow stirred tank reactor 262.9.1 Design equation 28
2.10 Reactors in series 292.11 Semibatch or semiflow reactors 32Problems 32References 34
3 Wastewatermicrobiology 353.1 Introduction 353.2 Bacteria 36
3.2.1 Cell composition and structure 373.2.2 Bacterial growth curve 383.2.3 Classification by carbon and energy requirement 403.2.4 Classification by oxygen requirement 413.2.5 Classification by temperature 413.2.6 Bacteria of significance 41
3.3 Archaea 433.4 Protozoa 433.5 Algae 453.6 Fungi 463.7 Virus 46Problems 49References 49
4 Naturalpurificationprocesses 514.1 Impurities in water 514.2 Dilution 514.3 Sedimentation 534.4 Microbial degradation 534.5 Measurement of organic matter 53
4.5.1 Biochemical oxygen demand (BOD) 544.5.1.1 BOD kinetics 544.5.1.2 Laboratory measurement 584.5.1.3 Unseeded BOD test 584.5.1.4 Seeded BOD test 604.5.1.5 Determination of k and Lo 614.5.1.6 Thomas’s graphical method 61
4.5.2 Theoretical oxygen demand 624.6 Dissolved oxygen balance 63
4.6.1 Dissolved oxygen sag curve 64
Contents ix
4.6.1.1 Critical points 664.6.1.2 Limitations of the oxygen
sag curve model 70Problems 70References 73
5 Wastewatertreatmentfundamentals 75
5.1 Introduction 755.2 Sources of wastewater 765.3 Wastewater constituents 765.4 Wastewater treatment methods 78
5.4.1 Physical treatment 785.4.2 Chemical treatment 785.4.3 Biological treatment 78
5.5 Levels of wastewater treatment 795.5.1 Preliminary treatment 795.5.2 Primary treatment 795.5.3 Enhanced primary treatment 795.5.4 Conventional secondary treatment 795.5.5 Secondary treatment with nutrient removal 805.5.6 Tertiary treatment 805.5.7 Advanced treatment 80
5.6 Residuals and biosolids management 805.7 Flow diagrams of treatment options 815.8 Types of biological treatment processes 83Problems 84References 84
6 Preliminarytreatment 85
6.1 Introduction 856.2 Screens 85
6.2.1 Trash racks 856.2.2 Coarse screens or bar screens 86
6.2.2.1 Design of coarse screens 876.2.3 Fine screens 90
6.2.3.1 Design of fine screens 906.2.4 Microscreens 92
6.3 Shredder/grinder 92
x Contents
6.4 Grit chamber 93Problems 97References 98
7 Primarytreatment 99
7.1 Introduction 997.2 Types of settling/sedimentation 997.3 Type I sedimentation 100
7.3.1 Theory of discrete particle settling 1007.3.1.1 Stokes equation 102
7.3.2 Design of ideal sedimentation tank 1047.4 Type II sedimentation 1077.5 Primary sedimentation 109
7.5.1 Rectangular sedimentation tank 1107.5.2 Circular sedimentation tank 112
7.6 Chemically enhanced primary treatment 116Problems 116References 118
8 Secondarytreatment:Suspendedgrowthprocesses 119
8.1 Introduction 1198.2 Microbial growth kinetics 120
8.2.1 Biomass yield 1208.2.2 Logarithmic growth phase 1228.2.3 Monod model 1228.2.4 Biomass growth and substrate utilization 1238.2.5 Other rate expressions for rsu 1248.2.6 Endogenous metabolism 1248.2.7 Net rate of growth 1258.2.8 Rate of oxygen uptake 1258.2.9 Effect of temperature 126
8.3 Activated sludge process (for BOD removal) 1268.3.1 Design and operational parameters 1278.3.2 Factors affecting microbial growth 1318.3.3 Stoichiometry of aerobic oxidation 132
8.4 Modeling suspended growth processes 1328.4.1 CSTR without recycle 1328.4.2 Activated sludge reactor (CSTR with recycle) 135
8.4.2.1 Other useful relationships 138
Contents xi
8.4.3 Activated sludge reactor (plug flow reactor with recycle) 139
8.4.4 Limitations of the models 1418.4.5 Aeration requirements 145
8.4.5.1 Types of aerators 1478.5 Types of suspended growth processes 150
8.5.1 Conventional activated sludge 1508.5.2 Step aeration or step feed process 1508.5.3 Tapered aeration process 1508.5.4 Contact stabilization process 1518.5.5 Staged activated sludge process 1528.5.6 Extended aeration process 1528.5.7 Oxidation ditch 1538.5.8 Sequencing batch reactor (SBR) 1538.5.9 Membrane biological reactor (MBR) 154
8.6 Stabilization ponds and lagoons 1558.6.1 Process microbiology 1558.6.2 Design of pond or lagoon system 1578.6.3 Design practice 158
Problems 161References 163
9 Secondarytreatment:Attachedgrowthandcombinedprocesses 165
9.1 Introduction 1659.2 System microbiology and biofilms 1669.3 Important media characteristics 1679.4 Loading rates 1689.5 Stone media trickling filter 170
9.5.1 Design equations for stone media 1719.6 Biotower 175
9.6.1 Design equations for plastic media 1759.7 Rotating biological contactor 1799.8 Hybrid processes 181
9.8.1 Moving bed biofilm reactor (MBBR) 1819.8.2 Integrated fixed-film activated sludge (IFAS) 1829.8.3 Fluidized bed bioreactor (FBBR) 183
9.9 Combined processes 184Problems 184References 187
xii Contents
10 SecondaryClarification 189
10.1 Introduction 18910.2 Secondary clarifier for attached growth process 18910.3 Secondary clarifier for suspended growth process 191
10.3.1 Settling column test 19210.3.2 Solids flux analysis 194
10.3.2.1 Theory 19510.3.2.2 Determination of area
required for thickening 19710.3.3 Secondary clarifier design 199
Problems 206References 207
11 Anaerobicwastewatertreatment 209
11.1 Introduction 20911.2 Process chemistry and microbiology 211
11.2.1 Syntrophic relationships 21311.3 Methanogenic bacteria 21411.4 Sulfate-reducing bacteria 21611.5 Environmental requirements and toxicity 21611.6 Methane gas production 217
11.6.1 Stoichiometry 21711.6.2 Biochemical methane potential assay 22011.6.3 Anaerobic toxicity assay 221
11.7 Anaerobic growth kinetics 22111.8 Anaerobic suspended growth processes 222
11.8.1 Anaerobic contact process 22211.8.2 Upflow anaerobic sludge blanket process 224
11.8.2.1 Design equations 22511.8.3 Expanded granular sludge bed 22611.8.4 Anaerobic sequencing batch reactor 22811.8.5 Anaerobic migrating blanket reactor 231
11.9 Anaerobic attached growth processes 23111.9.1 Anaerobic filter 23111.9.2 Anaerobic expanded bed reactor 233
11.10 Hybrid processes 23311.10.1 Anaerobic fluidized bed reactor 23311.10.2 Anaerobic membrane bioreactor 234
Problems 235References 236
Contents xiii
12 Solidsprocessinganddisposal 239
12.1 Introduction 23912.2 Characteristics of municipal sludge 24012.3 Sludge quantification 24012.4 Sludge thickening 246
12.4.1 Gravity thickener 24612.4.2 Dissolved air flotation 24912.4.3 Centrifugation 251
12.5 Sludge stabilization 25112.5.1 Alkaline stabilization 252
12.5.1.1 Chemical reactions 25212.5.1.2 Lime pretreatment 25312.5.1.3 Lime posttreatment 253
12.5.2 Anaerobic digestion 25312.5.2.1 Single-stage mesophilic digestion 25512.5.2.2 Two-stage mesophilic digestion 25912.5.2.3 Thermophilic anaerobic digestion 26612.5.2.4 Temperature-phased anaerobic
digestion (TPAD) 26712.5.2.5 Acid-gas phased digestion 26812.5.2.6 Enhanced enzymic hydrolysisTM 26812.5.2.7 CambiTM process 269
12.5.3 Aerobic digestion 27012.5.3.1 Autothermal thermophilic
aerobic digestion 27112.5.3.2 Dual digestion 271
12.5.4 Composting 27312.6 Conditioning of biosolids 27412.7 Biosolids dewatering 275
12.7.1 Centrifugation 27512.7.1.1 High-solids centrifuge 275
12.7.2 Belt-filter press 27612.7.3 Drying beds 276
12.8 Disposal of biosolids 27712.8.1 Incineration 27712.8.2 Land disposal methods 277
12.9 Biosolids disposal regulations in the United States 27812.9.1 Class A biosolids 279
12.9.1.1 Processes to further reduce pathogens 28012.9.2 Class B biosolids 280
xiv Contents
12.9.2.1 Processes to significantly reduce pathogens 281
Problems 281References 283
13 Advancedtreatmentprocesses 287
13.1 Introduction 28713.2 Nitrogen removal 287
13.2.1 Biological nitrogen removal 28813.2.1.1 Nitrification–denitrification 28813.2.1.2 Nitritation–denitritation 30113.2.1.3 Deammonification 302
13.2.2 Physicochemical process for nitrogen removal 30413.2.2.1 Air stripping 304
13.3 Phosphorus removal 30413.3.1 Chemical precipitation 30513.3.2 Biological phosphorus removal 306
13.3.2.1 Selected processes for BPR 30713.3.2.2 Phoredox 30713.3.2.3 A2OTM process 30713.3.2.4 Modified BardenphoTM (five stage) 30713.3.2.5 UCT process 307
13.4 Solids removal 30913.4.1 Granular media filtration 30913.4.2 Activated carbon adsorption 31113.4.3 Membrane filtration 312
13.4.3.1 Fundamental equations 31313.4.3.2 Membrane fouling 31513.4.3.3 Membrane configurations 315
13.4.4 Process flow diagrams 316Problems 316References 318
Appendix 323
xv
Preface
Thisbookisdesignedforacourseonwastewatertreatmentandengineer-ingforseniorlevelorearlygraduatelevelstudents.Asthenamesuggests,the book covers the fundamental concepts of wastewater treatment fol-lowedbyengineeringdesignofunitprocessesfortreatmentofmunicipalwastewater.Thestudentsshouldhavebackgroundknowledgeofenviron-mentalchemistryandfluidmechanics.Oneimportantcharacteristicofthisbookisthateachdesignconceptisexplainedwiththehelpofanunderlyingfundamental theory, followed by a mathematical model or formulation.Problems are presented and solved to demonstrate the use of the math-ematicalformulationsandapplythemindesign.
Chapter1startswithahistoryofwastewatertreatment,followedbycur-rentpractices,emergingconcerns,futuredirections,andpertinentregula-tionsthathaveshapedtheobjectivesanddirectionsofthisimportantareaofengineeringandresearch.Chapters2and3describe the fundamentalconceptsofreactionkinetics,reactordesign,andwastewatermicrobiology.Biochemicaloxygendemand(BOD) ispresented indetail,as it isoneofthemostimportantmeasurementsforwastewatercharacteristics.Chapter4 introducesnaturalpurificationprocessesandthedissolvedoxygensagcurve.Theconceptofsimplemassbalancesisintroducedinthischapter.Chapters5through10describeindetailtheunitprocessesinprimaryandsecondarytreatment.Massbalanceisusedtodevelopdesignequationsforbiologicaltreatmentprocesses.Aseparatechapter,Chapter11,isprovidedforanaerobictreatment,whichisbecomingmoreandmoreimportantduetotheenergyproductionpotentialfrommethanegasgeneration.Chapter12describessolidsprocessinganddisposal,togetherwithpertinentregula-tions.Anumberofproblemsandtheirsolutionsaregiventodemonstratecalculationofmassandvolumeofsludge,performsolidsbalance,andcal-culatetheefficiency.Thefinalchapter,Chapter13,describesadvancedandtertiary treatmentprocesses.Removalofnutrients, suchasnitrogenandphosphorus,ispresentedindetail,followedbyprocessesforsolidsremoval.Recentadvancesinnitrogenandphosphorusremovalareprovided.Ihave
xvi Preface
incorporated recent research advances in various sections of the book,whereverapplicable.
ThelayoutofthebookissimilartothemannerinwhichIhavetaughtthiscourseatGeorgeWashingtonUniversity(GWU)forthelast18years.AtGWU, I teach this course asEnvironmentalEngineering II,which istakenbyseniorlevelstudentsintheCivilandEnvironmentalEngineeringDepartment. The material is covered in one semester consisting of 14weeks.Attheendofthecourse,thestudentshouldhaveanunderstandingofthefundamentalconceptsofwastewatertreatmentandbeabletodesigntheunitprocessesfortreatmentofmunicipalwastewater.
xvii
Acknowledgments
First,IwouldliketoexpressmysincerethankstomydoctoralstudentTaqsimHusnain.Hehashelpedwiththisbook incountlessways.Hehas diligently and beautifully prepared all the diagrams and illustra-tionsforthisbook.Iamdeeplyindebtedtohimforallhishelpandforhis assistance in reviewing the manuscript and making corrections. Iwould also like to thank my former doctoral students Sebnem Aynurand Kannitha Krongthamchat for their contributions to Chapters 11and12.
IwouldliketothankmydearfriendFerhatZerinforherhelpindesign-ingthebookcover.Finally,Iwouldliketothankmyfamilyforalltheirpatienceandsupportduringthislongoneyear,whichmadeitpossibleformetowritethisbook.

xix
About the author
Dr.RumanaRiffatisprofessoroftheCivilandEnvironmentalEngineeringDepartment at George Washington University in Washington, D.C. Sheobtained her bachelor’s degree in civil engineering from BangladeshUniversityofEngineeringandTechnologyinDhaka,Bangladesh,andhergraduatedegrees incivilandenvironmentalengineeringfromIowaStateUniversityinAmes,Iowa.Shehasbeeninvolvedinteachingandresearchforthelast18years.
Dr. Riffat’s research interests are in wastewater treatment, specifi-callyanaerobictreatmentofwastewaterandbiosolids,aswellasnutrientremoval.Sheandherresearchgrouphaveconductedextensiveresearchonprocessestofurtherreducepathogens,suchasdualdigestion,temperature-phaseddigestion,andvariouspretreatmentoptions.Hernutrientremovalresearchhasfocusedondeterminationofkineticsandevaluationofvariousexternalcarbonsourcesfordenitrification.Dr.RiffatiscurrentlyinvolvedinanumberofresearchprojectswiththeDistrictofColumbiaWaterandSewerAuthorityattheBluePlainsAdvancedWastewaterTreatmentPlant,amongothers.
Dr.RiffatreceivedtheDistinguishedTeacherAwardfromtheSchoolofEngineeringandAppliedScienceofGeorgeWashingtonUniversityin2011.She received theGeorgeBradleyGascoigneWastewaterTreatmentPlantOperational Improvement Medal of the Water Environment Federation(WEF) in 2010. She is a member of several professional organizations,includingWEFandtheAmericanSocietyofCivilEngineers.Sheisaregis-teredprofessionalengineeroftheDistrictofColumbia.

xxi
List of symbols
α oxygentransfercorrectionfactorβ salinity–surfacetensioncorrectionfactorC concentrationCd dragcoefficientD dissolvedoxygenconcentrationdp diameterofparticleF foulingfactorFg forceduetogravityFb forceduetobuoyancyFD dragforceΦ shapefactorofparticleg accelerationduetogravityKs halfsaturationcoefficientk1 BODrateconstantk2 re-aerationrateconstantkd endogenousdecaycoefficientkt reactionratecoefficientLt oxygenequivalentoforganicmatterremainingattimetMo massofoxygenµ specificgrowthrateofbiomassµmax maximumspecificgrowthrateofbiomassµw dynamicviscosityofwaterρp densityofparticleρw densityofwaterPx biomasswastedQ flowrateR recycleratioRe Reynoldsnumberrd rateofdecayrg growthrateofbiomassrmax maximumbiomassproductionratero rateofoxygenuptake

xxii List of symbols
rsu rateofsubstrateutilizationS substrateconcentrationSt substrateconcentrationattimett timeT temperatureθ hydraulicretentiontimeθc solidsretentiontimeV volumeofreactorVL volumetricloadingratevt terminalsettlingvelocityX biomassconcentrationY biomassyieldcoefficient
xxiii
List of abbreviations
AEBR anaerobicexpandedbedreactorAMBR anaerobicmigratingblanketreactorAOTR actualoxygentransferrateAPD acidphasedigestionAS activatedsludgeASBR anaerobicsequencingbatchreactorATA anaerobictoxicityassayATAD autothermalthermophilicaerobicdigestionAWTP advancedwastewatertreatmentplantbCOD biodegradablechemicaloxygendemandBOD biochemicaloxygendemandBOD5 5dbiochemicaloxygendemandBMP biochemicalmethanepotentialBNR biologicalnutrientremovalBPR biologicalphosphorusremovalbsCOD biodegradablesolubleCODCEPT chemicallyenhancedprimarytreatmentCOD chemicaloxygendemandCSTR continuous-flowstirredtankreactorCWA CleanWaterActDAF dissolvedairflotationDD dualdigestionDNA deoxyribonucleicacidDO dissolvedoxygenEC EuropeanCommissionE. coli Escherichia coliEDC endocrinedisruptingcompoundEEH enhancedenzymichydrolysisEGSB expandedgranularsludgebedEPA EnvironmentalProtectionAgencyEU EuropeanUnionFBBR fluidizedbedbio-reactor
xxiv List of abbreviations
FC fecalcoliformFWPCA FederalWaterPollutionControlActGAC granularactivatedcarbonHRT hydraulicretentiontimeIFAS integratedfixed-filmactivatedsludgeMAD mesophilicanaerobicdigestionMBBR movingbedbiofilmreactorMBR membranebiologicalreactorMF microfiltrationMGD milliongallonsperdayMLE modifiedLutzack–EttingerMLSS mixedliquorsuspendedsolidsMLVSS mixedliquorvolatilesuspendedsolidsMPN mostprobablenumberN nitrogenNH3 ammoniaNF nanofiltrationNPDES NationalPollutantDischargeEliminationSystemNOD nitrogenousoxygendemandOLR organicloadingrateOUR oxygenutilizationratePAC powderedactivatedcarbonPAO phosphorus-accumulatingorganismsPES polyethersulfonePFR plugflowreactorPFRP processestofurtherreducepathogensPHB poly-hydroxy-butyratePOTW publiclyownedtreatmentworksPS polysulfonePSRP processestosignificantlyreducepathogensPVC polyvinylchloridePVDF polyvinylidenedifluorideRAS returnactivatedsludgeRBC rotatingbiologicalcontactorRNA ribonucleicacidRO reverseosmosisSBR sequencingbatchreactorsCOD solublechemicaloxygendemandSDNR specificdenitrificationrateSES sandequivalentsizeSHARON singlereactorsystemforhighammoniumremovalovernitriteSOC syntheticorganiccompoundSOR surfaceoverflowratesSOTR oxygentransferrateatstandardtemperatureandpressure
List of abbreviations xxv
SRT solidsretentiontimeSTP standardtemperatureandpressureTC totalcoliformTF tricklingfilterThOD theoreticaloxygendemandTKN totalKjeldahlnitrogenTMDL totalmaximumdailyloadTOC totalorganiccarbonTPAD temperature-phasedanaerobicdigestionTS totalsolidsTSS totalsuspendedsolidsUASB upflowanaerobicsludgeblanketUF ultrafiltrationUK UnitedKingdomUV ultravioletVFA volatilefattyacidVS volatilesolidsVSS volatilesuspendedsolidsWAS waste-activatedsludge

1
Chapter 1
Sustainable wastewater treatment and engineering
1.1 INTRODUCTION AND HISTORY
Thescienceandengineeringofwastewatertreatmenthasevolvedsignifi-cantlyoverthelastcentury.Asthepopulationoftheworldhasincreased,our sources of clean water have decreased. This has shifted our focustowardpollutionreductionandcontrol.Disposalofwastesandwastewaterwithout treatment in landsandwaterbodies isno longeranoption.Anincreasingbodyof scientificknowledge relatingwaterbornemicroorgan-ismsandconstituentstothehealthofthepopulationandtheenvironmenthasspurredthedevelopmentofnewengineeredtechnologiesfortreatmentofwastewaterandpotentialreuse.
Thetermwastewater includesliquidwastesandwastestransportedinwaterfromhouseholds,commercialestablishments,andindustries,aswellasstormwaterandothersurfacerunoff.Wastewatermaycontainhighcon-centrationsoforganic and inorganicpollutants, pathogenicmicroorgan-isms,aswellas toxicchemicals. If thewastewater isdischargedwithouttreatmenttoastreamorriver,itwillresultinseverepollutionoftheaquaticenvironment. The decline in water quality will render the stream waterunusableforfuturedrinkingwaterpurposes.Sustainable wastewater engi-neering involves application of the principles of science and engineeringforthetreatmentofwastewatertoremovepollutantsorreducethemtoanacceptablelevelpriortodischargetoawaterbodyorotherenvironment,withoutcompromisingtheself-purificationcapacityofthatenvironment.Thetreatmentanddisposalofthegeneratedsolidsandotherby-productsisanintegralpartofthetotalprocess.
If we look back in time, wastewater engineering has progressed fromcollectionandopendumping,tocollectionanddisposalwithouttreatment,tocollectionandtreatmentbeforedisposal,allthewaytocollectionandtreatmentpriortoreuse.EvidenceofwastecollectioninthestreetsandthenuseofwatertowashthewastethroughopensewershasbeenfoundintheancientRomanempire.Intheearly1800s,theconstructionofsewerswasstartedinLondon.In1843,thefirstsewersystem,inHamburg,Germany,
2 Fundamentals of wastewater treatment and engineering
wasofficiallydesignedbyaBritishengineer,Lindley(Anon,2011).Insev-enteenth century Colonial America, household wastewater managementconsistedofaprivy(toilet)withanoutletconstructedatgroundlevelthatdischargedoutsidetoacesspoolorasewer.Withlowpopulationdensities,priviesandcesspoolsconstructedinthiswaydidnotcausemanyproblems(Duffy,1968).Butasthepopulationincreased,theneedforanengineeredsystem forwastewatermanagement in large citiesbecamemore evident.Scientists and public health officials started to understand the relation-shipbetweendiseaseoutbreaksandcontaminationofdrinkingwaterfromwastewater.Nuisancecausedbyodors,outbreakofdiseases,e.g.cholera,andotherpublichealthconcernspromptedthedesignofacomprehensivesewersysteminChicagointhe1850s.Atthattime,thesewersystemwasusedtotransporttheuntreatedwastewateroutsideoftheresidentialcom-munity toa streamor river.Dilutionof thewastewaterwith the streamwater was the primary means of pollutant reduction. These were calledwater-carriage sewer systems.
Publichealthconcerninthe1850salsoresultedintheplanninganddevel-opmentof awater-carriage sewer system for the city ofLondon.A chol-eraepidemicstruckLondonin1848andagainin1854,causingmorethan25,000 deaths (Burian et al., 2000). Dr. John Snow was the first doctoratthattimetoestablishaconnectionbetweenthecholeraoutbreakandacontaminatedwatersupplyattheBroadStreetpublicwell.Inaddition,heshowedstatisticallythatcholeravictimshaddrawntheirdrinkingwaterfromasewage-contaminatedpartoftheriverThames,whilethosewhoremainedhealthydrewwaterfromanuncontaminatedpartoftheriver.Thesefind-ings,togetherwiththediscoveriesbyPasteurandKoch,promptedtheBritishParliamenttopassanactin1855toimproveLondon’swastemanagementsystem.Thisledtothedevelopmentofacomprehensivewater-carriagesewersystemforLondon,designedbyJosephBazalgette(HeyandWaggy,1979).
Towardthebeginningofthetwentiethcentury,sewagetreatmentplantsmainlyusedsettlingtanks(primarytreatment)toremovesuspendedpar-ticles fromthewastewaterbeforedischargetostreamsandrivers. Intheearly1900s,aboutonemillionpeopleintheUnitedStateswereservedby60suchtreatmentplants.Intheearly1900s,thefirsttricklingfilterwasconstructedinMadison,Wisconsin,toprovidebiological(secondary)treat-menttowastewater.TheImhofftankwasdevelopedbyGermanengineerKarlImhoffin1906forsolidsseparationandfurthertreatment.Thefirstactivated sludgeprocesswasconstructed inSanMarcos,Texas, in1916(Burianetal.,2000).Advancesinsludgedigestionandgasproductionwerealsobeingaccomplishedbyresearchersandutilities.Fromthemid-1900stothepresenttime,wehaveseendevelopmentofvarioustypesofbiologi-calandbiochemicalprocesses for the removalofpollutants fromwaste-water. The earlier objectives were mainly to reduce the total suspendedsolids(TSS),biochemicaloxygendemand(BOD),andpathogens.Primary
Sustainable wastewater treatment and engineering 3
andsecondarybiologicaltreatmentwasconsideredsufficientforproduc-tionoftreatedwastewaterofacceptablestandards.Withindustrializationandscientificadvances,chemicalandtoxiccompoundshavebeendetectedinmunicipalwastewatertreatmentplantinfluents.Thishasresultedintheneedforadditionaltreatmentbeyondthesecondary,givingrisetotertiarytreatment.Tertiaryor advanced treatment canbephysical, chemical, orbiological,oracombinationoftheseprocesses.
1.2 CURRENT PRACTICE
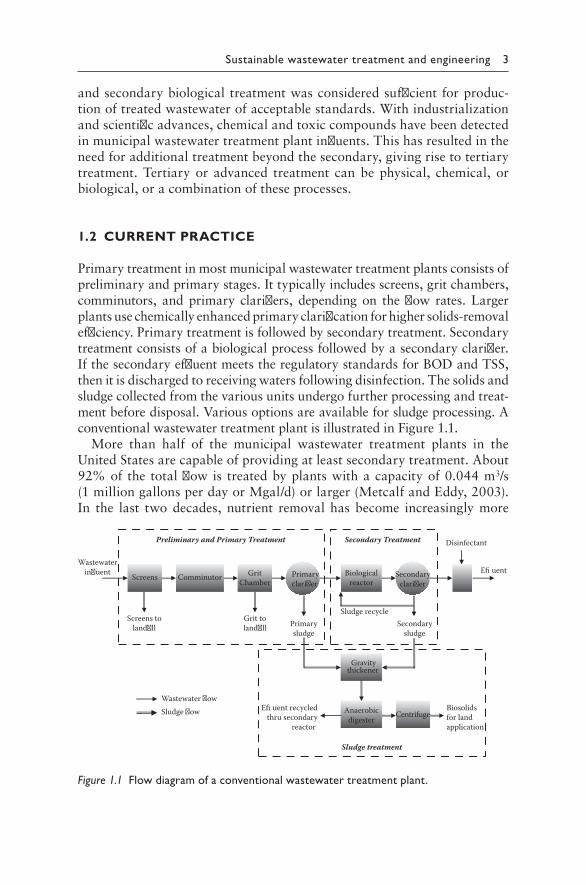
Primarytreatmentinmostmunicipalwastewatertreatmentplantsconsistsofpreliminaryandprimarystages.Ittypicallyincludesscreens,gritchambers,comminutors, andprimary clarifiers, dependingon the flow rates. Largerplantsusechemicallyenhancedprimaryclarificationforhighersolids-removalefficiency.Primarytreatmentisfollowedbysecondarytreatment.Secondarytreatmentconsistsofabiologicalprocessfollowedbyasecondaryclarifier.IfthesecondaryeffluentmeetstheregulatorystandardsforBODandTSS,thenitisdischargedtoreceivingwatersfollowingdisinfection.Thesolidsandsludgecollectedfromthevariousunitsundergofurtherprocessingandtreat-mentbeforedisposal.Variousoptionsareavailableforsludgeprocessing.AconventionalwastewatertreatmentplantisillustratedinFigure 1.1.
More than half of the municipal wastewater treatment plants in theUnitedStatesarecapableofprovidingatleastsecondarytreatment.About92%of the totalflowis treatedbyplantswithacapacityof0.044m3/s(1milliongallonsperdayorMgal/d)orlarger(MetcalfandEddy,2003).In the last twodecades, nutrient removalhasbecome increasinglymore
Screens Comminutor GritChamber
Primaryclari�er
Biologicalreactor
Secondaryclari�er
Gravity thickener
Primarysludge
Secondarysludge
Grit toland�ll
Screens toland�ll
Sludge recycle
Disinfectant
Anaerobicdigester Centrifuge
Biosolidsfor landapplication
E�uent recycledthru secondary
reactor
Preliminary and Primary Treatment Secondary Treatment
Sludge treatment
Wastewater �ow Sludge �ow
E�uent Wastewater
in�uent
Figure 1.1 Flow diagram of a conventional wastewater treatment plant.
4 Fundamentals of wastewater treatment and engineering
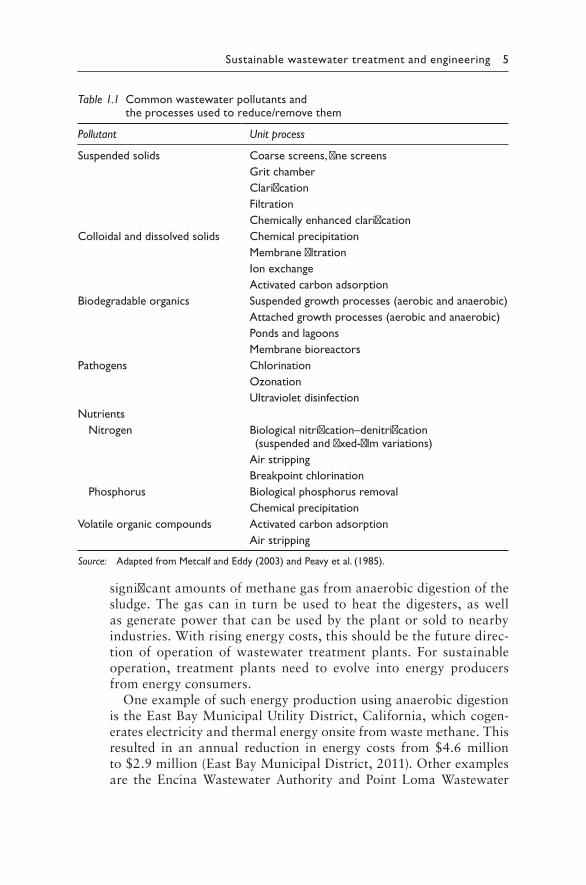
important in parts of the United States, as well as in Europe and Asia.Eutrophication caused by excessive nitrogen and phosphorus in waste-waterdischargeshasdisruptedtheaquaticlifeinreceivingwaterbodies,withasubsequentdeclineinwaterquality.Wastewatertreatmentplantsinaffectedareasandwatershedshavetoprovideadditionalnutrientremovalpriortodischarge.Biologicalnutrientremoval is incorporatedaspartofthesecondarytreatmentoras tertiarytreatment.Nutrientremoval isnolongerconsideredanadvancedtreatmentoption.AnexampleofthisistheChesapeakeBaywatershedintheeasternUnitedStatesandthemunicipalwastewatertreatmentplantswithinthewatershed.Mostoftheplantsusebiologicalnitrification–denitrificationtogetherwithBODremoval,and/orchemicalprecipitationforremovalofphosphorus.Useofgranularmediafiltration as tertiary treatment for reduction of total suspended solids isalsoquitecommon.Table 1.1presentsthepollutantscommonlyfoundinmunicipalwastewaterandthephysical,chemical,andbiologicalprocessesusedtoremoveorreducetheirconcentrations.
1.3 EMERGING ISSUES
Thefollowingareareasofimportanceandconcernformunicipalwastewa-tertreatmentplants:
• Risingenergycostsforoperationoftreatmentplants• Disposalofbiosolidsinasustainablemanner• Performanceandreliabilityofplantsinthedigitalage• Presenceofendocrinedisruptingcompounds(EDC)inwastewater• Presenceoftoxicchemicalsinwastewaterfromhouseholdproducts• More stringent discharge limits due to continued degradation of
waterbodies• Scarcityoffreshwatersources• Theneedtoupgradeaginginfrastructureandtreatmentplants• Theneedforadequatemathematicalmodelsandsoftwareforprocess
analysisandcontrol
1.4 FUTURE DIRECTIONS
Basedontheemergingissues,wastewaterengineeringandresearchshouldbefocusedonthefollowingareasinthefuture:
• Energy generation—Typically, wastewater treatment plants havehigh energy requirements for plant operation. They are big con-sumers of energy or electricity. Wastewater plants can generate
Sustainable wastewater treatment and engineering 5
significantamountsofmethanegasfromanaerobicdigestionofthesludge.Thegas can in turnbeused toheat thedigesters, aswellasgeneratepowerthatcanbeusedbytheplantorsoldtonearbyindustries.Withrisingenergycosts,thisshouldbethefuturedirec-tion of operation of wastewater treatment plants. For sustainableoperation, treatment plants need to evolve into energy producersfromenergyconsumers.
OneexampleofsuchenergyproductionusinganaerobicdigestionistheEastBayMunicipalUtilityDistrict,California,whichcogen-erateselectricityandthermalenergyonsitefromwastemethane.Thisresulted in an annual reduction in energy costs from $4.6 millionto$2.9million(EastBayMunicipalDistrict,2011).Otherexamplesare the Encina Wastewater Authority and Point Loma Wastewater
Table 1.1 Common wastewater pollutants and the processes used to reduce/remove them
Pollutant Unit process
Suspended solids Coarse screens, fine screensGrit chamberClarificationFiltrationChemically enhanced clarification
Colloidal and dissolved solids Chemical precipitationMembrane filtrationIon exchangeActivated carbon adsorption
Biodegradable organics Suspended growth processes (aerobic and anaerobic)Attached growth processes (aerobic and anaerobic)Ponds and lagoonsMembrane bioreactors
Pathogens ChlorinationOzonationUltraviolet disinfection
NutrientsNitrogen Biological nitrification–denitrification
(suspended and fixed-film variations)Air strippingBreakpoint chlorination
Phosphorus Biological phosphorus removalChemical precipitation
Volatile organic compounds Activated carbon adsorptionAir stripping
Source: Adapted from Metcalf and Eddy (2003) and Peavy et al. (1985).
6 Fundamentals of wastewater treatment and engineering
Treatment Plant in California, among others. The West PointTreatmentPlantinKingsCounty,Washington,usesthemethanegasgenerated from anaerobic digestion to run generators that produceelectricity. They are able to produce 1.5 to 2.0 megawatts of elec-tricity,whichissoldtothelocalutilitycompanyaftermeetingplantdemands(WestPointTreatmentPlant,2011).
• Beneficial reuse of biosolids—Thecostofprocessinganddisposalofthebiosolidsproducedatawastewatertreatmentplantcanamounttoalmost50%ofthetotalcapitalandoperationcosts.Futuredirectionshouldbemoretowardproducingaproductthatcanbereusedinabeneficialmanner,suchasfuelorfertilizer.AnexampleistheEncinaWastewaterAuthority,whichproducesbiosolidspelletsthataresoldto a cement manufacturing facility as an alternative fuel (EncinaWastewaterAuthority,2011).
• Wastewater reuse—Asfreshwaterresourcesbecomemorescarce,theneedforrecycledwastewaterwillincrease.Futuredirectionsshouldinclude increased research on water quality and safety of recycledwastewater,aswellaspubliceducationfordirectpotablereuse.TheislandnationofSingaporeusesreclaimedwaterthatisproducedfromamultiplebarrierwastewater treatmentprocess.Thewastewater isfirst treatedbyconventionaltreatment, followedbymicrofiltration/ultrafiltration,membranefilters,andfinallyultravioletdisinfection.NEWateristhebrandnamegiventothereclaimedwaterinSingapore(NEWater,2011).
• Fundamental research—With an increasing aging population andan increase in the use of pharmaceutical products, a vast num-berofnewandemerging contaminantshave found theirway intowastewatertreatmentplants.Ofconcernaretheendocrinedisrupt-ing compounds (EDCs),whichhave caused feminizationoffish inthe waters of Maryland, among others. A number of these com-pounds pass through the treatment plant unchanged and end upinstreamsandrivers,havingvariousconsequencesonaquaticlife.Fundamentalresearch isnecessary todetermine thecharacteristicsofthesecompoundsofconcernandtodevelopmethodsfortreatmentandremoval.
• Mathematical modeling—Wastewaterengineeringisstillinitsinfancywhencomparedwithotherengineeringdisciplines,withregardtothedevelopmentandavailabilityofprocessmodelsfordesignandcontrolof treatmentoperations.A fewmodelshavebeendevelopedby theInternationalWaterAssociationandBiowin®,amongothers.Inorderforthisbodyofscienceandengineeringtohaveasignificantpositiveimpactontheplanet’sscarcewaterresources,futuredirectionshouldbeinattractingbrilliantscientificmindstodevelopadequateandver-satileprocessmodels.
Sustainable wastewater treatment and engineering 7
1.5 REGULATORY REQUIREMENTS
Regulatoryrequirementshaveplayedasignificantroleinthedevelopmentandapplicationofwastewatertreatmentprocesses.Emergingresearchandsubsequent regulationshave shiftedcurrentgoalsoraddednewgoals tothetreatmentprocessfromtimetotime.Thishasresultedin innovationofnewengineeredprocesses.Inthefollowingsections,thedevelopmentofregulationsandstandardspertainingtowastewater intheUnitedStates,EuropeanUnion,andtheUnitedKingdomwillbediscussedindetail.
1.5.1 U.S. regulations
TheFederalWaterPollutionControlAct(FWPCA)of1948wasthefirstlegislationenactedbythefederalgovernmenttoaddressurbanwastewatermanagementissues(PublicLaw,1948).Theactprovidedforcomprehen-siveprogramsforeliminatingorreducingthepollutionofinterstatewatersand tributaries, and for research and technical assistance for improvingthesanitaryconditionofsurfaceandgroundwaters.MajoramendmentstotheFWPCAwereenactedin1961,1966,1970,1972,1977,and1987.The1966amendments, titled theCleanWaterRestorationAct, stronglyaddressed the issueofprotectingwaterquality (PublicLaw,1966).This1966actprovidedforauthorizationofacomprehensivestudyoftheeffectsofpollution,includingsedimentation,inU.S.estuariesandestuarinezonesonfishandwildlife,sportandcommercialfishing,recreation,watersupplyandpower, andother specifieduses.The legislation established a set ofwaterqualitystandards.Protectingpublichealthwastheprimarygoal,butadditionalgoalsofprotectingaquaticlifeandaestheticsofwaterresourceswereincluded.
TheFWPCAamendmentsof1972stipulatedbroadnationalobjectivestorestoreandmaintainthechemical,physical,andbiologicalintegrityofthenation’swaters(PublicLaw,1972).ThisbecameknownastheCleanWater Act (CWA) together with subsequent amendments in 1977. TheCWAestablishedthebasicstructureforregulatingdischargesofpollutantsintothenation’swatersandregulatingqualitystandardsforsurfacewaters.Newregulationswereestablishedforindustrialandagriculturalpolluters.TheCWAauthorizedtheEnvironmentalProtectionAgency(EPA)toestab-lish the National Pollutant Discharge Elimination System (NPDES) per-mitprogram.Allmunicipal,industrial,andotherfacilitiesthatdischargedtheirwastewatertosurfacewaterswererequiredtoobtainanNPDESper-mitfromEPA,whichspecifiedtechnology-basedeffluentstandardsforspe-cificpollutants.TheCWAalsoauthorizedsignificantfederalfundingforresearchandconstructiongrants,withtheambitiousgoalofeliminatingallwaterpollutionby1985.Allpubliclyownedtreatmentworks(POTWs)wererequiredtomeettheminimumstandardsforsecondarytreatment.
8 Fundamentals of wastewater treatment and engineering
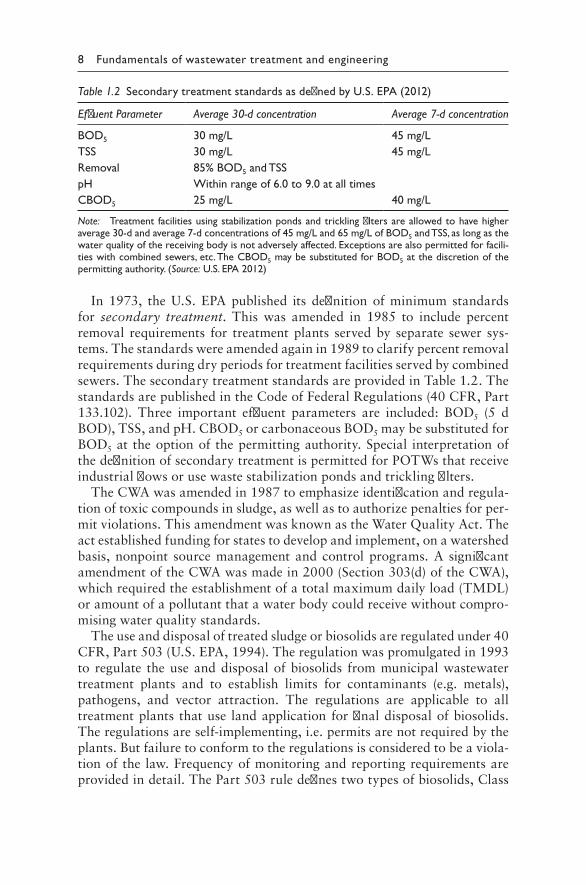
In 1973, the U.S. EPA published its definition of minimum standardsfor secondary treatment. This was amended in 1985 to include percentremoval requirements for treatmentplants servedby separate sewer sys-tems.Thestandardswereamendedagainin1989toclarifypercentremovalrequirementsduringdryperiodsfortreatmentfacilitiesservedbycombinedsewers.ThesecondarytreatmentstandardsareprovidedinTable 1.2.ThestandardsarepublishedintheCodeofFederalRegulations(40CFR,Part133.102). Three important effluent parameters are included: BOD5 (5 dBOD),TSS,andpH.CBOD5orcarbonaceousBOD5maybesubstitutedforBOD5at theoptionof thepermittingauthority.Special interpretationofthedefinitionofsecondarytreatmentispermittedforPOTWsthatreceiveindustrialflowsorusewastestabilizationpondsandtricklingfilters.
TheCWAwasamendedin1987toemphasizeidentificationandregula-tionoftoxiccompoundsinsludge,aswellastoauthorizepenaltiesforper-mitviolations.ThisamendmentwasknownastheWaterQualityAct.Theactestablishedfundingforstatestodevelopandimplement,onawatershedbasis, nonpoint sourcemanagement and controlprograms.A significantamendmentoftheCWAwasmadein2000(Section303(d)oftheCWA),whichrequiredtheestablishmentofatotalmaximumdailyload(TMDL)oramountofapollutantthatawaterbodycouldreceivewithoutcompro-misingwaterqualitystandards.
Theuseanddisposaloftreatedsludgeorbiosolidsareregulatedunder40CFR,Part503(U.S.EPA,1994).Theregulationwaspromulgatedin1993to regulate theuseanddisposalofbiosolids frommunicipalwastewatertreatment plants and to establish limits for contaminants (e.g. metals),pathogens, and vector attraction. The regulations are applicable to alltreatmentplants thatuse landapplication forfinaldisposalofbiosolids.Theregulationsareself-implementing,i.e.permitsarenotrequiredbytheplants.Butfailuretoconformtotheregulationsisconsideredtobeaviola-tionofthe law.Frequencyofmonitoringandreportingrequirementsareprovidedindetail.ThePart503ruledefinestwotypesofbiosolids,Class
Table 1.2 Secondary treatment standards as defined by U.S. EPA (2012)
Effluent Parameter Average 30-d concentration Average 7-d concentration
BOD5 30 mg/L 45 mg/LTSS 30 mg/L 45 mg/LRemoval 85% BOD5 and TSSpH Within range of 6.0 to 9.0 at all timesCBOD5 25 mg/L 40 mg/L
Note: Treatment facilities using stabilization ponds and trickling filters are allowed to have higher average 30-d and average 7-d concentrations of 45 mg/L and 65 mg/L of BOD5 and TSS, as long as the water quality of the receiving body is not adversely affected. Exceptions are also permitted for facili-ties with combined sewers, etc. The CBOD5 may be substituted for BOD5 at the discretion of the permitting authority. (Source: U.S. EPA 2012)
Sustainable wastewater treatment and engineering 9
AandClassB,basedonthelevelofpathogenreduction,metalconcentra-tions,andvectorattractionreduction.ClassAbiosolidscanbeappliedtolandwithoutanyrestrictions.Sludgestabilizationrequirementsandpatho-genreductionalternativesarespecifiedinthelaw.AdditionaldetailsofthePart503ruleareprovidedinChapter12(Section12.9).
1.5.2 European Union regulations
TheEuropeanUnion(EU)hasestablishedanumberofpoliciesordirec-tives that address the quality of surface and ground waters. Water sup-plyandsanitationistheresponsibilityofeachmembernationintheEU.However, theEUdirectives serve as a baseline for individual nations toformtheirownlegislation.
TherearethreemajorEUdirectives:
• TheUrbanWasteWaterTreatmentDirective(91/271/EEC)of1991pertainingtodischargesofmunicipalandsomeindustrialwastewaters
• TheDrinkingWaterDirective(98/83/EC)of1998pertainingtopota-blewater
• TheWaterFrameworkDirective(2000/60/EC)of2000pertainingtomanagementofsurfaceandgroundwaterresources
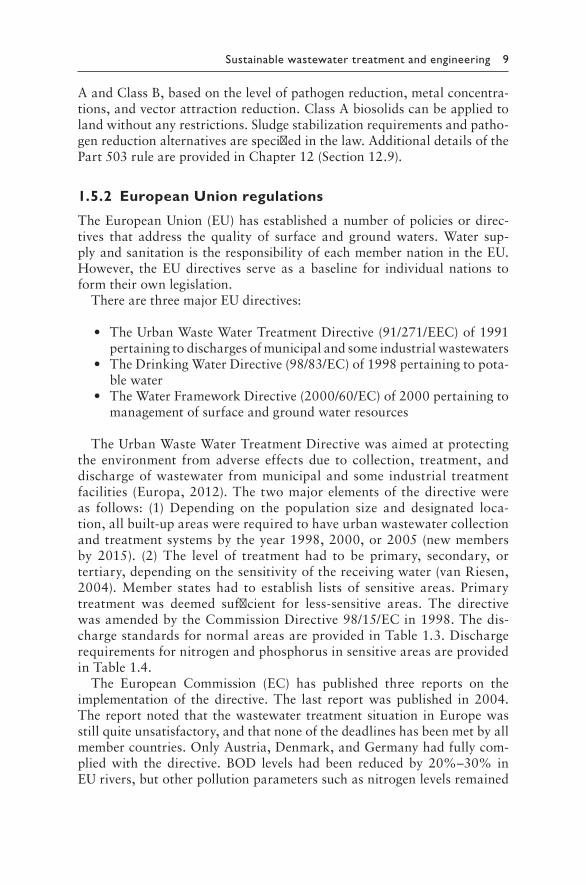
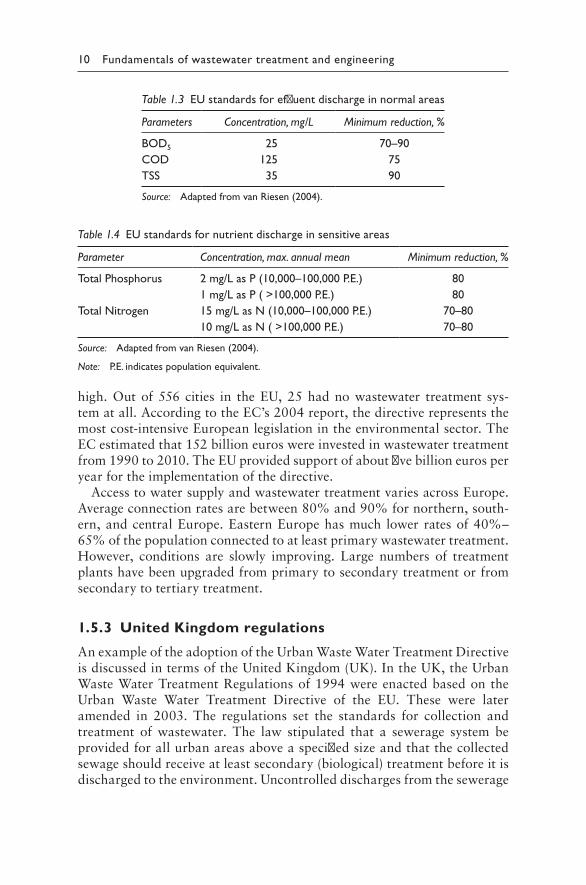
TheUrbanWasteWaterTreatmentDirectivewasaimedatprotectingthe environment fromadverse effectsdue to collection, treatment, anddischargeofwastewater frommunicipalandsome industrial treatmentfacilities (Europa,2012).Thetwomajorelementsof thedirectivewereas follows: (1) Depending on the population size and designated loca-tion,allbuilt-upareaswererequiredtohaveurbanwastewatercollectionandtreatmentsystemsbytheyear1998,2000,or2005(newmembersby 2015). (2) The level of treatment had to be primary, secondary, ortertiary,dependingonthesensitivityofthereceivingwater(vanRiesen,2004).Member states had to establish lists of sensitive areas. Primarytreatment was deemed sufficient for less-sensitive areas. The directivewasamendedbytheCommissionDirective98/15/ECin1998.Thedis-chargestandardsfornormalareasareprovidedinTable 1.3.DischargerequirementsfornitrogenandphosphorusinsensitiveareasareprovidedinTable 1.4.
The European Commission (EC) has published three reports on theimplementation of the directive.The last reportwaspublished in 2004.Thereportnoted that thewastewater treatmentsituation inEuropewasstillquiteunsatisfactory,andthatnoneofthedeadlineshasbeenmetbyallmembercountries.OnlyAustria,Denmark,andGermanyhadfullycom-plied with the directive. BOD levels had been reduced by 20%–30% inEUrivers,butotherpollutionparameterssuchasnitrogenlevelsremained
10 Fundamentals of wastewater treatment and engineering
high.Outof556 cities in theEU,25hadnowastewater treatment sys-tematall.AccordingtotheEC’s2004report,thedirectiverepresentsthemostcost-intensiveEuropeanlegislationintheenvironmentalsector.TheECestimatedthat152billioneuroswereinvestedinwastewatertreatmentfrom1990to2010.TheEUprovidedsupportofaboutfivebillioneurosperyearfortheimplementationofthedirective.
AccesstowatersupplyandwastewatertreatmentvariesacrossEurope.Averageconnectionratesarebetween80%and90%fornorthern,south-ern,andcentralEurope.EasternEuropehasmuch lower ratesof40%–65%ofthepopulationconnectedtoatleastprimarywastewatertreatment.However, conditions are slowly improving. Large numbers of treatmentplantshavebeenupgradedfromprimarytosecondarytreatmentorfromsecondarytotertiarytreatment.
1.5.3 United Kingdom regulations
AnexampleoftheadoptionoftheUrbanWasteWaterTreatmentDirectiveisdiscussedintermsoftheUnitedKingdom(UK).IntheUK,theUrbanWasteWaterTreatmentRegulationsof1994wereenactedbasedontheUrban Waste Water Treatment Directive of the EU. These were lateramended in 2003. The regulations set the standards for collection andtreatment of wastewater. The law stipulated that a sewerage system beprovidedforallurbanareasaboveaspecifiedsizeandthatthecollectedsewageshouldreceiveatleastsecondary(biological)treatmentbeforeitisdischargedtotheenvironment.Uncontrolleddischargesfromthesewerage
Table 1.3 EU standards for effluent discharge in normal areas
Parameters Concentration, mg/L Minimum reduction, %
BOD5 25 70–90COD 125 75TSS 35 90
Source: Adapted from van Riesen (2004).
Table 1.4 EU standards for nutrient discharge in sensitive areas
Parameter Concentration, max. annual mean Minimum reduction, %
Total Phosphorus 2 mg/L as P (10,000–100,000 P.E.) 801 mg/L as P ( >100,000 P.E.) 80
Total Nitrogen 15 mg/L as N (10,000–100,000 P.E.) 70–8010 mg/L as N ( >100,000 P.E.) 70–80
Source: Adapted from van Riesen (2004).
Note: P.E. indicates population equivalent.
Sustainable wastewater treatment and engineering 11
systemsareallowedonlyunderstormconditions.Thelawidentifiedsensi-tiveareas,e.g.eutrophicwaters.Largertreatmentplantshavetoreducetheirnutrientloadspriortodischargetoeutrophicwaters.Theregulationalsobanned thedisposalof sludge to seaby the endof1998 (DEFRA,2012).
TheDepartmentofEnvironment,Food,andRuralAffairs(DEFRA)isresponsible for policy on implementation of the regulations in England,NorthernIreland,theScottishgovernmentinScotland,andtheWelshgov-ernmentinWales.Theirenvironmentalregulators(theEnvironmentAgencyforEngland,NorthernIrelandEnvironmentAgency,ScottishEnvironmentProtection Agency, and Environment Agency Wales) are responsible formonitoringdischargesfromtreatmentplantsforcompliancewiththelegis-lation’streatmentstandards(DEFRA,2012).
REFERENCES
Anon(2011)“TheHistoryofWastewaterTreatment.”http://www.cityoflewisville.com/wcmsite/publishing.nsf/AttachmentsByTitle/Wastewater+Treatment+History/$FILE/The+History+of+Wastewater+Treatment3.pdf.
Burian,S.J.,Nix,S.J.,Pitt,R.E.,andDurrans,S.R. (2000)“UrbanWastewaterManagementintheUnitedStates:Past,PresentandFuture.”Journal of Urban Technology,vol.7,no.3,p.33–62.
DEFRA(2012)http://www.defra.gov.uk/environment/quality/water/sewage/sewage-treatment/.
Duffy,J.(1968)A History of Public Health in New York City: 1625–1866.RussellSageFoundation,NewYork.
EastBayMunicipalDistrict(2011)http://www.ebmud.com/about-ebmud.Encina Wastewater Authority (2011) http://www.encinajpa.com/Home/Public
Information.aspx.Europa(2012)“SummariesofEULegislation.”http://europa.eu/legislation_summaries/
environment/water_protection_management/l28008_en.htm.EuropeanCommission(2004)“EuropeanCommissionReport”p.108.http://eur-lex.
europa.eu/LexUriServ/site/en/com/2004/com2004_0248en01.pdf.Hey,D.L.,andWaggy,W.H.(1979)“PlanningforWaterQuality:1776to1976.”
ASCE Journal of the Water Resources Planning and Management Division,105(March),p.121–131.
Metcalf and Eddy, Inc. (2003) Wastewater Engineering: Treatment and Reuse.Fourthedition.McGraw-Hill,Inc.,NewYork.
NEWater(2011)http://en.wikipedia.org/wiki/NEWater.Peavy,H.S.,Rowe,D.R.,andTchobanoglous,G.(1985)Environmental Engineering.
McGraw-Hill,Inc.,NewYork.PublicLaw(1948)P.L.845,Ch758,33U.S.C.1251-1376.PublicLaw(1966)P.L.89-753,33U.S.C.466.PublicLaw(1972)P.L.92-500,33U.S.C.1251,1311-1317.

12 Fundamentals of wastewater treatment and engineering
U.S. EPA (1994)“A Plain English Guide to the EPA Part 503, Biosolids Rule.”EPA/832/R-93/003.Washington,D.C.
U.S. EPA (2012)“EPA NPDES PermitWriters’ Manual.” Chapter 5, Section 5.2.http://www.epa.gov/npdes/pubs/chapt_05.pdf.
vanRiesen,S.(2004)“EuropeanWastewaterStandards.”PresentedattheWastewaterForum of IFAT China 2004: International Trade Fair for EnvironmentalProtection,Jun29-Jul2,Shanghai,China.
West Point Treatment Plant (2011) http://www.kingcounty.gov/environment/wtd/About/System/West.aspx.
13
Chapter 2
Reaction kinetics and chemical reactors
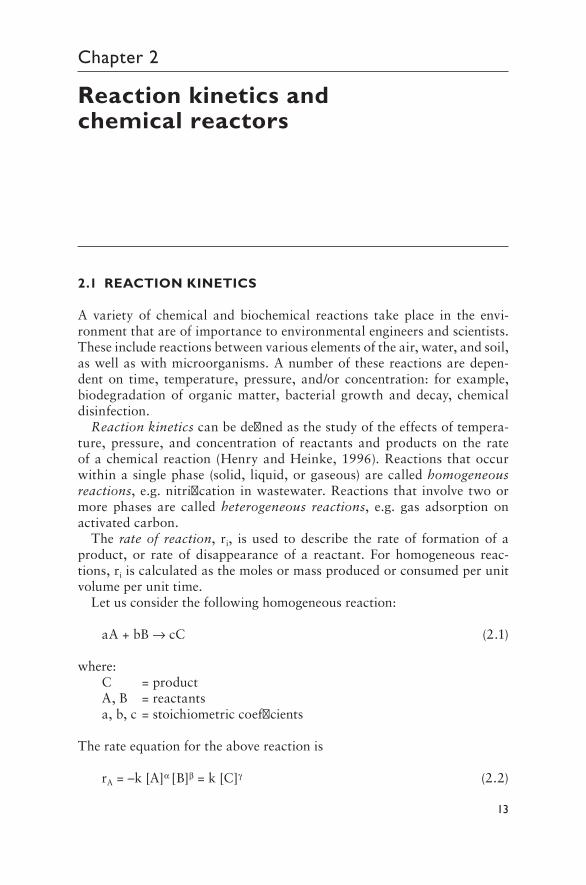
2.1 REACTION KINETICS
A variety of chemical and biochemical reactions take place in the envi-ronmentthatareofimportancetoenvironmentalengineersandscientists.Theseincludereactionsbetweenvariouselementsoftheair,water,andsoil,aswellaswithmicroorganisms.Anumberofthesereactionsaredepen-dent on time, temperature, pressure, and/or concentration: for example,biodegradation of organic matter, bacterial growth and decay, chemicaldisinfection.
Reaction kineticscanbedefinedasthestudyoftheeffectsoftempera-ture, pressure, and concentrationof reactants andproducts on the rateofachemical reaction(HenryandHeinke,1996).Reactions thatoccurwithinasinglephase(solid, liquid,orgaseous)arecalledhomogeneous reactions,e.g.nitrification inwastewater.Reactionsthat involvetwoormore phases are called heterogeneous reactions, e.g. gas adsorption onactivatedcarbon.
The rate of reaction, ri, isused todescribe the rateof formationof aproduct, or rate of disappearance of a reactant. For homogeneous reac-tions,riiscalculatedasthemolesormassproducedorconsumedperunitvolumeperunittime.
Letusconsiderthefollowinghomogeneousreaction:
aA+bB→cC (2.1)
where:C=productA,B=reactantsa,b,c=stoichiometriccoefficients
Therateequationfortheabovereactionis
rA=–k[A]α[B]β=k[C]γ (2.2)
14 Fundamentals of wastewater treatment and engineering
where:α,β,γ=empiricallydeterminedexponents[A],[B],[C]=molarconcentrationsofA,B,andCk=reactionrateconstant
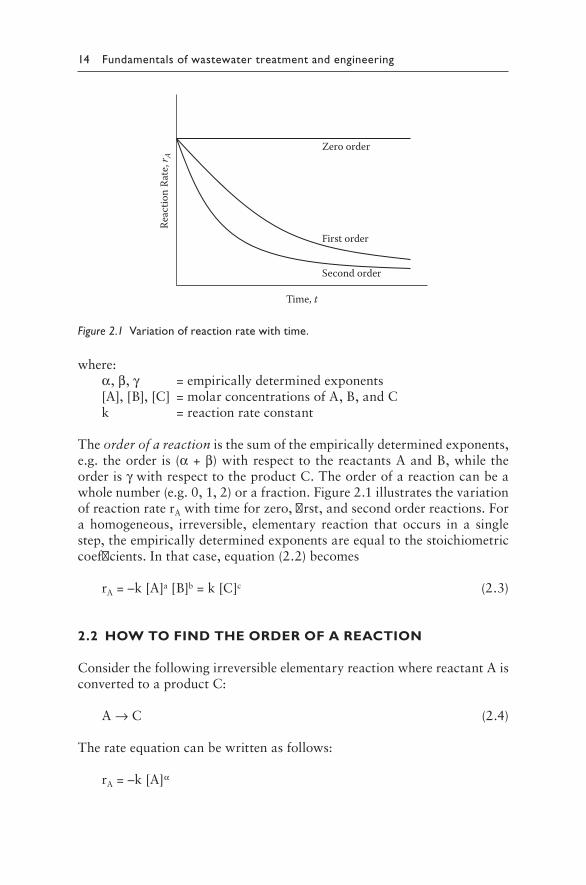
Theorder of a reactionisthesumoftheempiricallydeterminedexponents,e.g.theorderis(α+β)withrespecttothereactantsAandB,whiletheorderisγwithrespecttotheproductC.Theorderofareactioncanbeawholenumber(e.g.0,1,2)orafraction.Figure 2.1illustratesthevariationofreactionraterAwithtimeforzero,first,andsecondorderreactions.Fora homogeneous, irreversible, elementary reaction that occurs in a singlestep,theempiricallydeterminedexponentsareequaltothestoichiometriccoefficients.Inthatcase,equation(2.2)becomes
rA=–k[A]a[B]b=k[C]c (2.3)
2.2 HOW TO FIND THE ORDER OF A REACTION
ConsiderthefollowingirreversibleelementaryreactionwherereactantAisconvertedtoaproductC:
A→C (2.4)
Therateequationcanbewrittenasfollows:
rA=–k[A]α
Time, t
Reac
tion
Rate
, rA
Zero order
First order
Second order
Figure 2.1 Variation of reaction rate with time.
Reaction kinetics and chemical reactors 15
or
loge(–rA)=loge(k)+αloge[A] (2.5)
where:α=orderofthereaction(e.g.0,1,2,etc.)k=reactionrateconstant
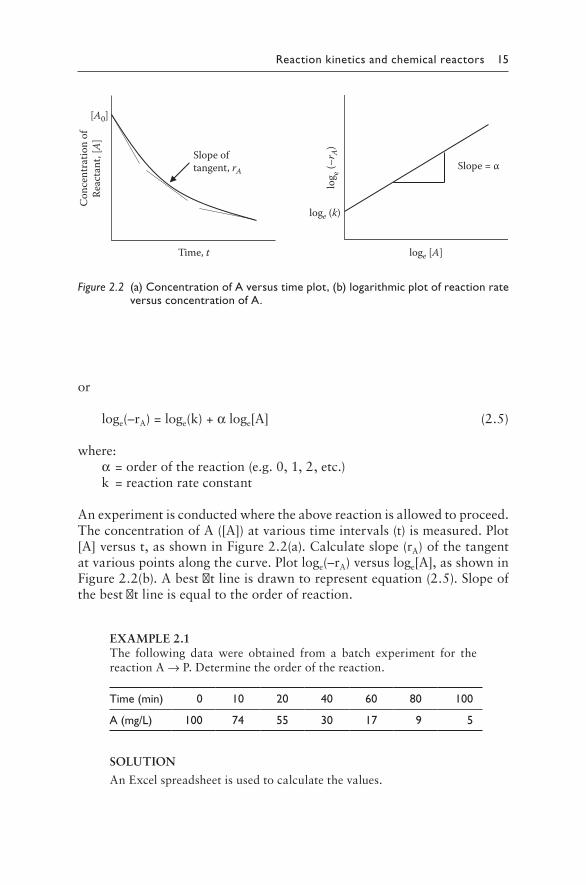
Anexperimentisconductedwheretheabovereactionisallowedtoproceed.TheconcentrationofA([A])atvarioustimeintervals(t)ismeasured.Plot[A]versust,asshowninFigure 2.2(a).Calculateslope(rA)ofthetangentatvariouspointsalongthecurve.Plotloge(–rA)versusloge[A],asshowninFigure 2.2(b).Abestfitlineisdrawntorepresentequation(2.5).Slopeofthebestfitlineisequaltotheorderofreaction.
EXAMPLE2.1The following data were obtained from a batch experiment for thereactionA→P.Determinetheorderofthereaction.
Time (min) 0 10 20 40 60 80 100
A (mg/L) 100 74 55 30 17 9 5
SOLUTION
AnExcelspreadsheetisusedtocalculatethevalues.
Time, t
Conc
entr
atio
n of
Reac
tant
, [A]
Slope oftangent, rA
[A0]
loge [A]
log e (–
r A)
loge (k)
Slope = α
Figure 2.2 (a) Concentration of A versus time plot, (b) logarithmic plot of reaction rate versus concentration of A.
16 Fundamentals of wastewater treatment and engineering
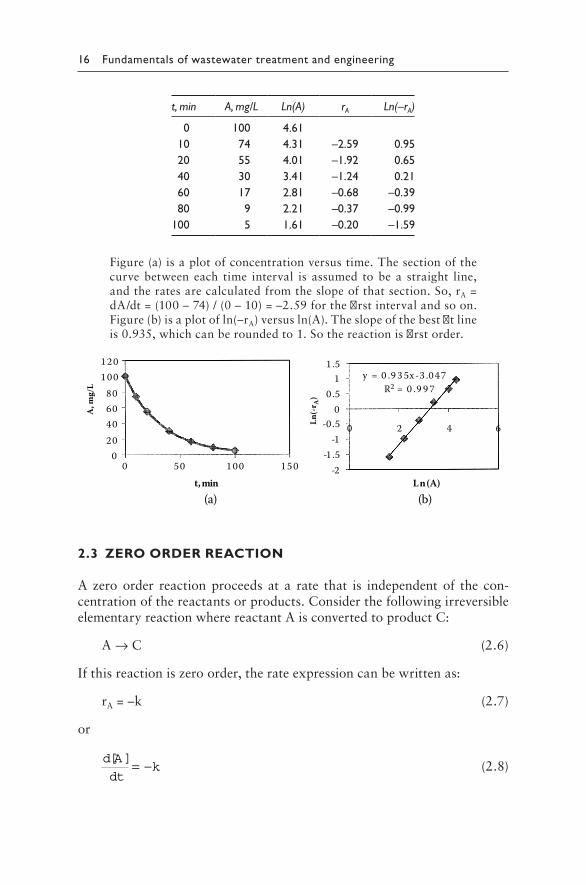
t, min A, mg/L Ln(A) rA Ln(–rA)
0 100 4.61 10 74 4.31 –2.59 0.95 20 55 4.01 –1.92 0.65 40 30 3.41 –1.24 0.21 60 17 2.81 –0.68 –0.39 80 9 2.21 –0.37 –0.99100 5 1.61 –0.20 –1.59
Figure (a)isaplotofconcentrationversustime.Thesectionofthecurvebetween each time interval is assumed tobe a straight line,andtheratesarecalculatedfromtheslopeofthatsection.So,rA=dA/dt=(100–74)/(0–10)=–2.59forthefirstintervalandsoon.Figure (b)isaplotofln(–rA)versusln(A).Theslopeofthebestfitlineis0.935,whichcanberoundedto1.Sothereactionisfirstorder.
(a) (b)
020406080
1 0 01 2 0
0 50 1 0 0 1 5 0t, min
A, m
g/L
-2-1 .5
-1-0 .5
00 .5
11 .5
0 2 4 6
Ln(A)
y = 0 .9 3 5x -3 .0 4 7R2 = 0 .9 9 7
Ln(-
r A)
2.3 ZERO ORDER REACTION
Azeroorder reactionproceeds at a rate that is independentof the con-centrationofthereactantsorproducts.ConsiderthefollowingirreversibleelementaryreactionwherereactantAisconvertedtoproductC:
A→C (2.6)
Ifthisreactioniszeroorder,therateexpressioncanbewrittenas:
rA=–k (2.7)
or
d A
dtk
[ ]= − (2.8)
Reaction kinetics and chemical reactors 17
where:
d A
dt
[ ]= rateofchangeofconcentrationofAwithtime
k=reactionrateconstant,time–1
Integrateequation(2.8)betweeninitialvaluesandvaluesaftertimet
[ ]
[ ]
[ ]
A
A t
o
t
d A k dt∫ ∫= −0
or
[At]–[Ao]=–kt
or
[At]=[Ao]–kt (2.9)
where:[Ao]=initialconcentrationofreactantAattimezero,mg/L[At]=concentrationofAaftertimet,mg/L
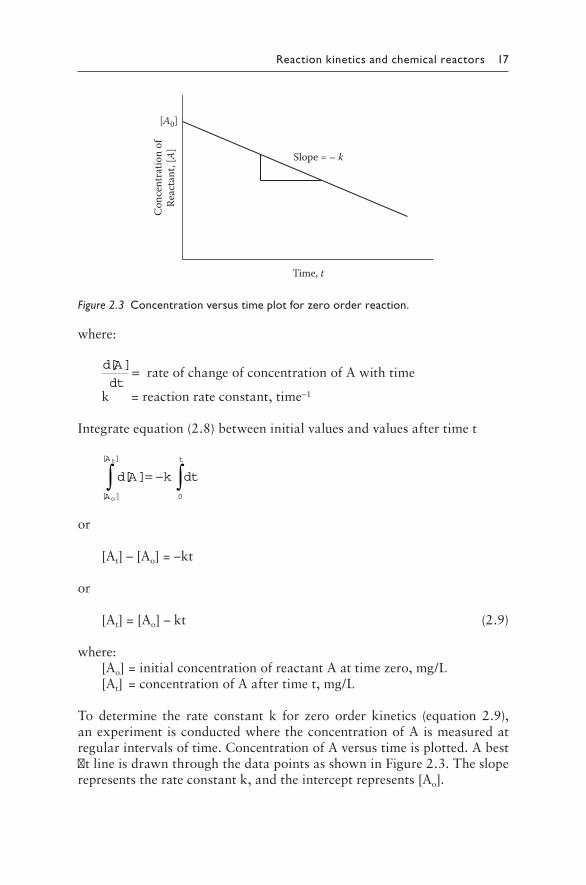
To determine the rate constant k for zero order kinetics (equation 2.9),anexperimentisconductedwheretheconcentrationofAismeasuredatregularintervalsoftime.ConcentrationofAversustimeisplotted.AbestfitlineisdrawnthroughthedatapointsasshowninFigure 2.3.Thesloperepresentstherateconstantk,andtheinterceptrepresents[Ao].
Time, t
Conc
entr
atio
n of
Reac
tant
, [A] Slope = – k
[A0]
Figure 2.3 Concentration versus time plot for zero order reaction.
18 Fundamentals of wastewater treatment and engineering
2.4 FIRST ORDER REACTION
Considertheirreversibleelementaryreactionrepresentedbyequation(2.6).If the reaction isfirstorderwith respect to concentrationofA, the rateexpressionbecomes
d A
dtk A
[ ][ ]= − (2.10)
Integrateequation(2.10)betweeninitialvaluesandvaluesaftertimet,
[ ]
[ ]
[ ]
[ ]A
A t
o
t
d A
Ak dt∫ ∫= −
0
or
logA
Akte
o
t
[ ]
[ ]=
or
[At]=[Ao]e–kt (2.11)
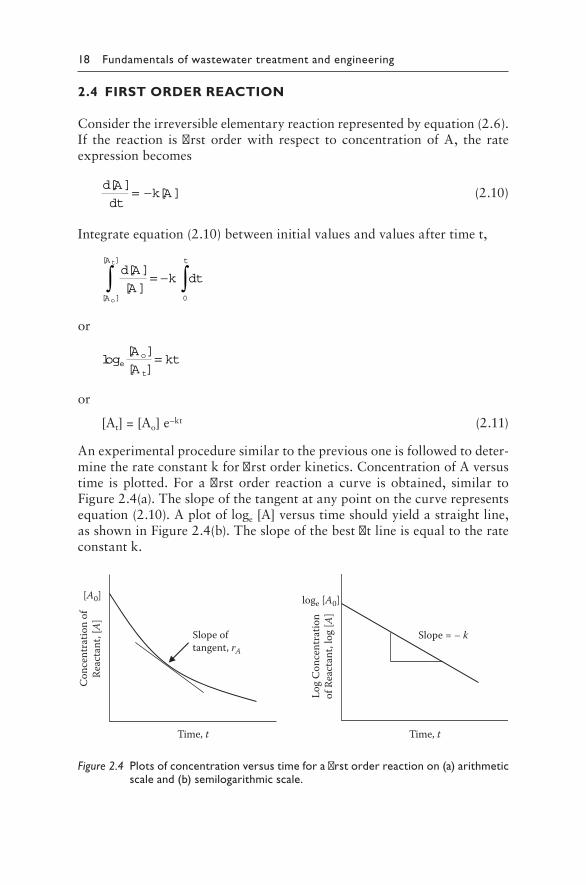
Anexperimentalproceduresimilartothepreviousoneisfollowedtodeter-minetherateconstantkforfirstorderkinetics.ConcentrationofAversustime isplotted.Forafirstorder reactiona curve isobtained, similar toFigure 2.4(a).Theslopeofthetangentatanypointonthecurverepresentsequation(2.10).Aplotofloge[A]versustimeshouldyieldastraightline,asshowninFigure 2.4(b).Theslopeofthebestfitlineisequaltotherateconstantk.
Time, t
Conc
entr
atio
n of
Reac
tant
, [A]
Slope oftangent, rA
[A0]
Time, t
Log
Conc
entr
atio
nof
Rea
ctan
t, lo
g [A
]
loge [A0]
Slope = – k
Figure 2.4 Plots of concentration versus time for a first order reaction on (a) arithmetic scale and (b) semilogarithmic scale.
Reaction kinetics and chemical reactors 19
2.5 SECOND ORDER REACTION
Letusconsidertheirreversibleelementaryreactionrepresentedbyequation(2.6).IfthereactionissecondorderwithrespecttoconcentrationofA,therateexpressionbecomes
d A
dtk A
[ ][ ]= − 2 (2.12)
Integrateequation(2.12)betweeninitialvaluesandvaluesaftertimet,
[ ]
[ ]
[ ]
[ ]A
A t
o
t
d A
Ak dt∫ ∫= −
2
0
or
1 1
[ ] [ ]A Akt
t o
− = (2.13)
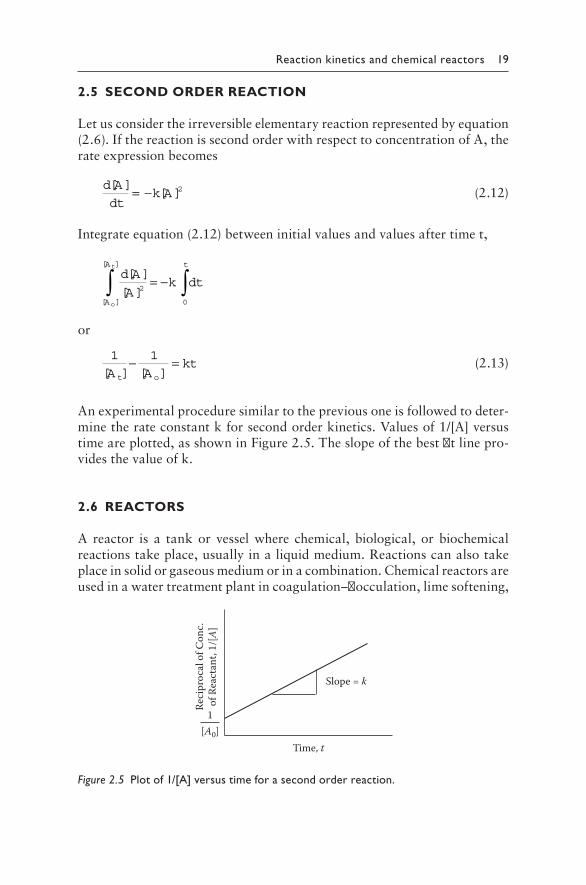
Anexperimentalproceduresimilartothepreviousoneisfollowedtodeter-minetherateconstantkforsecondorderkinetics.Valuesof1/[A]versustimeareplotted,asshowninFigure 2.5.Theslopeofthebestfitlinepro-videsthevalueofk.
2.6 REACTORS
A reactor is a tankor vesselwhere chemical, biological, or biochemicalreactionstakeplace,usuallyinaliquidmedium.Reactionscanalsotakeplaceinsolidorgaseousmediumorinacombination.Chemicalreactorsareusedinawatertreatmentplantincoagulation–flocculation,limesoftening,
Time, t
Slope = k
1[A0]
Reci
proc
al o
f Con
c.of
Rea
ctan
t, 1/
[A]
Figure 2.5 Plot of 1/[A] versus time for a second order reaction.
20 Fundamentals of wastewater treatment and engineering
tasteandodorcontrol,disinfection,andotherunitprocessesthatinvolvechemicalreactions.Reactorsusedinwastewatertreatmentplantsinvolvemostlybiochemicalandbiologicalreactions,e.g.activatedsludgereactor,membranebioreactor.
Therearethreetypesof idealreactors: (1)batchreactor, (2)plugflowreactor (PFR),and (3)continuous-flowstirred tankreactor (CSTR).Thehydraulicsandconversionefficienciesofthesereactorscanbedeterminedusing mathematical models. Models developed for ideal reactors can befurther modified to represent real-life processes and flow conditions forreactorsusedat treatmentplants. In the followingsections,basicdesignequationsforidealreactorswillbediscussed.
2.6.1 Conversion of a reactant
Theconversionorremovalofareactantiscalculatedasfollows:
fA A
A
A
Ao t
o
t
o
= − = −[ ] [ ]
[ ]
[ ]
[ ]1 (2.14)
where:f=conversionorremovalefficiency[Ao]=initialconcentrationofreactantAattimezero,mg/L[At]=concentrationofAaftertimet,mg/L
2.6.2 Detention time in reactor
Thetheoreticaldetentiontimeorresidencetimeofthefluidparticlesinareactorisgivenby
tV
Q= (2.15)
where:t=detentiontimeinreactorV=volumeofreactorQ=volumetricflowrate,volume/time
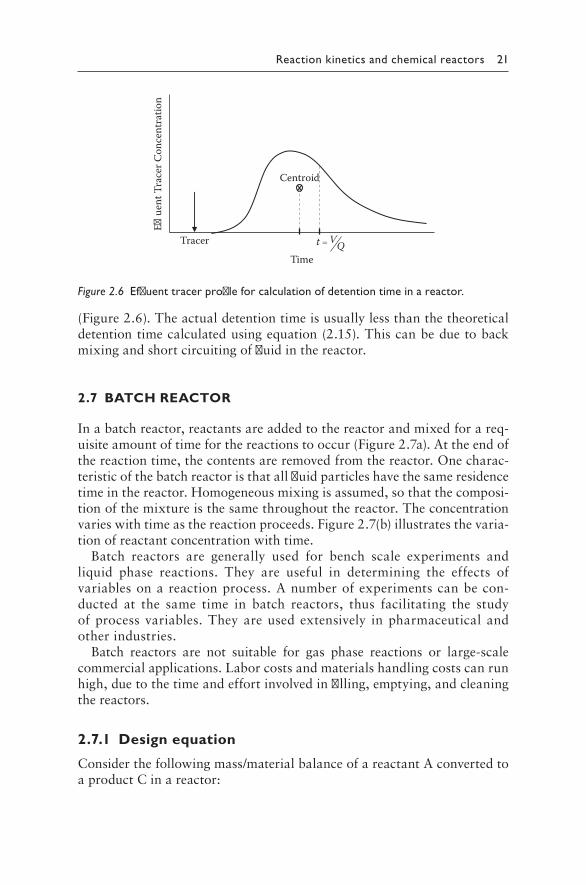
Theactualdetentiontimeinareactorcanbedeterminedbyaddingatracerordyetotheinfluentduringsteadystateflowandthenmeasuringthecon-centrationof the tracer in the effluentover aperiodof time.The tracerconcentration in the effluent is plotted versus time on graph paper, andthecentroidoftheresultingcurveislocatedastheactualdetentiontime
Reaction kinetics and chemical reactors 21
(Figure 2.6).Theactualdetentiontimeisusuallylessthanthetheoreticaldetentiontimecalculatedusingequation(2.15).Thiscanbeduetobackmixingandshortcircuitingoffluidinthereactor.
2.7 BATCH REACTOR
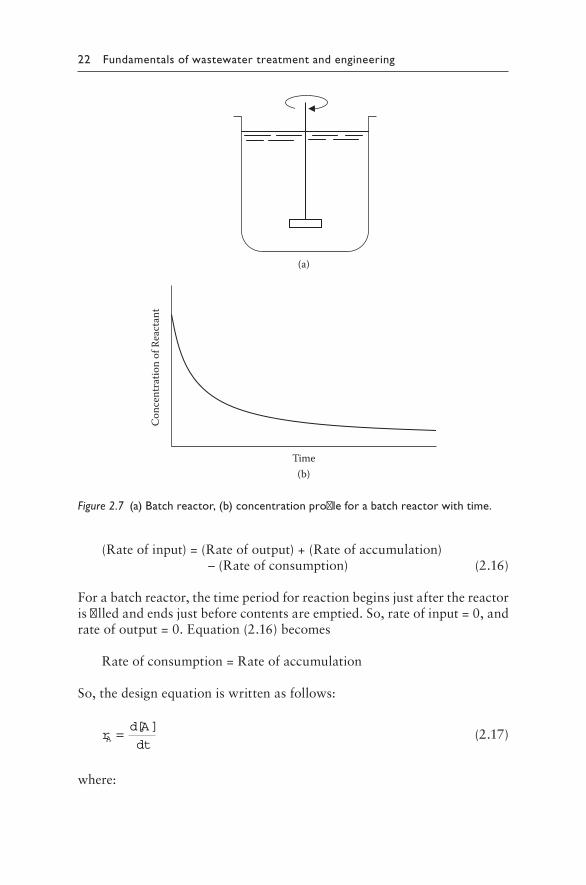
Inabatchreactor,reactantsareaddedtothereactorandmixedforareq-uisiteamountoftimeforthereactionstooccur(Figure 2.7a).Attheendofthereactiontime,thecontentsareremovedfromthereactor.Onecharac-teristicofthebatchreactoristhatallfluidparticleshavethesameresidencetimeinthereactor.Homogeneousmixingisassumed,sothatthecomposi-tionofthemixtureisthesamethroughoutthereactor.Theconcentrationvarieswithtimeasthereactionproceeds.Figure 2.7(b)illustratesthevaria-tionofreactantconcentrationwithtime.
Batch reactors are generally used for bench scale experiments andliquid phase reactions. They are useful in determining the effects ofvariablesonareactionprocess.Anumberofexperimentscanbecon-ducted at the same time in batch reactors, thus facilitating the studyofprocessvariables.Theyareusedextensively inpharmaceuticalandotherindustries.
Batch reactors are not suitable for gas phase reactions or large-scalecommercialapplications.Laborcostsandmaterialshandlingcostscanrunhigh,duetothetimeandeffortinvolvedinfilling,emptying,andcleaningthereactors.
2.7.1 Design equation
Considerthefollowingmass/materialbalanceofareactantAconvertedtoaproductCinareactor:
Time
E�ue
nt T
race
r Con
cent
ratio
n
QVtTracer
Centroid
Figure 2.6 Effluent tracer profile for calculation of detention time in a reactor.
22 Fundamentals of wastewater treatment and engineering
(Rateofinput)=(Rateofoutput)+(Rateofaccumulation) –(Rateofconsumption) (2.16)
Forabatchreactor,thetimeperiodforreactionbeginsjustafterthereactorisfilledandendsjustbeforecontentsareemptied.So,rateofinput=0,andrateofoutput=0.Equation(2.16)becomes
Rateofconsumption=Rateofaccumulation
So,thedesignequationiswrittenasfollows:
rd A
dtA = [ ]
(2.17)
where:
(a)
(b)Time
Conc
entr
atio
n of
Rea
ctan
t
Figure 2.7 (a) Batch reactor, (b) concentration profile for a batch reactor with time.
Reaction kinetics and chemical reactors 23
rA=rateofconsumptionoflimitingreactantA,concentration/time[A]=concentrationoflimitingreactantA
Whentheorderofthereactionisknown,anexpressionforrAcanbesub-stitutedintotheleftsideofequation(2.17),andtheresultingdifferentialequationcanbeintegratedtoobtainthedesignexpression.Table 2.1pres-ents thedesignequations for zero,first,and secondorder reactions inabatchreactor.
EXAMPLE2.2Considerafirstorderreactiontakingplaceinabatchreactor.Developanexpressionforthedetentiontimeinthereactor.
SOLUTION
Forafirstorderreaction,rA=–k[A]SubstitutetheexpressionforrAinequation(2.17):
− =k Ad A
dt[ ]
[ ]
Thisissimilartoequation(2.10).Uponintegrationbetweenlimitsweobtain,
log
A
Akte
o
t
[ ]
[ ]=
or
t
klog
A
Ae
o
t
= 1 [ ]
[ ]
2.8 PLUG FLOW REACTOR (PFR)
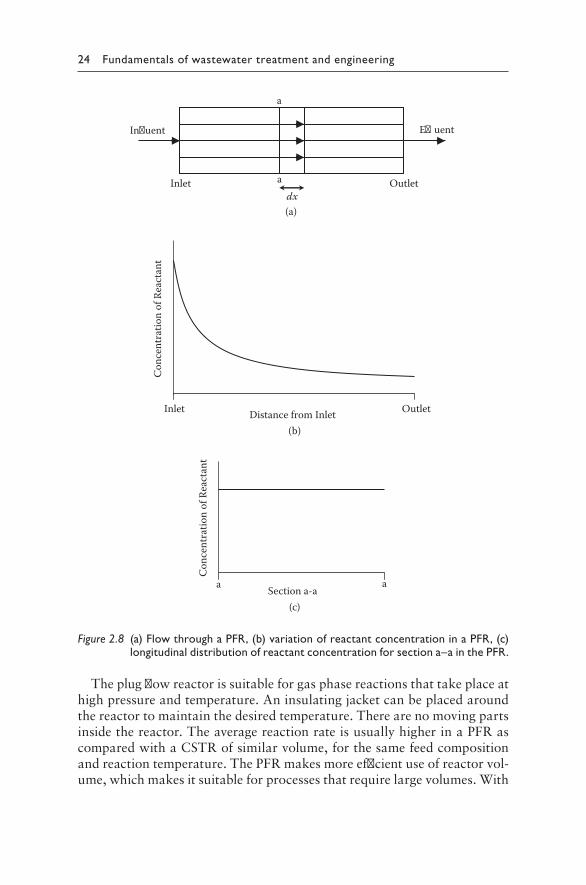
Inaplugflowreactor,fluidparticlesflowthroughthetankandaredis-charged in the same sequence as they entered. The fluid particles movethrough the reactor tube as plugs moving parallel to the tube axis(Figure 2.8a).Thereisnolongitudinalmixingoffluid,thoughtheremaybesomelateralmixing.Allfluidelementshavethesameresidencetimeinthereactor.Figure 2.8(b)presentstheconcentrationgradientfromreactorinlettooutlet.Thisisduetotheconversionofreactantasitflowsthroughthereactor.Thevelocityprofileatanygivencross-sectionisflat,asthereisnobackmixingoraxialdiffusion.Asaresult,theconcentrationofreactantacrossanyverticalcross-sectionisthesame,asillustratedinFigure 2.8(c).
24 Fundamentals of wastewater treatment and engineering
Theplugflowreactorissuitableforgasphasereactionsthattakeplaceathighpressureandtemperature.Aninsulatingjacketcanbeplacedaroundthereactortomaintainthedesiredtemperature.Therearenomovingpartsinsidethereactor.TheaveragereactionrateisusuallyhigherinaPFRascomparedwithaCSTRofsimilarvolume,forthesamefeedcompositionandreactiontemperature.ThePFRmakesmoreefficientuseofreactorvol-ume,whichmakesitsuitableforprocessesthatrequirelargevolumes.With
(a)
(b)
(c)Section a-a
Conc
entr
atio
n of
Rea
ctan
t
a a
Distance from Inlet
Conc
entr
atio
n of
Rea
ctan
t
Inlet Outlet
In�uent E�uent
Inlet Outletdx
a
a
Figure 2.8 (a) Flow through a PFR, (b) variation of reactant concentration in a PFR, (c) longitudinal distribution of reactant concentration for section a–a in the PFR.
Reaction kinetics and chemical reactors 25
sufficientlyhighrecyclerates,thebehaviorofthePFRbecomessimilartothatofaCSTR.
2.8.1 Design equation
Considerthedifferentialsectiondx(Figure 2.8a)withadifferentialvolumedVinthereactor.Amass/materialbalanceonlimitingreactantAinthedifferentialvolumeisasfollows:
(Rateofinput)=(Rateofoutput)+(Rateofaccumulation) –(Rateofconsumption)
Forsteadystateconditions,thedesignequationiswrittenas
rd A
dtA = [ ]
(2.18)
which is the sameas thedesign equation for abatch reactor.When theorderofthereactionisknown,anexpressionforrAcanbesubstitutedintotheleftsideoftheaboveequation,andtheresultingdifferentialequationcanbe integratedtoobtainthedesignexpression.Table 2.1presentsthedesignequationsforzero,first,andsecondorderreactionsinaPFR.
EXAMPLE2.3AreactiontakesplaceinaPFR,wherereactantAisconvertedtoprod-uctP.Therateequationis
rA=–0.38[A]mol/L·s
DeterminethevolumeofPFRrequiredfor95%conversionofA.Theini-tialconcentrationofAis0.25mol/L,andvolumetricflowrateis5m3/s.
Table 2.1 Design equations for batch, PFR, and CSTR
Order Rate of reaction Batch reactor expression CSTR or PFR
0 –k kt = [Ao] – [At] kt = [Ao] – [At]
1 –k[A] ktAAo
t
=
ln[ ][ ]
ktAAo
t
=
−[ ][ ]
1
2 –k[A]2 ktA
AAo
o
t
= −
11
[ ][ ][ ]
ktA
AAt
o
t
= −
11
[ ][ ][ ]
26 Fundamentals of wastewater treatment and engineering
SOLUTION
Thegivenreactionisfirstorderwithk=0.38s–1,[Ao]=0.25mol/L.With95%conversion,[A]=(1–0.95)[Ao]=0.05×0.25=0.0125
mol/L.FromTable 2.1,firstorderdesignequationforaPFRis
ktA
Ao
t
=
ln[ ]
[ ]
or
0.38t=ln(0.25/0.0125)
or
t=7.88s
VolumeofPFR,V=Qt=(5m3/s)(7.88s)=39.42m3.
2.9 CONTINUOUS-FLOW STIRRED TANK REACTOR
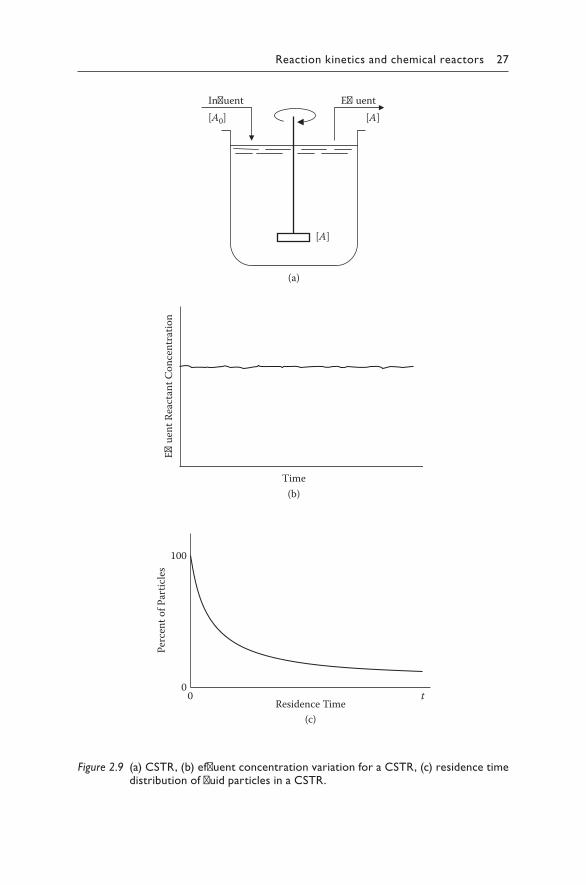
Continuous-flow stirred tank reactors (CSTRs) are used mainly for liq-uidphase reactionsat loworatmosphericpressures. In this reactor, thereactantflowscontinuouslyintothereactor,theproducteffluentflowsoutcontinuously, and the reactor contents are mixed on a continuous basis(Figure 2.9a).Thistypeofreactorisalsocalledbackmixreactororcom-pletelymixedreactor.
ThebasicassumptionforanidealCSTRisthatthereactorcontentsarecompletely mixed and homogeneous throughout. When a reactant [Ao]enters the reactor, it is subjected to instantaneousandcompletemixing,resulting in immediate reduction to the final effluent concentration [At].Theeffluentcompositionandtemperaturearethesameasthoseofthereac-torcontents.Thisremainsthesameovertime,asshowninFigure 2.9(b).
Atracermoleculeintheinfluenthasequalprobabilityofbeinglocatedanywhereinthereactorafterasmalltimeinterval,withinthelimitofcom-pletemixing(Hill,1977).Thusallfluidelementsinthereactorhaveequalprobabilityofleavingthereactorwiththeeffluentinthenexttimeincre-ment.Asaresult,thereisabroaddistributionofresidencetimesforvariousfluidparticlesasillustratedinFigure 2.9(c).
LowerconversionofreactantisachievedinaCSTRascomparedwithaPFR,at thesameoperating temperatureandfeedcomposition.This ismainlyduetothevariationofparticleresidencetimeswithinthereactorandtheinabilitytoachievecompletemixing.Asaresult,aCSTRoflargervolumeisrequiredtoachievethesameconversionasaPFR.
Reaction kinetics and chemical reactors 27
(a)
(b)Time
E�ue
nt R
eact
ant C
once
ntra
tion
In�uent E�uent [A0] [A]
[A]
(c)Residence Time
Perc
ent o
f Par
ticle
s
0 t
100
0
Figure 2.9 (a) CSTR, (b) effluent concentration variation for a CSTR, (c) residence time distribution of fluid particles in a CSTR.
28 Fundamentals of wastewater treatment and engineering
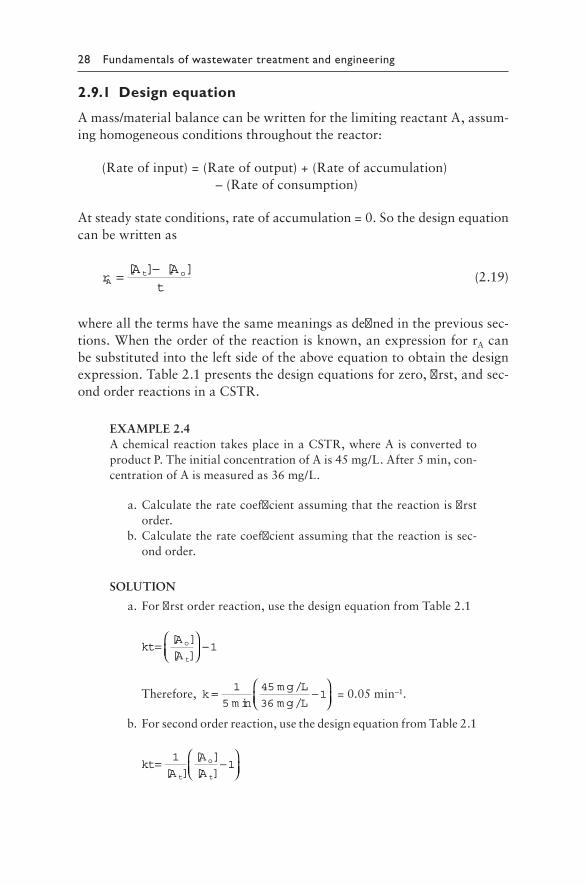
2.9.1 Design equation
Amass/materialbalancecanbewrittenforthelimitingreactantA,assum-inghomogeneousconditionsthroughoutthereactor:
(Rateofinput)=(Rateofoutput)+(Rateofaccumulation) –(Rateofconsumption)
Atsteadystateconditions,rateofaccumulation=0.Sothedesignequationcanbewrittenas
rA A
tA
t o= −[ [ ]] (2.19)
whereallthetermshavethesamemeaningsasdefinedintheprevioussec-tions.Whentheorderofthereactionisknown,anexpressionforrAcanbesubstitutedintotheleftsideoftheaboveequationtoobtainthedesignexpression.Table 2.1presentsthedesignequationsforzero,first,andsec-ondorderreactionsinaCSTR.
EXAMPLE2.4AchemicalreactiontakesplaceinaCSTR,whereAisconvertedtoproductP.TheinitialconcentrationofAis45mg/L.After5min,con-centrationofAismeasuredas36mg/L.
a.Calculatetheratecoefficientassumingthatthereactionisfirstorder.
b.Calculatetheratecoefficientassumingthatthereactionissec-ondorder.
SOLUTION
a.Forfirstorderreaction,usethedesignequationfromTable 2.1
ktA
Ao
t
=
−[ ]
[ ]1
Therefore, km in
m g L
m g L= −
1
5
45
361
/
/=0.05min–1.
b.Forsecondorderreaction,usethedesignequationfromTable 2.1
ktA
A
At
o
t
= −
11
[ ]
[ ]
[ ]
Reaction kinetics and chemical reactors 29
Therefore, km g L
m g L
m g L=
×−
1
5 36
45
361
m in /
/
/=0.0014(mg/l·min)–1.
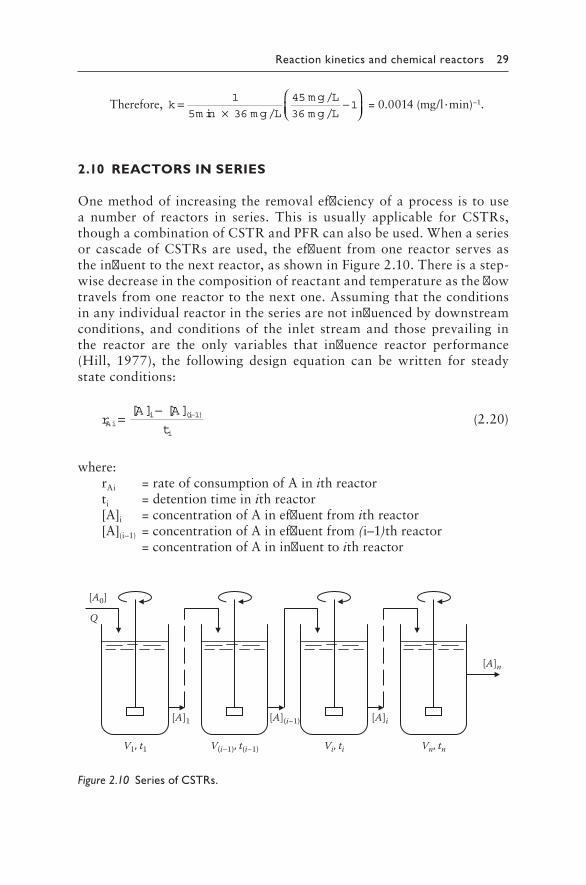
2.10 REACTORS IN SERIES
Onemethodof increasingtheremovalefficiencyofaprocess is tousea number of reactors in series. This is usually applicable for CSTRs,thoughacombinationofCSTRandPFRcanalsobeused.WhenaseriesorcascadeofCSTRsareused, theeffluent fromone reactor servesastheinfluenttothenextreactor,asshowninFigure 2.10.Thereisastep-wisedecreaseinthecompositionofreactantandtemperatureastheflowtravelsfromonereactortothenextone.Assumingthattheconditionsinanyindividualreactorintheseriesarenotinfluencedbydownstreamconditions, and conditions of the inlet streamand those prevailing inthe reactor are the only variables that influence reactor performance(Hill, 1977), the following design equation can be written for steadystateconditions:
rA A
tAi
i i
i
=− −[ ] [ ]( )1 (2.20)
where:rAi=rateofconsumptionofAinithreactorti=detentiontimeinithreactor[A]i=concentrationofAineffluentfromithreactor[A](i–1)=concentrationofAineffluentfrom(i–1)threactor =concentrationofAininfluenttoithreactor
V1, t1 V(i–1), t(i–1) Vi, ti Vn, tn
[A]1 [A](i–1) [A]i
[A]n
[A0]
Q
Figure 2.10 Series of CSTRs.
30 Fundamentals of wastewater treatment and engineering
Thedetentiontimeintheithreactorisgivenby
tV
Qi
i= (2.21)
where:Vi=volumeofithreactorQ=volumetricflowrateintoreactor
Inaseriesofnreactors,theoverallconversionisgivenby
fA A
Ao n
o
= −[ ] [ ]
[ ] (2.22)
where:[Ao]=concentrationofAininfluentto1streactor[An]=concentrationofAineffluentfromnthreactor
Conversioninindividualreactorscanbecalculatedfrominfluentandefflu-entreactantconcentrationsofthatreactor.
EXAMPLE2.5Consider the same first order chemical reaction from Example 2.4.Tworeactorsareusedinseries,aCSTRfollowedbyaPFRforproductformation.Thedetentiontimeinthefirstreactor(CSTR)is5min.Thetworeactorsareoperatedatthesametemperatureandhavethesamevolume.WhatwillbetheeffluentconcentrationofAfromthePFR?Whatistheconversionefficiency?
SOLUTION
Thetworeactorsareoperatedatthesametemperature:
Therefore,kCSTR=kPFR
Thetworeactorshavethesamevolume,andiftheflowrateisthesame:
detentiontime,tCSTR=tPFR
A1 A2AoQ
PFRCSTR
FromExample2.4,Ao=45mg/L,A1=36mg/L,kCSTR=0.05min–1.
Therefore,kPFR=0.05min–1
Reaction kinetics and chemical reactors 31
UsethedesignequationforPFRforfirstorderreactionfromTable 2.1:
kt lnA
A=
1
2
or
0 05 5361
2
. m in/
m in lnm g L
A− × =
or
A2=28.04mg/L
Overallconversionefficiency=45 28 04
45100
− ×.% =37.7%.
EXAMPLE2.6In Example 2.5, if another CSTR was used as the second reactorinsteadof thePFR,whatwouldbe the effluent concentrationofA?Calculate the conversion efficiency. Determine the concentration ofreactantAinthefirstandsecondreactors.
SOLUTION
UsedesignequationforCSTRforfirstorderreactionforreactor#2:
A1=36mg/L,kCSTR=0.05min–1,t=5min
ktA
A=
−1
2
1
or
0 05 536
11
2
./
m in m inm g L
A− × = −
or
A2=28.8mg/L
Overallconversionefficiency=45 28 8
45100
− ×.% =36%.
ForaCSTR,concentrationineffluent=concentrationinreactorConcentrationofAinreactor#1=A1=36mg/LConcentrationofAinreactor#2=A2=28.8mg/L
32 Fundamentals of wastewater treatment and engineering
2.11 SEMIBATCH OR SEMIFLOW REACTORS
Reactorsused inactual treatmentplantsandprocessesmaybeoperatedsomewhereinbetweenidealreactormodes.Reactoroperationcanbesemi-batchorsemiflow.Afewexamplesaregivenbelow:
1.A reactor where all the reactants are added at the same time as abatch,buttheproductsaredischargedcontinuously
2.Areactorwherethereactantsareaddedatdifferenttimeintervals 3.Areactorwheretheproductsareremovedatdifferenttimeintervals 4.Abatch reactorpartially filledwithone reactant,withprogressive
additionofotherreactantsuntilthereactioniscompleted.
PROBLEMS
2.1 Itwasobservedfromanexperimentalstudythattherateofachemi-cal reaction did not depend on the concentration of the reactantbutwasinfluencedbytheconcentrationoftheproduct.Whatistheorderofthereactionwithrespecttothereactant?
2.2 Drawthecurvesforreactionrateversustimeforzero,first,andsec-ondorderreactions.Writedowntherateexpressionsforeachcurve.
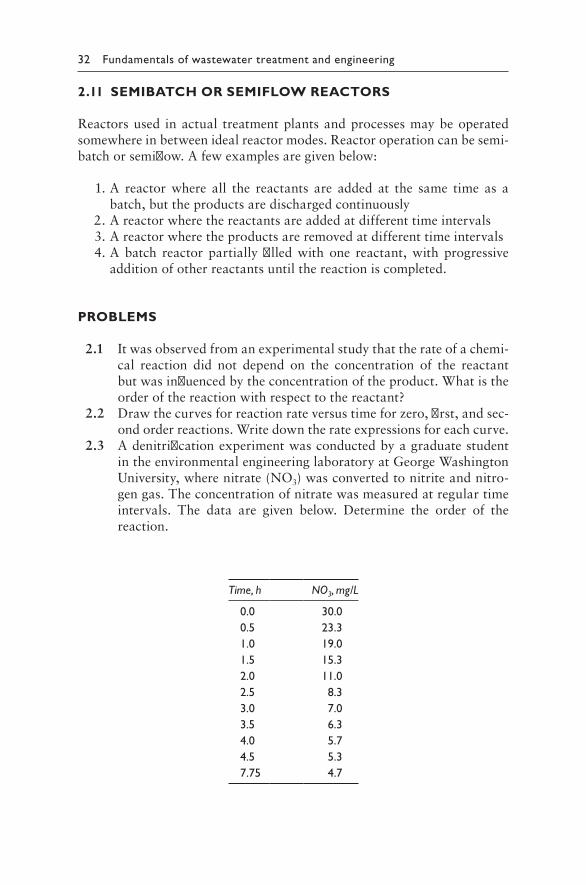
2.3 AdenitrificationexperimentwasconductedbyagraduatestudentintheenvironmentalengineeringlaboratoryatGeorgeWashingtonUniversity,wherenitrate(NO3)wasconvertedtonitriteandnitro-gengas.Theconcentrationofnitratewasmeasuredatregulartimeintervals. The data are given below. Determine the order of thereaction.
Time, h NO3, mg/L
0.0 30.00.5 23.31.0 19.01.5 15.32.0 11.02.5 8.33.0 7.03.5 6.34.0 5.74.5 5.37.75 4.7
Reaction kinetics and chemical reactors 33
2.4 Wastewateristreatedinareactorvessel.Afirstorderreactiontakesplacewithrespecttotheorganicmatterinthewastewater.Therateconstantisdeterminedtobe0.23d–1.Theinitialconcentrationoforganicmatteris150mg/L,anditisdesiredtoachieve90%conver-sion.Theflowrateofthewastewateris500m3/d.
a. Calculate thedetention time and volumeof PFR required toachievethisconversion.
b. Calculate the volume of CSTR required to achieve the sameconversion.
c. Whichoptionseemsbettertoyouandwhy? 2.5 A laboratoryanalysis is carriedout inbatch reactors. Initial con-
centration of reactant was 0.25 mol/L, and 85% conversion wasachievedin20min.Itwasassumedthatthereactionwaszeroorderwithrespecttoreactant.
a. Calculatethezeroorderratecoefficient. b. Afterfurtherexperimentation,itwasdiscoveredthattherate
wasfirstorderandnotzeroorder.Calculate thecorrect ratecoefficient.
2.6 Theammoniainwastewateristobeconvertedtonitrateinabiore-actor.Initialconcentrationofammoniais145mg/L.Itisdesiredtoachieve90%conversionina50m3reactor.ThedesignengineeristryingtoselectbetweenaPFRandCSTRmodeforoperationofthereactor.Whichmodeofoperationwillallowtheengineertoprocessalargervolumeofwastewaterwithinashorterperiodoftime?
2.7 IndustrialwastewateristreatedinaCSTR.Theconversionofreac-tantAtoproductCisgovernedbythefollowingrateequation:
rA=–1.2[A]mg/L·h
a. The volume of the reactor is 60 m3. What is the volumetricflowrateofthewastewater,correspondingtoaconversioneffi-ciencyof95%?
b. If only 90% conversion efficiency is desired, can we use asmaller reactor volume to handle the same flow rate? Whatwouldbethevolume?
2.8 DairywastewateristreatedinaseriesofCSTRs.Theinitialcon-centrationofcomplexorganicsinthewastewateris1500mg/L.Thefirstorderratecoefficientis0.45d–1.Detentiontimeineachreactor is1.5d. If tworeactorsareused inseries,calculatethefinal effluent concentration of the organic matter. What is theconversionefficiency?
2.9 UsingthedatafromProblem2.8,calculatetheoverallefficiencyifthreereactorsareused inseries.Would itbe feasible touse threereactors?
34 Fundamentals of wastewater treatment and engineering
2.10 Whatisaplugflowreactor?Whataretheadvantagesanddisadvan-tagesofusingaPFR?
2.11 Illustrate graphically the variation of reactant concentration withtimein(1)aPFRand(2)aCSTR.
2.12 WhatisaCSTR?MentiontwoadvantagesandtwodisadvantagesofaCSTR.
2.13 Itisdesiredtoincreasetheconversionefficiencyofachemicalpro-cess. Would you use multiple reactors in series or in parallel toachievethis?Why?
REFERENCES
Henry, J. G., and Heinke, G.W. (1996) Environmental Science and Engineering.Secondedition.PrenticeHall,NewYork.
Hill,C.G.Jr.(1977)An Introduction to Chemical Engineering Kinetics and Reactor Design.JohnWiley&Sons,NewYork.
35
Chapter 3
Wastewater microbiology
3.1 INTRODUCTION
Wastewatercontainsawidevarietyofmicroorganisms,someofwhicharepathogens,whileothersplaya significant role indegradationoforganicmatter.Bacteria,protozoa,andothermicroorganismsplayanactiverolein the conversion of biodegradable organic matter to simpler end prod-uctsthatresultinstabilizationofthewaste.Thisisacontinuousprocessoccurring instreamsandriversasnaturalpurificationprocesses.This isdescribedinmoredetailinChapter4.Thesenaturalpurificationprocessesareenhancedandacceleratedinengineeredbiologicaltreatmentsystemsatwastewatertreatmentplants.Forefficientremovaloforganicmatterandother pollutants, it is essential tohave a thoroughunderstanding of thenature,growthkinetics,andprocessrequirementsofthemicroorganismsinvolvedandutilized in thebiological treatmentprocesses.This chapterwillprovideanoverviewofthemajorgroupsofmicroorganismsusedinbiologicaltreatmentofwastewater.
The three major domains of living organisms are the Bacteria, theArchaea,andtheEukarya.ThisisaccordingtotheUniversalPhylogenetic(Evolutionary) Tree, which was derived from comparative sequencing of16Sor18SribosomalRNA(ribonucleicacid)(Madiganetal.,2010).Basedoncellstructure,alllivingorganismsaredividedintotwotypes:prokary-otic and eukaryotic.Themajorstructuraldifferencebetweenprokaryotesandeukaryotes is theirnuclear structure.Theeukaryoticnucleus is sur-rounded by a nuclear membrane, contains DNA (deoxyribonucleic acid)molecules,andundergoesdivisionbymitosis.Ontheotherhand,thepro-karyotic nuclear region is not surrounded by a membrane and containsa single DNA molecule whose division is nonmitotic. The prokaryotesincludebacteria,blue-greenalgae (cyanobacter), andarchaea.Figure 3.1shows typical cell structure of (a) prokaryotes and (b) eukaryotes. Thearchaea are separated frombacteria due to theirDNAcomposition anduniquecellularchemistry.Examplesofarchaeaare themethaneproduc-ers,e.g.methanococcus, methanosarcina.Theeukaryotesaremuchmore
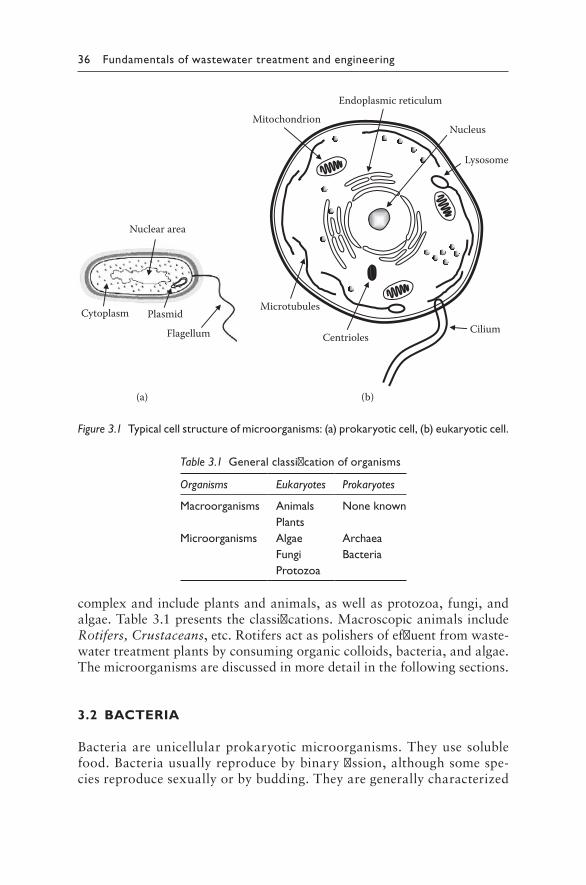
36 Fundamentals of wastewater treatment and engineering
complexandincludeplantsandanimals,aswellasprotozoa,fungi,andalgae.Table 3.1presentstheclassifications.MacroscopicanimalsincludeRotifers, Crustaceans,etc.Rotifersactaspolishersofeffluentfromwaste-watertreatmentplantsbyconsumingorganiccolloids,bacteria,andalgae.Themicroorganismsarediscussedinmoredetailinthefollowingsections.
3.2 BACTERIA
Bacteriaareunicellularprokaryoticmicroorganisms.Theyusesolublefood.Bacteriausuallyreproducebybinaryfission,althoughsomespe-ciesreproducesexuallyorbybudding.Theyaregenerallycharacterized
(a) (b)
Flagellum
Plasmid
Nuclear area
Cytoplasm
Nucleus
Centrioles
Mitochondrion
Lysosome
Microtubules
Endoplasmic reticulum
Cilium
Figure 3.1 Typical cell structure of microorganisms: (a) prokaryotic cell, (b) eukaryotic cell.
Table 3.1 General classification of organisms
Organisms Eukaryotes Prokaryotes
Macroorganisms Animals None knownPlants
Microorganisms Algae ArchaeaFungi BacteriaProtozoa
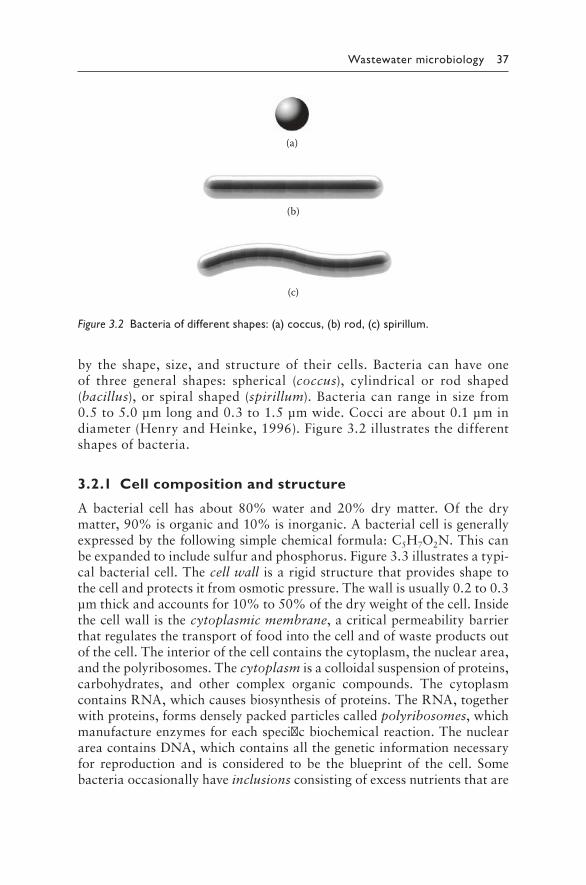
Wastewater microbiology 37
by the shape, size, and structureof their cells. Bacteria canhaveoneof three general shapes: spherical (coccus), cylindrical or rod shaped(bacillus),orspiralshaped(spirillum).Bacteriacanrange insizefrom0.5to5.0μmlongand0.3to1.5μmwide.Cocciareabout0.1μmindiameter(HenryandHeinke,1996).Figure 3.2illustratesthedifferentshapesofbacteria.
3.2.1 Cell composition and structure
A bacterial cell has about 80% water and 20% dry matter. Of the drymatter,90%isorganicand10%isinorganic.Abacterialcellisgenerallyexpressedbythefollowingsimplechemicalformula:C5H7O2N.Thiscanbeexpandedtoincludesulfurandphosphorus.Figure 3.3illustratesatypi-calbacterialcell.Thecell wallisarigidstructurethatprovidesshapetothecellandprotectsitfromosmoticpressure.Thewallisusually0.2to0.3μmthickandaccountsfor10%to50%ofthedryweightofthecell.Insidethecellwallisthecytoplasmic membrane,acriticalpermeabilitybarrierthatregulatesthetransportoffoodintothecellandofwasteproductsoutofthecell.Theinteriorofthecellcontainsthecytoplasm,thenucleararea,andthepolyribosomes.Thecytoplasmisacolloidalsuspensionofproteins,carbohydrates, and other complex organic compounds. The cytoplasmcontainsRNA,whichcausesbiosynthesisofproteins.TheRNA,togetherwithproteins,formsdenselypackedparticlescalledpolyribosomes,whichmanufactureenzymesforeachspecificbiochemicalreaction.ThenuclearareacontainsDNA,whichcontainsallthegeneticinformationnecessaryfor reproduction and is considered to be the blueprint of the cell. Somebacteriaoccasionallyhaveinclusionsconsistingofexcessnutrientsthatare
(a)
(b)
(c)
Figure 3.2 Bacteria of different shapes: (a) coccus, (b) rod, (c) spirillum.
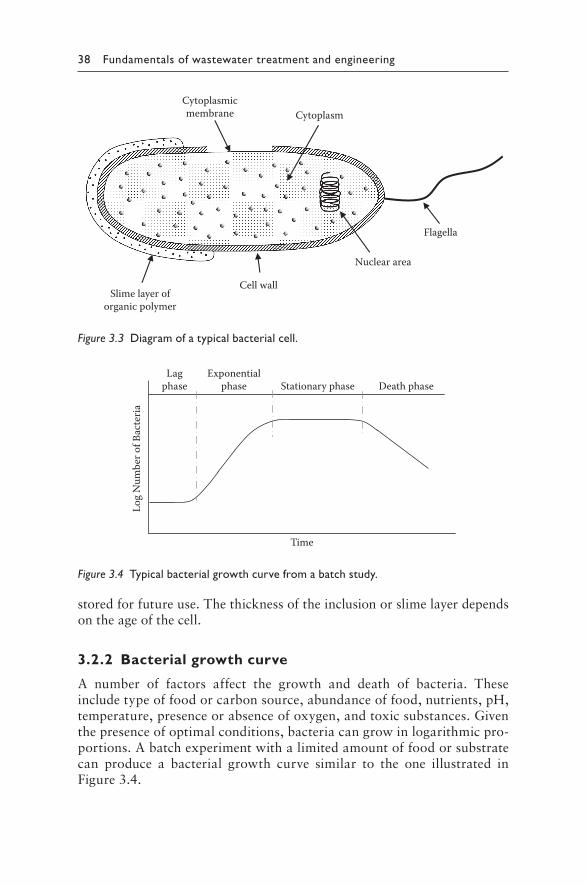
38 Fundamentals of wastewater treatment and engineering
storedforfutureuse.Thethicknessoftheinclusionorslimelayerdependsontheageofthecell.
3.2.2 Bacterial growth curve
A number of factors affect the growth and death of bacteria. Theseincludetypeoffoodorcarbonsource,abundanceoffood,nutrients,pH,temperature,presenceorabsenceofoxygen,andtoxicsubstances.Giventhepresenceofoptimalconditions,bacteriacangrowinlogarithmicpro-portions.Abatchexperimentwithalimitedamountoffoodorsubstratecan produce a bacterial growth curve similar to the one illustrated inFigure 3.4.
Time
Log
Num
ber o
f Bac
teria
Lagphase
Exponentialphase Stationary phase Death phase
Figure 3.4 Typical bacterial growth curve from a batch study.
Flagella
Nuclear area
CytoplasmCytoplasmicmembrane
Cell wallSlime layer of
organic polymer
Figure 3.3 Diagram of a typical bacterial cell.
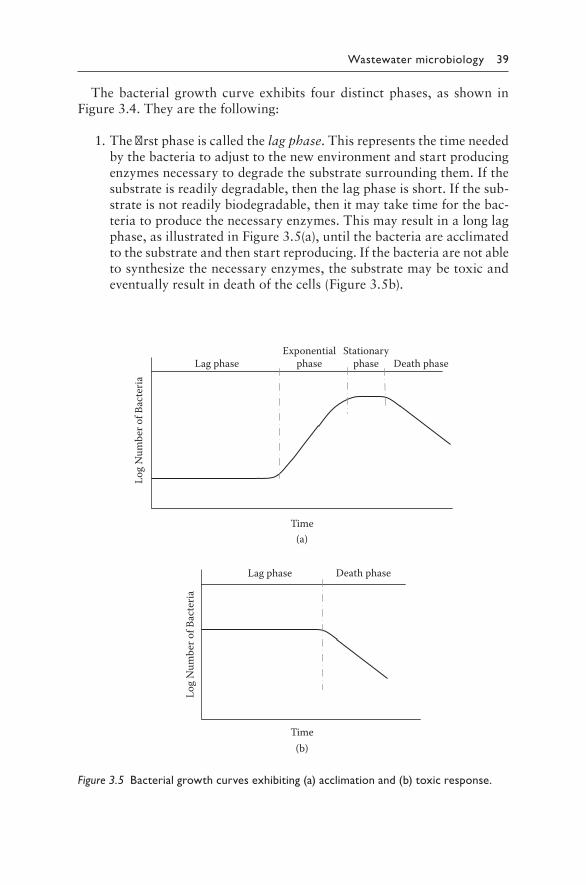
Wastewater microbiology 39
Thebacterial growth curve exhibits fourdistinctphases, as shown inFigure 3.4.Theyarethefollowing:
1.Thefirstphaseiscalledthelag phase.Thisrepresentsthetimeneededbythebacteriatoadjusttothenewenvironmentandstartproducingenzymesnecessarytodegradethesubstratesurroundingthem.Ifthesubstrateisreadilydegradable,thenthelagphaseisshort.Ifthesub-strateisnotreadilybiodegradable,thenitmaytaketimeforthebac-teriatoproducethenecessaryenzymes.Thismayresultinalonglagphase,asillustratedinFigure 3.5(a),untilthebacteriaareacclimatedtothesubstrateandthenstartreproducing.Ifthebacteriaarenotabletosynthesizethenecessaryenzymes,thesubstratemaybetoxicandeventuallyresultindeathofthecells(Figure 3.5b).
(a)
(b)Time
Log
Num
ber o
f Bac
teria
Lag phase Death phase
Time
Log
Num
ber o
f Bac
teria
Lag phaseExponential
phaseStationary
phase Death phase
Figure 3.5 Bacterial growth curves exhibiting (a) acclimation and (b) toxic response.
40 Fundamentals of wastewater treatment and engineering
2.After the lag phase comes the logarithmic or exponential growth phase. In thisphase, thepopulationdoublesat regular intervalsoftimeduetoabundanceofsubstrateandoptimalgrowthconditions.
3.Eventuallyasthesubstrateconcentrationdecreases,thegrowthratestartsdecreasingand thestationary phase isobserved.During thisphase,thegrowthrateequalsthedeathrate,resultinginadynamicequilibriumatwhichthereisnofurtherincreaseinpopulation.Thisphasecorrespondstoverylowsubstrateconcentration.
4.Thelastphaseiscalledtheendogenous decay ordeath phase,whenoneormorenutrientsorthesubstrateiscompletelyexhausted.Celldeathandlysisreleasessomesolubleorganicsthatareusedbysurviv-ingbacteriaforawhile.Thedeathratekeepsonincreasinguntilallbacterialcellsdieoff.
Mostbiologicalwastewater treatmentprocessesareoperatedsomewhereinbetweenthestationaryphaseandthedeathphase.Thisistrueforbio-logicalreactorsoperatedascontinuous-flowstirredtankreactors(CSTRs),sincethiscorrespondstoverylowsubstrateorbiochemicaloxygendemand(BOD)concentrationsinthereactorandeffluent.
3.2.3 Classification by carbon and energy requirement
Allcellsneedasourceofcarbonandasourceofenergytocarryoutcellsynthesis.Oneofthegoalsofwastewatertreatmentistoconvertboththecarbonandenergyofthewastewaterintomicrobialcells,whichcanthenberemovedfromwaterbysettlingorfiltration.Bacterialcellscanbedividedintotwobroadgroupsaccordingtocarbonandenergysources:
1.Heterotrophic—uses organic compounds as both their carbon andenergysource.Alargenumberofwastewaterbacteriaareheterotrophic.
2.Autotrophic—usesinorganiccompoundsascarbonsource(e.g.CO2,HCO3
–)andsunlightorinorganiccompoundsforenergy.Twotypesofautotrophsareofinterest:(a)PhotoautotrophsthatobtainenergyfromsunlightandcarbonfromCO2,and(b)Chemoautotrophsthatobtain energy fromoxidationof inorganic compounds and carbonfromCO2,e.g.nitrifyingbacteria—nitrosomonasandnitrobacter.
Thenitrifyingbacteriaareofgreatsignificanceinwastewatertreat-mentfornitrogenremoval.Thenitrifyingbacteriacarryoutthetwo-stepprocessofnitrification,whichresultsinconversionofammoniatonitritesinthefirststep,followedbyconversionofnitritestonitratesinthesecondstep.Thenitratesareconvertedtonitrogengasinasub-sequentstepcalleddenitrification.Thenitrificationreactionisgivenbelow:
Wastewater microbiology 41
nitrosomonas NH3+O2
______________▶ NO2–+energy (3.1)
nitrobacter NO2
–+O2______________▶ NO3
–+energy (3.2)
3.2.4 Classification by oxygen requirement
Bacteriacanbedivided intothefollowinggroupsbasedontheiroxygenrequirements:
1.Aerobic—requiresoxygenforgrowthandsurvival. 2.Anaerobic—grows in absence of oxygen. They cannot survive in
presenceofoxygen. 3.Facultative—cangrowbothinpresenceorabsenceofoxygen.E.g.,
Denitrifying bacteria are facultative anaerobes that grow underanoxicconditions.
3.2.5 Classification by temperature
Certaingroupsofbacteriagrowatspecificrangesoftemperature:
1.Cryophilic or psychrophilic—grows at temperatures below 20°C,usuallybetween12°Cand18°C.
2.Mesophilic—growsbetween25°Cand40°C,optimumat35°C. 3.Thermophilic—growsbetween50°Cand75°C,optimumat55°C.
Growthisnotlimitedtothesetemperaturerangesonly.Bacteriawillgrowatslowerratesatothertemperaturesandcansurviveoverawiderangeoftemperatures.Somecansurviveattemperaturesas lowas0°C.Iffrozenrapidly,bacteriacanbestoredforalongtimewithinsignificantdeathrates.BacteriareproducebybinaryfissionasillustratedinFigure 3.6.
3.2.6 Bacteria of significance
Bacteriaarethemostimportantgroupofmicroorganismsintheenviron-ment. The largest population of microorganisms present in water andwastewaterisbacteria.Someofthemarepathogenicandcausediseasesinhumansandanimals.Othergroupsofbacteriaareimportantinbio-logical wastewater treatment processes, natural purification processesin lakes and streams, anddecompositionoforganicmatter in soil andlandfills.Table 3.2presentssomesignificantgroupsofbacteriaandtheirfunctions.
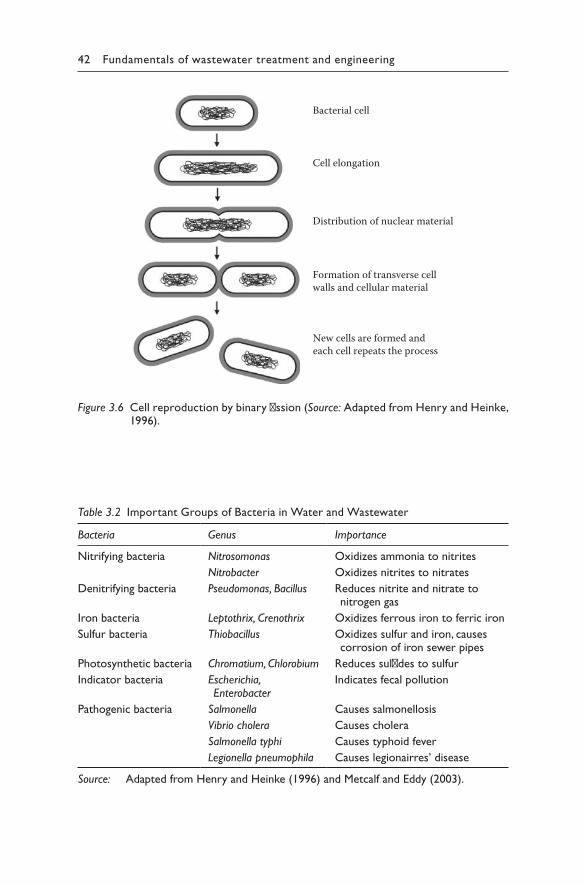
42 Fundamentals of wastewater treatment and engineering
Bacterial cell
Cell elongation
Distribution of nuclear material
Formation of transverse cellwalls and cellular material
New cells are formed andeach cell repeats the process
Figure 3.6 Cell reproduction by binary fission (Source: Adapted from Henry and Heinke, 1996).
Table 3.2 Important Groups of Bacteria in Water and Wastewater
Bacteria Genus Importance
Nitrifying bacteria Nitrosomonas Oxidizes ammonia to nitritesNitrobacter Oxidizes nitrites to nitrates
Denitrifying bacteria Pseudomonas, Bacillus Reduces nitrite and nitrate to nitrogen gas
Iron bacteria Leptothrix, Crenothrix Oxidizes ferrous iron to ferric ironSulfur bacteria Thiobacillus Oxidizes sulfur and iron, causes
corrosion of iron sewer pipesPhotosynthetic bacteria Chromatium, Chlorobium Reduces sulfides to sulfurIndicator bacteria Escherichia,
EnterobacterIndicates fecal pollution
Pathogenic bacteria Salmonella Causes salmonellosisVibrio cholera Causes choleraSalmonella typhi Causes typhoid feverLegionella pneumophila Causes legionairres’ disease
Source: Adapted from Henry and Heinke (1996) and Metcalf and Eddy (2003).
Wastewater microbiology 43
3.3 ARCHAEA
At the molecular level, both archaea and bacteria are structurally pro-karyotic.But theyare evolutionarilydistinct fromoneanother.Archaeawaspreviouslyknownasthearchaebacteria(Madiganetal.,2010).Theircell wall, cell material, and RNA composition are different from bacte-ria. Some archaea are important in anaerobic processes, e.g. methano-gensthatproducemethanegasfromdegradationoforganicmatterunderanaerobicconditions.Theseincludemethanobacterium, methanosarcina, and methanothrix,whichareimportantinanaerobicdigestionofsludge.Somearchaeaexhibithighlyspecializedmetabolicpathwaysandarefoundunderextremeenvironmentalconditions.Onedistinctgroupisthehyper-thermophiles.Theyareobligateanaerobesandhaveatemperatureoptimaabove 80°C. Examples are thermoproteus, sulfolobus, and methanopy-rus.Extremelyhalophilicarchaeaareanotherdiversegroupthatinhabitshighlysalineenvironments,suchassolarsaltevaporationponds.Examplesarehalobacteriumandhalococcus.
3.4 PROTOZOA
Protozoaaremostlyunicellulareukaryotesthatlackcellwalls.Theycanbefreelivingorparasitic.Mostareaerobicheterotrophs,someareaero-tolerantanaerobes,andafewareobligateanaerobes.Theyreproducebybinaryfission.Theycanrangeinsizefromafewtoseveralhundredµm.Theyareanorderofmagnitudelargerthanbacteria.Protozoaactaspol-ishersofeffluent frombiological treatmentprocessesby feedingonbac-teria,algae,andparticulateorganicmatter.Someprotozoahavehairlikestrands calledflagella,whichprovidemotilitybyawhiplikeaction, e.g.Giardia.Someflagellatedspeciesfeedonsolubleorganics.Free-swimmingprotozoahavecilia,whichareusedforpropulsionandgatheringoforganicmatter,e.g.Paramecium.
Anumberofprotozoaareimportantinwaterandwastewater,astheycauseentericdiseasesinhumansandanimals:
1.Amoeba—Theymovebyextendingtheircytoplasminsearchoffood.These extensions are called pseudopods or false feet (Figure 3.7).Theyarepathogenicandcauseameobicdysenteryinhumans.
2.Giardia lamblia—These are parasitic protozoa. They range in sizefrom8to18µmlongand5to15µmwide(HammerandHammer,2012).Insideahostbody,theGiardiacystreleasesatrophozoitethatfeeds,growsandreproduces,causingagastrointestinaldiseasecalledgiardiasis,whichcausescramps,diarrhea,andfatigueandcanbecome
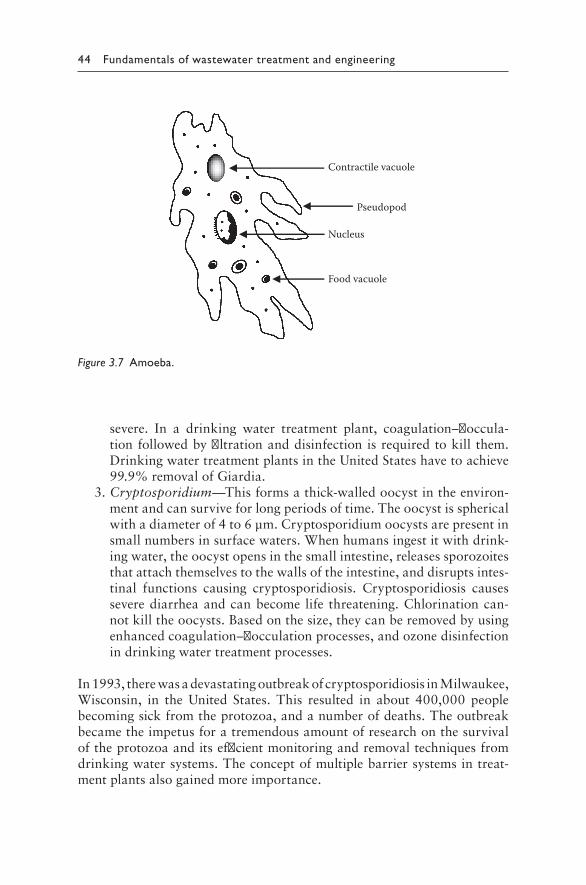
44 Fundamentals of wastewater treatment and engineering
severe. In a drinking water treatment plant, coagulation–floccula-tionfollowedbyfiltrationanddisinfectionisrequiredtokill them.DrinkingwatertreatmentplantsintheUnitedStateshavetoachieve99.9%removalofGiardia.
3.Cryptosporidium—Thisformsathick-walledoocystintheenviron-mentandcansurviveforlongperiodsoftime.Theoocystissphericalwithadiameterof4to6µm.Cryptosporidiumoocystsarepresentinsmallnumbersinsurfacewaters.Whenhumansingestitwithdrink-ingwater,theoocystopensinthesmallintestine,releasessporozoitesthatattachthemselvestothewallsoftheintestine,anddisruptsintes-tinal functions causing cryptosporidiosis. Cryptosporidiosis causesseverediarrheaandcanbecome life threatening.Chlorinationcan-notkilltheoocysts.Basedonthesize,theycanberemovedbyusingenhancedcoagulation–flocculationprocesses,andozonedisinfectionindrinkingwatertreatmentprocesses.
In1993,therewasadevastatingoutbreakofcryptosporidiosisinMilwaukee,Wisconsin, in the United States. This resulted in about 400,000 peoplebecomingsickfromtheprotozoa,andanumberofdeaths.Theoutbreakbecametheimpetusforatremendousamountofresearchonthesurvivaloftheprotozoaanditsefficientmonitoringandremovaltechniquesfromdrinkingwatersystems.Theconceptofmultiplebarriersystemsintreat-mentplantsalsogainedmoreimportance.
Contractile vacuole
Nucleus
Food vacuole
Pseudopod
Figure 3.7 Amoeba.
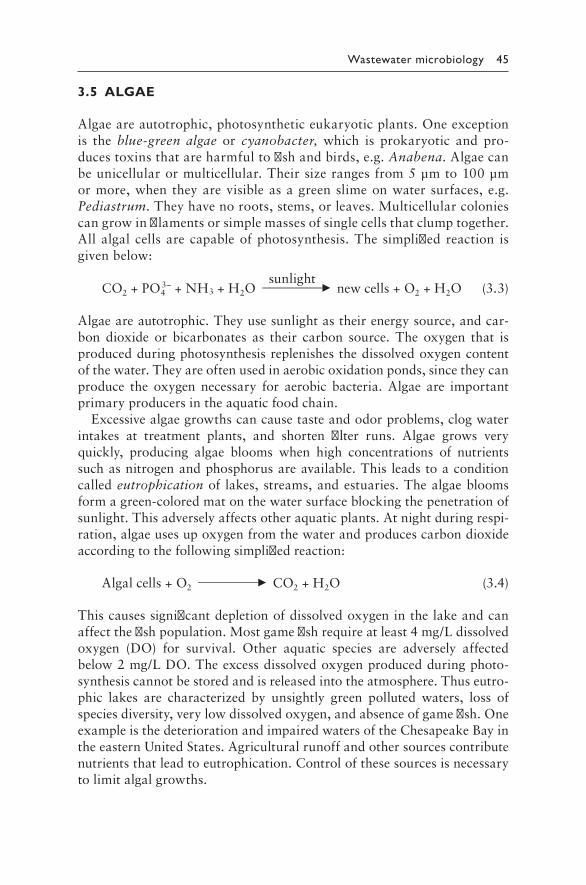
Wastewater microbiology 45
3.5 ALGAE
Algaeareautotrophic,photosyntheticeukaryoticplants.Oneexceptionis the blue-green algae or cyanobacter, which is prokaryotic and pro-ducestoxinsthatareharmfultofishandbirds,e.g.Anabena.Algaecanbeunicellularormulticellular.Theirsizerangesfrom5μmto100μmormore,whentheyarevisibleasagreenslimeonwatersurfaces,e.g.Pediastrum.Theyhavenoroots,stems,orleaves.Multicellularcoloniescangrowinfilamentsorsimplemassesofsinglecellsthatclumptogether.Allalgal cellsarecapableofphotosynthesis.The simplified reaction isgivenbelow: sunlight CO2+PO4
3–+NH3+H2O ________▶ newcells+O2+H2O (3.3)
Algaeareautotrophic.Theyusesunlightastheirenergysource,andcar-bon dioxide or bicarbonates as their carbon source. The oxygen that isproducedduringphotosynthesisreplenishesthedissolvedoxygencontentofthewater.Theyareoftenusedinaerobicoxidationponds,sincetheycanproduce the oxygen necessary for aerobic bacteria. Algae are importantprimaryproducersintheaquaticfoodchain.
Excessivealgaegrowthscancausetasteandodorproblems,clogwaterintakes at treatment plants, and shorten filter runs. Algae grows veryquickly, producing algae blooms when high concentrations of nutrientssuchasnitrogenandphosphorusareavailable.This leadstoaconditioncalledeutrophicationof lakes, streams,andestuaries.Thealgaebloomsformagreen-coloredmatonthewatersurfaceblockingthepenetrationofsunlight.Thisadverselyaffectsotheraquaticplants.Atnightduringrespi-ration,algaeusesupoxygenfromthewaterandproducescarbondioxideaccordingtothefollowingsimplifiedreaction:
Algalcells+O2________▶ CO2+H2O (3.4)
Thiscausessignificantdepletionofdissolvedoxygeninthelakeandcanaffectthefishpopulation.Mostgamefishrequireatleast4mg/Ldissolvedoxygen (DO) for survival. Other aquatic species are adversely affectedbelow2mg/LDO.Theexcessdissolvedoxygenproducedduringphoto-synthesiscannotbestoredandisreleasedintotheatmosphere.Thuseutro-phic lakes are characterized by unsightly green polluted waters, loss ofspeciesdiversity,verylowdissolvedoxygen,andabsenceofgamefish.OneexampleisthedeteriorationandimpairedwatersoftheChesapeakeBayintheeasternUnitedStates.Agriculturalrunoffandothersourcescontributenutrientsthatleadtoeutrophication.Controlofthesesourcesisnecessarytolimitalgalgrowths.
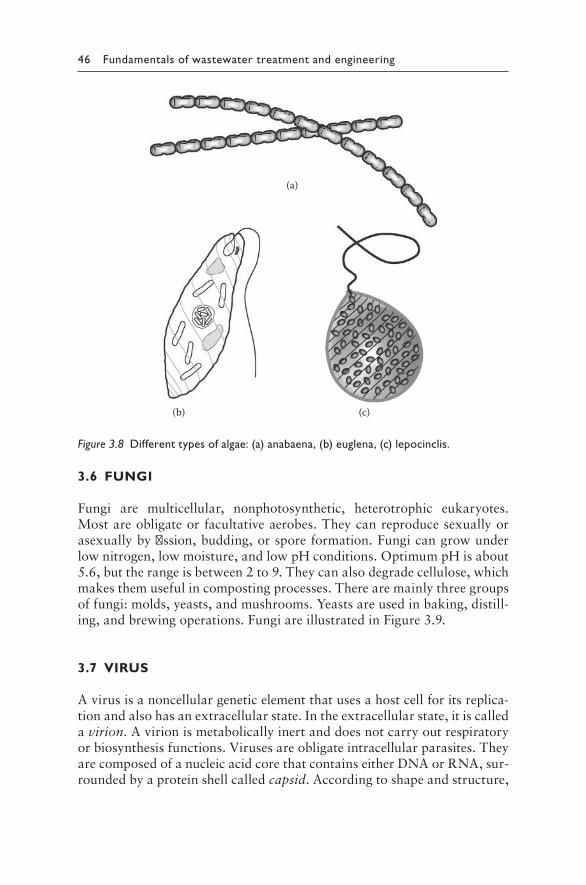
46 Fundamentals of wastewater treatment and engineering
3.6 FUNGI
Fungi are multicellular, nonphotosynthetic, heterotrophic eukaryotes.Mostareobligateorfacultativeaerobes.Theycanreproducesexuallyorasexuallybyfission,budding,orsporeformation.Fungicangrowunderlownitrogen,lowmoisture,andlowpHconditions.OptimumpHisabout5.6,buttherangeisbetween2to9.Theycanalsodegradecellulose,whichmakesthemusefulincompostingprocesses.Therearemainlythreegroupsoffungi:molds,yeasts,andmushrooms.Yeastsareusedinbaking,distill-ing,andbrewingoperations.FungiareillustratedinFigure3.9.
3.7 VIRUS
Avirusisanoncellulargeneticelementthatusesahostcellforitsreplica-tionandalsohasanextracellularstate.Intheextracellularstate,itiscalledavirion.Avirionismetabolicallyinertanddoesnotcarryoutrespiratoryorbiosynthesisfunctions.Virusesareobligateintracellularparasites.TheyarecomposedofanucleicacidcorethatcontainseitherDNAorRNA,sur-roundedbyaproteinshellcalledcapsid.Accordingtoshapeandstructure,
(a)
(b) (c)
Figure 3.8 Different types of algae: (a) anabaena, (b) euglena, (c) lepocinclis.
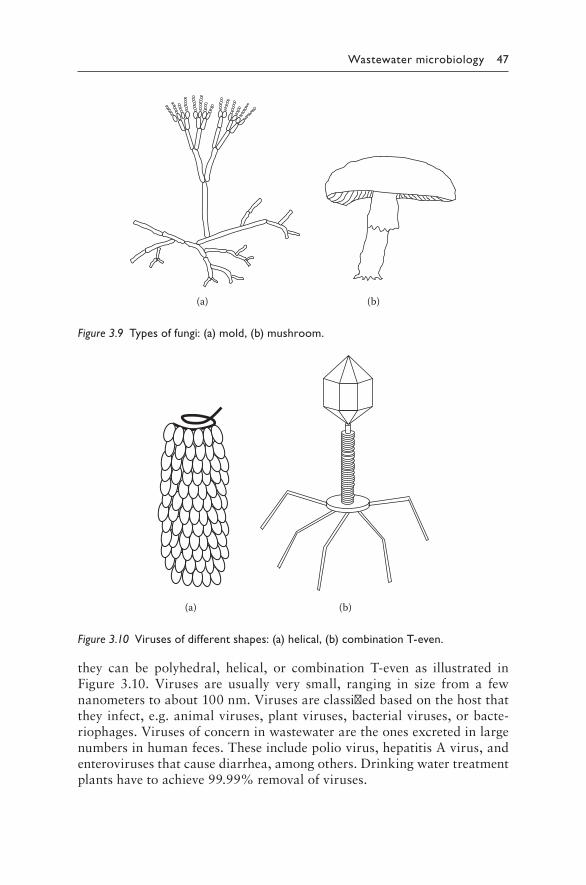
Wastewater microbiology 47
they can be polyhedral, helical, or combination T-even as illustrated inFigure 3.10. Viruses are usually very small, ranging in size from a fewnanometerstoabout100nm.Virusesareclassifiedbasedonthehostthattheyinfect,e.g.animalviruses,plantviruses,bacterialviruses,orbacte-riophages.Virusesofconcerninwastewateraretheonesexcretedinlargenumbersinhumanfeces.Theseincludepoliovirus,hepatitisAvirus,andenterovirusesthatcausediarrhea,amongothers.Drinkingwatertreatmentplantshavetoachieve99.99%removalofviruses.
(a) (b)
Figure 3.9 Types of fungi: (a) mold, (b) mushroom.
(a) (b)
Figure 3.10 Viruses of different shapes: (a) helical, (b) combination T-even.
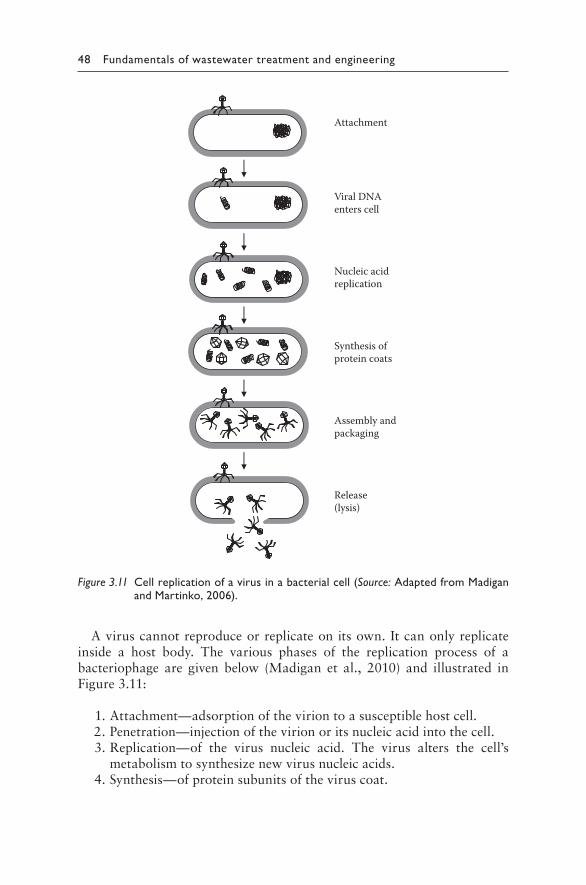
48 Fundamentals of wastewater treatment and engineering
Aviruscannotreproduceorreplicateonitsown.Itcanonlyreplicateinside a host body. The various phases of the replication process of abacteriophage are given below (Madigan et al., 2010) and illustrated inFigure 3.11:
1.Attachment—adsorptionoftheviriontoasusceptiblehostcell. 2.Penetration—injectionofthevirionoritsnucleicacidintothecell. 3.Replication—of the virus nucleic acid. The virus alters the cell’s
metabolismtosynthesizenewvirusnucleicacids. 4.Synthesis—ofproteinsubunitsoftheviruscoat.
Attachment
Viral DNA enters cell
Nucleic acid replication
Synthesis of protein coats
Assembly and packaging
Release (lysis)
Figure 3.11 Cell replication of a virus in a bacterial cell (Source: Adapted from Madigan and Martinko, 2006).
Wastewater microbiology 49
5.Assemblyandpackaging—ofproteinsubunitsandnucleicacidintonewvirusparticles.
6.Release—ofmaturenewvirusesfromthecellbylysisasthecellbreaksopen.
Foravirusinfectingbacteria,thewholereplicationprocesscanbecom-pletedin30to40minutes.
PROBLEMS
3.1 What are the differences between eukaryotes and prokaryotes?Explainwithdiagramsoftheircells.
3.2 Drawatypicalbacterialcellandlabelthedifferentparts.Mentionthefunctionsofthecytoplasmicmembrane,cytoplasm,andDNA.
3.3 Whatisthelogarithmicgrowthphase?Developamodeltocalculatethenumberofbacteria inthelogarithmicgrowthphaseassumingfirstorderkinetics.
3.4 Explaintheprocessofnitrificationwiththehelpofequations.Whattypesofbacteriaareinvolvedintheprocess?Namethem.
3.5 Writeshortnotesonalgae,protozoa,andvirus. 3.6 Conducta literature review tofindoutabout the lastwaterborne
diseaseoutbreakinyourcityorcountry.Whattypeofmicroorgan-ismwasresponsible,whatwere thereasonsfor theoutbreak,andwhatmeasuresweretakenforcontrolandfutureprevention?
3.7 What is cryptosporidium? Why is chlorine disinfection unable toremoveitfromdrinkingwatersupply?
3.8 Whatiseutrophication? 3.9 Whatare the steps in the replicationofabacteriophage?Explain
withthehelpofadiagram. 3.10 Arrangethefollowingmicroorganismsaccordingtosizeandpreda-
tionfromlargesttosmallest:bacteria,virus,protozoa,crustaceans.
REFERENCES
Hammer,M.J.,andHammerM.J.Jr.(2012)Water and Wastewater Technology.Seventhedition.Pearson-PrenticeHall,Inc.,NewJersey.
Henry, J. G., and Heinke, G.W. (1996) Environmental Science and Engineering.Secondedition.PrenticeHall,NewYork.
Madigan,M.,andMartinko,J.(2006)Brock Biology of Microorganisms.Eleventhedition.PrenticeHall,NewYork.
Madigan, M., Martinko, J., Stahl, D., and Clark, D. (2010) Brock Biology of Microorganisms.Thirteenthedition.PrenticeHall,NewYork.
Metcalf and Eddy, Inc. (2003) Wastewater Engineering: Treatment and Reuse.Fourthedition.McGraw-Hill,NewYork.

51
Chapter 4
Natural purification processes
4.1 IMPURITIES IN WATER
Awidevarietyofpollutantsarepresentinnaturalwaters.Theseincludesand,silt,clay,organicmatterfromdecayingvegetation,andproductsofchemical conversions, among others. Natural purification processes arecontinuallyactiveinstreamsandriverstoreducethelevelsofthepollutantstoacceptableornegligibleconcentrations.Theseprocessesincludedilution,sedimentation,filtration,heattransfer,andchemicalandbiologicalconver-sions.Thesenaturalpurificationmechanismsareslowandcanrestorethehealthofwaterbodiesoveraperiodoftime,dependingontheconcentra-tionofthepollutants.
Ashumanand industrialactivityhas increased, sohas theamountofpollutants discharged into the water bodies. Various types of industrialchemicals,fertilizers,andpesticidesendupinwater.Inmostcases,naturalpurificationprocessesbecomeinsufficienttoreducethelevelsofpollutants.Asaresult,thehealthofthewaterbodybecomesimpaired.Environmentalregulationsareintroducedandenforcedinanefforttoreducethepollutionofnaturalstreamsandrivers.
Engineeredsystemsareusedinwastewatertreatmentplantstoreducethepollutantconcentrationstoacceptablelevelspriortodischargetostreamsandrivers.Thesesystemsaredesignedbasedontheprinciplesofnaturalpurificationprocesses.Thedifferenceliesintheratesofreactionandcon-version. In treatmentplants,unitprocesses aredesigned toachieve con-versionswithin a shortperiodof time.For this reason, it is essential tounderstand the basic principles and kinetics of natural purification pro-cesses,aswellasquantificationofthepollutionstrengthofwastewater.
4.2 DILUTION
Dilutionisaprocesswherebytheconcentrationofpollutantsisreducedduetomixingofasmallvolumeofpollutedwaterwithalargebodyofwater,
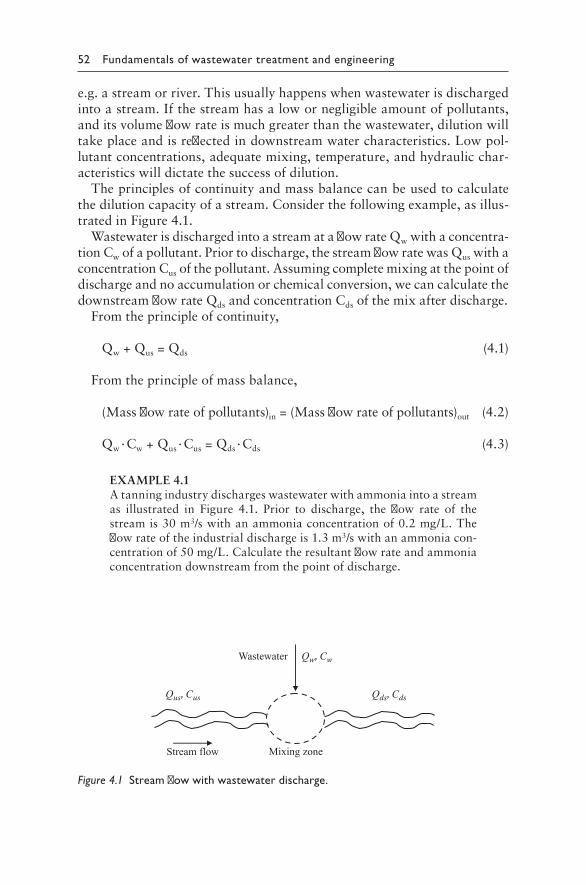
52 Fundamentals of wastewater treatment and engineering
e.g.astreamorriver.Thisusuallyhappenswhenwastewaterisdischargedintoastream.Ifthestreamhasalowornegligibleamountofpollutants,anditsvolumeflowrateismuchgreaterthanthewastewater,dilutionwilltakeplaceandisreflectedindownstreamwatercharacteristics.Lowpol-lutantconcentrations,adequatemixing,temperature,andhydraulicchar-acteristicswilldictatethesuccessofdilution.
Theprinciplesofcontinuityandmassbalancecanbeusedtocalculatethedilutioncapacityofastream.Considerthefollowingexample,asillus-tratedinFigure4.1.
WastewaterisdischargedintoastreamataflowrateQwwithaconcentra-tionCwofapollutant.Priortodischarge,thestreamflowratewasQuswithaconcentrationCusofthepollutant.Assumingcompletemixingatthepointofdischargeandnoaccumulationorchemicalconversion,wecancalculatethedownstreamflowrateQdsandconcentrationCdsofthemixafterdischarge.
Fromtheprincipleofcontinuity,
Qw+Qus=Qds (4.1)
Fromtheprincipleofmassbalance,
(Massflowrateofpollutants)in=(Massflowrateofpollutants)out (4.2)
Qw·Cw+Qus·Cus=Qds·Cds (4.3)
EXAMPLE4.1Atanningindustrydischargeswastewaterwithammoniaintoastreamas illustrated in Figure 4.1. Prior to discharge, the flow rate of thestreamis30m3/swithanammoniaconcentrationof0.2mg/L.Theflowrateoftheindustrialdischargeis1.3m3/swithanammoniacon-centrationof50mg/L.Calculatetheresultantflowrateandammoniaconcentrationdownstreamfromthepointofdischarge.
us, us ds, ds
w, w
Figure 4.1 Stream flow with wastewater discharge.
Natural purification processes 53
SOLUTION
Calculateresultantflowrateusingequationofcontinuity(equation4.1).
Qds=30m3/s+1.3m3/s
Qds=31.3m3/s
Write a mass balance between upstream and downstream points(equation4.2).
(Massflowrateofammonia)in=(Massflowrateofammonia)out
(30m3/s×0.2mg/L)+(1.3m3/s×50mg/L)=31.3m3/s×Cds
Cds=2.27mg/L
4.3 SEDIMENTATION
Sedimentation isaprocess that involves theremovalof suspendedsolidsfromawaterbodybysettlingthemout.Thesizeofthesolidparticlesplaysamajorroleintheefficiencyofsedimentation.Largerparticlessettleoutquickly,whereassmallerparticlesmayremainsuspendedforlongerperiodsand eventually settleout. Streamcharacteristics, suchasflow rates, beddepth,androughness,alsoaffecttheratesofsedimentation.
Excessiveturbulenceorfloodingcancauseresuspensionofdepositedsol-ids.Thiscantransfersolidsdepositsfromonelocationtoanother.
4.4 MICROBIAL DEGRADATION
Wastewaterdischargedfrommunicipalsourcescontainsalargeamountoforganicmatter.Whenuntreatedwastewaterisdischargedintostreamsandrivers,theorganicmatterisusedasfoodbybacteria,protozoa,andothermicroorganismsinthewaterbodies.Aerobicmicroorganismsuseoxygenduringaerobicoxidationoforganicmatter.Thiscreatesasubstantialoxy-gendemandinthewaterbodyandcanlowerthedissolvedoxygenconcen-trationssignificantly.Theoxygeninwaterbodiesisreplenishedbytransferfromtheatmosphere.
4.5 MEASUREMENT OF ORGANIC MATTER
Anumberofdifferentmethodscanbeusedtomeasuretheorganiccon-tentofwastewater.Thecommonlyusedtechniquesinclude(1)biochemical
54 Fundamentals of wastewater treatment and engineering
oxygendemand(BOD),(2)chemicaloxygendemand(COD),and(3)totalorganiccarbon(TOC).
BOD is themostwidelyusedparameter formeasuringtheamountofbiodegradableorganicmatterpresentinawastewater.StandardBODtestresultsareobtainedafterfivedays.Thisisdiscussedinmoredetailinthefollowingsection.
CODisdefinedastheoxygenequivalentoforganicmatterthatcanbeoxidizedbyastrongchemicaloxidizerinanacidicmedium.CODmeasuresbothbiodegradableandnonbiodegradableorganicmatter.Theresultscanbeobtainedinafewhours.
TheTOC testmeasuresthetotalorganiccarbonthatcanbeoxidizedtocarbondioxideinthepresenceofacatalyst.Thetestcanbeperformedrapidlyandresultsobtainedinashortperiodoftime.
4.5.1 Biochemical oxygen demand (BOD)
TheBODisusedasameasureofthepollutionpotentialofwastewater.Itgivesusanideaoftheamountofbiodegradableorganicmatterthatispres-entinawastewater.BODisdefinedastheamountofoxygenutilizedbyamixedpopulationofmicroorganismsduringaerobicoxidationoforganicmatteratacontrolledtemperatureof20°Cforaspecifiedtime.
Theoreticallyitwouldtakeaninfinitelylongtimeforthemicroorgan-isms to degrade all the organic matter present in the sample. The BODvalueistimedependent.Withina20dperiod,theoxidationofthecarbo-naceousorganicmatterisabout95%complete.Inthewastewaterindustry,theBOD5inmg/LofO2isusedasastandardvaluethatisobtainedfromaBODtestconductedforfivedays.About60%to70%oftheorganicmatterisoxidizedafterfivedays.AmeasureofthetotalamountoforganicmatterpresentinthesampleisobtainedfromtheultimateBOD,orBODult.
If thewastewater containsproteins andothernitrogenousmatter, thenitrifyingbacteriawillalsoexertameasurabledemandaftersixtosevendays.Thedelayinexhibitionofthenitrogenousoxygendemand(NOD)isduetotheslowgrowthrateofthenitrifyingbacteria,ascomparedwiththegrowthrateoftheheterotrophicbacteriaresponsibleforexertionofthecarbonaceousoxygendemandtypicallyknownascarbonaceousBODorsimplyBOD.Figure 4.2illustratestypicalBODandNODcurves.
4.5.1.1 BOD kinetics
The rate at which organic matter is utilized by microorganisms can beassumedtobeafirstorderreaction(Peavyetal.,1985).Inotherwords,therateatwhichorganicmatterisutilizedisproportionaltotheamountoforganicmatterremaining.Thiscanbeexpressedasfollows:
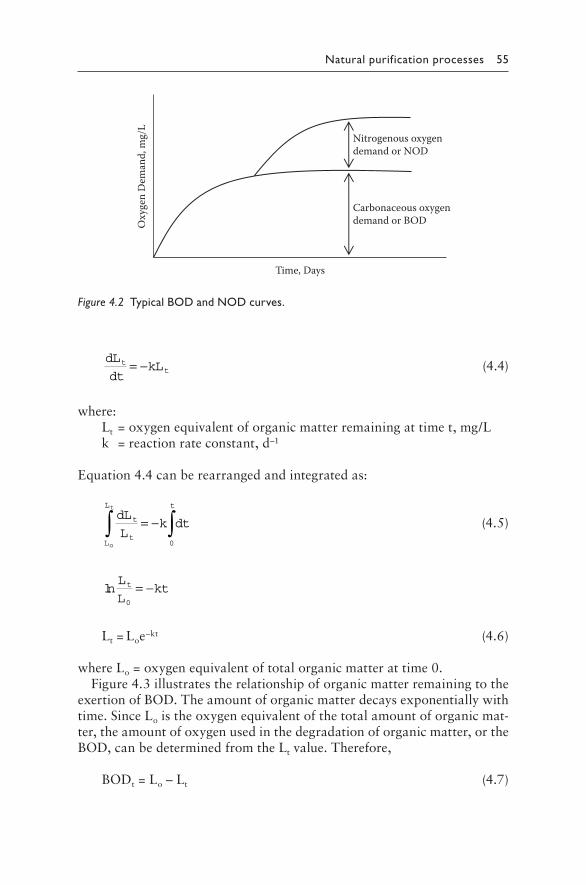
Natural purification processes 55
dL
dtkLt
t= − (4.4)
where:Lt=oxygenequivalentoforganicmatterremainingattimet,mg/Lk=reactionrateconstant,d–1
Equation4.4canberearrangedandintegratedas:
L
L
t
t
t
o
t
dL
Lk dt∫ ∫= −0
(4.5)
lnL
Lktt
0
= −
Lt=Loe–kt (4.6)
whereLo=oxygenequivalentoftotalorganicmatterattime0.Figure 4.3illustratestherelationshipoforganicmatterremainingtothe
exertionofBOD.Theamountoforganicmatterdecaysexponentiallywithtime.SinceLoistheoxygenequivalentofthetotalamountoforganicmat-ter,theamountofoxygenusedinthedegradationoforganicmatter,ortheBOD,canbedeterminedfromtheLtvalue.Therefore,
BODt=Lo–Lt (4.7)
Time, Days
Oxy
gen
Dem
and,
mg/
LNitrogenous oxygendemand or NOD
Carbonaceous oxygendemand or BOD
Figure 4.2 Typical BOD and NOD curves.
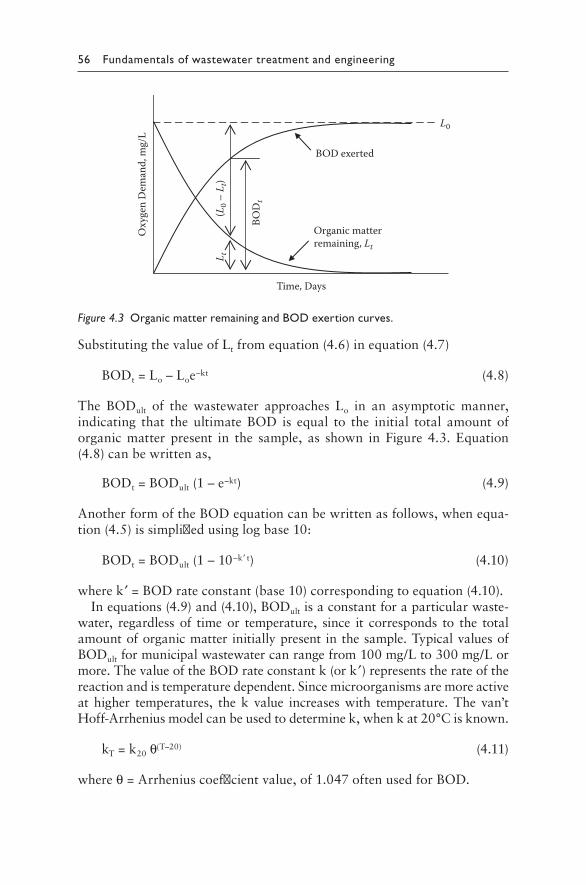
56 Fundamentals of wastewater treatment and engineering
SubstitutingthevalueofLtfromequation(4.6)inequation(4.7)
BODt=Lo–Loe–kt (4.8)
The BODult of the wastewater approaches Lo in an asymptotic manner,indicating that the ultimateBOD is equal to the initial total amount oforganic matter present in the sample, as shown in Figure 4.3. Equation(4.8)canbewrittenas,
BODt=BODult(1–e–kt) (4.9)
AnotherformoftheBODequationcanbewrittenasfollows,whenequa-tion(4.5)issimplifiedusinglogbase10:
BODt=BODult(1–10–k ′t) (4.10)
wherek′=BODrateconstant(base10)correspondingtoequation(4.10).Inequations(4.9)and(4.10),BODultisaconstantforaparticularwaste-
water, regardless of timeor temperature, since it corresponds to the totalamountoforganicmatterinitiallypresentinthesample.TypicalvaluesofBODultformunicipalwastewatercanrangefrom100mg/Lto300mg/Lormore.ThevalueoftheBODrateconstantk(ork′)representstherateofthereactionandistemperaturedependent.Sincemicroorganismsaremoreactiveat higher temperatures, the k value increaseswith temperature.The van’tHoff-Arrheniusmodelcanbeusedtodeterminek,whenkat20°Cisknown.
kT=k20θ(T–20) (4.11)
whereθ=Arrheniuscoefficientvalue,of1.047oftenusedforBOD.
Time, Days
Oxy
gen
Dem
and,
mg/
LL0
BOD exerted
Organic matterremaining, Lt
BODt
L t(L
0 – L
t)
Figure 4.3 Organic matter remaining and BOD exertion curves.
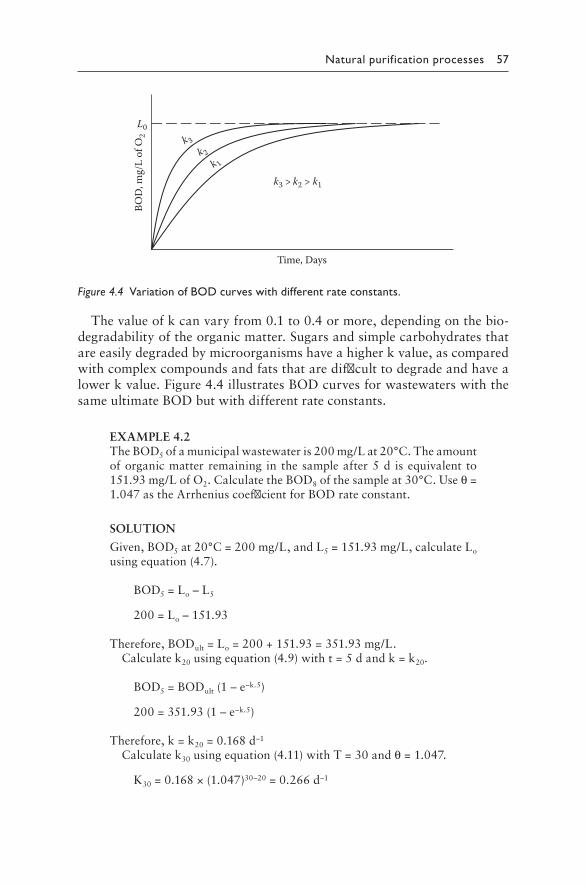
Natural purification processes 57
Thevalueofkcanvaryfrom0.1to0.4ormore,dependingonthebio-degradabilityoftheorganicmatter.Sugarsandsimplecarbohydratesthatareeasilydegradedbymicroorganismshaveahigherkvalue,ascomparedwithcomplexcompoundsandfatsthataredifficulttodegradeandhavealowerkvalue.Figure 4.4illustratesBODcurvesforwastewaterswiththesameultimateBODbutwithdifferentrateconstants.
EXAMPLE4.2TheBOD5ofamunicipalwastewateris200mg/Lat20°C.Theamountoforganicmatterremaining in thesampleafter5d isequivalent to151.93mg/LofO2.CalculatetheBOD8ofthesampleat30°C.Useθ=1.047astheArrheniuscoefficientforBODrateconstant.
SOLUTION
Given,BOD5at20°C=200mg/L,andL5=151.93mg/L,calculateLousingequation(4.7).
BOD5=Lo–L5
200=Lo–151.93
Therefore,BODult=Lo=200+151.93=351.93mg/L.Calculatek20usingequation(4.9)witht=5dandk=k20.
BOD5=BODult(1–e–k.5)
200=351.93(1–e–k.5)
Therefore,k=k20=0.168d–1
Calculatek30usingequation(4.11)withT=30andθ=1.047.
K30=0.168×(1.047)30–20=0.266d–1
Time, Days
BOD
, mg/
L of
O2
L0
k 3 k 2
k3 > k2 > k1 k 1
Figure 4.4 Variation of BOD curves with different rate constants.
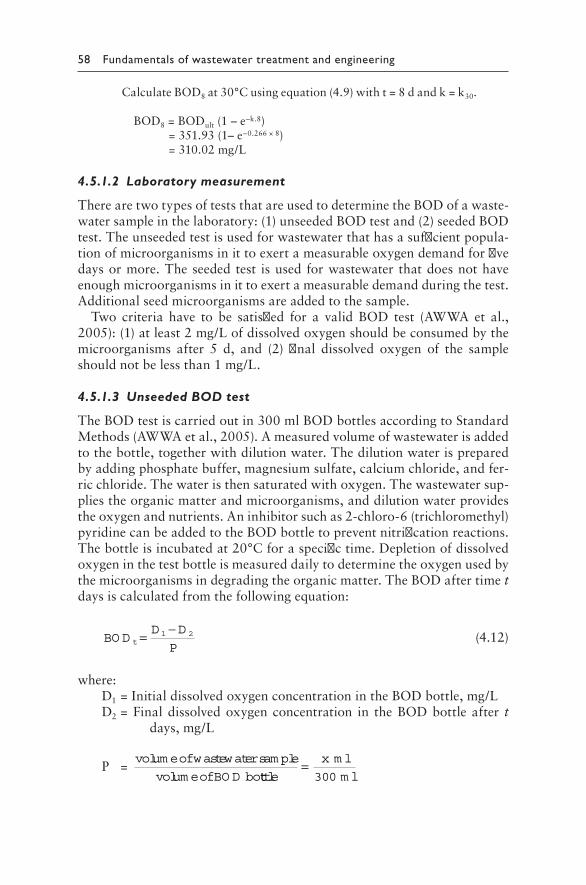
58 Fundamentals of wastewater treatment and engineering
CalculateBOD8at30°Cusingequation(4.9)witht=8dandk=k30.
BOD8=BODult(1–e–k.8) =351.93(1–e–0.266×8) =310.02mg/L
4.5.1.2 Laboratory measurement
TherearetwotypesofteststhatareusedtodeterminetheBODofawaste-watersampleinthelaboratory:(1)unseededBODtestand(2)seededBODtest.Theunseededtestisusedforwastewaterthathasasufficientpopula-tionofmicroorganismsinittoexertameasurableoxygendemandforfivedaysormore.Theseededtest isusedforwastewater thatdoesnothaveenoughmicroorganismsinittoexertameasurabledemandduringthetest.Additionalseedmicroorganismsareaddedtothesample.
Two criteria have to be satisfied for a valid BOD test (AWWA et al.,2005):(1)atleast2mg/Lofdissolvedoxygenshouldbeconsumedbythemicroorganisms after 5 d, and (2) final dissolved oxygen of the sampleshouldnotbelessthan1mg/L.
4.5.1.3 Unseeded BOD test
TheBODtestiscarriedoutin300mlBODbottlesaccordingtoStandardMethods(AWWAetal.,2005).Ameasuredvolumeofwastewaterisaddedtothebottle,togetherwithdilutionwater.Thedilutionwaterispreparedbyaddingphosphatebuffer,magnesiumsulfate,calciumchloride,andfer-ricchloride.Thewateristhensaturatedwithoxygen.Thewastewatersup-pliestheorganicmatterandmicroorganisms,anddilutionwaterprovidestheoxygenandnutrients.Aninhibitorsuchas2-chloro-6(trichloromethyl)pyridinecanbeaddedtotheBODbottletopreventnitrificationreactions.Thebottleisincubatedat20°Cforaspecifictime.Depletionofdissolvedoxygeninthetestbottleismeasureddailytodeterminetheoxygenusedbythemicroorganismsindegradingtheorganicmatter.TheBODaftertimetdaysiscalculatedfromthefollowingequation:
BO DD D
Pt= −1 2 (4.12)
where:D1=InitialdissolvedoxygenconcentrationintheBODbottle,mg/LD2=Finaldissolvedoxygenconcentration in theBODbottleafter t
days,mg/L
P=volum eofwastewatersam ple
volum eofBO D botttle= x m l
m l300
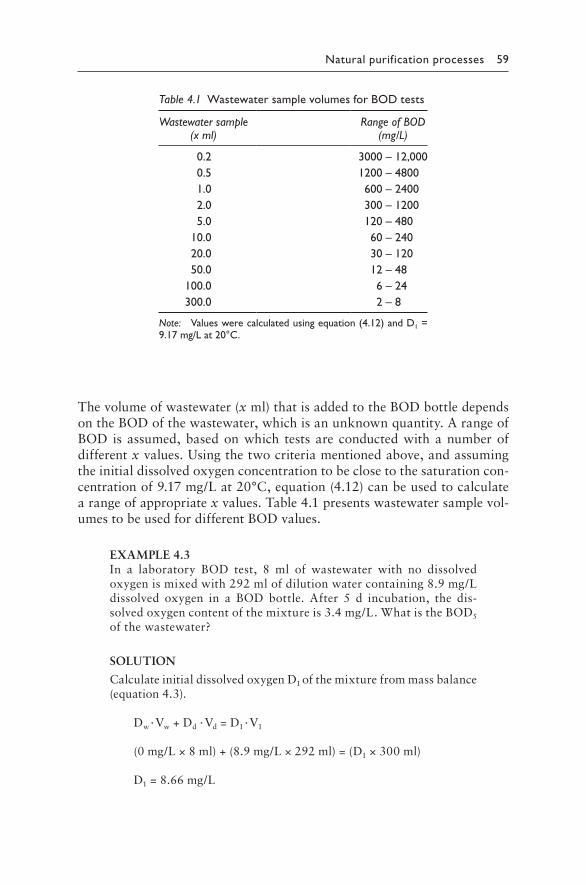
Natural purification processes 59
Thevolumeofwastewater(xml)thatisaddedtotheBODbottledependsontheBODofthewastewater,whichisanunknownquantity.ArangeofBOD isassumed,basedonwhich testsare conductedwithanumberofdifferentxvalues.Usingthetwocriteriamentionedabove,andassumingtheinitialdissolvedoxygenconcentrationtobeclosetothesaturationcon-centrationof9.17mg/Lat20°C,equation(4.12)canbeusedtocalculatearangeofappropriatexvalues.Table 4.1presentswastewatersamplevol-umestobeusedfordifferentBODvalues.
EXAMPLE4.3In a laboratory BOD test, 8 ml of wastewater with no dissolvedoxygenismixedwith292mlofdilutionwatercontaining8.9mg/Ldissolved oxygen in a BOD bottle. After 5 d incubation, the dis-solvedoxygencontentofthemixtureis3.4mg/L.WhatistheBOD5ofthewastewater?
SOLUTION
CalculateinitialdissolvedoxygenD1ofthemixturefrommassbalance(equation4.3).
Dw·Vw+Dd·Vd=D1·V1
(0mg/L×8ml)+(8.9mg/L×292ml)=(D1×300ml)
D1=8.66mg/L
Table 4.1 Wastewater sample volumes for BOD tests
Wastewater sample(x ml)
Range of BOD(mg/L)
0.2 3000 – 12,0000.5 1200 – 48001.0 600 – 24002.0 300 – 12005.0 120 – 480
10.0 60 – 24020.0 30 – 12050.0 12 – 48
100.0 6 – 24300.0 2 – 8
Note: Values were calculated using equation (4.12) and D1 = 9.17 mg/L at 20°C.
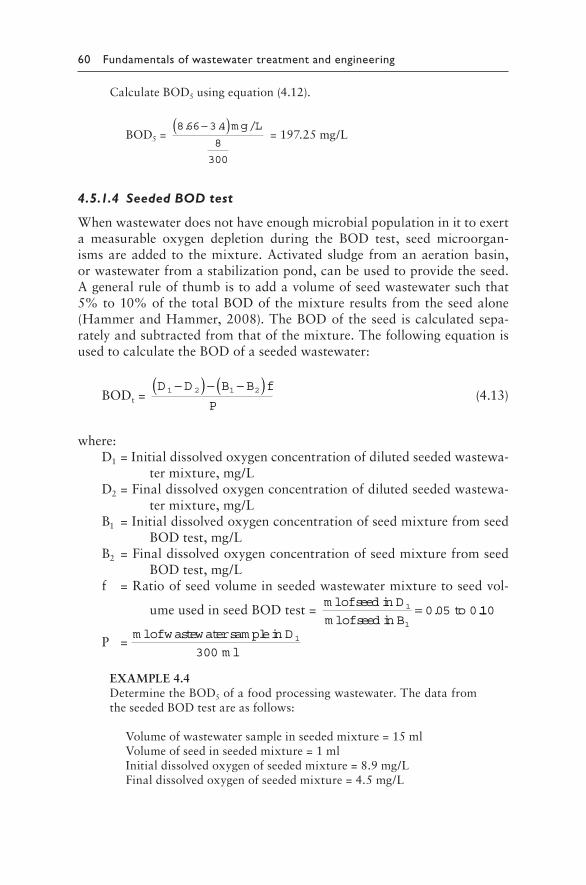
60 Fundamentals of wastewater treatment and engineering
CalculateBOD5usingequation(4.12).
BOD5=8 66 3 4
8
300
. . /−( )m g L=197.25mg/L
4.5.1.4 Seeded BOD test
Whenwastewaterdoesnothaveenoughmicrobialpopulationinittoexerta measurable oxygen depletion during the BOD test, seed microorgan-ismsareadded to themixture.Activatedsludge fromanaerationbasin,orwastewaterfromastabilizationpond,canbeusedtoprovidetheseed.Ageneralruleofthumbistoaddavolumeofseedwastewatersuchthat5%to10%ofthetotalBODofthemixtureresultsfromtheseedalone(HammerandHammer,2008).TheBODoftheseed iscalculatedsepa-ratelyandsubtractedfromthatofthemixture.ThefollowingequationisusedtocalculatetheBODofaseededwastewater:
BODt=D D B B f
P1 2 1 2−( ) − −( )
(4.13)
where:D1=Initialdissolvedoxygenconcentrationofdilutedseededwastewa-
termixture,mg/LD2=Finaldissolvedoxygenconcentrationofdilutedseededwastewa-
termixture,mg/LB1=Initialdissolvedoxygenconcentrationofseedmixturefromseed
BODtest,mg/LB2=Finaldissolvedoxygenconcentrationofseedmixturefromseed
BODtest,mg/Lf=Ratioofseedvolumeinseededwastewatermixturetoseedvol-
umeusedinseedBODtest=m lofseed in D
m lofseed in B1
1
= 0 05 0. .to 110
P=m lofwastewatersam plein D
m l1
300
EXAMPLE4.4DeterminetheBOD5ofafoodprocessingwastewater.ThedatafromtheseededBODtestareasfollows:
Volumeofwastewatersampleinseededmixture=15mlVolumeofseedinseededmixture=1mlInitialdissolvedoxygenofseededmixture=8.9mg/LFinaldissolvedoxygenofseededmixture=4.5mg/L
Natural purification processes 61
ForBODtestforseedconductedseparately:
Volumeofseed=10mlInitialdissolvedoxygen=8.7mg/LFinaldissolvedoxygen=5.1mg/L
SOLUTION
f=(1ml)/(10ml)=0.1
P= 15300
BOD5=8 9 4 5 8 7 5 1 0 1
15
300
. . . . .−( ) − −( ) ×=80.8mg/L
4.5.1.5 Determination of k and Lo
Thevaluesof theconstantskandLoorBODultcanbedeterminedfromaseriesofBODmeasurements.Anumberoftechniquescanbeused,e.g.(1)Thomas’s graphicalmethod (Droste, 1997;Thomas,1950); (2)Leastsquares method (Metcalf and Eddy, 2003; Moore et al., 1950); and (3)Fujimotomethod(Fujimoto,1964),amongothers.
4.5.1.6 Thomas’s graphical method
ABODtestisconductedfor7to10d,anddailymeasurementsaretaken.Foreachday,BODand(time/BOD)1/3arecalculated.Aplotof(time/BOD)1/3versustimeismade,andthebestfitlineisdrawn.Thebestfitlinehasaslope(S)andintercept(I).Theslopeandinterceptvaluesareusedtocalculatek(base10)andLofromthefollowingrelationships.Thederivationsforequa-tions(4.14)and(4.15)areprovidedelsewhere(Droste,1997;Thomas,1950).
kS
I= 2 61. (4.14)
Lo=1
2 3 3. kI (4.15)
Thisisanapproximatemethod.ItisnotvalidforBOD>0.9Lo,orafter90%oftheBODhasbeenexerted.
62 Fundamentals of wastewater treatment and engineering
4.5.2 Theoretical oxygen demand
Thetheoreticaloxygendemand(ThOD)foracompoundorsubstancecanbedetermined fromthechemicaloxidationreactionsof thatcompound.Ifthesubstanceisacomplexofcarbohydratesandproteins,thenthetotalThODisthesumofthecarbonaceous ThODandthenitrogenous ThOD.Thecarbonaceous ThOD isequivalenttotheBODultofthesubstance.Thecalculationsareillustratedinthefollowingexample.
EXAMPLE4.5Awastewatercontains250mg/Lofglucose(C6H12O6)and60mg/LofNH3-N.CalculatethetotalThODforthewastewater.Atomicweights:C12,H1,O16.
Underanaerobicconditions,glucoseisconvertedtocarbondioxideandmethane.
C6H12O6→CO2+CH4
Methaneundergoesfurtheroxidationtocarbondioxideandwater.
CH4+O2→CO2+H2O
SOLUTION
Addingthetwochemicalreactionsandbalancingtheresultantreaction,
C6H12O6+6O2→6CO2+6H2O
Accordingtothisreaction,6molesofO2arerequiredtocompletelyoxidizeeachmoleofglucose.
MolecularwtofC6H12O6=(12×6)+(1×12)+(16×6)=180g/molMolecularwtofO2=16×2=32g/mol
Carbonaceous ThOD
= × ×2506 32
12 62
6 12 6
m g L H Om olO
m olC H O
g O/ C6
22
2
6 12 6
1000
1
180
m olO
m g
g
m ol C H O
g m ol
g
/
×
× ×11000 m g
=266.67mg/L=BODult
Nitrificationreaction(balanced): NH3–N+2O2→NO3––N+H++H2O
Natural purification processes 63
Accordingtothisreaction,2molesofO2arerequiredtocompletelyoxidizeeachmoleofNH3–N.Note,concentrationofNH3isgivenintermsofN.
Nitrogenous ThOD
= − ×−
×602 322
3
2m g L Nm olO
m olN H N
g O
m ol/ N H 3
OO
m g
g
m olN H N
g N m ol
g
2
3
1000
1
14 1000/
×
× − ×mm g
=274.29mg/L
Total ThOD=CarbonaceousThOD+NitrogenousThOD
=266.67mg/L+274.29mg/L=540.96mg/L
4.6 DISSOLVED OXYGEN BALANCE
Oneofthemostimportantparametersformaintainingahealthyecologyofnaturalstreamsandriversisthedissolvedoxygen(DO)concentration.Mostaquaticplantsandanimals requireaminimumconcentrationof2mg/LDOtosurvive.Gamefishandotherhigherlife-formsrequire4mg/Lormoreforsurvival(Peavyetal.,1985).
When wastewater with a high BOD is discharged into a stream, dis-solvedoxygenfromthewaterisusedupbythemicroorganismsindegrada-tionofBODororganicmatter.ThisresultsinadropinDOconcentrationof the stream. The amount of oxygen that can be dissolved in water atagiventemperatureisdefinedasitsequilibriumorsaturationconcentra-tion, or solubility. This can be calculated using Henry’s law (MihelcicandZimmerman,2010).Equilibrium concentrationsof oxygen inwateratvarioustemperaturesandsalinityvaluesareprovidedinTableA.2(intheAppendix).ThedifferencebetweenthesaturationDO(DOsat)andthemeasuredactualstreamDOconcentration(DOstream)iscalledthedissolved oxygen deficit(D).
D=DOsat–DOstream (4.16)
AtequilibriumDOsatisconstant,sotherateofchangeofdeficitdD
dt
is
proportionaltotherateofchangeofDOofthestream.TherateatwhichdissolvedoxygendecreasesisalsoproportionaltotherateatwhichBODisexerted.Thus,wecanobtainthefollowingrelationship(Peavyetal.,1985):

64 Fundamentals of wastewater treatment and engineering
rD=k1Lt (4.17)
where:rD=rateofchangeofdeficitduetooxygenutilizationk1=BODrateconstantLt=organicmatterremainingaftertimet
The natural process of replenishment of the dissolved oxygen is calledreaeration,whichistherateatwhichoxygenisresuppliedfromtheatmo-sphere. The dissolved oxygen deficit is the driving force for reaeration.Therateofreaerationincreasesastheconcentrationofdissolvedoxygendecreases.Therateofreaeration(rR)isafirstorderreactionwithrespecttotheoxygendeficit(D).Thiscanbewrittenasfollows:
rR=–k2D (4.18)
where:k2=reaerationrateconstant.
Ifalgae ispresent in thewater, itcanreplenishthedissolvedoxygen inthe water in presence of sunlight, as it produces oxygen during photo-synthesis. Excessive algal growths sometimes outweigh these benefits,sinceitcanleadtoeutrophicationasexplainedinChapter3.Excessdis-solvedoxygencannotbe stored in thewater for futureuseandusuallyescapes to the atmospheredue to turbulence andwind action.Also, inabsenceofsunlightespeciallyatnight,algaeusedissolvedoxygenfromthestreamduringrespiration.Thiscanleadtosignificantoxygendeficitsinthestream.
4.6.1 Dissolved oxygen sag curve
When a wastewater with a significant amount of organic matter is dis-charged into a streamor river, thedissolvedoxygen level decreases anddropstoaminimumvalue.Asreaerationslowlyreplenishesthedissolvedoxygen,overtimeandwithdistance,thestreamDOlevelcomesbacktopredischargeconcentration.ThisisillustratedinFigure 4.5andisknownas thedissolvedoxygen sag curve. Streeter andPhelpsdevelopedoneoftheearliestmodelsofthedissolvedoxygensagcurvein1925.Theirbasicmodelwillbediscussedhere,whichpredictedchangesinthedeficitasafunctionofBODexertionandstreamreaeration.
According to the model, the rate of change in deficit is a function ofoxygendepletionduetoBODexertionandstreamreaeration.Thiscanbeexpressedmathematicallyasfollows:
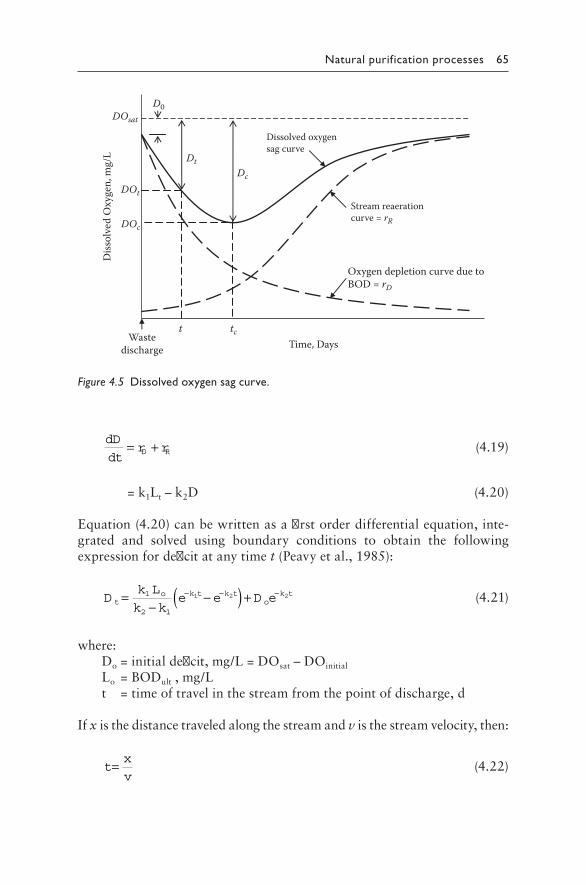
Natural purification processes 65
dD
dtr rD R= + (4.19)
=k1Lt–k2D (4.20)
Equation(4.20)canbewrittenasafirstorderdifferentialequation,inte-grated and solved using boundary conditions to obtain the followingexpressionfordeficitatanytimet (Peavyetal.,1985):
Dk L
k ke e D et
o k t k to
k t=−
−( ) +− − −1
2 1
1 2 2 (4.21)
where:Do=initialdeficit,mg/L=DOsat–DOinitial
Lo=BODult,mg/Lt=timeoftravelinthestreamfromthepointofdischarge,d
Ifxisthedistancetraveledalongthestreamandvisthestreamvelocity,then:
tx
v= (4.22)
Wastedischarge Time, Days
Diss
olve
d O
xyge
n, m
g/L
DOc
DOt
t tc
Dc
Dt
DOsat
D0
Oxygen depletion curve due toBOD = rD
Stream reaerationcurve = rR
Dissolved oxygensag curve
Figure 4.5 Dissolved oxygen sag curve.
66 Fundamentals of wastewater treatment and engineering
4.6.1.1 Critical points
Thelowestpointontheoxygensagcurve,wherethedeficit isthegreat-est, iscalledthecritical deficit Dc(Figure 4.5).Thispointrepresentsthemaximumimpactofthewastedischargeonthedissolvedoxygencontentofthestream.IftheBODofthewasteistoohigh,itmayresultinadeficitthatcausesanaerobicconditionsinthestream,i.e.DOlevelgoestozero.Thetimetakentoreachthecriticaldeficitiscalledcritical time tc,andthecorrespondingdistancecritical distance xc.Itisimperativetodeterminethedeficitatthecriticallocation.Ifstandardsaremetatthislocation,theywillbemetatotherlocationstoo.Equation(4.21)isdifferentiatedwithrespecttotime,settozerosinceDcismaximumattc,andsimplifiedtoobtain
tk k
k
kD
k k
k Lc o
o
=−
− −
1
12 1
2
1
2 1
1
ln
(4.23)
Anexpressionforcriticaldeficitcanbewrittenintermsofcriticaltimeasfollows:
Dk
kL ec o
k tc= −1
2
1 (4.24)
CriticalDOconcentration,DOc=DOsat–Dc (4.25)
DOConcentrationatanytimet,DOt=DOsat–Dt (4.26)
Equations (4.21) to (4.26)canbeused todetermine thedeficitsanddis-solvedoxygen concentrations along a stream followingwaste discharge,andtheoxygensagcurvecanbeproduced.Thisisillustratedinthefollow-ingexample.
EXAMPLE4.6Anindustrialprocessdischargesitseffluentintoastream.Itisdesiredtodeterminetheeffectsofthewastedischargeonthedissolvedoxygenconcentrationofthestream.k1at20°Cis0.23d–1,andk2at20°Cis0.43d–1.Thecharacteristicsofthestreamandindustrialwastewateraregivenbelow.
Characteristics Stream Industrial wastewater
Flow rate, m3/s 6.5 0.5Temperature, °C 19.2 25.0Dissolved oxygen, mg/L 8.2 0.5BOD5 at 20°C 3.0 200.0
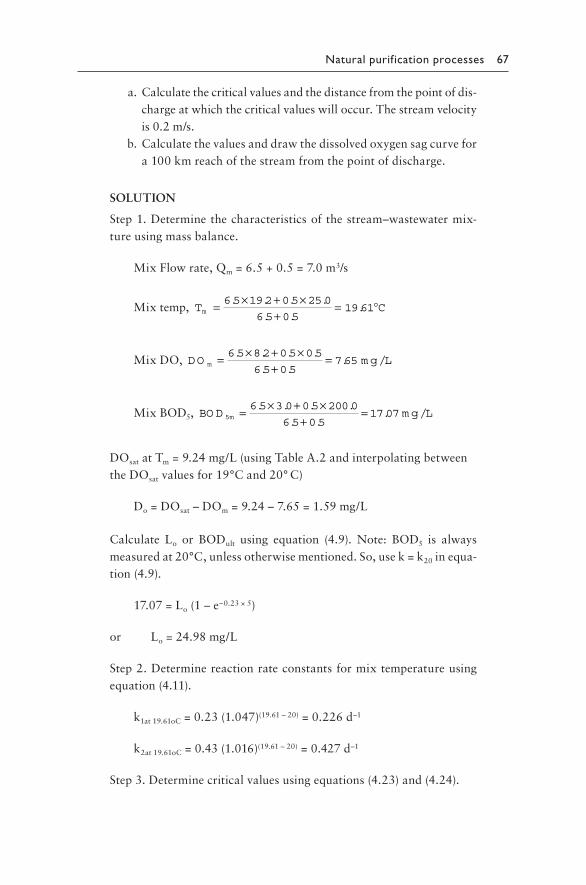
Natural purification processes 67
a.Calculatethecriticalvaluesandthedistancefromthepointofdis-chargeatwhichthecriticalvalueswilloccur.Thestreamvelocityis0.2m/s.
b.Calculatethevaluesanddrawthedissolvedoxygensagcurvefora100kmreachofthestreamfromthepointofdischarge.
SOLUTION
Step1.Determinethecharacteristicsofthestream–wastewatermix-tureusingmassbalance.
MixFlowrate,Qm=6.5+0.5=7.0m3/s
Mixtemp, T Cm
. . . .
. ..= × + ×
+= °6 5 19 2 0 5 25 0
6 5 0 519 61
MixDO, DO m g Lm = × + ×+
=6 5 8 2 0 5 0 5
6 5 0 57 65
. . . .
. .. /
MixBOD5, BO D m g Lm5
6 5 3 0 0 5 200 0
6 5 0 517 07= × + ×
+=. . . .
. .. /
DOsatatTm=9.24mg/L(usingTableA.2andinterpolatingbetweentheDOsatvaluesfor19°Cand20°C)
Do=DOsat–DOm=9.24–7.65=1.59mg/L
Calculate Lo or BODult using equation (4.9). Note: BOD5 is alwaysmeasuredat20°C,unlessotherwisementioned.So,usek=k20inequa-tion(4.9).
17.07=Lo(1–e–0.23×5)
or Lo=24.98mg/L
Step2.Determinereactionrateconstantsformixtemperatureusingequation(4.11).
k1at19.61oC=0.23(1.047)(19.61–20)=0.226d–1
k2at19.61oC=0.43(1.016)(19.61–20)=0.427d–1
Step3.Determinecriticalvaluesusingequations(4.23)and(4.24).
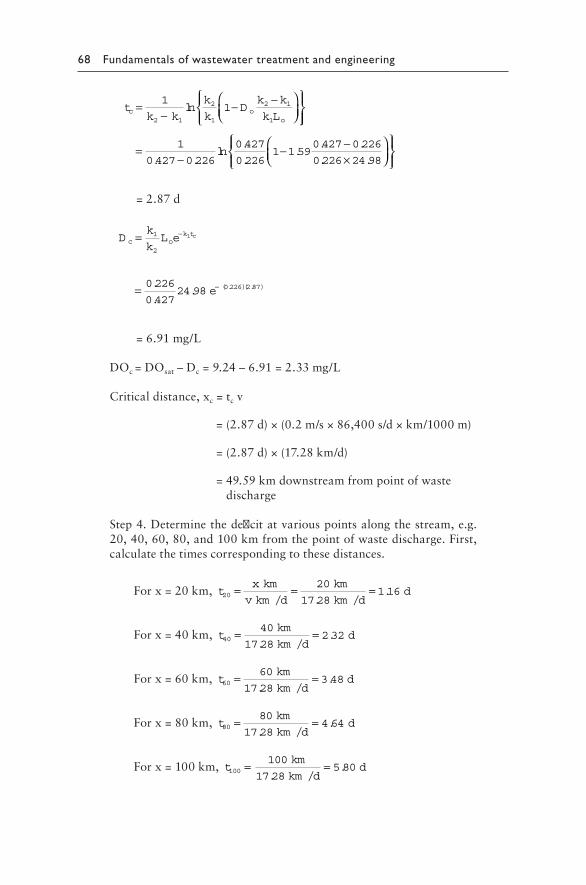
68 Fundamentals of wastewater treatment and engineering
tk k
k
kD
k k
k Lc o
o
=−
− −
1
12 1
2
1
2 1
1
ln
=−
− −1
0 427 0 226
0 427
0 2261 1 59
0 427 0 226
0. .ln
.
..
. .
.. .226 24 98×
=2.87d
Dk
kL ec o
k tc= −1
2
1
= −0 226
0 42724 98 0226 2 87.
.. ( . )( . )e
=6.91mg/L
DOc=DOsat–Dc=9.24–6.91=2.33mg/L
Criticaldistance,xc=tcv
=(2.87d)×(0.2m/s×86,400s/d×km/1000m)
=(2.87d)×(17.28km/d)
=49.59kmdownstreamfrompointofwastedischarge
Step4.Determinethedeficitatvariouspointsalongthestream,e.g.20,40,60,80,and100kmfromthepointofwastedischarge.First,calculatethetimescorrespondingtothesedistances.
Forx=20km, tx km
v km d
km
km dd20
20
17 281 16= = =
/ . /.
Forx=40km, tkm
km dd40
40
17 282 32= =
. /.
Forx=60km, tkm
km dd60
60
17 283 48= =
. /.
Forx=80km, tkm
km dd80
80
17 284 64= =
. /.
Forx=100km, tkm
km dd100
100
17 285 80= =
. /.
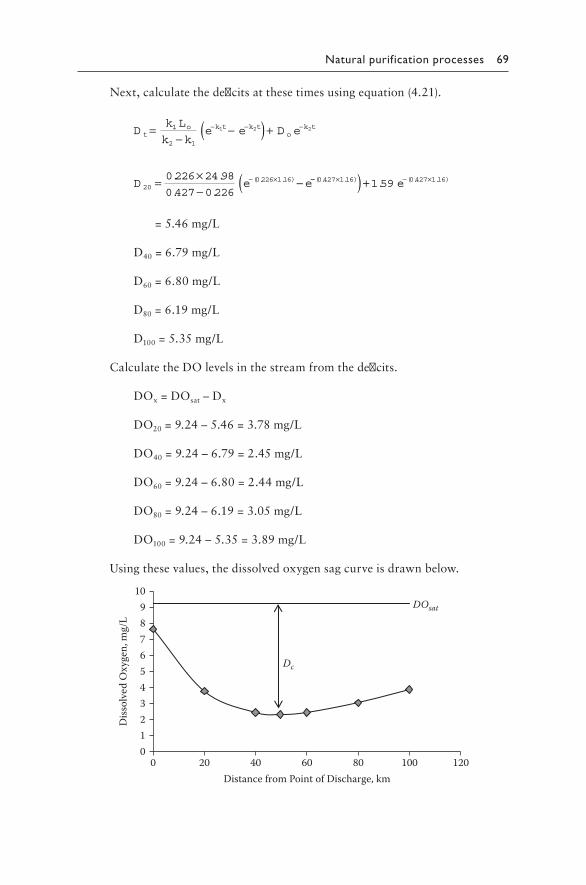
Natural purification processes 69
Next,calculatethedeficitsatthesetimesusingequation(4.21).
D
k L
k ke e D et
o k t k to
k t=−
−( ) +− − −1
2 1
1 2 2
D e e20
0 226 1 160 226 24 98
0 427 0 226= ×
−−− ×. .
. .( . . ) −− × − ×( ) +( . . ) ( . . ).0427 1 16 0 427 1 161 59 e
=5.46mg/L
D40=6.79mg/L
D60=6.80mg/L
D80=6.19mg/L
D100=5.35mg/L
CalculatetheDOlevelsinthestreamfromthedeficits.
DOx=DOsat–Dx
DO20=9.24–5.46=3.78mg/L
DO40=9.24–6.79=2.45mg/L
DO60=9.24–6.80=2.44mg/L
DO80=9.24–6.19=3.05mg/L
DO100=9.24–5.35=3.89mg/L
Usingthesevalues,thedissolvedoxygensagcurveisdrawnbelow.
0123456789
10
0 20 40 60 80 100 120
Diss
olve
d O
xyge
n, m
g/L
Distance from Point of Discharge, km
DOsat
Dc
70 Fundamentals of wastewater treatment and engineering
4.6.1.2 Limitations of the oxygen sag curve model
1.ThemodelassumesonlyonesourceofBODdischargeintothestream.Iftherearemultiplewastedischargesalongthestream,theyhavetobetakenintoaccount.Thestreamcanbedividedintosegmentscon-sistingofasinglesourceofwastedischarge,andthemodelappliedsequentiallyfromthefirsttothelastsegment.
2.Oxygendemandduetonitrificationoralgalrespirationisnottakenintoaccount.
3.Contributionofalgaetoreaerationisnotconsidered. 4.Steadystateconditionsareassumedalongthestreamchannel,result-
ing in the use of a single value of k2. Stream bed characteristics,slopes,impoundments,etc.arenotconsidered.
ComputermodelshavebeendevelopedinrecentyearsbasedontheStreeter–Phelpsmodelthathaveincludedthenitrificationprocess,thediurnaleffectofalgalphotosynthesis and respiration, aswell as streamcharacteristicsaffectingreaerationrates.
PROBLEMS
4.1 AmunicipalwastewaterisdischargedintoastreamasillustratedinFigure 4.1.Priortodischarge,theflowrateofthestreamis45m3/swithaBOD5of1.5mg/L.Downstreamfromthepointofdischarge,thestreamflowrateis47.2m3/swithaBOD5of50mg/L.Calculatethecharacteristicsofthemunicipaldischarge.
4.2 Astreamflowsthroughasmalltownwhereanindustrydischargesitseffluentintothestream.Upstreamcharacteristicspriortoindus-trialdischargeareasfollows:flowrate1000m3/d,BOD52.5mg/L,nitrates2.0mg/L,andtemperature19°C.Theindustrydischargesat 50 m3/d. According to regulatory requirements, the maximumallowablevaluesinthestreamfollowinganydischargeareBOD530mg/L,nitrates4.0mg/L,andtemperaturedifferentialof4°Cfromupstreamconditions.Calculatethemaximumallowablevaluesfortheindustrialdischarge.
4.3 Whatsizeofsample,expressedasapercent,isrequiredifthe5dBODis650mg/LandtotaloxygenconsumedintheBODbottleislimitedto2mg/L?
4.4 TheBODvalueofawastewaterwasmeasuredat2dand8dandfoundtobe125and225mg/L,respectively.Determinethe5dBODvalueusingthefirstorderratemodel.
4.5 ForaBODanalysis, 30mlofwastewithaDOof zeromg/L, ismixedwith270mlofdilutionwaterwith aDOof9mg/L.The
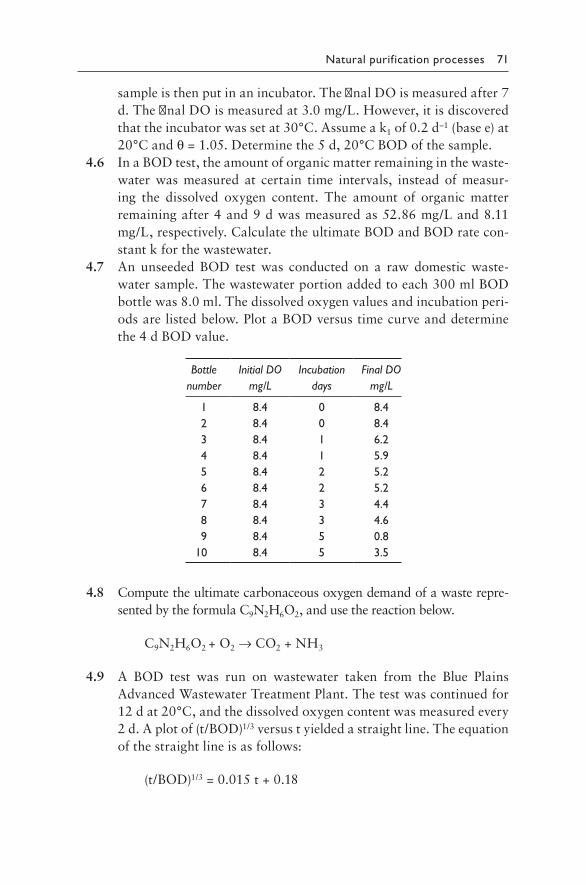
Natural purification processes 71
sampleisthenputinanincubator.ThefinalDOismeasuredafter7d.ThefinalDOismeasuredat3.0mg/L.However,itisdiscoveredthattheincubatorwassetat30°C.Assumeak1of0.2d–1(basee)at20°Candθ=1.05.Determinethe5d,20°CBODofthesample.
4.6 InaBODtest,theamountoforganicmatterremaininginthewaste-water was measured at certain time intervals, instead of measur-ing the dissolved oxygen content. The amount of organic matterremainingafter4and9dwasmeasuredas52.86mg/Land8.11mg/L,respectively.CalculatetheultimateBODandBODratecon-stantkforthewastewater.
4.7 An unseeded BOD test was conducted on a raw domestic waste-watersample.Thewastewaterportionaddedtoeach300mlBODbottlewas8.0ml.Thedissolvedoxygenvaluesandincubationperi-odsarelistedbelow.PlotaBODversustimecurveanddeterminethe4dBODvalue.
Bottle Initial DO Incubation Final DOnumber mg/L days mg/L
1 8.4 0 8.42 8.4 0 8.43 8.4 1 6.24 8.4 1 5.95 8.4 2 5.26 8.4 2 5.27 8.4 3 4.48 8.4 3 4.69 8.4 5 0.8
10 8.4 5 3.5
4.8 Computetheultimatecarbonaceousoxygendemandofawasterepre-sentedbytheformulaC9N2H6O2,andusethereactionbelow.
C9N2H6O2+O2→CO2+NH3
4.9 A BOD test was run on wastewater taken from the Blue PlainsAdvancedWastewaterTreatmentPlant.Thetestwascontinuedfor12dat20°C,andthedissolvedoxygencontentwasmeasuredevery2d.Aplotof(t/BOD)1/3versustyieldedastraightline.Theequationofthestraightlineisasfollows:
(t/BOD)1/3=0.015t+0.18
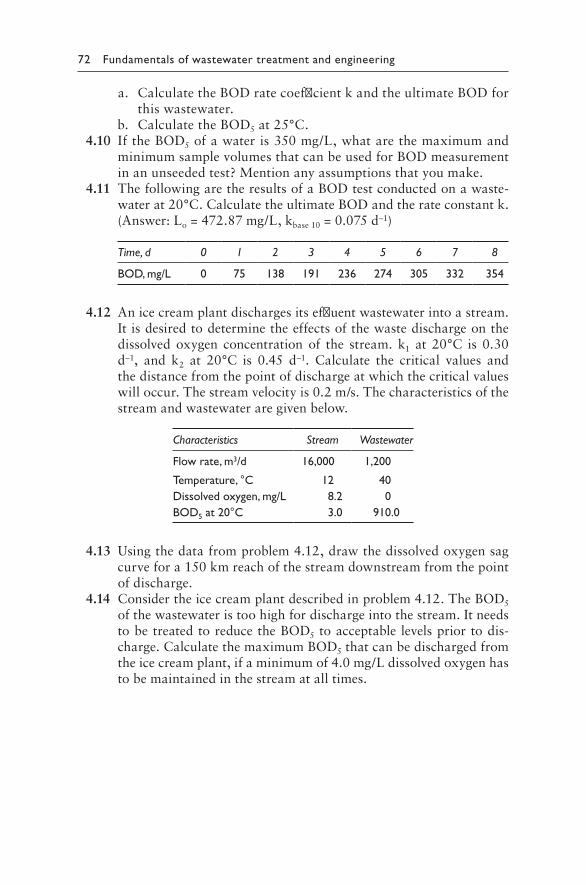
72 Fundamentals of wastewater treatment and engineering
a. CalculatetheBODratecoefficientkandtheultimateBODforthiswastewater.
b. CalculatetheBOD5at25°C. 4.10 IftheBOD5ofawateris350mg/L,whatarethemaximumand
minimumsamplevolumesthatcanbeusedforBODmeasurementinanunseededtest?Mentionanyassumptionsthatyoumake.
4.11 ThefollowingaretheresultsofaBODtestconductedonawaste-waterat20°C.CalculatetheultimateBODandtherateconstantk.(Answer:Lo=472.87mg/L,kbase10=0.075d–1)
Time, d 0 1 2 3 4 5 6 7 8
BOD, mg/L 0 75 138 191 236 274 305 332 354
4.12 Anicecreamplantdischargesitseffluentwastewaterintoastream.Itisdesiredtodeterminetheeffectsofthewastedischargeonthedissolved oxygen concentration of the stream. k1 at 20°C is 0.30d–1, and k2 at 20°C is 0.45 d–1. Calculate the critical values andthedistancefromthepointofdischargeatwhichthecriticalvalueswilloccur.Thestreamvelocityis0.2m/s.Thecharacteristicsofthestreamandwastewateraregivenbelow.
Characteristics Stream Wastewater
Flow rate, m3/d 16,000 1,200
Temperature, °C 12 40Dissolved oxygen, mg/L 8.2 0BOD5 at 20°C 3.0 910.0
4.13 Usingthedatafromproblem4.12,drawthedissolvedoxygensagcurvefora150kmreachofthestreamdownstreamfromthepointofdischarge.
4.14 Considertheicecreamplantdescribedinproblem4.12.TheBOD5ofthewastewateristoohighfordischargeintothestream.ItneedstobetreatedtoreducetheBOD5toacceptable levelspriortodis-charge.CalculatethemaximumBOD5thatcanbedischargedfromtheicecreamplant,ifaminimumof4.0mg/Ldissolvedoxygenhastobemaintainedinthestreamatalltimes.
Natural purification processes 73
REFERENCES
AWWA,WEF,andAPHA(2005)Standard Methods for the Examination of Water and Wastewater.Twenty-firstedition.EditedbyEaton,A.,andFranson,M.A.H.,AmericanWaterWorksAssociation.
Droste,R.L.(1997)Theory and Practice of Water and Wastewater Treatment.JohnWiley&Sons,Hoboken,NewJersey.
Fujimoto,Y.(1964)“GraphicalUseofFirst-StageBODEquation.”Journal of Water Pollution Control Federation,vol.36,no.1,p.69–71.
Hammer,M.J.,andHammer,M.J.Jr.(2008)Water and Wastewater Technology.Sixthedition.Pearson-PrenticeHall,Inc.,UpperSaddleRiver,NewJersey.
Metcalf and Eddy, Inc. (2003) Wastewater Engineering: Treatment and Reuse.Fourthedition.McGraw-Hill,Inc.,NewYork.
Mihelcic, J. R., and Zimmerman, J. B. (2010) Environmental Engineering: Fundamentals, Sustainability, Design.JohnWiley&Sons,Inc.,Hoboken,NewJersey.
Moore,E.W.,Thomas,H.A.,andSnow,W.B.(1950)“SimplifiedMethodforAnalysisofBODData.”Sewage and Industrial Wastes,vol.22,no.10,p. 1343–1353.
Peavy,H.S.,Rowe,D.R.,andTchobanoglous,G.(1985)Environmental Engineering.McGraw-Hill,Inc.,NewYork.
Thomas, H. A. Jr. (1950)“Graphical Determination of BOD Curve Constants.”Water & Sewage Works,vol.97,p.123–124.

75
Chapter 5
Wastewater treatment fundamentals
5.1 INTRODUCTION
Thescienceandengineeringofwastewatertreatmenthasprogressedtre-mendously over the last four or five decades. As knowledge and under-standing of the relationship between waterborne pathogens and publichealthhasincreased,sohastheimpetusforinnovationofnewtechnologiesfor treatmentofwastewater. In the last century,populationgrowthandindustrialization have resulted in significant degradation of the environ-ment.Disposalofuntreatedwastesandwastewateronlandorinstreamsandriversisnolongeranoption.Newerregulationsareaimedatprotect-ingtheenvironmentaswellaspublichealth.
Wastewaterengineeringhascomealongwayfromthetimewhencityresidentshadtoplacenight soil(fecalwaste)inbucketsalongthestreets,andworkerscollectedthewasteanddeliveredittoruralareasfordisposalonagriculturallands.Withtheinventionoftheflushtoilet,nightsoilwastransformedintowastewater. Itwasnotfeasible totransport these largeliquidvolumesfor landdisposal.Socitiesbegantousenaturaldrainagesystemsandstormsewerstotransportthewastewatertostreamsandriv-ers,whereitwasdischargedwithoutanytreatment.Thecommonnotionwas, “the solution to pollution is dilution.” However, with increasingurbanization, the self-purification capacity of the receiving waters wasexceeded,causingdegradationofthewaterbodiesandtheenvironment.Inthelate1800sandearly1900s,varioustreatmentprocesseswereappliedtowastewater (Peavy et al., 1985).By the1920s, treatmentplantsweredesignedandconstructedforpropertreatmentofwastewaterpriortodis-posal.Withnewerandmorestringentregulations,existingprocessesaremodifiedandinnovativetechnologiesareintroducedtoachieveenhancedremovalofpollutants.
Theobjectivesofwastewatertreatmentaretoreduce(1)thelevelofsol-ids,(2)thelevelofbiodegradableorganicmatter,(3)thelevelofpathogens,and(4)theleveloftoxiccompoundsinthewastewater,tomeetregulatorylimitsthatareprotectiveofpublichealthandtheenvironment.
76 Fundamentals of wastewater treatment and engineering
5.2 SOURCES OF WASTEWATER
Thefollowingarecommonsourcesortypesofwastewater:
• Domestic or municipal wastewater: this includes wastewater dis-chargedfromresidences, institutionssuchasschoolsandhospitals,andcommercialfacilitiessuchasrestaurants,shoppingmalls,etc.
• Industrial wastewater: wastewater discharged from industrial pro-cesses,e.g.pharmaceuticalindustry,poultryprocessing.
• Infiltration and inflow:thisincludeswaterthateventuallyentersthesewer fromfoundationdrains, leakingpipes, submergedmanholes,andgroundwaterinfiltration,amongothers.
• Stormwater:rainfallrunoffandsnowmelt.
Municipal wastewater is usually collected in sanitary sewers and trans-portedtothewastewatertreatmentplant.Stormwatermaybecollectedinseparate sewer lines called storm sewers. In somecities, especiallyoldercities,stormwateriscollectedinthesamesewerlineasthedomesticwaste-water.Thistypeofsystemiscalledacombined sewersystem.Eachsystemhasadvantagesanddisadvantages. Industrialwastewatermaybe treatedon-site,orpretreatedandthendischargedtosanitarysewers,afterappro-priateremovalofpollutants.
5.3 WASTEWATER CONSTITUENTS
The major constituents of municipal wastewater are suspended solids,organicmatter,andpathogens.Nutrientssuchasnitrogenandphosphoruscancauseproblemswhenpresentinhighconcentrations.Inrecentyears,thepresenceofEDCs(endocrinedisruptingcompounds)hasbeenrecognizedasanareaofconcern.Industrialwastewatercancontaintheabove-mentionedcontaminants, aswell as heavymetals, toxic compounds, and refractoryorganics.Stormwatermaycontainpetroleumcompounds, silt,andpesti-cideswhenitincludesurbanrunoffandagriculturalrunoff.Table 5.1pro-videstheenvironmentalimpactsofthemajorconstituentsofwastewater.
Suspended solids consist of inert matter such as rags, silt, and paper,aswellasfoodwasteandhumanwaste.Biodegradableorganicmatteriscomposedof40%to60%proteins,25%to50%carbohydrates,andabout10%lipids(Peavyetal.,1985).Proteinsaremainlyaminoacidsandcontainnitrogen.Carbohydratesaresugars,starches,andcellulose.Lipidsincludefats,oils,andgrease.Alloftheseexertanoxygendemand.Table 5.2pres-entsthetypicalcharacteristicsofuntreatedmunicipalwastewater.
Theconstituentsofindustrialwastewatersvarywidelydependingonthetypeofindustryandtheprocessesusedinmanufacturingtheproduct.In
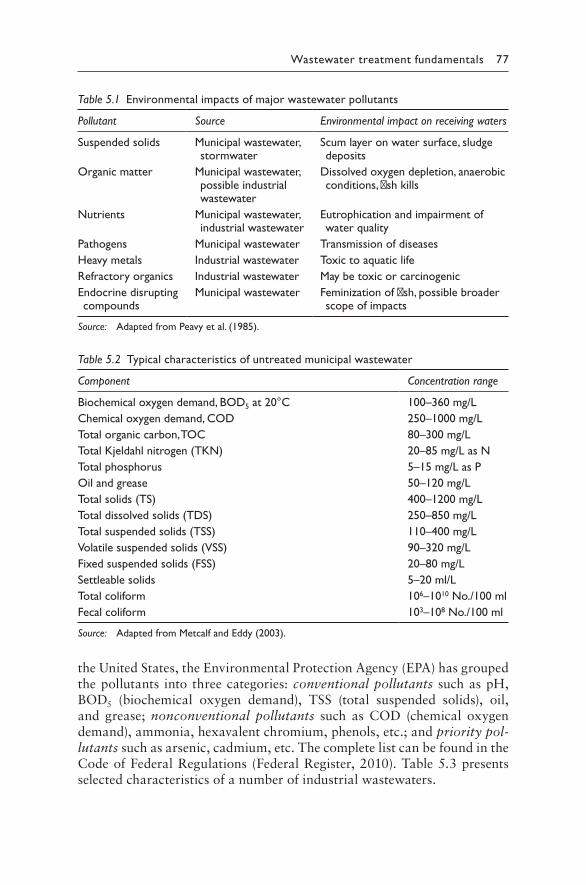
Wastewater treatment fundamentals 77
theUnitedStates,theEnvironmentalProtectionAgency(EPA)hasgroupedthepollutants intothreecategories:conventional pollutants suchaspH,BOD5 (biochemical oxygen demand), TSS (total suspended solids), oil,and grease; nonconventional pollutants such as COD (chemical oxygendemand),ammonia,hexavalentchromium,phenols,etc.;andpriority pol-lutantssuchasarsenic,cadmium,etc.ThecompletelistcanbefoundintheCodeofFederalRegulations (FederalRegister,2010).Table 5.3presentsselectedcharacteristicsofanumberofindustrialwastewaters.
Table 5.1 Environmental impacts of major wastewater pollutants
Pollutant Source Environmental impact on receiving waters
Suspended solids Municipal wastewater, stormwater
Scum layer on water surface, sludge deposits
Organic matter Municipal wastewater, possible industrial wastewater
Dissolved oxygen depletion, anaerobic conditions, fish kills
Nutrients Municipal wastewater, industrial wastewater
Eutrophication and impairment of water quality
Pathogens Municipal wastewater Transmission of diseasesHeavy metals Industrial wastewater Toxic to aquatic lifeRefractory organics Industrial wastewater May be toxic or carcinogenicEndocrine disrupting compounds
Municipal wastewater Feminization of fish, possible broader scope of impacts
Source: Adapted from Peavy et al. (1985).
Table 5.2 Typical characteristics of untreated municipal wastewater
Component Concentration range
Biochemical oxygen demand, BOD5 at 20°C 100–360 mg/LChemical oxygen demand, COD 250–1000 mg/LTotal organic carbon, TOC 80–300 mg/LTotal Kjeldahl nitrogen (TKN) 20–85 mg/L as NTotal phosphorus 5–15 mg/L as POil and grease 50–120 mg/LTotal solids (TS) 400–1200 mg/LTotal dissolved solids (TDS) 250–850 mg/LTotal suspended solids (TSS) 110–400 mg/LVolatile suspended solids (VSS) 90–320 mg/LFixed suspended solids (FSS) 20–80 mg/LSettleable solids 5–20 ml/LTotal coliform 106–1010 No./100 mlFecal coliform 103–108 No./100 ml
Source: Adapted from Metcalf and Eddy (2003).
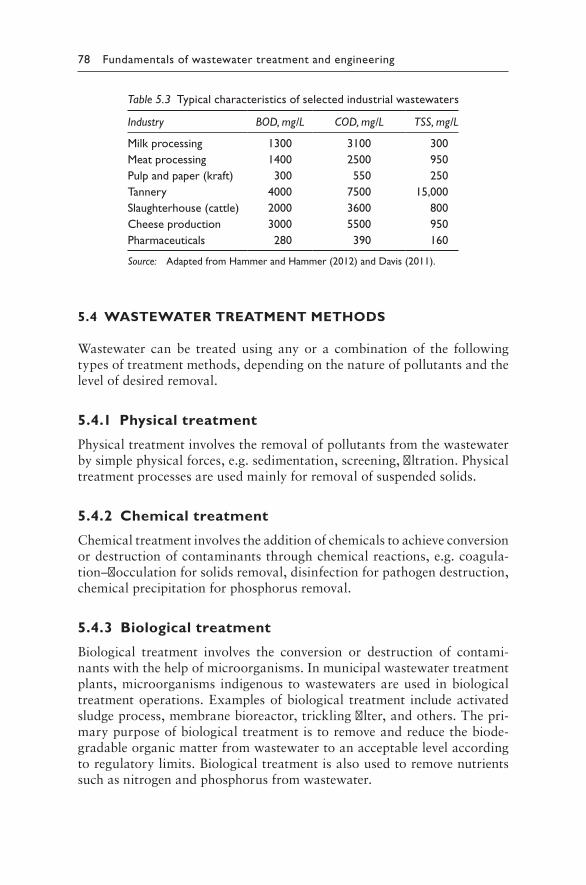
78 Fundamentals of wastewater treatment and engineering
5.4 WASTEWATER TREATMENT METHODS
Wastewater can be treatedusing anyor a combination of the followingtypesoftreatmentmethods,dependingonthenatureofpollutantsandthelevelofdesiredremoval.
5.4.1 Physical treatment
Physicaltreatmentinvolvestheremovalofpollutantsfromthewastewaterbysimplephysicalforces,e.g.sedimentation,screening,filtration.Physicaltreatmentprocessesareusedmainlyforremovalofsuspendedsolids.
5.4.2 Chemical treatment
Chemicaltreatmentinvolvestheadditionofchemicalstoachieveconversionordestructionofcontaminantsthroughchemicalreactions,e.g.coagula-tion–flocculationforsolidsremoval,disinfectionforpathogendestruction,chemicalprecipitationforphosphorusremoval.
5.4.3 Biological treatment
Biological treatment involves the conversion or destruction of contami-nantswiththehelpofmicroorganisms.Inmunicipalwastewatertreatmentplants,microorganisms indigenous towastewatersareused inbiologicaltreatmentoperations.Examplesofbiological treatment includeactivatedsludgeprocess,membranebioreactor,tricklingfilter,andothers.Thepri-marypurposeofbiologicaltreatmentistoremoveandreducethebiode-gradableorganicmatterfromwastewatertoanacceptablelevelaccordingtoregulatorylimits.Biologicaltreatmentisalsousedtoremovenutrientssuchasnitrogenandphosphorusfromwastewater.
Table 5.3 Typical characteristics of selected industrial wastewaters
Industry BOD, mg/L COD, mg/L TSS, mg/L
Milk processing 1300 3100 300Meat processing 1400 2500 950Pulp and paper (kraft) 300 550 250Tannery 4000 7500 15,000Slaughterhouse (cattle) 2000 3600 800Cheese production 3000 5500 950Pharmaceuticals 280 390 160
Source: Adapted from Hammer and Hammer (2012) and Davis (2011).
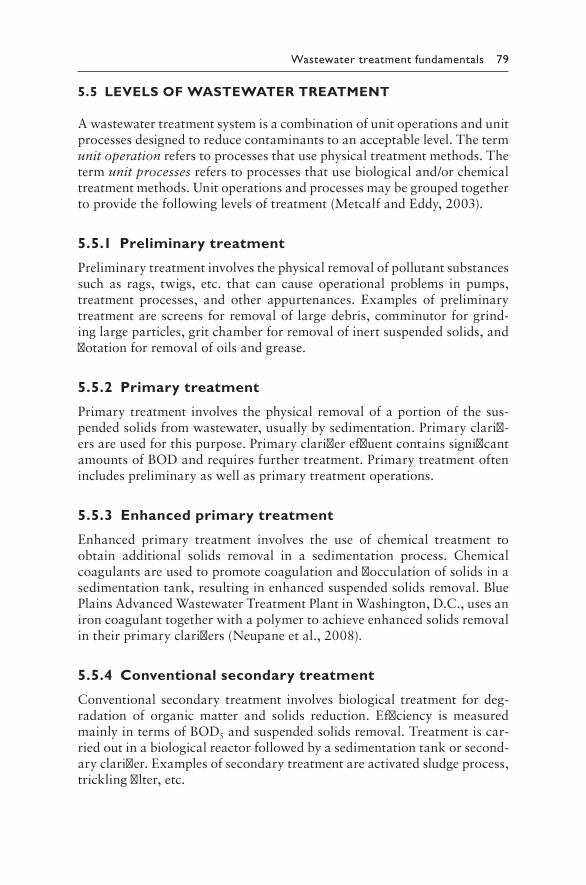
Wastewater treatment fundamentals 79
5.5 LEVELS OF WASTEWATER TREATMENT
Awastewatertreatmentsystemisacombinationofunitoperationsandunitprocessesdesignedtoreducecontaminantstoanacceptablelevel.Thetermunit operationreferstoprocessesthatusephysicaltreatmentmethods.Thetermunit processes referstoprocessesthatusebiologicaland/orchemicaltreatmentmethods.Unitoperationsandprocessesmaybegroupedtogethertoprovidethefollowinglevelsoftreatment(MetcalfandEddy,2003).
5.5.1 Preliminary treatment
Preliminarytreatmentinvolvesthephysicalremovalofpollutantsubstancessuch as rags, twigs, etc. that can cause operational problems in pumps,treatment processes, and other appurtenances. Examples of preliminarytreatmentarescreensforremovalof largedebris,comminutorforgrind-inglargeparticles,gritchamberforremovalofinertsuspendedsolids,andflotationforremovalofoilsandgrease.
5.5.2 Primary treatment
Primary treatment involves thephysical removalofaportionof thesus-pendedsolidsfromwastewater,usuallybysedimentation.Primaryclarifi-ersareusedforthispurpose.PrimaryclarifiereffluentcontainssignificantamountsofBODandrequiresfurthertreatment.Primarytreatmentoftenincludespreliminaryaswellasprimarytreatmentoperations.
5.5.3 Enhanced primary treatment
Enhanced primary treatment involves the use of chemical treatment toobtain additional solids removal in a sedimentation process. Chemicalcoagulantsareusedtopromotecoagulationandflocculationofsolidsinasedimentationtank,resultinginenhancedsuspendedsolidsremoval.BluePlainsAdvancedWastewaterTreatmentPlantinWashington,D.C.,usesanironcoagulanttogetherwithapolymertoachieveenhancedsolidsremovalintheirprimaryclarifiers(Neupaneetal.,2008).
5.5.4 Conventional secondary treatment
Conventional secondary treatment involvesbiological treatment fordeg-radation of organic matter and solids reduction. Efficiency is measuredmainlyintermsofBOD5andsuspendedsolidsremoval.Treatmentiscar-riedoutinabiologicalreactorfollowedbyasedimentationtankorsecond-aryclarifier.Examplesofsecondarytreatmentareactivatedsludgeprocess,tricklingfilter,etc.
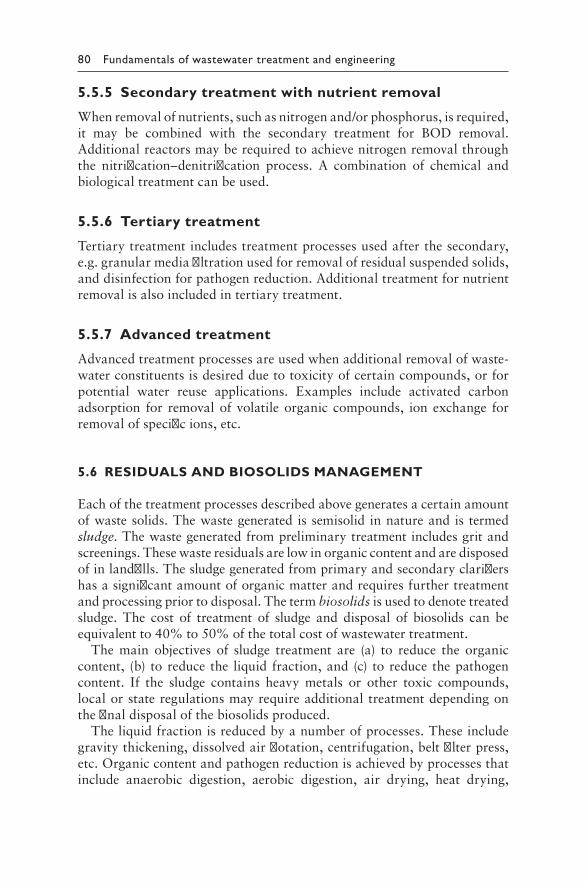
80 Fundamentals of wastewater treatment and engineering
5.5.5 Secondary treatment with nutrient removal
Whenremovalofnutrients,suchasnitrogenand/orphosphorus,isrequired,it may be combined with the secondary treatment for BOD removal.Additionalreactorsmayberequiredtoachievenitrogenremovalthroughthe nitrification–denitrification process. A combination of chemical andbiologicaltreatmentcanbeused.
5.5.6 Tertiary treatment
Tertiarytreatmentincludestreatmentprocessesusedafterthesecondary,e.g.granularmediafiltrationusedforremovalofresidualsuspendedsolids,anddisinfectionforpathogenreduction.Additionaltreatmentfornutrientremovalisalsoincludedintertiarytreatment.
5.5.7 Advanced treatment
Advancedtreatmentprocessesareusedwhenadditionalremovalofwaste-waterconstituentsisdesiredduetotoxicityofcertaincompounds,orforpotential water reuse applications. Examples include activated carbonadsorption for removalofvolatileorganic compounds, ion exchange forremovalofspecificions,etc.
5.6 RESIDUALS AND BIOSOLIDS MANAGEMENT
Eachofthetreatmentprocessesdescribedabovegeneratesacertainamountofwastesolids.Thewastegenerated is semisolid innatureand is termedsludge.Thewastegeneratedfrompreliminarytreatmentincludesgritandscreenings.Thesewasteresidualsarelowinorganiccontentandaredisposedofinlandfills.Thesludgegeneratedfromprimaryandsecondaryclarifiershasasignificantamountoforganicmatterandrequiresfurthertreatmentandprocessingpriortodisposal.Thetermbiosolidsisusedtodenotetreatedsludge. The cost of treatment of sludge and disposal of biosolids can beequivalentto40%to50%ofthetotalcostofwastewatertreatment.
The main objectives of sludge treatment are (a) to reduce the organiccontent, (b) toreduce the liquid fraction,and(c) toreduce thepathogencontent. If the sludge contains heavy metals or other toxic compounds,localorstateregulationsmayrequireadditionaltreatmentdependingonthefinaldisposalofthebiosolidsproduced.
Theliquidfractionisreducedbyanumberofprocesses.Theseincludegravitythickening,dissolvedairflotation,centrifugation,beltfilterpress,etc.Organiccontentandpathogenreductionisachievedbyprocessesthatinclude anaerobic digestion, aerobic digestion, air drying, heat drying,
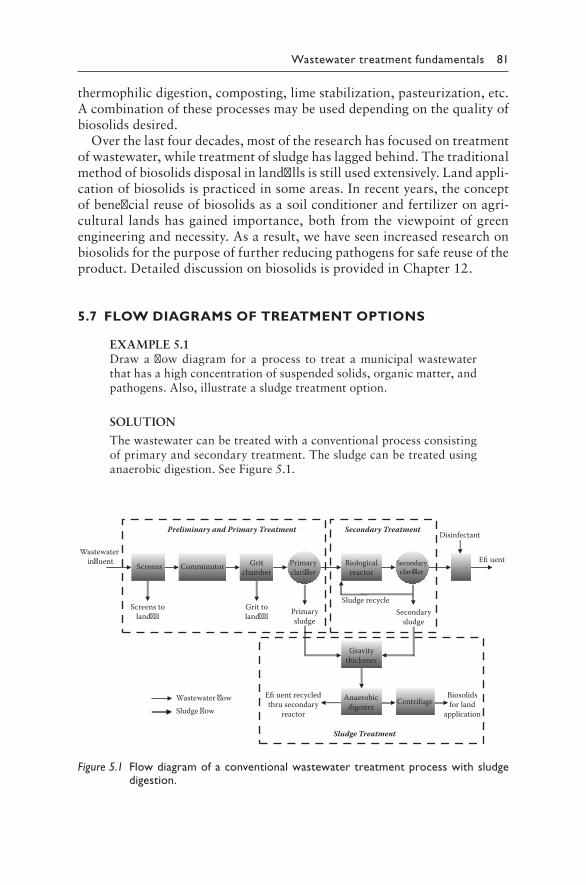
Wastewater treatment fundamentals 81
thermophilicdigestion,composting,limestabilization,pasteurization,etc.Acombinationoftheseprocessesmaybeuseddependingonthequalityofbiosolidsdesired.
Overthelastfourdecades,mostoftheresearchhasfocusedontreatmentofwastewater,whiletreatmentofsludgehaslaggedbehind.Thetraditionalmethodofbiosolidsdisposalinlandfillsisstillusedextensively.Landappli-cationofbiosolidsispracticedinsomeareas.Inrecentyears,theconceptofbeneficialreuseofbiosolidsasasoilconditionerandfertilizeronagri-cultural landshasgained importance,both fromtheviewpointofgreenengineeringandnecessity.Asaresult,wehaveseenincreasedresearchonbiosolidsforthepurposeoffurtherreducingpathogensforsafereuseoftheproduct.DetaileddiscussiononbiosolidsisprovidedinChapter12.
5.7 FLOW DIAGRAMS OF TREATMENT OPTIONS
EXAMPLE5.1Drawaflowdiagram foraprocess to treatamunicipalwastewaterthathasahighconcentrationofsuspendedsolids,organicmatter,andpathogens.Also,illustrateasludgetreatmentoption.
SOLUTION
Thewastewatercanbetreatedwithaconventionalprocessconsistingofprimaryandsecondarytreatment.Thesludgecanbetreatedusinganaerobicdigestion.SeeFigure 5.1.
Screens Comminutor Gritchamber
Primaryclari�er
Biologicalreactor
Secondaryclari�er
Gravitythickener
Primarysludge
Secondarysludge
Grit toland�ll
Screens toland�ll
Sludge recycle
Disinfectant
Anaerobicdigester Centrifuge
Biosolidsfor land
application
E�uent recycledthru secondary
reactor
Preliminary and Primary Treatment Secondary Treatment
Sludge Treatment
Wastewater �ow Sludge �ow
E�uent Wastewater
in�uent
Figure 5.1 Flow diagram of a conventional wastewater treatment process with sludge digestion.
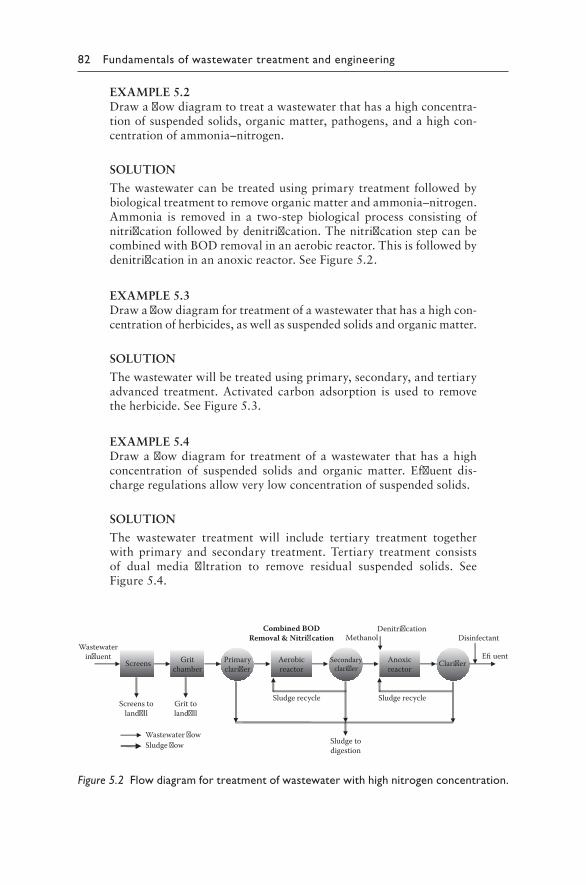
82 Fundamentals of wastewater treatment and engineering
EXAMPLE5.2Drawaflowdiagramtotreatawastewaterthathasahighconcentra-tionofsuspendedsolids,organicmatter,pathogens,andahighcon-centrationofammonia–nitrogen.
SOLUTION
Thewastewatercanbetreatedusingprimarytreatmentfollowedbybiologicaltreatmenttoremoveorganicmatterandammonia–nitrogen.Ammonia is removed in a two-step biological process consisting ofnitrificationfollowedbydenitrification.ThenitrificationstepcanbecombinedwithBODremovalinanaerobicreactor.Thisisfollowedbydenitrificationinananoxicreactor.SeeFigure 5.2.
EXAMPLE5.3Drawaflowdiagramfortreatmentofawastewaterthathasahighcon-centrationofherbicides,aswellassuspendedsolidsandorganicmatter.
SOLUTION
Thewastewaterwillbetreatedusingprimary,secondary,andtertiaryadvanced treatment. Activated carbon adsorption is used to removetheherbicide.SeeFigure 5.3.
EXAMPLE5.4Drawaflowdiagramfor treatmentofawastewater thathasahighconcentration of suspended solids and organic matter. Effluent dis-chargeregulationsallowverylowconcentrationofsuspendedsolids.
SOLUTION
The wastewater treatment will include tertiary treatment togetherwith primary and secondary treatment. Tertiary treatment consistsof dual media filtration to remove residual suspended solids. SeeFigure 5.4.
Screens Gritchamber
Primaryclari�er
Aerobicreactor
Secondaryclari�er
Grit toland�ll
Screens toland�ll
Sludge recycle
Wastewater �owSludge �ow
Wastewaterin�uent
Combined BODRemoval & Nitri�cation
Anoxicreactor
Denitri�cationMethanol
Clari�erE�uent
Disinfectant
Sludge recycle
Sludge todigestion
Figure 5.2 Flow diagram for treatment of wastewater with high nitrogen concentration.
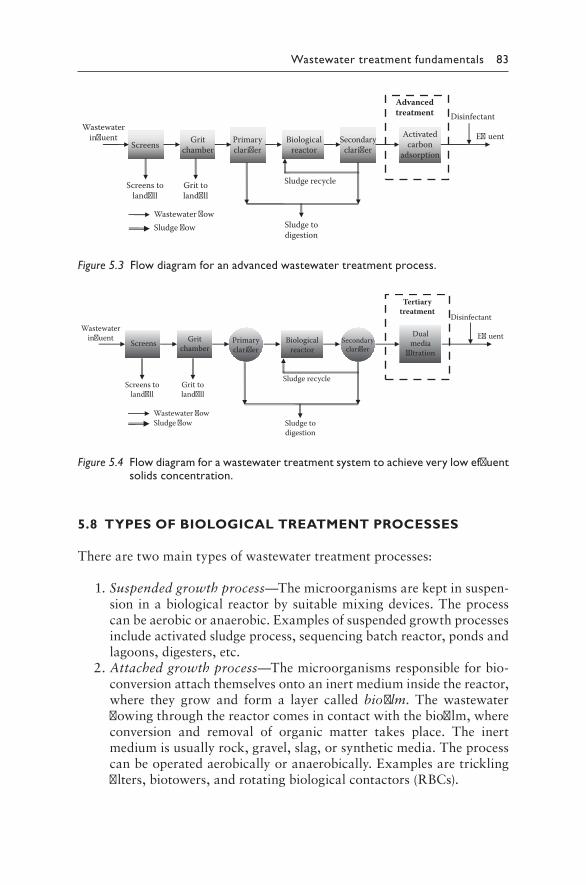
Wastewater treatment fundamentals 83
5.8 TYPES OF BIOLOGICAL TREATMENT PROCESSES
Therearetwomaintypesofwastewatertreatmentprocesses:
1.Suspended growth process—Themicroorganismsarekeptinsuspen-sioninabiologicalreactorbysuitablemixingdevices.Theprocesscanbeaerobicoranaerobic.Examplesofsuspendedgrowthprocessesincludeactivatedsludgeprocess,sequencingbatchreactor,pondsandlagoons,digesters,etc.
2.Attached growth process—Themicroorganismsresponsibleforbio-conversionattachthemselvesontoaninertmediuminsidethereactor,where they grow and form a layer called biofilm. The wastewaterflowingthroughthereactorcomesincontactwiththebiofilm,whereconversion and removal of organic matter takes place. The inertmediumisusuallyrock,gravel,slag,orsyntheticmedia.Theprocesscanbeoperatedaerobicallyoranaerobically.Examplesaretricklingfilters,biotowers,androtatingbiologicalcontactors(RBCs).
Screens Gritchamber
Primaryclari�er
Biologicalreactor
Secondaryclari�er
Grit toland�ll
Screens toland�ll
Sludge recycle
Wastewater �ow Sludge �ow
Wastewaterin�uent Activated
carbonadsorption
E�uent
Disinfectant
Sludge todigestion
Advancedtreatment
Figure 5.3 Flow diagram for an advanced wastewater treatment process.
Screens Gritchamber
Primaryclari�er
Biologicalreactor
Secondaryclari�er
Grit toland�ll
Screens toland�ll
Sludge recycle
Wastewater �ow Sludge �ow
Wastewaterin�uent Dual
media�ltration
E�uent
Disinfectant
Sludge todigestion
Tertiarytreatment
Figure 5.4 Flow diagram for a wastewater treatment system to achieve very low effluent solids concentration.
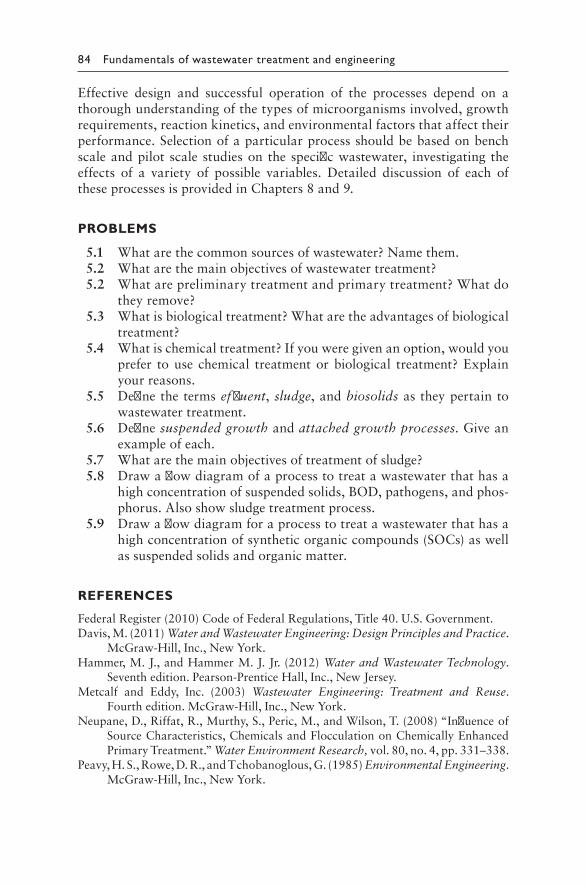
84 Fundamentals of wastewater treatment and engineering
Effective design and successful operation of the processes depend on athoroughunderstandingofthetypesofmicroorganismsinvolved,growthrequirements,reactionkinetics,andenvironmentalfactorsthataffecttheirperformance.Selectionofaparticularprocessshouldbebasedonbenchscaleandpilot scale studieson thespecificwastewater, investigating theeffects of a variety of possible variables. Detailed discussion of each oftheseprocessesisprovidedinChapters8and9.
PROBLEMS
5.1 Whatarethecommonsourcesofwastewater?Namethem. 5.2 Whatarethemainobjectivesofwastewatertreatment? 5.2 Whatarepreliminarytreatmentandprimarytreatment?Whatdo
theyremove? 5.3 Whatisbiologicaltreatment?Whataretheadvantagesofbiological
treatment? 5.4 Whatischemicaltreatment?Ifyouweregivenanoption,wouldyou
prefer touse chemical treatmentorbiological treatment?Explainyourreasons.
5.5 Definethetermseffluent,sludge,andbiosolidsastheypertaintowastewatertreatment.
5.6 Definesuspended growthandattached growth processes.Giveanexampleofeach.
5.7 Whatarethemainobjectivesoftreatmentofsludge? 5.8 Drawaflowdiagramofaprocesstotreatawastewaterthathasa
highconcentrationofsuspendedsolids,BOD,pathogens,andphos-phorus.Alsoshowsludgetreatmentprocess.
5.9 Drawaflowdiagramforaprocesstotreatawastewaterthathasahighconcentrationofsyntheticorganiccompounds(SOCs)aswellassuspendedsolidsandorganicmatter.
REFERENCES
FederalRegister(2010)CodeofFederalRegulations,Title40.U.S.Government.Davis,M.(2011)Water and Wastewater Engineering: Design Principles and Practice.
McGraw-Hill,Inc.,NewYork.Hammer,M.J.,andHammerM.J.Jr.(2012)Water and Wastewater Technology.
Seventhedition.Pearson-PrenticeHall,Inc.,NewJersey.Metcalf and Eddy, Inc. (2003) Wastewater Engineering: Treatment and Reuse.
Fourthedition.McGraw-Hill,Inc.,NewYork.Neupane,D.,Riffat,R.,Murthy,S.,Peric,M.,andWilson,T.(2008)“Influenceof
SourceCharacteristics,ChemicalsandFlocculationonChemicallyEnhancedPrimaryTreatment.”Water Environment Research,vol.80,no.4,pp.331–338.
Peavy,H.S.,Rowe,D.R.,andTchobanoglous,G.(1985)Environmental Engineering.McGraw-Hill,Inc.,NewYork.
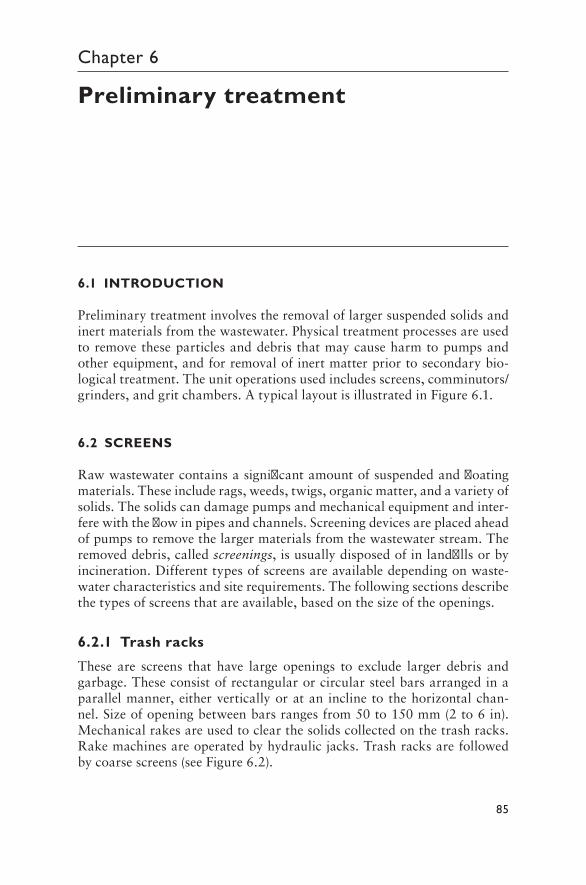
85
Chapter 6
Preliminary treatment
6.1 INTRODUCTION
Preliminarytreatmentinvolvestheremovaloflargersuspendedsolidsandinertmaterialsfromthewastewater.Physicaltreatmentprocessesareusedtoremovetheseparticlesanddebris thatmaycauseharmtopumpsandotherequipment,andforremovalofinertmatterpriortosecondarybio-logicaltreatment.Theunitoperationsusedincludesscreens,comminutors/grinders,andgritchambers.AtypicallayoutisillustratedinFigure 6.1.
6.2 SCREENS
Rawwastewatercontainsasignificantamountofsuspendedandfloatingmaterials.Theseincluderags,weeds,twigs,organicmatter,andavarietyofsolids.Thesolidscandamagepumpsandmechanicalequipmentandinter-ferewiththeflowinpipesandchannels.Screeningdevicesareplacedaheadofpumpstoremovethelargermaterialsfromthewastewaterstream.Theremoveddebris,calledscreenings,isusuallydisposedofinlandfillsorbyincineration.Differenttypesofscreensareavailabledependingonwaste-watercharacteristicsandsiterequirements.Thefollowingsectionsdescribethetypesofscreensthatareavailable,basedonthesizeoftheopenings.
6.2.1 Trash racks
These are screens that have large openings to exclude larger debris andgarbage.Theseconsistofrectangularorcircularsteelbarsarrangedinaparallelmanner,eitherverticallyoratan inclinetothehorizontalchan-nel.Sizeofopeningbetweenbarsrangesfrom50to150mm(2to6in).Mechanicalrakesareusedtoclearthesolidscollectedonthetrashracks.Rakemachinesareoperatedbyhydraulicjacks.Trashracksarefollowedbycoarsescreens(seeFigure6.2).
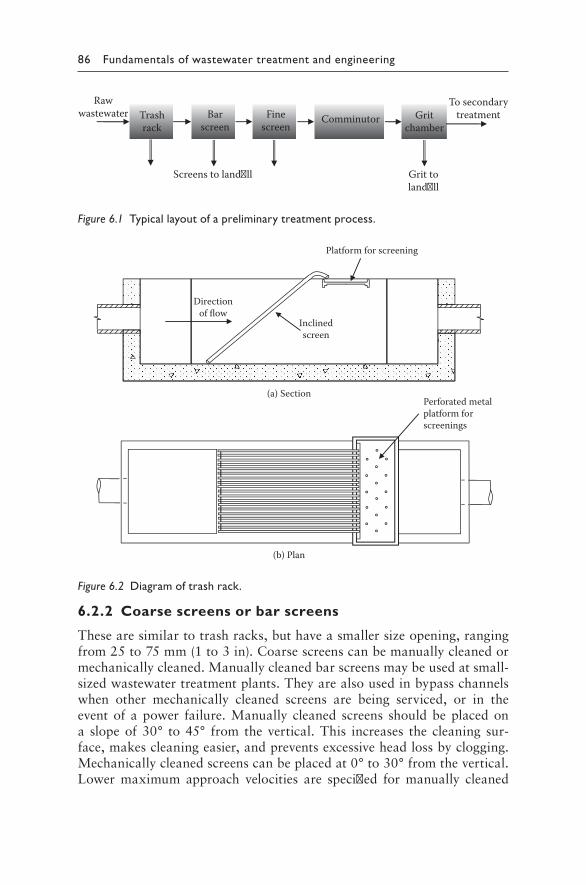
86 Fundamentals of wastewater treatment and engineering
6.2.2 Coarse screens or bar screens
Thesearesimilartotrashracks,buthaveasmallersizeopening,rangingfrom25to75mm(1to3in).Coarsescreenscanbemanuallycleanedormechanicallycleaned.Manuallycleanedbarscreensmaybeusedatsmall-sizedwastewatertreatmentplants.Theyarealsousedinbypasschannelswhen other mechanically cleaned screens are being serviced, or in theeventof apower failure.Manually cleaned screens shouldbeplacedona slopeof 30° to45° from the vertical.This increases the cleaning sur-face,makescleaningeasier,andpreventsexcessiveheadlossbyclogging.Mechanicallycleanedscreenscanbeplacedat0°to30°fromthevertical.Lower maximum approach velocities are specified for manually cleaned
(a) Section
(b) Plan
Directionof flow
Inclinedscreen
Platform for screening
Perforated metalplatform forscreenings
Figure 6.2 Diagram of trash rack.
Trashrack
Gritchamber
Grit toland ll
Screens to land ll
Rawwastewater Bar
screenFine
screenComminutor
To secondarytreatment
Figure 6.1 Typical layout of a preliminary treatment process.
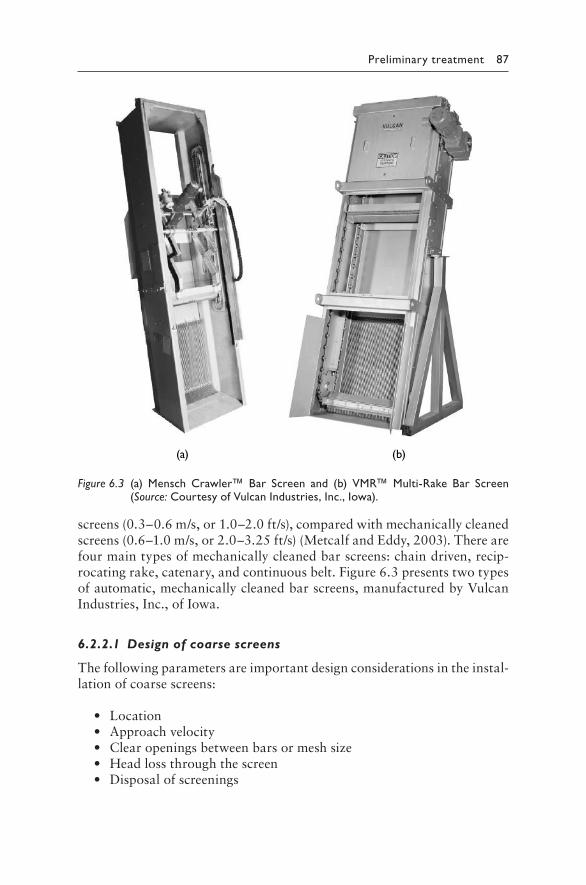
Preliminary treatment 87
screens(0.3–0.6m/s,or1.0–2.0ft/s),comparedwithmechanicallycleanedscreens(0.6–1.0m/s,or2.0–3.25ft/s)(MetcalfandEddy,2003).Therearefourmaintypesofmechanicallycleanedbarscreens:chaindriven,recip-rocatingrake,catenary,andcontinuousbelt.Figure 6.3presentstwotypesofautomatic,mechanicallycleanedbarscreens,manufacturedbyVulcanIndustries,Inc.,ofIowa.
6.2.2.1 Design of coarse screens
Thefollowingparametersareimportantdesignconsiderationsintheinstal-lationofcoarsescreens:
• Location• Approachvelocity• Clearopeningsbetweenbarsormeshsize• Headlossthroughthescreen• Disposalofscreenings
(a) (b)
Figure 6.3 (a) Mensch Crawler™ Bar Screen and (b) VMR™ Multi-Rake Bar Screen (Source: Courtesy of Vulcan Industries, Inc., Iowa).
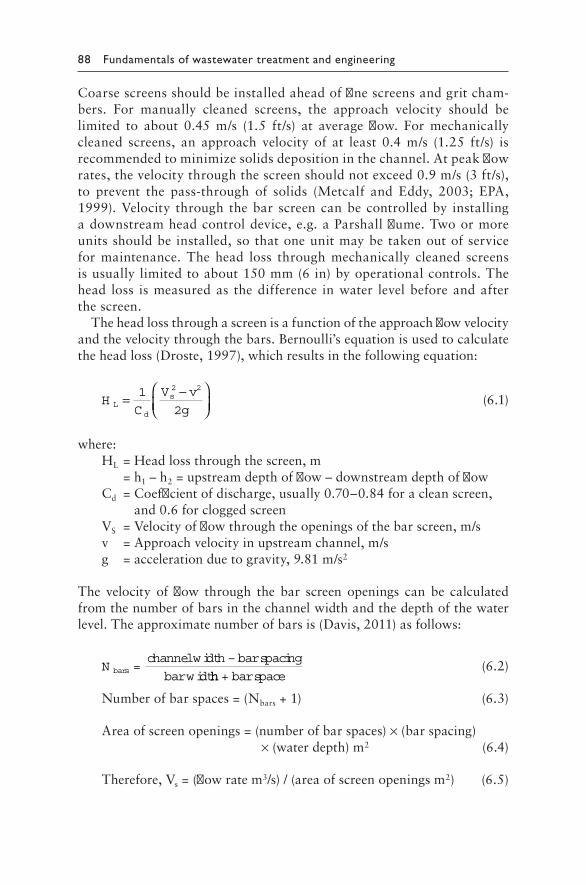
88 Fundamentals of wastewater treatment and engineering
Coarsescreensshouldbeinstalledaheadoffinescreensandgritcham-bers. For manually cleaned screens, the approach velocity should belimited to about 0.45 m/s (1.5 ft/s) at average flow. For mechanicallycleaned screens, an approach velocity of at least 0.4 m/s (1.25 ft/s) isrecommendedtominimizesolidsdepositioninthechannel.Atpeakflowrates,thevelocitythroughthescreenshouldnotexceed0.9m/s(3ft/s),to prevent the pass-through of solids (Metcalf and Eddy, 2003; EPA,1999).Velocity through thebar screencanbecontrolledby installingadownstreamheadcontroldevice,e.g.aParshallflume.Twoormoreunitsshouldbeinstalled,sothatoneunitmaybetakenoutofservicefor maintenance. The head loss through mechanically cleaned screensisusuallylimitedtoabout150mm(6in)byoperationalcontrols.Thehead loss ismeasuredas thedifference inwater levelbeforeandafterthescreen.
Theheadlossthroughascreenisafunctionoftheapproachflowvelocityandthevelocitythroughthebars.Bernoulli’sequationisusedtocalculatetheheadloss(Droste,1997),whichresultsinthefollowingequation:
HC
V v
gL
d
s= −
1
2
2 2
(6.1)
where:HL=Headlossthroughthescreen,m =h1–h2=upstreamdepthofflow–downstreamdepthofflowCd=Coefficientofdischarge,usually0.70–0.84foracleanscreen,
and0.6forcloggedscreenVS=Velocityofflowthroughtheopeningsofthebarscreen,m/sv=Approachvelocityinupstreamchannel,m/sg=accelerationduetogravity,9.81m/s2
The velocity of flow through the bar screen openings can be calculatedfromthenumberofbarsinthechannelwidthandthedepthofthewaterlevel.Theapproximatenumberofbarsis(Davis,2011)asfollows:
N =channelwidth –barspacing
barwidtbars
hh + barspace (6.2)
Numberofbarspaces=(Nbars+1) (6.3)
Areaofscreenopenings=(numberofbarspaces)×(barspacing) ×(waterdepth)m2 (6.4)
Therefore,Vs=(flowratem3/s)/(areaofscreenopeningsm2) (6.5)
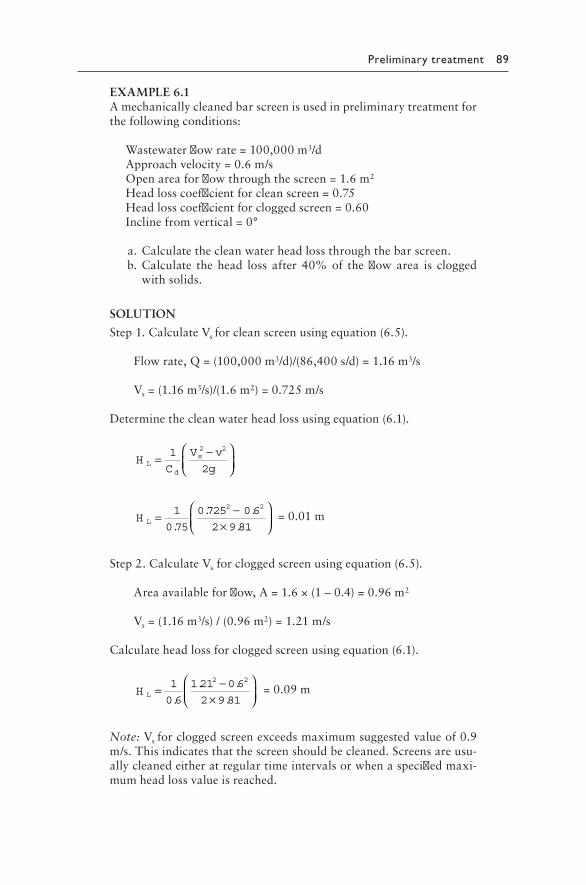
Preliminary treatment 89
EXAMPLE6.1Amechanicallycleanedbarscreenisusedinpreliminarytreatmentforthefollowingconditions:
Wastewaterflowrate=100,000m3/dApproachvelocity=0.6m/sOpenareaforflowthroughthescreen=1.6m2
Headlosscoefficientforcleanscreen=0.75Headlosscoefficientforcloggedscreen=0.60Inclinefromvertical=0°
a.Calculatethecleanwaterheadlossthroughthebarscreen. b.Calculate thehead loss after 40%of theflowarea is clogged
withsolids.
SOLUTION
Step1.CalculateVsforcleanscreenusingequation(6.5).
Flowrate,Q=(100,000m3/d)/(86,400s/d)=1.16m3/s
Vs=(1.16m3/s)/(1.6m2)=0.725m/s
Determinethecleanwaterheadlossusingequation(6.1).
HC
V v
gL
d
s= −
1
2
2 2
H L = −
×
1
0 75
0 725 0 6
2 9 81
2 2
.
. .
.=0.01m
Step2.CalculateVsforcloggedscreenusingequation(6.5).
Areaavailableforflow,A=1.6×(1–0.4)=0.96m2
Vs=(1.16m3/s)/(0.96m2)=1.21m/s
Calculateheadlossforcloggedscreenusingequation(6.1).
H L = −×
1
0 6
1 21 0 6
2 9 81
2 2
.
. .
.=0.09m
Note:Vsforcloggedscreenexceedsmaximumsuggestedvalueof0.9m/s.Thisindicatesthatthescreenshouldbecleaned.Screensareusu-allycleanedeitheratregulartimeintervalsorwhenaspecifiedmaxi-mumheadlossvalueisreached.
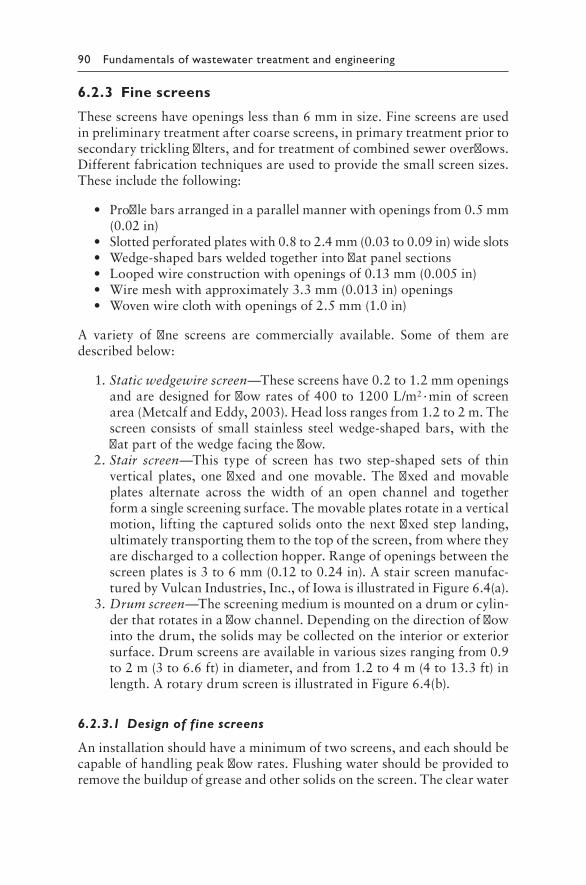
90 Fundamentals of wastewater treatment and engineering
6.2.3 Fine screens
Thesescreenshaveopeningslessthan6mminsize.Finescreensareusedinpreliminarytreatmentaftercoarsescreens,inprimarytreatmentpriortosecondarytricklingfilters,andfortreatmentofcombinedseweroverflows.Differentfabricationtechniquesareusedtoprovidethesmallscreensizes.Theseincludethefollowing:
• Profilebarsarrangedinaparallelmannerwithopeningsfrom0.5mm(0.02in)
• Slottedperforatedplateswith0.8to2.4mm(0.03to0.09in)wideslots• Wedge-shapedbarsweldedtogetherintoflatpanelsections• Loopedwireconstructionwithopeningsof0.13mm(0.005in)• Wiremeshwithapproximately3.3mm(0.013in)openings• Wovenwireclothwithopeningsof2.5mm(1.0in)
A variety of fine screens are commercially available. Some of them aredescribedbelow:
1.Static wedgewire screen—Thesescreenshave0.2to1.2mmopeningsandaredesignedforflowratesof400to1200L/m2·minofscreenarea(MetcalfandEddy,2003).Headlossrangesfrom1.2to2m.Thescreenconsistsof small stainless steelwedge-shapedbars,with theflatpartofthewedgefacingtheflow.
2.Stair screen—This type of screen has two step-shaped sets of thinverticalplates, onefixedandonemovable.Thefixedandmovableplates alternate across the width of an open channel and togetherformasinglescreeningsurface.Themovableplatesrotateinaverticalmotion,liftingthecapturedsolidsontothenextfixedsteplanding,ultimatelytransportingthemtothetopofthescreen,fromwheretheyaredischargedtoacollectionhopper.Rangeofopeningsbetweenthescreenplatesis3to6mm(0.12to0.24in).Astairscreenmanufac-turedbyVulcanIndustries,Inc.,ofIowaisillustratedinFigure 6.4(a).
3.Drum screen—Thescreeningmediumismountedonadrumorcylin-derthatrotatesinaflowchannel.Dependingonthedirectionofflowintothedrum,thesolidsmaybecollectedontheinteriororexteriorsurface.Drumscreensareavailableinvarioussizesrangingfrom0.9to2m(3to6.6ft)indiameter,andfrom1.2to4m(4to13.3ft)inlength.ArotarydrumscreenisillustratedinFigure 6.4(b).
6.2.3.1 Design of fine screens
Aninstallationshouldhaveaminimumoftwoscreens,andeachshouldbecapableofhandlingpeakflowrates.Flushingwatershouldbeprovidedtoremovethebuildupofgreaseandothersolidsonthescreen.Theclearwater
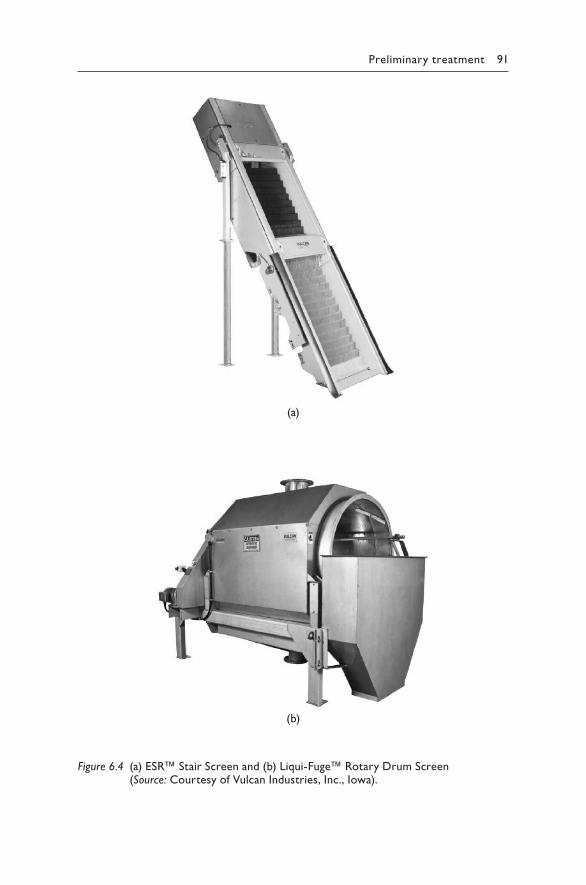
Preliminary treatment 91
(a)
(b)
Figure 6.4 (a) ESR™ Stair Screen and (b) Liqui-Fuge™ Rotary Drum Screen (Source: Courtesy of Vulcan Industries, Inc., Iowa).
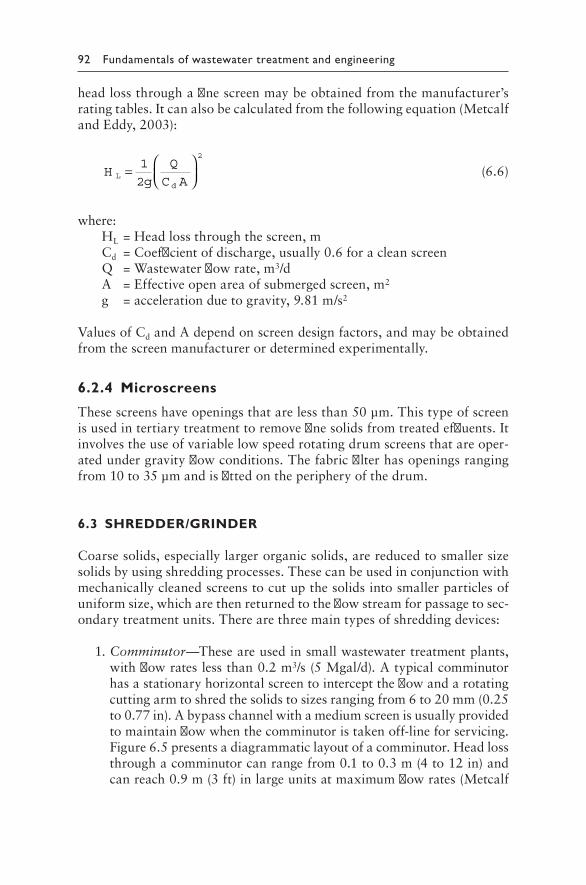
92 Fundamentals of wastewater treatment and engineering
headlossthroughafinescreenmaybeobtainedfromthemanufacturer’sratingtables.Itcanalsobecalculatedfromthefollowingequation(MetcalfandEddy,2003):
Hg
Q
C AL
d
=
1
2
2
(6.6)
where:HL=Headlossthroughthescreen,mCd=Coefficientofdischarge,usually0.6foracleanscreenQ=Wastewaterflowrate,m3/dA=Effectiveopenareaofsubmergedscreen,m2
g=accelerationduetogravity,9.81m/s2
ValuesofCdandAdependonscreendesignfactors,andmaybeobtainedfromthescreenmanufacturerordeterminedexperimentally.
6.2.4 Microscreens
Thesescreenshaveopeningsthatarelessthan50μm.Thistypeofscreenisusedintertiarytreatmenttoremovefinesolidsfromtreatedeffluents.Itinvolvestheuseofvariablelowspeedrotatingdrumscreensthatareoper-atedundergravityflowconditions.Thefabricfilterhasopeningsrangingfrom10to35μmandisfittedontheperipheryofthedrum.
6.3 SHREDDER/GRINDER
Coarsesolids,especiallylargerorganicsolids,arereducedtosmallersizesolidsbyusingshreddingprocesses.Thesecanbeusedinconjunctionwithmechanicallycleanedscreenstocutupthesolidsintosmallerparticlesofuniformsize,whicharethenreturnedtotheflowstreamforpassagetosec-ondarytreatmentunits.Therearethreemaintypesofshreddingdevices:
1.Comminutor—Theseareusedinsmallwastewatertreatmentplants,withflowrateslessthan0.2m3/s(5Mgal/d).Atypicalcomminutorhasastationaryhorizontalscreentointercepttheflowandarotatingcuttingarmtoshredthesolidstosizesrangingfrom6to20mm(0.25to0.77in).Abypasschannelwithamediumscreenisusuallyprovidedtomaintainflowwhenthecomminutoristakenoff-lineforservicing.Figure 6.5presentsadiagrammaticlayoutofacomminutor.Headlossthroughacomminutorcanrangefrom0.1to0.3m(4 to12in)andcanreach0.9m(3ft)inlargeunitsatmaximumflowrates(Metcalf
Preliminary treatment 93
andEddy,2003).Comminutorscancreateastringofragsand/orplas-ticthatcancollectondownstreamequipmentandcauseoperationalproblems.Newerinstallationsusemaceratorsorgrinders.
2.Macerator—These are slow-speed grinders that chop or grind sol-ids to very small pieces.Themaceratorblade assembly is typicallybetween6to9mm(Davis,2011).Effectivechoppingactionreducesthepossibilityofproducingropesofragsandplasticsthatcancollectondownstreamequipment.
3.Grinder—High-speedgrindersareusedtopulverizesolidsinthewaste-water.TheyarealsocalledHammermills.Thesolidsarepulverizedastheypassthroughahigh-speedrotatingassembly.Washwaterisusedtokeeptheunitcleanandtotransportsolidsbacktothewastewaterstream.
6.4 GRIT CHAMBER
Gritisdefinedassand,gravel,orothermineralmaterialthathasanominaldiameterof0.15–0.20mmorlarger(Droste,1997).Gritmayalsoincludeash, wood chips, coffee grounds, egg shells, and other nonputrescibleorganicmatter.Somecomponentssuchascoffeegroundsareorganic,buttheyareessentiallynonbiodegradableoverthetimespanforgritcollectionanddisposal.Gritchambersaresedimentationtanksthatareplacedafterscreensandbeforeprimaryclarifiers.Thepurposeofagritchamberistoremovematerialsthatmayformheavydepositsinpipelines,protectpumps
In�uent E�uent
Comminutor
Motor and gear reducer
Valved drain for dewateringcomminutor channel
Figure 6.5 Diagrammatic layout of a comminutor.
94 Fundamentals of wastewater treatment and engineering
andothermechanicalequipment fromabrasion, reduce the frequencyofdigestercleaningcausedbygritaccumulation,andseparateheavier inertsolidsfromlighterbiodegradableorganicsolidsthataresenttosecondarybiologicaltreatment.Theamountofgritcollecteddependsonthewastewa-tercharacteristicsandthetypeofgritchamberusedattheplant.Gritcanbecoatedbygreaseorotherorganicmatter.So,gritremovedfromthegritchambersisusuallywashedtoremoveorganicmatterandthentransportedtoasanitarylandfillfordisposal.
Ingeneral,gritchambersaredesignedtoremoveparticleswithaspecificgravityof2.65 (sand)andnominaldiameterof0.20mmor larger,atawastewater temperature of 15.5°C (60°F). The settling velocity of theseparticlesisabout2.3cm/s(4.5ft/min)basedoncurvesofwastewatergritsettling velocities developed by Camp (1942). Grit chambers are some-timesdesignedtoremove0.15mmsandparticleswithasettlingvelocityof1.3cm/s(2.6ft/min),basedonCamp’scurves.Subsequentresearchhasrevealedthatthespecificgravityofgritcanrangefrom1.1to2.7(Eutek,2008; Metcalf and Eddy, 2003). Wilson et al. (2007) suggested a sand equivalent size (SES),whereSES is the sizeofaclean sandparticle thatsettlesatthesamerateasagritparticle.
Therearemainlythreetypesofgritchambers:
1.Horizontal flow grit chamber—Thisisasquareorrectangularopenchannelwithasufficientdetentiontimetoallowsedimentationofgritparticles,andaconstantvelocitytoscourtheorganics.Thevelocityiscontrolledbychanneldimensions,aninfluentdistributiongate,andaneffluentweir.Itmaybecleanedmanuallyorbymechanicalsludgescrapers.Itisfoundinolderinstallations.
2.Aerated grit chamber—This isusedinnewer installations.Aspiralflowpatternisintroducedinthewastewaterasitflowsthroughthetank,bysupplyingairfromadiffuserlocatedononesideofthetank.The air provides sufficient roll velocity to keep the lighter organicparticlesinsuspension,whileheaviergritparticlessettleatthebot-tom.Thelighterorganicparticlesarecarriedoutofthetankwiththewastewater.Ahopperisprovidedalongonesideofthetankforgritcollection.Theadvantagesofthesystemincludeminimalheadlossandthefactthataerationhelpsreducesepticconditionsinthewaste-water.Disadvantagesincludehighpowerconsumption,laborinten-sive,andpossibleodorissues.Figure 6.6illustratestheflowpatterninanaeratedgritchamber.Aeratedgritchambersaregenerallydesignedtoremoveparticles0.21mmdiameterorlargerwithadetentiontimeof2to5minatpeakhourlyflowrates.Typicalwidthtodepthratiois1.5:1,andlengthtowidthratiois4:1.Airsupplyrangesfrom0.2to0.5m3/minpermof length (3–8 ft3/ft·min) (MetcalfandEddy,2003).DesignofanaeratedgritchamberisshowninExample6.2.
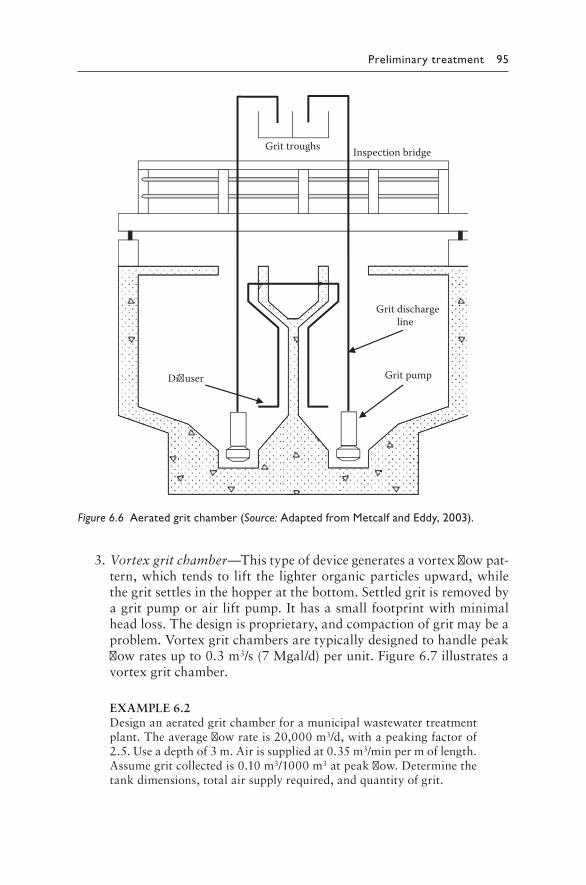
Preliminary treatment 95
3.Vortex grit chamber—Thistypeofdevicegeneratesavortexflowpat-tern,whichtendstolift the lighterorganicparticlesupward,whilethegritsettlesinthehopperatthebottom.Settledgritisremovedbyagritpumporairliftpump.Ithasasmallfootprintwithminimalheadloss.Thedesignisproprietary,andcompactionofgritmaybeaproblem.Vortexgritchambersaretypicallydesignedtohandlepeakflowratesupto0.3m3/s(7Mgal/d)perunit.Figure 6.7illustratesavortexgritchamber.
EXAMPLE6.2Designanaeratedgritchamberforamunicipalwastewatertreatmentplant.Theaverageflowrateis20,000m3/d,withapeakingfactorof2.5.Useadepthof3m.Airissuppliedat0.35m3/minpermoflength.Assumegritcollectedis0.10m3/1000m3atpeakflow.Determinethetankdimensions,totalairsupplyrequired,andquantityofgrit.
Grit troughs Inspection bridge
Grit dischargeline
Grit pumpDiuser
Figure 6.6 Aerated grit chamber (Source: Adapted from Metcalf and Eddy, 2003).
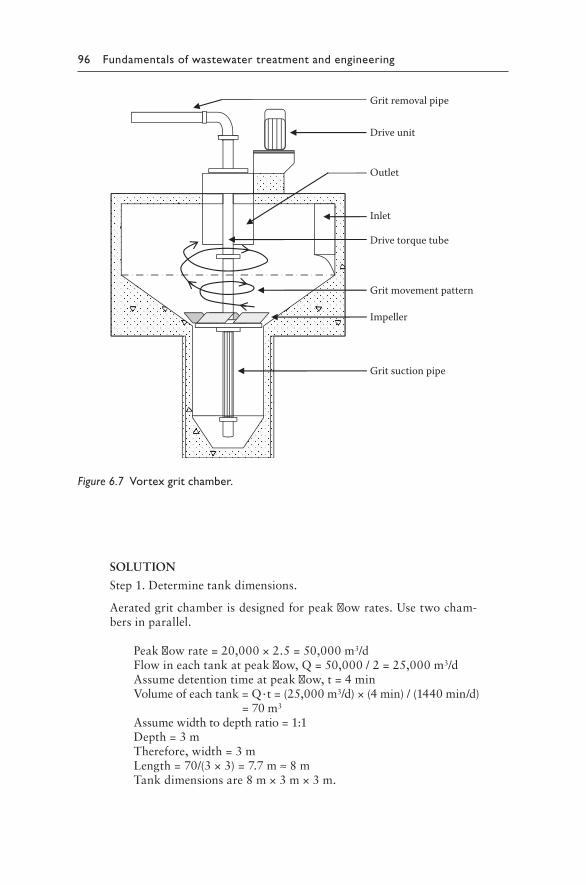
96 Fundamentals of wastewater treatment and engineering
SOLUTION
Step1.Determinetankdimensions.
Aeratedgritchamberisdesignedforpeakflowrates.Usetwocham-bersinparallel.
Peakflowrate=20,000×2.5=50,000m3/d Flowineachtankatpeakflow,Q=50,000/2=25,000m3/d Assumedetentiontimeatpeakflow,t=4min Volumeofeachtank=Q·t=(25,000m3/d)×(4min)/(1440min/d)
=70m3
Assumewidthtodepthratio=1:1 Depth=3m Therefore,width=3m Length=70/(3×3)=7.7m≈8m Tankdimensionsare8m×3m×3m.
Grit removal pipe
Drive unit
Drive torque tube
Outlet
Inlet
Impeller
Grit suction pipe
Grit movement pattern
Figure 6.7 Vortex grit chamber.
Preliminary treatment 97
Step2.Determinetotalairrequired.
Airrequired=(0.35m3/minperm)×8m=2.80m3/minforeachtank Totalairrequiredfor2tanks=2.80×2=5.60m3/min
Step3.Calculatevolumeofgrit.
Volumeofgrit=(0.10m3/1000m3)×25,000m3/d=2.5m3/dineachtank
Totalgritvolume=2.5×2=5.0m3/d
PROBLEMS
6.1 Drawaflowdiagramofapreliminarytreatmentprocessthatcon-sists of trash racks, two bar screens, two rotary drum screens, amacerator with a bypass channel, and an aerated grit chamber.Whathappenstothewastesremovedfromeachunit?
6.2 Whataretheadvantagesofinstallingabarscreenatanincline? 6.3 Whyshouldyouprovideabypasschannelwithacomminutor? 6.4 Thewaterelevationsupstreamanddownstreamofabarscreenare
0.89mand0.85m.Iftheapproachvelocityis0.45m/s,whatistheflowvelocitythroughthescreen?Thedischargecoefficientof thescreenis0.7.
6.5 Amechanicallycleanedbarscreenisusedinpreliminarytreatmentforthefollowingconditions:
Inclinefromvertical=30°Wastewaterflowrate=150,000m3/dApproachvelocity=0.6m/sOpenareaforflowthroughthescreen=1.6m2
Headlosscoefficientforcleanscreen=0.74Headlosscoefficientforcloggedscreen=0.60
a. Calculatethecleanwaterheadlossthroughthebarscreen. b. Calculatetheheadlossafter50%oftheflowareaisclogged
withsolids. 6.6 Estimatetheheadlossforabarscreensetata30°inclinefromthe
vertical.Thewastewaterflowrateis90,000m3/d.Thebarsare20mmindiameter,with25mmclear spacing inbetweenbars.Thewaterdepthis1.2m,channelwidthis1.5m,approachvelocityis0.65m/s,andtheheadlosscoefficientis0.65.
6.7 Whatisgrit?Whataretheobjectivesofgritremovalfromthewaste-water?Whatisthedisposalmethodforcollectedgrit?
6.8 Find thenameof thewastewater treatmentplant that serves yourlocality.Whatunitoperationsareusedaspreliminarytreatmentattheplant?Drawaflowdiagramofthepreliminarytreatmentprocess.
98 Fundamentals of wastewater treatment and engineering
6.9 Design a grit chamber for a wastewater treatment plant with anaverageflowrateof25,000m3/dandapeakflowrateof55,000m3/d.Thedetentiontimeatpeakflowis3.0min.Thewidthtodepthratiois2:1.Useadepthof2m.Theaerationrateis0.4m3/minpermoftanklength.Determinethetotalairrequiredanddimensionsofthegritchamber.
REFERENCES
Camp,T.R.(1942)“GritChamberDesign.”Sewage Works J.,vol.14,pp.368–381.Davis,M.(2011)Water and Wastewater Engineering: Design Principles and Practice.
McGraw-Hill,Inc.,NewYork.Droste,R.L.(1997)Theory and Practice of Water and Wastewater Treatment.John
Wiley&Sons,Inc.,Hoboken,NewJersey.EPA(1999)“CombinedSewerOverflowTechnologyFactSheet:Screens.”EPA832-
F-99-040, United States Environmental Protection Agency, Office of Water,Washington,D.C.
Eutek(2008)EutekSystems,Hillboro,Oregon.Metcalf and Eddy, Inc. (2003) Wastewater Engineering: Treatment and Reuse.
Fourthedition.McGraw-Hill,Inc.,NewYork.Peavy,H.S.,Rowe,D.R.,andTchobanoglous,G.(1985)Environmental Engineer-
ing,McGraw-Hill,Inc.,NewYork.Wilson, G., Tchobanoglous, G., and Griffiths, J. (2007)“The Nitty Gritty: Grit
SamplingandAnalysis.”Water Environment & Technology,July,pp.64–68.
99
Chapter 7
Primary treatment
7.1 INTRODUCTION
Theobjectiveofprimarytreatment is toremoveasignificant fractionofthe suspended solids andfloatingmaterial from thewastewaterby sedi-mentation.Thesuspendedsolidsremovedareorganicinnature,andthuscontribute to theBOD (biochemicaloxygendemand)of the sludge.Thefloatingmaterialcanincludeoil,grease,rags,etc.thatwerenotremovedinupstreamprocesses.Theseareremovedasscumfromthewatersurfaceinthetank.Theremovaloflargerorganicsolidshelpstoreducetheloadonthesecondarybiologicalreactors.Thesolidsremovedarefurthertreatedindigesters,orotherprocesses,andstabilizedbeforedisposal.
Primary treatment mainly involves sedimentation or settling by grav-ity.Thevarioustypesofsettlingthatareobservedinwaterandwastewa-tertreatmentoperationsaredescribedinthefollowingsections. Insomecases, sedimentation is enhancedby the additionof coagulatingorfloc-culationagents.Theprocessiscalledenhancedclarification,orchemically enhanced primary treatment.Thisisdiscussedinmoredetailattheendofthechapter.
7.2 TYPES OF SETTLING/SEDIMENTATION
Therearemainlyfourtypesofgravitationalsettlingobservedinwaterandwastewatertreatmentoperations:
1.Type I or discrete particle settling—Particleswhosesize,shapeandspecificgravitydonotchangewithtimearecalleddiscrete particles(Peavyetal.,1985).TypeIsedimentationreferstothesettlingofdis-creteparticlesinadilutesuspension,wheretheparticleconcentrationislowenoughthattheparticlessettleasindividualentities.Thereisno interferenceofvelocityfieldswithneighboringparticles.Thistypeofsettlingisusuallyobservedingritchambers.
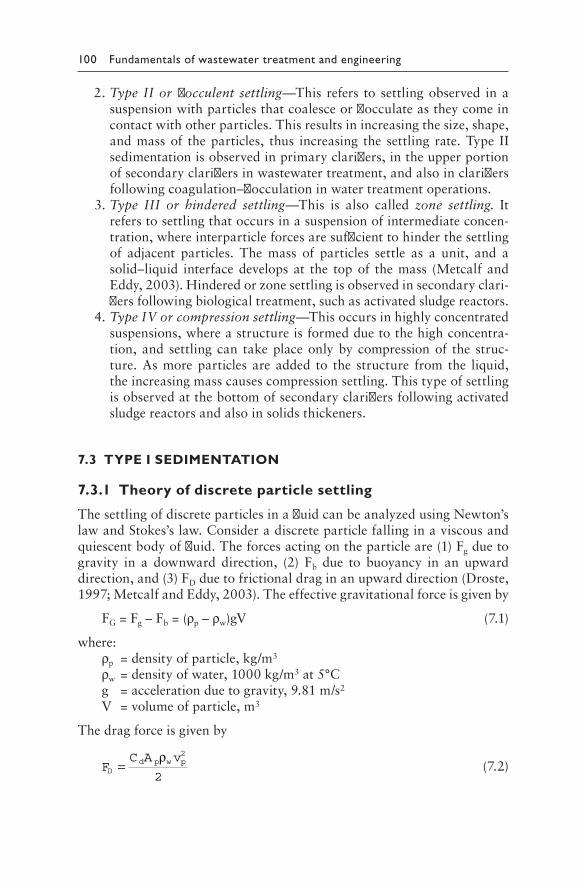
100 Fundamentals of wastewater treatment and engineering
2.Type II or flocculent settling—This refers to settlingobserved inasuspensionwithparticlesthatcoalesceorflocculateastheycomeincontactwithotherparticles.Thisresultsinincreasingthesize,shape,andmassof theparticles, thus increasing the settling rate.Type IIsedimentationisobservedinprimaryclarifiers,intheupperportionofsecondaryclarifiersinwastewatertreatment,andalsoinclarifiersfollowingcoagulation–flocculationinwatertreatmentoperations.
3.Type III or hindered settling—This is also called zone settling. Itreferstosettlingthatoccursinasuspensionofintermediateconcen-tration,whereinterparticleforcesaresufficienttohinderthesettlingof adjacent particles. The mass of particles settle as a unit, and asolid–liquid interfacedevelops at the topof themass (Metcalf andEddy,2003).Hinderedorzonesettlingisobservedinsecondaryclari-fiersfollowingbiologicaltreatment,suchasactivatedsludgereactors.
4.Type IV or compression settling—Thisoccursinhighlyconcentratedsuspensions,whereastructureisformedduetothehighconcentra-tion, and settling can takeplaceonlyby compressionof the struc-ture.Asmoreparticles are added to the structure from the liquid,theincreasingmasscausescompressionsettling.Thistypeofsettlingisobservedatthebottomofsecondaryclarifiersfollowingactivatedsludgereactorsandalsoinsolidsthickeners.
7.3 TYPE I SEDIMENTATION
7.3.1 Theory of discrete particle settling
ThesettlingofdiscreteparticlesinafluidcanbeanalyzedusingNewton’slawandStokes’slaw.Consideradiscreteparticlefallinginaviscousandquiescentbodyoffluid.Theforcesactingontheparticleare(1)Fgduetogravity in a downward direction, (2) Fb due to buoyancy in an upwarddirection,and(3)FDduetofrictionaldraginanupwarddirection(Droste,1997;MetcalfandEddy,2003).Theeffectivegravitationalforceisgivenby
FG=Fg–Fb=(ρp–ρw)gV (7.1)
where:ρp=densityofparticle,kg/m3
ρw=densityofwater,1000kg/m3at5°Cg=accelerationduetogravity,9.81m/s2
V =volumeofparticle,m3
Thedragforceisgivenby
FC A v
Dd p w p=
ρ 2
2 (7.2)
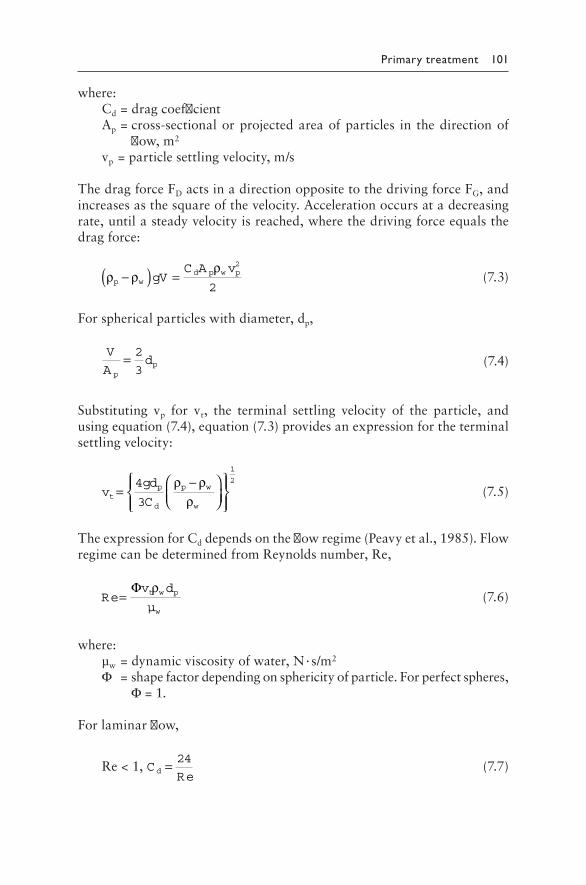
Primary treatment 101
where:Cd=dragcoefficientAp=cross-sectionalorprojectedareaofparticles in thedirectionof
flow,m2
vp=particlesettlingvelocity,m/s
ThedragforceFDactsinadirectionoppositetothedrivingforceFG,andincreasesasthesquareofthevelocity.Accelerationoccursatadecreasingrate,untilasteadyvelocityisreached,wherethedrivingforceequalsthedragforce:
ρ ρρ
p wd p w pgV
C A v−( ) =
2
2 (7.3)
Forsphericalparticleswithdiameter,dp,
V
Ad
pp= 2
3 (7.4)
Substituting vp for vt, the terminal settling velocity of the particle, andusingequation(7.4),equation(7.3)providesanexpressionfortheterminalsettlingvelocity:
vgd
Ct
p
d
p w
w
=−
4
3
1
2ρ ρρ
(7.5)
TheexpressionforCddependsontheflowregime(Peavyetal.,1985).FlowregimecanbedeterminedfromReynoldsnumber,Re,
Re=Φv d
µt w p
w
ρ (7.6)
where:µw=dynamicviscosityofwater,N·s/m2
Φ=shapefactordependingonsphericityofparticle.Forperfectspheres,Φ=1.
Forlaminarflow,
Re<1,Cd = 24
Re (7.7)
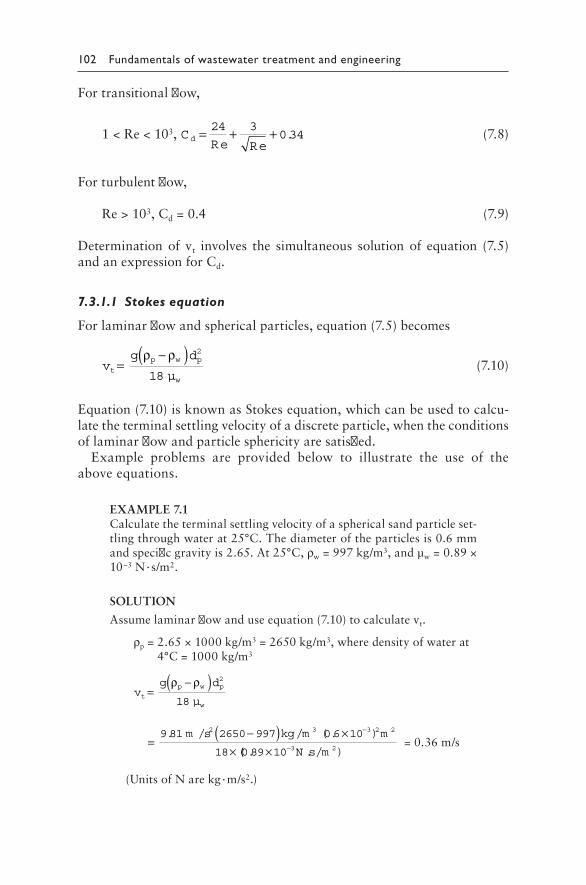
102 Fundamentals of wastewater treatment and engineering
Fortransitionalflow,
1<Re<103,Cd = + +24 30 34
Re Re. (7.8)
Forturbulentflow,
Re>103,Cd=0.4 (7.9)
Determinationof vt involves the simultaneous solutionof equation (7.5)andanexpressionforCd.
7.3.1.1 Stokes equation
Forlaminarflowandsphericalparticles,equation(7.5)becomes
vg d
µt
p w p
w
=−( )ρ ρ 2
18 (7.10)
Equation(7.10)isknownasStokesequation,whichcanbeusedtocalcu-latetheterminalsettlingvelocityofadiscreteparticle,whentheconditionsoflaminarflowandparticlesphericityaresatisfied.
Example problems are provided below to illustrate the use of theaboveequations.
EXAMPLE7.1Calculatetheterminalsettlingvelocityofasphericalsandparticleset-tlingthroughwaterat25°C.Thediameteroftheparticlesis0.6mmandspecificgravityis2.65.At25°C,ρw=997kg/m3,andµw=0.89×10–3N·s/m2.
SOLUTION
Assumelaminarflowanduseequation(7.10)tocalculatevt.
ρp=2.65×1000kg/m3=2650kg/m3,wheredensityofwaterat4°C=1000kg/m3
vg d
µt
p w p
w
=−( )ρ ρ 2
18
=
−( ) ××
−. / / ( . )9 81 2650 997 0 6 10
18
2 3 3 2 2m s kg m m
(( . . / )0 89 10 3 2× − N s m=0.36m/s
(UnitsofNarekg·m/s2.)
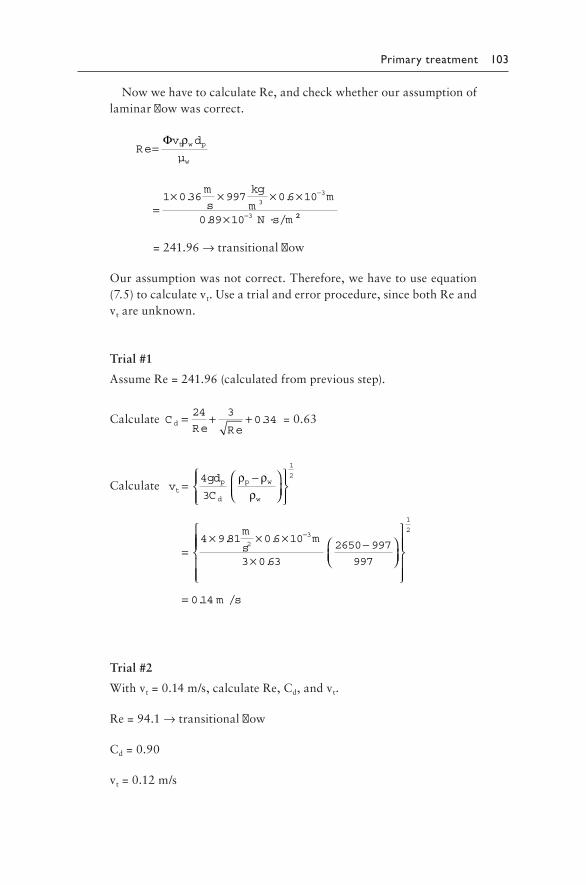
Primary treatment 103
NowwehavetocalculateRe,andcheckwhetherourassumptionoflaminarflowwascorrect.
Re=Φv d
µt w p
w
ρ
=
× × × ×
×
−
−
1 0 36 997 0 6 10
0 89 10
33
3
. .
. · /
m
s
kg
mm
N s m 22
=241.96→transitionalflow
Ourassumptionwasnotcorrect.Therefore,wehavetouseequation(7.5)tocalculatevt.Useatrialanderrorprocedure,sincebothReandvtareunknown.
Trial#1
AssumeRe=241.96(calculatedfrompreviousstep).
CalculateCRe Re
d = + +24 30 34. =0.63
Calculate
vgd
Ct
p
d
p w
w
=−
=×
4
3
4 9
1
2ρ ρρ
.. .
.
81 0 6 10
3 0 63
2650 997
997
23m
sm× ×
×−
−
=
1
2
0 14. /m s
Trial#2
Withvt=0.14m/s,calculateRe,Cd,andvt.
Re=94.1→transitionalflow
Cd=0.90
vt=0.12m/s
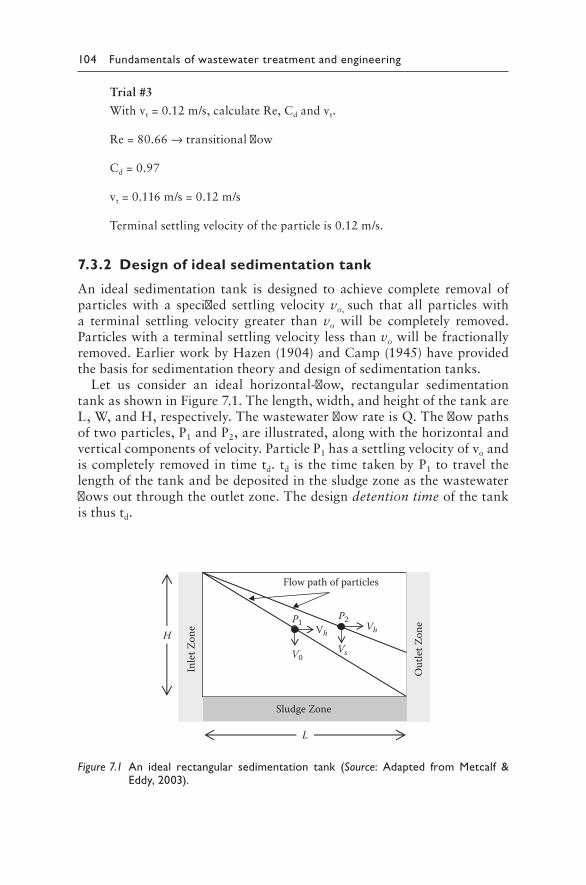
104 Fundamentals of wastewater treatment and engineering
Trial#3
Withvt=0.12m/s,calculateRe,Cdandvt.
Re=80.66→transitionalflow
Cd=0.97
vt=0.116m/s=0.12m/s
Terminalsettlingvelocityoftheparticleis0.12m/s.
7.3.2 Design of ideal sedimentation tank
An ideal sedimentation tank is designed to achieve complete removalofparticles with a specified settling velocity vo, such that all particleswitha terminal settling velocity greater than vo will be completely removed.Particleswithaterminalsettlingvelocitylessthanvowillbefractionallyremoved.EarlierworkbyHazen(1904)andCamp(1945)haveprovidedthebasisforsedimentationtheoryanddesignofsedimentationtanks.
Let us consider an ideal horizontal-flow, rectangular sedimentationtankasshowninFigure 7.1.Thelength,width,andheightofthetankareL,W,andH,respectively.ThewastewaterflowrateisQ.Theflowpathsoftwoparticles,P1andP2,areillustrated,alongwiththehorizontalandverticalcomponentsofvelocity.ParticleP1hasasettlingvelocityofvoandiscompletelyremovedintimetd.td isthetimetakenbyP1totravelthelengthofthetankandbedepositedinthesludgezoneasthewastewaterflowsoutthroughtheoutletzone.Thedesigndetention timeofthetankisthustd.
Inle
t Zon
e
Out
let Z
one
L
HP1
P2
V0Vs
VhVh
Flow path of particles
Sludge Zone
Figure 7.1 An ideal rectangular sedimentation tank (Source: Adapted from Metcalf & Eddy, 2003).
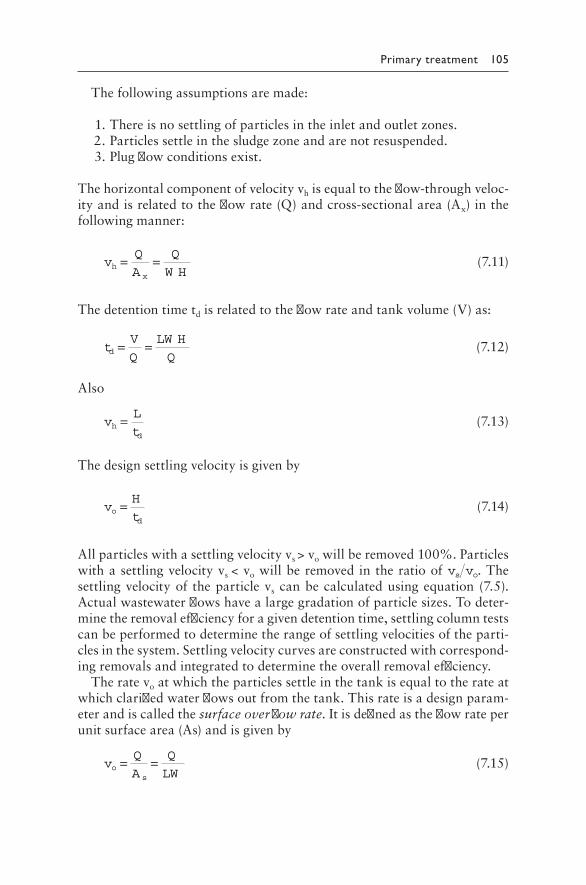
Primary treatment 105
Thefollowingassumptionsaremade:
1.Thereisnosettlingofparticlesintheinletandoutletzones. 2.Particlessettleinthesludgezoneandarenotresuspended. 3.Plugflowconditionsexist.
Thehorizontalcomponentofvelocityvhisequaltotheflow-throughveloc-ityandisrelatedtotheflowrate(Q)andcross-sectionalarea(Ax)inthefollowingmanner:
vQ
A
Q
W Hh
x
= = (7.11)
Thedetentiontimetdisrelatedtotheflowrateandtankvolume(V)as:
tV
Q
LW H
Qd = = (7.12)
Also
vL
th
d
= (7.13)
Thedesignsettlingvelocityisgivenby
vH
to
d
= (7.14)
Allparticleswithasettlingvelocityvs>vowillberemoved100%.Particleswithasettlingvelocityvs<vowillberemovedintheratioofv vs o.Thesettlingvelocityof theparticlevscanbecalculatedusingequation (7.5).Actualwastewaterflowshavealargegradationofparticlesizes.Todeter-minetheremovalefficiencyforagivendetentiontime,settlingcolumntestscanbeperformedtodeterminetherangeofsettlingvelocitiesoftheparti-clesinthesystem.Settlingvelocitycurvesareconstructedwithcorrespond-ingremovalsandintegratedtodeterminetheoverallremovalefficiency.
Theratevoatwhichtheparticlessettleinthetankisequaltotherateatwhichclarifiedwaterflowsoutfromthetank.Thisrateisadesignparam-eterandiscalledthesurface overflow rate.Itisdefinedastheflowrateperunitsurfacearea(As)andisgivenby
vQ
A
Q
LWo
s
= = (7.15)
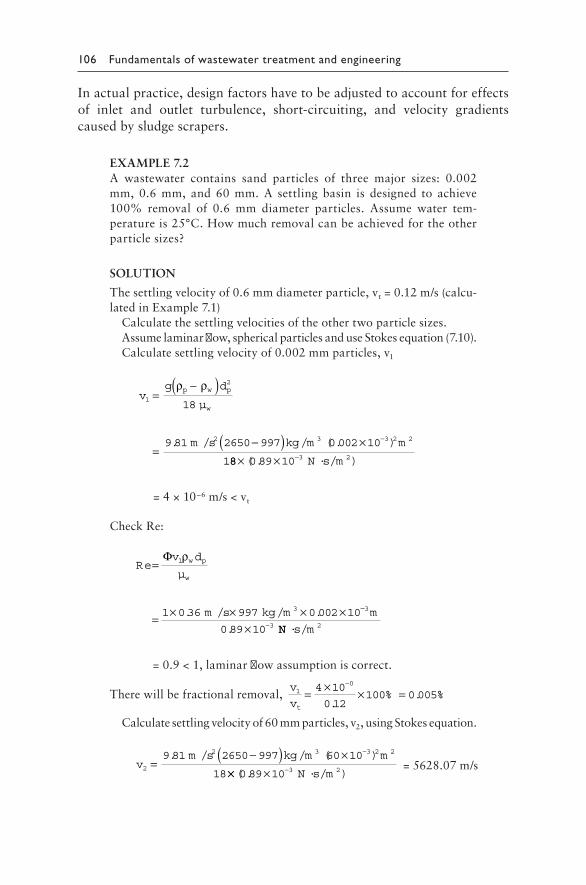
106 Fundamentals of wastewater treatment and engineering
Inactualpractice,designfactorshavetobeadjustedtoaccountforeffectsof inlet and outlet turbulence, short-circuiting, and velocity gradientscausedbysludgescrapers.
EXAMPLE7.2A wastewater contains sand particles of three major sizes: 0.002mm, 0.6 mm, and 60 mm. A settling basin is designed to achieve100% removal of 0.6 mm diameter particles. Assume water tem-peratureis25°C.Howmuchremovalcanbeachievedfortheotherparticlesizes?
SOLUTION
Thesettlingvelocityof0.6mmdiameterparticle,vt=0.12m/s(calcu-latedinExample7.1)
Calculatethesettlingvelocitiesoftheothertwoparticlesizes.Assumelaminarflow,sphericalparticlesanduseStokesequation(7.10).Calculatesettlingvelocityof0.002mmparticles,v1
vg d
µ
p w p
w1
2
18=
−( )ρ ρ
=−( ) × −. / / ( . )9 81 2650 997 0 002 10
1
2 3 3 2 2m s kg m m
88 0 89 10 3 2× × −( . · / )N s m
=4×10⁻⁶m/s<vt
CheckRe:
Re=Φv d
µw p
w
1ρ
= × × × ×
×
−
−1 0 36 997 0 002 10
0 89 10
3 3
3
. / / .
.
m s kg m m
NN s m· / 2
=0.9<1,laminarflowassumptioniscorrect.
Therewillbefractionalremoval,v
vt
104 10
0 12100 0 005= × × =
−
.% . %
Calculatesettlingvelocityof60mmparticles,v2,usingStokesequation.
v
m s kg m m2
2 3 3 2 29 81 2650 997 60 10
18=
−( ) × −. / / ( )
×× × −( . · / )0 89 10 3 2N s m=5628.07m/s
Primary treatment 107
CheckRe:
Re
. / /
.= × × × ×
×
−
−1 0 36 997 60 10
0 89 10
3 3
3
m s kg m m
N ·· /s m 2
=24,196.85>103,turbulentflow
UseCd=0.4.
Calculatev2usingequation(7.5).
vgd
Cp
d
p w
w2
1
24
3
4 9 8
=−
= ×
ρ ρρ
. 11 60 10
3 0 4
2650 997
997
2 3m s m/
.
× ××
−
−
1
2
=1.80m/s>vt,therefore100%removalof60mmparticleswillbeachieved.
7.4 TYPE II SEDIMENTATION
TypeIIsedimentationinvolvesthesettlingofflocculentparticles.Asfloc-culationoccurs,theshapeandmassoftheparticlesincrease,resultinginanincreaseinsettlingvelocities.Asettlingcolumntestcanbeusedtodeter-minethesettlingcharacteristicsandremovalefficiencyofflocculentpar-ticles.Asettlingcolumnwithsamplingportssituatedatregularintervalsofdepthisused,asillustratedinFigure 7.2(a).Theheightofthecolumnshouldbeequaltotheproposedtankdepth.Thetestdurationshouldbeequaltotheproposeddetentiontime.Settlingshouldtakeplaceunderqui-escent conditions. A suspension with solids concentration similar to thewastewaterisintroducedatthetopofthecolumn.Atregulartimeinter-vals,samplesarewithdrawnfromalltheportsandanalyzedforsuspendedsolidsconcentration.
Thepercentremovalatithtimeintervalforjthportisgivenby
RC
Cij
ij
o
= −
×1 100% (7.16)
where:Co=initialconcentrationofsuspension,mg/LCij=concentrationatithtimeintervalforsamplefromjthport,mg/L
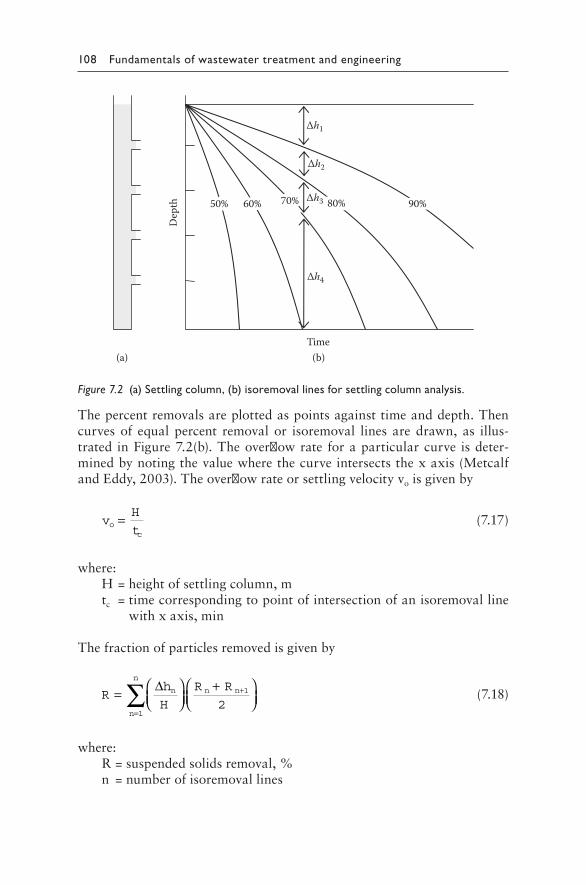
108 Fundamentals of wastewater treatment and engineering
Thepercentremovalsareplottedaspointsagainsttimeanddepth.Thencurvesof equalpercent removalor isoremoval lines aredrawn, as illus-trated inFigure 7.2(b).Theoverflowrate foraparticularcurve isdeter-minedbynotingthevaluewherethecurveintersectsthexaxis(MetcalfandEddy,2003).Theoverflowrateorsettlingvelocityvoisgivenby
vH
to
c
= (7.17)
where:H=heightofsettlingcolumn,mtc=timecorrespondingtopointofintersectionofanisoremovalline
withxaxis,min
Thefractionofparticlesremovedisgivenby
Rh
H
R R
n
n
n n n=
+
=
+∑1
1
2
∆ (7.18)
where:R=suspendedsolidsremoval,%n=numberofisoremovallines
50% 60% 70% 80% 90%
Time
Dep
th
∆h1
∆h2
∆h3
∆h4
(b)(a)
Figure 7.2 (a) Settling column, (b) isoremoval lines for settling column analysis.
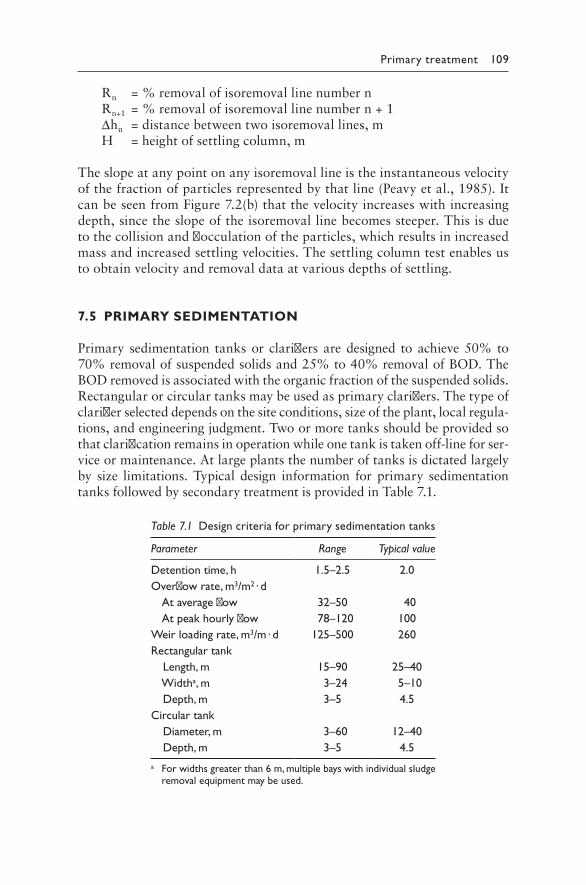
Primary treatment 109
Rn=%removalofisoremovallinenumbernRn+1=%removalofisoremovallinenumbern+1Δhn=distancebetweentwoisoremovallines,mH=heightofsettlingcolumn,m
Theslopeatanypointonanyisoremovallineistheinstantaneousvelocityofthefractionofparticlesrepresentedbythatline(Peavyetal.,1985).ItcanbeseenfromFigure 7.2(b)thatthevelocityincreaseswithincreasingdepth,sincetheslopeoftheisoremovallinebecomessteeper.Thisisduetothecollisionandflocculationoftheparticles,whichresultsinincreasedmassandincreasedsettlingvelocities.Thesettlingcolumntestenablesustoobtainvelocityandremovaldataatvariousdepthsofsettling.
7.5 PRIMARY SEDIMENTATION
Primary sedimentation tanksor clarifiers aredesigned toachieve50% to70%removalofsuspendedsolidsand25%to40%removalofBOD.TheBODremovedisassociatedwiththeorganicfractionofthesuspendedsolids.Rectangularorcirculartanksmaybeusedasprimaryclarifiers.Thetypeofclarifierselecteddependsonthesiteconditions,sizeoftheplant,localregula-tions,andengineeringjudgment.Twoormoretanksshouldbeprovidedsothatclarificationremainsinoperationwhileonetankistakenoff-lineforser-viceormaintenance.Atlargeplantsthenumberoftanksisdictatedlargelyby size limitations.Typical design information forprimary sedimentationtanksfollowedbysecondarytreatmentisprovidedinTable 7.1.
Table 7.1 Design criteria for primary sedimentation tanks
Parameter Range Typical value
Detention time, h 1.5–2.5 2.0Overflow rate, m3/m2 · d At average flow 32–50 40 At peak hourly flow 78–120 100Weir loading rate, m3/m · d 125–500 260Rectangular tank Length, m 15–90 25–40 Widtha, m 3–24 5–10 Depth, m 3–5 4.5Circular tank Diameter, m 3–60 12–40 Depth, m 3–5 4.5a For widths greater than 6 m, multiple bays with individual sludge
removal equipment may be used.
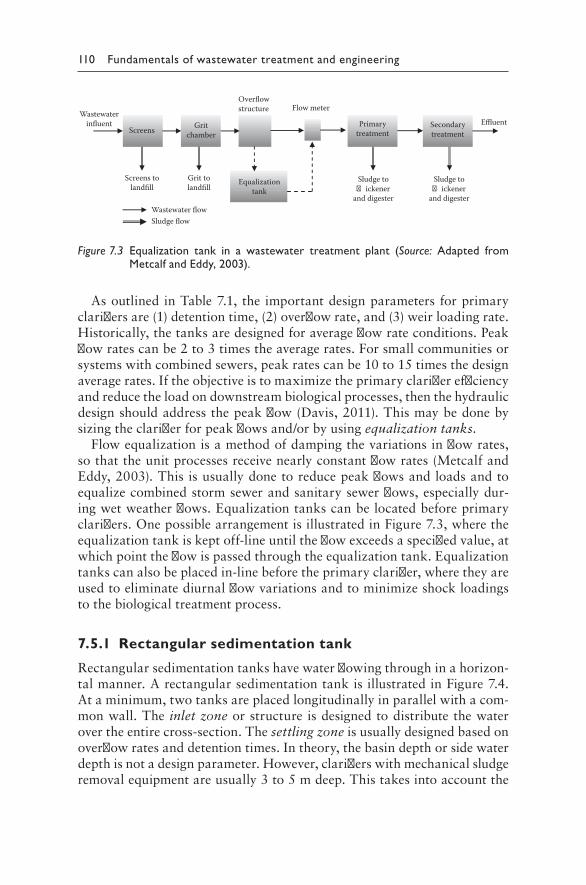
110 Fundamentals of wastewater treatment and engineering
AsoutlinedinTable 7.1,the importantdesignparametersforprimaryclarifiersare(1)detentiontime,(2)overflowrate,and(3)weirloadingrate.Historically,thetanksaredesignedforaverageflowrateconditions.Peakflowratescanbe2to3timestheaveragerates.Forsmallcommunitiesorsystemswithcombinedsewers,peakratescanbe10to15timesthedesignaveragerates.Iftheobjectiveistomaximizetheprimaryclarifierefficiencyandreducetheloadondownstreambiologicalprocesses,thenthehydraulicdesignshouldaddressthepeakflow(Davis,2011).Thismaybedonebysizingtheclarifierforpeakflowsand/orbyusingequalization tanks.
Flowequalizationisamethodofdampingthevariationsinflowrates,sothattheunitprocessesreceivenearlyconstantflowrates(MetcalfandEddy,2003).Thisisusuallydonetoreducepeakflowsandloadsandtoequalizecombinedstormsewerandsanitarysewerflows,especiallydur-ingwetweatherflows.Equalizationtankscanbelocatedbeforeprimaryclarifiers.OnepossiblearrangementisillustratedinFigure 7.3,wheretheequalizationtankiskeptoff-lineuntiltheflowexceedsaspecifiedvalue,atwhichpointtheflowispassedthroughtheequalizationtank.Equalizationtankscanalsobeplacedin-linebeforetheprimaryclarifier,wheretheyareusedtoeliminatediurnalflowvariationsandtominimizeshockloadingstothebiologicaltreatmentprocess.
7.5.1 Rectangular sedimentation tank
Rectangularsedimentationtankshavewaterflowingthroughinahorizon-talmanner.ArectangularsedimentationtankisillustratedinFigure 7.4.Ataminimum,twotanksareplacedlongitudinallyinparallelwithacom-monwall.The inlet zoneorstructureisdesignedtodistributethewaterovertheentirecross-section.Thesettling zoneisusuallydesignedbasedonoverflowratesanddetentiontimes.Intheory,thebasindepthorsidewaterdepthisnotadesignparameter.However,clarifierswithmechanicalsludgeremovalequipmentareusually3to5mdeep.Thistakesintoaccountthe
Screens Gritchamber
Overflowstructure
Grit tolandfill
Screens tolandfill
Wastewater flowSludge flow
Wastewaterinfluent Primary
treatmentEffluent
Equalizationtank
Flow meter
Secondarytreatment
Sludge to�ickener
and digester
Sludge to�ickener
and digester
Figure 7.3 Equalization tank in a wastewater treatment plant (Source: Adapted from Metcalf and Eddy, 2003).
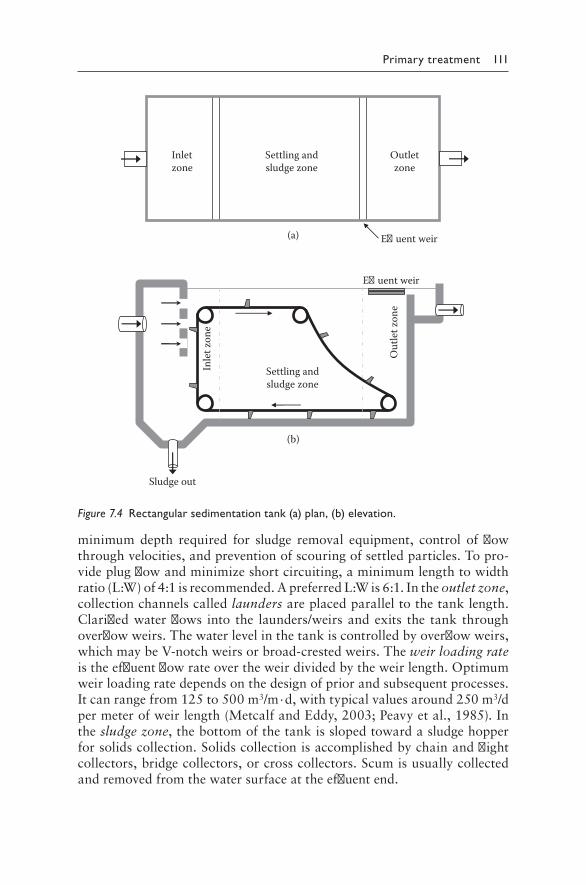
Primary treatment 111
minimum depth required for sludge removal equipment, control of flowthroughvelocities,andpreventionofscouringofsettledparticles.Topro-videplugflowandminimizeshortcircuiting,aminimumlengthtowidthratio(L:W)of4:1isrecommended.ApreferredL:Wis6:1.Intheoutlet zone,collectionchannelscalledlaundersareplacedparalleltothetanklength.Clarifiedwaterflows into the launders/weirsandexits the tank throughoverflowweirs.Thewaterlevelinthetankiscontrolledbyoverflowweirs,whichmaybeV-notchweirsorbroad-crestedweirs.Theweir loading rateistheeffluentflowrateovertheweirdividedbytheweirlength.Optimumweirloadingratedependsonthedesignofpriorandsubsequentprocesses.Itcanrangefrom125to500m3/m·d,withtypicalvaluesaround250m3/dpermeterofweirlength(MetcalfandEddy,2003;Peavyetal.,1985).Inthesludge zone,thebottomofthetankisslopedtowardasludgehopperforsolidscollection.Solidscollectionisaccomplishedbychainandflightcollectors,bridgecollectors,orcrosscollectors.Scumisusuallycollectedandremovedfromthewatersurfaceattheeffluentend.
Settling andsludge zone
Inletzone
Outletzone
(a) E�uent weir
Inle
t zon
e
Out
let z
one
Settling andsludge zone
E�uent weir
Sludge out
(b)
Figure 7.4 Rectangular sedimentation tank (a) plan, (b) elevation.
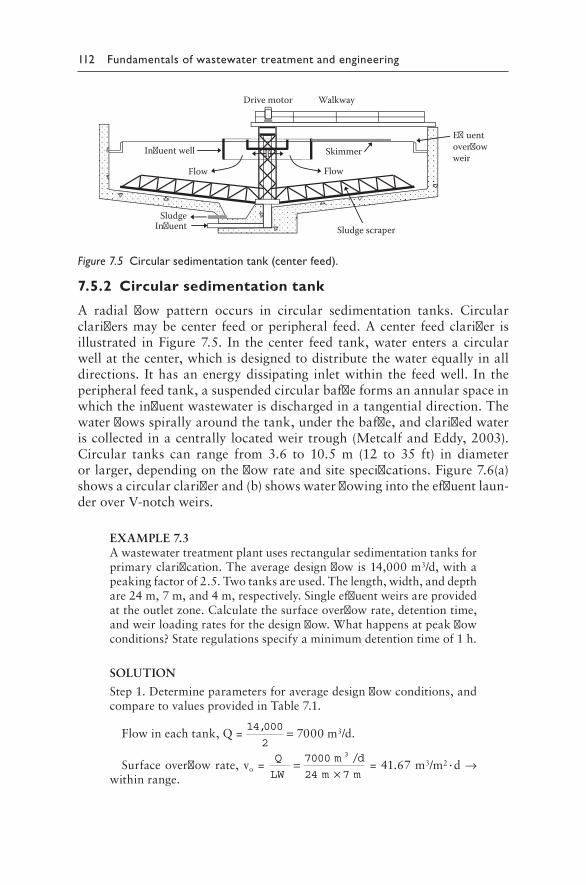
112 Fundamentals of wastewater treatment and engineering
7.5.2 Circular sedimentation tank
A radial flow pattern occurs in circular sedimentation tanks. Circularclarifiersmaybecenter feedorperipheral feed.Acenter feedclarifier isillustrated inFigure 7.5. In the center feed tank,water enters a circularwellatthecenter,whichisdesignedtodistributethewaterequallyinalldirections. Ithasanenergydissipating inletwithin the feedwell. In theperipheralfeedtank,asuspendedcircularbaffleformsanannularspaceinwhichtheinfluentwastewaterisdischargedinatangentialdirection.Thewaterflowsspirallyaroundthetank,underthebaffle,andclarifiedwateriscollectedinacentrally locatedweirtrough(MetcalfandEddy,2003).Circular tanks can range from 3.6 to 10.5 m (12 to 35 ft) in diameterorlarger,dependingontheflowrateandsitespecifications.Figure 7.6(a)showsacircularclarifierand(b)showswaterflowingintotheeffluentlaun-deroverV-notchweirs.
EXAMPLE7.3Awastewatertreatmentplantusesrectangularsedimentationtanksforprimaryclarification.Theaveragedesignflowis14,000m3/d,withapeakingfactorof2.5.Twotanksareused.Thelength,width,anddepthare24m,7m,and4m,respectively.Singleeffluentweirsareprovidedattheoutletzone.Calculatethesurfaceoverflowrate,detentiontime,andweirloadingratesforthedesignflow.Whathappensatpeakflowconditions?Stateregulationsspecifyaminimumdetentiontimeof1h.
SOLUTION
Step1.Determineparametersforaveragedesignflowconditions,andcomparetovaluesprovidedinTable 7.1.
Flowineachtank,Q=14 000
2
, =7000m3/d.
Surfaceoverflowrate,vo=Q
LW
m d
m m=
×7000
24 7
3 /
=41.67m3/m2·d→
withinrange.
Walkway
Sludge scraper
SkimmerE�uentover�owweir
Flow Flow
In�uentSludge
Drive motor
In�uent well
Figure 7.5 Circular sedimentation tank (center feed).
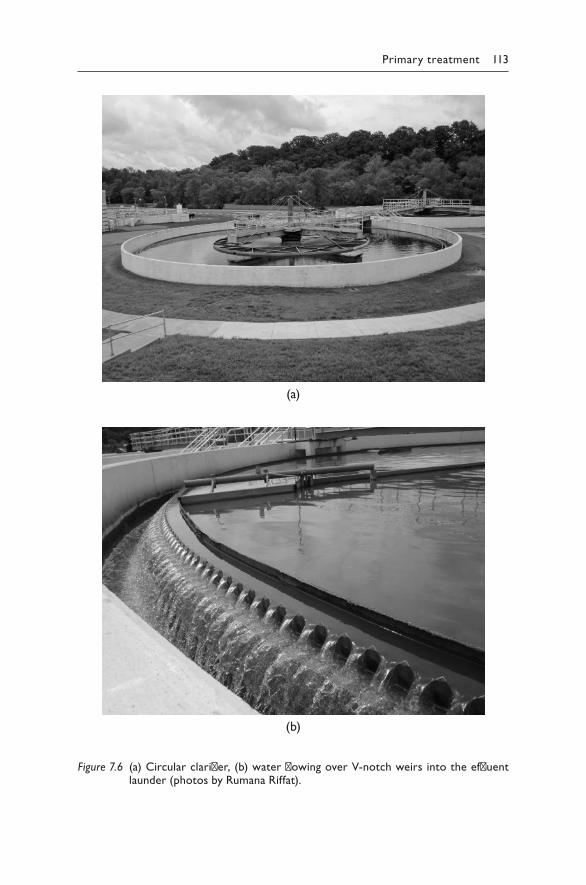
Primary treatment 113
(a)
(b)
Figure 7.6 (a) Circular clarifier, (b) water flowing over V-notch weirs into the effluent launder (photos by Rumana Riffat).
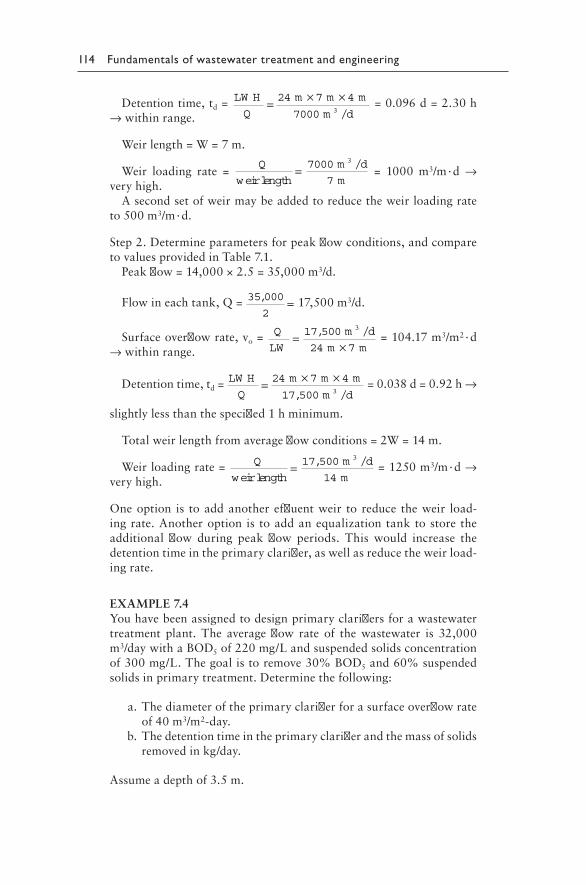
114 Fundamentals of wastewater treatment and engineering
Detentiontime,td= LW H
Q
m m m
m d= × ×24 7 4
7000 3 / =0.096d=2.30h
→withinrange.
Weirlength=W=7m.
Weir loading rate =Q m d
mweirlength= /7000
7
3
= 1000 m3/m·d →
veryhigh.Asecondsetofweirmaybeaddedtoreducetheweirloadingrate
to500m3/m·d.
Step2.Determineparametersforpeakflowconditions,andcomparetovaluesprovidedinTable 7.1.
Peakflow=14,000×2.5=35,000m3/d.
Flowineachtank,Q=35 0002
, =17,500m3/d.
Surfaceoverflowrate,vo= Q
LW
m d
m m=
×, /17 500
24 7
3
=104.17m3/m2·d
→withinrange.
Detentiontime,td=LW H
Q
m m m
m d= × ×24 7 4
17 500 3, / =0.038d=0.92h→
slightlylessthanthespecified1hminimum.
Totalweirlengthfromaverageflowconditions=2W=14m.
Weirloadingrate= Q m d
mweirlength= , /17 500
14
3
=1250m3/m·d→
veryhigh.
Oneoption is toaddanothereffluentweir toreduce theweir load-ingrate.Anotheroptionis toaddanequalizationtanktostoretheadditional flow during peak flow periods. This would increase thedetentiontimeintheprimaryclarifier,aswellasreducetheweirload-ingrate.
EXAMPLE7.4Youhavebeenassignedtodesignprimaryclarifiersforawastewatertreatment plant. The average flow rate of the wastewater is 32,000m3/daywithaBOD5of220mg/Landsuspendedsolidsconcentrationof300mg/L.Thegoalistoremove30%BOD5and60%suspendedsolidsinprimarytreatment.Determinethefollowing:
a.Thediameteroftheprimaryclarifierforasurfaceoverflowrateof40m3/m2-day.
b.Thedetentiontimeintheprimaryclarifierandthemassofsolidsremovedinkg/day.
Assumeadepthof3.5m.
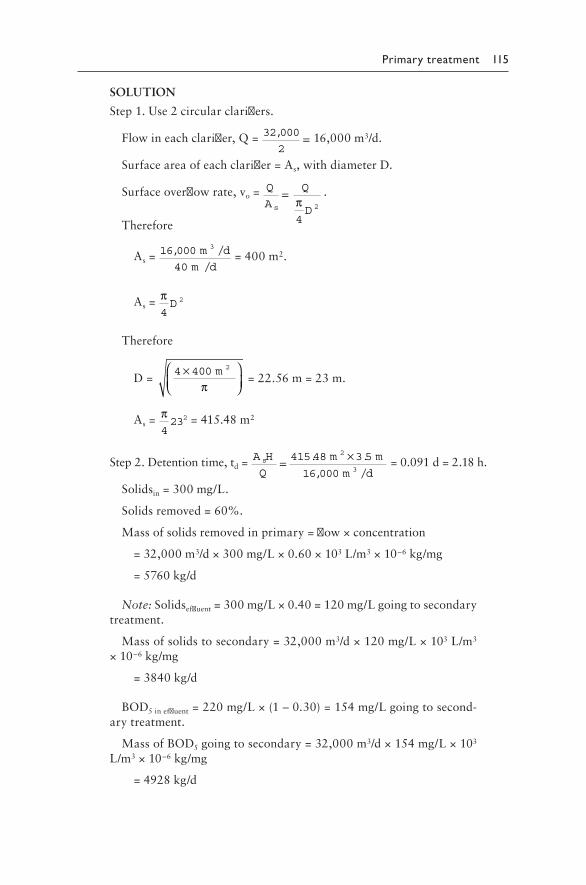
Primary treatment 115
SOLUTION
Step1.Use2circularclarifiers.
Flowineachclarifier,Q=32 0002
, =16,000m3/d.
Surfaceareaofeachclarifier=As,withdiameterD.
Surfaceoverflowrate,vo= QA
Q
Ds
=π4
2
.
Therefore
As=16 00040
3, /
/
m d
m d =400m2.
As= π4
2D
Therefore
D=4 400 2×
m
π=22.56m=23m.
As= π4232=415.48m2
Step2.Detentiontime,td=A H
Q
m m
m ds = ×415 48 3 5
16 000
2
3
. .
, /=0.091d=2.18h.
Solidsin=300mg/L.
Solidsremoved=60%.
Massofsolidsremovedinprimary=flow×concentration
=32,000m3/d×300mg/L×0.60×103L/m3×10–6kg/mg
=5760kg/d
Note:Solidseffluent=300mg/L×0.40=120mg/Lgoingtosecondarytreatment.
Massofsolidstosecondary=32,000m3/d×120mg/L×103L/m3×10–6kg/mg
=3840kg/d
BOD5ineffluent=220mg/L×(1–0.30)=154mg/Lgoingtosecond-arytreatment.
MassofBOD5goingtosecondary=32,000m3/d×154mg/L×103L/m3×10–6kg/mg
=4928kg/d
116 Fundamentals of wastewater treatment and engineering
7.6 CHEMICALLY ENHANCED PRIMARY TREATMENT
CEPT (chemically enhanced primary treatment) refers to a process thatuseschemicalsforcoagulation,flocculation,andprecipitationofparticu-late/dissolved solids in thewastewaterasaprimary step in clarification.AlthoughCEPTwasfirstusedaround1840inFrance,itsuseintheUnitedStatesstartedinthe1960s(Pericetal.,2008).Anumberofdifferentchemi-calsweredeveloped,tested,andused.Asinglechemicaloracombinationofchemicalscanbeused.Inrecentyears,CEPThasbeenusedatvariouswastewatertreatmentplantsforphosphateremoval,clarificationofwaste-water, reduction in sludgevolume,and increase in surfaceoverflowrate(SOR).Increasingtheefficiencyofprimarytreatmenthasdualbenefits:(a)Itreducestheloadfordownstreamprocesses,and(b)itenhancestherateofsecondarytreatment,becausesmaller,easilybiodegradableparticlesareavailableafterprimarytreatment(Odegaard,1998).Theselectionofchem-icalsforCEPTdependsontheprimaryobjectiveofusingthem.Thedoseofchemicalcoagulantandmethodofdosinghavetobeoptimizedforbetterclarification.Chemicalcoagulantssuchasferricchlorideareused,togetherwithpolymers,asflocculatingagents.Combinedflocculator–clarifierscanbeusedforthisprocess.
PerformanceofCEPTdependstoagreatextentoninfluentcharacter-isticsofwastewater.Influentcharacteristics includeTSS(totalsuspendedsolids), turbidity, BOD (biochemical oxygen demand), COD (chemicaloxygen demand), particle size distribution, septicity, etc. Characterizingincoming wastewater can provide a vast array of benefits, e.g. feedbackforchemicaldosing,analysisandpreventionofoperationalinefficiencies,establishingthetrendsofseasonalvariations,providingthebenchmarkonoperationalperformanceoftheplantitself,andprovidingparametersforcomparisonofqualityofwastewaterwiththatofotherplantsintheregionorcountry.Itisnecessarytostudysourcecharacteristicsofthewastewatertodesignanoptimizedsettlingenvironment.InfluentcharacteristicssuchasTSS, turbidity, and totalCODwere found tohave significant impactonCEPTinanexperimentalstudyconductedbyNeupaneatal. (2008).Rapidmixingtimesdidnotimpactperformance,butincreasedflocculationtimeimprovedperformance.Aminimumflocculationtimeof10minwasrequired foroptimizedCEPTperformance, asobservedbyParker et al.(2000)andNeupaneetal.(2008).
PROBLEMS
7.1 DefineTypeIandTypeIIsettling.Whatarethedifferencesbetweenthesetwotypesofsettling?Wherearetheyobserved?
7.2 Whatistheobjectiveofusinganequalizationtank?Whereisitused?
Primary treatment 117
7.3 A1cmdiameterplasticspherefallsinaviscousliquidatatermi-nalvelocityof1cm/sec.Whatwouldbetheterminalvelocityofa10cmdiametersphere(ofthesameplasticmaterial)inthesamefluid?Clearly state anyassumptions that youmake toarrive atyouranswer.
7.4 Thesettlingbasinforatype-1suspensionistooperateatanover-flowrateof0.76m3/m2·h.Theflowratethroughtheplantis24,000m3/day. Determine the dimensions for a long rectangular basin,usingalengthtowidthratioof4:1.Depthshouldnotexceed4m.Usemorethanonetank.Determinethedetentiontimeinthetankandthehorizontalvelocity.
7.5 Arectangularsedimentationtankisdesignedwithadepthof3.5mandadetentiontimeof1h.Isthedesignsufficienttoachievecom-pleteremovalofparticleswithadiameterof0.01mm?Specificgrav-ityoftheparticlesis2.65.Theflowrateandtemperatureofwaterare10,000m3/dand20°C,respectively.At20°C,densityofwateris998kg/m3anddynamicviscosityofwateris10–3kg/m·s.Stateanyassumptionsyoumaketocalculateyourresults.
7.6 Anindustrialprocesswastewatercontainsamixtureofmetalfrag-mentsandsand.Themetalfragmentsrangeindiameterfrom0.5to10mmwithaspecificgravityof1.65.Thesandparticlesrangeindiameterfrom0.04to2.0mmwithaspecificgravityof2.65.Thewastewaterdischargerateis1400m3/dat20°C.Designasettlingtanktoremoveallthemetalandsandparticles.Ifthedepthofthetankis2m,calculatethedetentiontime.
7.7 Aprimaryclarifierremoves35%ofBOD5and55%ofsuspendedsolidsfromtheincomingwastewater.CalculatethemassofsolidsandmassofBOD5removedinkg/dforaplantprocessing4500m3/dofwastewaterwith275mg/LBOD5and400mg/LSS.
7.8 WhatisCEPT?WhataretheadvantagesofusingCEPT? 7.9 Whattypesofsettlingcanbeobservedinawastewatertreatment
plant?Drawaflowdiagramofaconventionaltreatmentplanttreat-ingmunicipalwastewater,andlabeltheunitprocessestogetherwiththetypeofsettlingobserved.
7.10 A wastewater treatment plant has four primary clarifiers, eachwithdiameterof15mand sidewaterdepthof4m.Theaver-age daily flow is 24,000 m3/d. The effluent weir is located ontheperipheryofeachtank.Calculatethesurfaceoverflowrate,detentiontime,andweirloadingrates.Ifonetankistakenoutofserviceformaintenance,whathappenstotheoverflowrateanddetentiontime?Isthedesignadequatefortheaverageflowwiththethreetanksinservice?
7.11 Awastewatertreatmentplanthasadesignaverageflowof15,000m3/d.Theengineerwishestouserectangularclarifiersforprimary
118 Fundamentals of wastewater treatment and engineering
treatment.Design therectangular tanks foramaximumoverflowrateof42m3/m2·dandaminimumdetentiontimeof2h.Whichcriteriagovernthedesign?
7.12 AmoderateamountoftotalBODcanberemovedinaprimaryclari-fierthroughsettling.TherelationshipbetweenpercentremovaloftotalBODandthesurfaceoverflowrateinacircularclarifiercanbedescribedbythefollowingstraight-lineequation:
y=42–0.255x
whereyisthepercentremovaloftotalBODandxistheoverflowrateinm/d.Theaveragewastewaterflowrateis5000m3/d.Calculatethediameterof theclarifier thatwouldresult inremovalofone-thirdofthetotalBOD.Also,calculatethedetentiontimeintheprimaryclarifierwhenthesidewalldepthis3.6m.
REFERENCES
Camp,T.R.(1945)“SedimentationandtheDesignofSettlingTanks.”Transactions of the American Society of Civil Engineers,vol.111,pp.895–936.
Davis,M.(2011)Water and Wastewater Engineering: Design Principles and Practice.McGraw-Hill,Inc.,NewYork.
Droste,R.L.(1997)Theory and Practice of Water and Wastewater Treatment.JohnWiley&Sons,Inc.,NewJersey.
Hazen,A,(1904)“OnSedimentation.”Transactions of the American Society of Civil Engineers,vol.53,pp.46–48.
Metcalf and Eddy, Inc. (2003) Wastewater Engineering: Treatment and Reuse.Fourthedition.McGraw-Hill,Inc.,NewYork.
Neupane,D.,Riffat,R.,Murthy,S.,Peric,M.,andWilson,T.(2008)“InfluenceofSourceCharacteristics,ChemicalsandFlocculationonChemicallyEnhancedPrimaryTreatment.”Water Environment Research,vol.80,no.4,pp.331–338.
Odegaard, H. (1998) “Optimized Particle Separation in the Primary Step ofWastewaterTreatment.”Wat. Sci. Tech.vol.37,p.43.
Parker,D.,Esquer,M.,Hetherington,M.,Malik,A.,Robinson,D.,Wahlberg,E.,andWang,J.(2000)“AssessmentandOptimizationofaChemicallyEnhancedPrimaryTreatmentSystem.”Proc. 73rd Annual Conference and Exposition of Water Environment Federation,WEFTEC,Anaheim,California.
Peric,M.,Riffat,R.,Murthy,S.,Neupane,D.,andCassel,A.(2008)“DevelopmentofaLaboratoryClarifierTesttoPredictFull-ScalePrimaryClarifierPerformance.”International Journal of Environmental Research,vol.2,no.2,pp.103–110.
Peavy,H.S.,Rowe,D.R.,andTchobanoglous,G.(1985)Environmental Engineering.McGraw-Hill,Inc.,NewYork.
119
Chapter 8
Secondary treatmentSuspended growth processes
8.1 INTRODUCTION
Secondary treatment usually consists of biological treatment of primaryeffluentwastewater.Theobjectivesofsecondarytreatmentaretoreducethebiochemicaloxygendemand(BOD)andsuspendedsolidsoftheeffluenttoacceptablelevels.Insomecases,nutrientremovalmayalsobeanobjective.Dependingondischargelimits,thesecondaryeffluentmaybedischargedtosurfacewatersafterdisinfection,ormayproceedtotertiarytreatment.Twomajorcategoriesofbiologicaltreatmentprocessesare(1)suspendedgrowth and (2) attached growth processes. In this chapter, aerobic sus-pendedgrowthprocessesforBODremovalwillbedescribedindetail,withmajoremphasisontheactivatedsludgeprocess.Membranebiologicalreac-tors(MBRs)andland-basedsystems,suchaspondsandlagoons,arepre-sentedtowardthelatterpartofthischapter.Attachedgrowthprocessesarediscussed inChapter9.Biologicalprocessesusedfornitrogenandphos-phorusremovalarepresentedindetailinChapter13.
Inasuspendedgrowthprocess,themicroorganismsarekeptinsuspen-sioninabiologicalreactorbyusingasuitablemixingtechnique.Themicro-organismsusetheorganicmatterasfoodandconvertittonewbiologicalcells, energy, and waste matter. Municipal wastewater contains a widevarietyoforganics,consistingofproteins,fats,andcarbohydrates,amongothers.Asaresult,avarietyoforganismsoramixedcultureisrequiredforcompletetreatment.Eachtypeoforganisminthemixedcultureusesthefoodthatismostsuitabletoitsmetabolism(Peavyetal.,1985).Thelargerspecies,inturn,feedonthesmallerspecies.Forexample,therotifersandcrustaceansfeedontheprotozoa,theprotozoafeedonthebacteria,andsoon.Themicroorganismsusedinthebiologicaltreatmentprocessesareessentiallythesameasthosefoundinsurfacewaters,performingdeg-radationoforganicmatterduringnaturalpurificationprocesses.Naturalpurificationprocesses takeplaceover an extendedperiodof time, rang-ingfromdaystoweeks,dependingonthestrengthofthewastewaterandavailabilityofasuitablemicrobialpopulation,asdescribedinChapter4.
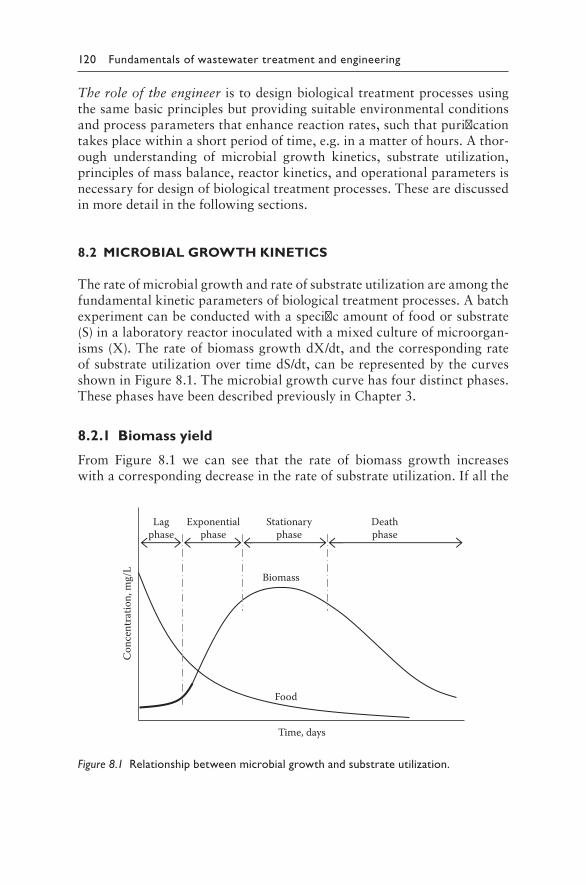
120 Fundamentals of wastewater treatment and engineering
The role of the engineeristodesignbiologicaltreatmentprocessesusingthesamebasicprinciplesbutprovidingsuitableenvironmentalconditionsandprocessparametersthatenhancereactionrates,suchthatpurificationtakesplacewithinashortperiodoftime,e.g.inamatterofhours.Athor-ough understanding of microbial growth kinetics, substrate utilization,principlesofmassbalance,reactorkinetics,andoperationalparametersisnecessaryfordesignofbiologicaltreatmentprocesses.Thesearediscussedinmoredetailinthefollowingsections.
8.2 MICROBIAL GROWTH KINETICS
Therateofmicrobialgrowthandrateofsubstrateutilizationareamongthefundamentalkineticparametersofbiologicaltreatmentprocesses.Abatchexperimentcanbeconductedwithaspecificamountoffoodorsubstrate(S)inalaboratoryreactorinoculatedwithamixedcultureofmicroorgan-isms(X).TherateofbiomassgrowthdX/dt,andthecorrespondingrateofsubstrateutilizationovertimedS/dt,canberepresentedbythecurvesshowninFigure 8.1.Themicrobialgrowthcurvehasfourdistinctphases.ThesephaseshavebeendescribedpreviouslyinChapter3.
8.2.1 Biomass yield
From Figure 8.1 we can see that the rate of biomass growth increaseswithacorrespondingdecreaseintherateofsubstrateutilization.Ifallthe
Time, days
Conc
entr
atio
n, m
g/L
Lagphase
Exponentialphase
Stationaryphase
Deathphase
Food
Biomass
Figure 8.1 Relationship between microbial growth and substrate utilization.
Secondary treatment 121
substratewasconvertedtobiomass, thentherateofbiomassproductionwouldequaltherateofsubstrateutilization.Butpartofthefoodiscon-vertedtoenergyandwasteproducts,aswellasnewcells.Forthisreason,thiscanbeexpressedas:
dX
dt
dS
dt∝ − (8.1)
or
dX
dtY
dS
dt= −
(8.2)
or
rg=–Y(rsu) (8.3)
where:
dX
dt=rg=growthrateofbiomass,mg/L·d
dS
dt=rsu=rateofsubstrateutilization,mg/L·d
Y=biomassyieldor
Y=m gbiom assproduced
m gsubstrateutilized (8.4)
Thebiomassinareactorisusuallymeasuredintermsofconcentrationoftotalsuspendedsolids(TSS)orvolatilesuspendedsolids(VSS).Thesub-strateconcentrationcanbemeasuredintermsofBODorCOD.Therefore,
Y = m gVSSproduced
m gBO D rem oved or Y=
m gTSSproduced
m gCO D rem oved
TheyieldcoefficientYdependsonthemetabolicpathwayusedinthedeg-radationprocess.Aerobicprocesseshaveahigheryieldofbiomasscom-paredwithanaerobicprocesses.TypicalvaluesofYforaerobicprocessesrangefrom0.4to0.8kgVSS/kgBOD5,whiletheyrangefrom0.08to0.2kgVSS/kgBOD5foranaerobicprocesses.
122 Fundamentals of wastewater treatment and engineering
8.2.2 Logarithmic growth phase
Inthelogarithmicgrowthphase,wecanusuallyassumefirstorderkineticstoobtainthefollowingrateexpression:
rdX
dtXg = = µ (8.5)
where:
dX
dt=growthrateofbiomass,mg/L·d
µ=specificgrowthrate,d–1
X=concentrationofbiomass,mg/L
8.2.3 Monod model
Anumberofmodelshavebeendevelopedtomodelthemicrobialgrowthinbiologicalreactors.OneoftheearliestmodelswastheMonod model,whichhasservedasthebasisfordevelopmentofnumerousmodelsthatareinusetoday.TheMonodmodelassumesthattherateofsubstrateutiliza-tion,andthereforetherateofbiomassproduction,islimitedbytherateofenzymaticreactionsinvolvingthelimitingsubstrate.TheMonodequationformicrobialgrowth(Monod,1949)isgivenby
µ µ= ⋅+m ax
S
K SS (8.6)
where:µmax=maximumspecificgrowthrateconstant,d–1
S=substrateconcentration,mg/LKS=halfsaturationcoefficient,mg/L
KSisthesubstrateconcentrationcorrespondingtogrowthrateµ=1/2µmax.Figure 8.2isagraphicalrepresentationoftheMonodequation,whichillus-tratesthatthegrowthrateofbiomassisahyperbolicfunctionofthesub-strateconcentration.
BasedontheMonodequationandFigure 8.2,athighsubstrateconcen-tration,thesystemisconsideredtobeenzymelimited(S>>Ks).Inthiscase,thegrowthrateisapproximatelyequaltothemaximumgrowthrate,andequation(8.6)becomes
µ≈µmax (8.7)
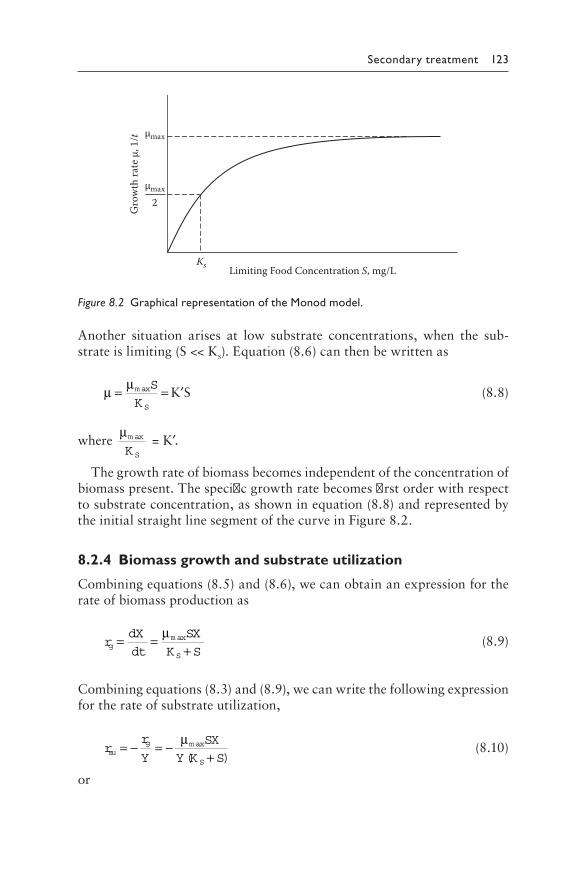
Secondary treatment 123
Another situation arises at low substrate concentrations, when the sub-strateislimiting(S<<Ks).Equation(8.6)canthenbewrittenas
µ µ= =m ax
S
S
KK′S (8.8)
whereµm ax
SK=K′.
Thegrowthrateofbiomassbecomesindependentoftheconcentrationofbiomasspresent.Thespecificgrowthratebecomesfirstorderwithrespecttosubstrateconcentration,asshowninequation(8.8)andrepresentedbytheinitialstraightlinesegmentofthecurveinFigure 8.2.
8.2.4 Biomass growth and substrate utilization
Combiningequations(8.5)and(8.6),wecanobtainanexpressionfortherateofbiomassproductionas
rdX
dt
SX
K Sg
max
S
= =+
µ (8.9)
Combiningequations(8.3)and(8.9),wecanwritethefollowingexpressionfortherateofsubstrateutilization,
rr
Y
SX
Y K Ssu
g
S
= − = −+
µm ax
( ) (8.10)
or
Limiting Food Concentration S, mg/L
Gro
wth
rate
μ, 1
/t
Ks
μmax
μmax
2
Figure 8.2 Graphical representation of the Monod model.
124 Fundamentals of wastewater treatment and engineering
dS
dt
SX
Y K SS
= −+
µm ax
( ) (8.11)
or
rkSX
K Ssu
S
= −+
(8.12)
wherekYmax= µ
andisdefinedasthemaximumrateofsubstrateutilization
perunitmassofmicroorganisms.
8.2.5 Other rate expressions for rsu
Dependingonthesubstrateandspecificmicroorganismsinvolved,anum-ber of rate expressions have been used to describe substrate utilizationrates, inadditionto thesubstrate limitedrelationshippresented inequa-tion(8.11).Thesearebasedonexperimentalresultsobservedbyvariousresearchers.Someofthecommonlyusedrateexpressionsare
rsu=–k (8.13)
rsu=–kS (8.14)
rsu=–kSX (8.15)
wherek=substrateutilizationratecoefficient,time–1.
8.2.6 Endogenous metabolism
Inthedeathanddecayphaseofthemicrobialgrowthcurve,someendog-enousmetabolismtakesplace.Itisassumedthatthedecreaseinbiomasscaused by death and predation is proportional to the concentration ofmicroorganismspresent.Theendogenousdecayisthusassumedtobefirstorderandcanbewrittenas:
dX
dtend r k Xd d
= = − (8.16)
where:rd=rateofdecay,mg/L·dkd=endogenousdecaycoefficient,d–1
Secondary treatment 125
8.2.7 Net rate of growth
Combiningequations(8.9)and(8.16),wecanobtainanexpressionforthenetrateofgrowth:
rg(net)=rg+rd
dX
dtnet
dX
dt
dX
dtend
=
+
dX
dtnet
SX
K Sk X
Sd
=+
−m axµ (8.17)
Thenetbiomassyieldcanbeexpressedas
Ynet= −r
rg net
su
( ) (8.18)
Thenetbiomassyieldisusedasanestimateoftheamountofactivemicro-organismsinthesystem.
Table 8.1presentstypicalvaluesofthekineticcoefficientsfortheacti-vatedsludgeprocesstreatingdomesticwastewater.
8.2.8 Rate of oxygen uptake
Therateofoxygenuptakeisstoichiometricallyrelatedtotherateofutiliza-tionoforganicmatterandthebiomassgrowthrate.BasedontheformulaC5H7O2Nforbiomass,theoxygenequivalentofbiomass(measuredasVSS)isapproximately1.42gCODutilized/gVSSproduced(MetcalfandEddy,2003).Therefore,theoxygenuptakeratecanbeexpressedas:
ro=rsu=–1.42rg (8.19)
Table 8.1 Kinetic coefficients for activated sludge process treating municipal wastewater
Kinetic coefficient Range Typical value
µmax, mg COD/mg VSS · d 1–10 5Ks, mg/L COD 12–60 38kd, mg VSS/mg VSS · d 0.05–0.15 0.10Y, mg VSS/mg COD 0.25–0.60 0.40
Source: Adapted from Metcalf and Eddy (2003).
126 Fundamentals of wastewater treatment and engineering
where:ro=rateofoxygenuptake,gO2/m3·drsu=rateofsubstrateutilization,gCOD/m3·d1.42=CODofcelltissue,gCOD/gVSSrg=rateofbiomassgrowth,gVSS/m3·d
8.2.9 Effect of temperature
Temperaturehasasignificanteffectonbiologicalreactions.Temperatureinfluencesthemetabolicactivitiesofthemicrobialpopulation,aswellasgas transfer rates and settling characteristics of the biomass. The van’tHoff–Arrheniusmodelcanbeusedtodescribetheeffectoftemperatureonreactionratecoefficientsasshownbelow:
kT=k20θ(T–20) (8.20)
where:kT=reactionratecoefficientattemperatureT°Ck20=reactionratecoefficientat20°Cθ=temperatureactivitycoefficientT=temperature,°C
Valuesofθrangefrom1.02to1.25dependingonthetypeofsubstrateandbiologicalprocess(MetcalfandEddy,2003).
8.3 ACTIVATED SLUDGE PROCESS (FOR BOD REMOVAL)
The most widely used suspended growth process is the activated sludgeprocess. It is used for biological treatment of municipal and industrialwastewaters. The process concept dates back to the work of Dr. AngusSmith in the early 1880s, who investigated the aeration of wastewatertanks toacceleratebiologicaloxidation. In1912and1913, experimentswere conducted by Clark and Adams with aerated wastewater to growmicroorganisms in bottles and tanks, at Lawrence Experiment Station(ClarkandAdams,1914).TheseresultswerethemotivationforadditionalresearchcarriedoutatManchesterSewageWorksinEnglandbyArdernandLockett(1914a,b).Theydevelopedtheprocessandnameditactivated sludge,becauseitinvolvedtheproductionofanactivatedmassofmicro-organismscapableofaerobicstabilizationoforganicmatterinwastewater(MetcalfandEddy,2003).
Thebasicactivatedsludgeprocessconsistsofthreecomponents,asillus-tratedinFigure 8.3:(1)abiologicalreactorwherethemicroorganismsare
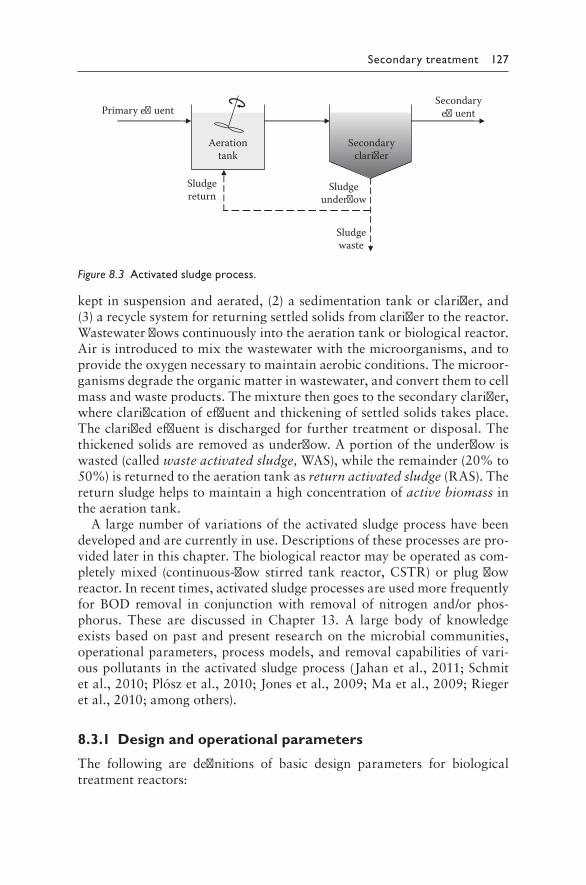
Secondary treatment 127
keptinsuspensionandaerated,(2)asedimentationtankorclarifier,and(3)arecyclesystemforreturningsettledsolidsfromclarifiertothereactor.Wastewaterflowscontinuouslyintotheaerationtankorbiologicalreactor.Airisintroducedtomixthewastewaterwiththemicroorganisms,andtoprovidetheoxygennecessarytomaintainaerobicconditions.Themicroor-ganismsdegradetheorganicmatterinwastewater,andconvertthemtocellmassandwasteproducts.Themixturethengoestothesecondaryclarifier,whereclarificationofeffluentandthickeningofsettledsolidstakesplace.Theclarifiedeffluentisdischargedforfurthertreatmentordisposal.Thethickenedsolidsareremovedasunderflow.Aportionoftheunderflowiswasted(calledwaste activated sludge,WAS),whiletheremainder(20%to50%)isreturnedtotheaerationtankasreturn activated sludge(RAS).Thereturnsludgehelpstomaintainahighconcentrationofactive biomassintheaerationtank.
Alargenumberofvariationsoftheactivatedsludgeprocesshavebeendevelopedandarecurrentlyinuse.Descriptionsoftheseprocessesarepro-videdlaterinthischapter.Thebiologicalreactormaybeoperatedascom-pletelymixed (continuous-flowstirred tank reactor,CSTR)orplugflowreactor.Inrecenttimes,activatedsludgeprocessesareusedmorefrequentlyforBOD removal in conjunction with removal of nitrogen and/or phos-phorus. These are discussed in Chapter 13. A large body of knowledgeexistsbasedonpastandpresentresearchonthemicrobialcommunities,operationalparameters,processmodels,andremovalcapabilitiesofvari-ouspollutantsintheactivatedsludgeprocess(Jahanetal.,2011;Schmitet al.,2010;Plószetal.,2010;Jonesetal.,2009;Maetal.,2009;Riegeret al.,2010;amongothers).
8.3.1 Design and operational parameters
The following are definitions of basic design parameters for biologicaltreatmentreactors:
Aerationtank
Secondaryclari�er
Primary e uentSecondary
e uent
Sludgereturn
Sludgeunderow
Sludgewaste
Figure 8.3 Activated sludge process.
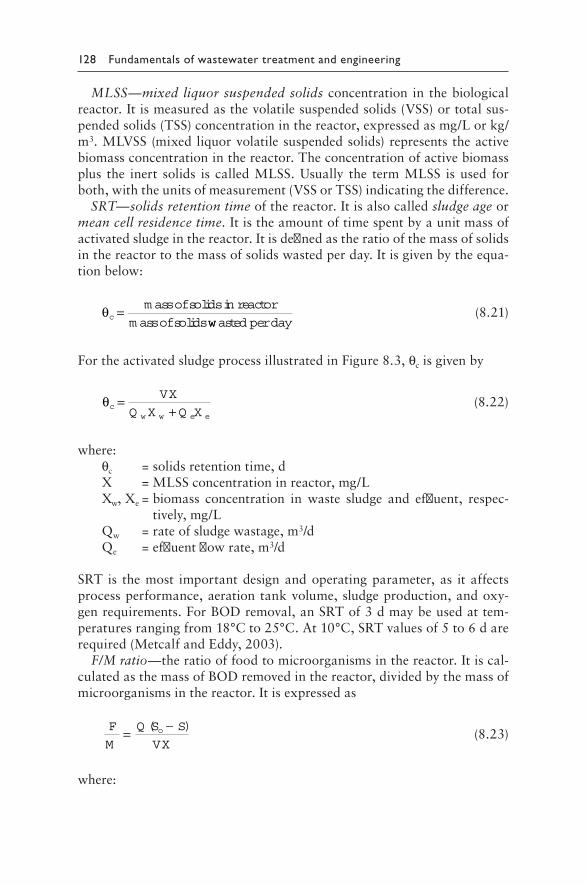
128 Fundamentals of wastewater treatment and engineering
MLSS—mixed liquor suspended solidsconcentration inthebiologicalreactor.Itismeasuredasthevolatilesuspendedsolids(VSS)ortotalsus-pendedsolids(TSS)concentrationinthereactor,expressedasmg/Lorkg/m3.MLVSS(mixedliquorvolatilesuspendedsolids)representstheactivebiomassconcentrationinthereactor.Theconcentrationofactivebiomassplus the inert solids is calledMLSS.Usually the termMLSS isused forboth,withtheunitsofmeasurement(VSSorTSS)indicatingthedifference.
SRT—solids retention timeofthereactor.Itisalsocalledsludge ageormean cell residence time. Itistheamountoftimespentbyaunitmassofactivatedsludgeinthereactor.Itisdefinedastheratioofthemassofsolidsinthereactortothemassofsolidswastedperday.Itisgivenbytheequa-tionbelow:
θc = m assofsolidsin reactor
m assofsolidswwasted perday (8.21)
FortheactivatedsludgeprocessillustratedinFigure 8.3,θcisgivenby
θcw w e e
VX
Q X Q X=
+ (8.22)
where:θc=solidsretentiontime,dX=MLSSconcentrationinreactor,mg/LXw,Xe=biomass concentration in waste sludge and effluent, respec-
tively,mg/LQw=rateofsludgewastage,m3/dQe=effluentflowrate,m3/d
SRT is themost importantdesignandoperatingparameter,as itaffectsprocessperformance,aerationtankvolume,sludgeproduction,andoxy-genrequirements.ForBODremoval,anSRTof3dmaybeusedattem-peraturesrangingfrom18°Cto25°C.At10°C,SRTvaluesof5to6darerequired(MetcalfandEddy,2003).
F/M ratio—theratiooffoodtomicroorganismsinthereactor.Itiscal-culatedasthemassofBODremovedinthereactor,dividedbythemassofmicroorganismsinthereactor.Itisexpressedas
F
M
Q S S
VXo= −( )
(8.23)
where:
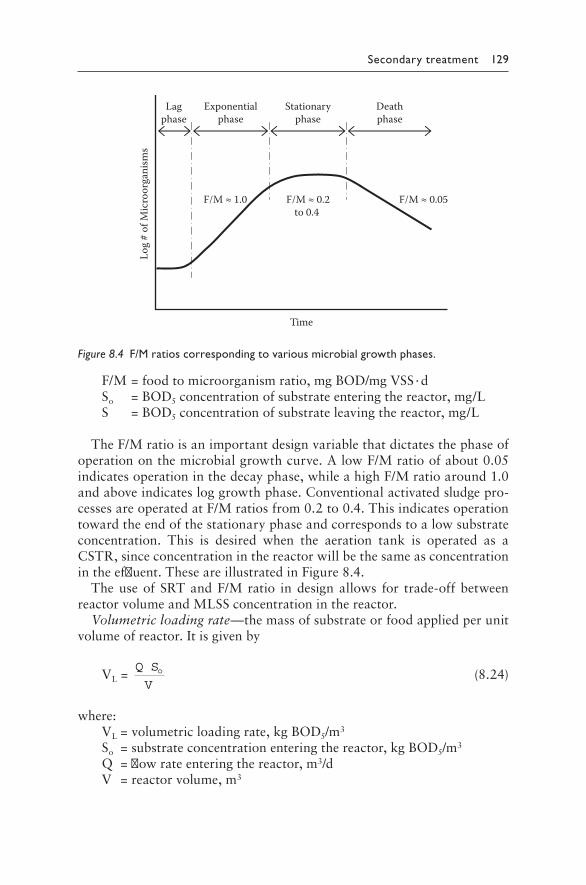
Secondary treatment 129
F/M=foodtomicroorganismratio,mgBOD/mgVSS·dSo=BOD5concentrationofsubstrateenteringthereactor,mg/LS=BOD5concentrationofsubstrateleavingthereactor,mg/L
TheF/Mratioisanimportantdesignvariablethatdictatesthephaseofoperationonthemicrobialgrowthcurve.AlowF/Mratioofabout0.05indicatesoperationinthedecayphase,whileahighF/Mratioaround1.0andaboveindicatesloggrowthphase.Conventionalactivatedsludgepro-cessesareoperatedatF/Mratiosfrom0.2to0.4.Thisindicatesoperationtowardtheendofthestationaryphaseandcorrespondstoalowsubstrateconcentration. This is desired when the aeration tank is operated as aCSTR,sinceconcentrationinthereactorwillbethesameasconcentrationintheeffluent.TheseareillustratedinFigure 8.4.
TheuseofSRTandF/Mratio indesignallows for trade-offbetweenreactorvolumeandMLSSconcentrationinthereactor.
Volumetric loading rate—themassofsubstrateorfoodappliedperunitvolumeofreactor.Itisgivenby
VL=Q S
Vo (8.24)
where:VL=volumetricloadingrate,kgBOD5/m3
So=substrateconcentrationenteringthereactor,kgBOD5/m3
Q=flowrateenteringthereactor,m3/dV=reactorvolume,m3
Time
Log
# of
Mic
roor
gani
sms
Lagphase
Exponentialphase
Stationaryphase
Deathphase
F/M ≈ 1.0 F/M ≈ 0.2to 0.4
F/M ≈ 0.05
Figure 8.4 F/M ratios corresponding to various microbial growth phases.
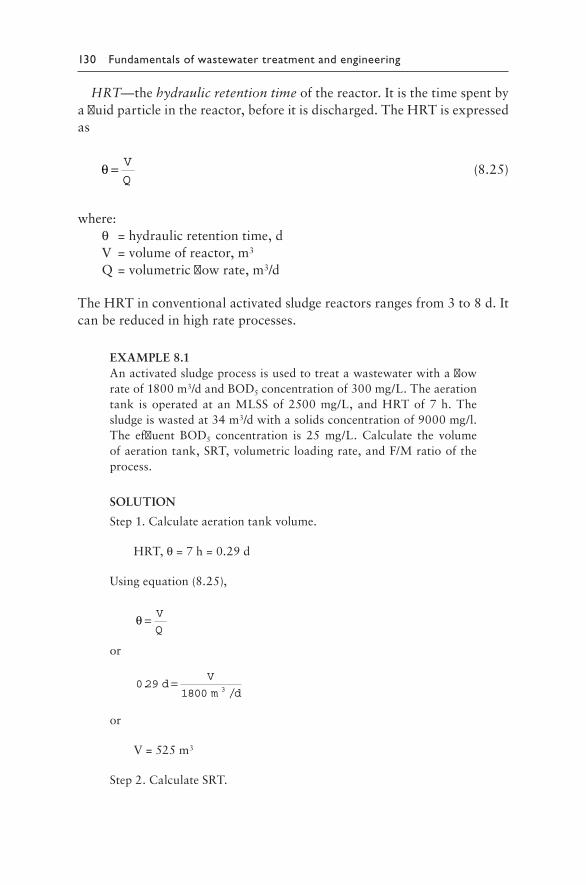
130 Fundamentals of wastewater treatment and engineering
HRT—thehydraulic retention timeofthereactor.Itisthetimespentbyafluidparticleinthereactor,beforeitisdischarged.TheHRTisexpressedas
θ = V
Q (8.25)
where:θ=hydraulicretentiontime,dV=volumeofreactor,m3
Q=volumetricflowrate,m3/d
TheHRTinconventionalactivatedsludgereactorsrangesfrom3to8d.Itcanbereducedinhighrateprocesses.
EXAMPLE8.1Anactivatedsludgeprocessisusedtotreatawastewaterwithaflowrateof1800m3/dandBOD5concentrationof300mg/L.Theaerationtank is operated at anMLSSof 2500mg/L, andHRTof 7h.Thesludgeiswastedat34m3/dwithasolidsconcentrationof9000mg/l.The effluent BOD5 concentration is 25 mg/L. Calculate the volumeofaerationtank,SRT,volumetricloadingrate,andF/Mratiooftheprocess.
SOLUTION
Step1.Calculateaerationtankvolume.
HRT,θ=7h=0.29d
Usingequation(8.25),
θ = V
Q
or
0 291800 3
./
dV
m d=
or
V=525m3
Step2.CalculateSRT.
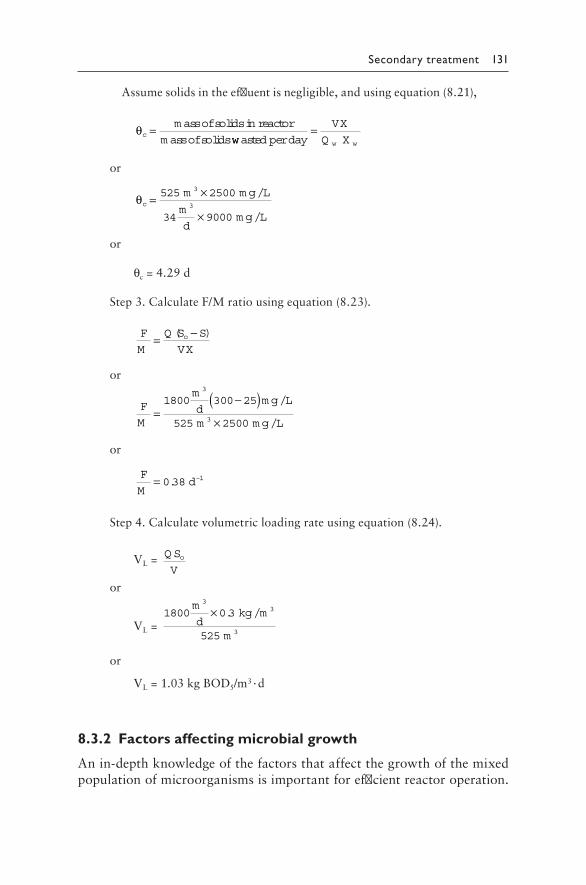
Secondary treatment 131
Assumesolidsintheeffluentisnegligible,andusingequation(8.21),
θc = m assofsolidsin reactor
m assofsolidswwasted perday= VX
Q Xw w
or
θc
m m g L
m
dm g L
= ×
×
525 2500
34 9000
3
3
/
/
or
θc=4.29d
Step3.CalculateF/Mratiousingequation(8.23).
F
M
Q S S
VXo= −( )
or
F
M
m
dm g L
m m g L=
−( )×
1800 300 25
525 2500
3
3
/
/
or
F
Md= 0 38 1. –
Step4.Calculatevolumetricloadingrateusingequation(8.24).
VL= Q SV
o
or
VL=1800 0 3
525
33
3
m
dkg m
m
× . /
or
VL=1.03kgBOD5/m3·d
8.3.2 Factors affecting microbial growth
Anin-depthknowledgeofthefactorsthataffectthegrowthofthemixedpopulationofmicroorganismsisimportantforefficientreactoroperation.
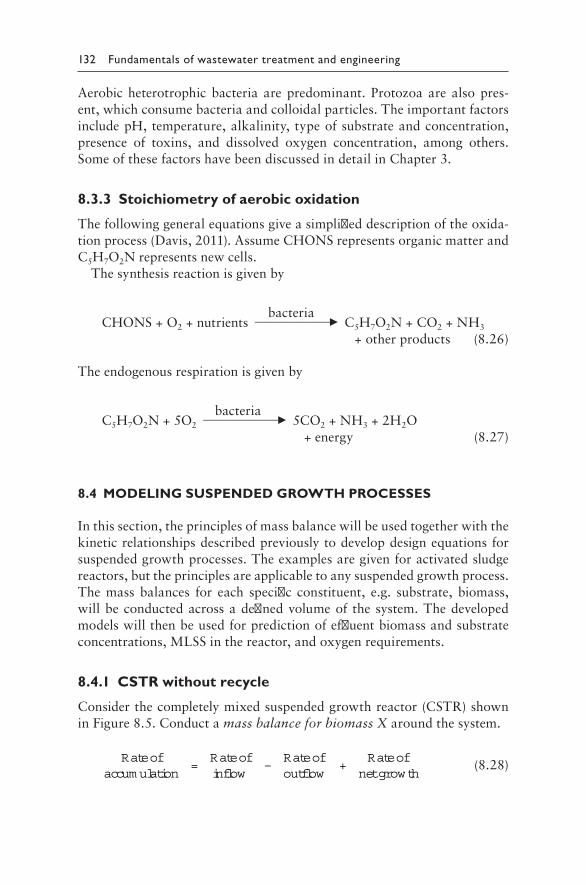
132 Fundamentals of wastewater treatment and engineering
Aerobicheterotrophicbacteria arepredominant. Protozoaare alsopres-ent,whichconsumebacteriaandcolloidalparticles.TheimportantfactorsincludepH,temperature,alkalinity, typeofsubstrateandconcentration,presence of toxins, and dissolved oxygen concentration, among others.SomeofthesefactorshavebeendiscussedindetailinChapter3.
8.3.3 Stoichiometry of aerobic oxidation
Thefollowinggeneralequationsgiveasimplifieddescriptionoftheoxida-tionprocess(Davis,2011).AssumeCHONSrepresentsorganicmatterandC5H7O2Nrepresentsnewcells.
Thesynthesisreactionisgivenby
bacteria CHONS+O2+nutrients __________▶ C5H7O2N+CO2+NH3 +otherproducts (8.26)
Theendogenousrespirationisgivenby
bacteria C5H7O2N+5O2
__________▶ 5CO2+NH3+2H2O +energy (8.27)
8.4 MODELING SUSPENDED GROWTH PROCESSES
Inthissection,theprinciplesofmassbalancewillbeusedtogetherwiththekineticrelationshipsdescribedpreviouslytodevelopdesignequationsforsuspendedgrowthprocesses.Theexamplesaregivenforactivatedsludgereactors,buttheprinciplesareapplicabletoanysuspendedgrowthprocess.The mass balances for each specific constituent, e.g. substrate, biomass,willbeconductedacrossadefinedvolumeof thesystem.Thedevelopedmodelswillthenbeusedforpredictionofeffluentbiomassandsubstrateconcentrations,MLSSinthereactor,andoxygenrequirements.
8.4.1 CSTR without recycle
Considerthecompletelymixedsuspendedgrowthreactor(CSTR)showninFigure 8.5.Conductamass balance for biomass Xaroundthesystem.
Rateofaccum ulation
=Rateofinflow
–Rateofoutflow
+Rateof
netgrowth (8.28)
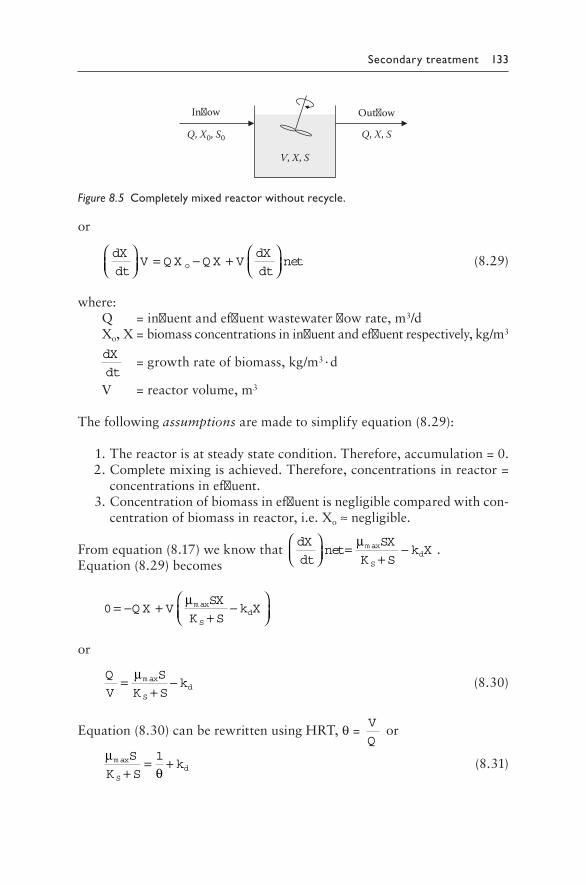
Secondary treatment 133
or
dX
dtV Q X Q X V
dX
dtneto
= − +
(8.29)
where:Q=influentandeffluentwastewaterflowrate,m3/dXo,X=biomassconcentrationsininfluentandeffluentrespectively,kg/m3
dX
dt=growthrateofbiomass,kg/m3·d
V=reactorvolume,m3
Thefollowingassumptionsaremadetosimplifyequation(8.29):
1.Thereactorisatsteadystatecondition.Therefore,accumulation=0. 2.Completemixingisachieved.Therefore,concentrationsinreactor=
concentrationsineffluent. 3.Concentrationofbiomassineffluentisnegligiblecomparedwithcon-
centrationofbiomassinreactor,i.e.Xo≈negligible.
Fromequation(8.17)weknowthatdX
dtnet
SX
K Sk X
Sd
=+
−µm ax .Equation(8.29)becomes
0= − ++
−
Q X VSX
K Sk X
Sd
µm ax
or
Q
V
S
K Sk
Sd=
+−µm ax (8.30)
Equation(8.30)canberewrittenusingHRT,θ=V
Qor
µ
θm axS
K Sk
Sd+
= +1 (8.31)
In�ow
Q, X0, S0
Out�ow
Q, X, S
V, X, S
Figure 8.5 Completely mixed reactor without recycle.
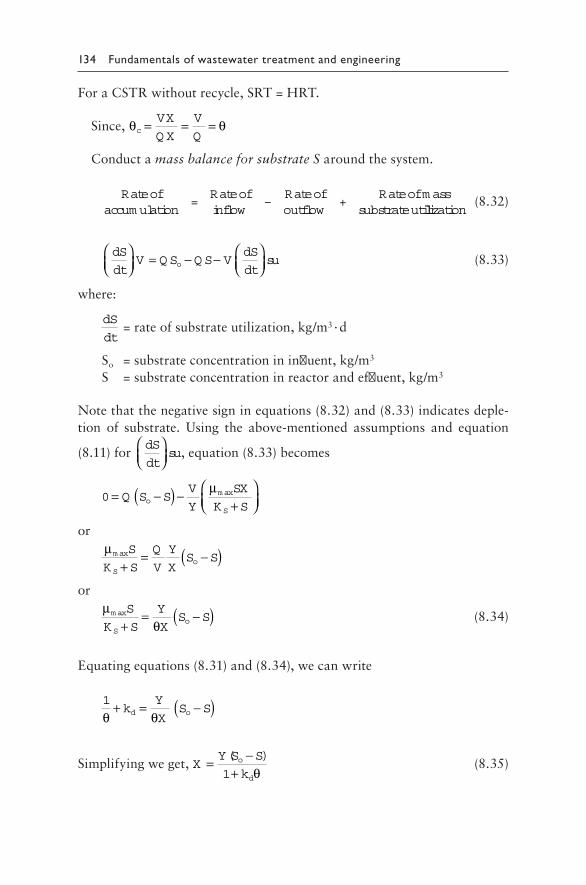
134 Fundamentals of wastewater treatment and engineering
ForaCSTRwithoutrecycle,SRT=HRT.
Since,θ θc
VX
Q X
V
Q= = =
Conductamass balance for substrate Saroundthesystem.
Rateofaccum ulation
=Rateofinflow
–Rateofoutflow
+Rateofm ass
substrateutillization (8.32)
dS
dtV Q S Q S V
dS
dtsuo
= − −
(8.33)
where:
dS
dt=rateofsubstrateutilization,kg/m3·d
So=substrateconcentrationininfluent,kg/m3
S=substrateconcentrationinreactorandeffluent,kg/m3
Notethatthenegativesigninequations(8.32)and(8.33)indicatesdeple-tion of substrate. Using the above-mentioned assumptions and equation
(8.11)fordS
dtsu
,equation(8.33)becomes
0= −( ) −+
Q S SV
Y
SX
K So
S
µm ax
or
µm axS
K S
Q
V
Y
XS S
So+
= −( )or
µ
θm axS
K S
Y
XS S
So+
= −( ) (8.34)
Equatingequations(8.31)and(8.34),wecanwrite
1
θ θ+ = −( )k
Y
XS Sd o
Simplifyingweget,XY S S
ko
d
= −+( )
1 θ (8.35)
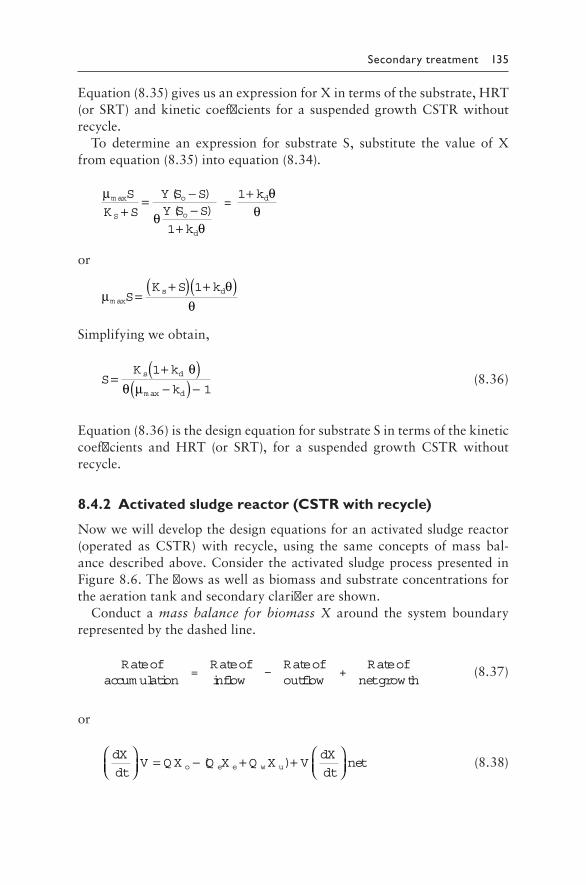
Secondary treatment 135
Equation(8.35)givesusanexpressionforXintermsofthesubstrate,HRT(orSRT)andkinetic coefficients fora suspendedgrowthCSTRwithoutrecycle.
To determine an expression for substrate S, substitute the value of Xfromequation(8.35)intoequation(8.34).
µ
θθ
m ax ( )( )
S
K S
Y S SY S S
kS
o
o
d
+= −
−+1
=1+ kdθ
θ
or
µθ
θm axs d
SK S k
=+( ) +( )1
Simplifyingweobtain,
SK k
ks d
d
=+( )−( ) −
1
1max
θθ µ
(8.36)
Equation(8.36)isthedesignequationforsubstrateSintermsofthekineticcoefficients and HRT (or SRT), for a suspended growth CSTR withoutrecycle.
8.4.2 Activated sludge reactor (CSTR with recycle)
Nowwewilldevelopthedesignequationsforanactivatedsludgereactor(operated as CSTR) with recycle, using the same concepts of mass bal-ancedescribedabove.Consider theactivatedsludgeprocesspresented inFigure 8.6.Theflowsaswellasbiomassandsubstrateconcentrationsfortheaerationtankandsecondaryclarifierareshown.
Conduct a mass balance for biomass X around the system boundaryrepresentedbythedashedline.
Rateofaccum ulation
=Rateofinflow
–Rateofoutflow
+Rateof
netgrowth (8.37)
or
dX
dtV Q X Q X Q X V
dX
dtneto e e w u
= − + +
( ) (8.38)
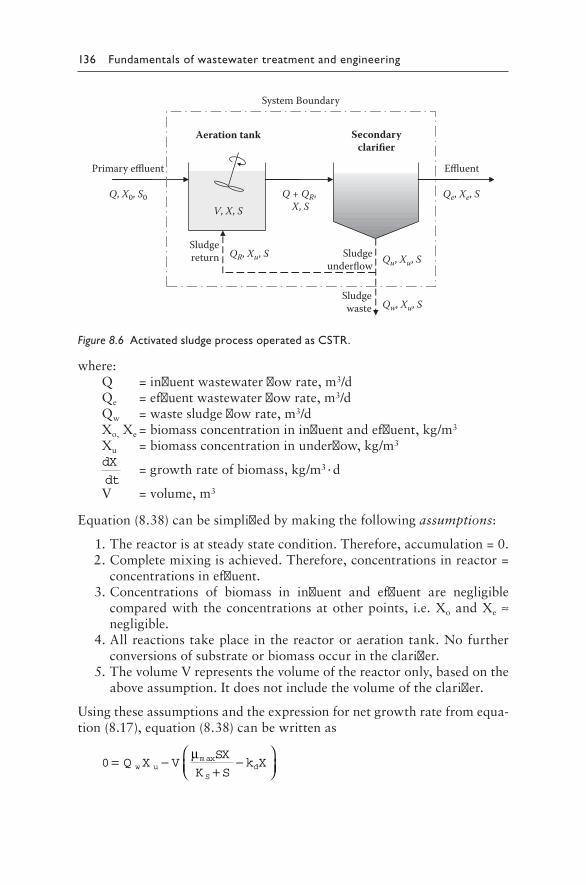
136 Fundamentals of wastewater treatment and engineering
where:Q=influentwastewaterflowrate,m3/dQe=effluentwastewaterflowrate,m3/dQw=wastesludgeflowrate,m3/dXo,Xe=biomassconcentrationininfluentandeffluent,kg/m3
Xu=biomassconcentrationinunderflow,kg/m3
dX
dt=growthrateofbiomass,kg/m3·d
V=volume,m3
Equation(8.38)canbesimplifiedbymakingthefollowingassumptions:
1.Thereactorisatsteadystatecondition.Therefore,accumulation=0. 2.Completemixingisachieved.Therefore,concentrationsinreactor=
concentrationsineffluent. 3.Concentrations of biomass in influent and effluent are negligible
comparedwith theconcentrationsatotherpoints, i.e.XoandXe≈negligible.
4.Allreactionstakeplaceinthereactororaerationtank.Nofurtherconversionsofsubstrateorbiomassoccurintheclarifier.
5.ThevolumeVrepresentsthevolumeofthereactoronly,basedontheaboveassumption.Itdoesnotincludethevolumeoftheclarifier.
Usingtheseassumptionsandtheexpressionfornetgrowthratefromequa-tion(8.17),equation(8.38)canbewrittenas
0= −+
−
m axQ X VSX
K Sk Xw u
Sd
µ
Aeration tank Secondaryclarifier
V, X, S
Primary effluent
Q, X0, S0 Q + QR, X, S
Effluent
Qe, Xe, S
QR, Xu, SSludgereturn Sludge
underflow Qu, Xu, S
Sludgewaste Qw, Xu, S
System Boundary
Figure 8.6 Activated sludge process operated as CSTR.
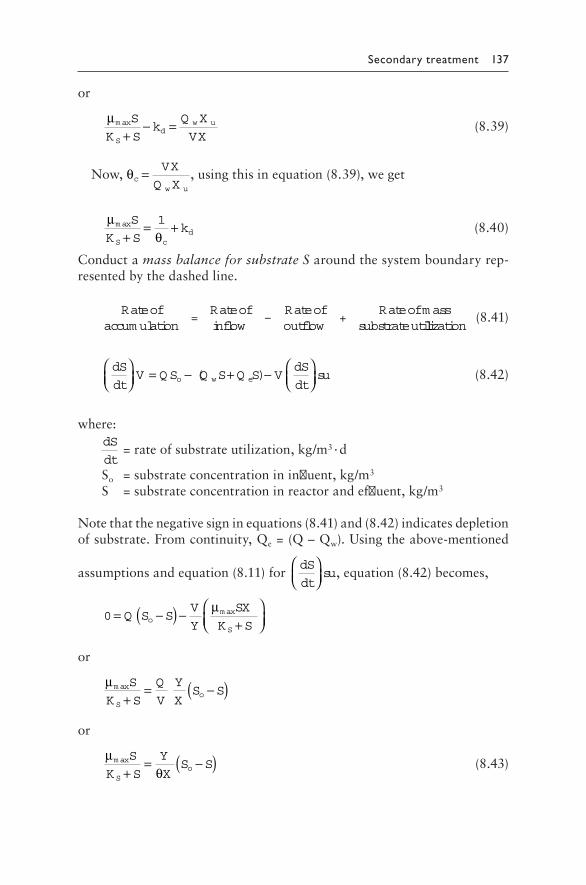
Secondary treatment 137
or
µm axS
K Sk
Q X
VXSd
w u
+− = (8.39)
Now,θcw u
VX
Q X= ,usingthisinequation(8.39),weget
µ
θm axS
K Sk
S cd+
= +1 (8.40)
Conductamass balance for substrate Saroundthesystemboundaryrep-resentedbythedashedline.
Rateofaccum ulation
=Rateofinflow
–Rateofoutflow
+Rateofm ass
substrateutillization (8.41)
dS
dtV Q S Q S Q S V
dS
dtsuo w e
= − + −
( ) (8.42)
where:dS
dt=rateofsubstrateutilization,kg/m3·d
So=substrateconcentrationininfluent,kg/m3
S=substrateconcentrationinreactorandeffluent,kg/m3
Notethatthenegativesigninequations(8.41)and(8.42)indicatesdepletionofsubstrate.Fromcontinuity,Qe=(Q–Qw).Usingtheabove-mentioned
assumptionsandequation(8.11)fordS
dtsu
,equation(8.42)becomes,
0= −( ) −+
Q S SV
Y
SX
K So
S
µm ax
or
µm axS
K S
Q
V
Y
XS S
So+
= −( )
or
µ
θm axS
K S
Y
XS S
So+
= −( ) (8.43)
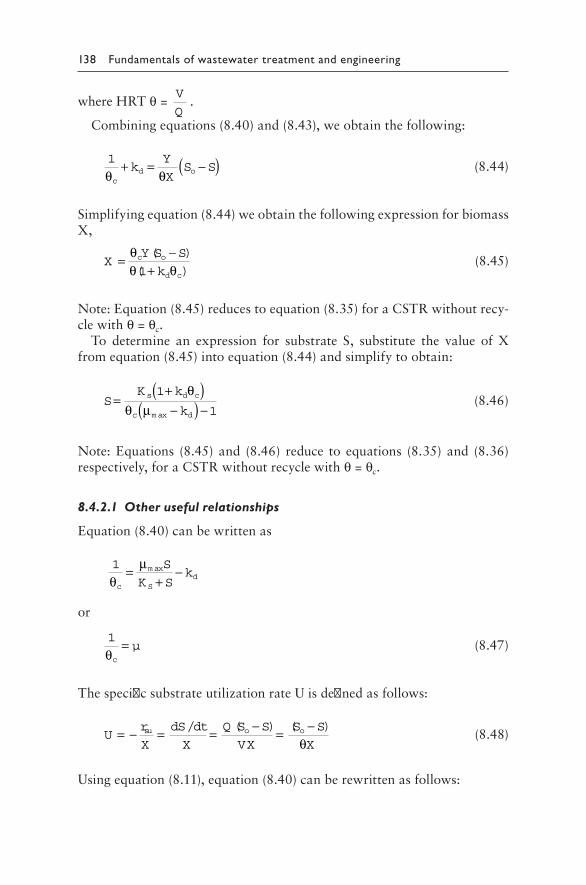
138 Fundamentals of wastewater treatment and engineering
whereHRTθ=V
Q.
Combiningequations(8.40)and(8.43),weobtainthefollowing:
1
θ θcd ok
Y
XS S+ = −( ) (8.44)
Simplifyingequation(8.44)weobtainthefollowingexpressionforbiomassX,
XY S S
kc o
d c
= −+
θθ θ
( )
( )1 (8.45)
Note:Equation(8.45)reducestoequation(8.35)foraCSTRwithoutrecy-clewithθ=θc.
To determine an expression for substrate S, substitute the value of Xfromequation(8.45)intoequation(8.44)andsimplifytoobtain:
SK k
ks d c
c d
=+( )−( ) −
1
1
θθ µm ax
(8.46)
Note:Equations (8.45)and (8.46) reduce to equations (8.35) and (8.36)respectively,foraCSTRwithoutrecyclewithθ=θc.
8.4.2.1 Other useful relationships
Equation(8.40)canbewrittenas
m ax1
θµ
c Sd
S
K Sk=
+−
or
1
θc
µ= (8.47)
ThespecificsubstrateutilizationrateUisdefinedasfollows:
Ur
X
dS dt
X
Q S S
VX
S S
Xsu o o= − = = − = −/ ( ) ( )
θ (8.48)
Usingequation(8.11),equation(8.40)canberewrittenasfollows:
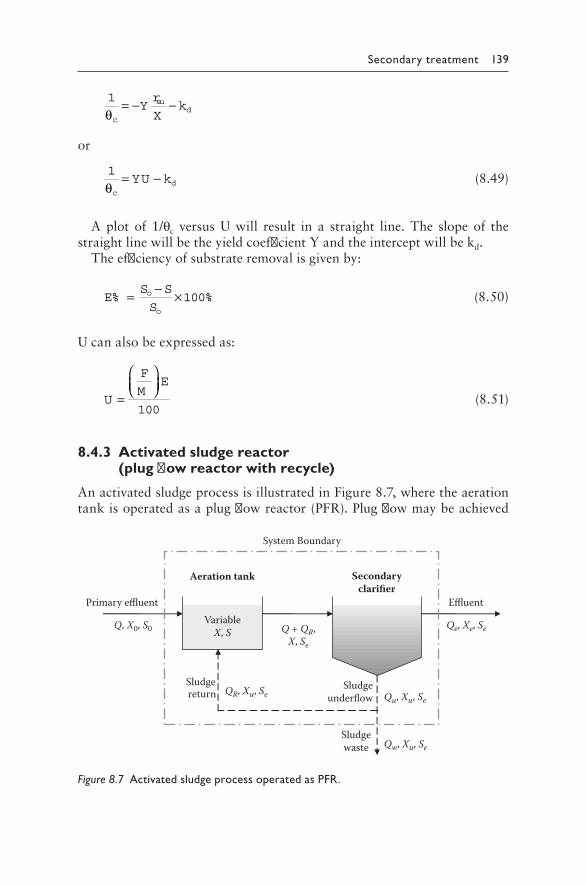
Secondary treatment 139
1
θc
sudY
r
Xk= − −
or
1
θcdYU k= − (8.49)
Aplot of 1/θc versus Uwill result in a straight line.The slope of thestraightlinewillbetheyieldcoefficientYandtheinterceptwillbekd.
Theefficiencyofsubstrateremovalisgivenby:
ES S
So
o
% %= − ×100 (8.50)
Ucanalsobeexpressedas:
U
F
ME
=
100 (8.51)
8.4.3 Activated sludge reactor (plug flow reactor with recycle)
AnactivatedsludgeprocessisillustratedinFigure 8.7,wheretheaerationtankisoperatedasaplugflowreactor(PFR).Plugflowmaybeachieved
Aeration tank Secondaryclarifier
VariableX, S
Primary effluent
Q, X0, S0 Q + QR,X, Se
Effluent
Qe, Xe, Se
QR, Xu, SeSludge return
Sludgeunderflow Qu, Xu, Se
Sludgewaste Qw, Xu, Se
System Boundary
Figure 8.7 Activated sludge process operated as PFR.
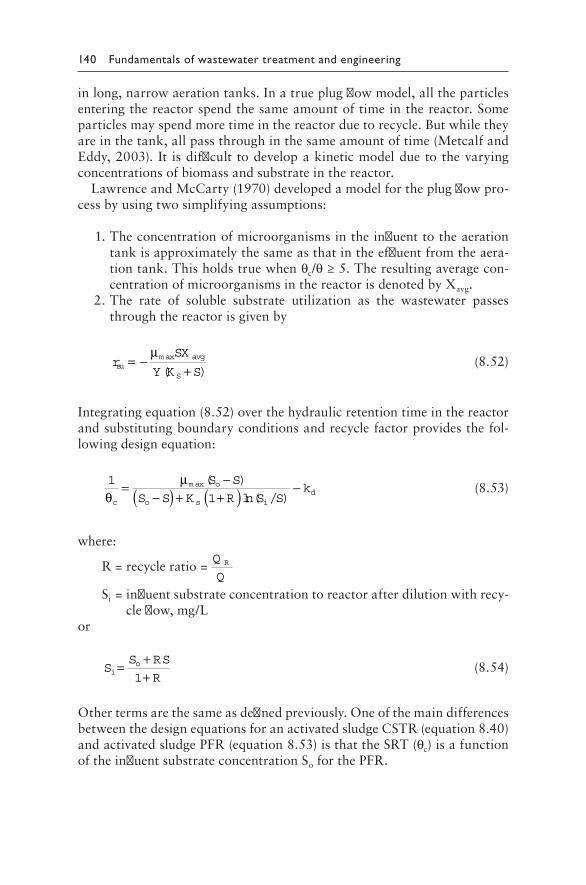
140 Fundamentals of wastewater treatment and engineering
inlong,narrowaerationtanks.Inatrueplugflowmodel,alltheparticlesenteringthereactorspendthesameamountoftimeinthereactor.Someparticlesmayspendmoretimeinthereactorduetorecycle.Butwhiletheyareinthetank,allpassthroughinthesameamountoftime(MetcalfandEddy,2003). It isdifficult todevelopakineticmodelduetothevaryingconcentrationsofbiomassandsubstrateinthereactor.
LawrenceandMcCarty(1970)developedamodelfortheplugflowpro-cessbyusingtwosimplifyingassumptions:
1.Theconcentrationofmicroorganismsintheinfluenttotheaerationtankisapproximatelythesameasthatintheeffluentfromtheaera-tiontank.Thisholdstruewhenθc/θ≥5.Theresultingaveragecon-centrationofmicroorganismsinthereactorisdenotedbyXavg.
2.The rate of soluble substrate utilization as the wastewater passesthroughthereactorisgivenby
rSX
Y K Ssu
avg
S
= −+( )
maxµ (8.52)
Integratingequation(8.52)overthehydraulicretentiontimeinthereactorandsubstitutingboundaryconditionsandrecyclefactorprovidesthefol-lowingdesignequation:
1
1θµ
c
o
o s id
S S
S S K R S Sk= −
−( ) + +( ) −m ax( )
ln( / ) (8.53)
where:
R=recycleratio=Q
QR
Si=influentsubstrateconcentrationtoreactorafterdilutionwithrecy-cleflow,mg/L
or
SS RS
Ri
o= ++1
(8.54)
Othertermsarethesameasdefinedpreviously.OneofthemaindifferencesbetweenthedesignequationsforanactivatedsludgeCSTR(equation8.40)andactivatedsludgePFR(equation8.53)isthattheSRT(θc)isafunctionoftheinfluentsubstrateconcentrationSoforthePFR.
Secondary treatment 141
In practice, a true plug flow regime is almost impossible to maintainbecause of longitudinal dispersion caused by aeration and mixing. Theaeration tank may be divided into a series of reactors to approach plugflowkinetics.ThisalsoimprovesthetreatmentefficiencycomparedwithaCSTR.TheCSTR,however,canhandle shock loadsbetterdue to thehigherdilutionwithinfluentwastewater,ascomparedwithstagedreactorsinseries(MetcalfandEddy,2003).
8.4.4 Limitations of the models
In practice, the assumptions of ideal CSTR or PFR are extremely diffi-culttoachieve.Reallifereactorsfallsomewhereinbetween.Themodelsdescribed in theprevioussectionsprovideauseful startingpoint for thedesignandmodelingofactualprocesses.Thequantificationofsubstrateconcentrationisalsoimportant.ThesubstrateconcentrationSisthesolu-bleCODconcentrationthatisreadilybiodegradable,butitisnotthetotalBOD.SomefractionofthesuspendedsolidsthatremaininthesecondaryclarifiereffluentalsocontributestotheBODloadofthereceivingwaters.ThetotalBODconsistsofasolublefractionandaninsoluble/particulatefraction. It is importanttokeepthese inconsiderationwhendesigningatreatmentprocess.WecandeterminetheeffluentsubstrateconcentrationSinthefollowingmanner(Davis,2011):
S=TotalallowableBOD–BODineffluentsuspendedsolids (8.55)
Anotherassumptionwasthatnobiologicalreactionstakeplace intheclarifier.Basedon theconcentrationofbiomassand theamountof timespentintheclarifier,thisassumptionmaynotbeentirelycorrect.ThismayresultinerrorsincalculationofthevolumeVinthemodel.Itisimportanttounderstandtheselimitationswhenusingthemodelsfordesignoftreat-mentprocesses.
EXAMPLE8.2DevelopanexpressionfortherecycleflowQRforanactivatedsludgeprocess,usingtheconceptofmassbalances.
SOLUTION
Consider the activated sludge process illustrated in Figure 8.6. Wewilldoamassbalancearoundthesecondaryclarifierwiththesystemboundaryasshownbelow.Conductamassbalanceforbiomassaroundthesecondaryclarifier.Makealltheassumptionsthatwerestatedpre-viouslyinSection8.4.2.Sinceallbiologicalreactionstakeplaceintheaerationtank,thereisnogrowthintheclarifier.Accumulation=0.
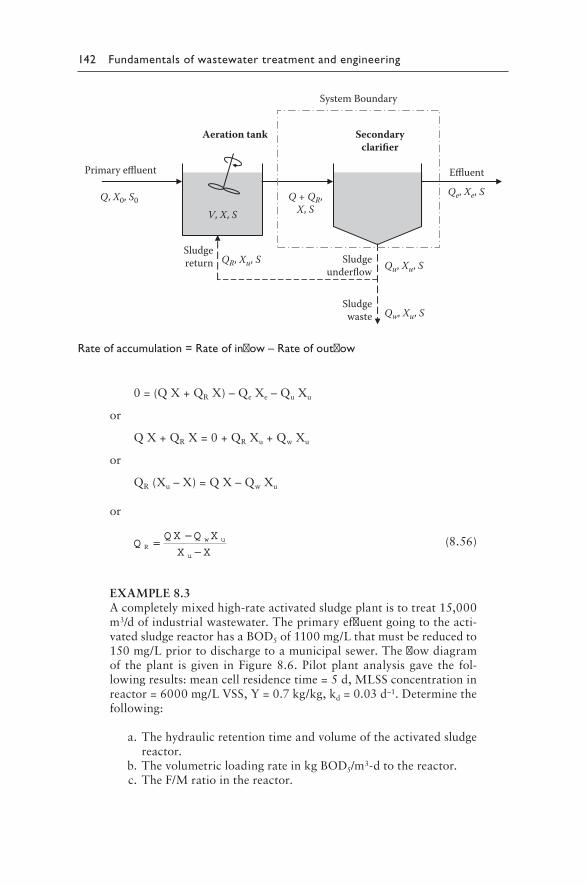
142 Fundamentals of wastewater treatment and engineering
Aeration tank Secondaryclarifier
V, X, S
Primary effluent
Q, X0, S0 Q + QR,X, S
Effluent
Qe, Xe, S
QR, Xu, SSludgereturn Sludge
underflow Qu, Xu, S
Sludgewaste Qw, Xu, S
System Boundary
Rate of accumulation = Rate of inflow – Rate of outflow
0=(QX+QRX)–QeXe–QuXu
or
QX+QRX=0+QRXu+QwXu
or
QR(Xu–X)=QX–QwXu
or
QQ X Q X
X XR
w u
u
= −−
(8.56)
EXAMPLE8.3Acompletelymixedhigh-rateactivatedsludgeplantistotreat15,000m3/dofindustrialwastewater.Theprimaryeffluentgoingtotheacti-vatedsludgereactorhasaBOD5of1100mg/Lthatmustbereducedto150mg/Lpriortodischargetoamunicipalsewer.Theflowdiagramof theplant is given inFigure 8.6.Pilotplant analysis gave the fol-lowingresults:meancellresidencetime=5d,MLSSconcentrationinreactor=6000mg/LVSS,Y=0.7kg/kg,kd=0.03d–1.Determinethefollowing:
a.Thehydraulicretentiontimeandvolumeoftheactivatedsludgereactor.
b.ThevolumetricloadingrateinkgBOD5/m3-dtothereactor. c.TheF/Mratiointhereactor.
Secondary treatment 143
d.Themassandvolumeofsolidswastedeachday,atanunderflowsolidsconcentrationXu=12,000mg/L.
e.Thesludgerecirculationratio. f.Thevolumeofsolidsthatmustbewastedeachday,ifthesolids
arewasteddirectlyfromtheactivatedsludgereactorinsteadoffromtheunderflow.
SOLUTION
Step1.Useequation(8.45)tocalculateHRT(θ).
XY S S
kc o
d c
= −+
θθ θ
( )
( )1
or
θ θθ
= −+
=( )( ) −(( )
( )
.c o
d c
Y S S
X k
d
1
5 0 7 1100 150))+ ×−
m g L
m g L d d
/
/ ( . )6000 1 0 03 51
or
θ=0.48d=11.56h
Volumeofaerationtank,V=Qθ=15000m3/d×0.48d=7200m3
Step2.Useequation(8.24)tocalculatevolumetricloadingrate.
So=1100mg/L=1.10kg/m3
VL=Q SV
m d kg m
mo = × =/ . /15000 1 10
7200
3 3
32.29kgBOD5/m3·d
Step3.Useequation(8.23)tocalculateF/Mratio.
F
M
Q S S
VX
m d m g Lo= − =
−( )( ) , / /15 000 1100 150
7200
3
mm m g L3 6000 /×
=0.33mgBOD5/mgVSS·d
Step4.Atsteadystate,theSRTisgivenby
θcw u
VX
Q X=
or
Q XVX m d kg m
dw u
c
= = ×/ /
θ7200 6
5
3 3
=8640kg/d
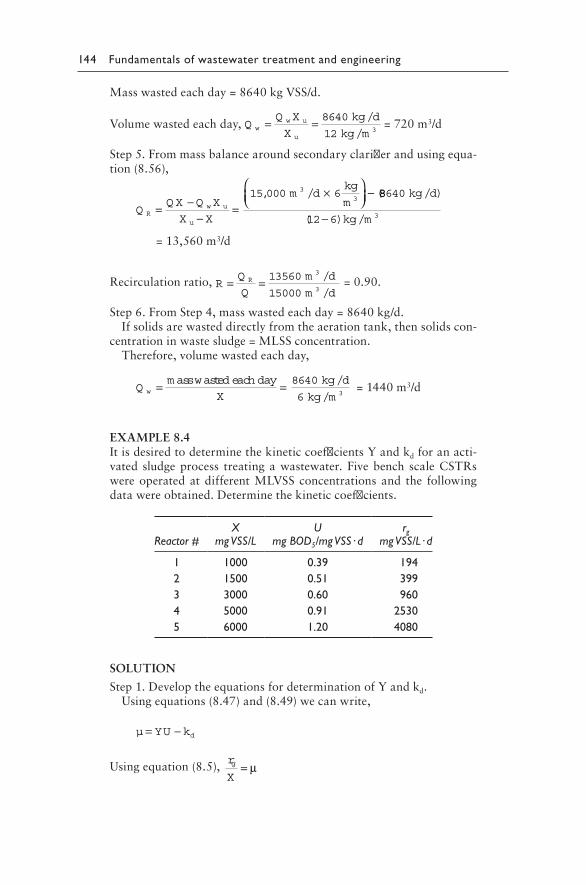
144 Fundamentals of wastewater treatment and engineering
Masswastedeachday=8640kgVSS/d.
Volumewastedeachday,QQ X
X
kg d
kg mw
w u
u
= = 8640
12 3
/
/=720m3/d
Step5.Frommassbalancearoundsecondaryclarifierandusingequa-tion(8.56),
QQ X Q X
X X
m dkg
mR
w u
u
= −−
=×
−, / (15 000 633
88640
12 6 3
/ )
( ) /
kg d
kg m−
=13,560m3/d
Recirculationratio,RQ
Q
m d
m dR= = 13560
15000
3
3
/
/=0.90.
Step6.FromStep4,masswastedeachday=8640kg/d.Ifsolidsarewasteddirectlyfromtheaerationtank,thensolidscon-
centrationinwastesludge=MLSSconcentration.Therefore,volumewastedeachday,
QX
kg d
kg mw = =m asswasted each day /
/
8640
6 3=1440m3/d
EXAMPLE8.4ItisdesiredtodeterminethekineticcoefficientsYandkdforanacti-vated sludgeprocess treatingawastewater.Fivebench scaleCSTRswereoperatedatdifferentMLVSS concentrations and the followingdatawereobtained.Determinethekineticcoefficients.
Reactor #X
mg VSS/LU
mg BOD5/mg VSS · drg
mg VSS/L · d
1 1000 0.39 1942 1500 0.51 3993 3000 0.60 9604 5000 0.91 25305 6000 1.20 4080
SOLUTION
Step1.DeveloptheequationsfordeterminationofYandkd.Usingequations(8.47)and(8.49)wecanwrite,
µ YU kd= −
Usingequation(8.5),r
Xg = µ
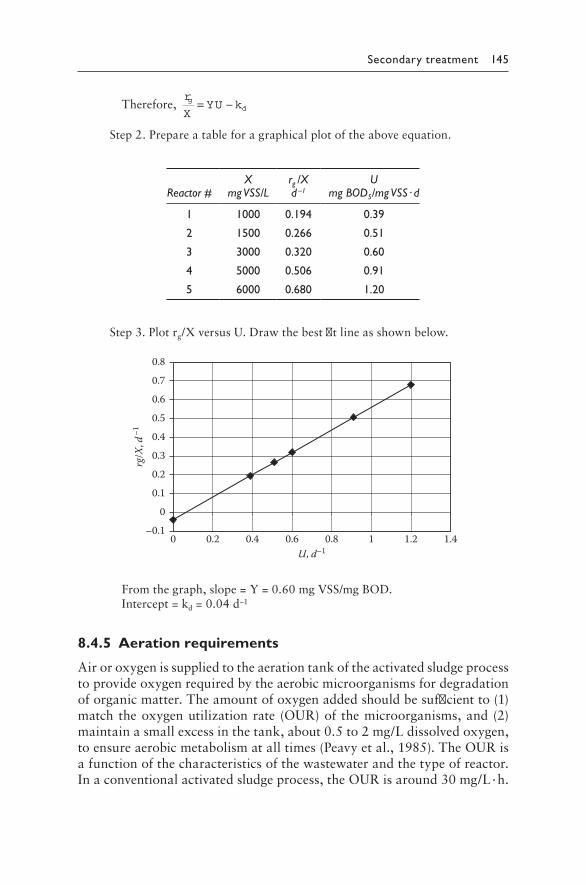
Secondary treatment 145
Therefore,r
XYU kg
d= −
Step2.Prepareatableforagraphicalplotoftheaboveequation.
Reactor #X
mg VSS/Lrg /Xd–1
Umg BOD5/mg VSS · d
1 1000 0.194 0.39
2 1500 0.266 0.51
3 3000 0.320 0.60
4 5000 0.506 0.91
5 6000 0.680 1.20
Step3.Plotrg/XversusU.Drawthebestfitlineasshownbelow.
–0.1
0
0.1
0.2
0.3
0.4
0.5
0.6
0.7
0.8
0 0.2 0.4 0.6 0.8 1 1.2 1.4
rg/X
, d–1
U, d–1
Fromthegraph,slope=Y=0.60mgVSS/mgBOD.Intercept=kd=0.04d–1
8.4.5 Aeration requirements
Airoroxygenissuppliedtotheaerationtankoftheactivatedsludgeprocesstoprovideoxygenrequiredbytheaerobicmicroorganismsfordegradationoforganicmatter.Theamountofoxygenaddedshouldbesufficientto(1)matchtheoxygenutilizationrate (OUR)of themicroorganisms,and(2)maintainasmallexcessinthetank,about0.5to2mg/Ldissolvedoxygen,toensureaerobicmetabolismatalltimes(Peavyetal.,1985).TheOURisafunctionofthecharacteristicsofthewastewaterandthetypeofreactor.Inaconventionalactivatedsludgeprocess,theOURisaround30mg/L·h.
146 Fundamentals of wastewater treatment and engineering
Forextendedaerationprocess,theOURisabout10mg/L·h,whereasforhigh-rateprocessestheOURcanbeupto100mg/L·h.
TheoxygenrequirementmaybeestimatedfromthebiodegradableCOD(bCOD)ofthewastewaterandthebiomasswastedeachday.ThemassofoxygenrequiredforBODremovalmaybecalculatedfromthefollowingexpression(MetcalfandEddy,2003):
Mo=Q(So–S)–1.42Px (8.57)
where:Mo=MassofoxygenrequiredforBODremoval,kg/dQ=wastewaterflowrateintoaerationtank(withoutrecycleflow),
m3/dSo=influentbCOD,kg/m3
S=effluentbCOD,kg/m3
Px=biomasswasted,kgVSS/d1.42=CODofcelltissue,kgCOD/kgVSS
Asanapproximation,theoxygenrequirementforonlyBODremovalwillvaryfrom0.9to1.3kgO2/kgBODremovedforSRTsof5to20d,respec-tively(WEF,1998).Whennitrificationisincludedintheprocess,theoxy-genrequiredforoxidationofammoniaandnitritetonitrateisincludedasfollows(MetcalfandEddy,2003):
MO+N=Q(So–S)–1.42Px+4.33Q(NOx) (8.58)
where:NOx=TKNconcentration,kg/m3
MO+N=oxygenrequiredforBODandnitrogenremoval,kg/d
Othertermsarethesameasdefinedpreviously.The aeration devices have to provide adequate oxygen to satisfy the
demandforaverageandpeakflows.Apeakingfactorof2.0iscommonlyused.However,areviewofactualconditionsshouldbeperformed.Eachtypeofaerationdevicecomeswithacertainoxygentransferefficiencyandanoxygentransferrate inpurewateratstandardtemperatureandpres-sure(SOTR)specifiedbythemanufacturer.Theactualoxygentransferrate(AOTR)variesfromtheSOTRduetowastewatercharacteristics,pressurevariation,residualoxygenconcentration,etc.TheAOTRcanbecalculatedfromthefollowingexpression(MetcalfandEddy,2003):
AO TR SO TRC C
CFsT H L
s
T=−
( )( )−βθ α, ,
,20
20 (8.59)
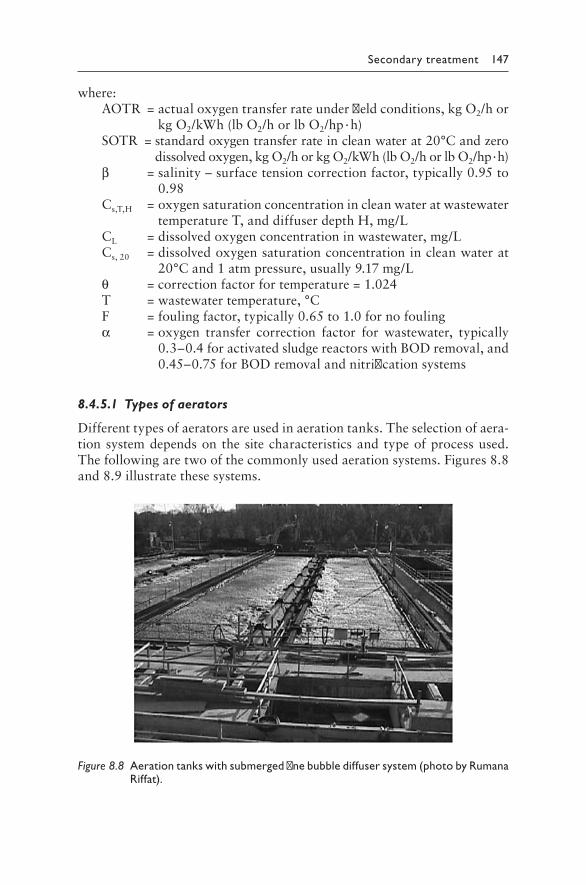
Secondary treatment 147
where:AOTR=actualoxygentransferrateunderfieldconditions,kgO2/hor
kgO2/kWh(lbO2/horlbO2/hp·h)SOTR=standardoxygentransferrateincleanwaterat20°Candzero
dissolvedoxygen,kgO2/horkgO2/kWh(lbO2/horlbO2/hp·h)β=salinity–surfacetensioncorrectionfactor,typically0.95to
0.98Cs,T,H=oxygensaturationconcentrationincleanwateratwastewater
temperatureT,anddiffuserdepthH,mg/LCL=dissolvedoxygenconcentrationinwastewater,mg/LCs,20=dissolvedoxygensaturationconcentrationincleanwaterat
20°Cand1atmpressure,usually9.17mg/Lθ=correctionfactorfortemperature=1.024T=wastewatertemperature,°CF=foulingfactor,typically0.65to1.0fornofoulingα=oxygen transfer correction factor for wastewater, typically
0.3–0.4foractivatedsludgereactorswithBODremoval,and0.45–0.75forBODremovalandnitrificationsystems
8.4.5.1 Types of aerators
Differenttypesofaeratorsareusedinaerationtanks.Theselectionofaera-tionsystemdependsonthesitecharacteristicsandtypeofprocessused.Thefollowingaretwoofthecommonlyusedaerationsystems.Figures 8.8and8.9illustratethesesystems.
Figure 8.8 Aeration tanks with submerged fine bubble diffuser system (photo by Rumana Riffat).
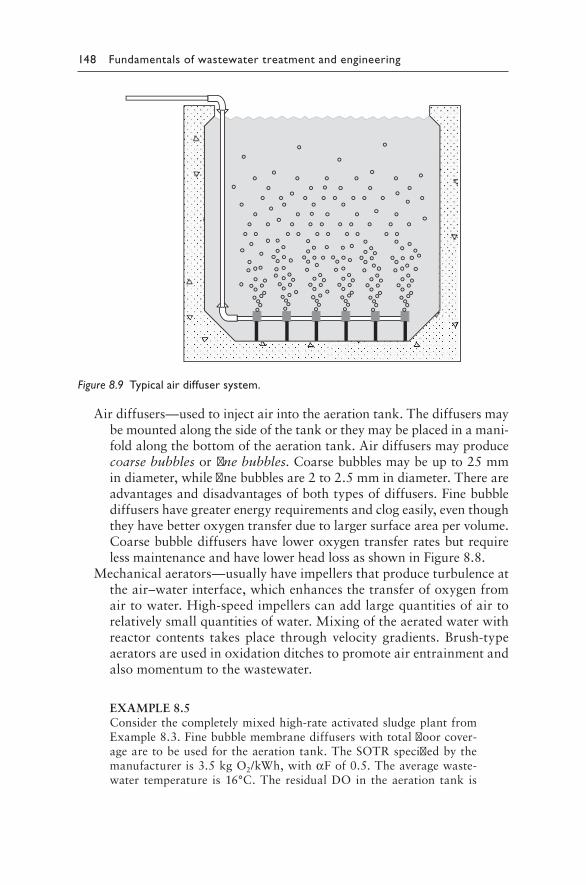
148 Fundamentals of wastewater treatment and engineering
Airdiffusers—usedtoinjectairintotheaerationtank.Thediffusersmaybemountedalongthesideofthetankortheymaybeplacedinamani-foldalongthebottomoftheaerationtank.Airdiffusersmayproducecoarse bubblesorfine bubbles.Coarsebubblesmaybeupto25mmindiameter,whilefinebubblesare2to2.5mmindiameter.Thereareadvantagesanddisadvantagesofbothtypesofdiffusers.Finebubblediffusershavegreaterenergyrequirementsandclogeasily,eventhoughtheyhavebetteroxygentransferduetolargersurfaceareapervolume.CoarsebubblediffusershaveloweroxygentransferratesbutrequirelessmaintenanceandhavelowerheadlossasshowninFigure8.8.
Mechanicalaerators—usuallyhaveimpellersthatproduceturbulenceattheair–waterinterface,whichenhancesthetransferofoxygenfromairtowater.High-speedimpellerscanaddlargequantitiesofairtorelativelysmallquantitiesofwater.Mixingoftheaeratedwaterwithreactor contents takesplace throughvelocity gradients.Brush-typeaeratorsareusedinoxidationditchestopromoteairentrainmentandalsomomentumtothewastewater.
EXAMPLE8.5Considerthecompletelymixedhigh-rateactivatedsludgeplantfromExample8.3.Finebubblemembranediffuserswithtotalfloorcover-agearetobeusedfortheaerationtank.TheSOTRspecifiedbythemanufactureris3.5kgO2/kWh,withαFof0.5.Theaveragewaste-water temperature is16°C.The residualDO in theaeration tank is
Figure 8.9 Typical air diffuser system.
Secondary treatment 149
4 mg/L,βis0.95,andsaturationoxygenconcentrationisat16°Candtankdepthelevationis9.81mg/L.Calculatetheoxygendemandandthepowerrequiredforaeration.
SOLUTION
Step1.CalculatetheoxygendemandforBODremoval.Usingequation(8.57)andthedatafromExample8.3,
Mo=Q(So–S)–1.42Px
=15,000m3/d(1.1–0.15)kg/m3–1.42×8640kg/d =1981.20kg/d
Useapeakingfactor=2.0.Oxygendemand=1982.Oxygendemand=1981.2×2.0=3962.40kg/d.
Step2.CalculatetheAOTR.
SOTR=3.5kgO2/kWh Cs,T,H=9.81mg/L Cs,20=9.17mg/L CL=4mg/L
Useequation(8.59)tocalculateAOTR.
AO TR SO TRC C
CFsT H L
s
T=−
( )( )−βθ α, ,
,20
20
or
AO TR = × −
−3 50 95 9 81 4
9 171 02416 20.
. .
..(( )( )0 5.
or
AOTR=0.92kgO2/kWh
Oxygentransferefficiency=AOTR/SOTR×100%=(0.95/3.5)×100%=27%whichistypicalforthistypeofaerationsystem.
Step3.Calculatepowerrequiredforaeration.Oxygendemand=3962.40kgO2/d=165.10kgO2/h.Powerrequired=oxygendemand/AOTR
=(165.10kgO2/h)/(0.92kgO2/kWh)
=179.46kW
≈180kW
150 Fundamentals of wastewater treatment and engineering
8.5 TYPES OF SUSPENDED GROWTH PROCESSES
Awidevarietyofsuspendedgrowthprocessesareinoperationatwastewatertreatmentplantsworldwide.Each typehas its advantages and limitations.Wastewatercharacteristics,sitecharacteristics,effluentlimitations,regulatoryrequirements,andeconomicconsiderationsaresomeofthefactorsthatinflu-encethechoiceandselectionofaparticularprocess.Pilotstudiesshouldbeconductedbeforemakingafinalselection.SomeofthemorecommontypesofsuspendedgrowthprocessesusedforBODremovalaredescribedbelow.
8.5.1 Conventional activated sludge
Theconventionalactivatedsludgeprocessisthemostwidelyusedsuspendedgrowthprocessforthetreatmentofwastewater.ThebasicprocesshasbeendescribedindetailinSection8.3.Section8.4providesthedevelopmentofdesignmodels for completelymixedandplugflowactivated sludgepro-cesses.Typicaldesignvalues for completelymixed systemsare (Peavyetal.,1985)asfollows:HRT3–5h,F/M0.2–0.4,SRT4–15d,VL0.8–2.0kgBOD5/m3·d,withBODremovalefficiency85%–95%andrecycleratioof0.25–1.0.Forplugflowsystemstherecycleratiovariesfrom0.25to0.5,withanHRTof4–8handVL0.3–0.6kgBOD5/m3·d.TheSRTandF/Mratiosforthetwosystemsaresimilar.
Anumberofvariationsoftheconventionalprocesshavebeendevelopedandareinuse.Thefollowingsectionsprovidedescriptionsofafewofthem.
8.5.2 Step aeration or step feed process
Inthisprocess,alongandnarrowaerationtankisusedforplugflowcon-figuration.Theinfluentwastewaterenterstheaerationtankatseveralloca-tionsalongthelength.Thishelpstoreducetheoxygendemandattheheadinletpoint.Atthesametime,compressedair is injectedintothetankatseverallocationsalongthelength.Thishelpsprovideuniformaerobiccon-ditionsthroughoutthetank.This is illustrated inFigure 8.10(a).TypicaldesignvaluesareHRT3–5h,F/M0.2–0.4,SRT4–15d,VL0.6–1.0kgBOD5/m3·d,withBODremovalefficiency85%–95%.
8.5.3 Tapered aeration process
Plugflowconfigurationisused,withthewastewaterenteringtheaerationtankatoneend.Theairflowistaperedwiththehigherflowtowardtheinlet,graduallytaperingtolowairflowtowardtheoutlet.Airandmaxi-mumoxygenisprovidedattheinletwheretheorganicloadishighest.Asthewastewaterflowsthroughthetank,thesubstrateisdegradedandtheoxygendemandislowertowardtheoutlet.Thisresultsinefficientuseof
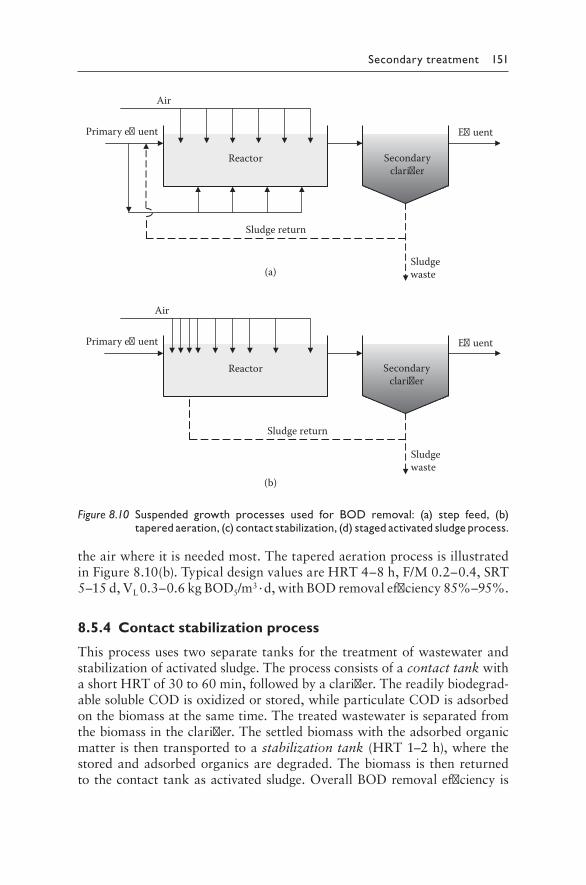
Secondary treatment 151
theairwhereitisneededmost.ThetaperedaerationprocessisillustratedinFigure 8.10(b).TypicaldesignvaluesareHRT4–8h,F/M0.2–0.4,SRT5–15d,VL0.3–0.6kgBOD5/m3·d,withBODremovalefficiency85%–95%.
8.5.4 Contact stabilization process
Thisprocessusestwoseparatetanksforthetreatmentofwastewaterandstabilizationofactivatedsludge.Theprocessconsistsofacontact tankwithashortHRTof30to60min,followedbyaclarifier.Thereadilybiodegrad-ablesolubleCODisoxidizedorstored,whileparticulateCODisadsorbedonthebiomassatthesametime.Thetreatedwastewaterisseparatedfromthebiomassintheclarifier.Thesettledbiomasswiththeadsorbedorganicmatteristhentransportedtoastabilization tank(HRT1–2h),wherethestoredandadsorbedorganicsaredegraded.Thebiomass is thenreturnedtothecontacttankasactivatedsludge.OverallBODremovalefficiencyis
(a)
(b)
Reactor Secondaryclari�er
Primary e�uent E�uent
Air
Sludge return
Sludgewaste
Reactor Secondaryclari�er
Primary e�uent E�uent
Air
Sludge return
Sludgewaste
Figure 8.10 Suspended growth processes used for BOD removal: (a) step feed, (b) tapered aeration, (c) contact stabilization, (d) staged activated sludge process.
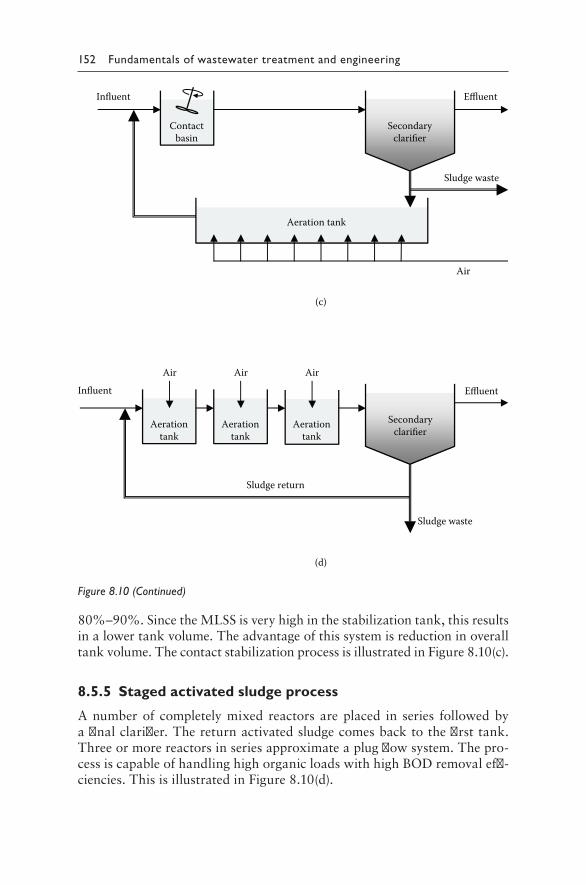
152 Fundamentals of wastewater treatment and engineering
80%–90%.SincetheMLSSisveryhighinthestabilizationtank,thisresultsinalowertankvolume.Theadvantageofthissystemisreductioninoveralltankvolume.ThecontactstabilizationprocessisillustratedinFigure 8.10(c).
8.5.5 Staged activated sludge process
Anumberof completelymixed reactorsareplaced in series followedbyafinalclarifier.Thereturnactivatedsludgecomesbacktothefirsttank.Threeormorereactorsinseriesapproximateaplugflowsystem.Thepro-cessiscapableofhandlinghighorganicloadswithhighBODremovaleffi-ciencies.ThisisillustratedinFigure 8.10(d).
(d)
(c)
Influent Effluent
Influent Effluent
Contactbasin
Secondaryclarifier
Secondaryclarifier
Aerationtank
Aerationtank
Aerationtank
Sludge return
Sludge waste
Sludge waste
Aeration tank
Air
Air Air Air
Figure 8.10 (Continued)
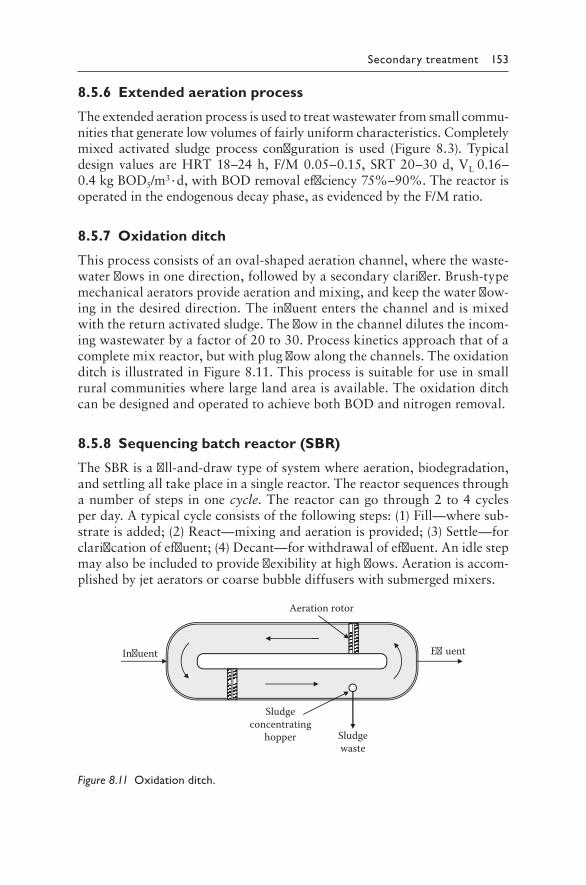
Secondary treatment 153
8.5.6 Extended aeration process
Theextendedaerationprocessisusedtotreatwastewaterfromsmallcommu-nitiesthatgeneratelowvolumesoffairlyuniformcharacteristics.Completelymixedactivated sludgeprocess configuration is used (Figure 8.3).TypicaldesignvaluesareHRT18–24h,F/M0.05–0.15,SRT20–30d,VL0.16–0.4kgBOD5/m3·d,withBODremovalefficiency75%–90%.Thereactorisoperatedintheendogenousdecayphase,asevidencedbytheF/Mratio.
8.5.7 Oxidation ditch
Thisprocessconsistsofanoval-shapedaerationchannel,wherethewaste-waterflowsinonedirection,followedbyasecondaryclarifier.Brush-typemechanicalaeratorsprovideaerationandmixing,andkeepthewaterflow-inginthedesireddirection.Theinfluententersthechannelandismixedwiththereturnactivatedsludge.Theflowinthechanneldilutestheincom-ingwastewaterbyafactorof20to30.Processkineticsapproachthatofacompletemixreactor,butwithplugflowalongthechannels.TheoxidationditchisillustratedinFigure 8.11.Thisprocessissuitableforuseinsmallruralcommunitieswherelargelandareaisavailable.TheoxidationditchcanbedesignedandoperatedtoachievebothBODandnitrogenremoval.
8.5.8 Sequencing batch reactor (SBR)
TheSBRisafill-and-drawtypeofsystemwhereaeration,biodegradation,andsettlingalltakeplaceinasinglereactor.Thereactorsequencesthroughanumberofsteps inonecycle.Thereactorcangothrough2to4cyclesperday.Atypicalcycleconsistsofthefollowingsteps:(1)Fill—wheresub-strateisadded;(2)React—mixingandaerationisprovided;(3)Settle—forclarificationofeffluent;(4)Decant—forwithdrawalofeffluent.Anidlestepmayalsobeincludedtoprovideflexibilityathighflows.Aerationisaccom-plishedbyjetaeratorsorcoarsebubblediffuserswithsubmergedmixers.
In�uent E�uent
Sludgewaste
Aeration rotor
Sludgeconcentrating
hopper
Figure 8.11 Oxidation ditch.
154 Fundamentals of wastewater treatment and engineering
8.5.9 Membrane biological reactor (MBR)
The MBR process uses a biological reactor with suspended biomass forBODand/ornitrogenremoval,andmicro-orultrafiltrationmembranesforsolidsseparation.Thebioreactorsmaybeaerobicoranaerobic.Theefflu-entwaterqualityisveryhighandmakesthisprocessattractiveforwaterreuseapplications.MBRshavebeenusedfortreatmentofmunicipalandindustrialwastewater,aswellasforwaterreuse.Thistypeofreactorhasbeenfoundsuitableforremovalofavarietyofcontaminantsfrommunici-palwastewater,e.g.pharmaceuticalproductsandaromatichydrocarbons,amongothers(Kimuraetal.,2007;Francescoetal.,2011).Recentresearchhas focusedontheuseofnanomaterials,whichareappliedasacoatingonthemembranestoimprovethehydrophilicity,selectivity,conductivity,foulingresistance,andantiviralpropertiesofmembranes(Suetal.,2011;KimandvanderBruggen,2010;Luetal.,2009;Zodrowetal.,2007;BaeandTak,2005).
The MBR process has the following advantages (Metcalf and Eddy,2003):
• ItcanoperateathighMLSSconcentrations(15,000to25,000mg/L).• AsaresultofhighMLSS,itcanhandlehighvolumetricloadingrates
atshortHRTs.• LongerSRTresultsinlesssludgeproduction.• High-quality effluent in terms of low turbidity, TSS, BOD, and
pathogens.• Lessspaceisrequired,asnosecondaryclarifierisneeded.
Thedisadvantagesoftheprocessincludethefollowing:
• Highcapitalcosts• Membranefoulingproblems• Membranereplacementcosts• Higherenergycosts
Membranebioreactorsystemshavetwobasicconfigurations:(1)Aninte-gratedbioreactorhasamembranemodule immersed in the reactor, and(2) a recirculated MBR has the membrane module separately mountedoutside the reactor. Immersed membranes use hollow fiber or flat sheetmembranesmountedinmodules.Theyoperateatlowerpressuresandareused in activated sludge bioreactors. The separate systems use pressure-driven, in-pipe cartridge membranes. They are used more for industrialwastewaters(Davis,2011).Additionaldiscussiononmembranecharacter-istics,membranefouling,andfluxcalculationsisprovidedinChapter13(Section13.4.3).
Secondary treatment 155
8.6 STABILIZATION PONDS AND LAGOONS
Ponds and lagoons are land-based suspendedgrowth treatment systems.Usually there are no primary or secondary clarifiers. All treatment andsolids separation takes place in an earthen basin, where wastewater isretainedandnaturalpurificationprocessesresultinbiologicaltreatment.Mechanicalmixingisprovidedinalagoon,whereasthereisnomechanicalmixinginapond.Pondscanbe(a)aerobic—shallowpond,(b)anaerobic—deeppond,and(c)facultative.Lagoonscanbe(a)aerobic—withcompletemixing,and(b)facultative—withmixingoftheliquidportion.Themajor-ityofpondsandlagoonsarefacultative.AtreatmentsystemmayconsistofanaerobiclagoonfollowedbyfacultativepondstoachievesufficientBODremoval.Thesetypesofsystemsaresuitableforsmallcommunitiesandon-sitetreatmentofindustrialwastewaters.Lagoonsareusedextensivelyfortreatmentoflivestockwastewatersathogandpoultryfarms.
Theadvantagesoftheseland-basedtreatmentsystemsareasfollows:
• Lowcapitalcost• Lowoperatingcost• Largevolumeto inflowratioprovidesenoughdilutiontominimize
theeffectsofvariableorganicandhydraulicloadings
Thedisadvantagesincludethefollowing:
• Largelandareaisrequired.• Odorproblemsareaconcern.• High suspended solids concentration in the effluent. In the United
States,thedischargelimitsforsolidsintheeffluentare75mg/LasspecifiedbytheEnvironmentalProtectionAgency(EPA).
• At a cold temperature, biological activity is significantly reduced.Incoldclimates,itisoftennecessarytoprovidesufficientvolumetostoretheentirewinterflow.
8.6.1 Process microbiology
Inthissectionthemicrobiologicalprocessestakingplaceinafacultativepond will be discussed. This includes both aerobic and anaerobic pro-cesses.Thefacultativepondhasacomplexsystemofmicrobialprocessesthatresultindegradationoforganicmatter.Thefacultativepondhasanaerobic section in the top layers,anaerobic section in thebottom layers,andsomefacultativereactionstakingplaceinbetween.ThisisillustratedinFigure 8.12.
The wastewater enters the pond near the bottom. The biological andother solids settle at the bottom in a thin sludge blanket. Anaerobic
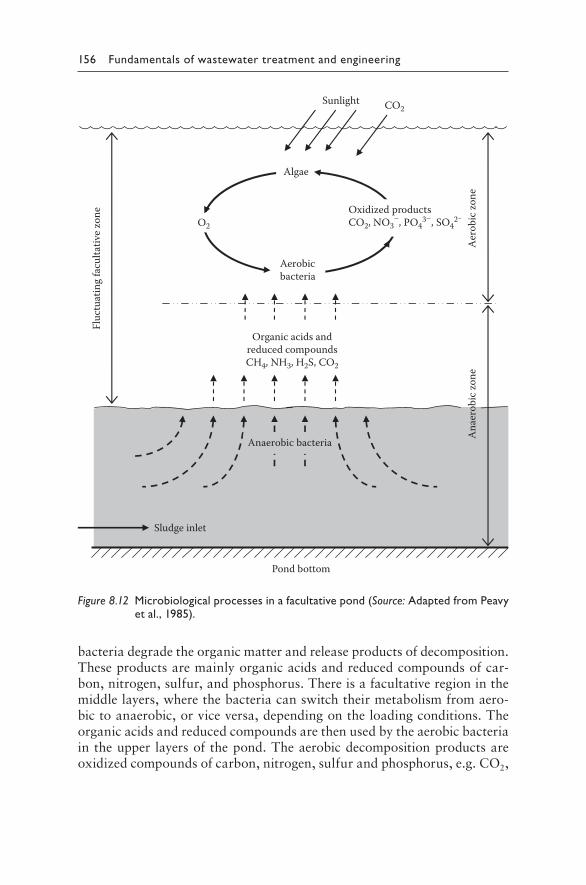
156 Fundamentals of wastewater treatment and engineering
bacteriadegradetheorganicmatterandreleaseproductsofdecomposition.Theseproductsaremainlyorganicacidsandreducedcompoundsofcar-bon,nitrogen,sulfur,andphosphorus.Thereisafacultativeregioninthemiddlelayers,wherethebacteriacanswitchtheirmetabolismfromaero-bictoanaerobic,orviceversa,dependingontheloadingconditions.Theorganicacidsandreducedcompoundsarethenusedbytheaerobicbacteriaintheupper layersofthepond.Theaerobicdecompositionproductsareoxidizedcompoundsofcarbon,nitrogen,sulfurandphosphorus,e.g.CO2,
Algae
Oxidized productsCO2, NO3
–, PO43–, SO4
2–O2
Aerobicbacteria
CO2Sunlight
Ana
erob
ic zo
ne
Aero
bic z
one
Fluc
tuat
ing
facu
ltativ
e zon
e
Organic acids andreduced compoundsCH4, NH3, H2S, CO2
Sludge inlet
Pond bottom
Anaerobic bacteria
Figure 8.12 Microbiological processes in a facultative pond (Source: Adapted from Peavy et al., 1985).
Secondary treatment 157
NO3–,PO4
–3,SO4–2,etc.Algaeusetheseoxidizedcompoundsasfoodinpres-
enceofsunlightandreleaseO2asaby-product.Thereleasedoxygenhelpstoreplenishthedissolvedoxygenconcentrationofthepondandmaintainaerobicconditionsinthetoplayers.Thus,asymbioticrelationshipexistswithinthemicrobialcommunityinthepond.
Thedepthof theaerobic zonedependson thepenetrationof sunlightand wind action. Strong wind action and enhanced light penetration inclearwaterscanextendthedepthoftheaerobiczonedownward.Ontheotherhand,absenceofwindandcloudyskiescanresultintheanaerobiczone rising toward the surface.The facultative zone is the regionwheredissolvedoxygenconcentrationfluctuatesinthepond.Facultativemicroor-ganismsexistinthiszone,whicharecapableofadjustingtheirmetabolisminresponsetoloworhighdissolvedoxygenconcentrations.
8.6.2 Design of pond or lagoon system
Anumberofmodelsareavailableforthedesignofpondsandlagoons.Themostcommonlyusedmodelassumesacompletelymixedreactorwithoutsolidsrecycle.Therateofsubstrateutilizationisassumedtobefirstorder.Amassbalanceforthesolubleportionofsubstratecanbewritten,andthefollowingdesignequationcanbeobtained(MetcalfandEddy,2003;Peavyetal.,1985):
S
S ko
=+1
1 θ (8.60)
where:S=effluentsolubleBODconcentration,mg/LSo=influentsolubleBODconcentration,mg/Lk=firstorderratecoefficient,variesfrom0.5to1.5d–1
θ=HRT=V/Q,d
Whenapondorlagoonsystemisusedformunicipalwastewatertreatment,itiscommonpracticetodistributetheflowbetweentwotothreepondsinseries.Thisisdonetominimizeshort-circuitingthatcanoccurinonelargepond/lagoon. The first unit is usually designed as an aerated facultativelagoon,sinceitreceivesthewastewaterwiththehighestBODconcentra-tion.Thisisfollowedbytwoormorefacultativeponds.Thedesignequa-tionfornnumberofequallysizedpondsisgivenby
S
S k nn
on
=+
1
1( / )θ (8.61)
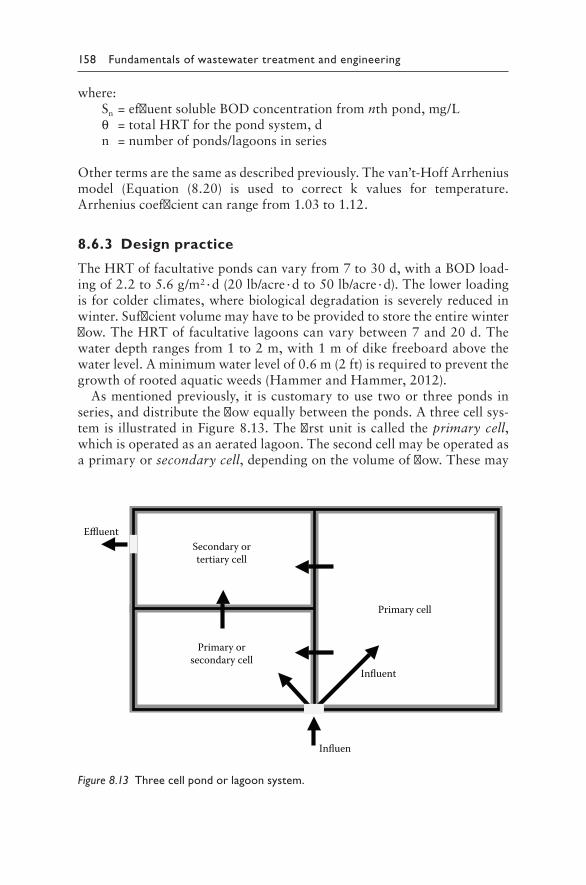
158 Fundamentals of wastewater treatment and engineering
where:Sn=effluentsolubleBODconcentrationfromnthpond,mg/Lθ=totalHRTforthepondsystem,dn=numberofponds/lagoonsinseries
Othertermsarethesameasdescribedpreviously.Thevan’t-HoffArrheniusmodel (Equation (8.20) is used to correct k values for temperature.Arrheniuscoefficientcanrangefrom1.03to1.12.
8.6.3 Design practice
TheHRToffacultativepondscanvaryfrom7to30d,withaBODload-ingof2.2to5.6g/m2·d(20lb/acre·dto50lb/acre·d).Thelowerloadingisforcolderclimates,wherebiologicaldegradationisseverelyreducedinwinter.Sufficientvolumemayhavetobeprovidedtostoretheentirewinterflow.TheHRToffacultativelagoonscanvarybetween7and20d.Thewaterdepthrangesfrom1to2m,with1mofdikefreeboardabovethewaterlevel.Aminimumwaterlevelof0.6m(2ft)isrequiredtopreventthegrowthofrootedaquaticweeds(HammerandHammer,2012).
Asmentionedpreviously, it iscustomarytousetwoorthreeponds inseries,anddistributetheflowequallybetweentheponds.Athreecellsys-temis illustratedinFigure 8.13.Thefirstunit iscalledtheprimary cell,whichisoperatedasanaeratedlagoon.Thesecondcellmaybeoperatedasaprimaryorsecondary cell,dependingonthevolumeofflow.Thesemay
Effluent
Influent
Influen
Secondary ortertiary cell
Primary orsecondary cell
Primary cell
Figure 8.13 Three cell pond or lagoon system.
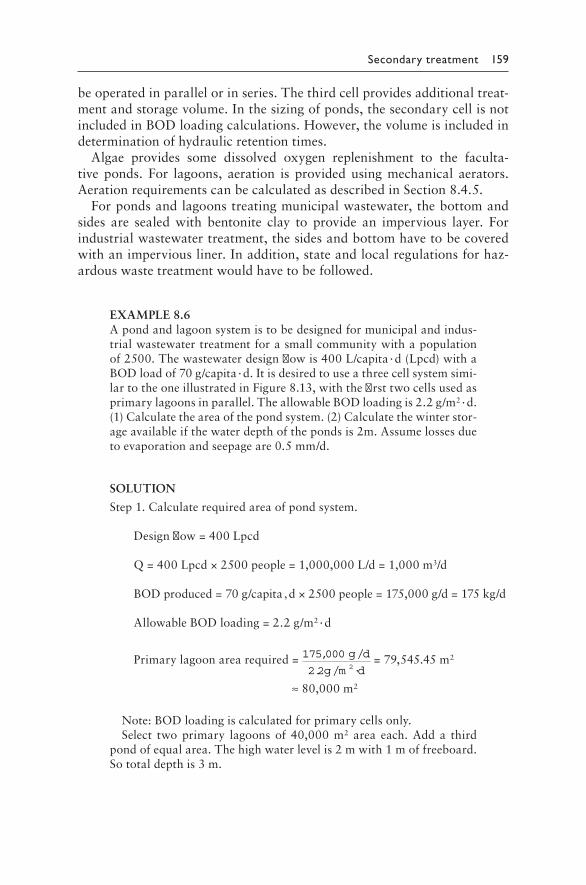
Secondary treatment 159
beoperatedinparallelorinseries.Thethirdcellprovidesadditionaltreat-mentandstoragevolume.Inthesizingofponds,thesecondarycellisnotincludedinBODloadingcalculations.However,thevolumeisincludedindeterminationofhydraulicretentiontimes.
Algae provides some dissolved oxygen replenishment to the faculta-tiveponds. For lagoons, aeration is providedusingmechanical aerators.AerationrequirementscanbecalculatedasdescribedinSection8.4.5.
Forpondsandlagoonstreatingmunicipalwastewater,thebottomandsides are sealed with bentonite clay to provide an impervious layer. Forindustrialwastewatertreatment,thesidesandbottomhavetobecoveredwithanimperviousliner.Inaddition,stateandlocalregulationsforhaz-ardouswastetreatmentwouldhavetobefollowed.
EXAMPLE8.6Apondandlagoonsystemistobedesignedformunicipalandindus-trialwastewatertreatmentforasmallcommunitywithapopulationof2500.Thewastewaterdesignflowis400L/capita·d(Lpcd)withaBODloadof70g/capita·d.Itisdesiredtouseathreecellsystemsimi-lartotheoneillustratedinFigure 8.13,withthefirsttwocellsusedasprimarylagoonsinparallel.TheallowableBODloadingis2.2g/m2·d.(1)Calculatetheareaofthepondsystem.(2)Calculatethewinterstor-ageavailableifthewaterdepthofthepondsis2m.Assumelossesduetoevaporationandseepageare0.5mm/d.
SOLUTION
Step1.Calculaterequiredareaofpondsystem.
Designflow=400Lpcd
Q=400Lpcd×2500people=1,000,000L/d=1,000m3/d
BODproduced=70g/capita‚d×2500people=175,000g/d=175kg/d
AllowableBODloading=2.2g/m2·d
Primarylagoonarearequired=175 0002 2 2
, /
. / ·
g d
g m d=79,545.45m2
≈80,000m2
Note:BODloadingiscalculatedforprimarycellsonly.Select twoprimary lagoonsof 40,000m2 area each.Adda third
pondofequalarea.Thehighwaterlevelis2mwith1moffreeboard.Sototaldepthis3m.
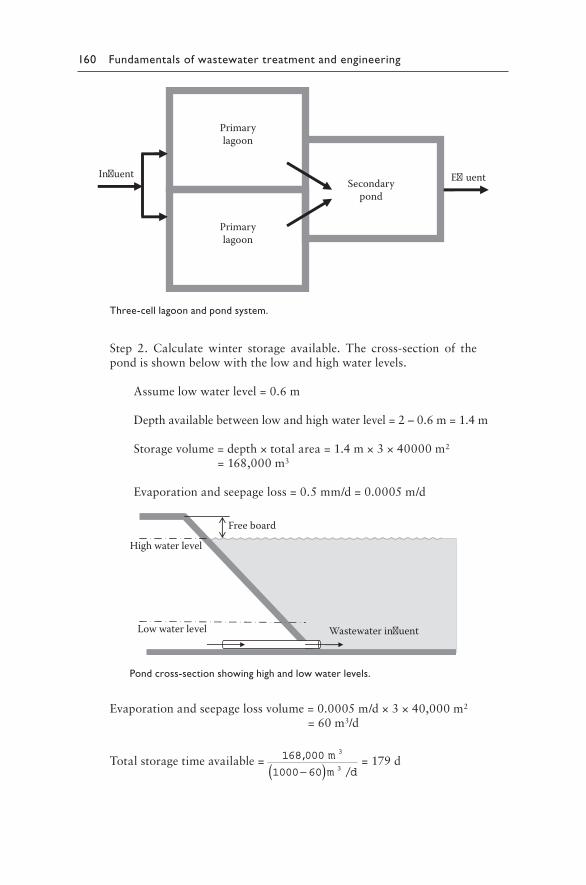
160 Fundamentals of wastewater treatment and engineering
Primarylagoon
In�uent
Primarylagoon
Secondarypond
E�uent
Three-cell lagoon and pond system.
Step 2. Calculate winter storage available. The cross-section of thepondisshownbelowwiththelowandhighwaterlevels.
Assumelowwaterlevel=0.6m
Depthavailablebetweenlowandhighwaterlevel=2–0.6m=1.4m
Storagevolume=depth×totalarea=1.4m×3×40000m2=168,000m3
Evaporationandseepageloss=0.5mm/d=0.0005m/d
Wastewater in�uent Low water level
High water level
Free board
Pond cross-section showing high and low water levels.
Evaporationandseepagelossvolume=0.0005m/d×3×40,000m2
=60m3/d
Totalstoragetimeavailable= 168 000
1000 60
3
3
,
/
m
m d−( ) =179d
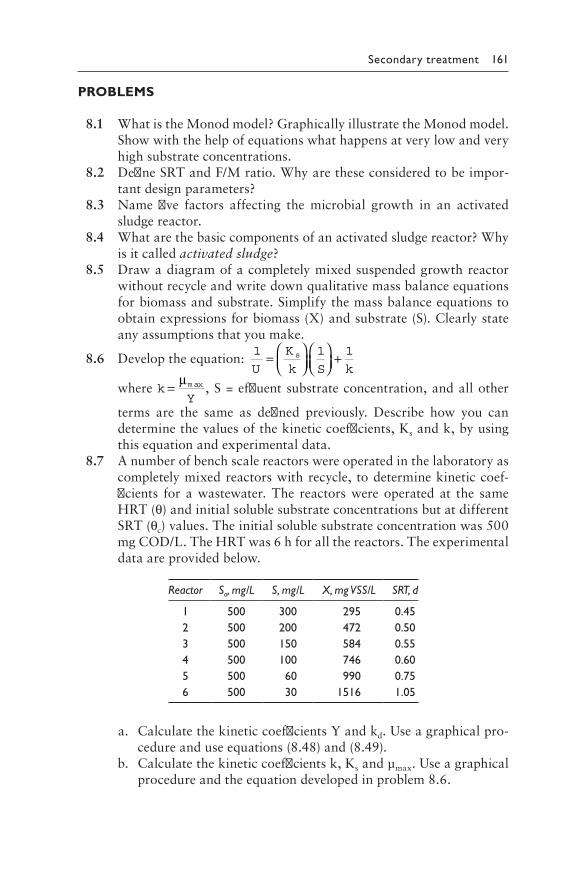
Secondary treatment 161
PROBLEMS
8.1 WhatistheMonodmodel?GraphicallyillustratetheMonodmodel.Showwiththehelpofequationswhathappensatverylowandveryhighsubstrateconcentrations.
8.2 DefineSRTandF/Mratio.Whyaretheseconsideredtobeimpor-tantdesignparameters?
8.3 Name five factors affecting the microbial growth in an activatedsludgereactor.
8.4 Whatarethebasiccomponentsofanactivatedsludgereactor?Whyisitcalledactivated sludge?
8.5 Drawadiagramofacompletelymixedsuspendedgrowthreactorwithoutrecycleandwritedownqualitativemassbalanceequationsforbiomassandsubstrate.Simplifythemassbalanceequationstoobtainexpressionsforbiomass(X)andsubstrate(S).Clearlystateanyassumptionsthatyoumake.
8.6 Developtheequation:1 1 1
U
K
k S ks=
+
wherekYmax= µ
,S=effluentsubstrateconcentration,andallother
terms are the same as defined previously. Describe how you candeterminethevaluesofthekineticcoefficients,Ksandk,byusingthisequationandexperimentaldata.
8.7 Anumberofbenchscalereactorswereoperatedinthelaboratoryascompletelymixedreactorswithrecycle, todeterminekineticcoef-ficients for awastewater.The reactorswereoperatedat the sameHRT(θ)andinitialsolublesubstrateconcentrationsbutatdifferentSRT(θc)values.Theinitialsolublesubstrateconcentrationwas500mgCOD/L.TheHRTwas6hforallthereactors.Theexperimentaldataareprovidedbelow.
Reactor So, mg/L S, mg/L X, mg VSS/L SRT, d
1 500 300 295 0.452 500 200 472 0.503 500 150 584 0.554 500 100 746 0.605 500 60 990 0.756 500 30 1516 1.05
a. CalculatethekineticcoefficientsYandkd.Useagraphicalpro-cedureanduseequations(8.48)and(8.49).
b. Calculatethekineticcoefficientsk,Ksandµmax.Useagraphicalprocedureandtheequationdevelopedinproblem8.6.
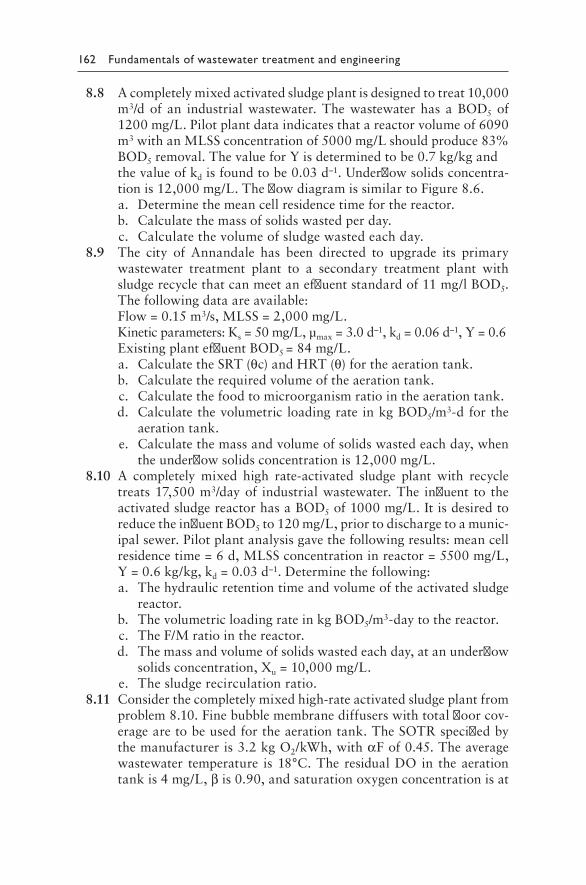
162 Fundamentals of wastewater treatment and engineering
8.8 Acompletelymixedactivatedsludgeplantisdesignedtotreat10,000m3/dof an industrialwastewater.Thewastewaterhas aBOD5of1200mg/L.Pilotplantdataindicatesthatareactorvolumeof6090m3withanMLSSconcentrationof5000mg/Lshouldproduce83%BOD5removal.ThevalueforYisdeterminedtobe0.7kg/kgandthevalueofkdisfoundtobe0.03d–1.Underflowsolidsconcentra-tionis12,000mg/L.TheflowdiagramissimilartoFigure 8.6.
a. Determinethemeancellresidencetimeforthereactor. b. Calculatethemassofsolidswastedperday. c. Calculatethevolumeofsludgewastedeachday. 8.9 The city of Annandale has been directed to upgrade its primary
wastewater treatment plant to a secondary treatment plant withsludgerecyclethatcanmeetaneffluentstandardof11mg/lBOD5.Thefollowingdataareavailable:
Flow=0.15m3/s,MLSS=2,000mg/L. Kineticparameters:Ks=50mg/L,µmax=3.0d–1,kd=0.06d–1,Y=0.6 ExistingplanteffluentBOD5=84mg/L. a. CalculatetheSRT(θc)andHRT(θ)fortheaerationtank. b. Calculatetherequiredvolumeoftheaerationtank. c. Calculatethefoodtomicroorganismratiointheaerationtank. d. Calculatethevolumetric loadingrate inkgBOD5/m3-dforthe
aerationtank. e. Calculatethemassandvolumeofsolidswastedeachday,when
theunderflowsolidsconcentrationis12,000mg/L. 8.10 A completely mixed high rate-activated sludge plant with recycle
treats17,500m3/dayof industrialwastewater.The influent to theactivatedsludgereactorhasaBOD5of1000mg/L.ItisdesiredtoreducetheinfluentBOD5to120mg/L,priortodischargetoamunic-ipalsewer.Pilotplantanalysisgavethefollowingresults:meancellresidencetime=6d,MLSSconcentrationinreactor=5500mg/L,Y=0.6kg/kg,kd=0.03d–1.Determinethefollowing:
a. Thehydraulicretentiontimeandvolumeoftheactivatedsludgereactor.
b. ThevolumetricloadingrateinkgBOD5/m3-daytothereactor. c. TheF/Mratiointhereactor. d. Themassandvolumeofsolidswastedeachday,atanunderflow
solidsconcentration,Xu=10,000mg/L. e. Thesludgerecirculationratio. 8.11 Considerthecompletelymixedhigh-rateactivatedsludgeplantfrom
problem8.10.Finebubblemembranediffuserswithtotalfloorcov-eragearetobeusedfortheaerationtank.TheSOTRspecifiedbythemanufactureris3.2kgO2/kWh,withαFof0.45.Theaveragewastewater temperature is18°C.The residualDO in theaerationtankis4mg/L,βis0.90,andsaturationoxygenconcentrationisat
Secondary treatment 163
18°Candtankdepthelevationis9.54mg/L.Calculatetheoxygendemandandthepowerrequiredforaeration.
8.12 ThetownofOrlandParkusesstabilizationpondstotreatitswaste-water. The wastewater flow is 140,000 gpd with a BOD5 of 320mg/L.Totalsurfaceareaofthepondis14.8acres.Waterlossduringthewintermonthsis0.11in/day.
a. CalculatetheBODloadingonthepond. b. Calculate thedaysofwinterstorageavailable,whenoperating
waterdepthsrangefrom2ftto5ft.
REFERENCES
Ardern,E.andLockett,W.T. (1914a)“Experimentson theOxidationofSewageWithouttheAidofFilters.”Journal of Society of Chemical Industry,London,vol.33,p.523–539.
Ardern, E. and Lockett, W. T. (1914b) “Oxidation of Sewage Without the Aidof Filters.” Journal of Society of Chemical Industry, London, vol. 33,p. 1122–1124.
Bae, T., and Tak, T. (2005) “Preparation of TiO2 Self-Assembled PolymericNanocomposite Membranes and Examination of Their Fouling MitigationEffectsinaMembraneBioreactorSystem.”Journal of Membrane Science,vol.266,no.1–2,pp.1–5.
Clark,H.W.andAdams,G.O.(1914)“SewageTreatmentbyaerationandContactinTanksContainingLayersofSlate.”Engineering Record,vol.69,p.158–159.
Davis,M.(2011)Water and Wastewater Engineering: Design Principles and Practice.McGraw-Hill,Inc.,NewYork.
Francesco,F.,DiFabio,S.,Bolzonella,D.,andCecchi,F.(2011)“FateofAromaticHydrocarbons in Italian Municipal Wastewater Systems: An Overview ofWastewaterTreatmentUsingConventionalActivated-SludgeProcesses(CASP)and Membrane Bioreactors (MBRs).” Water Research, vol. 45, no. 1, pp.93–104.
Hammer,M.J.,andHammerM.J.Jr.(2012)Water and Wastewater Technology.Seventhedition.Pearson-PrenticeHall,Inc.,UpperSaddleRiver,NewJersey.
Jahan,K.,Hoque,S.,Ahmed,T.,Türkdoğan,andPatarkine,V. (2011)“ActivatedSludgeandOtherAerobicSuspendedCultureProcesses.”Water Environment Research,vol.83,no.10,pp.1092–1149.
Jones,R.,Parker,W.,Zhu,H.,Houweling,D.,andMurthy,S.(2009)“PredictingtheDegradabilityofWasteActivatedSludge.”Water Environment Research,vol.81,no.8,pp.765–771.
Kim, J., andvanderBruggen,B. (2010)“TheUseofNanoparticles inPolymericandCeramicMembraneStructures:ReviewofManufacturingProceduresandPerformance Improvement for Water Treatment.” Environmental Pollution, vol.158,no.7,pp.2335–2349.
Kimura, K., Hara, H., and Watanabe, Y. (2007)“Elimination of Selected AcidicPharmaceuticalsfromMunicipalWastewaterbyanActivatedSludgeSystemandMembraneBioreactors.”Environmental Science and Technology,vol.41,no.10,pp.3708–3714.
164 Fundamentals of wastewater treatment and engineering
Lawrence,A.W.,andMcCarty,P.L.(1970)“AUnifiedBasisforBiologicalTreatmentDesignandOperation.”Journal of Sanitary Engineering Division,vol.96,no.SA3,p.757.
Lu, Y., Yu, S., and Meng, L. (2009) “Preparation of Poly(Vinylidene Fluoride)UltrafiltrationMembraneModifiedbyNano-SizedAluminaandItsAntifoulingPerformance.”Harbin Gongye Daxue Xuebao/Journal of Harbin Institute of Technology, vol.41,no.10,pp.64–69.
Ma, F., Guo, J., Zhao, L., Chang, C., and Cui, D. (2009) “Application ofBioaugmentation to Improve theActivated Sludge System into the ContactOxidation System Treating Petrochemical Wastewater.” Bioresource Technology,vol.100,no.2,pp.597–602.
Metcalf and Eddy, Inc. (2003) Wastewater Engineering: Treatment and Reuse.Fourthedition.McGraw-Hill,Inc.,NewYork.
Monod, J. (1949) “The Growth of Bacterial Cultures.” Annual Review of Microbiology,vol.3,pp.371–394.
Peavy,H.S.,Rowe,D.R.,andTchobanoglous,G.(1985)Environmental Engineering.McGraw-Hill,Inc.,NewYork.
Plósz,B.,Leknes,H,Liltved,H.,andThomas,K.(2010)“DiurnalVariationsintheOccurrence and the Fate of Hormones andAntibiotics inActivated SludgeWastewaterTreatment inOslo,Norway.”Science of the Total Environment, vol.408,no.8,pp.1915–1924.
Rieger, L., Takács, I., Villez, K., Siegrist, H., Lessard, P., Vanrolleghem, P., andComeau, Y. (2010) “Data Reconciliation for Wastewater Treatment PlantSimulation Studies: Planning forHigh-QualityData andTypical Sources ofErrors.”Water Environment Research,vol.82,no.5,pp.426–433.
Schmit,C.G.,Jahan,K.,Schmit,K.,Aydinol,F.,Debik,E.,andPattarkine,V.(2010)“Activated Sludge and OtherAerobic Suspended Culture Processes.” Water Environment Research,vol.82,no.10,pp.1073–1123.
Su,Y.,Huang,C.,Pan,J.R.,Hsieh,W.,andChu,M.(2011)“FoulingMitigationbyTiO2CompositeMembraneinMembraneBioreactors.”Journal of Envi-ronmental Engineering (ASCE),doi:10.1061/(ASCE)EE.1943-7870.0000419.
WEF (1998) Design of Wastewater Treatment Plants. Fourth edition, Manual ofPracticeno.8,WaterEnvironmentFederation,Alexandria,Virginia.
Zodrow, K., Brunet, L., Mahendra, S., Li, D., Zhang,A., Li, Q., andAlvarez, P.J. (2007) “Polysulfone Ultrafiltration Membranes Impregnated with SilverNanoparticles Show Improved Biofouling Resistance and Virus Removal.”Polymers for Advanced Technologies, vol.18,no.7,pp.562–568.
165
Chapter 9
Secondary treatmentAttached growth and combined processes
9.1 INTRODUCTION
Thetwomajorcategoriesofbiologicaltreatmentare(1)suspendedgrowthand(2)attachedgrowthprocesses.Thefocusofthischapterisaerobicbio-logicaltreatmentusingattachedgrowthprocessesforbiochemicaloxygendemand(BOD)removal.Acombinationofsuspendedandattachedgrowthprocessesmaybeusedforbiologicaltreatmentofwastewater.Someofthesehybridprocessesarediscussedattheendofthechapter.SuspendedgrowthprocesseshavebeendiscussedinChapter8.BiologicalprocessesusedfornitrogenandphosphorusremovalwillbedescribedindetailinChapter13.
Inattachedgrowthsystemsthemicroorganismsareattachedtoaninertmedium,formingabiofilm.Asthewastewatercomesincontactwithandflowsoverthebiofilm,theorganicmatterisremovedbythemicroorgan-ismsanddegradedtoproduceanacceptableeffluent.Asecondaryclarifierisused,butsludgerecirculationtothebiologicalreactorisnotnecessary.The settled sludge consisting of sloughed biofilm is usually recirculatedback to the wet well or primary clarifier. Attached growth systems arecharacterizedbyahighdegreeofliquidrecirculation(100%to300%)tothebiologicalreactor.Themediumisusuallyaninertmaterialwithahighporosityandsurfacearea,e.g.rock,gravel,syntheticmedia.Thesystemcanbeoperatedasanaerobicoranaerobicprocess.Themediacanbewhollyorpartiallysubmergedinthewastewater.Thecommontypesofattachedgrowthprocessesincludetricklingfilters,biotowers,androtatingbiologi-calcontactors(RBCs).Thesewillbedescribedinthefollowingsections.
Themainadvantagesof the attachedgrowthprocesses are as follows(MetcalfandEddy,2003):
• Simplicityofoperation• Lowenergyrequirement• Lowmaintenancerequired• Abilitytohandleshockloads• Lowersludgeproduction
166 Fundamentals of wastewater treatment and engineering
• Noproblemsofsludgebulkinginsecondaryclarifiers• Bettersludgethickeningproperties
Disadvantagesincludethefollowing:
• Lowefficiencyatcoldtemperatures• Possibilityofmasstransferanddiffusionlimitations• Problemswithbiofilmmaintenanceduetoexcesssloughing• HigherBODandsolidsconcentrationintheeffluent• Possibilityofodorproblems
9.2 SYSTEM MICROBIOLOGY AND BIOFILMS
Themicroorganisms inthebiofilmaresimilartothosefoundinactivatedsludgereactors.Theyaremostlyheterotrophic,withfacultativebacteriabeingpredominant.Fungiandprotozoaarepresent.Ifsunlightisavailable,algaegrowthisfoundnearthesurface.Largerorganismssuchassludgeworms,insectlarvae,rotifers,etc.mayalsobepresent.Whenthecarboncontentofthewastewaterislow,nitrifyingbacteriamaybepresentinlargenumbers.
Inanattachedculturereactor,microorganismsattachthemselvesontothe inertmediaandgrowintodensefilms.Thesearecalledbiofilms.Asthe wastewater passes over the biofilm, suspended organic particles areadsorbedon thebiofilmsurface.Theadsorbedparticlesaredegraded tosolubleproducts,whicharethenfurtherdegradedtosimplerproductsandgasesbythebacteria.Dissolvedorganicspass intothebiofilmaccordingtomasstransferprinciples,duetothepresenceofconcentrationgradients.Dissolvedoxygenfromthewastewaterdiffusesintothebiofilmfortheaer-obicbacteria.Wasteproductsandgasesdiffuseoutwardfromthebiofilmand are carried out of the reactor with the wastewater. This process isillustratedinFigure 9.1.
With the passage of time, the thickness of the biofilm increases. Thebiofilm grows in a direction outward from the media. As the thicknessincreases,theouter0.1to0.2mmofbiofilmremainsaerobic(Peavyetal.,1985).Theinnerlayersofthebiofilmbecomeanaerobic,asoxygencannotpassintotheinnerlayersduetodiffusionlimitations.Thetotalthicknessmayrangefrom100µmto10mm.Withincreasingthicknessthebiofilmattachmentbecomesweak,andshearingactionofthewastewaterdislodgesitfromthemediaandtransportsittothesecondaryclarifier.Thisprocessisknownassloughingofbiofilm.Regrowthofbiofilmoccursquicklyinplacesclearedbysloughing.Sloughingisafunctionofthehydraulicandorganicloadingonthereactor.Thehydraulic loadingaccountsforshearvelocities,andtheorganicloadingcontrolstherateofmetabolisminthebiofilmlayer.
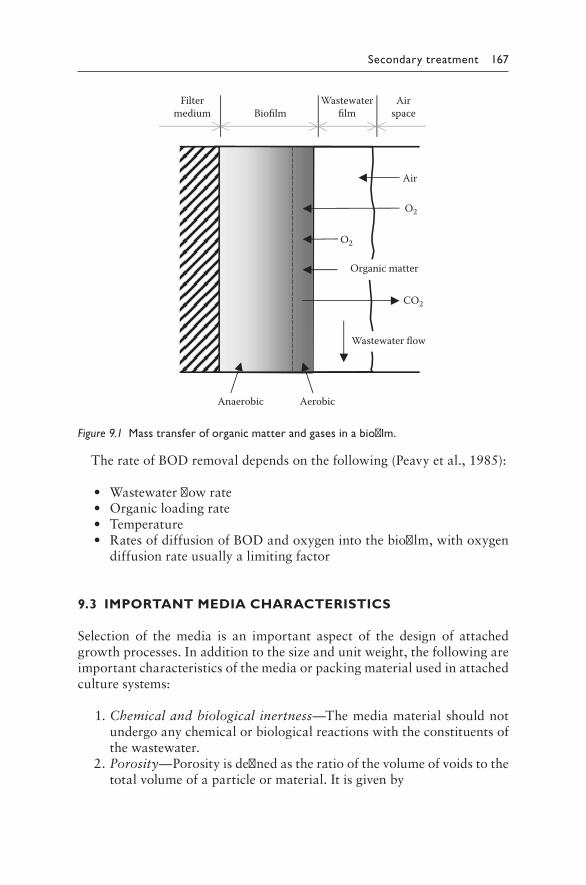
Secondary treatment 167
TherateofBODremovaldependsonthefollowing(Peavyetal.,1985):
• Wastewaterflowrate• Organicloadingrate• Temperature• RatesofdiffusionofBODandoxygenintothebiofilm,withoxygen
diffusionrateusuallyalimitingfactor
9.3 IMPORTANT MEDIA CHARACTERISTICS
Selection of the media is an important aspect of the design of attachedgrowthprocesses.Inadditiontothesizeandunitweight,thefollowingareimportantcharacteristicsofthemediaorpackingmaterialusedinattachedculturesystems:
1.Chemical and biological inertness—Themediamaterialshouldnotundergoanychemicalorbiologicalreactionswiththeconstituentsofthewastewater.
2.Porosity—Porosityisdefinedastheratioofthevolumeofvoidstothetotalvolumeofaparticleormaterial.Itisgivenby
Air
O2
O2
CO2
Filtermedium Biofilm
Wastewaterfilm
Airspace
Anaerobic Aerobic
Organic matter
Wastewater flow
Figure 9.1 Mass transfer of organic matter and gases in a biofilm.
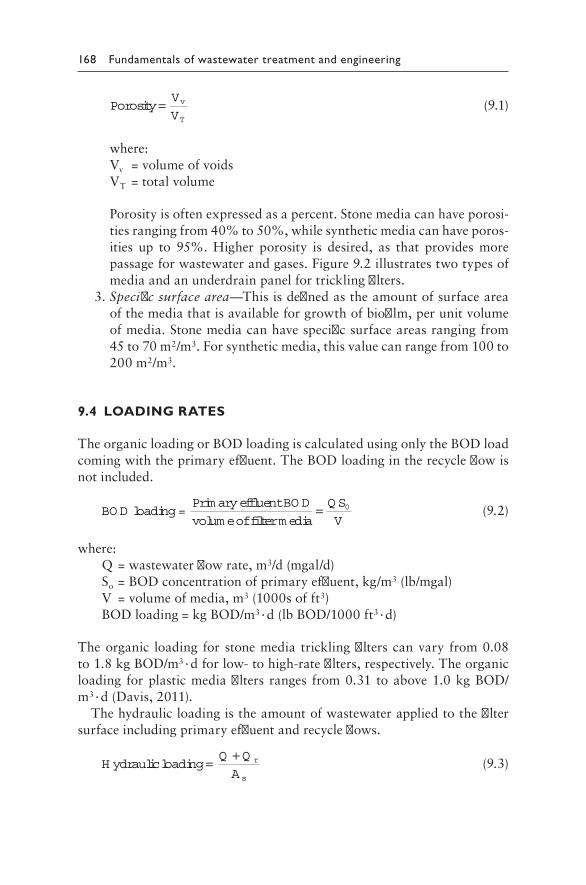
168 Fundamentals of wastewater treatment and engineering
PorosityV
Vv
T
= (9.1)
where:Vv=volumeofvoidsVT=totalvolume
Porosityisoftenexpressedasapercent.Stonemediacanhaveporosi-tiesrangingfrom40%to50%,whilesyntheticmediacanhaveporos-ities up to 95%. Higher porosity is desired, as that provides morepassageforwastewaterandgases.Figure 9.2illustratestwotypesofmediaandanunderdrainpanelfortricklingfilters.
3.Specific surface area—Thisisdefinedastheamountofsurfaceareaofthemediathatisavailableforgrowthofbiofilm,perunitvolumeofmedia.Stonemediacanhavespecificsurfaceareasrangingfrom45to70m2/m3.Forsyntheticmedia,thisvaluecanrangefrom100to200 m2/m3.
9.4 LOADING RATES
TheorganicloadingorBODloadingiscalculatedusingonlytheBODloadcomingwiththeprimaryeffluent.TheBODloadingintherecycleflowisnotincluded.
BO D loading=Prim aryeffluentBO D
volum eoffilterm edia= Q S
V0 (9.2)
where:Q=wastewaterflowrate,m3/d(mgal/d)So=BODconcentrationofprimaryeffluent,kg/m3(lb/mgal)V=volumeofmedia,m3(1000sofft3)BODloading=kgBOD/m3·d(lbBOD/1000ft3·d)
Theorganic loading for stonemedia tricklingfilterscanvary from0.08to1.8kgBOD/m3·dforlow-tohigh-ratefilters,respectively.Theorganicloading forplasticmediafilters ranges from0.31 toabove1.0kgBOD/m3·d(Davis,2011).
Thehydraulicloadingistheamountofwastewaterappliedtothefiltersurfaceincludingprimaryeffluentandrecycleflows.
H ydraulicloading= +Q Q
Ar
s
(9.3)
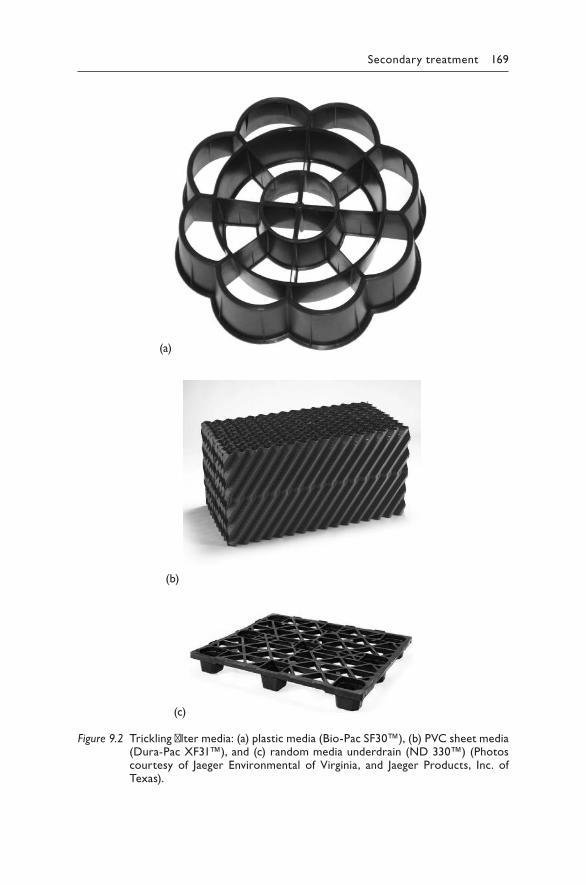
Secondary treatment 169
(a)
(b)
(c)
Figure 9.2 Trickling filter media: (a) plastic media (Bio-Pac SF30™), (b) PVC sheet media (Dura-Pac XF31™), and (c) random media underdrain (ND 330™) (Photos courtesy of Jaeger Environmental of Virginia, and Jaeger Products, Inc. of Texas).
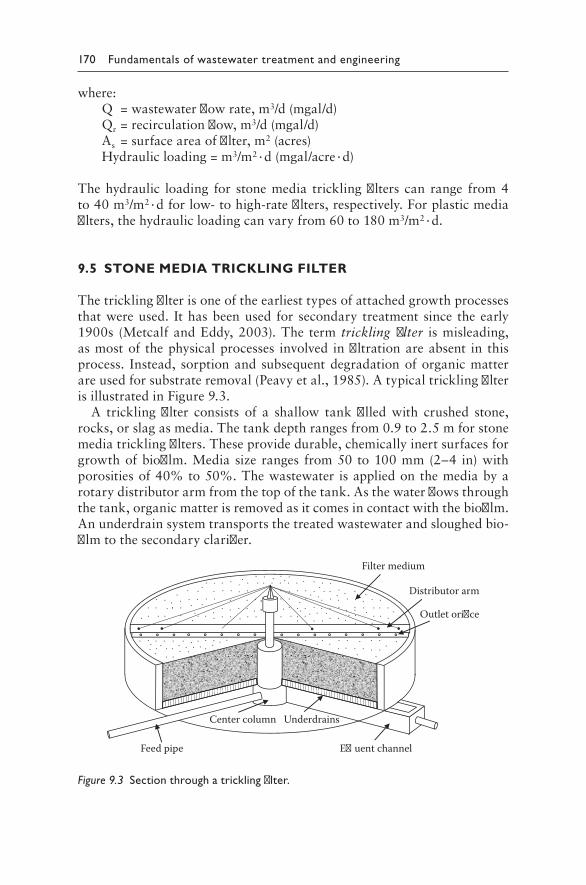
170 Fundamentals of wastewater treatment and engineering
where:Q=wastewaterflowrate,m3/d(mgal/d)Qr=recirculationflow,m3/d(mgal/d)As=surfaceareaoffilter,m2(acres)Hydraulicloading=m3/m2·d(mgal/acre·d)
Thehydraulic loading for stonemedia tricklingfilters can range from4to40m3/m2·dforlow-tohigh-ratefilters,respectively.Forplasticmediafilters,thehydraulicloadingcanvaryfrom60to180m3/m2·d.
9.5 STONE MEDIA TRICKLING FILTER
Thetricklingfilterisoneoftheearliesttypesofattachedgrowthprocessesthatwereused. Ithasbeenused for secondary treatment since theearly1900s (MetcalfandEddy,2003).The term trickling filter ismisleading,asmostof thephysicalprocesses involved infiltrationareabsent in thisprocess. Instead, sorptionandsubsequentdegradationoforganicmatterareusedforsubstrateremoval(Peavyetal.,1985).AtypicaltricklingfilterisillustratedinFigure 9.3.
A trickling filter consists of a shallow tank filled with crushed stone,rocks,orslagasmedia.Thetankdepthrangesfrom0.9to2.5mforstonemediatricklingfilters.Theseprovidedurable,chemicallyinertsurfacesforgrowthofbiofilm.Media size ranges from50 to100mm(2–4 in)withporositiesof40%to50%.Thewastewater isappliedonthemediabyarotarydistributorarmfromthetopofthetank.Asthewaterflowsthroughthetank,organicmatterisremovedasitcomesincontactwiththebiofilm.Anunderdrainsystemtransportsthetreatedwastewaterandsloughedbio-filmtothesecondaryclarifier.
Feed pipe E�uent channel
Center column Underdrains
Distributor arm
Filter medium
Outlet ori�ce
Figure 9.3 Section through a trickling filter.
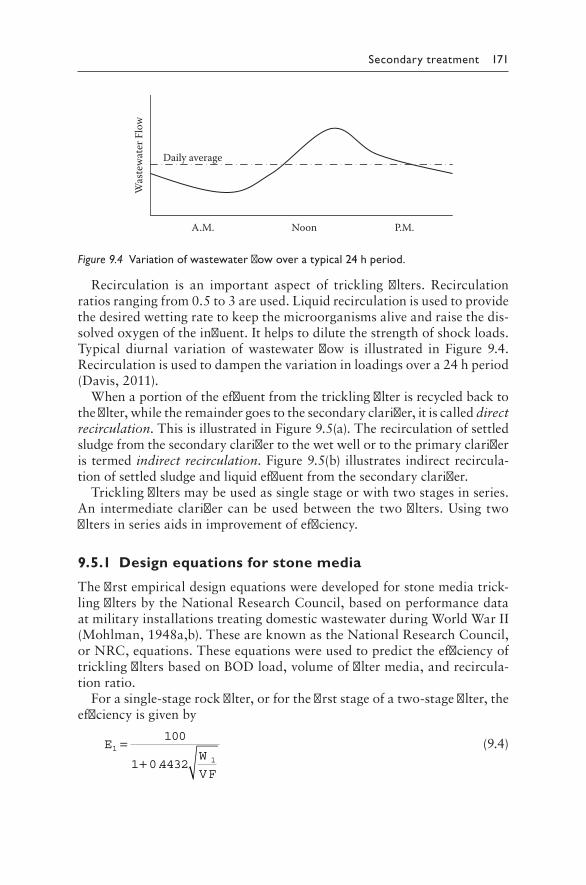
Secondary treatment 171
Recirculation is an important aspect of trickling filters. Recirculationratiosrangingfrom0.5to3areused.Liquidrecirculationisusedtoprovidethedesiredwettingratetokeepthemicroorganismsaliveandraisethedis-solvedoxygenoftheinfluent.Ithelpstodilutethestrengthofshockloads.Typical diurnal variation ofwastewater flow is illustrated in Figure 9.4.Recirculationisusedtodampenthevariationinloadingsovera24hperiod(Davis,2011).
Whenaportionoftheeffluentfromthetricklingfilterisrecycledbacktothefilter,whiletheremaindergoestothesecondaryclarifier,itiscalleddirect recirculation.ThisisillustratedinFigure 9.5(a).Therecirculationofsettledsludgefromthesecondaryclarifiertothewetwellortotheprimaryclarifieris termed indirect recirculation.Figure 9.5(b) illustrates indirectrecircula-tionofsettledsludgeandliquideffluentfromthesecondaryclarifier.
Tricklingfiltersmaybeusedassinglestageorwithtwostagesinseries.An intermediateclarifiercanbeusedbetweenthe twofilters.Usingtwofiltersinseriesaidsinimprovementofefficiency.
9.5.1 Design equations for stone media
Thefirstempiricaldesignequationsweredevelopedforstonemediatrick-lingfiltersbytheNationalResearchCouncil,basedonperformancedataatmilitaryinstallationstreatingdomesticwastewaterduringWorldWarII(Mohlman,1948a,b).TheseareknownastheNationalResearchCouncil,orNRC,equations.TheseequationswereusedtopredicttheefficiencyoftricklingfiltersbasedonBODload,volumeoffiltermedia,andrecircula-tionratio.
Forasingle-stagerockfilter,orforthefirststageofatwo-stagefilter,theefficiencyisgivenby
EW
VF
1
1
100
1 0 4432
=+ .
(9.4)
A.M.
Was
tew
ater
Flo
w
Noon P.M.
Daily average
Figure 9.4 Variation of wastewater flow over a typical 24 h period.
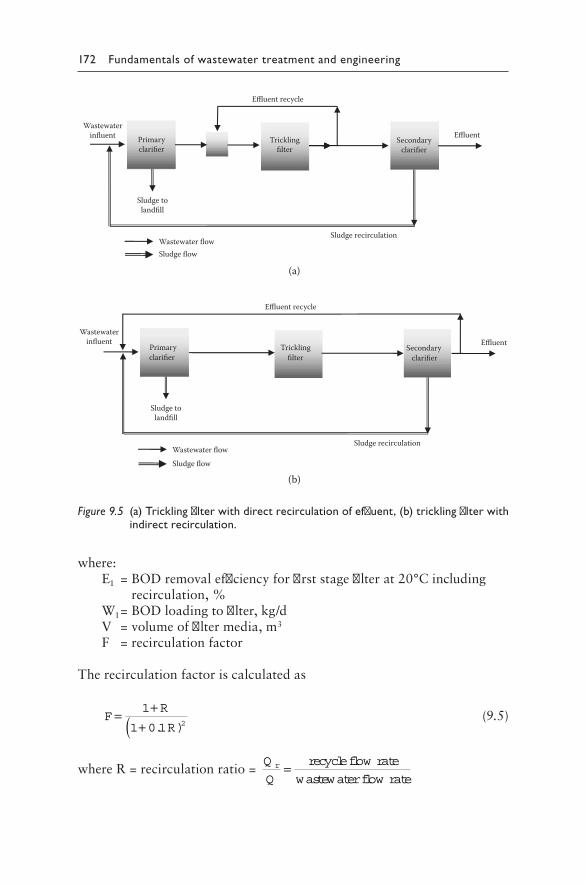
172 Fundamentals of wastewater treatment and engineering
where:E1=BODremovalefficiencyforfirststagefilterat20°Cincluding
recirculation,%W1=BODloadingtofilter,kg/dV=volumeoffiltermedia,m3
F=recirculationfactor
Therecirculationfactoriscalculatedas
FR
R= +
+(1
1 0 1 2. ) (9.5)
whereR=recirculationratio=Q
Qr = recycleflow rate
wastewaterflow rate
(a)
(b)
Primary clarifier
Secondary clarifier
Sludge tolandfill
Sludge recirculationWastewater flow Sludge flow
Wastewaterinfluent
Trickling filter
Effluent
Effluent recycle
Primaryclarifier
Secondaryclarifier
Sludge tolandfill
Sludge recirculationWastewater flowSludge flow
Wastewaterinfluent Trickling
filter
Effluent
Effluent recycle
Figure 9.5 (a) Trickling filter with direct recirculation of effluent, (b) trickling filter with indirect recirculation.
Secondary treatment 173
Foratwo-stagetricklingfilter,theBODremovalefficiencyofthesecondstageisgivenby
E
E
W
VF
2
1
2
100
10 4432
1
=+
−.
(9.6)
where:E2=BODremovalefficiencyforsecondstagefilterat20°Cincluding
recirculation,%W2=BODloadingtosecond-stagefilter,kg/dE1=fractionofBODremovalinfirststagefilter
An intermediateclarifier isassumedtobesituatedbetweenthefirstandsecondstagefilters.TheeffectofwastewatertemperatureonBODremovalefficiencyiscalculatedusingaformofthevan’tHoff–Arrheniusequation:
ET=E20(1.035)T–20 (9.7)
where:T=wastewatertemperature,°CET=BODremovalefficiencyattemperatureT°CE20=BODremovalefficiencyat20°C
WhenusingtheNRCequationsitshouldbenotedthatthemilitaryinstalla-tions,whichwerethebasisfortheNRCstudy,hadhigherinfluentBODcon-centrationsthandomesticwastewatertoday.Theclarifierswereshallowerandcarriedhigherhydraulicloadingthancurrentpracticetoday(Davis,2011).
EXAMPLE9.1A wastewater treatment plant uses a single stage rock-media trick-lingfilterforsecondarytreatment,asillustratedinFigure 9.5(a).Thewastewaterflowrateis2000m3/dwithaBOD5concentrationof400mg/L.Primaryclarificationremoves30%oftheBOD5.Thefilteris12mindiameterand1.5mindepth.Directrecirculationpumpoperatesat2.78m3/mintothefilter.Wastewatertemperatureis20°C.Calculatethehydraulicloadingrate,organicloadingrate,effluentBOD5concen-tration,andoverallplantefficiency.
SOLUTION
Step1.Calculatefilterareaandvolume.
Tricklingfilterarea,As=π π4 4
122 2
D( ) = ( )=113.09m2
Tricklingfiltervolume,V=As×h=113.09m2×1.5m=169.65m3
174 Fundamentals of wastewater treatment and engineering
Step2.Calculatehydraulicloadingrateonfilter.
BOD5intotricklingfilter,So=400(1–0.30)=280mg/l=0.28kg/m3
Recirculationflow,Qr=2.78m3/min=2.78×60×24=4003m3/d
Recirculationratio,R=Q
Qr = 4003
2000=2
Hydraulicloadingrate=Q Q
A
m d
mr
s
+ = +2000 4003
113 09
3
2
/
.
=53.08m3/m2·d
Step3.Calculateorganicloadingrate.
Organic/BODloadingrate=Q S
V0 =
2000 0 28
169 65
33
3
m
dkg m
m
× . /
.
=3.30kg/m3·d
Step4.Calculatethefilterefficiency.
Recirculationfactor, FR
R= +
+(1
1 0 1 2. )=
1 2
1 0 1 22
+
+ ×( ).=2.08
W1/V=3.3kg/m3·d
EW
VF
1
1
100
1 0 4432
100
1 0 44323 30
2 08
=+
=+. .
.
.
=64.17%
PlanteffluentBODconcentration=280mg/L(1–0.6417)
=100.32mg/L
Overallplantefficiency=400 100 32
400100
− ×.% =74.92%
Comment:ThehydraulicandBODloadingratesarehigh.Thesecanbereducedbyaddingmorefiltersinparalleltothefirstone.
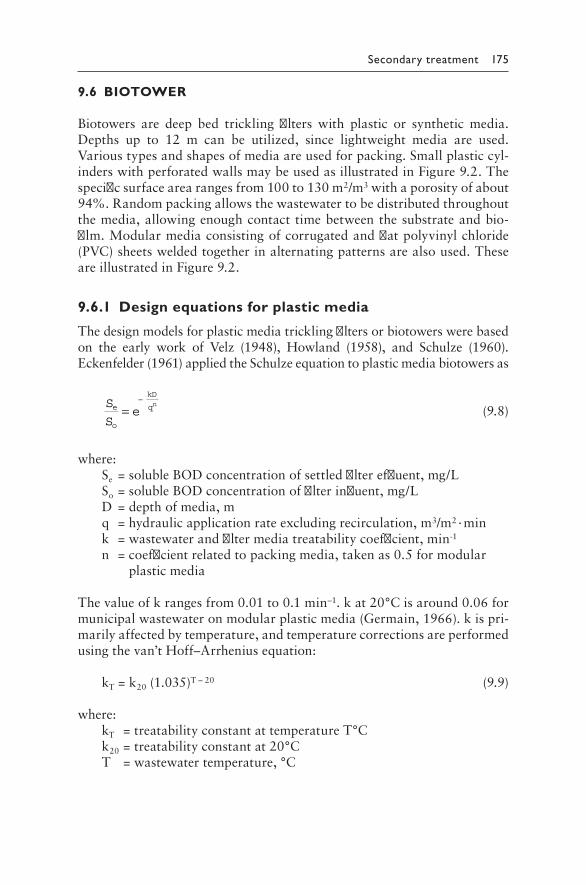
Secondary treatment 175
9.6 BIOTOWER
Biotowers are deep bed trickling filters with plastic or synthetic media.Depths up to 12 m can be utilized, since lightweight media are used.Varioustypesandshapesofmediaareusedforpacking.Smallplasticcyl-inderswithperforatedwallsmaybeusedasillustratedinFigure 9.2.Thespecificsurfacearearangesfrom100to130m2/m3withaporosityofabout94%.Randompackingallowsthewastewatertobedistributedthroughoutthemedia,allowingenoughcontacttimebetweenthesubstrateandbio-film.Modularmediaconsistingofcorrugatedandflatpolyvinylchloride(PVC)sheetsweldedtogetherinalternatingpatternsarealsoused.TheseareillustratedinFigure 9.2.
9.6.1 Design equations for plastic media
Thedesignmodelsforplasticmediatricklingfiltersorbiotowerswerebasedon the early work of Velz (1948), Howland (1958), and Schulze (1960).Eckenfelder(1961)appliedtheSchulzeequationtoplasticmediabiotowersas
S
See
o
kD
qn=−
(9.8)
where:Se=solubleBODconcentrationofsettledfiltereffluent,mg/LSo=solubleBODconcentrationoffilterinfluent,mg/LD=depthofmedia,mq=hydraulicapplicationrateexcludingrecirculation,m3/m2·mink=wastewaterandfiltermediatreatabilitycoefficient,min-1
n=coefficientrelatedtopackingmedia,takenas0.5formodularplasticmedia
Thevalueofkrangesfrom0.01to0.1min–1.kat20°Cisaround0.06formunicipalwastewateronmodularplasticmedia(Germain,1966).kispri-marilyaffectedbytemperature,andtemperaturecorrectionsareperformedusingthevan’tHoff–Arrheniusequation:
kT=k20(1.035)T–20 (9.9)
where:kT=treatabilityconstantattemperatureT°Ck20=treatabilityconstantat20°CT=wastewatertemperature,°C
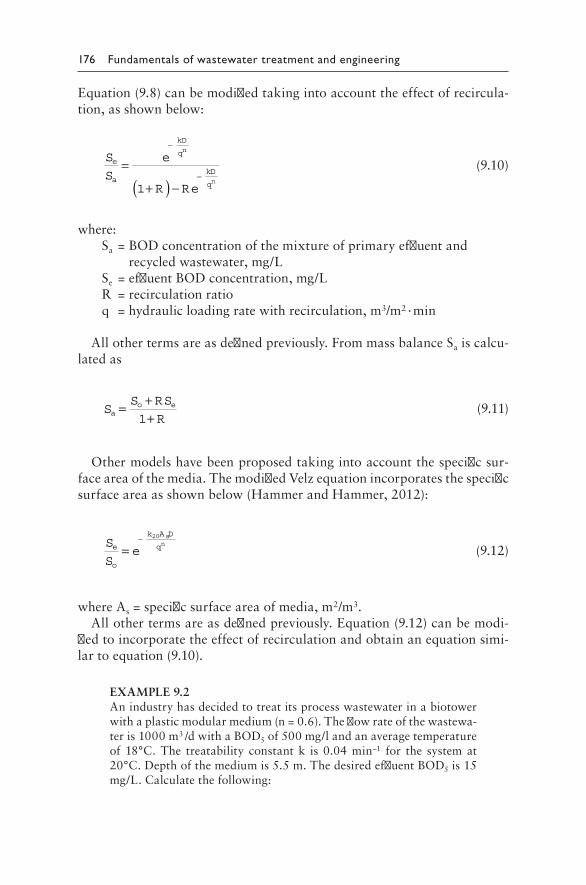
176 Fundamentals of wastewater treatment and engineering
Equation(9.8)canbemodifiedtakingintoaccounttheeffectofrecircula-tion,asshownbelow:
S
S
e
R Re
e
a
kD
q
kD
q
n
n
=
+( ) −
−
−1
(9.10)
where:Sa=BODconcentrationofthemixtureofprimaryeffluentand
recycledwastewater,mg/LSe=effluentBODconcentration,mg/LR=recirculationratioq=hydraulicloadingratewithrecirculation,m3/m2·min
Allothertermsareasdefinedpreviously.FrommassbalanceSaiscalcu-latedas
SS RS
Ra
o e= ++1
(9.11)
Othermodelshavebeenproposedtakingintoaccountthespecificsur-faceareaofthemedia.ThemodifiedVelzequationincorporatesthespecificsurfaceareaasshownbelow(HammerandHammer,2012):
S
See
o
k A D
q
sn
=− 20
(9.12)
whereAs=specificsurfaceareaofmedia,m2/m3.Allothertermsareasdefinedpreviously.Equation(9.12)canbemodi-
fiedtoincorporatetheeffectofrecirculationandobtainanequationsimi-lartoequation(9.10).
EXAMPLE9.2Anindustryhasdecidedtotreatitsprocesswastewaterinabiotowerwithaplasticmodularmedium(n=0.6).Theflowrateofthewastewa-teris1000m3/dwithaBOD5of500mg/landanaveragetemperatureof18°C.The treatability constantk is0.04min–1 for the systemat20°C.Depthofthemediumis5.5m.ThedesiredeffluentBOD5is15mg/L.Calculatethefollowing:
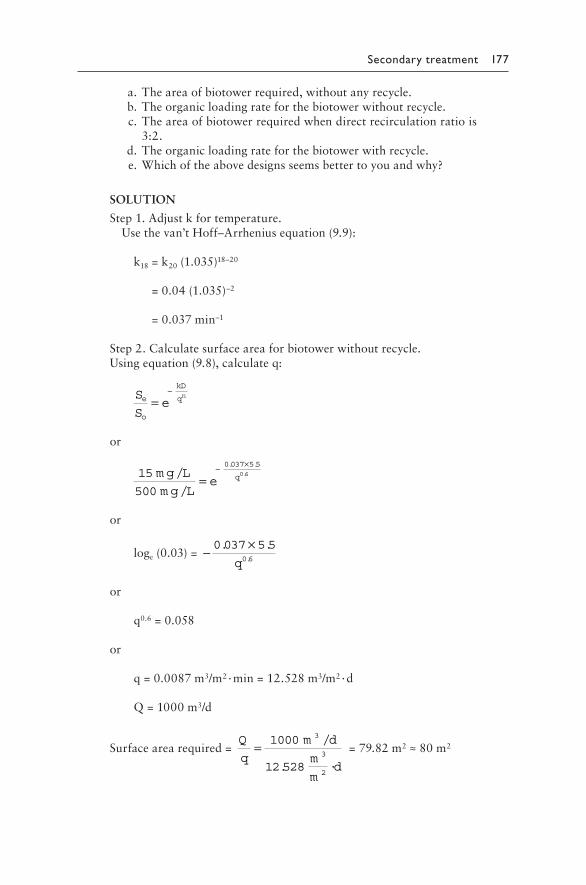
Secondary treatment 177
a.Theareaofbiotowerrequired,withoutanyrecycle. b.Theorganicloadingrateforthebiotowerwithoutrecycle. c.Theareaofbiotowerrequiredwhendirectrecirculationratiois
3:2. d.Theorganicloadingrateforthebiotowerwithrecycle. e.Whichoftheabovedesignsseemsbettertoyouandwhy?
SOLUTION
Step1.Adjustkfortemperature.Usethevan’tHoff–Arrheniusequation(9.9):
k18=k20(1.035)18–20
=0.04(1.035)–2
=0.037min–1
Step2.Calculatesurfaceareaforbiotowerwithoutrecycle.Usingequation(9.8),calculateq:
S
See
o
kD
qn=−
or
15
500
0037 5 506m g L
m g Le q/
/
. ..
=− ×
or
loge(0.03)= − ×0 037 5 506
. ..q
or
q0.6=0.058
or
q=0.0087m3/m2·min=12.528m3/m2·d
Q=1000m3/d
Surfacearearequired=Q
q
m d
m
md
= 1000
12 528
3
3
2
/
. ·
=79.82m2≈80m2
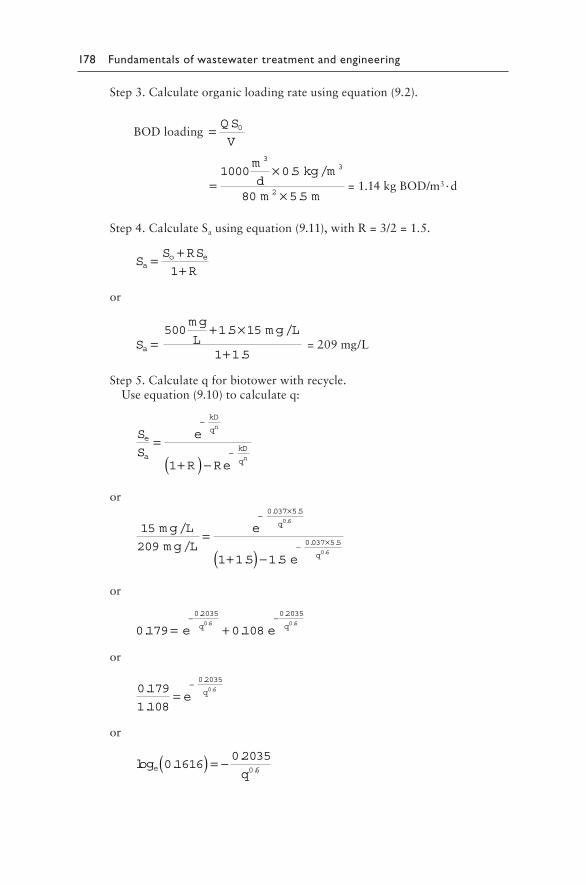
178 Fundamentals of wastewater treatment and engineering
Step3.Calculateorganicloadingrateusingequation(9.2).
BODloading = Q S
V0
=×
×
1000 0 5
80 5 5
33
2
m
dkg m
m m
. /
.=1.14kgBOD/m3·d
Step4.CalculateSausingequation(9.11),withR=3/2=1.5.
SS RS
Ra
o e= ++1
or
S
m g
Lm g L
a =+ ×
+
. /
.
500 1 5 15
1 1 5=209mg/L
Step5.Calculateqforbiotowerwithrecycle.Useequation(9.10)tocalculateq:
S
S
e
R Re
e
a
kD
q
kD
q
n
n
=
+( ) −
−
−1
or
15
2091 1 5 1 5
0037 5 506
/
/. .
. ..
m g L
m g L
e q
=
+( ) −
− ×
. ..
e q− ×0 037 5 5
06
or
0 179 0 108
02035 0 203506 0 6
. .
. .. .
= +− −e eq q
or
0 179
1 108
0203506.
.
..
=−e q
or
log ..
.eq
0 16160 2035
06( ) = −
Secondary treatment 179
or
q0.6=0.1116
or
q=0.026m3/m2·min=37.27m3/m2·d
Step6.Calculatesurfaceareaofbiotowerwithrecycle.
Surfacearearequired=Q R
q
m d
m
md
( ) ( .) /
. ·
1 1000 1 1 5
37 27
3
3
2
+ = +=67m2
Step7.Calculateorganicloadingrateforbiotowerwithrecycle,usingequation(9.2).
BODloading = Q S
V0
=×
×
1000 0 5
67 5 5
33
2
m
dkg m
m m
. /
.=1.36kgBOD/m3·d
Note:Thebiotowerwithrecycleseemstobethebetterdesign.Asmallersurfaceareaisrequired,andatthesametimeitcanhandlehigherBODloadingdue to recirculation.Construction costwouldbe lower, butadditionalpumpingcostforrecirculationwillhavetobeconsidered.
9.7 ROTATING BIOLOGICAL CONTACTOR
Therotatingbiologicalcontactor,orRBC,wasfirstinstalledinGermanyin1960andlaterintroducedintheUnitedStates(MetcalfandEddy,2003).RBCisatypeofattachedgrowthprocesswherethemediumisinmotionaswellasthewastewater.Aseriesofcloselyspacedcirculardisksofpoly-styreneorpolyvinylchloridearemountedonahorizontalshaft,whichisrotatedinatankthroughwhichthewastewaterisflowing(Figure 9.6).Themediaispartiallysubmergedinthewastewater.Itcomesincontactwithairandwastewaterinanalternatingfashion,thusmaintainingaerobiccondi-tions,astheshaftwiththedisksrotatesinthetank.Rotationalspeedvariesfrom1to2rpm.Itmustbesufficienttoprovidethehydraulicshearneces-saryforsloughingofbiofilmandtomaintainenoughturbulencetokeepthesolidsinsuspensioninthewastewater(Peavyetal.,1985).Themediadiskshaveadiameterrangingfrom2to4m,andthicknessofabout10mm.Spacingbetweenthedisksisabout30to40mm.Eachshaftwiththemedium,alongwithitstankandrotatingdevice,iscalledamodule.Several
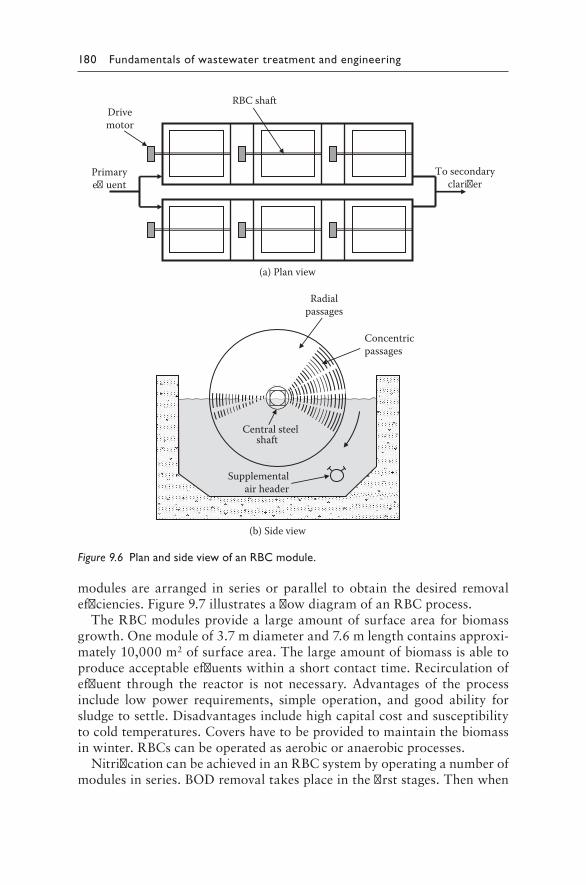
180 Fundamentals of wastewater treatment and engineering
modulesarearranged in seriesorparallel toobtain thedesired removalefficiencies.Figure 9.7illustratesaflowdiagramofanRBCprocess.
TheRBCmodulesprovidealargeamountofsurfaceareaforbiomassgrowth.Onemoduleof3.7mdiameterand7.6mlengthcontainsapproxi-mately10,000m2ofsurfacearea.Thelargeamountofbiomassisabletoproduceacceptableeffluentswithinashortcontacttime.Recirculationofeffluent through the reactor is not necessary. Advantages of the processinclude low power requirements, simple operation, and good ability forsludgetosettle.Disadvantagesincludehighcapitalcostandsusceptibilitytocoldtemperatures.Covershavetobeprovidedtomaintainthebiomassinwinter.RBCscanbeoperatedasaerobicoranaerobicprocesses.
NitrificationcanbeachievedinanRBCsystembyoperatinganumberofmodulesinseries.BODremovaltakesplaceinthefirststages.Thenwhen
(a) Plan view
(b) Side view
Primarye�uent
To secondaryclari�er
Drivemotor
RBC shaft
Radialpassages
Concentricpassages
Supplementalair header
Central steel shaft
Figure 9.6 Plan and side view of an RBC module.
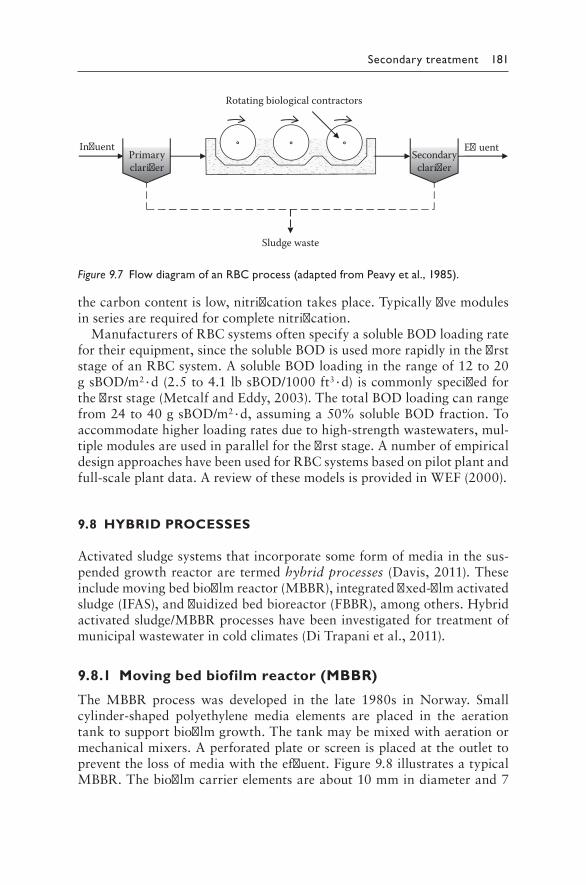
Secondary treatment 181
thecarboncontentislow,nitrificationtakesplace.Typicallyfivemodulesinseriesarerequiredforcompletenitrification.
ManufacturersofRBCsystemsoftenspecifyasolubleBODloadingratefortheirequipment,sincethesolubleBODisusedmorerapidlyinthefirststageofanRBCsystem.AsolubleBODloadingintherangeof12to20gsBOD/m2·d(2.5to4.1lbsBOD/1000ft3·d)iscommonlyspecifiedforthefirststage(MetcalfandEddy,2003).ThetotalBODloadingcanrangefrom24to40gsBOD/m2·d,assuminga50%solubleBODfraction.Toaccommodatehigherloadingratesduetohigh-strengthwastewaters,mul-tiplemodulesareusedinparallelforthefirststage.AnumberofempiricaldesignapproacheshavebeenusedforRBCsystemsbasedonpilotplantandfull-scaleplantdata.AreviewofthesemodelsisprovidedinWEF(2000).
9.8 HYBRID PROCESSES
Activatedsludgesystemsthatincorporatesomeformofmediainthesus-pendedgrowthreactoraretermedhybrid processes(Davis,2011).Theseincludemovingbedbiofilmreactor(MBBR),integratedfixed-filmactivatedsludge(IFAS),andfluidizedbedbioreactor(FBBR),amongothers.Hybridactivatedsludge/MBBRprocesseshavebeeninvestigatedfortreatmentofmunicipalwastewaterincoldclimates(DiTrapanietal.,2011).
9.8.1 Moving bed biofilm reactor (MBBR)
The MBBR process was developed in the late 1980s in Norway. Smallcylinder-shaped polyethylene media elements are placed in the aerationtanktosupportbiofilmgrowth.Thetankmaybemixedwithaerationormechanicalmixers.Aperforatedplateorscreenisplacedattheoutlettopreventthelossofmediawiththeeffluent.Figure 9.8illustratesatypicalMBBR.Thebiofilmcarrierelementsareabout10mmindiameterand7
In�uent E�uent
Sludge waste
Primaryclarier
Secondaryclarier
Rotating biological contractors
Figure 9.7 Flow diagram of an RBC process (adapted from Peavy et al., 1985).
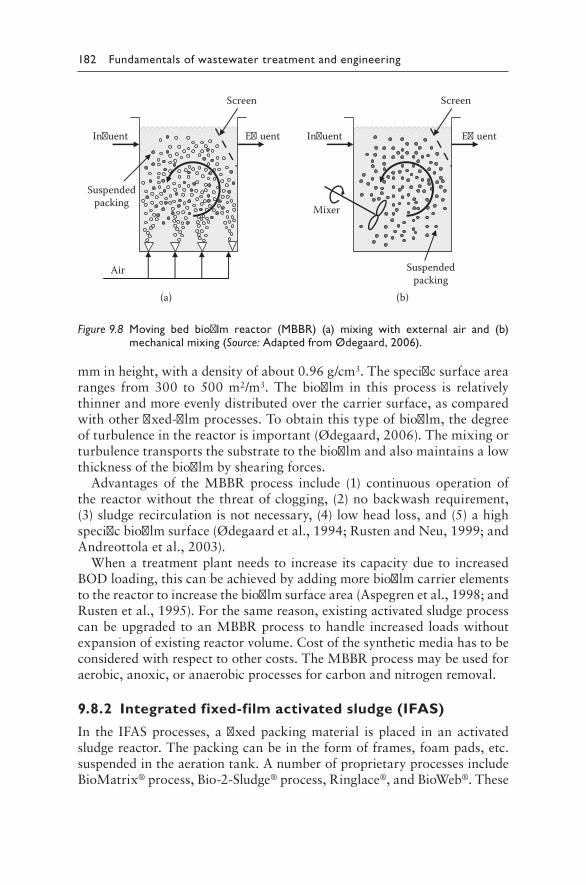
182 Fundamentals of wastewater treatment and engineering
mminheight,withadensityofabout0.96g/cm3.Thespecificsurfacearearanges from 300 to 500 m2/m3. The biofilm in this process is relativelythinnerandmoreevenlydistributedoverthecarriersurface,ascomparedwithotherfixed-filmprocesses.Toobtainthistypeofbiofilm,thedegreeofturbulenceinthereactorisimportant(Ødegaard,2006).Themixingorturbulencetransportsthesubstratetothebiofilmandalsomaintainsalowthicknessofthebiofilmbyshearingforces.
Advantages of the MBBR process include (1) continuous operation ofthereactorwithoutthethreatofclogging,(2)nobackwashrequirement,(3)sludgerecirculationisnotnecessary,(4)lowheadloss,and(5)ahighspecificbiofilmsurface(Ødegaardetal.,1994;RustenandNeu,1999;andAndreottolaetal.,2003).
Whenatreatmentplantneedsto increase itscapacitydueto increasedBODloading,thiscanbeachievedbyaddingmorebiofilmcarrierelementstothereactortoincreasethebiofilmsurfacearea(Aspegrenetal.,1998;andRustenetal.,1995).Forthesamereason,existingactivatedsludgeprocesscanbeupgraded toanMBBRprocess tohandle increased loadswithoutexpansionofexistingreactorvolume.Costofthesyntheticmediahastobeconsideredwithrespecttoothercosts.TheMBBRprocessmaybeusedforaerobic,anoxic,oranaerobicprocessesforcarbonandnitrogenremoval.
9.8.2 Integrated fixed-film activated sludge (IFAS)
In the IFASprocesses, afixedpackingmaterial is placed in an activatedsludgereactor.Thepackingcanbeintheformofframes,foampads,etc.suspendedintheaerationtank.AnumberofproprietaryprocessesincludeBioMatrix®process,Bio-2-Sludge®process,Ringlace®,andBioWeb®.These
(a) (b)
Air
Mixer
In�uent E�uent In�uent E�uent
Screen Screen
Suspendedpacking
Suspendedpacking
Figure 9.8 Moving bed biofilm reactor (MBBR) (a) mixing with external air and (b) mechanical mixing (Source: Adapted from Ødegaard, 2006).
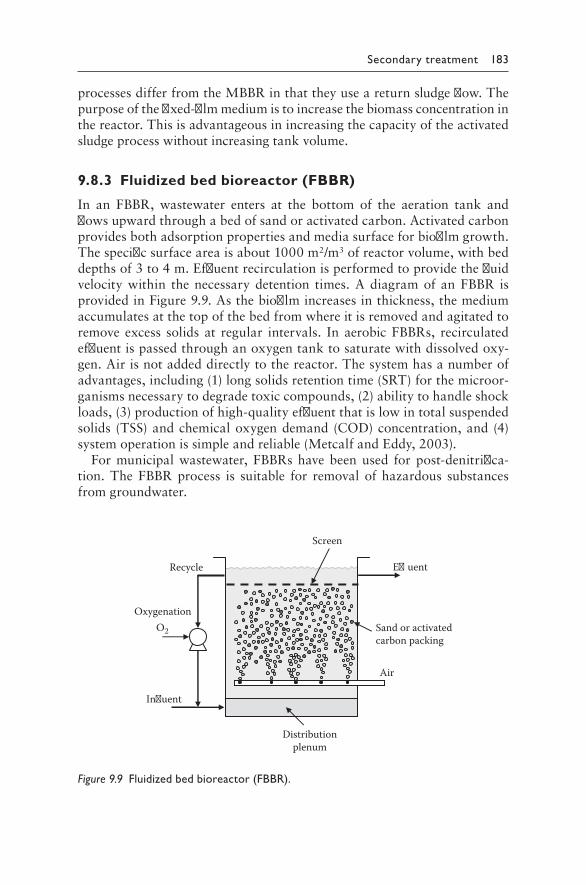
Secondary treatment 183
processesdifferfromtheMBBRinthattheyuseareturnsludgeflow.Thepurposeofthefixed-filmmediumistoincreasethebiomassconcentrationinthereactor.Thisisadvantageousinincreasingthecapacityoftheactivatedsludgeprocesswithoutincreasingtankvolume.
9.8.3 Fluidized bed bioreactor (FBBR)
In an FBBR, wastewater enters at the bottom of the aeration tank andflowsupwardthroughabedofsandoractivatedcarbon.Activatedcarbonprovidesbothadsorptionpropertiesandmediasurfaceforbiofilmgrowth.Thespecificsurfaceareaisabout1000m2/m3ofreactorvolume,withbeddepthsof3to4m.Effluentrecirculationisperformedtoprovidethefluidvelocitywithin thenecessarydetention times.AdiagramofanFBBR isprovidedinFigure 9.9.Asthebiofilmincreasesinthickness,themediumaccumulatesatthetopofthebedfromwhereitisremovedandagitatedtoremove excess solids at regular intervals. In aerobicFBBRs, recirculatedeffluentispassedthroughanoxygentanktosaturatewithdissolvedoxy-gen.Airisnotaddeddirectlytothereactor.Thesystemhasanumberofadvantages,including(1)longsolidsretentiontime(SRT)forthemicroor-ganismsnecessarytodegradetoxiccompounds,(2)abilitytohandleshockloads,(3)productionofhigh-qualityeffluentthatislowintotalsuspendedsolids (TSS)andchemicaloxygendemand(COD)concentration,and(4)systemoperationissimpleandreliable(MetcalfandEddy,2003).
Formunicipalwastewater,FBBRshavebeenused forpost-denitrifica-tion.TheFBBRprocess is suitable for removal of hazardous substancesfromgroundwater.
In�uent
E�uent
Screen
Air
O2
Oxygenation
Recycle
Distributionplenum
Sand or activatedcarbon packing
Figure 9.9 Fluidized bed bioreactor (FBBR).
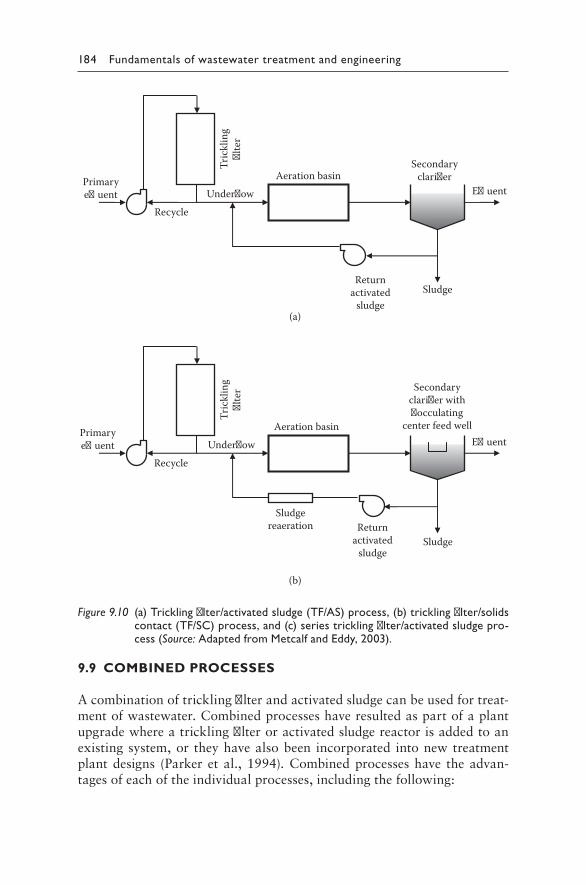
184 Fundamentals of wastewater treatment and engineering
9.9 COMBINED PROCESSES
Acombinationoftricklingfilterandactivatedsludgecanbeusedfortreat-mentofwastewater.Combinedprocesseshaveresultedaspartofaplantupgradewhereatricklingfilteroractivatedsludgereactorisaddedtoanexistingsystem,or theyhavealsobeen incorporated intonewtreatmentplantdesigns (Parker et al.,1994).Combinedprocesseshave theadvan-tagesofeachoftheindividualprocesses,includingthefollowing:
(a)
(b)
Primarye�uent E�uent
Aeration basin
Returnactivated
sludgeSludge
Tric
klin
g�l
ter
Under�owRecycle
Secondaryclari�er with�occulating
center feed well
Sludgereaeration
Primarye�uent E�uent
Aeration basin
Returnactivated
sludgeSludge
Tric
klin
g�l
ter
Under�owRecycle
Secondaryclari�er
Figure 9.10 (a) Trickling filter/activated sludge (TF/AS) process, (b) trickling filter/solids contact (TF/SC) process, and (c) series trickling filter/activated sludge pro-cess (Source: Adapted from Metcalf and Eddy, 2003).
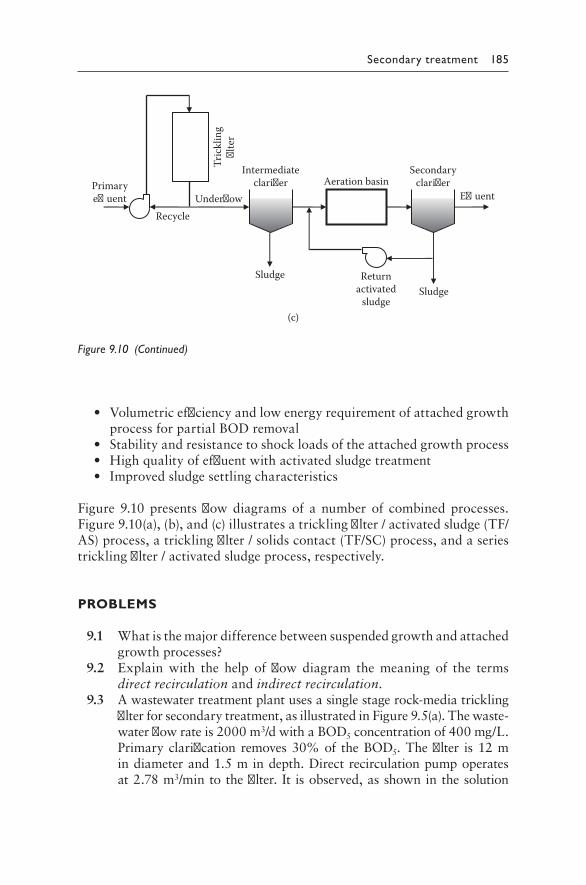
Secondary treatment 185
• VolumetricefficiencyandlowenergyrequirementofattachedgrowthprocessforpartialBODremoval
• Stabilityandresistancetoshockloadsoftheattachedgrowthprocess• Highqualityofeffluentwithactivatedsludgetreatment• Improvedsludgesettlingcharacteristics
Figure 9.10presents flowdiagrams of a number of combinedprocesses.Figure 9.10(a),(b),and(c)illustratesatricklingfilter/activatedsludge(TF/AS)process,atricklingfilter/solidscontact(TF/SC)process,andaseriestricklingfilter/activatedsludgeprocess,respectively.
PROBLEMS
9.1 Whatisthemajordifferencebetweensuspendedgrowthandattachedgrowthprocesses?
9.2 Explain with the help of flow diagram the meaning of the termsdirect recirculationandindirect recirculation.
9.3 Awastewatertreatmentplantusesasinglestagerock-mediatricklingfilterforsecondarytreatment,asillustratedinFigure 9.5(a).Thewaste-waterflowrateis2000m3/dwithaBOD5concentrationof400mg/L.Primaryclarification removes30%of theBOD5.Thefilter is12mindiameterand1.5mindepth.Directrecirculationpumpoperatesat2.78m3/mintothefilter. It isobserved,asshowninthesolution
(c)
Primarye�uent E�uent
Aeration basin
Returnactivated
sludgeSludge
Tric
klin
g�l
ter
Under�owRecycle
Secondaryclari�er
Intermediateclari�er
Sludge
Figure 9.10 (Continued)
186 Fundamentals of wastewater treatment and engineering
toExample9.1, that theuseofa singlefilterproducesaplant effi-ciencyofabout75%,withveryhighhydraulicandBODloadingrates.Toreducetheloadingratesandincreaseplantefficiency,theengineerdecidestoaddanidenticalfilterinparalleltothefirstone.Thedirectrecirculation ratio is maintained at 2.0. Wastewater temperature is20°C.Calculatethenewhydraulicloadingrate,organicloadingrate,effluentBOD5concentration,andoverallplantefficiency.Isthenewdesignbetterthantheoldone?
9.4 Consider the single stage trickling filter plant from the solutionin Example 9.1. The use of a single stage filter produced a plantefficiencyofabout75%.Toincreaseplantefficiency, theengineerdecides toaddan identical secondstagefilter inseries to thefirstone.Thewastewaterflowrateis2000m3/dwithaBOD5concentra-tionof400mg/L.Primaryclarificationremoves30%oftheBOD5.Thefiltersareeach12mindiameterand1.5mindepth.Thedirectrecirculationratioforeachstageis2.0.Wastewatertemperatureis20°C. Calculate the second stage hydraulic loading rate, organicloading rates, effluentBOD5concentration,andoverallplant effi-ciency.Commenton the advantages/disadvantages of using singlestageversustwostagetricklingfilters.
9.5 Reworkproblem9.3forawastewatertemperatureof15°C. 9.6 Reworkproblem9.4forwastewatertemperaturesof15°Cand22°C. 9.7 Aplasticmediabiotowerhasverticalflowpackingwithn=0.5and
k20of0.045min–1.Thetoweriscylindricalwithadiameterof10m.Depthofpackingmediumis6m.Primaryeffluentflowrateis2500m3/d with a soluble BOD5 of 250 mg/L. The average wastewatertemperature is16°C.Direct recirculation ispracticedat1:1 ratio.Calculatethefollowing:
a. Organicloadingrateofthebiotower b. Hydraulicloadingrateofthebiotower c. Recirculationratio d. EffluentsolubleBOD5concentration 9.8 Anindustryhasdecidedtotreatitsprocesswastewaterinabiotower
with a plastic modular medium (n = 0.55). The flow rate of thewastewateris1400m3/dwithaBOD5of630mg/l.Averagesum-merandwintertemperaturesare22°Cand15°C,respectively.Thetreatabilityconstantis0.04min–1forthesystemat20°C.Depthofthemediumis4m.CalculatetheareaofthebiotowerrequiredtoproduceaneffluentwithaBOD5of20mg/l,witharecycleratioof2:1.
9.9 Rework problem 9.8 using a winter recirculation ratio of 3:1.Summerrecirculationratioremainsthesameat2:1.Commentontheprosandconsofusingahigherrecirculationratio.
9.10 Whatisahybridprocess?Giveanexample.
Secondary treatment 187
REFERENCES
Andrettola, G., Foladori, P., Gatti, G., Nardelli, P., Pettena, M., and Ragazzi, M.(2003)“UpgradingofaSmallOverloadActivatedSludgePlantUsingaMBBRSystem.”Journal of Environmental Science and Health,vol.A38,no.10,pp.2317–2338.
Aspegren,H.,Nyberg,U.,Andersson,B.,Gotthardsson, S., and Jansen, J. (1998)“PostDenitrificationinaMovingBedBiofilmReactorProcess.”Water Science and Technology,vol.38,no.1,pp.31–38.
Davis,M.(2011)Water and Wastewater Engineering: Design Principles and Practice.McGraw-Hill,Inc.,NewYork.
DiTrapani,D.,Christensso,M.,andØdegaard,H.(2011)“HybridActivatedSludge/BiofilmProcessfortheTreatmentofMunicipalWastewaterinaColdClimateRegion: A Case Study.” Water Science and Technology, vol. 63, no. 6, pp.1121–1129.
Eckenfelder,W.W. Jr. (1961)“Trickling Filter Design and Performance.” Journal Sanitary Engineering Division,vol.87(SA6),p.87.
Germain,J.E.(1966)“EconomicalTreatmentofDomesticWastebyPlastic-MediaTricklingFilters.”Journal Water Pollution Control Federation,vol.38,no.2,p.192.
Hammer,M.J.,andHammer,M.J.Jr.(2012)Water and Wastewater Technology.Seventhedition.Pearson-PrenticeHall,Inc.,UpperSaddleRiver,NewJersey.
Howland,W.E.(1958)“FlowoverPorousMediainaTricklingFilter.”Proceedings of the 12th Industrial Waste Conference,PurdueUniversity,Lafayette,Indiana,p.435.
Metcalf and Eddy, Inc. (2003) Wastewater Engineering: Treatment and Reuse.Fourthedition.McGraw-Hill,Inc.,NewYork.
Mohlman,F.W. (1948a)“SewageTreatmentatMilitary Installations–SummaryandConclusions.”Sewage Works Journal,vol.20,p.52–95.
Mohlman,F.W. (1948b)“High-RateFilterPerformance.”Sewage Works Journal,vol.20,p.618–622.
Ødegaard, H. (2006) “Innovations in Wastewater Treatment: The Moving BedBiofilmProcess.”Water Science and Technology,vol.53,no.9,pp.17–33.
Ødegaard, H., Ruaten, B., andWestrum,T. (1994)“A New Moving Bed BiofilmReactor:Applications and Results.” Water Science Technology, vol. 29, no.10–11,pp.157–165.
Parker,D.S.,Krugel,S.,andMcConnell,H.(1994)“CriticalProcessDesignIssuesintheSelectionoftheTF/SCProcessforaLargeSecondaryTreatmentPlant.”Water, Science and Technology,vol.29,p.209.
Peavy,H.S.,Rowe,D.R.,andTchobanoglous,G.(1985)Environmental Engineering.McGraw-Hill,Inc.,NewYork.
Rusten,B.,andNeu,K.E.(1999)“DowntoSize.”Water Environment & Technology,vol.11,no.1,pp.27–34.
Rusten, B., Hem, L. J. and Ødegaard, H. (1995) “Nitrification of MunicipalWastewaterinMoving-BedBiofilmReactors.”Water Environment Research,vol.67,no.1,pp.75–86.
Schulze, K. L. (1960) “Load and Efficiency in Trickling Filters.” Journal Water Pollution Control Federation, vol.33,no.3,pp.245–260.
188 Fundamentals of wastewater treatment and engineering
Velz,C.J.(1948)“ABasicLawforthePerformanceofBiologicalFitters.”Sewage Works Journal,vol.20,no.4.
WEF (2000) Aerobic Fixed Growth Reactors: A Special Publication. WaterEnvironmentFederation,Alexandria,Virginia.
189
Chapter 10
Secondary Clarification
10.1 INTRODUCTION
Thetermsecondary clarificationdenotesclarificationofeffluentfromsec-ondarybiologicalreactorsinsettlingtanks.Secondaryclarifiersareplacedafterthebiologicalreactors,andconstitutesecondarytreatmenttogetherwiththebiologicalunit.Theassumptionisthatallbiochemicalreactionstakeplaceinthebioreactor,andthefunctionoftheclarifierisseparationofsolidsfromtheliquidfractionandthickeningofsettledsolidsinmostcases.
Thedesignofsecondaryclarifiersfollowingsuspendedgrowthprocessesis slightly different from clarifiers following attached growth processes.Thecharacteristicsofthebiologicalsolidsinthesetwotypesofprocessesare significantly different, so the design and operation of the secondaryclarifiersforthesesystemsarealsodifferent(Peavyetal.,1985).
AccordingtotheUrbanWastewaterTreatmentDirective(91/271/EEC)oftheEuropeanUnion(EU),thelimitsforsecondarytreatmentBOD5(bio-chemicaloxygendemand)andtotalsuspendedsolids(TSS)are25mg/Land35mg/L, respectively.TheU.S.EnvironmentalProtectionAgency (EPA)specifiesaneffluentBOD5lessthanorequalto30mg/Landaneffluentsuspendedsolidsconcentrationlessthanorequalto30mg/Lforsecondarytreatment.Multipleunitscapableofindependentoperationarerequiredforallplantswheredesignaverageflowsexceed380m3/d(GLUMRB,2004).Thehydraulicloadingisusuallybasedonpeakflowrates.
10.2 SECONDARY CLARIFIER FOR ATTACHED GROWTH PROCESS
Theprimaryobjectiveof secondary clarifiers followingattachedgrowthprocesses is to achieve clarification of treated wastewater. Sludge thick-ening is not considered in the design. The goal is to settle the sloughedbiofilmorhumus,whichexhibitsType IIorType I settling.Asaresult,this type of secondary clarifier is designed similar to primary clarifiers.
190 Fundamentals of wastewater treatment and engineering
Sidewaterdepthsrangefrom2to5m,withcorrespondingmaximumover-flowratesof18to65m3/m2·d(Davis,2011).GLUMRB(2004)specifiesapeakhourlyoverflowrateof2.0m/h.
High-ratetricklingfiltersandbiotowersareusuallydesignedwithahighdegree of liquid recirculation,which can range from100% to300%. Ifindirectrecirculationisused,thentheclarifiersizeisincreasedsignificantly.Direct recirculationmaybeanoption tohandlehighrecirculationrates,togetherwiththeuseofmodularsyntheticmedia.Thereisnosludgerecyclefromtheclarifiertothebioreactor.Sludgemaybepumpedtotheprimaryclarifiertobesettledwiththerawwastewatersolids,thenundergofurtherprocessingpriortodisposal.Figure 10.1illustratesasecondaryclarifierforabiotowersystemwith(a)directrecirculationand(b)indirectrecirculation.
EXAMPLE10.1Design secondary clarifiers for a wastewater treatment plant usingbiotowers for treatmentof amunicipalwastewater.Thewastewaterflowrateis1500m3/dwithaBOD5of180mg/Landsuspendedsolidsof200mg/L.Thebiotowerusesindirectrecirculationandoperatesatarecycleratioof2:1.Adesignsidewaterdepthof3misselectedwithamaximumoverflowrateof1.6m3/m2·h.
SOLUTION
Design2circularsecondaryclarifiersfortheplant.
Totalwastewaterflowwithrecycle,QT=1500m3/d×(2+1)=4500m3/d
Useapeakingfactorof2.0.
Totaldesignflow,Q=4500m3/d×2.0=9000m3/d
Flowineachclarifier=90002
=4500m3/d=187.50m3/h
Surfacearea,As=187 501 6
3
3 2
. /
. / ·
m h
m m h=117.19m2
Diameterofeachclarifier,D= 4 117 19 2× . m
π=12.21m=roundoffto12.5m
Note:Weshouldnotroundoffto12m,asthatwillreducethesurfaceareaand increase theoverflow ratebeyond themaximumvalue. Soroundofftothenext0.5mincrement.Therefore,twocircularclari-fierswillbeusedwith12.5mdiameter.
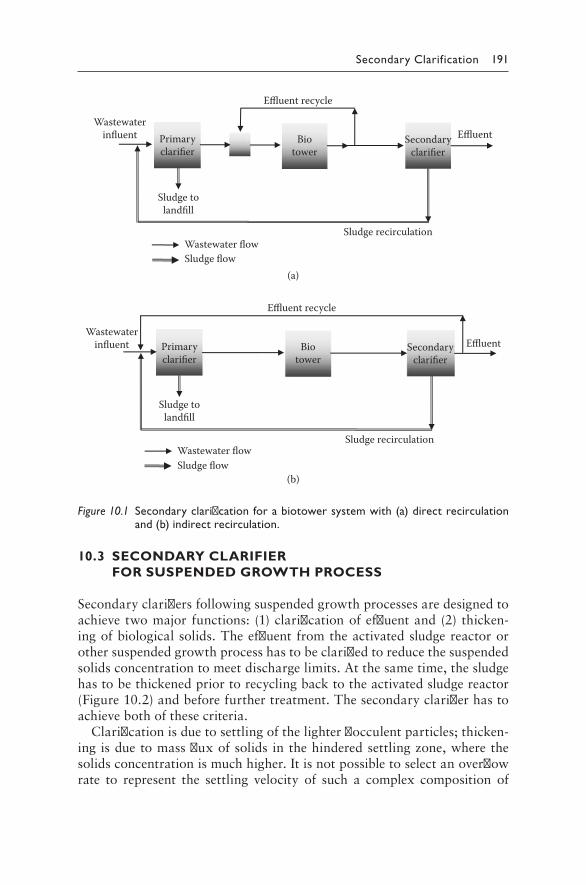
Secondary Clarification 191
10.3 SECONDARY CLARIFIER FOR SUSPENDED GROWTH PROCESS
Secondaryclarifiersfollowingsuspendedgrowthprocessesaredesignedtoachieve twomajor functions: (1)clarificationofeffluentand(2) thicken-ingofbiologicalsolids.Theeffluentfromtheactivatedsludgereactororothersuspendedgrowthprocesshastobeclarifiedtoreducethesuspendedsolidsconcentrationtomeetdischargelimits.Atthesametime,thesludgehastobethickenedpriortorecyclingbacktotheactivatedsludgereactor(Figure 10.2)andbeforefurthertreatment.Thesecondaryclarifierhastoachievebothofthesecriteria.
Clarificationisduetosettlingofthelighterflocculentparticles;thicken-ingisduetomassfluxofsolids inthehinderedsettlingzone,wherethesolidsconcentrationismuchhigher.Itisnotpossibletoselectanoverflowrate to represent the settling velocity of such a complex composition of
(a)
(b)
Primaryclarifier
Secondaryclarifier
Sludge tolandfill
Sludge recirculationWastewater flow Sludge flow
Wastewaterinfluent Bio
towerEffluent
Effluent recycle
Primaryclarifier
Secondaryclarifier
Sludge tolandfill
Sludge recirculationWastewater flow Sludge flow
Wastewaterinfluent Bio
towerEffluent
Effluent recycle
Figure 10.1 Secondary clarification for a biotower system with (a) direct recirculation and (b) indirect recirculation.
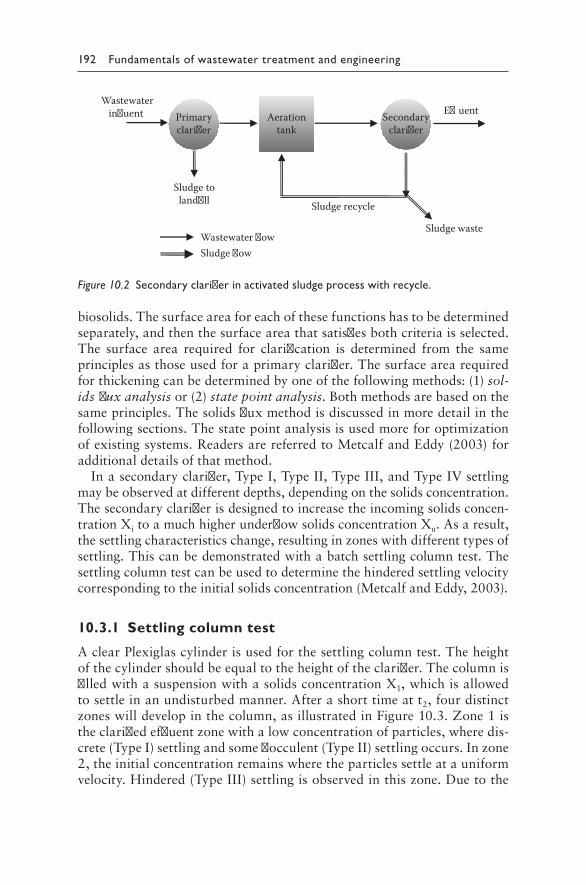
192 Fundamentals of wastewater treatment and engineering
biosolids.Thesurfaceareaforeachofthesefunctionshastobedeterminedseparately,andthenthesurfaceareathatsatisfiesbothcriteriaisselected.The surface area required for clarification is determined from the sameprinciplesasthoseusedforaprimaryclarifier.Thesurfacearearequiredforthickeningcanbedeterminedbyoneofthefollowingmethods:(1)sol-ids flux analysisor(2)state point analysis.Bothmethodsarebasedonthesameprinciples.Thesolidsfluxmethodisdiscussedinmoredetailinthefollowingsections.Thestatepointanalysisisusedmoreforoptimizationofexistingsystems.ReadersarereferredtoMetcalfandEddy(2003)foradditionaldetailsofthatmethod.
Inasecondaryclarifier,TypeI,TypeII,TypeIII,andTypeIVsettlingmaybeobservedatdifferentdepths,dependingonthesolidsconcentration.Thesecondaryclarifierisdesignedtoincreasetheincomingsolidsconcen-trationXitoamuchhigherunderflowsolidsconcentrationXu.Asaresult,thesettlingcharacteristicschange,resultinginzoneswithdifferenttypesofsettling.Thiscanbedemonstratedwithabatchsettlingcolumntest.Thesettlingcolumntestcanbeusedtodeterminethehinderedsettlingvelocitycorrespondingtotheinitialsolidsconcentration(MetcalfandEddy,2003).
10.3.1 Settling column test
AclearPlexiglascylinderisusedforthesettlingcolumntest.Theheightofthecylindershouldbeequaltotheheightoftheclarifier.ThecolumnisfilledwithasuspensionwithasolidsconcentrationX1,whichisallowedtosettleinanundisturbedmanner.Afterashorttimeatt2,fourdistinctzoneswilldevelopinthecolumn,asillustratedinFigure 10.3.Zone1istheclarifiedeffluentzonewithalowconcentrationofparticles,wheredis-crete(TypeI)settlingandsomeflocculent(TypeII)settlingoccurs.Inzone2,theinitialconcentrationremainswheretheparticlessettleatauniformvelocity.Hindered(TypeIII)settlingisobservedinthiszone.Duetothe
Primaryclari�er
Secondaryclari�er
Sludge toland�ll Sludge recycle
Wastewater owSludge ow
Wastewaterinuent Aeration
tank
E�uent
Sludge waste
Figure 10.2 Secondary clarifier in activated sludge process with recycle.
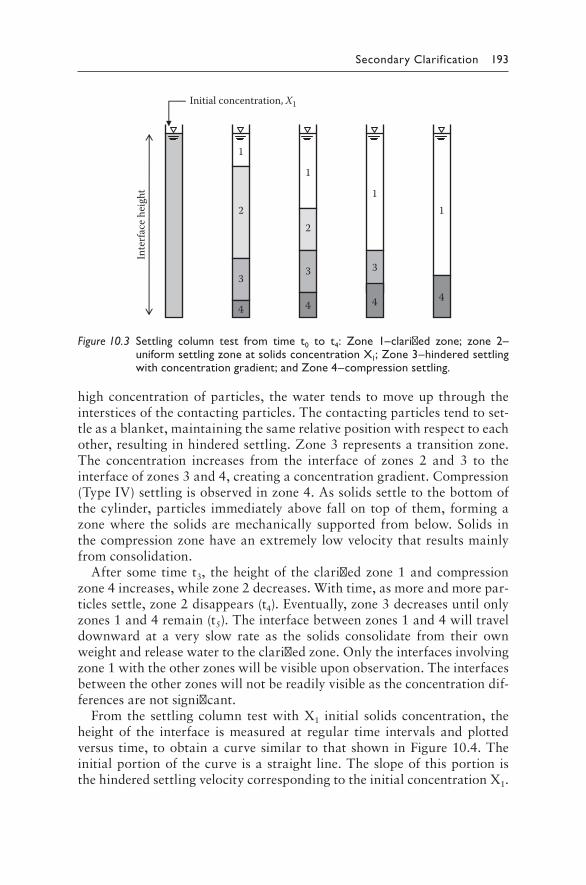
Secondary Clarification 193
highconcentrationofparticles, thewater tends tomoveupthroughtheintersticesofthecontactingparticles.Thecontactingparticlestendtoset-tleasablanket,maintainingthesamerelativepositionwithrespecttoeachother,resultinginhinderedsettling.Zone3representsatransitionzone.The concentration increases from the interface of zones 2 and 3 to theinterfaceofzones3and4,creatingaconcentrationgradient.Compression(TypeIV)settlingisobservedinzone4.Assolidssettletothebottomofthecylinder,particles immediatelyabovefallontopof them, formingazonewhere the solidsaremechanically supported frombelow.Solids inthecompressionzonehaveanextremelylowvelocitythatresultsmainlyfromconsolidation.
Aftersometimet3, theheightof theclarifiedzone1andcompressionzone4increases,whilezone2decreases.Withtime,asmoreandmorepar-ticlessettle,zone2disappears(t4).Eventually,zone3decreasesuntilonlyzones1and4remain(t5).Theinterfacebetweenzones1and4willtraveldownward at a very slow rate as the solids consolidate from their ownweightandreleasewatertotheclarifiedzone.Onlytheinterfacesinvolvingzone1withtheotherzoneswillbevisibleuponobservation.Theinterfacesbetweentheotherzoneswillnotbereadilyvisibleastheconcentrationdif-ferencesarenotsignificant.
From the settlingcolumn testwithX1 initial solids concentration, theheight of the interface ismeasured at regular time intervals andplottedversustime,toobtainacurvesimilartothatshowninFigure 10.4.Theinitialportionofthecurveisastraight line.TheslopeofthisportionisthehinderedsettlingvelocitycorrespondingtotheinitialconcentrationX1.
Inte
rface
hei
ght
Initial concentration, X1
1
2
3
4t0 t1 t2 t3 t4
4 4 4
1
11
2
3 3
Figure 10.3 Settling column test from time t0 to t4: Zone 1–clarified zone; zone 2–uniform settling zone at solids concentration X1; Zone 3–hindered settling with concentration gradient; and Zone 4–compression settling.
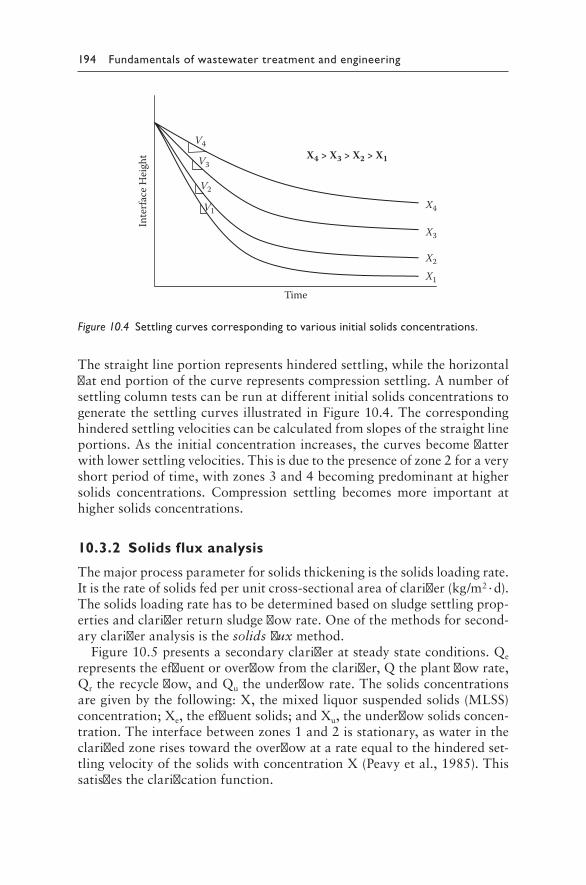
194 Fundamentals of wastewater treatment and engineering
Thestraightlineportionrepresentshinderedsettling,whilethehorizontalflatendportionofthecurverepresentscompressionsettling.AnumberofsettlingcolumntestscanberunatdifferentinitialsolidsconcentrationstogeneratethesettlingcurvesillustratedinFigure 10.4.Thecorrespondinghinderedsettlingvelocitiescanbecalculatedfromslopesofthestraightlineportions.Astheinitialconcentrationincreases,thecurvesbecomeflatterwithlowersettlingvelocities.Thisisduetothepresenceofzone2foraveryshortperiodoftime,withzones3and4becomingpredominantathighersolids concentrations. Compression settling becomes more important athighersolidsconcentrations.
10.3.2 Solids flux analysis
Themajorprocessparameterforsolidsthickeningisthesolidsloadingrate.Itistherateofsolidsfedperunitcross-sectionalareaofclarifier(kg/m2·d).Thesolidsloadingratehastobedeterminedbasedonsludgesettlingprop-ertiesandclarifierreturnsludgeflowrate.Oneofthemethodsforsecond-aryclarifieranalysisisthesolids fluxmethod.
Figure 10.5presentsasecondaryclarifieratsteadystateconditions.Qerepresentstheeffluentoroverflowfromtheclarifier,Qtheplantflowrate,Qrtherecycleflow,andQutheunderflowrate.Thesolidsconcentrationsaregivenbythefollowing:X,themixedliquorsuspendedsolids(MLSS)concentration;Xe,theeffluentsolids;andXu,theunderflowsolidsconcen-tration.Theinterfacebetweenzones1and2isstationary,aswaterintheclarifiedzonerisestowardtheoverflowatarateequaltothehinderedset-tlingvelocityofthesolidswithconcentrationX(Peavyetal.,1985).Thissatisfiestheclarificationfunction.
Time
Inte
rface
Hei
ght
X1
X2
X3
X4
X4 > X3 > X2 > X1
V1
V2
V3
V4
Figure 10.4 Settling curves corresponding to various initial solids concentrations.
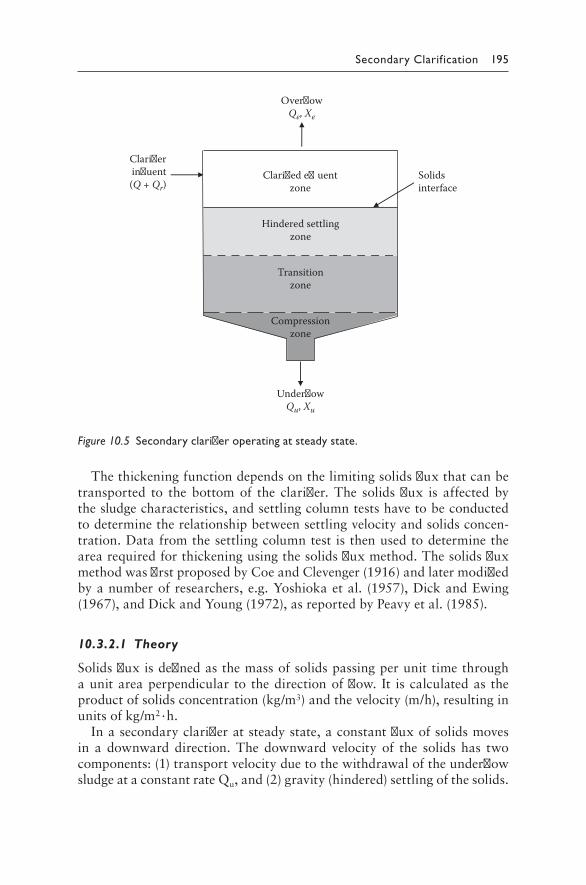
Secondary Clarification 195
Thethickeningfunctiondependsonthelimitingsolidsfluxthatcanbetransported to the bottomof the clarifier. The solids flux is affectedbythesludgecharacteristics,andsettlingcolumntestshavetobeconductedtodeterminetherelationshipbetweensettlingvelocityandsolidsconcen-tration.Datafromthesettlingcolumntestisthenusedtodeterminethearearequiredforthickeningusingthesolidsfluxmethod.ThesolidsfluxmethodwasfirstproposedbyCoeandClevenger(1916)andlatermodifiedbyanumberofresearchers,e.g.Yoshiokaetal. (1957),DickandEwing(1967),andDickandYoung(1972),asreportedbyPeavyetal.(1985).
10.3.2.1 Theory
Solidsfluxisdefinedasthemassofsolidspassingperunittimethroughaunitareaperpendicular to thedirectionofflow. It iscalculatedas theproductofsolidsconcentration(kg/m3)andthevelocity(m/h),resultinginunitsofkg/m2·h.
Inasecondaryclarifieratsteadystate,aconstantfluxofsolidsmovesin a downward direction. The downward velocity of the solids has twocomponents:(1)transportvelocityduetothewithdrawaloftheunderflowsludgeataconstantrateQu,and(2)gravity(hindered)settlingofthesolids.
Clari�ed e�uentzone
Hindered settlingzone
Transitionzone
Compressionzone
Over�owQe, Xe
Clari�erin�uent(Q + Qr)
Solidsinterface
Under�owQu, Xu
Figure 10.5 Secondary clarifier operating at steady state.
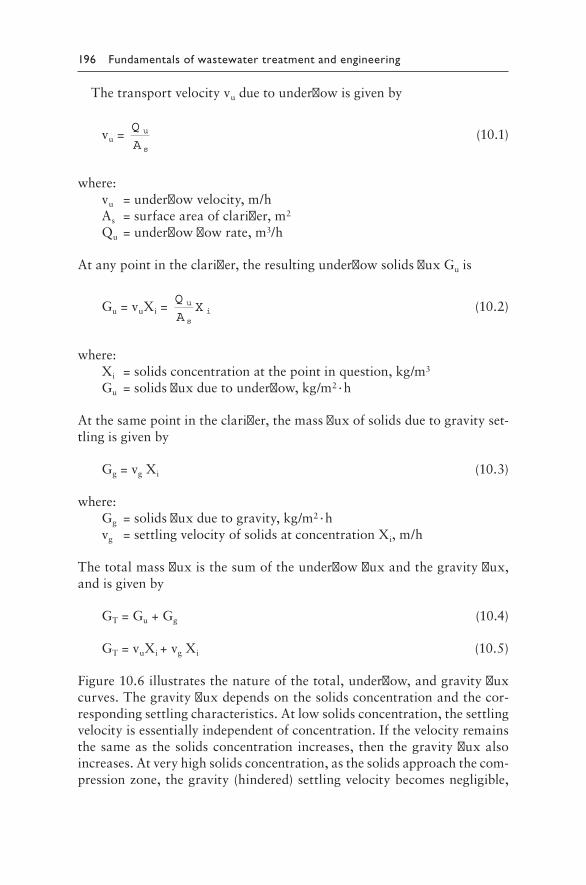
196 Fundamentals of wastewater treatment and engineering
Thetransportvelocityvuduetounderflowisgivenby
vu=Q
Au
s
(10.1)
where:vu=underflowvelocity,m/hAs=surfaceareaofclarifier,m2
Qu=underflowflowrate,m3/h
Atanypointintheclarifier,theresultingunderflowsolidsfluxGuis
Gu=vuXi=Q
AXu
si (10.2)
where:Xi=solidsconcentrationatthepointinquestion,kg/m3
Gu=solidsfluxduetounderflow,kg/m2·h
Atthesamepointintheclarifier,themassfluxofsolidsduetogravityset-tlingisgivenby
Gg=vgXi (10.3)
where:Gg=solidsfluxduetogravity,kg/m2·hvg=settlingvelocityofsolidsatconcentrationXi,m/h
Thetotalmassfluxisthesumoftheunderflowfluxandthegravityflux,andisgivenby
GT=Gu+Gg (10.4)
GT=vuXi+vgXi (10.5)
Figure 10.6illustratesthenatureofthetotal,underflow,andgravityfluxcurves.Thegravityfluxdependsonthesolidsconcentrationandthecor-respondingsettlingcharacteristics.Atlowsolidsconcentration,thesettlingvelocityisessentiallyindependentofconcentration.Ifthevelocityremainsthesameas thesolidsconcentration increases, thenthegravityfluxalsoincreases.Atveryhighsolidsconcentration,asthesolidsapproachthecom-pressionzone,thegravity(hindered)settlingvelocitybecomesnegligible,
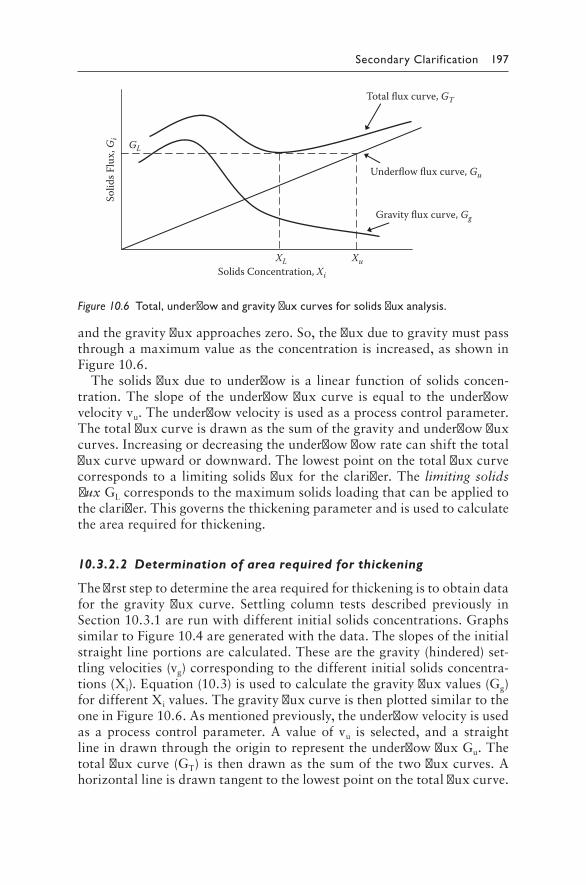
Secondary Clarification 197
andthegravityfluxapproacheszero.So,thefluxduetogravitymustpassthroughamaximumvalueastheconcentrationisincreased,asshowninFigure 10.6.
Thesolidsfluxduetounderflowisa linear functionofsolidsconcen-tration.The slopeof theunderflowfluxcurve is equal to theunderflowvelocityvu.Theunderflowvelocityisusedasaprocesscontrolparameter.Thetotalfluxcurveisdrawnasthesumofthegravityandunderflowfluxcurves.Increasingordecreasingtheunderflowflowratecanshiftthetotalfluxcurveupwardordownward.Thelowestpointonthetotalfluxcurvecorresponds toa limiting solidsflux for theclarifier.The limiting solids fluxGLcorrespondstothemaximumsolidsloadingthatcanbeappliedtotheclarifier.Thisgovernsthethickeningparameterandisusedtocalculatethearearequiredforthickening.
10.3.2.2 Determination of area required for thickening
Thefirststeptodeterminethearearequiredforthickeningistoobtaindatafor the gravity flux curve. Settling column tests described previously inSection10.3.1arerunwithdifferentinitialsolidsconcentrations.GraphssimilartoFigure 10.4aregeneratedwiththedata.Theslopesoftheinitialstraightlineportionsarecalculated.Thesearethegravity(hindered)set-tlingvelocities(vg)correspondingtothedifferentinitialsolidsconcentra-tions(Xi).Equation(10.3)isusedtocalculatethegravityfluxvalues(Gg)fordifferentXivalues.ThegravityfluxcurveisthenplottedsimilartotheoneinFigure 10.6.Asmentionedpreviously,theunderflowvelocityisusedas aprocess controlparameter.Avalueof vu is selected, anda straightlineindrawnthroughtheorigintorepresenttheunderflowfluxGu.Thetotalfluxcurve(GT)isthendrawnasthesumofthetwofluxcurves.Ahorizontallineisdrawntangenttothelowestpointonthetotalfluxcurve.
Solids Concentration, Xi
XL Xu
GL
Solid
s Flu
x, G
i
Total flux curve, GT
Underflow flux curve, Gu
Gravity flux curve, Gg
Figure 10.6 Total, underflow and gravity flux curves for solids flux analysis.
198 Fundamentals of wastewater treatment and engineering
Itsintersectionwiththey-axisgivesthelimiting solids fluxGLthatcanbehandledbytheclarifier.ThecorrespondingunderflowsolidsconcentrationXu,isobtainedastheabscissaofthepointwherethehorizontallineinter-sectstheunderflowfluxcurve.Ifthequantityofsolidscomingtotheclari-fierisgreaterthanthelimitingsolidsfluxvalue,thensolidswillbuildupintheclarifierandmayoverflowfromthetopifadequatestoragecapacityisnotavailable.
Thesurfacearearequiredforthickeningiscalculatedas
A T = Totalflow in to clarifierx solidsconceentration
Lim itingsolidsflux (10.6)
AQ Q X
GT
r
L
=+( )
(10.7)
where:AT=surfacearearequiredforthickening,m2
Qr=recycleflow,m3/hQ=plantflowrate,m3/hX=MLSSconcentration,kg/m3
GL=limitingsolidsflux,kg/m2·h
Thedepthofthethickeningportionoftheclarifiermustbesufficientto(1)maintainanadequatesludgeblanketdepthsothatthickenedsolidsarenotrecycled,and(2)temporarilystoreexcesssolidsthatmaycomeintotheclarifier(MetcalfandEddy,2003).
AslightmodificationtotheabovemethodwasproposedbyYoshiokaetal.(1957)todeterminethelimitingsolidsflux.ThismethodisillustratedinFigure 10.7.Thegravityfluxcurveisplottedfirst.AvalueofunderflowsolidsconcentrationXuisselected.ThenalineisdrawnfromXuonthex-axisandtangenttothegravityfluxcurve.Thetangent isextendedtothey-axis.Theintersectionpointofthetangentwiththey-axisprovidesthelimitingfluxvalueGL.Theabsolutevalueoftheslopeofthetangentistheunderflowvelocityvu.Theordinatevaluecorrespondingtothepointof tangency is the gravity solids flux, while the intercept GL–Gg is theunderflowflux (Peavyetal.,1985).Thismethod isuseful todeterminetheeffectofvariousunderflowsolidsconcentrationsonthelimitingsolidsflux. As illustrated in Figure 10.8, increasing the value of Xu results indecreasingthemaximumsolidsloadingthatcanbeappliedtotheclari-fier.Conversely,ahighersolidsloadingcanbeappliedtoaclarifierwithalowerdesiredunderflowsolidsconcentration.Thesemethodsareillus-tratedintheexamplesthatfollow.
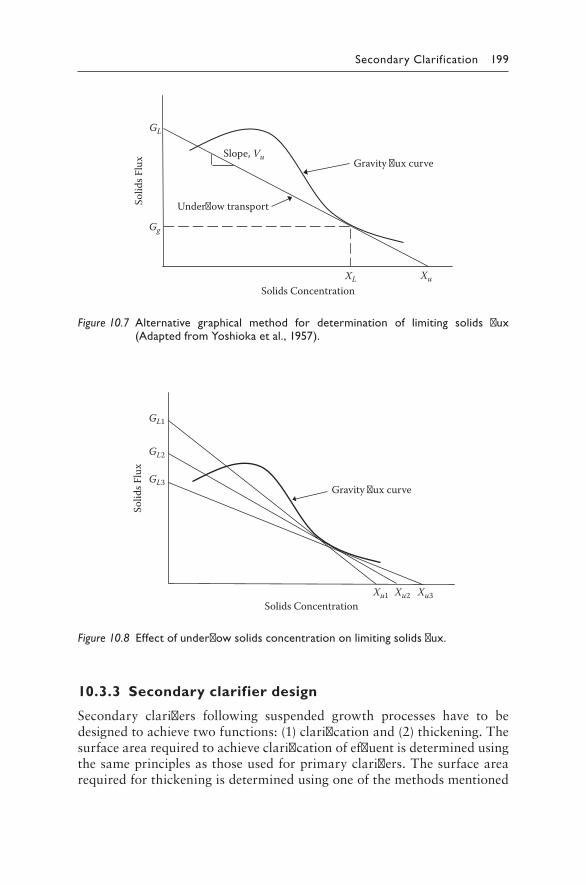
Secondary Clarification 199
10.3.3 Secondary clarifier design
Secondary clarifiers following suspended growth processes have to bedesignedtoachievetwofunctions:(1)clarificationand(2)thickening.Thesurfacearearequiredtoachieveclarificationofeffluentisdeterminedusingthesameprinciplesasthoseusedforprimaryclarifiers.Thesurfacearearequiredforthickeningisdeterminedusingoneofthemethodsmentioned
Solids Concentration
Solid
s Flu
x
XuXL
Gg
GL
Gravity �ux curve
Under�ow transport
Slope, Vu
Figure 10.7 Alternative graphical method for determination of limiting solids flux (Adapted from Yoshioka et al., 1957).
Solid
s Flu
x
Xu2Xu1Solids Concentration
Xu3
Gravity �ux curve
GL1
GL2
GL3
Figure 10.8 Effect of underflow solids concentration on limiting solids flux.
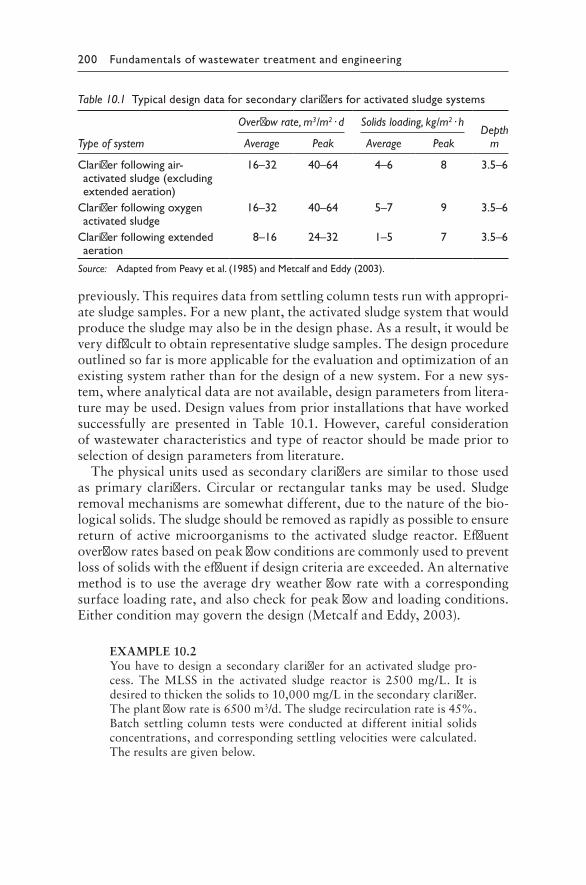
200 Fundamentals of wastewater treatment and engineering
previously.Thisrequiresdatafromsettlingcolumntestsrunwithappropri-atesludgesamples.Foranewplant,theactivatedsludgesystemthatwouldproducethesludgemayalsobeinthedesignphase.Asaresult,itwouldbeverydifficulttoobtainrepresentativesludgesamples.Thedesignprocedureoutlinedsofarismoreapplicablefortheevaluationandoptimizationofanexistingsystemratherthanforthedesignofanewsystem.Foranewsys-tem,whereanalyticaldataarenotavailable,designparametersfromlitera-turemaybeused.Designvaluesfrompriorinstallationsthathaveworkedsuccessfully are presented in Table 10.1. However, careful considerationofwastewatercharacteristicsandtypeofreactorshouldbemadepriortoselectionofdesignparametersfromliterature.
Thephysicalunitsusedassecondaryclarifiersaresimilartothoseusedasprimaryclarifiers.Circularor rectangular tanksmaybeused.Sludgeremovalmechanismsaresomewhatdifferent,duetothenatureofthebio-logicalsolids.Thesludgeshouldberemovedasrapidlyaspossibletoensurereturnof activemicroorganisms to theactivated sludge reactor.Effluentoverflowratesbasedonpeakflowconditionsarecommonlyusedtopreventlossofsolidswiththeeffluentifdesigncriteriaareexceeded.Analternativemethodistousetheaveragedryweatherflowratewithacorrespondingsurfaceloadingrate,andalsocheckforpeakflowandloadingconditions.Eitherconditionmaygovernthedesign(MetcalfandEddy,2003).
EXAMPLE10.2Youhavetodesignasecondaryclarifierforanactivatedsludgepro-cess. The MLSS in the activated sludge reactor is 2500 mg/L. It isdesiredtothickenthesolidsto10,000mg/Linthesecondaryclarifier.Theplantflowrateis6500m3/d.Thesludgerecirculationrateis45%.Batchsettlingcolumntestswereconductedatdifferent initial solidsconcentrations,andcorrespondingsettlingvelocitieswerecalculated.Theresultsaregivenbelow.
Table 10.1 Typical design data for secondary clarifiers for activated sludge systems
Type of system
Overflow rate, m3/m2 · d Solids loading, kg/m2 · hDepth
mAverage Peak Average Peak
Clarifier following air-activated sludge (excluding extended aeration)
16–32 40–64 4–6 8 3.5–6
Clarifier following oxygen activated sludge
16–32 40–64 5–7 9 3.5–6
Clarifier following extended aeration
8–16 24–32 1–5 7 3.5–6
Source: Adapted from Peavy et al. (1985) and Metcalf and Eddy (2003).
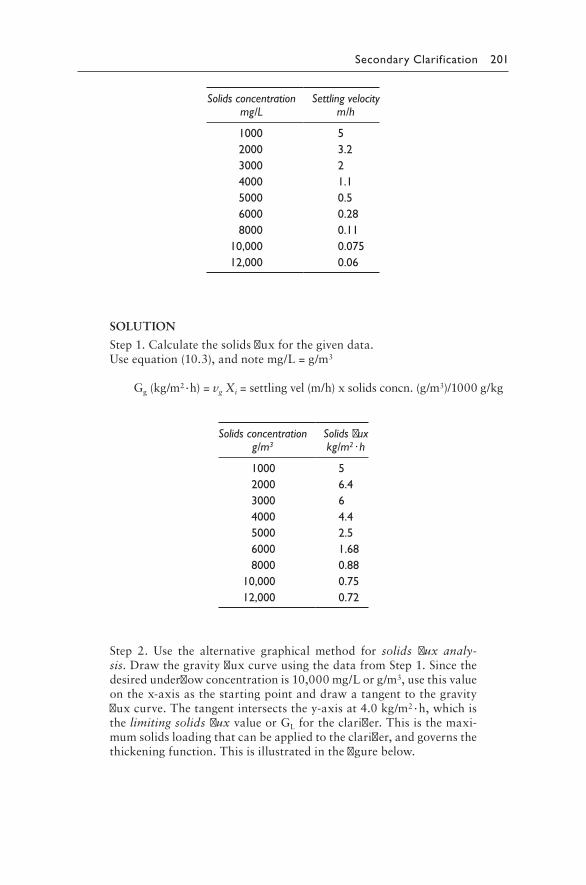
Secondary Clarification 201
Solids concentrationmg/L
Settling velocitym/h
1000 52000 3.23000 24000 1.15000 0.56000 0.288000 0.11
10,000 0.07512,000 0.06
SOLUTION
Step1.Calculatethesolidsfluxforthegivendata.Useequation(10.3),andnotemg/L=g/m3
Gg(kg/m2·h)=vg Xi=settlingvel(m/h)xsolidsconcn.(g/m3)/1000g/kg
Solids concentrationg/m3
Solids fluxkg/m2 · h
1000 52000 6.43000 64000 4.45000 2.56000 1.688000 0.88
10,000 0.7512,000 0.72
Step 2. Use the alternative graphical method for solids flux analy-sis.DrawthegravityfluxcurveusingthedatafromStep1.Sincethedesiredunderflowconcentrationis10,000mg/Lorg/m3,usethisvalueonthex-axisasthestartingpointanddrawatangenttothegravityfluxcurve.Thetangentintersectsthey-axisat4.0kg/m2·h,whichisthelimiting solids fluxvalueorGLfortheclarifier.Thisisthemaxi-mumsolidsloadingthatcanbeappliedtotheclarifier,andgovernsthethickeningfunction.Thisisillustratedinthefigurebelow.
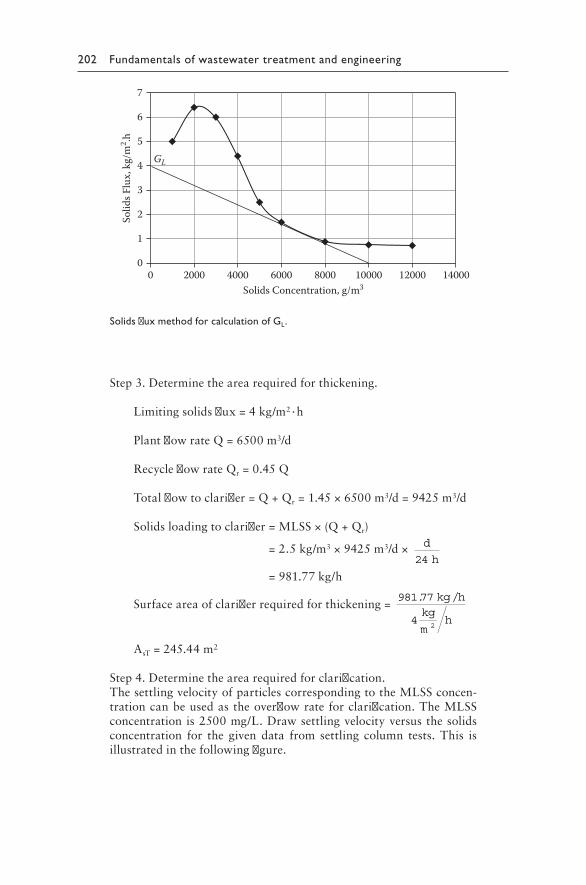
202 Fundamentals of wastewater treatment and engineering
0
1
2
3
4
5
6
7
0 2000 4000 6000 8000 10000 12000 14000
Solid
s Flu
x, k
g/m
2 .h
Solids Concentration, g/m3
GL
Solids flux method for calculation of GL.
Step3.Determinethearearequiredforthickening.
Limitingsolidsflux=4kg/m2·h
PlantflowrateQ=6500m3/d
RecycleflowrateQr=0.45Q
Totalflowtoclarifier=Q+Qr=1.45×6500m3/d=9425m3/d
Solidsloadingtoclarifier=MLSS×(Q+Qr)
=2.5kg/m3×9425m3/d× d
h24
=981.77kg/h
Surfaceareaofclarifierrequiredforthickening=981 77
42
. /kg hkg
mh
AsT=245.44m2
Step4.Determinethearearequiredforclarification.ThesettlingvelocityofparticlescorrespondingtotheMLSSconcen-trationcanbeusedastheoverflowrateforclarification.TheMLSSconcentrationis2500mg/L.Drawsettlingvelocityversusthesolidsconcentration for the given data from settling column tests. This isillustratedinthefollowingfigure.
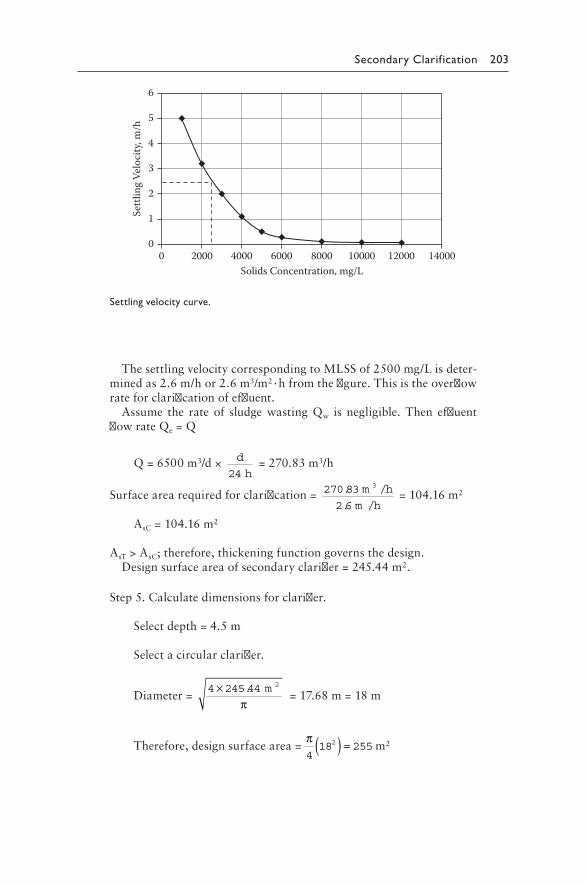
Secondary Clarification 203
0
1
2
3
4
5
6
Settl
ing
Velo
city
, m/h
Solids Concentration, mg/L0 2000 4000 6000 8000 10000 12000 14000
Settling velocity curve.
ThesettlingvelocitycorrespondingtoMLSSof2500mg/Lisdeter-minedas2.6m/hor2.6m3/m2·hfromthefigure.Thisistheoverflowrateforclarificationofeffluent.
Assume the rate of sludgewastingQw is negligible.Then effluentflowrateQe=Q
Q=6500m3/d× d
h24=270.83m3/h
Surfacearearequiredforclarification= 270 832 6
3. /
. /
m h
m h=104.16m2
AsC=104.16m2
AsT>AsC;therefore,thickeningfunctiongovernsthedesign.Designsurfaceareaofsecondaryclarifier=245.44m2.
Step5.Calculatedimensionsforclarifier.
Selectdepth=4.5m
Selectacircularclarifier.
Diameter=4 245 44 2× . m
π=17.68m=18m
Therefore,designsurfacearea=π418 2552( ) =
m2
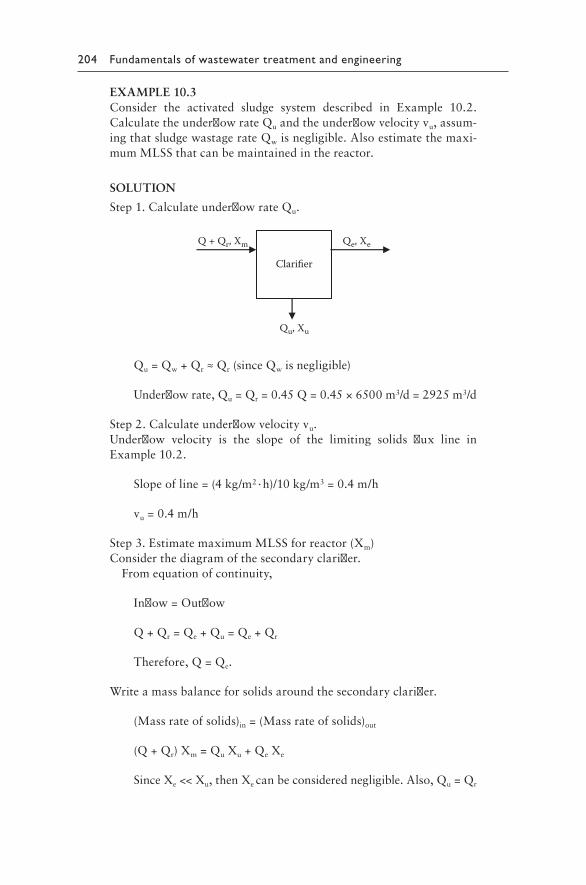
204 Fundamentals of wastewater treatment and engineering
EXAMPLE10.3Consider the activated sludge system described in Example 10.2.CalculatetheunderflowrateQuandtheunderflowvelocityvu,assum-ingthatsludgewastagerateQwisnegligible.Alsoestimatethemaxi-mumMLSSthatcanbemaintainedinthereactor.
SOLUTION
Step1.CalculateunderflowrateQu.
Qe, XeQ + Qr, Xm
Qu, Xu
Clarifier
Qu=Qw+Qr≈Qr(sinceQwisnegligible)
Underflowrate,Qu=Qr=0.45Q=0.45×6500m3/d=2925m3/d
Step2.Calculateunderflowvelocityvu.Underflow velocity is the slope of the limiting solids flux line inExample10.2.
Slopeofline=(4kg/m2·h)/10kg/m3=0.4m/h
vu=0.4m/h
Step3.EstimatemaximumMLSSforreactor(Xm)Considerthediagramofthesecondaryclarifier.
Fromequationofcontinuity,
Inflow=Outflow
Q+Qr=Qe+Qu=Qe+Qr
Therefore,Q=Qe.
Writeamassbalanceforsolidsaroundthesecondaryclarifier.
(Massrateofsolids)in=(Massrateofsolids)out
(Q+Qr)Xm=QuXu+QeXe
SinceXe<<Xu,thenXecanbeconsiderednegligible.Also,Qu=Qr
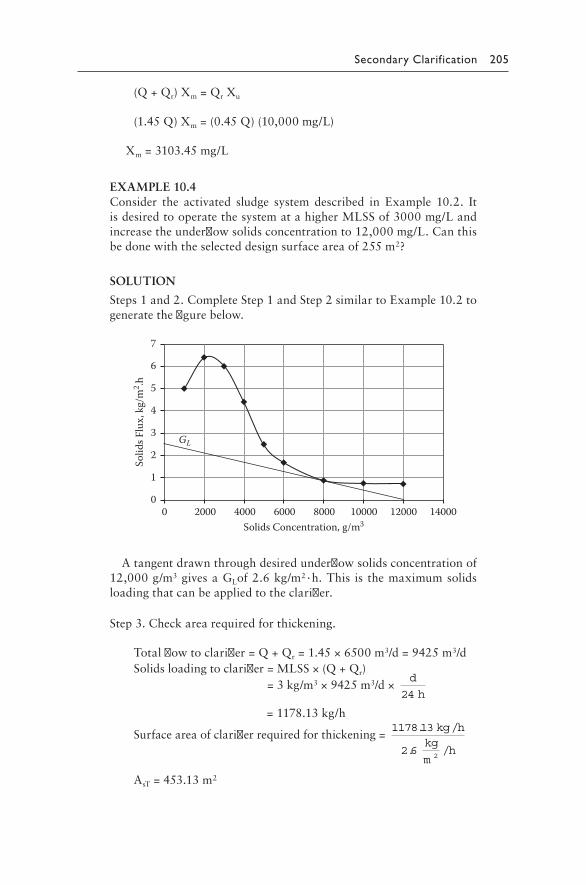
Secondary Clarification 205
(Q+Qr)Xm=QrXu
(1.45Q)Xm=(0.45Q)(10,000mg/L)
Xm=3103.45mg/L
EXAMPLE10.4Consider the activated sludge system described in Example 10.2. ItisdesiredtooperatethesystematahigherMLSSof3000mg/Landincreasetheunderflowsolidsconcentrationto12,000mg/L.Canthisbedonewiththeselecteddesignsurfaceareaof255m2?
SOLUTION
Steps1and2.CompleteStep1andStep2similartoExample10.2togeneratethefigurebelow.
0
1
2
3
4
5
6
7
14000120001000080006000400020000
Solid
s Flu
x, k
g/m
2 .h
Solids Concentration, g/m3
GL
Atangentdrawnthroughdesiredunderflowsolidsconcentrationof12,000g/m3givesaGLof2.6kg/m2·h.This is themaximumsolidsloadingthatcanbeappliedtotheclarifier.
Step3.Checkarearequiredforthickening.
Totalflowtoclarifier=Q+Qr=1.45×6500m3/d=9425m3/d Solidsloadingtoclarifier=MLSS×(Q+Qr)
=3kg/m3×9425m3/d×d
h24
=1178.13kg/h
Surfaceareaofclarifierrequiredforthickening=1178 13
2 62
. /
. /
kg hkg
mh
AsT=453.13m2
206 Fundamentals of wastewater treatment and engineering
Step4.Checkarearequiredforclarification.Settling velocity corresponding to MLSS of 3000 mg/L is 2.0 m/h(giveninsettlingcolumntestdata).Thisisequivalenttotheoverflowrateforclarification.
Assume the rate of sludgewastingQw is negligible.Then effluentflowrateQe=Q.
Q=6500m3/d× d
h24=270.83m3/h
Surfacearearequiredforclarification=270 832 0
3. /
. /
m h
m h=135.42m2
AsC=135.42m2
AsT>AsC;therefore,thickeningfunctiongovernsthedesign.
Designsurfaceareaofsecondaryclarifier=453.13m2
ThesurfacearearequiredisalmostdoublethatofExample10.2.Thesurfaceareawillhave tobe increased to453.13m2 from255m2 inordertoincreasetheMLSSandunderflowsolidsconcentrationtothenewvalues.
PROBLEMS
10.1 Whatisthemaindesignobjectiveofsecondaryclarifiersforattachedgrowthprocesses?Whyisitdifferentfromthedesignofsecondaryclarifiersfollowingsuspendedgrowthprocesses?
10.2 Designsecondaryclarifiersforatricklingfilterplanttreatingwaste-water fromamunicipality.Theaverageflowrate is500m3/d,witharecirculationratioof1.5to1.Themaximumoverflowrateis2.1m3/m2·h.
10.3 What are themajordesign considerations for secondary clarifiersfollowingactivatedsludgeprocesses?
10.4 Whatisasettlingcolumntest?Howcanyouuseittodeterminethesettlingvelocity?
10.5 Howcanyoudesignasettlingcolumntesttolocatethevariousset-tlingzoneswithinthecolumn?Illustrateyourdesign.
10.6 Writeanexpressionforthetotalsolidsfluxinasecondaryclarifier.Defineeachofthecomponentfluxes.
10.7 Illustratewiththehelpofagraphwhathappenstothelimitingsol-idsfluxandunderflowvelocitywhentheunderflowsolidsconcen-trationisincreasedordecreasedfromitsdesignvalue.
10.8 Anactivated sludgeplantwith recycle is evaluating its secondaryclarificationsystem.Settlingcolumntestsareconductedandana-lyzedforsettlingvelocitiesatdifferentinitialsolidsconcentrations.
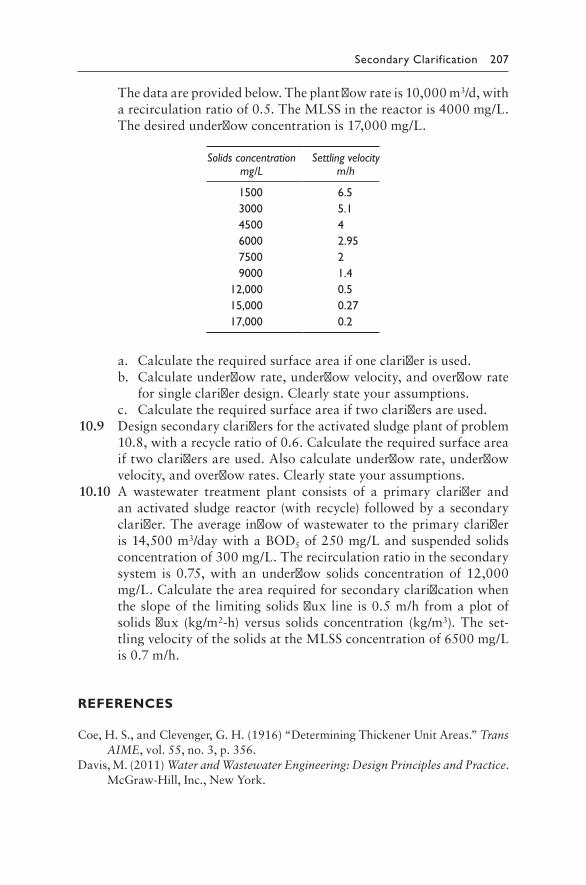
Secondary Clarification 207
Thedataareprovidedbelow.Theplantflowrateis10,000m3/d,witharecirculationratioof0.5.TheMLSSinthereactoris4000 mg/L.Thedesiredunderflowconcentrationis17,000mg/L.
Solids concentrationmg/L
Settling velocitym/h
1500 6.53000 5.14500 46000 2.957500 29000 1.4
12,000 0.515,000 0.2717,000 0.2
a. Calculatetherequiredsurfaceareaifoneclarifierisused.b. Calculateunderflowrate,underflowvelocity,andoverflowrate
forsingleclarifierdesign.Clearlystateyourassumptions.c. Calculatetherequiredsurfaceareaiftwoclarifiersareused.
10.9 Designsecondaryclarifiersfortheactivatedsludgeplantofproblem10.8,witharecycleratioof0.6.Calculatetherequiredsurfaceareaiftwoclarifiersareused.Alsocalculateunderflowrate,underflowvelocity,andoverflowrates.Clearlystateyourassumptions.
10.10 A wastewater treatment plant consists of a primary clarifier andanactivatedsludgereactor(withrecycle)followedbyasecondaryclarifier.Theaverageinflowofwastewatertotheprimaryclarifieris14,500m3/daywithaBOD5of250mg/Landsuspendedsolidsconcentrationof300mg/L.Therecirculationratiointhesecondarysystem is0.75,with anunderflow solids concentrationof12,000mg/L.Calculatethearearequiredforsecondaryclarificationwhentheslopeof the limitingsolidsflux line is0.5m/hfromaplotofsolidsflux (kg/m2-h) versus solids concentration (kg/m3).The set-tlingvelocityofthesolidsattheMLSSconcentrationof6500mg/Lis0.7 m/h.
REFERENCES
Coe,H.S.,andClevenger,G.H.(1916)“DeterminingThickenerUnitAreas.”Trans AIME,vol.55,no.3,p.356.
Davis,M.(2011)Water and Wastewater Engineering: Design Principles and Practice.McGraw-Hill,Inc.,NewYork.
208 Fundamentals of wastewater treatment and engineering
Dick,R. I., andEwing,B.B. (1967)“EvaluationofActivated SludgeThickeningTheories.”Journal of Sanitary Engineering Division, ASCE,vol.96,p.423.
Dick,R.I.,andYoung,K.W.(1972)“AnalysisofThickeningPerformanceofFinalSettling Tanks.” Proceedings of 27th Industrial Waste Conference, PurdueUniversity,Indiana,p.33.
GLUMRB(2004)Recommended Standards for Wastewater Facilities.GreatLakes–Upper Mississippi River Board of State and Provincial Public Health andEnvironmentalManagers,HealthEducationServices,Albany,NewYork,pp.70–73.
MetcalfandEddy,Inc.(2003)Wastewater Engineering: Treatment and Reuse.Fourthedition.McGraw-Hill,Inc.,NewYork.
Peavy,H.S.,Rowe,D.R.,andTchobanoglous,G.(1985)Environmental Engineering.McGraw-Hill,Inc.,NewYork.
Yoshioka,N.,Hotta,Y.,Tanaka,S.,Naito,S.,andTsugami,S.(1957)“ContinuousThickening of Homogeneous Flocculated Slurries.” Chemical Engineering, Japan,vol.21,p.66–74.

209
Chapter 11
Anaerobic wastewater treatment
11.1 INTRODUCTION
Thebiologicaltreatmentofwastewaterandsludgeinabsenceofoxygenistermedasanaerobic treatment.LouisPasteurwasthefirstscientisttodis-coveranaerobiclifeduringhisresearchonfermentationprocessesin1861(Madiganetal.,2010).Heobservedthattheclostridiumbacteria,whichcausedbutyricfermentation,werestrictlyanaerobic.Exposuretooxygenwastoxictothebacteria.Pasteurintroducedthetermsaerobicandanaer-obic to designate biological life in the presence and absence of oxygen,respectively.Pasteurobservedthattherewasadifferenceinyieldbetweenaerobicandanaerobicprocesses.Anaerobicfermentationresultedinlowermicrobialmassinyeastproductionthanaerobicconditions.
Historically,anaerobic treatmenthasbeenusedmore for treatmentofsludgeorbiosolidsratherthanforwastewater.Theseptic tankwasoneofthefirstformsofanaerobictreatmentusedforsewagesludgeorbiosolids.The development and use of the first septic tank dates back to 1896 atExeter,England,asreportedbyFuller(1912).Wastewaterclarificationanddigestiontookplaceinthesametank.Thiswaswidelyusedforwastetreat-mentinEuropeandtheUnitedStates.In1904,WilliamTravisdevelopedatwo-storyseptictankinGermany,wheresuspendedmaterialwasseparatedfromthewastewaterbysettlinginthefirststage.Thesecondstagewasahydrolyzingchamberthroughwhichthesupernatantwasallowedtoflow.TheTravis hydrolytic tankwasmodifiedbyKarlImhoffin1907toprovidea treatment system,which laterbecameknownas the Imhoff tank.TheImhofftankdidnotallowthewastewatertoflowthroughthehydrolyzingtank.Instead,thesludgewaskeptinthehydrolyzingtankforalongperiodoftimetoallowfordigestionandstabilization.TheImhofftankreducedthecostofsludgedisposalandrapidlybecamepopularinbothEuropeandtheUnitedStates(Imhoff,1915;McCarty,1981).
The importance of temperature on anaerobic treatment was observedandinvestigatedbyanumberofresearchersasearlyasthe1920s.Rudolfs(1927) observed that the total amount of gas produced from a gram of
210 Fundamentals of wastewater treatment and engineering
organicmatterunderanaerobicconditionswasnotdependentontempera-ture,buttherateofgasproductionwastemperaturedependent.Eventuallythe mesophilic (35°C) and thermophilic (55°C) temperature ranges wereidentifiedforanaerobictreatment(Heukelekian,1933).Extensivestudieswereconductedbyresearcherstogainabetterunderstandingofthemicro-biologyofanaerobictreatment,aswellasthebiochemicalandenvironmen-talfactorsthataffecttheprocess(BabbittandSchlenz,1929;Heukelekian,1958;FairandMoore,1932;Sawyeretal.,1954;McCartyetal.,1963;Dagueetal.,1966).In1964,PerryL.McCartypublishedaseriesofpapersonanaerobicwastetreatmentthatprovidedacomprehensivesummaryofthefundamentalsofanaerobictreatment(McCarty,1964a,b,c).Overtime,a large number of suspended and attached growth processes have beendevelopedforanaerobictreatmentofwastewater.
Anaerobic treatment of wastewater involves the stabilization oforganic matter, with a concurrent reduction in odors, pathogens, andthemassofsolidorganicmatterthatrequiresfurtherprocessing.Thisisaccomplishedbybiologicalconversionoforganicstomethaneandcar-bon dioxide in an oxygen-free or anaerobic environment (Parkin andOwen,1986).
Themainadvantagesofanaerobictreatmentprocessesoveraerobicpro-cessesare(McCarty,1964a;MetcalfandEddy,2003)asfollows:
• Ahighdegreeofwastestabilizationispossibleathighorganicloads.• Thereislowproductionofwastebiologicalsludge.• Lessenergyisrequired.• Therearelownutrientrequirements.• Methanegasproducedisausefulsourceoffuel.• Smallerreactorvolumeisrequired.• Nooxygenisrequired,sotreatmentratesarenotlimitedbyoxygen
transferrates.• Rapid reactivation of biomass is possible with substrate addition,
afterlongperiodsofstarvation.
Theanaerobicprocesshassomedisadvantages,asfollows:
• Relativelyhightemperature(35°C)isrequiredforoptimaloperation.• Longerstart-uptimeisrequiredtodevelopnecessaryamountofbio-
mass,duetoslowgrowthrateofmethane-formingbacteria.• Itmaybenecessarytoaddalkalinityorotherspecificions,depending
onthecharacteristicsofthewastewater.• Maybemoresusceptibletotoxicsubstances.• Odorproductionmaybeaproblem.• Biologicalnitrogenandphosphorusremovalmaynotbepossible.
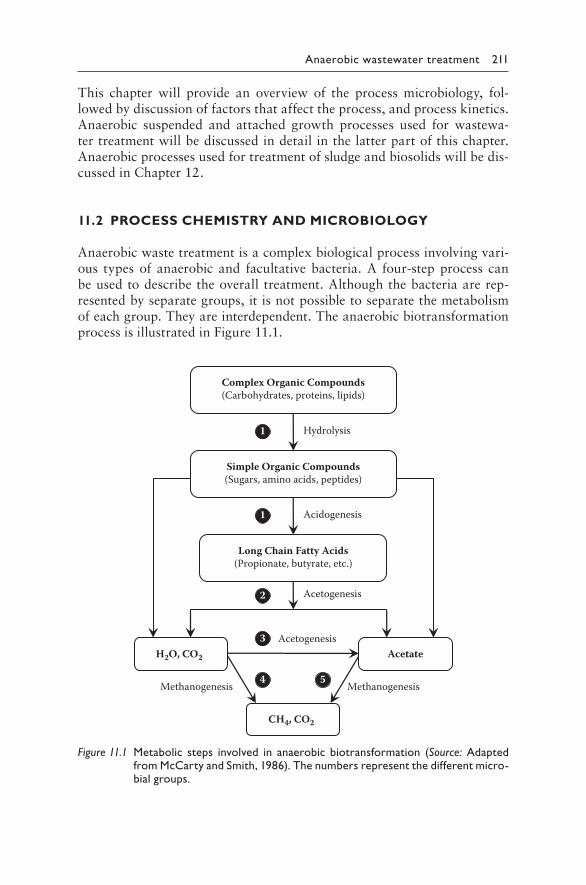
Anaerobic wastewater treatment 211
This chapter will provide an overview of the process microbiology, fol-lowedbydiscussionoffactorsthataffecttheprocess,andprocesskinetics.Anaerobic suspended and attached growth processes used for wastewa-tertreatmentwillbediscussedindetailinthelatterpartofthischapter.Anaerobicprocessesusedfortreatmentofsludgeandbiosolidswillbedis-cussedinChapter12.
11.2 PROCESS CHEMISTRY AND MICROBIOLOGY
Anaerobicwastetreatmentisacomplexbiologicalprocessinvolvingvari-ous types of anaerobic and facultative bacteria.A four-stepprocess canbeusedtodescribetheoverall treatment.Althoughthebacteriaarerep-resentedbyseparategroups,itisnotpossibletoseparatethemetabolismofeachgroup.Theyareinterdependent.TheanaerobicbiotransformationprocessisillustratedinFigure 11.1.
Complex Organic Compounds(Carbohydrates, proteins, lipids)
Simple Organic Compounds(Sugars, amino acids, peptides)
Long Chain Fatty Acids(Propionate, butyrate, etc.)
H2O, CO2 Acetate
CH4, CO2
Hydrolysis
Acidogenesis
Acetogenesis
Acetogenesis
MethanogenesisMethanogenesis
1
1
2
3
4 5
Figure 11.1 Metabolic steps involved in anaerobic biotransformation (Source: Adapted from McCarty and Smith, 1986). The numbers represent the different micro-bial groups.
212 Fundamentals of wastewater treatment and engineering
Five groups of bacteria are thought to be involved, each deriving itsenergyfromalimitednumberofbiochemicalreactions(Novaes,1986):
1.Fermentativebacteria:Thisgroupisresponsibleforthefirsttwostagesofanaerobicconversion,hydrolysisandacidogenesis.Anaerobicspe-ciesbelongingtothefamilyofStreptococcus andEnterobacterandto thegeneraofClostridium eubacteriumaremainly found in thisgroup.
2.Hydrogen-producing acetogenic bacteria: These catabolize sugars,alcohols, and organic acids to acetate and carbon dioxide. TheseincludetheSyntrophobacter woliniiandSyntrophomonus wolfei.
3.Hydrogen-consumingacetogenicorhomoacetogenicbacteria:Thesebacteriausehydrogenandcarbondioxidetoproduceacetate.TheyincludetheClostridium aceticumandButyribacterium methylotro-phicum,amongothers.
4.Carbondioxide–reducingmethanogens:Theseutilizehydrogenandcarbondioxidetoproducemethane.
5.Aceticlasticmethanogens:Thesecleaveacetatetoformmethaneandcarbondioxide.
Thefourstepsofanaerobicbiotransformation,discussedbelow,areasfollows:
1.Hydrolysisandliquefaction 2.Fermentationoracidogenesis 3.Hydrogenandaceticacidformation,oracetogenesis 4.Methaneformationormethanogenesis
Step 1: Hydrolysis and liquefaction. The first step involves hydrolysisandliquefaction.Insolubleorganicsmustfirstbesolubilizedbeforetheyareconsumed.Inaddition,largesolubleorganicmoleculesmustbediminishedinsizetofacilitatetransportacrossthecellmembrane.Thereactionsarehydrolyticandcatalyzedbyenzymessuchasamylase,proteinase, lipase,andnuclease.Nowastestabilizationtakesplaceduringthisstep,butrathertheorganicmatter isconverted intoa formthatcanbe takenupby themicroorganisms.Anaerobicdigestionmaybelimitedinthehydrolysisandliquefactionstep,ifthewastecontainslargeportionsofrefractoryornon-biodegradableorganicmaterialthatisnothydrolyzedbymicroorganisms.Particulateorganicmatter(lipids,polysaccharides,protein)isconvertedtosolublecompoundsandafterwardhydrolyzedtosimplemonomers (fattyacids,monosaccharides,aminoacids)inthisstep.
Step 2: Fermentation or acidogenesis.The simplemonomers resultingfromhydrolysisareusedascarbonandenergysourcesbytheacid-produc-ingbacteria.Theoxidizedendproductsofthisstepareprimarilyvolatilefattyacids(VFAs),suchasacetic,propionic,butyric,valeric,andcaproic
Anaerobic wastewater treatment 213
acid,togetherwithproductionofammonia(NH3),carbondioxide(CO2),hydrogensulfide(H2S),andotherby-products.
Step 3: Hydrogen and acetic acid formation, or acetogenesis.Inthethirdstep,VFAsandalcoholsproducedintheacidogenesissteparedegradedprimarilytoaceticacidtogetherwithproductionofCO2andH2.Inthisconversion,partialpressureofH2isanimportantfactor.Freeenergychangeassociatedwiththeconversionofpropionateandbutyratetoacetateandhydrogenrequireshydro-genconcentrationtobelowinthesystem(H2<10–4atm)ortheconversionwillnottakeplace(McCartyandSmith,1986).Hydrogenisproducedbythefermentativeandhydrogen-producingacetogenicbacteria.Acetateisalsopro-ducedbythesegroupsinadditiontothehomoacetogenicbacteria.
Step 4: Methane formation or methanogenesis. Waste stabilizationoccurs in the fourth and final stage when acetic acid or acetate is con-vertedtomethanebythemethanogenicbacteria.Approximately72%ofmethaneformedcomesfromacetatecleavagebyaceticlasticmethanogens(McCarty,1964c).Theproposedreactionis
CH3COOH ___▶ CH4+CO2 (11.1)
Theremaining28%resultsfromreductionofcarbondioxide(13%frompropionicacidand15%fromotherintermediates),usinghydrogenasanenergysourcebycarbondioxide–reducingmethanogens,formingmethanegasintheprocess:
CO2+H2___▶ CH4+H2O (11.2)
Thefollowingreactionsdescribetheoverallanaerobicbiotransformationofaceticacid,propionicacid,butyricacid,ethanol,andacetone:
CH3COOH ___▶ CH4+CO2 (11.3)
4CH3CH2COOH+2H2O ___▶ 7CH4+5CO2 (11.4)
2CH3CH2CH2COOH+2H2O ___▶ 5CH4+3CO2 (11.5)
2CH3CH2OH ___▶ 3CH4+CO2 (11.6)
CH3COCH3___▶ 2CH4+CO2 (11.7)
11.2.1 Syntrophic relationships
TheratelimitingstepintheentireanaerobicprocessistheconversionofhydrogentomethanebyCO2-reducingmethanogens.Thehydrogenpartial
214 Fundamentals of wastewater treatment and engineering
pressuremustbemaintainedatanextremelylowleveltoenablefavorablethermodynamicconditionsfortheconversionofvolatileacidsandalcoholstoacetate.Understandardconditionsof1atmofhydrogenpartialpres-sure, the freeenergychange ispositive for thisconversionand thuspre-cludesit.Thefreeenergychangeforconversionofpropionateandbutyratetoacetateandhydrogendoesnotbecomenegativeuntilthehydrogenpar-tialpressuredecreasesbelow10–4atm(Speece,1983;McCartyandSmith,1986).Itisthereforeobligatoryforthehydrogen-utilizingmethanogenstoutilizehydrogenrapidlyandmaintaintheseextremelylowhydrogenpartialpressuresinthesystem.Otherwise,highervolatileacids,suchaspropionicandbutyricacids,willaccumulateandwastestabilizationwillnotoccur.
11.3 METHANOGENIC BACTERIA
Methanogens are often considered to be the key class of microorgan-isms in anaerobic treatment. Methanogens are classified as Archaea orArchaebacteriaandcanbedistinguishedbythecomparativecatalogingof16SrRNAsequences(Batchetal.,1979)aswellasbiochemicalproperties,morphology,and immunologicalanalyses (MacarioandConway,1988).Theyareobligateanaerobeswithrelativelyslowreproductionrates,sincelessenergyisreleasedinthereactionsinvolvedintheanaerobicstabiliza-tionoforganicmatter.Thisslowgrowthratelimitstherateatwhichtheprocess can adjust to changing substrate loads, temperatures, and otherenvironmentalconditions.
Avarietyofmethanogensareobservedaccordingtothefollowing:
• Morphology:longorshortrods,smallorlargecocci,numerouslacentand spirillum shapes. The cell walls of methanogens are based onthreemajorcomponents:pseudomurien,protein,andheteropolysac-charide(ArcherandHarris,1986).
• Gramstaining:allaregram-negative.• Growthtemperature:somearethermophilic(55°Cto65°C)andsome
aremesophilic(30°Cto35°C)organisms.• Generation time: range is from 1.8 to 3.5 hrs (Dubach and
Bachofen,1985).
Methanogenscanonlyuseasmallnumberofsimplecompoundsthatcon-tain one or two carbons (Wose et al., 1978; Wose, 1987). The primaryreactions of methane formation with their associated Gibbs free energyvalues are shown in Table 11.1. The methanogenic bacteria are depen-dentonotherorganismsfortheirsubstrates.Henceacomplexfoodwebofanaerobesisrequiredtoconvertmostoftheorganicsubstratestolowmolecularweightorganicacids,CO2andhydrogen.Themethanogensuse
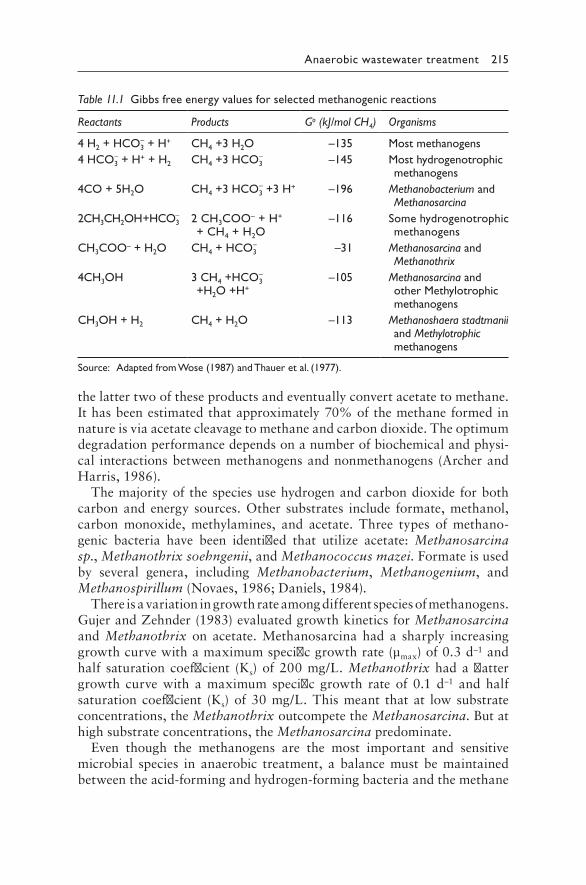
Anaerobic wastewater treatment 215
thelattertwooftheseproductsandeventuallyconvertacetatetomethane.Ithasbeenestimatedthatapproximately70%ofthemethaneformedinnatureisviaacetatecleavagetomethaneandcarbondioxide.Theoptimumdegradationperformancedependsonanumberofbiochemicalandphysi-cal interactionsbetweenmethanogensandnonmethanogens (ArcherandHarris,1986).
Themajorityofthespeciesusehydrogenandcarbondioxideforbothcarbonand energy sources.Other substrates include formate,methanol,carbon monoxide, methylamines, and acetate. Three types of methano-genic bacteria have been identified that utilize acetate: Methanosarcina sp.,Methanothrix soehngenii,andMethanococcus mazei.Formateisusedby several genera, including Methanobacterium, Methanogenium, andMethanospirillum(Novaes,1986;Daniels,1984).
Thereisavariationingrowthrateamongdifferentspeciesofmethanogens.GujerandZehnder(1983)evaluatedgrowthkineticsforMethanosarcinaand Methanothrix on acetate. Methanosarcina had a sharply increasinggrowthcurvewithamaximumspecificgrowthrate(µmax)of0.3d–1andhalf saturation coefficient (Ks)of200mg/L.Methanothrix hadaflattergrowth curve with a maximum specific growth rate of 0.1 d–1 and halfsaturation coefficient (Ks)of30mg/L.Thismeant that at low substrateconcentrations,theMethanothrixoutcompetetheMethanosarcina.Butathighsubstrateconcentrations,theMethanosarcinapredominate.
Even though the methanogens are the most important and sensitivemicrobial species in anaerobic treatment, a balance must be maintainedbetweentheacid-formingandhydrogen-formingbacteriaandthemethane
Table 11.1 Gibbs free energy values for selected methanogenic reactions
Reactants Products Go (kJ/mol CH4) Organisms
4 H2 + HCO3– + H+ CH4 +3 H2O –135 Most methanogens
4 HCO3– + H+ + H2 CH4 +3 HCO3
– –145 Most hydrogenotrophic methanogens
4CO + 5H2O CH4 +3 HCO3– +3 H+ –196 Methanobacterium and
Methanosarcina2CH3CH2OH +HCO3
– 2 CH3COO– + H+ + CH4 + H2O
–116 Some hydrogenotrophic methanogens
CH3COO– + H2O CH4 + HCO3– –31 Methanosarcina and
Methanothrix4CH3OH 3 CH4 +HCO3
– +H2O +H+
–105 Methanosarcina and other Methylotrophic methanogens
CH3OH + H2 CH4 + H2O –113 Methanoshaera stadtmanii and Methylotrophic methanogens
Source: Adapted from Wose (1987) and Thauer et al. (1977).
216 Fundamentals of wastewater treatment and engineering
formersinordertoachievecompleteconversionoforganiccompoundstomethaneandcarbondioxide.Theproperenvironmentalconditionshavetobemaintainedforgrowthandmetabolism.
11.4 SULFATE-REDUCING BACTERIA
Onegroupofbacteriaoften found inassociationwith themethanogens isthesulfate-reducing bacteria.Theseproducehydrogen,acetate,andsulfides,whichareusedbythemethanogens.Insulfate-richenvironments,thesulfate-reducingbacteria have a thermodynamic advantageover themethanogens(Thaueretal.,1977).Thesulfatereducershavelowerhalfsaturationcoef-ficient(Ks)valuesforH2andacetate,ascomparedtothevaluesformetha-nogens. The productionof sulfidemight inhibitmethanogenesis, since thesulfate-reducingbacteriautilizehydrogenandaceticacidasenergysourcesandoutcompetemethanogensforthesesubstrates.Also,solublehydrogensul-fideinexcessof200mg/L(ParkinandOwen,1986)istoxictomethanogens.
11.5 ENVIRONMENTAL REQUIREMENTS AND TOXICITY
Optimumenvironmentalconditionsareveryimportantinthedesignandoperationofanaerobictreatmentprocesses.Theseconditionsareusuallydictatedbytherequirementsofthemethanogens,whosegrowthratelimitstheprocessofwaste stabilization.The followingare important environ-mentalfactorsaffectingtheprocess:
1.Temperature—Temperature is an important factor influencing theanaerobicbacteria.Thereisalimitedrangeoftemperaturesforopti-mumgrowth.Methanebacteriaareactiveintwotemperaturezones,themesophilicandthethermophilicranges,andespeciallyinthepartofmesophilicrangebetween30°Cand35°C.Theratesofdegradationaresloweratlowertemperatures.Thetreatmentprocesshastobeoperatedatlongerdetentiontimes,orthemicrobialpopulationshouldincreasetoobtainthesamedegreeofstabilizationatlowertemperatures.
A rapid change of temperature is also detrimental to anaerobictreatment.Changingthetemperaturebyafewdegreescancauseanimbalancebetweenthemajorbacterialpopulations,whichcanleadtoprocessfailure(GradyandLim,1980).
2.pH—pHisanimportantparameteraffectingtheenzymaticactivity,since a specific and narrow pH range is suitable for the activationofeachenzyme.AnaerobictreatmentprocessesoperatebestatapHsystemofnearneutrality.ThepHhasaneffectonbothacid-forming
Anaerobic wastewater treatment 217
andmethane-formingbacteria.TheoptimumpHforanaerobictreat-mentisintherangeof6.5to7.6(McCarty,1964a).IfthepHdropsbelow6.3orincreasesbeyond7.8,therateofmethanogenicactivityreducessignificantly.AsharppHdropbelow6.3indicatesthattherateoforganicacidsproductionisfasterthantherateofmethanefor-mation.Forreactorstreatingawastewaterwithahighconcentrationofprotein,thebufferingeffectofammoniareleasedfromaminoacidfermentationcanpreventthepHfromdroppingbelowtheoptimumrange.Ontheotherhand,asharppHincreaseabove7.8canbeduetoashift inNH4
+toNH3,thetoxic,un-ionizedformofammonia(Gomecetal.,2002).Bufferscanalsobeaddedintheformofbicar-bonatesorhydroxidestomaintainpH.
3.Nutrients—Nitrogen and phosphorus are the two major nutrientsrequiredformicrobialgrowthandreproduction.Inaddition,sulfur,iron,cobalt,nickel,calcium,andsometracemetalsarenecessaryforgrowthofmethanogens.Sulfideisrequiredbymethanogens,eventhoughitmayadverselyaffectmethaneproductionbyprecipitatingessentialtracemet-als.Itistoxicatconcentrationsabove100to150mg/Lofun-ionizedhydrogensulfide(Speece,1983).Molybdenum,selenium,andtungstenhavealsobeenreportedastracemetalsusedbymethanogens.
4.Toxic materials—Themethanogensarecommonlyconsideredtobethemostsensitivetotoxicityamongallthemicroorganismsinvolvedin anaerobic conversion of organic matter to methane. However,acclimation to toxicity and reversibility of toxicity are frequentlyobserved.Whetherasubstanceistoxictoabiologicalsystemdependsonthenatureof thesubstance, itsconcentration,andthepotentialforacclimation.Changes in theconcentrationof thesubstancecanchange the classificationof the substance from toxic tobiodegrad-able.Table 11.2presents a summaryof concentrationsofdifferentcationsatwhichtheyarereportedtobestimulatoryorinhibitorytotheanaerobicprocess(McCarty,1964c).
Controloftoxicantsisvitaltothesuccessfuloperationofananaer-obicprocess.Toxicitymaybecontrolledby(1)dilutiontoreducecon-centration below the toxic threshold, (2) removal of toxic materialfromthefeed,(3)removalbychemicalprecipitation,(4)neutraliza-tion,or(5)acclimation.
11.6 METHANE GAS PRODUCTION
11.6.1 Stoichiometry
Asignificantfractionofthechemicaloxygendemand(COD)removedinananaerobicprocessisconvertedtomethane.Sothemethanegasproduction
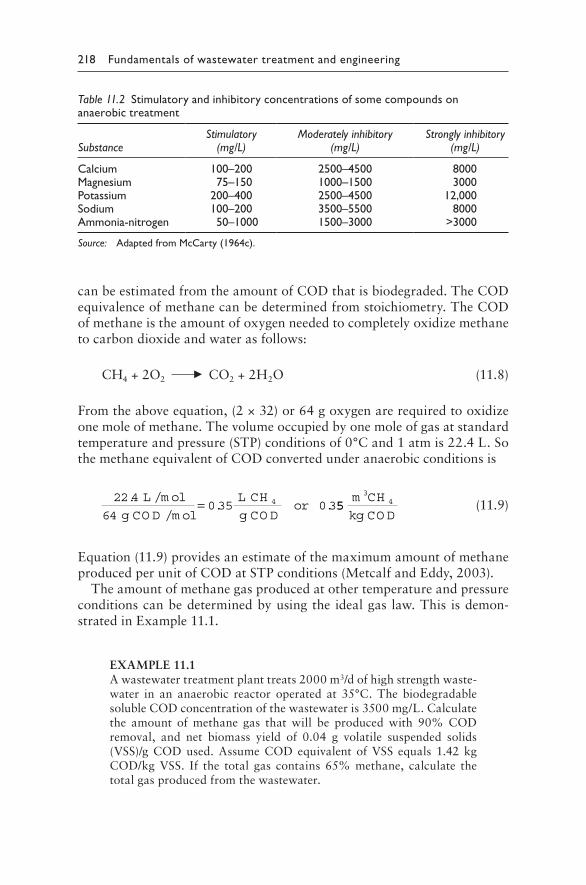
218 Fundamentals of wastewater treatment and engineering
canbeestimatedfromtheamountofCODthatisbiodegraded.TheCODequivalenceofmethanecanbedeterminedfromstoichiometry.TheCODofmethaneistheamountofoxygenneededtocompletelyoxidizemethanetocarbondioxideandwaterasfollows:
CH4+2O2___▶ CO2+2H2O (11.8)
Fromtheaboveequation,(2×32)or64goxygenarerequiredtooxidizeonemoleofmethane.Thevolumeoccupiedbyonemoleofgasatstandardtemperatureandpressure(STP)conditionsof0°Cand1atmis22.4L.SothemethaneequivalentofCODconvertedunderanaerobicconditionsis
22 4
640 35 0 34. /
/. .
L m ol
g CO D m ol
L CH
g CO Dor= 55
34m CH
kg CO D (11.9)
Equation(11.9)providesanestimateofthemaximumamountofmethaneproducedperunitofCODatSTPconditions(MetcalfandEddy,2003).
Theamountofmethanegasproducedatothertemperatureandpressureconditionscanbedeterminedbyusingthe idealgas law.This isdemon-stratedinExample11.1.
EXAMPLE11.1Awastewatertreatmentplanttreats2000m3/dofhighstrengthwaste-water in an anaerobic reactor operated at 35°C. The biodegradablesolubleCODconcentrationofthewastewateris3500mg/L.Calculatethe amount of methane gas that will be produced with 90% CODremoval, and net biomass yield of 0.04 g volatile suspended solids(VSS)/gCODused.AssumeCODequivalent ofVSS equals 1.42kgCOD/kg VSS. If the total gas contains 65% methane, calculate thetotalgasproducedfromthewastewater.
Table 11.2 Stimulatory and inhibitory concentrations of some compounds on anaerobic treatment
SubstanceStimulatory
(mg/L)Moderately inhibitory
(mg/L)Strongly inhibitory
(mg/L)
CalciumMagnesiumPotassiumSodiumAmmonia-nitrogen
100–200 75–150200–400100–200
50–1000
2500–45001000–15002500–45003500–55001500–3000
80003000
12,0008000
>3000
Source: Adapted from McCarty (1964c).
Anaerobic wastewater treatment 219
SOLUTION
Step1.ConductasteadystatemassbalancefortheCODintheanaer-obicreactor.
Accum ulation = Influent
CO D–Effluent
CO D–CO D connverted
to new cells–CO D converted
to m ethanee
(11.10)or
0=CODin–CODout–CODVSS–CODmethane (11.11)
CODin=2000m3/d×3.5kg/m3=7000kg/d
CODout=(1–0.9)7000kg/d=700kg/d
CODVSS=0.9×7000kgCOD/d×0.04kgVSS/kgCOD ×1.42kgCOD/kgVSS
=357.84kg/d
Usingthesevaluesinequation(11.11),weobtain
0=7000kg/d–700kg/d–357.84kg/d–CODmethane
or
CODmethane=5942.16kg/d
Step2.Determinevolume(V)occupiedby1moleofmethanegasat35°C.Fromtheidealgaslawwehave,
VnRT
P= (11.12)
where:n=numberofmolesR=idealgasconstant=0.082057atm·L/mole·KT=temperature,KP =pressure,atm
Here,T=273+35=308K.
n=1mol,andP=1atm
Therefore, Vm ol atm
L
m olK K
atm=
× ×=
. · ·.
1 0 082057 308
125 227 L
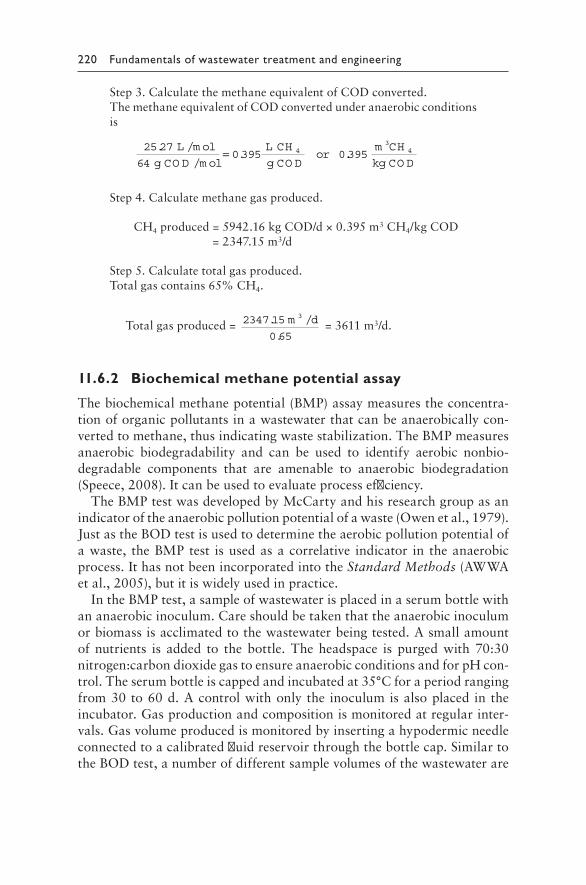
220 Fundamentals of wastewater treatment and engineering
Step3.CalculatethemethaneequivalentofCODconverted.ThemethaneequivalentofCODconvertedunderanaerobicconditionsis
25 27
640 395 04. /
/.
L m ol
g CO D m ol
L CH
g CO Dor= ..395
34m CH
kg CO D
Step4.Calculatemethanegasproduced.
CH4produced=5942.16kgCOD/d×0.395m3CH4/kgCOD =2347.15m3/d
Step5.Calculatetotalgasproduced.Totalgascontains65%CH4.
Totalgasproduced= 2347 150 65
3. /
.
m d =3611m3/d.
11.6.2 Biochemical methane potential assay
Thebiochemicalmethanepotential(BMP)assaymeasurestheconcentra-tionoforganicpollutantsinawastewaterthatcanbeanaerobicallycon-vertedtomethane,thusindicatingwastestabilization.TheBMPmeasuresanaerobic biodegradability and can be used to identify aerobic nonbio-degradable components that are amenable to anaerobic biodegradation(Speece,2008).Itcanbeusedtoevaluateprocessefficiency.
TheBMPtestwasdevelopedbyMcCartyandhisresearchgroupasanindicatoroftheanaerobicpollutionpotentialofawaste(Owenetal.,1979).JustastheBODtestisusedtodeterminetheaerobicpollutionpotentialofawaste, theBMPtest isusedasacorrelative indicator in theanaerobicprocess.IthasnotbeenincorporatedintotheStandard Methods(AWWAetal.,2005),butitiswidelyusedinpractice.
IntheBMPtest,asampleofwastewaterisplacedinaserumbottlewithananaerobicinoculum.Careshouldbetakenthattheanaerobicinoculumorbiomassisacclimatedtothewastewaterbeingtested.Asmallamountof nutrients is added to the bottle.Theheadspace is purgedwith70:30nitrogen:carbondioxidegastoensureanaerobicconditionsandforpHcon-trol.Theserumbottleiscappedandincubatedat35°Cforaperiodrangingfrom30to60d.Acontrolwithonlythe inoculumisalsoplaced intheincubator.Gasproductionandcompositionismonitoredatregularinter-vals.Gasvolumeproducedismonitoredbyinsertingahypodermicneedleconnectedtoacalibratedfluidreservoirthroughthebottlecap.SimilartotheBODtest,anumberofdifferentsamplevolumesofthewastewaterare
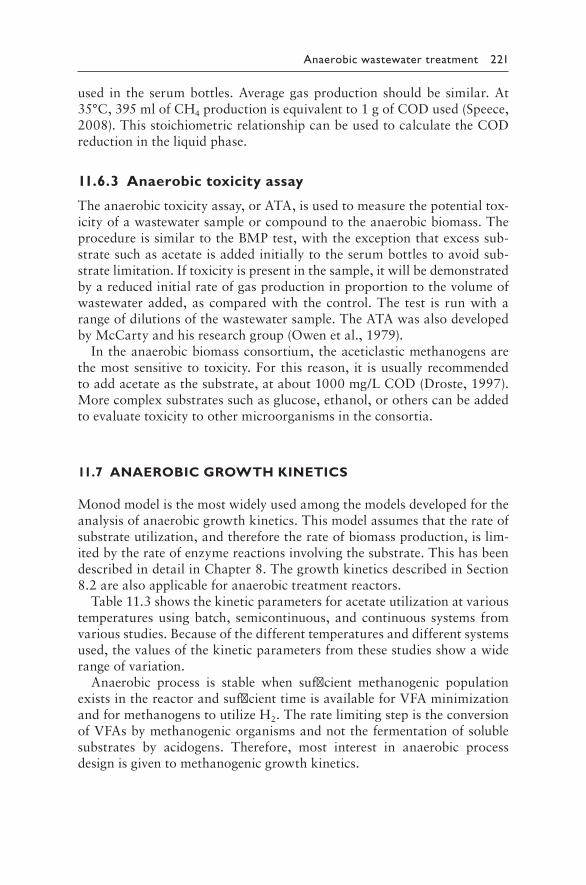
Anaerobic wastewater treatment 221
used in the serumbottles.Averagegasproduction shouldbe similar.At35°C,395mlofCH4productionisequivalentto1gofCODused(Speece,2008).ThisstoichiometricrelationshipcanbeusedtocalculatetheCODreductionintheliquidphase.
11.6.3 Anaerobic toxicity assay
Theanaerobictoxicityassay,orATA,isusedtomeasurethepotentialtox-icityofawastewatersampleorcompoundtotheanaerobicbiomass.TheprocedureissimilartotheBMPtest,withtheexceptionthatexcesssub-stratesuchasacetateisaddedinitiallytotheserumbottlestoavoidsub-stratelimitation.Iftoxicityispresentinthesample,itwillbedemonstratedbyareducedinitialrateofgasproductioninproportiontothevolumeofwastewateradded,as comparedwith thecontrol.The test is runwitharangeofdilutionsofthewastewatersample.TheATAwasalsodevelopedbyMcCartyandhisresearchgroup(Owenetal.,1979).
Intheanaerobicbiomassconsortium,theaceticlasticmethanogensarethemostsensitivetotoxicity.Forthisreason, it isusuallyrecommendedtoaddacetateasthesubstrate,atabout1000mg/LCOD(Droste,1997).Morecomplexsubstratessuchasglucose,ethanol,orotherscanbeaddedtoevaluatetoxicitytoothermicroorganismsintheconsortia.
11.7 ANAEROBIC GROWTH KINETICS
Monodmodelisthemostwidelyusedamongthemodelsdevelopedfortheanalysisofanaerobicgrowthkinetics.Thismodelassumesthattherateofsubstrateutilization,andthereforetherateofbiomassproduction,islim-itedbytherateofenzymereactionsinvolvingthesubstrate.ThishasbeendescribedindetailinChapter8.ThegrowthkineticsdescribedinSection8.2arealsoapplicableforanaerobictreatmentreactors.
Table 11.3showsthekineticparametersforacetateutilizationatvarioustemperaturesusingbatch, semicontinuous,andcontinuous systems fromvariousstudies.Becauseofthedifferenttemperaturesanddifferentsystemsused,thevaluesofthekineticparametersfromthesestudiesshowawiderangeofvariation.
Anaerobic process is stable when sufficient methanogenic populationexistsinthereactorandsufficienttimeisavailableforVFAminimizationandformethanogenstoutilizeH2.TheratelimitingstepistheconversionofVFAsbymethanogenicorganismsandnotthefermentationofsolublesubstrates by acidogens. Therefore, most interest in anaerobic processdesignisgiventomethanogenicgrowthkinetics.
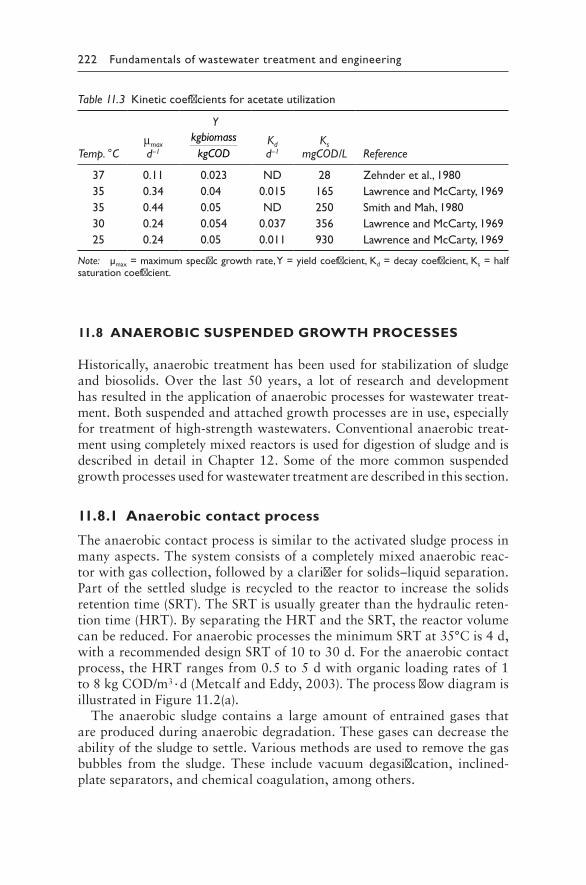
222 Fundamentals of wastewater treatment and engineering
11.8 ANAEROBIC SUSPENDED GROWTH PROCESSES
Historically,anaerobictreatmenthasbeenusedforstabilizationofsludgeandbiosolids.Over the last 50 years, a lot of research anddevelopmenthasresultedintheapplicationofanaerobicprocessesforwastewatertreat-ment.Bothsuspendedandattachedgrowthprocessesareinuse,especiallyfortreatmentofhigh-strengthwastewaters.Conventionalanaerobictreat-mentusingcompletelymixedreactorsisusedfordigestionofsludgeandisdescribed indetail inChapter12.Someof themorecommonsuspendedgrowthprocessesusedforwastewatertreatmentaredescribedinthissection.
11.8.1 Anaerobic contact process
Theanaerobiccontactprocessissimilartotheactivatedsludgeprocessinmanyaspects.Thesystemconsistsofacompletelymixedanaerobicreac-torwithgascollection,followedbyaclarifierforsolids–liquidseparation.Partof the settledsludge is recycled to the reactor to increase the solidsretentiontime(SRT).TheSRTisusuallygreaterthanthehydraulicreten-tiontime(HRT).ByseparatingtheHRTandtheSRT,thereactorvolumecanbereduced.ForanaerobicprocessestheminimumSRTat35°Cis4d,witharecommendeddesignSRTof10to30d.Fortheanaerobiccontactprocess,theHRTrangesfrom0.5to5dwithorganicloadingratesof1to8kgCOD/m3·d(MetcalfandEddy,2003).TheprocessflowdiagramisillustratedinFigure 11.2(a).
Theanaerobic sludge contains a large amountof entrainedgases thatareproducedduringanaerobicdegradation.Thesegasescandecreasetheabilityofthesludgetosettle.Variousmethodsareusedtoremovethegasbubbles from the sludge. These include vacuum degasification, inclined-plateseparators,andchemicalcoagulation,amongothers.
Table 11.3 Kinetic coefficients for acetate utilization
Temp. °Cμmax d–1
YkgbiomasskgCOD
Kdd–1
KsmgCOD/L Reference
37 0.11 0.023 ND 28 Zehnder et al., 198035 0.34 0.04 0.015 165 Lawrence and McCarty, 196935 0.44 0.05 ND 250 Smith and Mah, 198030 0.24 0.054 0.037 356 Lawrence and McCarty, 196925 0.24 0.05 0.011 930 Lawrence and McCarty, 1969
Note: µmax = maximum specific growth rate, Y = yield coefficient, Kd = decay coefficient, Ks = half saturation coefficient.
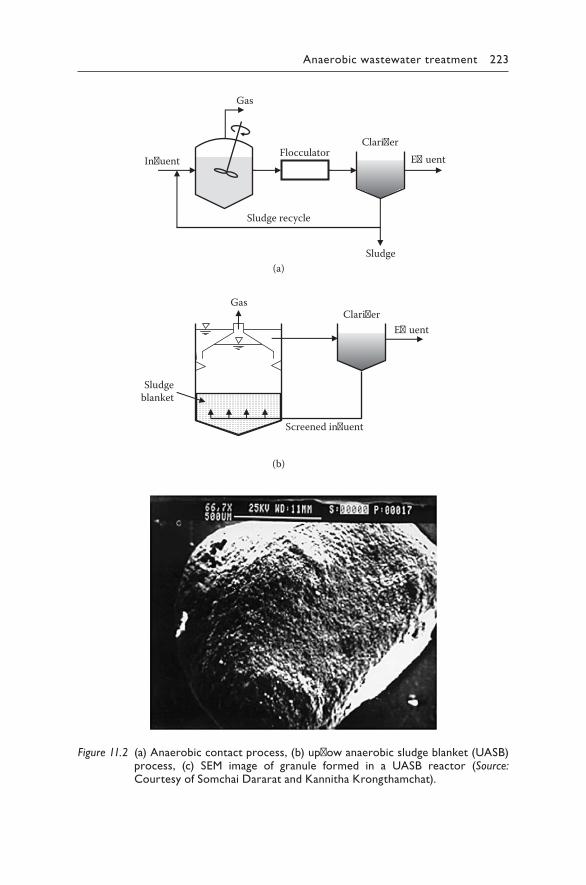
Anaerobic wastewater treatment 223
(a)
(b)
E�uentClari�er
Screened in�uent
Gas
Sludgeblanket
E�uentFlocculatorClari�er
Gas
In�uent
Sludge
Sludge recycle
Figure 11.2 (a) Anaerobic contact process, (b) upflow anaerobic sludge blanket (UASB) process, (c) SEM image of granule formed in a UASB reactor (Source: Courtesy of Somchai Dararat and Kannitha Krongthamchat).
224 Fundamentals of wastewater treatment and engineering
11.8.2 Upflow anaerobic sludge blanket process
Theupflowanaerobicsludgeblanket(UASB)processwasdevelopedinTheNetherlandsbyLettingaandco-workers(Lettingaetal.,1980).Thiswasoneofthemostimportantdevelopmentsofanaerobictechnologyfortreat-mentofhigh-strengthwastewaters.Morethan500installationsarelocatedallovertheworldandtreatawiderangeofindustrialwastewaters(MetcalfandEddy,2003).
TheUASBprocessisillustratedinFigure 11.2(b).Thewastewaterentersthereactoratthebottomandisdistributedupwardthroughasludgeblan-ket.Organicmatterisdegradedinthesludgeblanket,afterwhichtheliq-uideffluentisdischargedatthetop.Gasproductionandevolutionprovidesufficientmixinginthesludgeblanket.Aquiescentzoneabovethesludgeblanketisprovidedforsolidssettling.Theliquideffluentispassedthrougha settling tank to collect solids thathave escaped from the reactor.Thecollectedsolidsarerecycledbacktothereactor.Criticaldesignelementsincludetheinfluentdistributionsystem,gas–solidsseparator,andeffluentwithdrawalsystem.
ThemaincharacteristicoftheUASBprocessistheformationofadensegranularsludge.Thesolidsconcentrationcanrangefrom50to100g/Lat the reactorbottom, to5 to40g/Lat the topof the sludgeblanket.Severalmonthsmayberequiredtoformthegranules,andseedisoftensupplied from other installations to accelerate the process. It was sug-gested that the UASB system promoted a selection between the sludgeingredients,suchthatlighterparticleswerewashedoutandheavierpar-ticleswereretained.Growthwasconcentratedontheseparticles,whichresultedintheformationofgranulesupto5mmindiameter(HulshoffPoletal.,1983).AtypicalgranuleisillustratedinFigure 11.2(c).Mostoftheorganismsgrowonthesurfaceandintheintersticesofthegran-ules,while thecoremaycontain inert extracellularmaterial.A symbi-oticrelationshipexistsbetweenthemicrobialconsortiaassociatedwithgranular sludge particles that is advantageous in enhancing biologicalactivity.Veryhigh specificactivitieshavebeenobserved, ranging from2.2to2.3kgCOD/kgVSS·d.McCartyandSmith(1986)reportedthatreactorswithgranularsludgeproducedlowerhydrogenpartialpressuresandmorerapidhydrogenutilizationthanreactorswithdispersedsludge,resulting in increased efficiency. Granule development is influenced bywastewatercharacteristics,reactorgeometry,upflowvelocity,HRT,andorganicloadingrates.TheseareallimportantdesignconsiderationsfortheUASBprocess.
Volumetricloadingratescanvaryfrom0.5to40kg/m3·d(0.03–2.5lb/ft3·d) foraUASBprocess (Droste,1997).TheHRTcanvary from6 to14 h.Upflowvelocitiesrangefrom0.8to3.0m/h,dependingonthetypeofwastewaterandreactorheight.
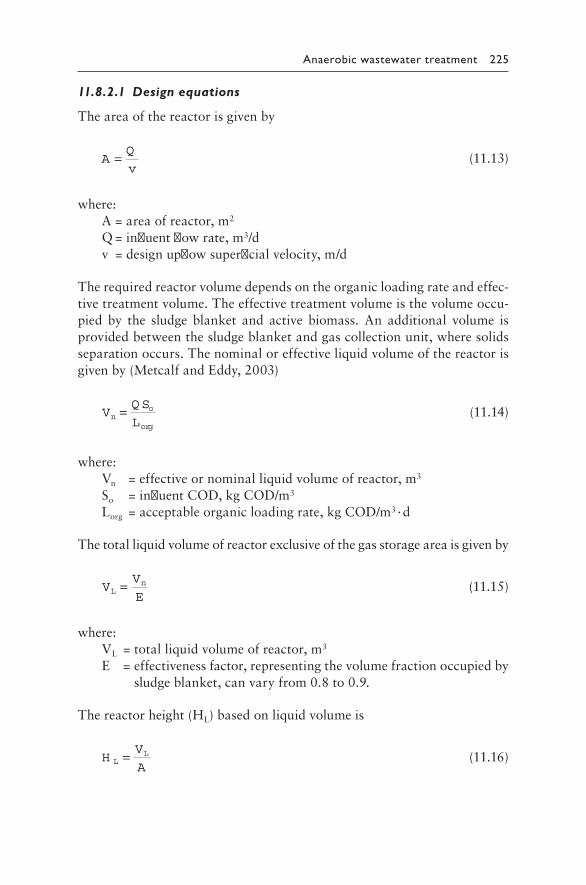
Anaerobic wastewater treatment 225
11.8.2.1 Design equations
Theareaofthereactorisgivenby
AQ
v= (11.13)
where:A=areaofreactor,m2
Q=influentflowrate,m3/dv=designupflowsuperficialvelocity,m/d
Therequiredreactorvolumedependsontheorganicloadingrateandeffec-tivetreatmentvolume.Theeffectivetreatmentvolumeisthevolumeoccu-pied by the sludge blanket and active biomass. An additional volume isprovidedbetweenthesludgeblanketandgascollectionunit,wheresolidsseparationoccurs.Thenominaloreffectiveliquidvolumeofthereactorisgivenby(MetcalfandEddy,2003)
VQ S
Ln
o
org
= (11.14)
where:Vn=effectiveornominalliquidvolumeofreactor,m3
So=influentCOD,kgCOD/m3
Lorg=acceptableorganicloadingrate,kgCOD/m3·d
Thetotalliquidvolumeofreactorexclusiveofthegasstorageareaisgivenby
VV
EL
n= (11.15)
where:VL=totalliquidvolumeofreactor,m3
E=effectivenessfactor,representingthevolumefractionoccupiedbysludgeblanket,canvaryfrom0.8to0.9.
Thereactorheight(HL)basedonliquidvolumeis
HV
AL
L= (11.16)
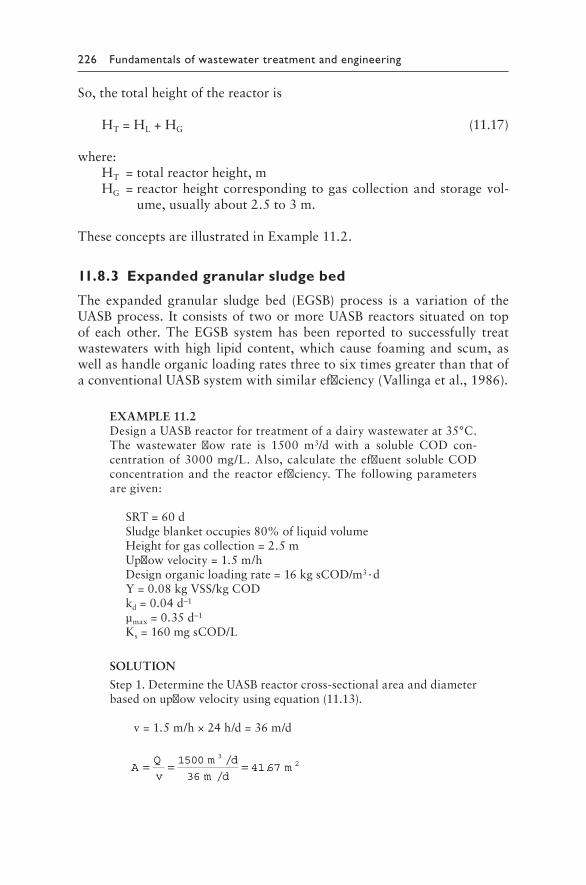
226 Fundamentals of wastewater treatment and engineering
So,thetotalheightofthereactoris
HT=HL+HG (11.17)
where:HT=totalreactorheight,mHG=reactorheightcorresponding togascollectionandstoragevol-
ume,usuallyabout2.5to3m.
TheseconceptsareillustratedinExample11.2.
11.8.3 Expanded granular sludge bed
The expanded granular sludge bed (EGSB) process is a variation of theUASBprocess. Itconsistsof twoormoreUASBreactorssituatedontopof each other. The EGSB system has been reported to successfully treatwastewaterswithhigh lipid content,which cause foamingand scum,aswellashandleorganicloadingratesthreetosixtimesgreaterthanthatofaconventionalUASBsystemwithsimilarefficiency(Vallingaetal.,1986).
EXAMPLE11.2DesignaUASBreactorfortreatmentofadairywastewaterat35°C.The wastewater flow rate is 1500 m3/d with a soluble COD con-centrationof3000mg/L.Also,calculate theeffluentsolubleCODconcentrationandthereactorefficiency.The followingparametersaregiven:
SRT=60dSludgeblanketoccupies80%ofliquidvolumeHeightforgascollection=2.5mUpflowvelocity=1.5m/hDesignorganicloadingrate=16kgsCOD/m3·dY=0.08kgVSS/kgCODkd=0.04d–1
µmax=0.35d–1
Ks=160mgsCOD/L
SOLUTION
Step1.DeterminetheUASBreactorcross-sectionalareaanddiameterbasedonupflowvelocityusingequation(11.13).
v=1.5m/h×24h/d=36m/d
AQ
v
m d
m dm= = =1500
3641 67
32/
/.
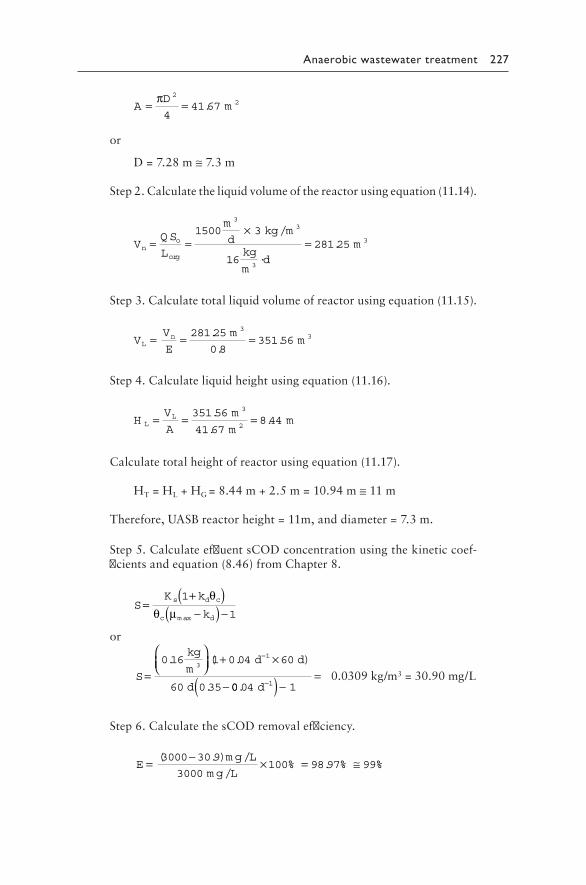
Anaerobic wastewater treatment 227
AD
m= =π 22
441 67.
or
D=7.28m≅7.3m
Step2.Calculatetheliquidvolumeofthereactorusingequation(11.14).
VQ S
L
m
dkg m
kg
md
no
org
= =×
=1500 3
16281 25
33
3
/
·. m 3
Step3.Calculatetotalliquidvolumeofreactorusingequation(11.15).
VV
E
mmL
n= = =.
..
281 25
0 8351 56
33
Step4.Calculateliquidheightusingequation(11.16).
HV
A
m
mmL
L= = =351 56
41 678 44
3
2
.
..
Calculatetotalheightofreactorusingequation(11.17).
HT=HL+HG=8.44m+2.5m=10.94m≅11m
Therefore,UASBreactorheight=11m,anddiameter=7.3m.
Step5.CalculateeffluentsCODconcentrationusingthekineticcoef-ficientsandequation(8.46)fromChapter8.
SK k
k
s d c
c d
=+( )−( ) −
1
1
θθ µm ax
or
S
kg
md d
d=
+ ×
−
−0 16 1 0 04 60
60 0 35
31. ( . )
. 00 04 11. d−( ) −=
0.0309kg/m3=30.90mg/L
Step6.CalculatethesCODremovalefficiency.
Em g L
m g L= − × = ≅( .) /
/% . % %
3000 30 9
3000100 98 97 99
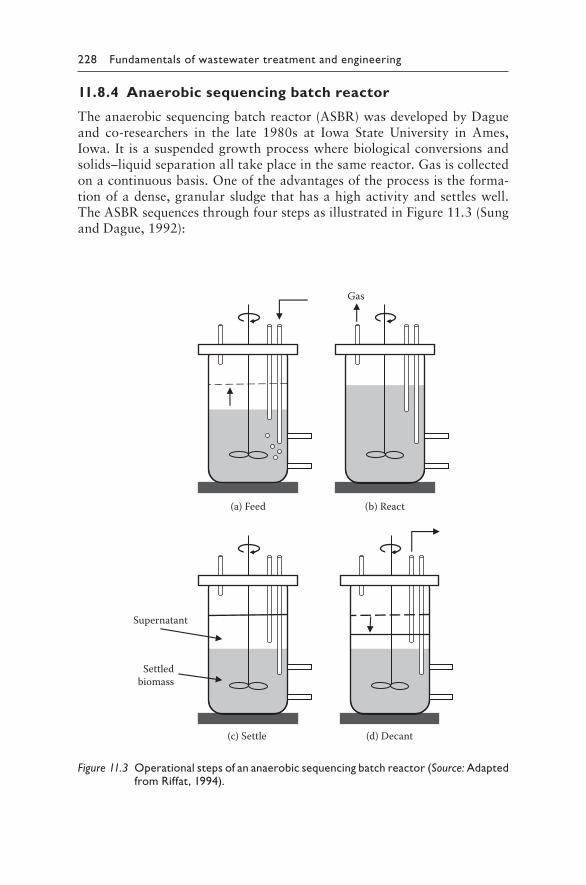
228 Fundamentals of wastewater treatment and engineering
11.8.4 Anaerobic sequencing batch reactor
Theanaerobicsequencingbatchreactor(ASBR)wasdevelopedbyDagueand co-researchers in the late 1980s at Iowa State University in Ames,Iowa.It isasuspendedgrowthprocesswherebiologicalconversionsandsolids–liquidseparationalltakeplaceinthesamereactor.Gasiscollectedonacontinuousbasis.Oneoftheadvantagesoftheprocessistheforma-tionofadense,granularsludgethathasahighactivityandsettleswell.TheASBRsequencesthroughfourstepsasillustratedinFigure 11.3(SungandDague,1992):
Gas
Supernatant
Settledbiomass
(a) Feed (b) React
(c) Settle (d) Decant
Figure 11.3 Operational steps of an anaerobic sequencing batch reactor (Source: Adapted from Riffat, 1994).
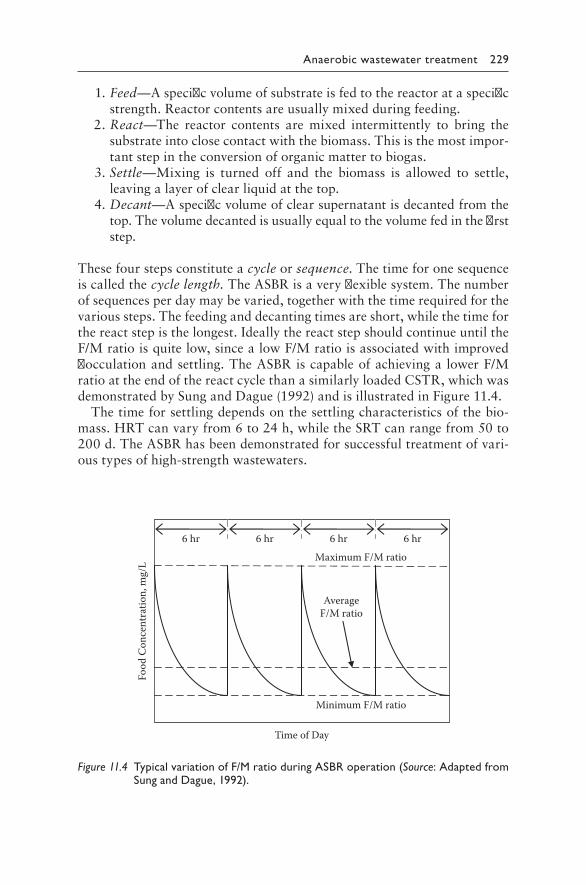
Anaerobic wastewater treatment 229
1.Feed—Aspecificvolumeofsubstrateisfedtothereactorataspecificstrength.Reactorcontentsareusuallymixedduringfeeding.
2.React—The reactor contents are mixed intermittently to bring thesubstrateintoclosecontactwiththebiomass.Thisisthemostimpor-tantstepintheconversionoforganicmattertobiogas.
3.Settle—Mixing is turned off and the biomass is allowed to settle,leavingalayerofclearliquidatthetop.
4.Decant—Aspecificvolumeofclearsupernatantisdecantedfromthetop.Thevolumedecantedisusuallyequaltothevolumefedinthefirststep.
Thesefourstepsconstituteacycleorsequence.Thetimeforonesequenceiscalledthecycle length. TheASBRisaveryflexiblesystem.Thenumberofsequencesperdaymaybevaried,togetherwiththetimerequiredforthevarioussteps.Thefeedinganddecantingtimesareshort,whilethetimeforthereactstepisthelongest.IdeallythereactstepshouldcontinueuntiltheF/Mratioisquitelow,sincealowF/Mratioisassociatedwithimprovedflocculationandsettling.TheASBRiscapableofachievinga lowerF/MratioattheendofthereactcyclethanasimilarlyloadedCSTR,whichwasdemonstratedbySungandDague(1992)andisillustratedinFigure 11.4.
Thetimeforsettlingdependsonthesettlingcharacteristicsofthebio-mass.HRTcanvaryfrom6to24h,whiletheSRTcanrangefrom50to200d.TheASBRhasbeendemonstratedforsuccessfultreatmentofvari-oustypesofhigh-strengthwastewaters.
6 hr 6 hr 6 hr 6 hr
Time of Day
Food
Con
cent
ratio
n, m
g/L
Minimum F/M ratio
Maximum F/M ratio
AverageF/M ratio
Figure 11.4 Typical variation of F/M ratio during ASBR operation (Source: Adapted from Sung and Dague, 1992).
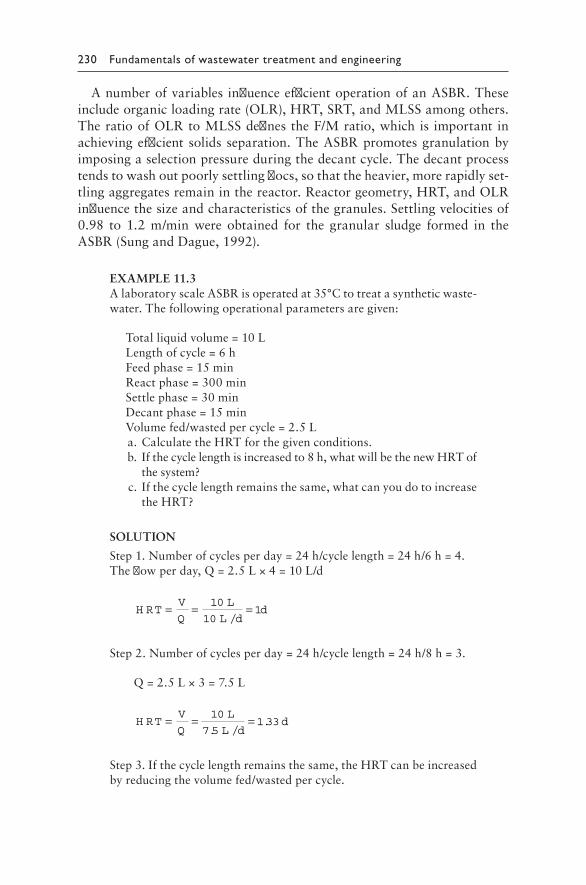
230 Fundamentals of wastewater treatment and engineering
AnumberofvariablesinfluenceefficientoperationofanASBR.Theseincludeorganicloadingrate(OLR),HRT,SRT,andMLSSamongothers.TheratioofOLRtoMLSSdefinestheF/Mratio,whichis important inachievingefficient solids separation.TheASBRpromotesgranulationbyimposingaselectionpressureduringthedecantcycle.Thedecantprocesstendstowashoutpoorlysettlingflocs,sothattheheavier,morerapidlyset-tlingaggregatesremaininthereactor.Reactorgeometry,HRT,andOLRinfluencethesizeandcharacteristicsofthegranules.Settlingvelocitiesof0.98 to 1.2 m/min were obtained for the granular sludge formed in theASBR(SungandDague,1992).
EXAMPLE11.3AlaboratoryscaleASBRisoperatedat35°Ctotreatasyntheticwaste-water.Thefollowingoperationalparametersaregiven:
Totalliquidvolume=10LLengthofcycle=6hFeedphase=15minReactphase=300minSettlephase=30minDecantphase=15minVolumefed/wastedpercycle=2.5L
a.CalculatetheHRTforthegivenconditions. b. Ifthecyclelengthisincreasedto8h,whatwillbethenewHRTof
thesystem? c. Ifthecyclelengthremainsthesame,whatcanyoudotoincrease
theHRT?
SOLUTION
Step1.Numberofcyclesperday=24h/cyclelength=24h/6h=4.Theflowperday,Q=2.5L×4=10L/d
H RT
V
Q
L
L dd= = =
/
10
101
Step2.Numberofcyclesperday=24h/cyclelength=24h/8h=3.
Q=2.5L×3=7.5L
H RTV
Q
L
L dd= = =
. /.
10
7 51 33
Step3.Ifthecyclelengthremainsthesame,theHRTcanbeincreasedbyreducingthevolumefed/wastedpercycle.
Anaerobic wastewater treatment 231
11.8.5 Anaerobic migrating blanket reactor
The anaerobic migrating blanket reactor (AMBR) consists of a numberof compartments separated by over and under baffles, as illustrated inFigure 11.5. Mixing is provided in each compartment as the wastewaterflowsthrough.Thesludgeblanketineachcompartmentrisesandfallswithgasproductionandflow,andalsomovesthroughthereactorataslowrate.Aftersometimeofoperation,theinfluentfeedportischangedtotheeffluentport,andviceversa.Thishelpstomaintainauniformsludgeblanketacrossthereactor.Usuallytheflowisreversedwhenalargequantityofsolidsaccu-mulatesinthelastcompartment.TheAMBRwasdemonstratedtoachievehighCODremovalefficienciesat lowtemperaturesof15°Cand20°C inbenchscaletestswithnonfatdrymilksubstrate(Angenentetal.,2000).
11.9 ANAEROBIC ATTACHED GROWTH PROCESSES
Similartotheaerobicprocess,amediaisusedinthisprocessthatthebac-teriaareallowedtoattachtoandgrowon.Anaerobicconditionsaremain-tainedinthereactorforconversionoforganicmattertomethaneandothergases.Examplesincludeanaerobicfilterorfixed-filmreactorandanaerobicrotatingbiologicalcontactor(RBC),amongothers.
11.9.1 Anaerobic filter
Ananaerobicfilterisacolumnorreactorpackedwithhighlyporousmaterial/medium.Thewastewaterusuallypassesthroughthereactorwithverticalflow,eitherupflowordownflow(Figure 11.6).Themicroorganismsinthereactorattachtotheporousinertmediumorbecomeentrapped.Theeffluentgasflowsupwardthroughthesupportmediaandthegasproducediscollectedatthetop.Anaerobicfiltersarealsoknownasfixed-film reactorsorpacked bed reactors.
Gas
E�uentE�uent
(�ow reversed)
In�uent(�ow reversed)In�uent
Figure 11.5 Anaerobic migrating blanket reactor (AMBR).
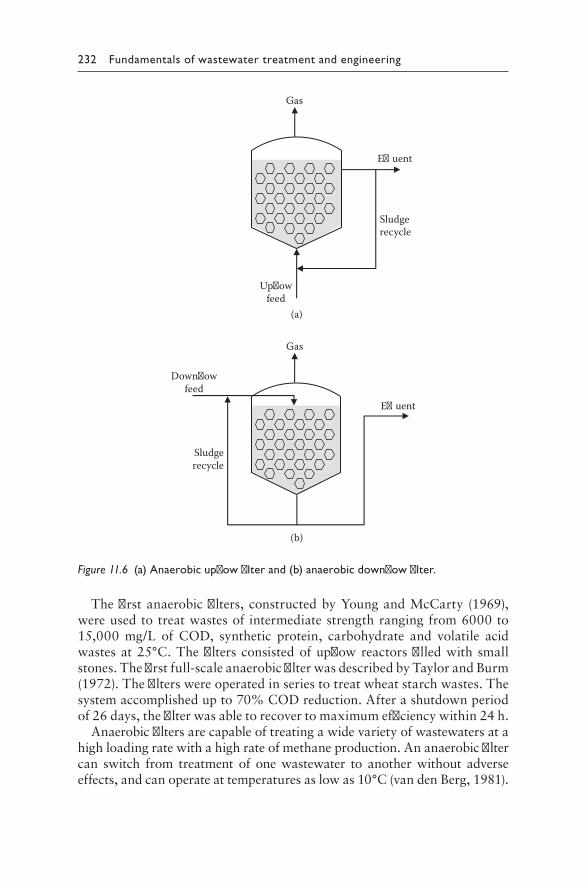
232 Fundamentals of wastewater treatment and engineering
Thefirstanaerobicfilters,constructedbyYoungandMcCarty (1969),wereusedtotreatwastesof intermediatestrengthrangingfrom6000to15,000 mg/L of COD, synthetic protein, carbohydrate and volatile acidwastesat25°C.Thefiltersconsistedofupflowreactorsfilledwithsmallstones.Thefirstfull-scaleanaerobicfilterwasdescribedbyTaylorandBurm(1972).Thefilterswereoperatedinseriestotreatwheatstarchwastes.Thesystemaccomplishedupto70%CODreduction.Afterashutdownperiodof26days,thefilterwasabletorecovertomaximumefficiencywithin24h.
Anaerobicfiltersarecapableoftreatingawidevarietyofwastewatersatahighloadingratewithahighrateofmethaneproduction.Ananaerobicfiltercan switch from treatmentof onewastewater to anotherwithout adverseeffects,andcanoperateattemperaturesaslowas10°C(vandenBerg,1981).
(a)
(b)
Gas
E�uent
Down�owfeed
Sludgerecycle
Gas
E�uent
Up�owfeed
Sludgerecycle
Figure 11.6 (a) Anaerobic upflow filter and (b) anaerobic downflow filter.
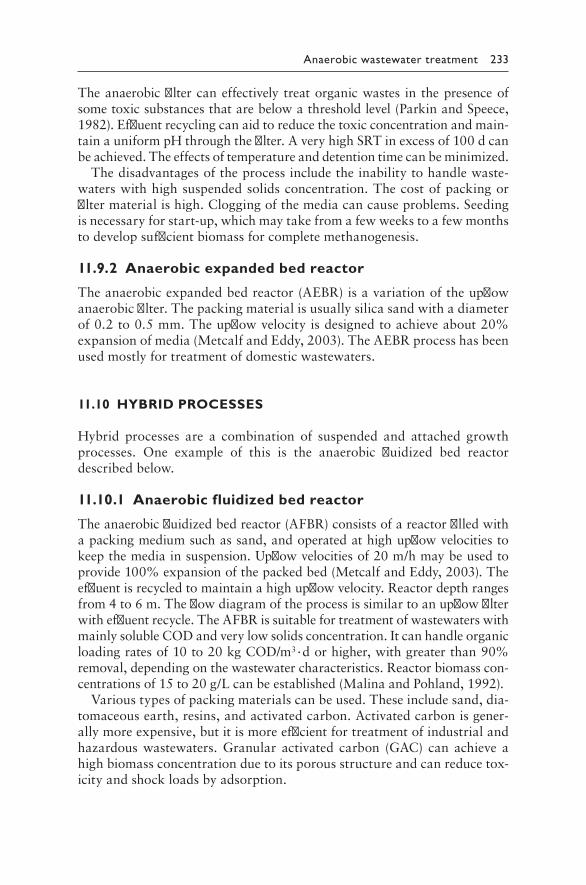
Anaerobic wastewater treatment 233
Theanaerobicfiltercaneffectively treatorganicwastes in thepresenceofsometoxicsubstancesthatarebelowathresholdlevel(ParkinandSpeece,1982).Effluentrecyclingcanaidtoreducethetoxicconcentrationandmain-tainauniformpHthroughthefilter.AveryhighSRTinexcessof100dcanbeachieved.Theeffectsoftemperatureanddetentiontimecanbeminimized.
Thedisadvantagesoftheprocessincludetheinabilitytohandlewaste-waterswithhighsuspendedsolidsconcentration.Thecostofpackingorfiltermaterialishigh.Cloggingofthemediacancauseproblems.Seedingisnecessaryforstart-up,whichmaytakefromafewweekstoafewmonthstodevelopsufficientbiomassforcompletemethanogenesis.
11.9.2 Anaerobic expanded bed reactor
Theanaerobicexpandedbedreactor(AEBR)isavariationoftheupflowanaerobicfilter.Thepackingmaterialisusuallysilicasandwithadiameterof0.2to0.5mm.Theupflowvelocityisdesignedtoachieveabout20%expansionofmedia(MetcalfandEddy,2003).TheAEBRprocesshasbeenusedmostlyfortreatmentofdomesticwastewaters.
11.10 HYBRID PROCESSES
Hybrid processes are a combination of suspended and attached growthprocesses. One example of this is the anaerobic fluidized bed reactordescribedbelow.
11.10.1 Anaerobic fluidized bed reactor
Theanaerobicfluidizedbedreactor(AFBR)consistsofareactorfilledwithapackingmediumsuchassand,andoperatedathighupflowvelocitiestokeepthemediainsuspension.Upflowvelocitiesof20m/hmaybeusedtoprovide100%expansionofthepackedbed(MetcalfandEddy,2003).Theeffluentisrecycledtomaintainahighupflowvelocity.Reactordepthrangesfrom4to6m.Theflowdiagramoftheprocessissimilartoanupflowfilterwitheffluentrecycle.TheAFBRissuitablefortreatmentofwastewaterswithmainlysolubleCODandverylowsolidsconcentration.Itcanhandleorganicloadingratesof10to20kgCOD/m3·dorhigher,withgreaterthan90%removal,dependingonthewastewatercharacteristics.Reactorbiomasscon-centrationsof15to20g/Lcanbeestablished(MalinaandPohland,1992).
Varioustypesofpackingmaterialscanbeused.Theseincludesand,dia-tomaceousearth,resins,andactivatedcarbon.Activatedcarbonisgener-allymoreexpensive,butitismoreefficientfortreatmentofindustrialandhazardouswastewaters.Granular activated carbon (GAC) can achieve ahighbiomassconcentrationduetoitsporousstructureandcanreducetox-icityandshockloadsbyadsorption.
234 Fundamentals of wastewater treatment and engineering
11.10.2 Anaerobic membrane bioreactorTheanaerobicmembranebioreactorsystemconsistsofananaerobicbiore-actorcoupledwithamembraneseparationunit.Theeffluentfromthebio-reactorpassesthroughthemembraneunit,wheresolids–liquidseparationtakesplace.Theliquideffluentorpermeateisdischarged,whilethesolids(concentrate)are recycledback to the reactor.ThemembranebioreactorprocessisillustratedinFigure 11.7.
Themajoradvantagesoftheanaerobicmembranebioreactorprocessare(1)high-qualityeffluentduetoefficientsolidscapture;(2)higherbiomassconcentration in the reactor, which results in higher COD loadings andsmallerreactorsize;and(3)higherSRTsareachievedinthereactorduetosolidsrecycle.Disadvantagesoftheprocessincludethehighcostofmem-branesandthepotentialformembranefouling.Alotofrecentresearchhasfocusedonfabricationofmembranesandapplicationofcoatingsthatcanreducefoulingproblems.Moredetaileddiscussiononmembranebioreac-torsisprovidedinChapter13.
PROBLEMS
11.1 Listthreeadvantagesandthreedisadvantagesoftheanaerobictreat-mentprocess.
11.2 Brieflydescribethefourstepsofanaerobicbiotransformation.Whatgroupsofbacteriaareinvolvedineachstep?
Influent
Anaerobicbioreactor
Gas Effluent(permeate)
Membraneseparation unit
Return solids(concentrate)
Figure 11.7 Anaerobic membrane bioreactor process.
Anaerobic wastewater treatment 235
11.3 List the factors thatare important foranaerobic treatment.WhattemperatureandpHrangesarebestfortheprocess?
11.4 DesignaUASBreactortotreatwastewaterat30°Cfromafoodpro-cessingplant.Thewastewaterflowrateis500m3/dwithasolubleCODconcentrationof6000mg/L.Thedesignparameters are asfollows:
Reactoreffectivenessfactor(E)=0.85Upflowvelocity=1.2m/hOrganicloadingrate=12kgsCOD/m3·dY=0.08kgVSS/kgCODkd=0.03d–1
μmax=0.25d–1
Ks=360mg/LHeightforgascollection=3mUsingthegiveninformation,determinethefollowing:
a. Thereactorareaanddiameter b. Thereactorliquidvolume c. Liquiddepthandtotalheightofthereactor d. TheaverageSRT(assuming97%degradationofsCOD)
11.5 Determine themethanegasproduction rate (m3/d) for the reactorfromproblem11.4.AssumeCODequivalentofVSSequals1.42kgCOD/kgVSS.
11.6 An anaerobic reactor operates at 35°C with an SRT of 30 d.Suddenly,themethanegasproductionratedecreasessignificantly.Explainthepossiblereason(s)tobeinvestigatedforthereductionofmethane.
11.7 Ananaerobicsequencingbatchreactor(ASBR)operatesatanHRTof1.5dat35°C.Calculatethevolumetobewastedpercycleforthefollowingoperationalparameters:
Totalliquidvolume=15LFeedphase=30minReactphase=240minSettlephase=60minDecantphase=30min
11.8 Briefly differentiate between anaerobic suspended and attachedgrowthprocesses.Givetwoexamplesofeachoftheprocesses.
11.9 Whataretheadvantagesanddisadvantagesofanaerobicfluidizedbedreactor(AFBR)andanaerobicmembranebioreactor?
236 Fundamentals of wastewater treatment and engineering
REFERENCES
Angenent,L.,Zheng,D.,Sung,S.,andRaskin,L. (2000)“MethanosaetaFibers inAnaerobicMigratingBlanketReactors.”Water Science & Technology,vol.41,p.35–39.
Archer,D.B.andHarris,J.E.(1986)“MethanogenicBacteriaandMethaneProductioninVarious Habitats.” In Anaerobic Bacteria in Habitats Other Than Man.EditedbyBarness,E.M.,andMead,G.C.BlackwellScientificPublication,Oxford,UnitedKingdom.
AWWA,WEF,andAPHA(2005)Standard Methods for the Examination of Water and Wastewater.Twenty-firstedition.EditedbyEaton,A.,Franson,M.A.H.,AmericanWaterWorksAssociation,Denver,Colorado.
Babbitt,H.E.,andSchlenz,H.E. (1929)“ResultsofTestsonSewageTreatment.”University of Illinois Engineering Experiment Station Bulletin.,Urbana,no.198.
Batch, W. E., Fox, G. E., Magrum, J., Woese, C. R., and Wolfe, R. S. (1979)“Methanogens: Reevaluation of a Unique Biological Group.” Microbiology Reviews,vol.43,p.260.
Dague,R.R.,McKinney,R.E.,andPfeffer,J.T.(1966)“AnaerobicActivatedSludge.”Journal Water Pollution Control Federation,vol.38,no.2,pp.220–226.
Daniels,L.(1984)“BiologicalMethanogenesis:PhysiologicalandPracticalAspects.”Trends in Biotechnology,vol.2,no.4,pp.91–98.
Droste,R.L.(1997)Theory and Practice of Water and Wastewater Treatment.JohnWiley&Sons,Inc.NewJersey.
Dubach, A. C., and Bachofen, R. (1985) “Methanogens: A Short TaxonomicOverview.”Experientia,vol.41,p.441.
Fair,G.M.,andMoore,E.W.(1932)“HeatandEnergyRelationintheDigestionofSewageSolids, III.EffectofTemperature if Incubateupon theCourseofDigestion.”Sewage Works Journal,vol.4,p.589.
Fuller,G.W.(1912)Sewage Disposal.McGraw-Hill,Inc.,NewYork.Gomec, C. Y., Kim, M., Ahn, Y., and Speece, R. E. (2002)“The Role of pH in
Mesophilic Anaerobic Sludge Solubilization.” Journal of Environmental Science and Health,PartA,vol.37,no.10,pp.1871–1878.
Grady,C.P.L.Jr.,andLim,H.C.(1980)Biological Wastewater Treatment.MarcelDekkerInc.,NewYork.
Gujer,W.,andZehnder,A.J.B.(1983)“ConversionProcessinAnaerobicDigestion.”Water Science and Technology,vol.15,pp.127–167.
Heukelekian, H. (1933) “Digestion of Solids between the Thermophilic andNonthermophilicRange.”Sewage Works Journal,vol.5,no.5,pp.757–762.
Heukelekian,H.(1958)“BasicPrinciplesofSludgeDigestion.”Biological Treatment of Sewage and Industrial Wastes,vol.II.ReinholdPublishingCorp.,NewYork.
HulshoffPol,L.W.,deZeeuw,W.J.,Velzeboer,C.T.M.,andLettinga,G.(1983)“GranulationinUASB-Reactors.”Presented at the 66th Annual Conference of Water Environmental Federation,Anaheim,California.
Imhoff,K.(1915)“EightYearsofImhoffTankDesignandOperation.”Engineering News(NewYork),vol.75,p.14–19,52-55.
Lawrence,A.W.,andMcCarty,P.L.(1969)“KineticsofMethaneFermentationinAnaerobicTreatment.”Journal of Water Pollution Control Federation,vol.41,pp.R1–R17.
Anaerobic wastewater treatment 237
Lettinga, G., van Velsen, F. M., Hobma, S. W., de Zeeuw, W., and Klapwijk, A.(1980)“UseofUpflowSludgeBlanket(USB)ReactorConceptforBiologicalWastewaterTreatment, Especially forAnaerobicTreatment.” Biotechnology and Bioengineering,vol.22,pp.699–734.
Macario,A.J.L.,andConwaydeMacario,E.(1988)“QuantitativeImmunologicalAnalysis of the Methanogenic Flora of Digesters Reveals a ConsiderableDiversity.”Applied Environmental Microbiology,vol.54,p.79.
Madigan, M., Martinko, J., Stahl, D., and Clark, D. (2010) Brock Biology of Microorganisms.Thirteenthedition.PrenticeHall,NewYork.
Malina, J. F., and Pohland, F. G. (1992)“Design ofAnaerobic Processes for theTreatmentofIndustrialandMunicipalWastes.”Water Quality Management Library,vol.7.TechnomicPublishingCo.,Lancaster,PA.
McCarty,P.L., Jeris, J. S., andMurdoch,W. (1963)“IndividualVolatileAcids inAnaerobicTreatment.” Journal Water Pollution Control Federation, vol. 35,p.1501.
McCarty, P. L. (1964a) “Anaerobic Waste Treatment Fundamentals—Part One:ChemistryandMicrobiology.”Public Works,vol.95,no.9,pp.107–112.
McCarty, P. L. (1964b) “Anaerobic Waste Treatment Fundamentals—Part Two:EnvironmentalRequirementsandControl.”Public Works,vol.95,no.9,pp.123–126.
McCarty, P. L. (1964c)“Anaerobic Waste Treatment Fundamentals—Part Three:ToxicMaterialsandTheirControl.”Public Works,vol.95,no.11,pp.91–94.
McCarty,P.L.(1981)“OneHundredYearsofAnaerobicTreatment.”Proceedings of Second International Conference on Anaerobic Digestion,Travemunde,Germany.
McCarty, P. L., and Smith, D. P. (1986) “Anaerobic Wastewater Treatment.”Environmental Science and Technology.,vol.20,pp.1200–1206.
Metcalf and Eddy, Inc. (2003) Wastewater Engineering: Treatment and Reuse.Fourthedition.McGraw-Hill,Inc.,NewYork.
Novaes,R.F.V.(1986)“MicrobiologyofAnaerobicDigestion.”Water Science and Technology, vol.18,no.12,pp.1–14.
Owen,W.F.,Stuckey,D.C.,Healy,J.B.,Young,L.Y.,andMcCarty,P.L.(1979)“Bioassay for Monitoring Biochemical Methane Potential and AnaerobicToxicity.”WaterResearch,vol.13,no.6,pp.485–492.
Parkin, G. F., and Owen,W. F. (1986)“Fundamentals ofAnaerobic Digestion ofWastewaterSludges.”Journal of Environmental Engineering, ASCE,vol.112,no.5,pp.867–920.
Parkin,G.F.,andSpeece,R.E.(1982)“AttachedversusSuspendedGrowthAnaerobicReactor:Response toToxicSubstances.”Proceedings of IAWPR Specialized Seminar onAnaerobic Treatment,Copenhagen,Denmark.
Riffat, R. (1994)“Fundamental Studies ofAnaerobic Biosorption inWastewaterTreatment.”Ph.D.Thesis,IowaStateUniversity,Ames,Iowa.
Rudolfs,W.(1927)“EffectofTemperatureonSewageSludgeDigestion.”Industrial and Engineering Chemistry,vol.19,no.1,pp.241–243.
Sawyer,C.N.,Howard,F.S.,andPershe,E.R.(1954)“ScientificBasisforLimingofDigesters.”Sewage and Industrial Wastes,vol.26,p.935.
Smith,M.R.andMah,R.A.(1980)“AcetateasSoleCarbonandEnergySourcefor Growth of Methanosarcina Strain 227.” Applied and Environmental Microbiology,vol.39,no.5,p.993–999.
238 Fundamentals of wastewater treatment and engineering
Sung, S., and Dague, R. R. (1992) “Fundamental Principles of the AnaerobicSequencingBatchReactorProcess.”Proceedings of the 47th Purdue Industrial Waste Conference,LewisPublishers,Inc.,Chelsea,Michigan.no.423.
Speece, R. E. (2008) Anaerobic Biotechnology and Odor/Corrosion Control for Municipalities and Industries.ArchaePress,Nashville,TN.
Speece R. E. (1983). “Anaerobic Biotechnology for Industrial Wastewater.”Environmental Science & Technology,vol.17,no.9,p.416A.
Taylor,D.W.,andBurm,R.J.(1972)“Full-ScaleAnaerobicFilterTreatmentofWheatStarch PlantWaste.” American Institute of Chemical Engineers Symposium Series,vol.69,no.129,p.30.
Thauer, R. K., Jungermann, K., and Decker, K. (1977) “Energy Conservationin Chemotrophic Anaerobic Bacteria.” Bacteriology Reviews, vol. 41, no.p. 100–180.
Vallinga,S.H.J.,Hack,P.J.F.M.,andvanderVlught,A.J.(1986)“NewTypeHighRateAnaerobicReactor.”Proceeding of Anaerobic Treatment: A Grown-Up Technology,pp.547–562.
vandenBerg,L.(1981)“EffectofTypeofWasteonPerformanceofAnaerobicFixed-Film and Upflow Sludge Bed Reactors.” Proceedings of the 36th Industrial Waste Conference,PurdueUniversity,Indiana.
Wose, C. R., Magrum, L. J., and Fox, G. E. (1978)“Archaebacteria.” Journal of Molecular Evolution,vol.11,p.245.
Wose,C.R.(1987)“BacterialEvolution.”Microbiology Reviews,vol.51,p.221.Young,J.C.,andMcCarty,P.L.(1969)“TheAnaerobicFilterforWasteTreatment.”
Journal of Water Pollution Control Federation,vol.41,p.R160.Zehnder, A. J. B., Huser, B. A., Brock, T. D., and Wuhrmann, K. (1980)
“Characterization of anAcetate Decarboxylating Non-Hydrogen-OxidizingMethaneBacteria.”Archives of Microbiology,vol.124,p.1.
239
Chapter 12
Solids processing and disposal
12.1 INTRODUCTION
Solids thataregenerated fromprimary, secondary,andadvancedwaste-watertreatmentprocessesarecalledsludge.Sludgeisusuallyintheformofliquidorsemisolidliquid,whichtypicallycontainsfrom0.25%to12%solidsbyweight.Itisclassifiedinthefollowingcategories:primarysludge,secondary sludge, and sludge produced in advanced treatment process.Primarysludgeconsistsofsettleablesolidscarriedintherawwastewater;secondarysludgeconsistsofbiologicalsolidsaswellasadditionalsettleablesolids.Sludgeproducedintheadvancedwastewatermayincludeviruses,heavymetals,phosphorous,ornitrogen.
In general, municipal sludge consists of primary and waste-activatedsludgeandmustbetreatedtosomeextentbeforedisposal.Itcontainsvari-ousorganicsandinorganics,e.g.biomassproducedbythebiologicalcon-versionoforganics,oil andgrease,nutrients (nitrogenandphosphorus),heavymetals, syntheticorganic compounds, andpathogens.Disposalofsludgerepresentsupto50%oftheoperatingcostsofawastewatertreat-mentplant(Appelsetal.,2008).
Treated wastewater sludge, commonly referred to as biosolids, is thematerial produced as the ultimate by-product of the processes used totreatmunicipalwastewaterinwastewatertreatmentfacilities.Biosolidsarenutrient-richorganicmaterial.Theycanbeusedforsoilenrichmentandcansupplementcommercial fertilizers.Biosolidsmustmeetstrict regula-tionsandqualitystandardsbeforebeingapplied to land.ApproximatelyeightmilliontoninemilliontonsofbiosolidsareproducedeachyearbymunicipalwastewatertreatmentfacilitiesintheUnitedStates(Hongetal.,2006).In2003,about60%ofthebiosolidswasreused.Beneficialreuseofbiosolidsisexpectedtoincreaseinthenearfuture.
Thefirststepinsludgehandlingisusuallythickening.Thepurposeofthickeningistoreducethevolumeofsludgebeforefurthertreatment.Themainthickeningmethodsusedaregravitythickening,floatationthickening,
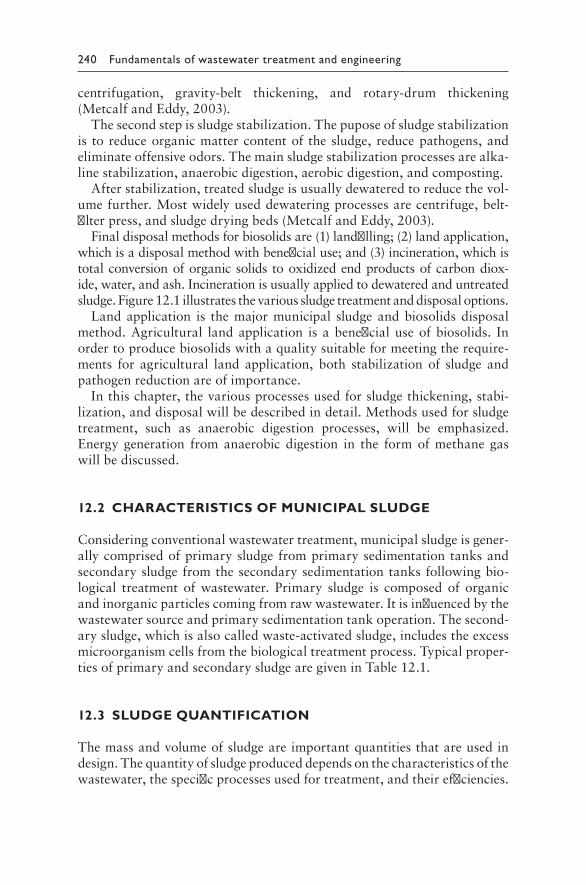
240 Fundamentals of wastewater treatment and engineering
centrifugation, gravity-belt thickening, and rotary-drum thickening(MetcalfandEddy,2003).
Thesecondstepissludgestabilization.Thepuposeofsludgestabilizationis toreduceorganicmattercontentof thesludge,reducepathogens,andeliminateoffensiveodors.Themainsludgestabilizationprocessesarealka-linestabilization,anaerobicdigestion,aerobicdigestion,andcomposting.
Afterstabilization,treatedsludgeisusuallydewateredtoreducethevol-umefurther.Mostwidelyuseddewateringprocessesarecentrifuge,belt-filterpress,andsludgedryingbeds(MetcalfandEddy,2003).
Finaldisposalmethodsforbiosolidsare(1)landfilling;(2)landapplication,whichisadisposalmethodwithbeneficialuse;and(3)incineration,whichistotalconversionoforganicsolids tooxidizedendproductsofcarbondiox-ide,water,andash.Incinerationisusuallyappliedtodewateredanduntreatedsludge.Figure 12.1illustratesthevarioussludgetreatmentanddisposaloptions.
Landapplication is themajormunicipal sludgeandbiosolidsdisposalmethod.Agricultural landapplication is abeneficialuseofbiosolids. Inordertoproducebiosolidswithaqualitysuitableformeetingtherequire-ments for agricultural land application, both stabilization of sludge andpathogenreductionareofimportance.
Inthischapter,thevariousprocessesusedforsludgethickening,stabi-lization,anddisposalwillbedescribedindetail.Methodsusedforsludgetreatment, such as anaerobic digestion processes, will be emphasized.Energy generation from anaerobic digestion in the formofmethane gaswillbediscussed.
12.2 CHARACTERISTICS OF MUNICIPAL SLUDGE
Consideringconventionalwastewatertreatment,municipalsludgeisgener-allycomprisedofprimarysludgefromprimarysedimentationtanksandsecondarysludgefromthesecondarysedimentationtanksfollowingbio-logical treatment of wastewater. Primary sludge is composed of organicandinorganicparticlescomingfromrawwastewater.Itisinfluencedbythewastewatersourceandprimarysedimentationtankoperation.Thesecond-arysludge,whichisalsocalledwaste-activatedsludge,includestheexcessmicroorganismcellsfromthebiologicaltreatmentprocess.Typicalproper-tiesofprimaryandsecondarysludgearegiveninTable 12.1.
12.3 SLUDGE QUANTIFICATION
Themassandvolumeofsludgeareimportantquantitiesthatareusedindesign.Thequantityofsludgeproduceddependsonthecharacteristicsofthewastewater,thespecificprocessesusedfortreatment,andtheirefficiencies.
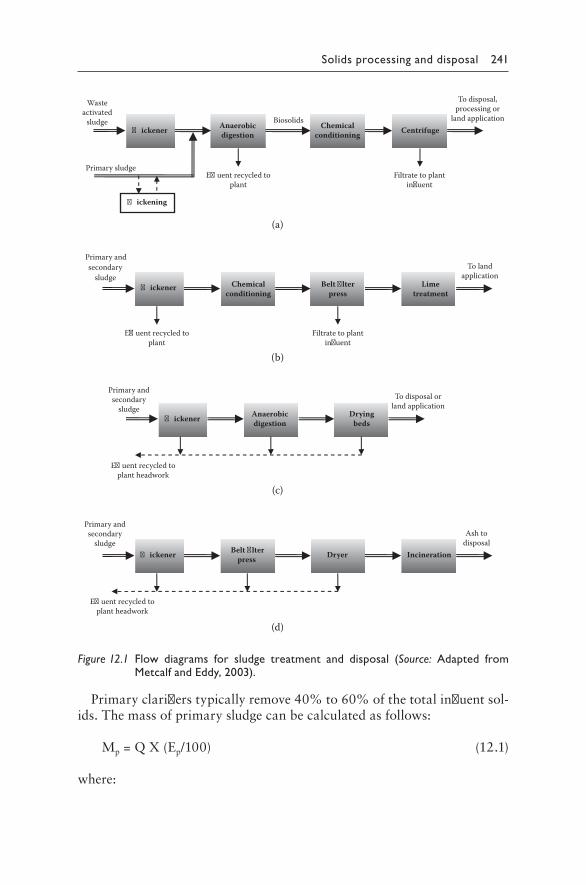
Solids processing and disposal 241
Primaryclarifierstypicallyremove40%to60%ofthetotalinfluentsol-ids.Themassofprimarysludgecanbecalculatedasfollows:
Mp=QX(Ep/100) (12.1)
where:
(a)
(b)
(c)
(d)
�ickener Dryer
Primary andsecondary
sludgeBelt �lter
press Incineration
Ash todisposal
E�uent recycled toplant headwork
�ickener Dryingbeds
Primary andsecondary
sludge Anaerobicdigestion
To disposal orland application
E�uent recycled toplant headwork
�ickener Belt �lterpress
Primary and secondary
sludge Chemical
conditioningLime
treatment
To landapplication
E�uent recycled toplant
Filtrate to plantin�uent
�ickener Anaerobicdigestion
Wasteactivated
sludge Chemicalconditioning Centrifuge
Biosolids
To disposal,processing or
land application
E�uent recycled toplant
Filtrate to plantin�uent
Primary sludge
�ickening
Figure 12.1 Flow diagrams for sludge treatment and disposal (Source: Adapted from Metcalf and Eddy, 2003).
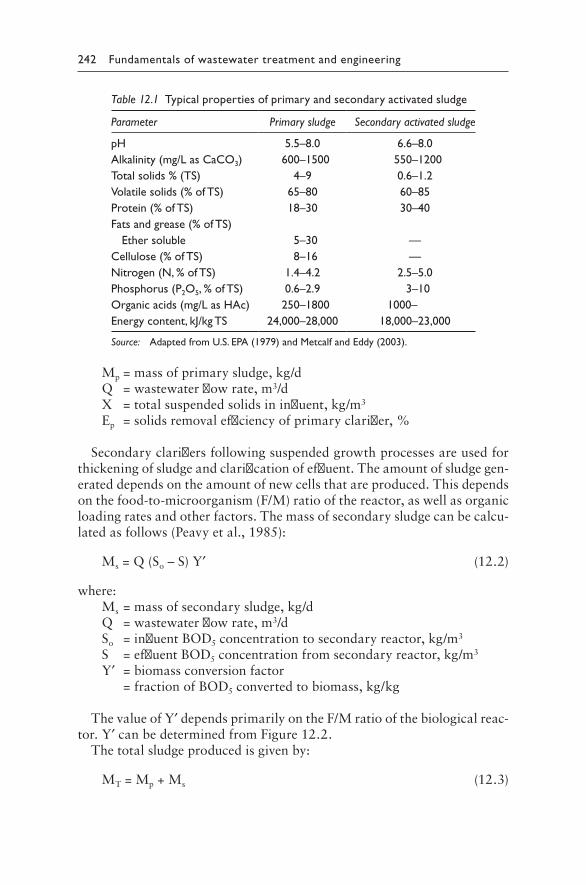
242 Fundamentals of wastewater treatment and engineering
Mp=massofprimarysludge,kg/dQ=wastewaterflowrate,m3/dX=totalsuspendedsolidsininfluent,kg/m3
Ep=solidsremovalefficiencyofprimaryclarifier,%
Secondaryclarifiersfollowingsuspendedgrowthprocessesareusedforthickeningofsludgeandclarificationofeffluent.Theamountofsludgegen-erateddependsontheamountofnewcellsthatareproduced.Thisdependsonthefood-to-microorganism(F/M)ratioofthereactor,aswellasorganicloadingratesandotherfactors.Themassofsecondarysludgecanbecalcu-latedasfollows(Peavyetal.,1985):
Ms=Q(So–S)Y′ (12.2)
where:Ms=massofsecondarysludge,kg/dQ=wastewaterflowrate,m3/dSo=influentBOD5concentrationtosecondaryreactor,kg/m3
S=effluentBOD5concentrationfromsecondaryreactor,kg/m3
Y′=biomassconversionfactor =fractionofBOD5convertedtobiomass,kg/kg
ThevalueofY′dependsprimarilyontheF/Mratioofthebiologicalreac-tor.Y′canbedeterminedfromFigure 12.2.
Thetotalsludgeproducedisgivenby:
MT=Mp+Ms (12.3)
Table 12.1 Typical properties of primary and secondary activated sludge
Parameter Primary sludge Secondary activated sludge
pH 5.5–8.0 6.6–8.0Alkalinity (mg/L as CaCO3) 600–1500 550–1200Total solids % (TS) 4–9 0.6–1.2Volatile solids (% of TS) 65–80 60–85Protein (% of TS) 18–30 30–40Fats and grease (% of TS)
Ether soluble 5–30 —Cellulose (% of TS) 8–16 —Nitrogen (N, % of TS) 1.4–4.2 2.5–5.0Phosphorus (P2O5, % of TS) 0.6–2.9 3–10Organic acids (mg/L as HAc) 250–1800 1000–Energy content, kJ/kg TS 24,000–28,000 18,000–23,000
Source: Adapted from U.S. EPA (1979) and Metcalf and Eddy (2003).
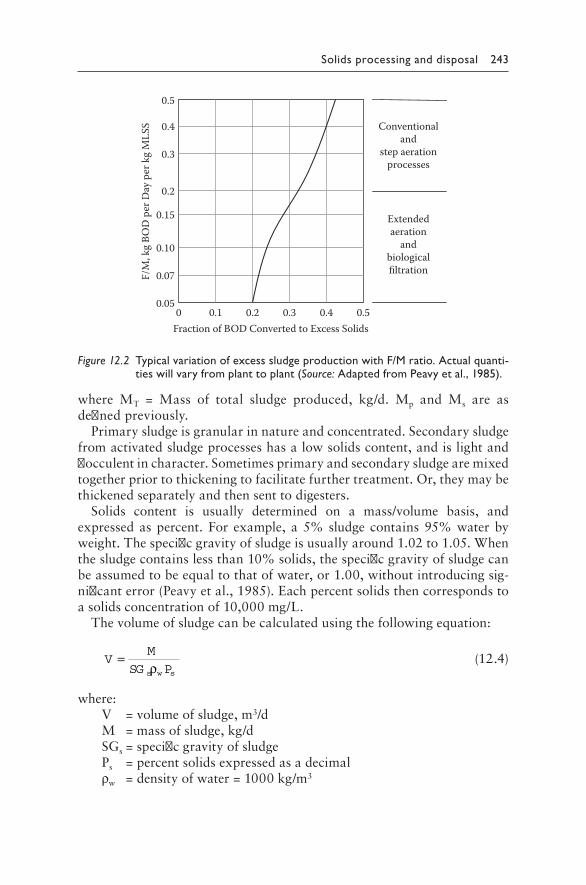
Solids processing and disposal 243
where MT = Mass of total sludge produced, kg/d. Mp and Ms are asdefinedpreviously.
Primarysludgeisgranularinnatureandconcentrated.Secondarysludgefromactivatedsludgeprocesseshasalowsolidscontent,andislightandflocculentincharacter.Sometimesprimaryandsecondarysludgearemixedtogetherpriortothickeningtofacilitatefurthertreatment.Or,theymaybethickenedseparatelyandthensenttodigesters.
Solids content is usually determined on a mass/volume basis, andexpressedaspercent.For example, a5%sludge contains95%waterbyweight.Thespecificgravityofsludgeisusuallyaround1.02to1.05.Whenthesludgecontainslessthan10%solids,thespecificgravityofsludgecanbeassumedtobeequaltothatofwater,or1.00,withoutintroducingsig-nificanterror(Peavyetal.,1985).Eachpercentsolidsthencorrespondstoasolidsconcentrationof10,000mg/L.
Thevolumeofsludgecanbecalculatedusingthefollowingequation:
VM
SG Ps w s
=ρ
(12.4)
where:V=volumeofsludge,m3/dM=massofsludge,kg/dSGs=specificgravityofsludgePs=percentsolidsexpressedasadecimalρw=densityofwater=1000kg/m3
Fraction of BOD Converted to Excess Solids0 0.1 0.2 0.3 0.4 0.5
0.05
0.07
0.10
0.15
0.2
0.3
0.4
0.5
F/M
, kg
BOD
per
Day
per
kg
MLS
S Conventionaland
step aerationprocesses
Extendedaeration
andbiologicalfiltration
Figure 12.2 Typical variation of excess sludge production with F/M ratio. Actual quanti-ties will vary from plant to plant (Source: Adapted from Peavy et al., 1985).
244 Fundamentals of wastewater treatment and engineering
For a given solids content, the following relationship can be used forapproximatecalculations(MetcalfandEddy,2003):
V
V
P
P1
2
2
1
= (12.5)
where:V1,V2=volumesofsludgeP1,P2=percentofsolidsinV1andV2,respectively
ThecalculationofsludgevolumesisillustratedinExample12.1.
EXAMPLE12.1A conventional wastewater treatment plant treats 15,000 m3 /d ofmunicipalwastewaterwithaBOD5(biochemicaloxygendemand)of220mg/landsuspendedsolidsof200mg/l.Thetreatmentconsistsofprimaryfollowedbysecondarytreatment.TheeffluentBOD5fromthefinalclarifieris20mg/L.Thefollowingdataareprovided:
Primaryclarifier:removalefficiency:SS=55%,BOD5=30%watercontent=95%,specificgravity=1.04
Aerationtank:F/M=0.33Secondary clarifier: 2% solids in waste-activated sludge, specific
gravity=1.02
a.Calculatethemassandvolumeofprimarysludge. b.Calculatethemassandvolumeofsecondarysludge. c.Calculatethetotalmassofprimaryandsecondarysludge.
SOLUTION
Step1.Calculatethemassofprimarysludge.
SS=200mg/L=0.2kg/m3
Calculatemassofprimarysludgeusingequation(12.1).
Mp=QX(Ep/100)=15,000m3/d×0.2kg/m3×0.55=1650kg/d
Step2.Calculatevolumeofprimarysludge.
Solidscontent=100–watercontent=100–95%=5%
Solids processing and disposal 245
Useequation(12.4)tocalculatesludgevolume.
VM
SG Pp
s w s
=ρ
=× ×
/
. .
1650
1 04 1000 0 053
kg dkg
m
=31.73m3/d
Step3.Calculatemassofsecondarysludge.Primaryclarifierremoves30%BOD5.Therefore,BOD5goingtoaerationtank=220mg/L(1–0.30).Or,So=154mg/L=0.154kg/m3.Given,S=20mg/L=0.02kg/m3.For F/M of 0.33, biomass conversion factor Y′ = 0.38 from
Figure 12.2.Useequation(12.2)tocalculatemassofsecondarysludge.
Ms=Q(So–S)Y′
=15,000m3/d(0.154–0.02)kg/m3×0.38
=763.80kg/d
Step4.Calculatevolumeofsecondarysludgeusingequation(12.4).
VM
SG Ps
s w s
=ρ
=× ×
. /
. .
763 80
1 02 1000 0 023
kg dkg
m
=37.44m3/d
Step5.Calculate totalmassofprimaryand secondary sludgeusingequation(12.3).
MT=Mp+Ms
=1650+763.8kg/d
=2413.80kg/d
246 Fundamentals of wastewater treatment and engineering
12.4 SLUDGE THICKENING
Theobjectiveofsludgethickening is toreducethevolumeofsludgeandincreasethesolidscontent.Thesludgegeneratedfromprimary,secondary,andtertiarytreatmentprocessescanhaveawiderangeofsolidsconcentra-tionandcharacteristics.Reducing thewater content isadvantageous forsubsequenttreatmentprocesses.Volumereductionreducespipesize,pump-ingcost,andtanksizesforfurthertreatment.
Allwastewatertreatmentplantsusesomemethodofsludgethickening.Insmallplantstreatinglessthan4000m3/d(lessthan1Mgal/d),thicken-ingisaccomplishedintheprimaryclarifierand/orsludgedigestionunits(MetcalfandEddy,2003). In largerplantsseparate thickeningprocessesareused.Examplesofthesearegravitythickener,dissolvedairflotation,centrifugation,gravity-belt thickener,androtary-drumthickener,amongothers.Thethickenedsludgeispumpedtoasubsequentsludgestabilizationprocess,whiletheliquideffluentisusuallyrecycledtoprimarytreatment.Thethickenershavetobedesignedtomeetpeakdemandsandpreventsep-ticityandodorproblemsduringthethickeningprocess.Anumberofthemajorsludgethickeningprocessesaredescribedinthefollowingsections.
12.4.1 Gravity thickener
Gravitythickeningisusedforprimarysludgeoracombinationofprimaryandwaste-activatedsludge.Thedesignofagravitythickenerissimilartoasecond-aryclarifier.Thethickeningfunctionisthemajordesignparameter,andtanksdeeperthansecondaryclarifiersareused.Thesurfacearearequiredforthick-eningmaybedeterminedusingthesolids flux analysisorthestate point analy-sismethods.AtypicalcirculargravitythickenerisillustratedinFigure 12.3.Dilute sludge is fed toacenter feedwell,where it isallowed tosettle.Thesludgescrapermechanismcanbeintheformofverticalpicketsordeeptrusses.Thescraperstirsthesludgegently,whichhelpstoreleasewatertrappedinthesludgeandpromotescompaction.Thethickenedsludgeispumpedtodigestersordewateringprocesses,andstoragespacehastobeprovidedforthesludge.Theliquideffluentisrecycledtotheheadworksoftheplant.
Asludgeblanketismaintainedatthebottomofthethickenertohelpinconcentratingthesludge.Blanketdepthscanrangefrom0.5to2.5m(2to8ft),withshallowerdepthsinwarmermonths.Anoperatingvariableisthesludge volume ratio,whichisthevolumeofsludgeblanketinthethickenerdividedbythevolumeofthickenedsludgeremoveddaily.Thesludgevol-umeratiocanrangefrom0.5to20d.Thesolidsloadingraterangesfrom100to150kg/m2·d,withmaximumhydraulicoverflowratesof15.5to21m3/m2·dforprimarysludge.Foracombinedprimaryandwaste-activatedsludgethickener,thesolidsloadingraterangesfrom25to80kg/m2·d,withmaximumhydraulicoverflowratesof6to12m3/m2·d(MetcalfandEddy,
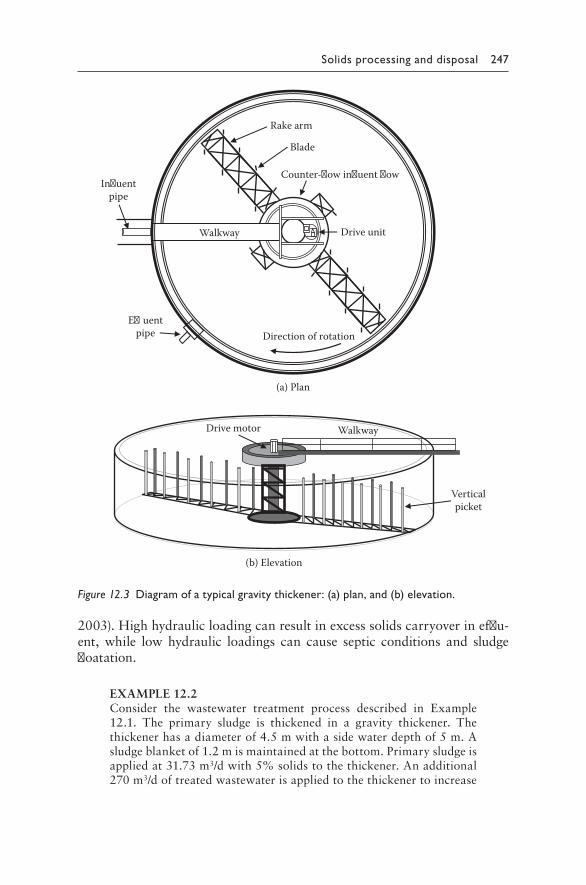
Solids processing and disposal 247
2003).Highhydraulicloadingcanresultinexcesssolidscarryoverinefflu-ent, while low hydraulic loadings can cause septic conditions and sludgefloatation.
EXAMPLE12.2Consider the wastewater treatment process described in Example12.1. The primary sludge is thickened in a gravity thickener. Thethickenerhasadiameterof4.5mwithasidewaterdepthof5m.Asludgeblanketof1.2mismaintainedatthebottom.Primarysludgeisappliedat31.73m3/dwith5%solidstothethickener.Anadditional270m3/doftreatedwastewaterisappliedtothethickenertoincrease
(a) Plan
(b) Elevation
Walkway
Rake arm
Drive unit
Counter-�ow in�uent �ow
Blade
Direction of rotation
In�uentpipe
E�uentpipe
WalkwayDrive motor
Verticalpicket
Figure 12.3 Diagram of a typical gravity thickener: (a) plan, and (b) elevation.
248 Fundamentals of wastewater treatment and engineering
theoverflowrateandimproveodorcontrolandthickening.Thethick-enedsludgeiswithdrawnat17m3/dwith7%solidscontent.Calculatethefollowing:
a.Hydraulicoverflowrate b.Solidsloadingrate c.Sludgevolumeratio d.Percentsolidscapturedinthickener
SOLUTION
Step1.Calculatethesurfaceareaofthickener.
As= π44 5 2( .) = 15.90m2
Step2.Calculatehydraulicoverflowrate.
Qin=(31.73+270)m3/d=301.73m3/d
Qthickened=17m3/d
Qeffluent=Qin–Qthickened=301.73–17=284.73m3/d
Overflowrate= QA
m d
meffluent
s
= . /
.
284 73
15 90
3
2=17.90m3/m2·d
Step3.Calculatesolidsloadingrate.FromExample12.1,massofprimarysludgesolids=1650kg/d.
Solidsloading=1650
15 90 2
/
.
kg d
m=103.77kg/m2·d
Step4.Calculatesludgevolumeratio.
Volumeofsludgeblanketinthickener=1.2m×15.90m2=19.08m3
Sludgevolumeratio= volum eofsludgeblanket
rateofthickened slludgewithdrawal= .
/
19 08
17
3
3
m
m d =1.12d
Step5.Calculatethesolidscapture.
Massofsolidscomingin=1650kg/d
Massofsolidsinthickenedsludge=17m3/d×0.07×1000kg/m3=1190kg/d
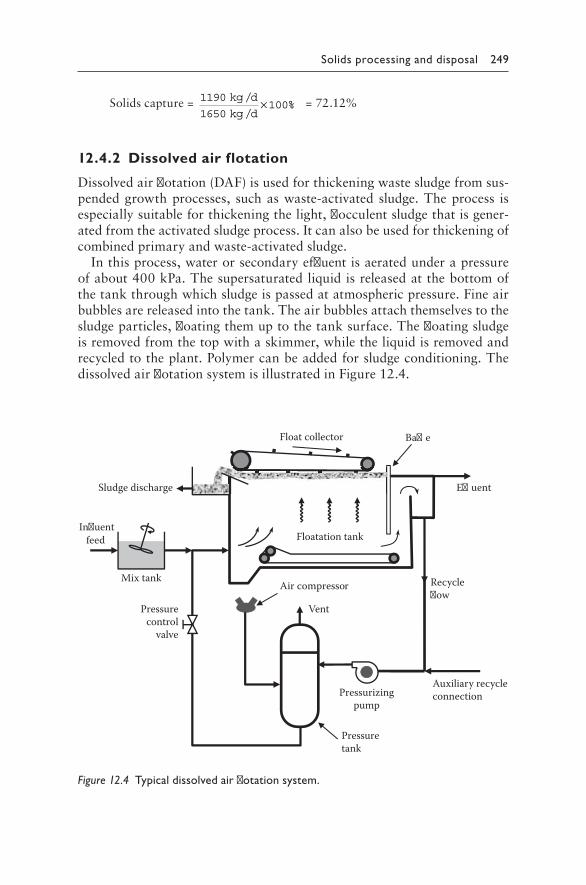
Solids processing and disposal 249
Solidscapture= 11901650
100/
/%
kg d
kg d× =72.12%
12.4.2 Dissolved air flotation
Dissolvedairflotation(DAF)isusedforthickeningwastesludgefromsus-pendedgrowthprocesses, suchaswaste-activated sludge.Theprocess isespeciallysuitableforthickeningthelight,flocculentsludgethatisgener-atedfromtheactivatedsludgeprocess.Itcanalsobeusedforthickeningofcombinedprimaryandwaste-activatedsludge.
Inthisprocess,waterorsecondaryeffluentisaeratedunderapressureofabout400kPa.Thesupersaturatedliquidisreleasedatthebottomofthetankthroughwhichsludgeispassedatatmosphericpressure.Fineairbubblesarereleasedintothetank.Theairbubblesattachthemselvestothesludgeparticles,floatingthemuptothetanksurface.Thefloatingsludgeisremovedfromthetopwithaskimmer,whiletheliquidisremovedandrecycledtotheplant.Polymercanbeaddedforsludgeconditioning.ThedissolvedairflotationsystemisillustratedinFigure 12.4.
Ba�e
E�uent
Recycle�ow
Auxiliary recycleconnectionPressurizing
pump
Vent
Air compressor
Pressuretank
Pressurecontrol
valve
In�uent feed
Mix tank
Sludge discharge
Float collector
Floatation tank
Figure 12.4 Typical dissolved air flotation system.
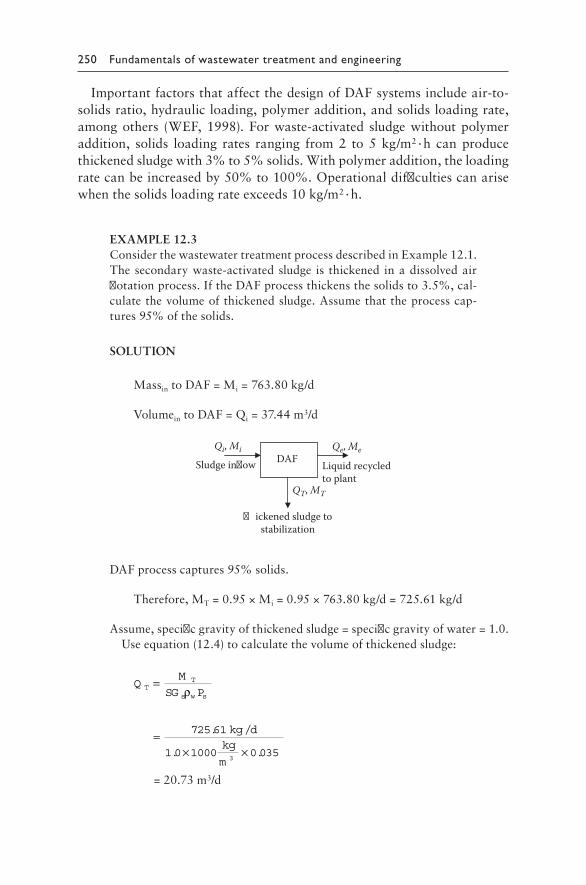
250 Fundamentals of wastewater treatment and engineering
ImportantfactorsthataffectthedesignofDAFsystemsincludeair-to-solidsratio,hydraulicloading,polymeraddition,andsolidsloadingrate,amongothers (WEF,1998).Forwaste-activated sludgewithoutpolymeraddition, solids loading rates ranging from2 to5kg/m2·h canproducethickenedsludgewith3%to5%solids.Withpolymeraddition,theloadingratecanbeincreasedby50%to100%.Operationaldifficultiescanarisewhenthesolidsloadingrateexceeds10kg/m2·h.
EXAMPLE12.3ConsiderthewastewatertreatmentprocessdescribedinExample12.1.Thesecondarywaste-activatedsludge is thickened inadissolvedairflotationprocess.IftheDAFprocessthickensthesolidsto3.5%,cal-culatethevolumeofthickenedsludge.Assumethattheprocesscap-tures95%ofthesolids.
SOLUTION
MassintoDAF=Mi=763.80kg/d
VolumeintoDAF=Qi=37.44m3/d
Sludge in�ow
�ickened sludge tostabilization
Liquid recycledto plant
DAF
QT, MT
Qe, MeQi, Mi
DAFprocesscaptures95%solids.
Therefore,MT=0.95×Mi=0.95×763.80kg/d=725.61kg/d
Assume,specificgravityofthickenedsludge=specificgravityofwater=1.0.Useequation(12.4)tocalculatethevolumeofthickenedsludge:
QM
SG PT
T
s w s
=ρ
=× ×
. /
. .
725 61
1 0 1000 0 0353
kg dkg
m
=20.73m3/d
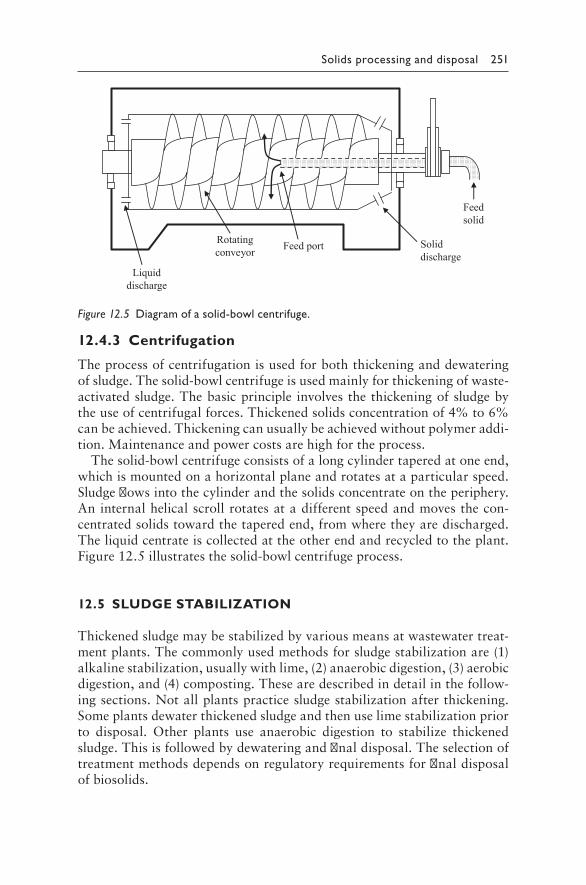
Solids processing and disposal 251
12.4.3 Centrifugation
Theprocessofcentrifugationisusedforboththickeninganddewateringofsludge.Thesolid-bowlcentrifugeisusedmainlyforthickeningofwaste-activatedsludge.Thebasicprinciple involvesthethickeningofsludgebytheuseofcentrifugalforces.Thickenedsolidsconcentrationof4%to6%canbeachieved.Thickeningcanusuallybeachievedwithoutpolymeraddi-tion.Maintenanceandpowercostsarehighfortheprocess.
Thesolid-bowlcentrifugeconsistsofalongcylindertaperedatoneend,whichismountedonahorizontalplaneandrotatesataparticularspeed.Sludgeflowsintothecylinderandthesolidsconcentrateontheperiphery.Aninternalhelicalscrollrotatesatadifferentspeedandmovesthecon-centratedsolidstowardthetaperedend,fromwheretheyaredischarged.Theliquidcentrateiscollectedattheotherendandrecycledtotheplant.Figure 12.5illustratesthesolid-bowlcentrifugeprocess.
12.5 SLUDGE STABILIZATION
Thickenedsludgemaybestabilizedbyvariousmeansatwastewatertreat-mentplants.Thecommonlyusedmethodsforsludgestabilizationare(1)alkalinestabilization,usuallywithlime,(2)anaerobicdigestion,(3)aerobicdigestion,and(4)composting.Thesearedescribedindetailinthefollow-ingsections.Notallplantspracticesludgestabilizationafterthickening.Someplantsdewaterthickenedsludgeandthenuselimestabilizationpriorto disposal. Other plants use anaerobic digestion to stabilize thickenedsludge.Thisisfollowedbydewateringandfinaldisposal.Theselectionoftreatmentmethodsdependsonregulatoryrequirementsforfinaldisposalofbiosolids.
Figure 12.5 Diagram of a solid-bowl centrifuge.
252 Fundamentals of wastewater treatment and engineering
The objectives of sludge stabilization are the following (Metcalf andEddy,2003):
• Reducepathogens• Eliminateoffensiveodors• Inhibit,reduce,oreliminatethepotentialforputrefaction
12.5.1 Alkaline stabilization
Quicklimeorhydratedlimeisaddedtothesludgeforstabilization.LimeisaddedtoraisethepHto12orhigher.Thealkalineenvironmentinhib-itspathogenicmicroorganismsandsignificantlyreducesorhaltsbacterialdecompositionoforganicmatterinthesludge.Thispreventsodorproduc-tionandvectorattraction.HealthhazardsarenotaproblemaslongasthepHismaintainedatthislevel.Limecanbeusedforpretreatment orpost-treatmentofsludge.
12.5.1.1 Chemical reactions
Avarietyofchemicalreactionscanoccurdependingonthecharacteristicsandconstituentsofthesludge.Someofthesearegivenbelow(MetcalfandEddy,2003;WEF,1998):
Withcalcium: Ca2++2HCO3
–+CaO→2CaCO3+H2O (12.6)
Withphosphorus: 2PO4
3–+6H++3CaO→Ca3(PO4)2+3H2O (12.7)
WithCO2: CO2+CaO→CaCO3 (12.8)
Withfats: Fat+Ca(OH)2→glycerol+fattyacids+CaCO3 (12.9)
Withacids: RCOOH+CaO→RCOOCaOH (12.10)
Other reactions also take place with proteins, carbohydrates, and poly-mers.Asthereactionsprogress,thepHcandecreaseduetoproductionofacidsetc.,soexcesslimeisadded.Ammoniaisproducedfromaminoacids,inadditiontovolatileoff-gases,whichrequirecollectionandtreatmentforodorcontrol.
Solids processing and disposal 253
Whenquicklime (CaO) isused, its reactionwithwater is exothermic,producingabout64kJ/g·mol(2.75×104BTU/lb·mol).Reactionofquick-limewithCO2illustratedinequation(12.8)isalsoexothermic,releasingapproximately180kJ/g·mol(7.8×104BTU/lb·mol)(U.S.EPA,1983).
12.5.1.2 Lime pretreatment
Pretreatmentinvolvestheapplicationoflimetoliquidsludgebeforedewa-tering.Thisrequiresmorelimeperunitweightofsludge.Limepretreatmentisusedfordirectapplicationofsludgeonlandorforconditioningandsta-bilizationpriortodewatering.ThedesignobjectiveistomaintainthepHabove12forabout2htoensurepathogendestructionandtoprovidesuf-ficientalkalinitytomaintainthepHabove11forseveraldays.Excesslimeisusedtoensurethelatter.
12.5.1.3 Lime posttreatment
Inposttreatment,hydratedlimeorquicklimeisappliedtodewateredsludge.Theadvantagesofposttreatmentarethatdrylimecanbeused,andthereare no special requirements for dewatering. Scaling problems are elimi-nated.Adequatemixingisimportanttoavoidtheformationofpocketsofputresciblematerial.Thestabilizedbiosolidshaveagranulartexture,canbestoredforlongperiods,andareeasilyspreadonlandbyaconventionalmanurespreader.
12.5.2 Anaerobic digestion
Anaerobicdigestion is the traditionalmethodforstabilizationofmunic-ipal sludge, which results in volatile solids reduction, biogas productionas an energy source, pathogen reduction, and reduced odor production.Anaerobicdigestionprocessesaregenerallyoperatedatmesophilicorther-mophilic temperatures.Overtheyears,manyprocessmodificationshavebeen developed. In addition to using single-stage digesters, two-phaseddigestionprocesses(stagingthedigestionprocessbyaddingapretreatmentstepforacidproduction)ortemperature-phaseddigestionprocesses(usingmesophilicandthermophilicdigestion)arealsoused.Thermal,mechani-cal,andchemicalpretreatmentoptionscanbeusedaswell,beforeameso-philicanaerobicdigestionprocess.
Themainadvantagesofanaerobicdigestionoveraerobicprocessesarereducingtheenergyneedbyeliminatingthenecessityofaeration,lownutri-entrequirements,energyproductionintheformofmethanegas,andloweramount of bacterial synthesis (Gomec et al., 2002). Energy in the formof methane can be recovered from the biological conversion of organic
254 Fundamentals of wastewater treatment and engineering
substrates. Sufficient digester gas can be produced to meet the energyrequirementsof digester heating andoperationof otherplantprocesses.Another advantage is that anaerobic processes can handle higher volu-metricorganicloadscomparedwithaerobicprocessesresultinginsmallerreactorvolumes.Forthesereasons,anaerobicdigestionistheprimarypre-ferredmethodfortreatmentofmunicipalsludgeandhigh-strengthorganicwastes.
Anaerobicdigestionhassomedisadvantagesaswell.Someofthesedis-advantagesarelongerstart-uptimerequiredtodevelopnecessaryamountofbiomassduetoslowgrowthrateofmethane-formingbacteria,possiblenecessityofalkalinityand/or specific ionaddition,andsensitivity to theadverseeffectoflowertemperaturesonreactionrates.
The following are important factors that should be considered in thedesignofanaerobicdigesters(MetcalfandEddy,2003):
• pH• Temperature• Alkalinity• Presenceoftoxiccompounds• Bioavailabilityofnutrients• Solidsretentiontime• Hydraulicretentiontime• Volumetricloadingofvolatilesolids
Process description. Anaerobicdigestion comprises fourmajor steps: (1)hydrolysis, (2) acidogenesis, (3) acetogenesis, and (4)methanogenesis, asdescribedpreviouslyinChapter11.Inconventionalsingle-stageanaerobicdigestionofmunicipalsludge,all foursteps takeplace inthesamereac-tor.However,metaboliccharacteristicsandgrowthratesofacidproducingandmethaneproducingbacteria aredifferent.Methanogens convert theendproducts(mainlyH2andacetate)frompreviousstepstomethaneandCO2,thereforemaintainingalowpartialpressureofH2andshiftingtheequilibriumof fermentationreactions toward formationofmoreH2andacetate.WhenthisbalanceisdisturbedandmethanogensdonotutilizetheH2formedbyacidogensfastenough,accumulationofVFAs(volatilefattyacids)andadropinpHareobservedduetoslowfermentationofpropio-nateandbutyrate,resultingindigesterfailure(MetcalfandEddy,2003).
Inordertomaintainafavorableenvironmentforthismixedcultureofmicroorganisms,VFAproductionandutilizationratesshouldbebalanced.Withshortretentiontimes,VFAproductionmayexceedVFAutilization.Therate-limitingstepistheconversionofVFAsbymethanogenicorgan-ismsandnotthefermentationofsolublesubstratesbyacidogens.Digesterupsetcanoccurduetodisturbanceoftheproperbalancebetweenacidandmethaneformers(GhoshandPohland,1974).
Solids processing and disposal 255
pH isan importantparameteraffecting theenzymaticactivity sinceaspecificandnarrowpHrangeissuitablefortheactivationofeachenzyme.pHrangeinwhichthemethanogensworkefficientlyisfrom6.7to7.4.AsharppHdropbelow6.3indicatesthattherateoforganicacidsproductionisfasterthantherateofmethaneformation.Ontheotherhand,asharppHincreaseabove7.8canbeduetoashiftinNH4
+toNH3,whichisthetoxic,un-ionizedformofammonia(Gomecetal.,2002).
BufferingeffectofammoniareleasedfromaminoacidfermentationcanpreventthepHfallinanaerobicdigesters.Primarysludgefromdomesticwastewaterconsistsofhighamountsofproteinanddetergent.Alkalinity-generating cations like ammonium ions from protein degradation andsodiumfromsoapdegradationincreasethealkalinityandpH.
ThemicrobiologyofanaerobictreatmentprocessisdiscussedindetailinChapter11.Factorsaffectinggrowthandtoxicityarealsoprovided.Thediscussioninthefollowingsectionswillfocusonthedesignandoperationofanumberofanaerobicdigestersforstabilizationofsludge.Theseinclude(1) single-stage mesophilic digestion, (2) two-stage mesophilic digestion,(3) thermophilic anaerobic digestion, (4) temperature-phased anaerobicdigestion (TPAD), (5) acid-gas phased digestion, (6) Enhanced EnzymicHydrolysis™,and(7)Cambi™process.
12.5.2.1 Single-stage mesophilic digestion
Single-stagemesophilicdigesterscanbestandard-rateorhigh-ratedigest-ers.Standard-ratedigestersareusedmainlybysmallplantsprocessinglessthan4000m3/d,whilehigh-ratedigestersareusedby largerwastewatertreatmentplants (Peavy et al., 1985).Digesters canhavefixed coversorfloatingcoverstoadjustforvariablevolumesofsludgeandgasproduction.Single-stageconventionalfloatingcoverdigestersperformthreefunctions:(1)volatilesolidsdestruction,(2)gravitythickeningofdigestedsludge,and(3) storage of digested sludge (Hammer and Hammer, 2012). Optimumoperatingtemperatureis35°C,witharangeof30°Cto38°C.
Figure 12.6 illustratesa single-stage standard-ratemesophilicanaerobicdigester (MAD). The sludge is fed continuously or at regular intervals tothedigester.Thetemperatureismaintainedat35°Cbypassingthesludgethrough a separate sludge heater. The sludge is mixed to some extent bypumpingactiontoandfromthesludgeheater,inthezoneofactivedigestion.Ascumlayerformsontop,withthesupernatantliquidseparatingoutfromthesolids.Thesupernatantiswithdrawnandrecycledtotheplant.Thetotalsolidsarereducedby45%to50%.Thedigestedsludgeiswithdrawnfromthebottomandtransportedtodewateringprocesses.Solidsconcentrationofdigestedsludgerangesfrom4%to6%.Theproducedgasiscollected,whichconsistsofabout60%to70%methane,25%to35%carbondioxide,andtraceamountsofothergases.Thegascanbeusedforheatingpurposes.
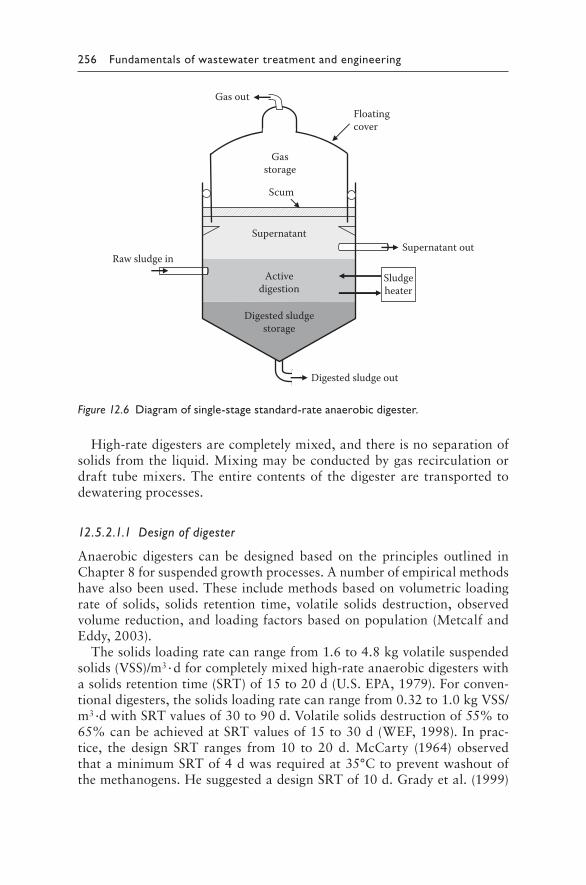
256 Fundamentals of wastewater treatment and engineering
High-ratedigestersarecompletelymixed,andthereisnoseparationofsolids fromthe liquid.Mixingmaybeconductedbygasrecirculationordraft tubemixers.Theentirecontentsof thedigesterare transported todewateringprocesses.
12.5.2.1.1 Design of digester
Anaerobic digesters can be designed based on the principles outlined inChapter8forsuspendedgrowthprocesses.Anumberofempiricalmethodshavealsobeenused.Theseincludemethodsbasedonvolumetricloadingrate of solids, solids retention time, volatile solids destruction, observedvolumereduction,andloadingfactorsbasedonpopulation(MetcalfandEddy,2003).
Thesolidsloadingratecanrangefrom1.6to4.8kgvolatilesuspendedsolids(VSS)/m3·dforcompletelymixedhigh-rateanaerobicdigesterswithasolidsretentiontime(SRT)of15to20d(U.S.EPA,1979).Forconven-tionaldigesters,thesolidsloadingratecanrangefrom0.32to1.0kgVSS/m3·dwithSRTvaluesof30to90d.Volatilesolidsdestructionof55%to65%canbeachievedatSRTvaluesof15to30d(WEF,1998).Inprac-tice, the design SRT ranges from 10 to 20 d. McCarty (1964) observedthataminimumSRTof4dwasrequiredat35°Ctopreventwashoutofthemethanogens.HesuggestedadesignSRTof10d.Gradyetal.(1999)
Digested sludgestorage
Activedigestion
SupernatantSupernatant out
Sludgeheater
Raw sludge in
Gasstorage
Gas out
Digested sludge out
Scum
Floatingcover
Figure 12.6 Diagram of single-stage standard-rate anaerobic digester.
Solids processing and disposal 257
proposedalowerSRTlimitof10dtoensureanadequatefactorofsafetyagainstwashout.TheyobservedthatincrementalchangesinvolatilesolidsdestructionwererelativelysmallforSRTvaluesabove15dat35°C.
Whenpopulationequivalentloadisusedtodesigndigesters,typicalval-uesusedare0.17m3(6ft3)tankvolumepercapitafordigestionofprimaryandwaste-activatedsludge,and0.11m3(4ft3)percapitafordigestionoftricklingfiltersludge(HammerandHammer,2012).
Whenthecharacteristicsofrawanddigestedsludgeareknown,thevol-umerequiredforasingle-stagestandard-ratedigestercanbecalculatedfromthefollowingequation(Peavyetal.,1985;HammerandHammer,2012):
VV V
t V tS = + +1 21 2 2
2 (12.11)
where:VS=volumeofstandard-ratedigester,m3
V1=rawsludgeloadingrate,m3/dV2=digestedsludgeaccumulationrate,m3/dt1=digestionperiod,dt2=digestedsludgestorageperiod,d
Forasingle-stagehigh-ratedigester,thevolumecanbecalculatedbasedonsolidsloadingrates,ordetentiontimes,oranyoftheotherempiricalmeth-odsmentionedabove.High-ratedigestersaredesignedascompletelymixedreactorswithoutsolidsrecycle.Foradesigndigestionperiod,thevolumecanbecalculatedfromthefollowing:
VH=V1t1 (12.12)
where:VH=volumeofhigh-ratedigester,m3
t1=digestionperiodorSRT,d
V1isasdefinedpreviously.ThedesignofmesophilicdigestersisillustratedinExample12.4.
12.5.2.1.2 Gas production and use
Gasproducedfromanaerobicdigestionusuallycontainsabout65%to70%methane; 25% to 30% carbon dioxide; and trace amounts of nitrogen,hydrogen,hydrogensulfide,watervapor,andothergases.Thevolumeofmethanegasproducedcanbeestimatedfromthefeedconcentrationsandbiomassproduced.Anumberofmathematicalrelationshipsareavailablein
258 Fundamentals of wastewater treatment and engineering
literature.Totalgasproductioncanbeestimatedfromtheamountofvola-tilesolidsreduction.Typicalvaluesrangefrom0.75to1.12m3/kgvolatilesolids(VS)destroyed(12to18ft3/lbVSdestroyed).Afirstapproximationofgasproductioncanalsobemadefromthepopulation.Forprimaryplantstreatingdomesticwastewater,thegasproductionisabout15to22m3/1000persons·d(0.6to0.8ft3/person·d),whileforsecondaryplantsthevalueisabout28m3/1000persons·d(1.0ft3/person·d)(MetcalfandEddy,2003).
Naturalgashasaheatingvalueof37,300kJ/m3 (1000BTU/ft3).Puremethanegasatstandardtemperatureandpressure(20°Cand1atm)hasaheatingvalueof35,800kJ/m3(960BTU/ft3).Digestergashasabout65%methane,whichhasaheatingvalueofapproximately22,400kJ/m3(600BTU/ft3).Digestergascanbeusedfuelforboilersandinternalcombustionengines.Theelectricitygeneratedisthenusedforpumpingwastewater,andheatingdigesters,amongotherpurposes.Itcanalsobeusedincogenera-tionofelectricityandsteam.
12.5.2.1.3 Digester heating
Heathastobeprovidedtoadigestertoachievethefollowing:(1)raisethetemperatureoffeedsludgetotemperatureofdigestiontank;(2)compen-sateforheatlossesthroughthefloor,wallsandcoverofthedigester;and(3)compensateforlossesinthepipingtotheheatexchanger.Thesludgeisheatedbytransportingthesludgetoanexternalheatexchangerandpump-ingitbacktothedigester.
Tocalculatetheenergyrequiredtoheattheincomingfeedsludge,itisassumedthatthespecificheatofincomingfeedsludgeisequaltothatofwater (4.186kJ/kg·K).Theheatrequiredtoraisethetemperatureof theincomingsludgecanbecalculatedusingthefollowingequation(MetcalfandEddy,2003;Davis,2011):
qr=MDCp(TD–TI) (12.13)
where:qr=heatrequired,kJ/dMD=massofsludgefedtodigester,kg/dCp=specificheatofwater=4.186kJ/kg·KTD=digestiontemperature,KTI=temperatureofincomingfeedsludge,K
Theheatlossesfromthewalls,floor,andcoverofthedigestercanbecal-culatedfromthefollowingequation:
ql=UAΔT (12.14)
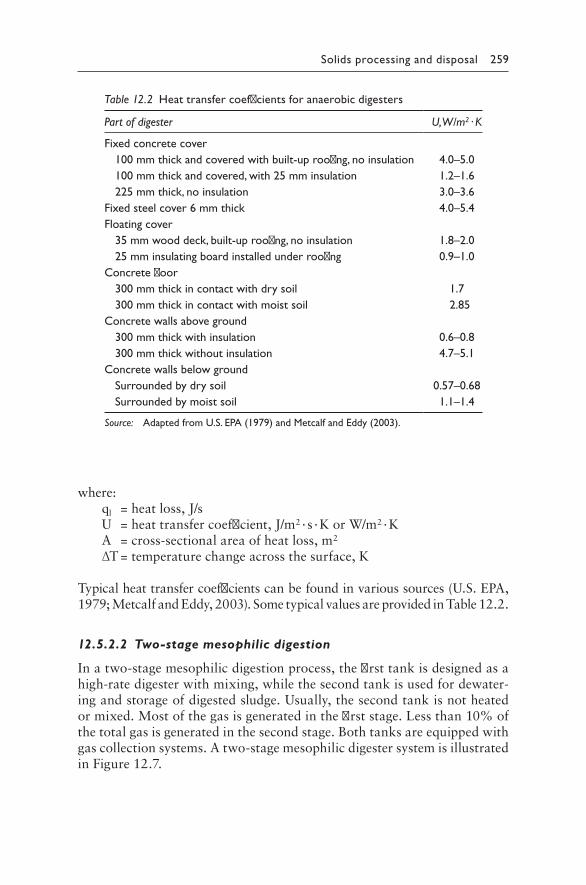
Solids processing and disposal 259
where:ql=heatloss,J/sU=heattransfercoefficient,J/m2·s·KorW/m2·KA=cross-sectionalareaofheatloss,m2
ΔT=temperaturechangeacrossthesurface,K
Typicalheattransfercoefficientscanbefoundinvarioussources(U.S.EPA,1979;MetcalfandEddy,2003).SometypicalvaluesareprovidedinTable 12.2.
12.5.2.2 Two-stage mesophilic digestion
Inatwo-stagemesophilicdigestionprocess,thefirsttankisdesignedasahigh-ratedigesterwithmixing,whilethesecondtankisusedfordewater-ingandstorageofdigestedsludge.Usually,thesecondtankisnotheatedormixed.Mostofthegasisgeneratedinthefirststage.Lessthan10%ofthetotalgasisgeneratedinthesecondstage.Bothtanksareequippedwithgascollectionsystems.Atwo-stagemesophilicdigestersystemisillustratedinFigure 12.7.
Table 12.2 Heat transfer coefficients for anaerobic digesters
Part of digester U, W/m2 · K
Fixed concrete cover100 mm thick and covered with built-up roofing, no insulation 4.0–5.0100 mm thick and covered, with 25 mm insulation 1.2–1.6225 mm thick, no insulation 3.0–3.6
Fixed steel cover 6 mm thick 4.0–5.4Floating cover
35 mm wood deck, built-up roofing, no insulation 1.8–2.025 mm insulating board installed under roofing 0.9–1.0
Concrete floor300 mm thick in contact with dry soil 1.7300 mm thick in contact with moist soil 2.85
Concrete walls above ground300 mm thick with insulation 0.6–0.8300 mm thick without insulation 4.7–5.1
Concrete walls below groundSurrounded by dry soil 0.57–0.68Surrounded by moist soil 1.1–1.4
Source: Adapted from U.S. EPA (1979) and Metcalf and Eddy (2003).
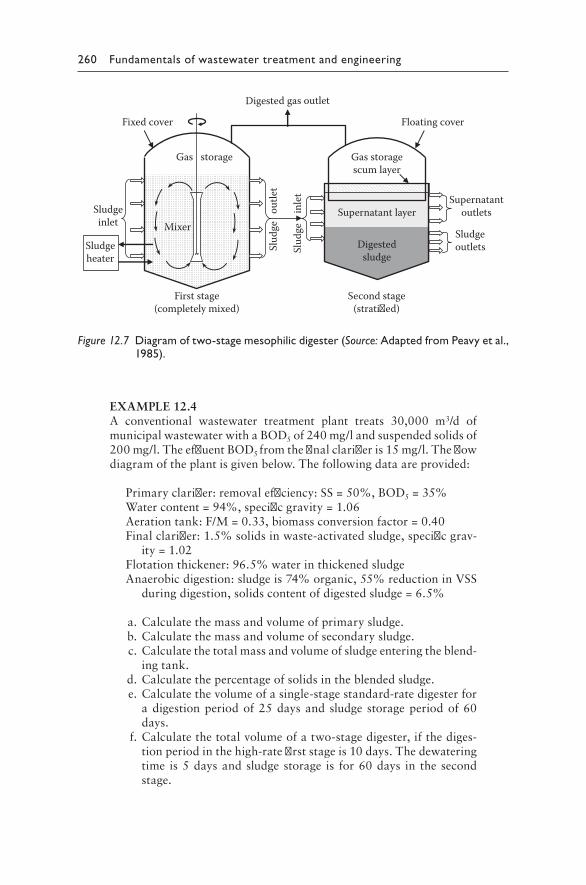
260 Fundamentals of wastewater treatment and engineering
EXAMPLE12.4A conventional wastewater treatment plant treats 30,000 m3/d ofmunicipalwastewaterwithaBOD5of240mg/landsuspendedsolidsof200mg/l.TheeffluentBOD5fromthefinalclarifieris15mg/l.Theflowdiagramoftheplantisgivenbelow.Thefollowingdataareprovided:
Primaryclarifier:removalefficiency:SS=50%,BOD5=35%Watercontent=94%,specificgravity=1.06Aerationtank:F/M=0.33,biomassconversionfactor=0.40Finalclarifier:1.5%solidsinwaste-activatedsludge,specificgrav-
ity=1.02Flotationthickener:96.5%waterinthickenedsludgeAnaerobicdigestion:sludgeis74%organic,55%reductioninVSS
duringdigestion,solidscontentofdigestedsludge=6.5%
a.Calculatethemassandvolumeofprimarysludge. b.Calculatethemassandvolumeofsecondarysludge. c.Calculatethetotalmassandvolumeofsludgeenteringtheblend-
ingtank. d.Calculatethepercentageofsolidsintheblendedsludge. e.Calculatethevolumeofasingle-stagestandard-ratedigesterfor
adigestionperiodof25daysand sludge storageperiodof60days.
f.Calculatethetotalvolumeofatwo-stagedigester,ifthediges-tionperiodinthehigh-ratefirststageis10days.Thedewateringtime is5daysandsludge storage is for60days in the secondstage.
Sludgeinlet
Sludgeheater
Slud
ge
inle
t
Slud
ge
outle
t
Supernatantoutlets
SludgeoutletsDigested
sludge
Supernatant layer
Gas storagescum layer
Floating coverFixed cover
Digested gas outlet
Gas storage
Mixer
First stage(completely mixed)
Second stage(strati�ed)
Figure 12.7 Diagram of two-stage mesophilic digester (Source: Adapted from Peavy et al., 1985).
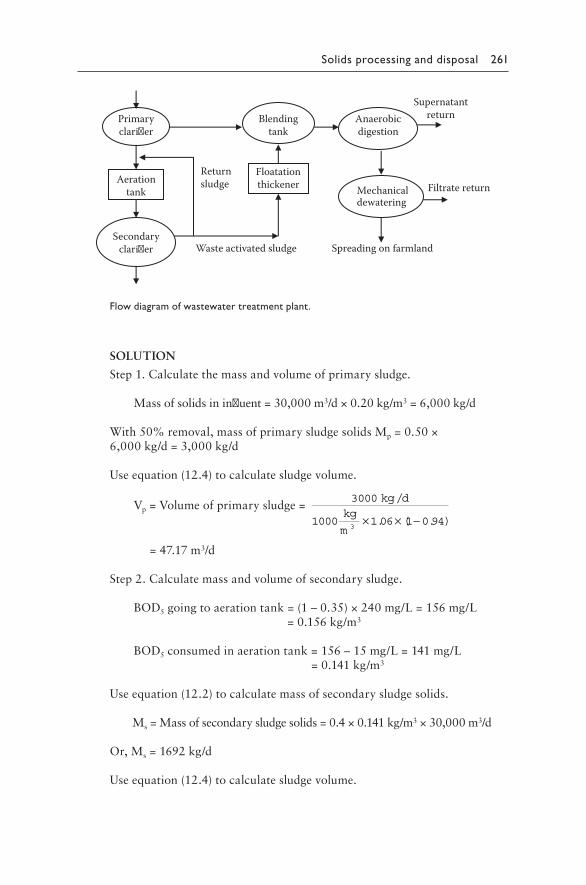
Solids processing and disposal 261
Supernatantreturn
Returnsludge Filtrate return
Waste activated sludge Spreading on farmland
Primaryclari�er
Aerationtank
Secondaryclari�er
Blendingtank
Floatationthickener
Anaerobicdigestion
Mechanical dewatering
Flow diagram of wastewater treatment plant.
SOLUTION
Step1.Calculatethemassandvolumeofprimarysludge.
Massofsolidsininfluent=30,000m3/d×0.20kg/m3=6,000kg/d
With50%removal,massofprimarysludgesolidsMp=0.50×6,000 kg/d=3,000kg/d
Useequation(12.4)tocalculatesludgevolume.
Vp=Volumeofprimarysludge=3000
1000 1 06 1 0 943
/
. ( . )
kg dkg
m× × −
=47.17m3/d
Step2.Calculatemassandvolumeofsecondarysludge.
BOD5goingtoaerationtank=(1–0.35)×240mg/L=156mg/L=0.156kg/m3
BOD5consumedinaerationtank=156–15mg/L=141mg/L=0.141kg/m3
Useequation(12.2)tocalculatemassofsecondarysludgesolids.
Ms=Massofsecondarysludgesolids=0.4×0.141kg/m3×30,000m3/d
Or,Ms=1692kg/d
Useequation(12.4)tocalculatesludgevolume.
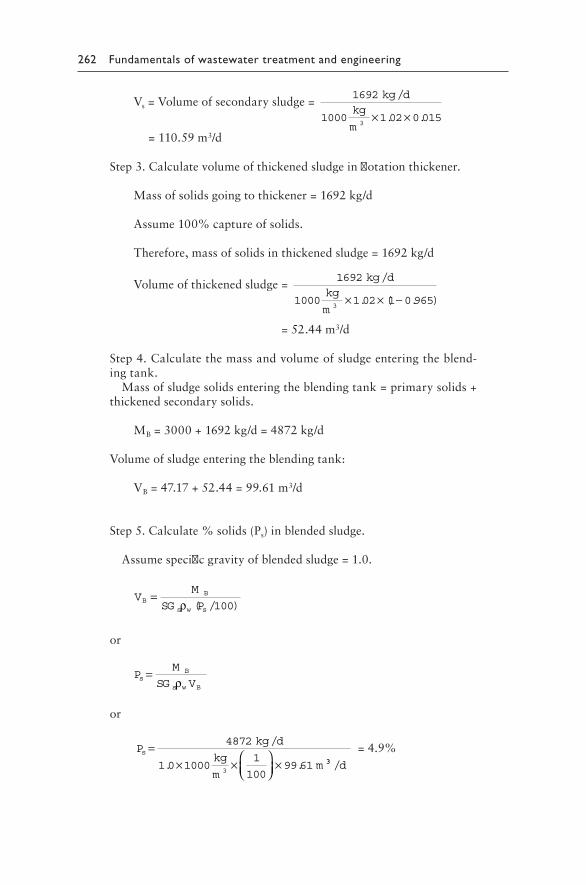
262 Fundamentals of wastewater treatment and engineering
Vs=Volumeofsecondarysludge=1692
1000 1 02 0 0153
/
. .
kg dkg
m× ×
=110.59m3/d
Step3.Calculatevolumeofthickenedsludgeinflotationthickener.
Massofsolidsgoingtothickener=1692kg/d
Assume100%captureofsolids.
Therefore,massofsolidsinthickenedsludge=1692kg/d
Volumeofthickenedsludge=1692
1000 1 02 1 0 9653
/
. ( . )
kg dkg
m× × −
=52.44m3/d
Step4.Calculatethemassandvolumeofsludgeenteringtheblend-ingtank.
Massofsludgesolidsenteringtheblendingtank=primarysolids+thickenedsecondarysolids.
MB=3000+1692kg/d=4872kg/d
Volumeofsludgeenteringtheblendingtank:
VB=47.17+52.44=99.61m3/d
Step5.Calculate%solids(Ps)inblendedsludge.
Assumespecificgravityofblendedsludge=1.0.
VM
SG PB
B
s w s
=ρ ( / )100
or
PM
SG Vs
B
s w B
=ρ
or
Pkg d
kg
mm
s =× ×
×
4872
1 0 10001
10099 61
3
/
. . 33 /d
=4.9%
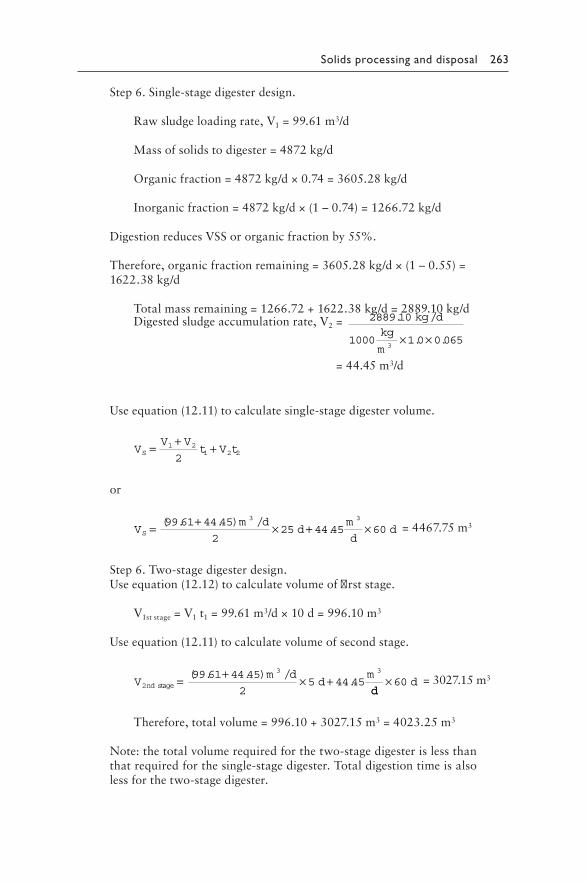
Solids processing and disposal 263
Step6.Single-stagedigesterdesign.
Rawsludgeloadingrate,V1=99.61m3/d
Massofsolidstodigester=4872kg/d
Organicfraction=4872kg/d×0.74=3605.28kg/d
Inorganicfraction=4872kg/d×(1–0.74)=1266.72kg/d
DigestionreducesVSSororganicfractionby55%.
Therefore,organicfractionremaining=3605.28kg/d×(1–0.55)=1622.38kg/d
Totalmassremaining=1266.72+1622.38kg/d=2889.10kg/d Digestedsludgeaccumulationrate,V2= 2889 10
1000 1 0 0 0653
. /
. .
kg dkg
m× ×
=44.45m3/d
Useequation(12.11)tocalculatesingle-stagedigestervolume.
VV V
t V tS = + +1 21 2 2
2
or
V
m dd
m
ddS = + × + ×( . . ) /
.99 61 44 45
225 44 45 60
3 3
=4467.75m3
Step6.Two-stagedigesterdesign.Useequation(12.12)tocalculatevolumeoffirststage.
V1ststage=V1t1=99.61m3/d×10d=996.10m3
Useequation(12.11)tocalculatevolumeofsecondstage.
V
m dd
mnd stage2
3 399 61 44 45
25 44 45
( . . ) /.= + × +
ddd×60 =3027.15m3
Therefore,totalvolume=996.10+3027.15m3=4023.25m3
Note:thetotalvolumerequiredforthetwo-stagedigesterislessthanthatrequiredforthesingle-stagedigester.Totaldigestiontimeisalsolessforthetwo-stagedigester.
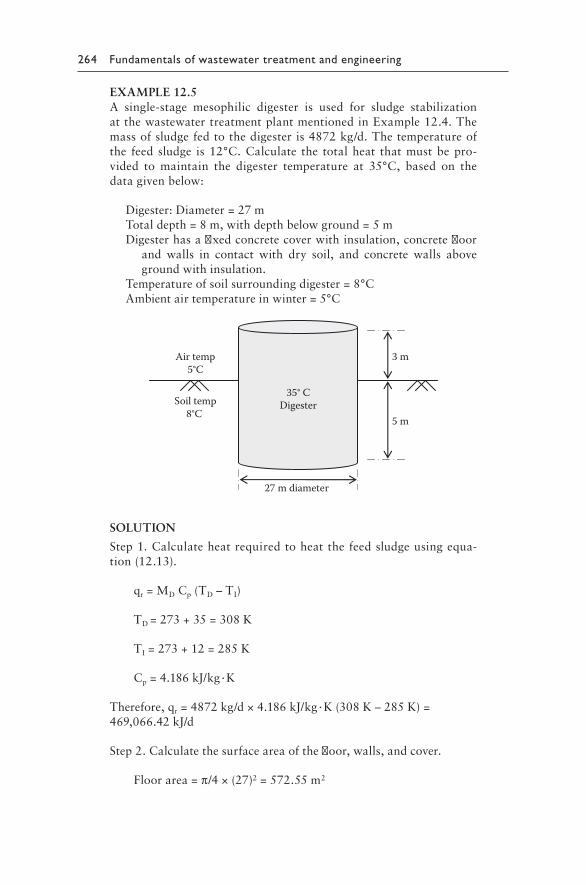
264 Fundamentals of wastewater treatment and engineering
EXAMPLE12.5A single-stage mesophilic digester is used for sludge stabilizationatthewastewatertreatmentplantmentionedinExample12.4.Themassofsludgefedtothedigesteris4872kg/d.Thetemperatureofthe feed sludge is12°C.Calculate the totalheat thatmustbepro-vided to maintain the digester temperature at 35°C, based on thedatagivenbelow:
Digester:Diameter=27mTotaldepth=8m,withdepthbelowground=5mDigesterhasafixedconcretecoverwithinsulation,concretefloor
and walls in contact with dry soil, and concrete walls abovegroundwithinsulation.
Temperatureofsoilsurroundingdigester=8°CAmbientairtemperatureinwinter=5°C
35° CDigester
Air temp5°C
Soil temp8°C
3 m
5 m
27 m diameter
SOLUTION
Step1.Calculateheatrequiredtoheatthefeedsludgeusingequa-tion(12.13).
qr=MDCp(TD–TI)
TD=273+35=308K
TI=273+12=285K
Cp=4.186kJ/kg·K
Therefore,qr=4872kg/d×4.186kJ/kg·K(308K–285K)=469,066.42kJ/d
Step2.Calculatethesurfaceareaofthefloor,walls,andcover.
Floorarea=π/4×(27)2=572.55m2
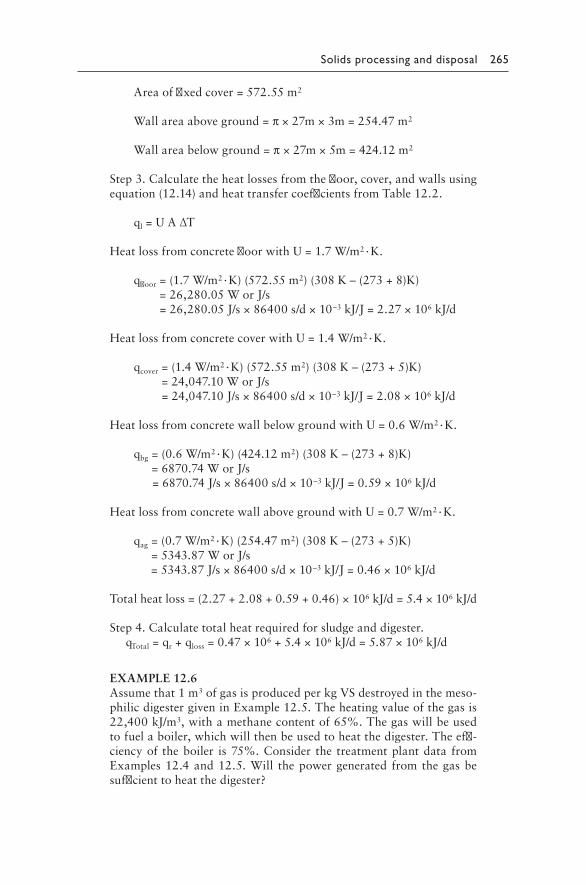
Solids processing and disposal 265
Areaoffixedcover=572.55m2
Wallareaaboveground=π×27m×3m=254.47m2
Wallareabelowground=π×27m×5m=424.12m2
Step3.Calculatetheheatlossesfromthefloor,cover,andwallsusingequation(12.14)andheattransfercoefficientsfromTable 12.2.
ql=UAΔT
HeatlossfromconcretefloorwithU=1.7W/m2·K.
qfloor=(1.7W/m2·K)(572.55m2)(308K–(273+8)K)=26,280.05WorJ/s=26,280.05J/s×86400s/d×10–3kJ/J=2.27×106kJ/d
HeatlossfromconcretecoverwithU=1.4W/m2·K.
qcover=(1.4W/m2·K)(572.55m2)(308K–(273+5)K)=24,047.10WorJ/s=24,047.10J/s×86400s/d×10–3kJ/J=2.08×106kJ/d
HeatlossfromconcretewallbelowgroundwithU=0.6W/m2·K.
qbg=(0.6W/m2·K)(424.12m2)(308K–(273+8)K)=6870.74WorJ/s=6870.74J/s×86400s/d×10–3kJ/J=0.59×106kJ/d
HeatlossfromconcretewallabovegroundwithU=0.7W/m2·K.
qag=(0.7W/m2·K)(254.47m2)(308K–(273+5)K)=5343.87WorJ/s=5343.87J/s×86400s/d×10–3kJ/J=0.46×106kJ/d
Totalheatloss=(2.27+2.08+0.59+0.46)×106kJ/d=5.4×106kJ/d
Step4.Calculatetotalheatrequiredforsludgeanddigester. qTotal=qr+qloss=0.47×10⁶+5.4×10⁶kJ/d=5.87×106kJ/d
EXAMPLE12.6Assumethat1m3ofgasisproducedperkgVSdestroyedinthemeso-philicdigestergiveninExample12.5.Theheatingvalueofthegasis22,400kJ/m3,withamethanecontentof65%.Thegaswillbeusedtofuelaboiler,whichwillthenbeusedtoheatthedigester.Theeffi-ciencyof theboiler is75%.Consider the treatmentplantdata fromExamples12.4and12.5.Will thepowergenerated from thegasbesufficienttoheatthedigester?
266 Fundamentals of wastewater treatment and engineering
SOLUTION
FromExample12.4:
VSSdestroyed=3605.28kg/d×0.55=1982.90kg/dTotalgasproduced=1982.90kg/d×1m3/kg=1982.90m3/dHeatingvalueofgas=22,400kJ/m3×1982.90m3/d=44.42×106kJ/dBoilerefficiency=75%Heatgeneratedbygas=44.42×106kJ/d×0.75=33.31×106kJ/d
FromExample12.5:Totalheatrequiredfordigester=5.87×10⁶kJ/d<<heatgeneratedbygasinboiler.The heat generated from the gas will be more than sufficient tomaintainthedigesterheatingrequirements.Excessgascanbeusedforotherpurposesattheplant,e.g.provideenergyforpumpingorotherpurposes.
12.5.2.3 Thermophilic anaerobic digestion
Thermophilic digestion takes place at temperature ranges from 50°C to60°C, with an optimum at 55°C. Advantages of thermophilic diges-tionwhen comparedwithmesophilic digestion are higher reaction ratesofdestructionoforganicmatter resulting in shorter retention timesandtherefore smaller reactor volumes, increased methane production dueto increased solids destruction, improved dewatering characteristics ofdigestedsludge,andhigherdestructionofpathogenicorganisms.Ontheotherhand,therearedisadvantagesassociatedwiththermophilicdigestionsuchashigherenergyrequirementsforheating,poorsupernatantquality,poor process stability, and increased odor problems (Metcalf and Eddy,2003). Thermophilic digestion is seldom used as a single-stage digester.Itistypicallyusedasafirststageinastagedprocess.Increasedpathogendestructionmakesitdesirable,especiallywhenthedigestedbiosolidsaretobeusedforspecificlandapplications.
Oneofthemajordrawbacksofthermophilicdigestionishighersen-sitivity of this process to environmental changes, e.g. temperature,accumulationofintermediateproductssuchasH2andacetate,andpro-pionateresultinginineffectiveconversionofVFAstomethane(vanLieretal.,1993).
Despite the higher substrate utilization and specific growth rates ofthermophilicmicroorganismswhencomparedwithmesophilicmicroor-ganisms,theyieldofthermophilicbacteriaperunitamountofsubstrateislower.Theloweryieldofthermophilicmicroorganismsmaybeduetotheirhigherenergyrequirementformaintenanceorthespecificmolecu-larpropertiesofenzymereactionsatthermophilictemperatures(Zeikus,1979).
Solids processing and disposal 267
12.5.2.4 Temperature-phased anaerobic digestion (TPAD)
Temperature-phasedanaerobicdigestion(TPAD)isatwo-stagedigestionsystem consistingof a thermophilic stage as thefirst step followedby amesophilicstageasthesecondstep(Hanetal.,1997).Bycombiningthethermophilicandmesophilicdigestionprocessesintoone,TPADofferstheadvantagesofbothwhileeliminatingtheproblemsassociatedwiththesesystemswhenoperatedindependently(HarikishanandSung,2003).TheTPADprocessisillustratedinFigure 12.8(a).
Thethermophilicstepprovidesincreasedrateofdegradationofcomplexorganicsandimprovespathogenreduction.Ontheotherhand,themeso-philicstageisusedasthepolishingstagehelpingtodiminishthedrawbacks
(a)
(b)
(c)
(d)
Rawsludge
42°C 42°C 42°C 55°C 55°C 55°C 35°C
Gas
Treatedsludge
E�uent
SRT = 1–2d SRT > 10d
Raw sludge 55°C
Acid phase Gas phase
35°Cor
55°C
35°Cor
55°C
SRT = 1–3d SRT > 10d
Raw sludge 35°C
Acid phase Gas phase
35°C
SRT = 3–5d SRT = 7–15d
Raw sludge 55°C
Figure 12.8 (a) TPAD process, (b) acid-gas phased digestion with mesophilic acid phase, (c) acid-gas phased digestion with thermophilic acid phase (d) Enhanced Enzymic Hydrolysis (EEHTM) process.
268 Fundamentals of wastewater treatment and engineering
ofthethermophilicstagesuchaspoorprocessstabilityandpooreffluentquality(SungandSantha,2003).
12.5.2.5 Acid-gas phased digestion
Theacid-gas-phaseddigestionsystemprovides the separationof the twomain stages of anaerobic biodegradation—hydrolysis/acidogenesis/aceto-genesisandmethanogenesissteps—increasingtheprocessstability.Ingen-eral,thermophilictemperaturesareusedfortheacid-formingstep,havingtheadvantageofhigherdestructionratesoforganicsolidsandincreaseddestructionofpathogens.HydraulicretentiontimehasaconsiderableeffectonthepopulationlevelsofmethanogensandcompositionoffermentativeproductslikeVFAs(Fukushietal.,2003).Inadditiontothermophilictem-peratures, short retention timesareadopted for thepretreatment step inorder to inhibit methanogenic population and increase acid production.Thesecondstepisthemethane-formingstep,whereneutralpHconditionsandalongerSRTareprovidedforthegrowthofmethane-formingbacteriaandformaximizinggasproduction.
Oneoptionfortwo-phasesystemsisemployingthermophilicanaerobicdigestionasthepretreatmentstepfollowedbymesophilicanaerobicdiges-tion.Anotheroptionistouseamesophilicacid-formingstepfollowedbyamesophilicorthermophilicmethane-formingstep.Theseoptionsareillus-tratedinFigure 12.8(b)and(c).
Enhanced pathogen destruction in two-phase anaerobic digestion isthoughttobearesultofthecombinedeffectofpHandacidconcentration.Anumberofstudieshavebeenconductedtoobservetheseparateandcom-binedeffectsofpHandorganicacidconcentrationonpathogendestruc-tion(Fukushietal.,2003andSalsalietal.,2006).
12.5.2.6 Enhanced enzymic hydrolysisTM
In January 2002, legislation was enacted in the United Kingdom (UK)thatrequiredpathogenreduction inmunicipalwastewatersludgefor thefirsttime.Thisnewrequirementledmanyutilitiestosearchformethodstooptimize theirexistinganaerobicdigestionsystems(Cumiskey,2005),particularlymesophilicdigesters,which included themajorityofoperat-ingsystems intheUKatthattime.OnesuchprocesswastheEnhancedEnzymicHydrolysisTM(EEHTM)processdevelopedbyUnitedUtilities(inUK)inpartnershipwithMonsalLimited.
The EEH process uses acid-phase digestion for hydrolysis of complexorganiccompoundsandVFAproduction,followedbybatchthermophilicanaerobicdigestionforpasteurization,andcontinuousmesophilicanaero-bicdigestionformethaneproductionandstabilization.Thecombinationof
Solids processing and disposal 269
42°Cand55°Ctemperaturesprovideimprovedhydrolyticactivitiestogetherwithpasteurizationtoachieverequiredpathogenreduction(Werkeretal.,2007).Theenzymehydrolysisstepbreaksdowncellwalllipoproteinstruc-tures,enhancingthedigestionprocess.TheEEHprocessschematicispre-sentedinFigure 12.8(d).
TheEEHprocessutilizesanovelplug-flowdigesteroperationthatpro-vides the ideal condition for maximum production of digestive enzymesthatare responsible forpathogendestructionandVFAproduction.Thisenablesapathogendestructionrateof99.9999%(LeandHarrison,2006).Inthisprocess,thesludgeisprefermentedat42°Cfollowedbypasteuriza-tionat55°C,fromwherethesludgeistransferredtoamesophilicdigester.AccordingtoWerkeretal.(2007),theEEHprocesshasachieved6logE. coliremoval,eliminationofSalmonella,andhasenhancedvolatilesolidsdestructionby10%attheBlackburnWastewaterTreatmentPlantintheUK.
12.5.2.7 CambiTM process
TheCambiTMprocesswasdevelopedinNorwayinthe1990s.Itisapat-entedsludgepretreatmentprocess.Theprocesshasbeeninstalledinwaste-water treatment plants in Norway, Denmark, Japan, Ireland, Scotland,and England (Greater Vancouver Regional District, 2005). The processinvolvestheoxidationofsludgeunderelevatedtemperatureandpressure.Undertheseconditions,pathogensaredestroyedandcellhydrolysisoccurs,releasingenergy-richcompounds.Followinghydrolysis,sludgeisfedtoananaerobicdigester,whereitreadilybreaksdown,resultinginhighvolatilesolidsdestruction (approximately65%)and increasedbiogasproductioncomparedwithconventionalanaerobicdigestion.
In the Cambi process, primary and secondary sludge is dewatered toapproximately17%solidsbeforeenteringapulpingvessel.Inthepulpingvessel,themixedsludgeisheatedtoapproximately80°C,andthentrans-ferredtothethermalhydrolysisdigestervessel,whereitisheatedto160°Catapressureofapproximately5.5barfor15to30minutes.Afterdiges-tion,thesludgeisreleasedtoaflash tank,whichisatatmosphericpres-sure.Thepressuredropbetweenthedigesterandtheflashtankcausescelllysisandadecreaseintemperatureto100°C.Aseriesofheatrecoveryandheattransfersystemsisrequiredtooptimizetheenergyuseoftheprocess.Sludgeintheflashtankisdilutedwithtreatedeffluenttoensurethatthesolidsconcentrationinthedigesterisnotexcessive.Figure 12.9providesaflowdiagramoftheCambiprocess.Afterthermalhydrolysistheviscosityofsludgeissignificantlyreduced,thusallowingthedigestertobeoperatedatsolidsconcentrationsofabout9%.ThedigestersizescanbesignificantlyreducedintheCambiprocess.
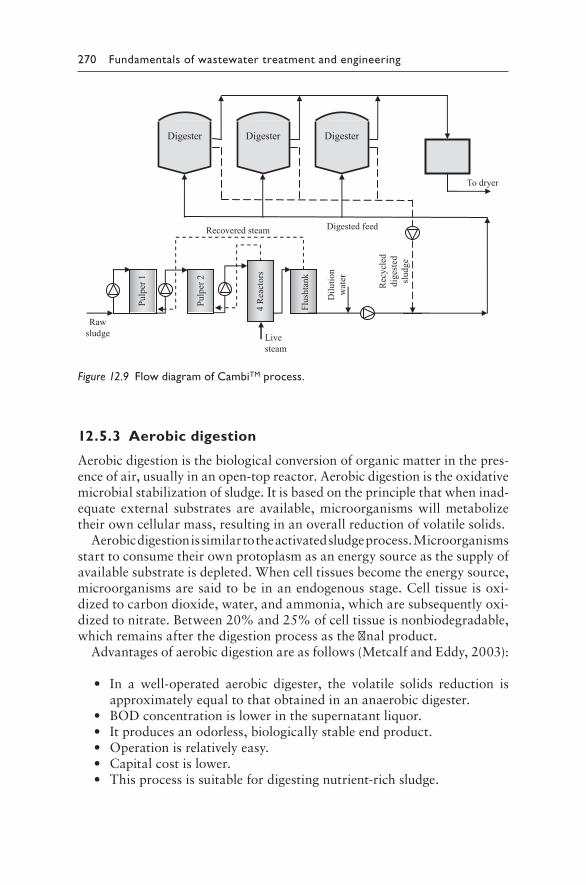
270 Fundamentals of wastewater treatment and engineering
12.5.3 Aerobic digestion
Aerobicdigestionisthebiologicalconversionoforganicmatterinthepres-enceofair,usuallyinanopen-topreactor.Aerobicdigestionistheoxidativemicrobialstabilizationofsludge.Itisbasedontheprinciplethatwheninad-equate external substrates are available,microorganismswillmetabolizetheirowncellularmass,resultinginanoverallreductionofvolatilesolids.
Aerobicdigestionissimilartotheactivatedsludgeprocess.Microorganismsstarttoconsumetheirownprotoplasmasanenergysourceasthesupplyofavailablesubstrateisdepleted.Whencelltissuesbecometheenergysource,microorganismsaresaidtobeinanendogenousstage.Celltissueisoxi-dizedtocarbondioxide,water,andammonia,whicharesubsequentlyoxi-dizedtonitrate.Between20%and25%ofcelltissueisnonbiodegradable,whichremainsafterthedigestionprocessasthefinalproduct.
Advantagesofaerobicdigestionareasfollows(MetcalfandEddy,2003):
• In a well-operated aerobic digester, the volatile solids reduction isapproximatelyequaltothatobtainedinananaerobicdigester.
• BODconcentrationislowerinthesupernatantliquor.• Itproducesanodorless,biologicallystableendproduct.• Operationisrelativelyeasy.• Capitalcostislower.• Thisprocessissuitablefordigestingnutrient-richsludge.
Figure 12.9 Flow diagram of CambiTM process.
Solids processing and disposal 271
Disadvantagesofaerobicdigestionareasfollows:
• Thecostofpowerishigher,relativetothesupplyofrequiredoxygen.• Digestedsolidshaveinferiormechanicaldewateringcharacteristics.• Theprocess is significantlyaffectedby temperature, location, tank
geometry,concentrationoffeed,andtypeofmixing/aeration.
Somevariationsandcombinationsofaerobicandanaerobicdigestionpro-cessesarepresentedinthefollowingsection.
12.5.3.1 Autothermal thermophilic aerobic digestion
Autothermalthermophilicaerobicdigestion(ATAD)isasolidstreatmentprocess where heat is released by the aerobic microbial degradation oforganicmatter(Layden,2007).InATAD,theheatreleasedbythediges-tionprocessisthemajorheatsourceusedtoachievethedesiredoperatingtemperature.For theATADoperation, feedsludge is typically thickenedto4%–6%totalsolids(TS)andVSdestructionprovidesheatproductionthatresultsinautothermalconditions.Thermophilictemperaturesbetween55°Cand70°Ccanbeachievedwithoutexternalheatinputbyusingtheheat released from themicrobial oxidationprocess.About20,000kJofheatisproducedperkgVSdestroyed(MetcalfandEddy,2003).However,sometimesanoutsideheatsourceisrequiredwhenthesolidscontentoftherawsludgeisnothighenoughtoachievethedesiredtemperature.
ThemainadvantagesoftheATADprocessareasfollows:
• Shorterretentiontimes(5to6d)canbeusedtoachieve30%to50%VSdestruction.
• Pathogendestructionisgreater.• Simplicityofoperation.
Thedisadvantagesincludethefollowing:
• Odorproduction• Lackofnitrification• Poordewateringcapabilitiesofdigestedsludge
12.5.3.2 Dual digestion
Thedualdigestion(DD)processinvolvestheuseofaerobicthermophilicdigestion followed by anaerobic digestion. Typically, an ATAD processwitharelativelyshortretentiontimeisusedasapretreatmentsteptomeso-philicanaerobicdigestion.This is termedasdual digestion (Wardetal.,1998; Zabranska et al., 2003). In the ATAD step, solids are pretreated
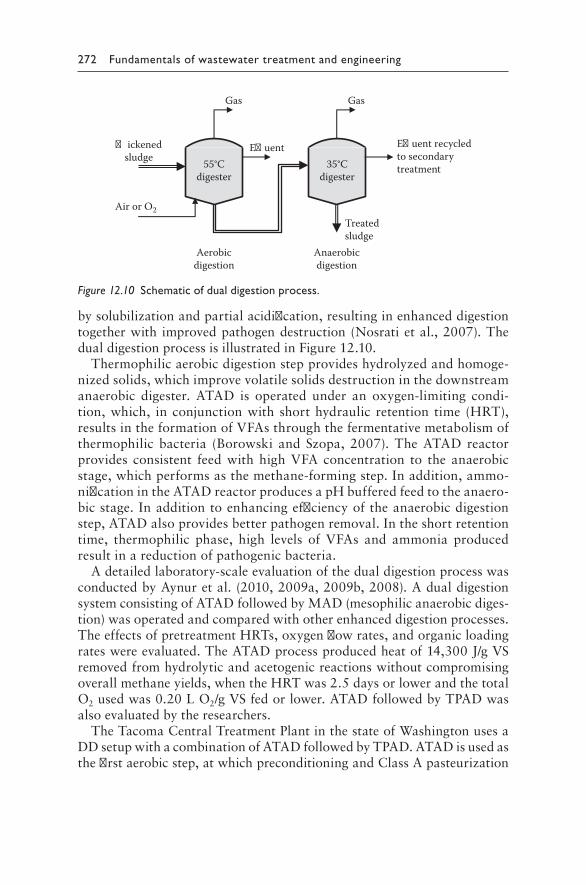
272 Fundamentals of wastewater treatment and engineering
bysolubilizationandpartialacidification,resultinginenhanceddigestiontogetherwith improvedpathogendestruction(Nosratietal.,2007).ThedualdigestionprocessisillustratedinFigure 12.10.
Thermophilicaerobicdigestionstepprovideshydrolyzedandhomoge-nizedsolids,whichimprovevolatilesolidsdestructioninthedownstreamanaerobic digester. ATAD is operated under an oxygen-limiting condi-tion,which, inconjunctionwith shorthydraulic retention time (HRT),resultsintheformationofVFAsthroughthefermentativemetabolismofthermophilic bacteria (Borowski andSzopa, 2007).TheATAD reactorprovides consistent feedwithhighVFAconcentration to the anaerobicstage,whichperformsasthemethane-formingstep.Inaddition,ammo-nificationintheATADreactorproducesapHbufferedfeedtotheanaero-bicstage.Inadditiontoenhancingefficiencyoftheanaerobicdigestionstep,ATADalsoprovidesbetterpathogenremoval.Intheshortretentiontime, thermophilic phase, high levels of VFAs and ammonia producedresultinareductionofpathogenicbacteria.
Adetailedlaboratory-scaleevaluationofthedualdigestionprocesswasconductedbyAynuretal.(2010,2009a,2009b,2008).AdualdigestionsystemconsistingofATADfollowedbyMAD(mesophilicanaerobicdiges-tion)wasoperatedandcomparedwithotherenhanceddigestionprocesses.TheeffectsofpretreatmentHRTs,oxygenflowrates,andorganicloadingrateswereevaluated.TheATADprocessproducedheatof14,300J/gVSremovedfromhydrolyticandacetogenicreactionswithoutcompromisingoverallmethaneyields,whentheHRTwas2.5daysorlowerandthetotalO2usedwas0.20LO2/gVSfedorlower.ATADfollowedbyTPADwasalsoevaluatedbytheresearchers.
TheTacomaCentralTreatmentPlantinthestateofWashingtonusesaDDsetupwithacombinationofATADfollowedbyTPAD.ATADisusedasthefirstaerobicstep,atwhichpreconditioningandClassApasteurization
55°Cdigester
�ickenedsludge
Gas
E�uent E�uent recycledto secondarytreatment
Gas
Treatedsludge
Air or O2
Aerobicdigestion
Anaerobicdigestion
35°Cdigester
Figure 12.10 Schematic of dual digestion process.
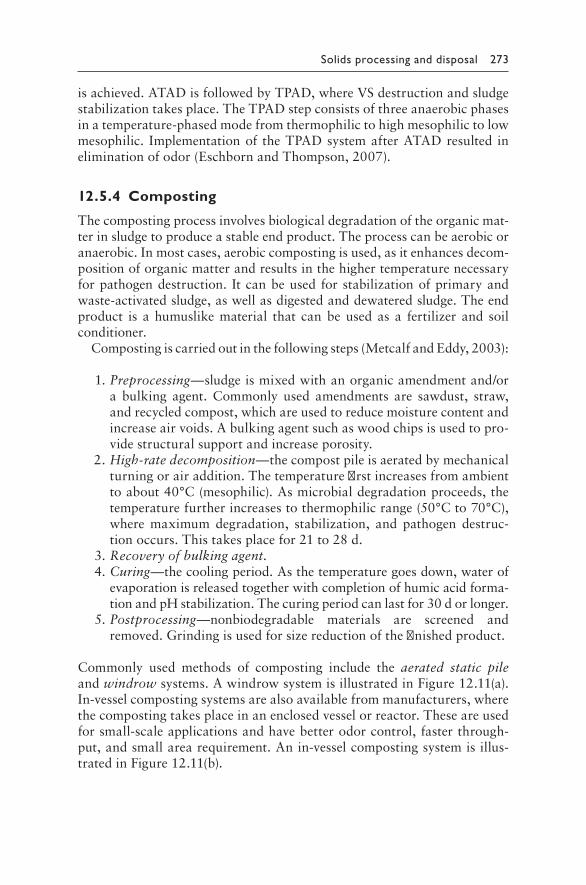
Solids processing and disposal 273
isachieved.ATADisfollowedbyTPAD,whereVSdestructionandsludgestabilizationtakesplace.TheTPADstepconsistsofthreeanaerobicphasesinatemperature-phasedmodefromthermophilictohighmesophilictolowmesophilic. Implementationof theTPADsystemafterATADresulted ineliminationofodor(EschbornandThompson,2007).
12.5.4 Composting
Thecompostingprocessinvolvesbiologicaldegradationoftheorganicmat-terinsludgetoproduceastableendproduct.Theprocesscanbeaerobicoranaerobic.Inmostcases,aerobiccompostingisused,asitenhancesdecom-positionoforganicmatterandresultsinthehighertemperaturenecessaryforpathogendestruction. Itcanbeusedforstabilizationofprimaryandwaste-activatedsludge,aswellasdigestedanddewateredsludge.Theendproduct is a humuslikematerial that canbeused as a fertilizer and soilconditioner.
Compostingiscarriedoutinthefollowingsteps(MetcalfandEddy,2003):
1.Preprocessing—sludgeismixedwithanorganicamendmentand/ora bulking agent. Commonly used amendments are sawdust, straw,andrecycledcompost,whichareusedtoreducemoisturecontentandincreaseairvoids.Abulkingagentsuchaswoodchipsisusedtopro-videstructuralsupportandincreaseporosity.
2. High-rate decomposition—thecompostpileisaeratedbymechanicalturningorairaddition.Thetemperaturefirstincreasesfromambienttoabout40°C(mesophilic).Asmicrobialdegradationproceeds,thetemperaturefurtherincreasestothermophilicrange(50°Cto70°C),where maximum degradation, stabilization, and pathogen destruc-tionoccurs.Thistakesplacefor21to28d.
3.Recovery of bulking agent. 4.Curing—thecoolingperiod.Asthetemperaturegoesdown,waterof
evaporationisreleasedtogetherwithcompletionofhumicacidforma-tionandpHstabilization.Thecuringperiodcanlastfor30dorlonger.
5.Postprocessing—nonbiodegradable materials are screened andremoved.Grindingisusedforsizereductionofthefinishedproduct.
Commonly used methods of composting include the aerated static pileandwindrowsystems.AwindrowsystemisillustratedinFigure 12.11(a).In-vesselcompostingsystemsarealsoavailablefrommanufacturers,wherethecompostingtakesplaceinanenclosedvesselorreactor.Theseareusedforsmall-scaleapplicationsandhavebetterodorcontrol,fasterthrough-put,andsmallarearequirement.Anin-vesselcompostingsystemisillus-tratedinFigure 12.11(b).
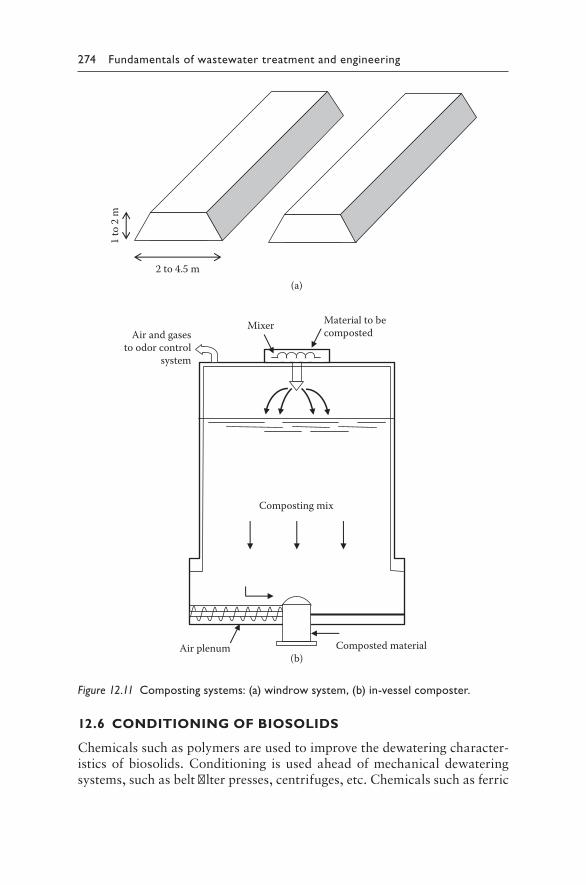
274 Fundamentals of wastewater treatment and engineering
12.6 CONDITIONING OF BIOSOLIDS
Chemicalssuchaspolymersareusedtoimprovethedewateringcharacter-isticsofbiosolids.Conditioning isusedaheadofmechanicaldewateringsystems,suchasbeltfilterpresses,centrifuges,etc.Chemicalssuchasferric
(a)
(b)Composted materialAir plenum
Composting mix
Material to becompostedMixer
Air and gasesto odor control
system
2 to 4.5 m
1 to
2 m
Figure 12.11 Composting systems: (a) windrow system, (b) in-vessel composter.
Solids processing and disposal 275
chloride,lime,alum,andpolymersareaddedtothebiosolids.Thesecausecoagulationofthesolidsandthereleaseofabsorbedwater.Themoisturecontentcanbereducedfrommorethan90%toarangeof65%to85%.Besides chemical conditioning, other methods such as heat treatment orfreeze–thawarealsousedtoalimitedextentatsomeplants.
12.7 BIOSOLIDS DEWATERING
Theprocessofdewateringisusedtoreducethevolumeoftreatedsludgeorbiosolidsbyreducingthewatercontent.Dewateringisaphysicalunitoperation.Dewateredsludgeiseasiertohandleandtransportforfinaldis-posal.Volumereductionreducestransportationcosts.Dewateringisusu-allyrequiredpriortocomposting,incineration,andlandfilling.Anumberofdewateringmethodsareusedatvarioustreatmentplants.Theseincludecentrifugation,belt-filterpress,recessed-platefilterpress,dryingbeds,andlagoons.Heatdryingisalsousedinsomeinstallations.Someofthesemeth-odsaredescribedindetailinthefollowingsections.
12.7.1 Centrifugation
Centrifugationisapopularmethodfordewateringbiosolids.Centrifugationisusedforthickeningaswellasdewateringstabilizedsludges.Thesolid-bowl centrifugeusedforsludgethickeninghasbeendescribedinSection12.4.3. The high-solids centrifuge used for dewatering biosolids is pre-sentedinthissection.
12.7.1.1 High-solids centrifuge
Thehigh-solidscentrifugeisamodificationofthesolid-bowlcentrifuge.It has a longer bowl length, lower differential bowl speed to increaseresidencetime,andamodifiedscroll toprovideapressingactionattheend.Polymerapplicationisrequired.Solidscontentrangingfrom10%to35%maybeachieved.Thecentrate isusuallyhigh insuspendedsolids,whichcanposeproblemswhenitisrecycledbacktotheplant.Chemicalconditioningorincreasedresidencetimeinthecentrifugecanbeusedtoincreasesolidscaptureandreducesolidsloadinthecentrate.Thepowercostsarehigh.
Thereareanumberofadvantagesofthecentrifugationprocess:
• Lowinitiallost• Smallerfootprintcomparedwithotherdewateringprocesses• Highsolidsconcentrationindewateredcake• Lowodorgenerationastheunitisenclosed
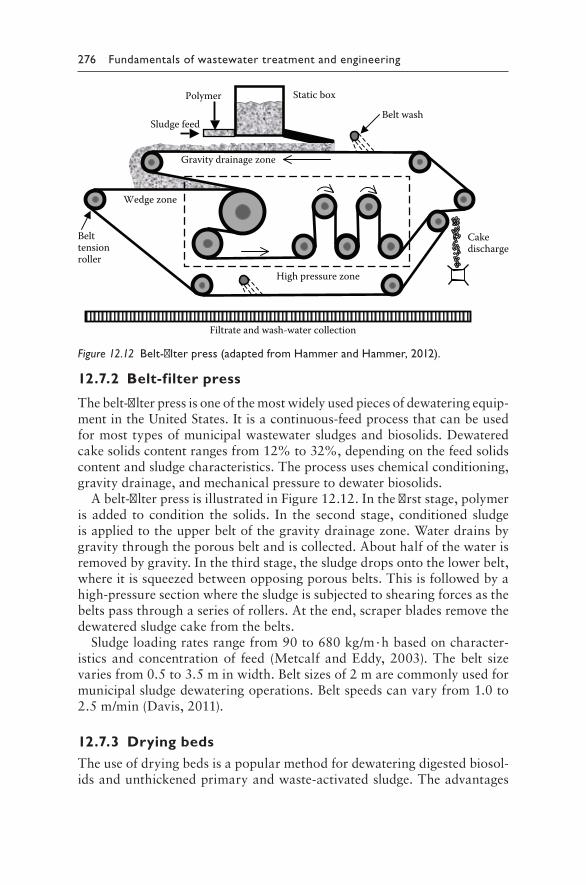
276 Fundamentals of wastewater treatment and engineering
12.7.2 Belt-filter press
Thebelt-filterpressisoneofthemostwidelyusedpiecesofdewateringequip-mentintheUnitedStates.Itisacontinuous-feedprocessthatcanbeusedformosttypesofmunicipalwastewatersludgesandbiosolids.Dewateredcakesolidscontentrangesfrom12%to32%,dependingonthefeedsolidscontentandsludgecharacteristics.Theprocessuseschemicalconditioning,gravitydrainage,andmechanicalpressuretodewaterbiosolids.
Abelt-filterpressisillustratedinFigure 12.12.Inthefirststage,polymeris added to condition the solids. In the second stage, conditioned sludgeisappliedtotheupperbeltofthegravitydrainagezone.Waterdrainsbygravitythroughtheporousbeltandiscollected.Abouthalfofthewaterisremovedbygravity.Inthethirdstage,thesludgedropsontothelowerbelt,whereitissqueezedbetweenopposingporousbelts.Thisisfollowedbyahigh-pressuresectionwherethesludgeissubjectedtoshearingforcesasthebeltspassthroughaseriesofrollers.Attheend,scraperbladesremovethedewateredsludgecakefromthebelts.
Sludgeloadingratesrangefrom90to680kg/m·hbasedoncharacter-istics andconcentrationof feed (Metcalf andEddy,2003).Thebelt sizevariesfrom0.5to3.5minwidth.Beltsizesof2marecommonlyusedformunicipalsludgedewateringoperations.Beltspeedscanvaryfrom1.0to2.5m/min(Davis,2011).
12.7.3 Drying bedsTheuseofdryingbedsisapopularmethodfordewateringdigestedbiosol-idsandunthickenedprimaryandwaste-activatedsludge.Theadvantages
Cakedischarge
Filtrate and wash-water collection
Belttensionroller
Wedge zone
High pressure zone
Belt wash
Polymer Static box
Gravity drainage zone
Sludge feed
Figure 12.12 Belt-filter press (adapted from Hammer and Hammer, 2012).
Solids processing and disposal 277
ofthemethodarelowcost,lowmaintenance,andhighsolidscontentinthe dried cake. The disadvantages include large land requirement, odorproblems, rodentproblems, impactofweather,and labor-intensivedriedproduct removal.There are a number of different types of dryingbeds,includingconventionalsandbeds,pavedbeds,artificialmediabeds,solardryingbeds,andvacuum-assistedbeds.
12.8 DISPOSAL OF BIOSOLIDS
Afterthickening,stabilization,anddewateringcomesthedisposalofthetreated sludgeandbiosolids.Disposal canbeby incinerationorby landapplicationandlandfilling.Theselectionofdisposalmethoddependsonregulatoryrequirementsandthedegreeoftreatmentreceivedbythesludge.Someofthecommonmethodsaredescribedinthefollowingsections.
12.8.1 Incineration
Incinerationisthecompletecombustionoforganicmatterinthesludgetoendproductssuchascarbondioxide,water,andash.Dewatered,untreatedsludgeisusedasfeedtotheincinerator.Theproductashhastobedisposedofinanappropriatemannerdependingonwhetheritcontainshazardousmaterials.Thegeneratedgasesarepassedthroughscrubbersandotherairpollutioncontroldevicestoremoveairpollutantsofconcernbeforereleas-ing them to the atmosphere. Examples of combustion processes includemultiplehearthincineration,fluidizedbedincineration,andcoincinerationwithmunicipalsolidwaste.
Theadvantagesofincinerationareasfollows(MetcalfandEddy,2003):
• Maximumvolumereductionisachieved.• Pathogensandtoxiccompoundsaredestroyed.• Thereispotentialforenergyrecovery.
Thedisadvantagesincludethefollowing:
• Capitalandoperatingcostsarehigh.• Hazardouswastemaybeproducedasaby-product.• Emissionofairpollutantsisamajorconcern.
12.8.2 Land disposal methods
Biosolidsmaybedisposedon land inanumberofways, including landapplication, landfilling,andbeneficial reuse.Landapplicationcanbeon(1)agriculturalland,(2)forestland,(3)disturbedland,or(4)adedicated
278 Fundamentals of wastewater treatment and engineering
landdisposalsite.Recyclingbiosolidsthroughlandapplicationhasseveraladvantages(U.S.EPA,2000):
• Biosolidsprovideessentialnutrients,suchasnitrogenandphospho-rus,toplants.Theyalsocontainothermicronutrients,e.g.nickel,zinc,andcopper.Theycanserveasanalternativetochemicalfertilizers.
• Thenutrientsinbiosolidsarepresentinorganicform.Assuch,theyarereleasedslowlytotheplantsandarelesssusceptibletorunoff.
• Biosolidsimprovesoiltextureandwater-holdingcapacity.Theycanenhancerootgrowthandincreasedroughttoleranceofvegetation.
• Biosolidscanbeusedtostabilizeandrevegetatelandsimpairedbymining, dredging, and construction activities, as well as by firesandlandslides.
• Biosolids are used in silviculture to increase forest productivity byacceleratingtreegrowth,especiallyonmarginallyproductivesoil.
Theselectionofdisposalmethodandsiteisdictatedbylocalandstatereg-ulationsandthedegreeoftreatmentreceivedbythesludge.TheregulatoryrequirementsfordisposalofbiosolidsintheUnitedStatesarepresentedinthefollowingsection.
12.9 BIOSOLIDS DISPOSAL REGULATIONS IN THE UNITED STATES
OnFebruary19,1993,theU.S.EnvironmentalProtectionAgencyundertheauthorityoftheCleanWaterActpromulgatedrisk-basedregulationsfor theuseanddisposalof sewagesludge (U.S.EPA,1993).Theregula-tionswereforsludgefrommunicipalwastewatertreatmentplantsthatwasappliedon land,soldorgivenawayforuse inhomegardens,and incin-erated. The regulations pertaining to land application are known as 40CFRPart503,aspublishedintheFederalRegisterastheCodeofFederalRegulations(CFR),andwillbediscussedinthissection.Theregulationsareapplicabletoalltreatmentplantsthatuselandapplicationforfinaldis-posalofbiosolids.Theregulationsareselfimplementing,i.e.permitsarenotrequiredbytheplants.However,failuretoconformtotheregulationsisaviolationofthelaw.Frequencyofmonitoringandreportingrequire-mentsareprovidedindetail.
The40CFRPart503regulationsspecifyanumberofmethodsforsludgestabilization,whichincludedigestion,composting,andlimestabilization,amongothers.Maximumconcentrationsofmetalsthatcannotbeexceededaregivenasceiling concentrations.Inaddition,cumulative pollutant load-ing rates for eightmetals are established,whichmaynotbe exceeded atland application sites. A third set of metals criteria, known as pollutant
Solids processing and disposal 279
concentrations, areprovided. If these concentrationsarenot exceeded inthebiosolids,thenthecumulativepollutantloadingratesdonothavetobemonitored.
ThePart503ruledefinestwomaintypesofbiosolidsaccordingtothelevelofpathogenreduction:ClassAandClassB.Class Abiosolidscanbeappliedtolandwithoutanyrestrictions.ClassAbiosolidshavepathogensbelowdetectionlimits,moststringentmetallimits,andvectorattractionstandards.Thetermexceptional quality biosolidsisalsousedforClassAbiosolids.Class Bbiosolidshavelessertreatmentrequirements.ClassBbio-solidscanbeappliedonlandbutaresubjecttorestrictionswithregardtopublicaccesstothesite,livestockgrazing,andcropharvestingschedules.
According to the 40 CFR Part 503 standards for Class A biosolids,fecalcoliformindicatorlevelsoflessthan1000MPN/gramTSshouldbeachievedorSalmonella sp.bacterialevelsshouldbebelowdetectionlimits(3MPN/4gTS)aftertreatment.Entericvirusesandviablehelminthovashouldeachbelessthan1per4gTS.
ThepathogenrequirementforClassBbiosolidsiseitherafecalcoliformconcentrationbelow2×106MPN/gTSorthatthesludgeistreatedinaprocesstosignificantlyreducepathogens(PSRP).Asapointofreference,theconcentrationoffecalcoliformsinundigestedsludgeisapproximately108MPN/gTS,andSalmonella sp.concentrationisapproximately2×103MPN/gTS(U.S.EPA,1994).
12.9.1 Class A biosolids
AccordingtoU.S.EPA(1993),therearesixpathogenreductionalternativesbywhichsludgetreatmentprocessescanbeconsideredtoproduceClassAbiosolids.ClassAbiosolidscanbeappliedon land immediatelywithoutanyrestrictions.Thepathogenreductionalternativesarethefollowing:
Alternative 1: Thermally treated sewage sludge—Thisalternativemaybe used when pathogen reduction process uses specific time–tem-perature regimes to reduce pathogens. Required time–temperatureregimes must be met as well as the following requirement: eitherfecalcoliformdensitiesshouldbebelow1000MPN/gTS(dryweightbasis) or Salmonella sp. bacteria should be below detection limits(3 MPN/4gTS).
Alternative 2: Sewage sludge treated in a high pH–high temperature process—High temperature–highpHprocess involves elevating thepH to greater than 12 and maintaining the pH for more than 72hours,orkeepingthetemperatureabove52°Cforatleast12hoursatpHgreaterthan12,orairdryingtoover50%solidsafterthe72hperiodofelevatedpHisnecessary.
280 Fundamentals of wastewater treatment and engineering
Alternative 3: Sewage sludge treated in other processes—Thisalterna-tiveappliestosewagesludgetreatedbyprocessesthatdonotmeettheprocessconditionsrequiredbyAlternatives1and2.Theprocessmustbedemonstratedtoreducethedensityofentericvirusesandhelminthovainthesewagesludgetolessthan1PFU/4gTS,inbothcases.
Alternative 4: Sewage sludge treated in unknown processes—Forthisalternative,demonstrationoftheprocessisnotnecessary.Instead,thedensityofentericvirusesandhelminthovainthebiosolidsmustbelessthan1PFU/4gTS.Inaddition,asforallClassAbiosolids,thesewagesludgemustmeetthefecalcoliformorSalmonella sp.limits.
Alternative 5: Use of PFRP—Biosolids are considered to be Class Aif they have been treated in one of the processs to further reducepathogens(PFRPs)aslistedbyU.S.EPA(1993).Thesearecompost-ing,heatdrying,heattreatment,thermophilicaerobicdigestion,betarayirradiation,gammarayirradiation,andpasteurization.Inaddi-tion,productsmustmeet theClassAfecalcoliformorSalmonella sp.requirements.
Alternative 6: Use of process equivalent to PFRP—Oneofthealterna-tivestoachieveClassAbiosolidsistouseaprocessequivalenttoaPFRP,asdeterminedbythepermittingauthority.Inaddition,prod-uctsofallequivalentprocessesmustmeettheClassAfecalcoliformorSalmonella sp.requirements.
12.9.1.1 Processes to further reduce pathogens
ThePFRPsdefinedbyU.S.EPAarelistedinAppendixBof40CFRPart503(FederalRegister,2010).Theseareoutlinedbelow.
Composting—maintaintemperatureat55°Corhigherfor3dforstaticaeratedpileorin-vesselcompostingmethod.Withwindrowcompost-ing,maintaintemperatureat55°Corhigherfor15dorlonger.
Heatdrying—at80°Cbydirectorindirectcontactwithhotgases.Heattreatment—at180°Corhigherfor30min.Thermophilicaerobicdigestion—at55°Cto60°CwithanSRTof10d.Betarayirradiation—at1.0megaradatroomtemperature.Gammarayirradiation—at1.0megaradatroomtemperature.Pasteurization—at70°Corhigherfor30minorlonger.
12.9.2 Class B biosolids
TherearethreepathogenreductionalternativesbywhichsludgetreatmentprocessescanbeconsideredtoproduceClassBbiosolids(U.S.EPA,1993).Inadditiontothepathogenreductionalternative,thebiosolidsmustalsomeetoneofthevectorattractionreductionrequirements.Siterestrictions
Solids processing and disposal 281
areplacedforlandapplicationofClassBbiosolids,withrespecttocropharvesting,animalgrazing,andpublicaccesstothesitewherethebiosolidsareapplied.ThedetailsoftheseareavailableintheFederalRegister(2010).
ThepathogenreductionalternativesforproductionofClassBbiosolidsarethefollowing:
Alternative 1: Monitoring of indicator organisms—Seven samples ofbiosolidsshouldbecollectedeachtimeformonitoring.Thegeometricmeanofthedensityoffecalcoliformsinthosesamplesshouldbelessthan2×106MPN/gTS.
Alternative 2: Use of PSRP—ThesludgehastobetreatedbyaPSRP.Theseincludeaerobicdigestion,anaerobicdigestion,airdrying,com-posting,andlimestabilization.
Alternative 3: Use of processes equivalent to PSRP—ClassBbiosolidscanbeproducedusingaprocessthatisequivalenttoPSRP,asdeter-minedbythepermittingauthority.
12.9.2.1 Processes to significantly reduce pathogens
ThePSRPsdefinedbyU.S.EPAarelistedinAppendixBof40CFRPart503(FederalRegister,2010).Thesearepresentedbelow:
Aerobicdigestion—at20°CwithSRTof40d,orat15°CwithSRTof60d.
Anaerobicdigestion—at35°Cto55°CwithSRTof15d,orat20°CwithSRTof60d.
Airdrying—sludgeshouldbedriedinsandbeds,orpavedorunpavedbedsforatleast3months,whenambienttemperatureisabove0°C.
Composting—at40°Corhigherfor5d.For4hduringthe5dperiod,thetemperatureinthecompostpileshouldexceed55°C.
Limestabilization—sufficientlimeshouldbeaddedtoraisethepHofthesludgeto12after2hofcontact.
PROBLEMS
12.1 Define the termbiosolids.List the fourstepsof sludgeprocessinganddisposal.Giveexamplesofeachstep.
12.2 Differentiatebetweenprimaryandsecondarysludge.12.3 Amunicipalwastewatertreatmentplantprocessesanaverageflow
of15,000m3/dwith200mg/LofBOD5and320mg/Lofsuspendedsolids.Thepeakflowis1.5timestheaverageflow.DeterminethemassofBOD5andsolids(kg/day)thatareremovedassludgefrom
282 Fundamentals of wastewater treatment and engineering
theprimaryclarifierforaverageandpeakflowconditions.AssumeareasonableefficiencyfortheprimaryclarifierandthesamepeakflowfactorforBOD5andsuspendedsolids.
12.4 A wastewater treatment plant consists of primary treatment fol-lowedbyanactivated-sludgesecondarysystem.Theplantprocesses7000m3/dofwastewaterwith180mg/LofBOD5and150mg/Lofsuspendedsolids.Theprimarysludgecontains500kgofdrysolidsperdaywith4.5%solidscontent.Theplantproduces760kgoftotalsludge(primaryandsecondary)perday.Assume30%removaleffi-ciencyoftheprimaryclarifierandF/Mratioof0.2fortheaerationtank.Determinethefollowing:
a. Primary sludge volume and removal efficiency of primaryclarifier
b. InfluentandeffluentBOD5of the secondaryactivated-sludgesystem
c. Volumeofsecondarysludgewith1%solidscontent12.5 Why it is necessary to thicken theprimary and secondary sludge
beforefurtherprocessing?Giveexamplesofdifferentsludge-thick-eningprocesses.Describethemostcommonmethodsavailableforvolumereductionofsludge.
12.6 Inproblem12.4,theprimaryandsecondarysludgesaremixedina gravity thickener and sent for further treatment.The thickenedsludgecontains4%solids.Calculatethepercentvolumereductioninthegravitythickener.
12.7 What are the objectives of sludge stabilization? List the commonmethodsusedtostabilizethesludgebeforedisposal.
12.8 Briefly describe the advantages and disadvantages of anaerobicdigestion.What factorsshouldbeconsidered for thedesignofananaerobicdigester?
12.9 Thethickenedsludgefromproblem12.6istobedigestedinastan-dard-ratemesophilicanaerobicdigester(MAD).Thesludgehas68%organiccontent,andapproximately60%oftheorganicfractionisdigestedaftera30-dperiod.Thedigestedsludgehasasolidscontentof6%andisstoredforaperiodof90d.Calculatethevolumeofthestandard-ratedigester.
12.10 Rework problem 12.9 for a two-stage digester system employing amixed,heatedfirststagewithadigestionperiodof10dandsecondstagewithathickeningperiodof3d.Determinethevolumeofthefirst-stageandsecond-stagedigesters,andcomparethetotalvolumewiththatofthesingle-stagedigesterinproblem12.9.
12.11 What are the advantages and disadvantages of aerobic digestion?Giveexamplesofdifferenttypesofaerobicdigestionprocesses.
12.12 Brieflyexplainthecompostingprocess.
Solids processing and disposal 283
12.13 Listtheprocessesbywhichwatercontentofthesludgeisreduced.Whichoneisthemostwidelyusedfordewatering?Brieflydescribetheprocess.
12.14 Nameanddescribethemostcommonmethodsofsludgedisposal.WhatisthebasicdifferencebetweenClassAandClassBbiosolids?
REFERENCES
Appels,L.,Baeyens,J.,Degreve,J.,andDewil,R.(2008)“PrinciplesandPotentialoftheAnaerobicDigestionofWaste-ActivatedSludge.”Progress in Energy and Combustion Science,vol.34,pp.755–781.
Aynur,S.,Riffat,R.,andMurthy,S.(2010)“EffectofHydraulicRetentionTimeonPretreatmentofBlendedMunicipalSludge.”Water Service & Technology,vol.64,no.4,p.967–973.
Aynur, S., Ahmed, F., Riffat, R., and Murthy, S. (2009a) “Evaluation of TwoDual Digestion Processes: Autothermal Thermophilic Aerobic PretreatmentFollowedbyTPADversusMAD.”Proceedings of 82nd Annual Conference of Water Environment Federation,WEFTEC’09,Orlando,Florida.
Aynur,S.K.,Dohale,S.,Dumit,M.,Riffat,R.,Abu-Orf,M.,andMurthy,S.(2009b)“Efficiency of Autothermal Thermophilic Aerobic Digestion under TwoDifferentOxygenFlowrates.”Proceedings of Water Environment Federation Residuals and Biosolids Conference,May3–6,Portland,Oregon.
Aynur, S.,Chatterjee, S.,Wilson,C.,Riffat,R.,Novak, J.,Higgins,M.,Abu-Orf,M.,Eschborn,R.,Le,S.,andMurthy,S. (2008)“BenchScaleEvaluationofTwoEnhancedDigestionProcesses:EnhancedEnzymicHydrolysisandDualDigestion.” Proceedings of 81st Annual Conference of Water Environment Federation,WEFTEC’08,Chicago,IL.
Borowski,S.,andSzopa,J.S.(2007)“ExperienceswithDualDigestionofMunicipalSewageSludge.”Bioresource Technology,vol.98,pp.1199–1207.
Cumiskey,A.(2005),“UKLeadstheWayinAdvancedDigestionTechnology.”Water and Wastewater International,vol.20,no.4,pp.35–36.
Davis,M.(2011)Water and Wastewater Engineering: Design Principles and Practice.McGraw-Hill,Inc.,NewYork.
Eschborn,R.,andThompson,D.(2007)“TheTagroStory:HowtheCityofTacoma,WashingtonWentBeyondPublicAcceptancetoAchievetheBiosolidsProgramWords We’d Like to Hear: Sold Out.” WEF/AWWA Joint Residuals and Biosolids Management Conference,Apr15–18,Denver,Colorado.
FederalRegister(2010)CodeofFederalRegulations,Title40.U.S.Government.Fukushi,K.,Babel, S., andBurakrai, S. (2003).“Survivalof Salmonella spp. ina
SimulatedAcid-phaseAnaerobicDigesterTreatingSewageSludge.”Bioresource Technology,vol.86,pp.53–57.
Grady, C. P. L. Jr., Daigger, G.T., and Lim, H. C. (1999) Biological Wastewater Treatment.MarcelDekker,NewYork.
Ghosh,S.,andPohland,F.G.(1974)“KineticsofSubstrateAssimilationandProductFormation in Anaerobic Digestion.” Journal of Water Pollution Control Federation, vol.46,p.748.
284 Fundamentals of wastewater treatment and engineering
Gomec, C. Y., Kim, M., Ahn, Y., and Speece, R. E. (2002)“The Role of pH inMesophilic Anaerobic Sludge Solubilization.” Journal of Environmental Science and Health,PartA,vol.37,no.10,pp.1871–1878.
GreaterVancouverRegionalDistrict(2005)Review of Alternative Technologies for Biosolids Treatment.Burnaby,BritishColumbia,Canada.
Hammer,M.J.,andHammerM.J.Jr.(2012)Water and Wastewater Technology.Seventhedition.Pearson-PrenticeHall,Inc.,Hoboken,NewJersey.
Han,Y.,Sung,S.,andDague,R.R.(1997)“Temperature-PhasedAnaerobicDigestionofWastewaterSludges.”Water Science & Technology,vol.36,no.6–7,pp.367–374.
Harikishan,S.,andSung,S.(2003)“CattleWasteTreatmentandClassABiosolidProduction Using Temperature-Phased Anaerobic Digester.” Advances in Environmental Research,vol.7,pp.701–706.
Hong,S.M.,Park,J.K.,Teeradej,N.,Lee,Y.O.,Cho,Y.K.,andPark,C.H.(2006)“Pretreatment of Sludge with Microwaves for Pathogen Destruction andImprovedAnaerobicDigestionPerformance.”Water Environment Research,vol.78,no.1,pp.76–83.
Layden, N. M. (2007) “An Evaluation of Autothermal Thermophilic AerobicDigestion(ATAD)ofMunicipalSludgeinIreland.”Journal of Environmental Engineering Science,vol.6,pp.19–29.
Le,M.S.,andHarrison,D.,(2006)“ApplicationofEnzymicHydrolysisTechnologyforVFAProductionandAgriculturalRecyclingofSludge.”Proceedings of the IWA Conference,Moscow.
McCarty,P.L.(1964)“AnaerobicWasteTreatmentFundamentals.”Public Works,vol.95,pp.9–12.
Metcalf and Eddy, Inc. (2003) Wastewater Engineering: Treatment and Reuse.Fourthedition.McGraw-Hill,Inc.,NewYork.
Nosrati,M.,Sreekishnan,T.R.,andMukhopadhyay,S.N.(2007)“EnergyAudit,Solids Reduction, and Pathogen Inactivation in Secondary Sludges duringBatch Thermophilic Aerobic Digestion Process.” Journal of Environmental Engineering,vol.133,no.5,pp.477–484.
Peavy,H.S.,Rowe,D.R.,andTchobanoglous,G.(1985)Environmental Engineering.McGraw-Hill,Inc.,NewYork.
Salsali, H. R., Parker, W. J., and Sattar, S. A. (2006) “Impact of Concentration,Temperature,andpHonInactivationofSalmonellaspp.byVolatileFattyAcidsinAnaerobicDigestion.”Canadian Journal of Microbiology,vol.52,pp.279–286.
Sung, S., and Santha, H. (2003)“Performance ofTemperature-PhasedAnaerobicDigestion(TPAD)SystemTreatingDairyCattleWastes.”Water Research,vol.37,pp.1628–1636.
U.S. EPA (1979) Process Design Manual of Sludge Treatment and Disposal.EnvironmentalProtectionAgency,Washington,D.C.
U.S.EPA(1983)Process Design Manual for Land Application of Municipal Sludge.EPA625/1-83-016.EnvironmentalProtectionAgency,Washington,D.C.
U.S.EPA(1993)Standards for the Use or Disposal of Sewage Sludge.40CFRParts257,403,and503(58-FR-9248).EnvironmentalProtectionAgency,OfficeofWater,Washington,D.C.
U.S. EPA (1994) A Plain English Guide to the EPA Part 503 Biosolids Rule.EPA/832/R-93/003. Environmental ProtectionAgency, Office ofWastewaterManagement,Washington,D.C.
Solids processing and disposal 285
U.S.EPA(2000)Biosolids Technology Fact Sheet: Land Application of Biosolids.EPA 832-F-00-064. Environmental Protection Agency, Office of Water,Washington,D.C.
VanLier,J.B.,Grolle,K.C.F.,Frijiters,C.T.M.J.,Stams,A.J.M.,andLettinga,G. (1993) “Effects of Acetate, Propionate, and Butyrate on ThermophilicAnaerobicDegradationofPropionatebyMethanogenicSludgeandDefinedCultures.”Applied EnvironmentalMicrobiology,vol.43,pp.227–235.
Ward,A., Stensel,H.D.,Ferguson, J.F.,Ma,G., andHummel, S. (1998)“Effectof Autothermal Treatment on Anaerobic Digestion in the Dual DigestionProcess.”Water Science & Technology,vol.38,no.8–9,pp.435–442.
WEF(1998)Design of Municipal Wastewater Treatment Plants. Manual of Practice 8.Fourthedition.WaterEnvironmentFederation,Alexandria,VA.
Werker,A. G., Carlsson, M., Morgan-Sagastume, F., Le, M. S., and Harrison, D.(2007) “Full Scale Demonstration and Assessment of Enzymic HydrolysisPre-Treatment for MesophilicAnerobic Digestion of MunicipalWastewaterTreatment Sludge.” Proceedings of the 80th Annual Conference of Water Environment Federation,WEFTEC’07,SanDiego,CA.
Zabranska,J.,Dohanyos,M.,Jenicek,P.,Ruzicikova,H.,andVranova,A.(2003)“Efficiency of Autothermal Aerobic Digestion of Municipal WastewaterSludgeinRemovingSalmonellaspp.andIndicatorBacteria.”Water Science & Technology, vol. 47,no.3,pp.151–156.
Zeikus,J.G.(1979)“ThermophilicBacteria:Ecology,Physiology,andTechnology.”Enzyme Microb. Technol.,vol.1,pp.243–251.

287
Chapter 13
Advanced treatment processes
13.1 INTRODUCTION
When the effluent from secondary treatment does not meet regulatoryrequirementsfordischarge,additionaltreatmentmaybeneededtoreducethe levels of specific contaminants. This is usually termed as advanced treatmentortertiary treatment.Advancedtreatmentprocessesareusedforremovalofnutrientssuchasnitrogenandphosphorus,removalofresidualtotalsuspendedsolids,removalofspecificheavymetalsorinorganics,andremovalof emerging contaminantsof concern, amongothers.Advancedtreatmentprocessesmaybeincorporatedwithintheprimaryorsecondarytreatmentunits,e.g.forbiologicalnutrientremoval,ortheymaybeaddedseparatelyfollowingsecondarytreatment,e.g.forwastewaterreclamation.These includechemicalprecipitation,carbonadsorption,granularmediafiltration,andmembranefiltration,amongothers.Anumberofthesepro-cesseswillbediscussedindetailinthischapterwithregardtothetypesofcontaminantsthatareremovedbytheprocesses.Thefocusofthischapterwillbetheremovalofnitrogen,phosphorus,suspendedanddissolvedsol-ids,andotherinorganicsfromwastewater.
13.2 NITROGEN REMOVAL
Excess nutrients, such as nitrogen and phosphorus, can cause eutrophi-cation problems in water bodies as described previously in Chapter 3(Section3.5).Effluentdischargelimitsonnutrientscannecessitatetheuseofadvancedprocesses for removalofnitrogenandphosphorus fromthetreatment plant effluent. Wastewater treatment plants that use biologi-calprocessesfornutrientremovalareknownasBNR(biologicalnutrientremoval) plants. The most commonly used method of nitrogen removalisbiological nitrification–denitrification.Thiscanbeaccomplishedbyanumber of different suspended and attached growth processes. Some ofthesearedescribedinthefollowingsections.Emergingtechnologiesthat
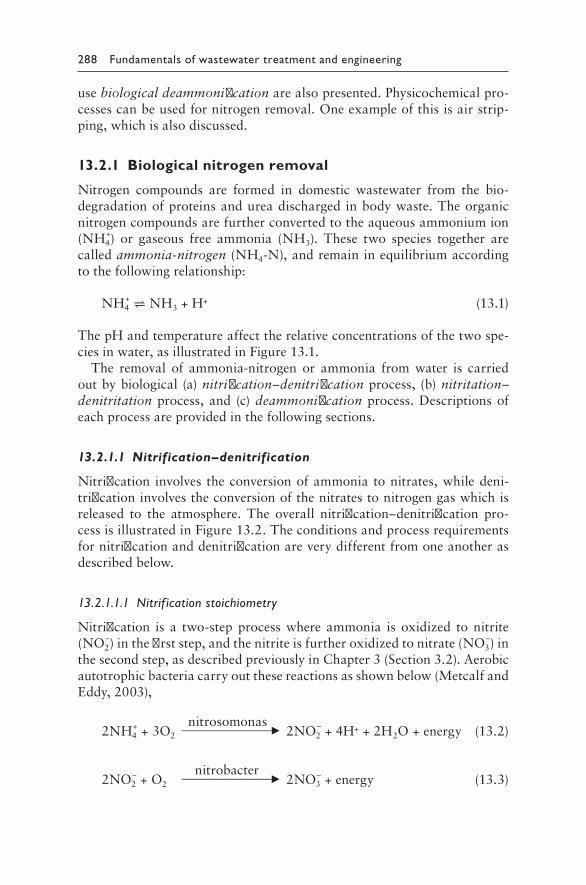
288 Fundamentals of wastewater treatment and engineering
usebiological deammonificationarealsopresented.Physicochemicalpro-cessescanbeusedfornitrogenremoval.Oneexampleofthisisairstrip-ping,whichisalsodiscussed.
13.2.1 Biological nitrogen removal
Nitrogen compounds are formed in domestic wastewater from the bio-degradationofproteinsandureadischarged inbodywaste.Theorganicnitrogencompoundsarefurtherconvertedtotheaqueousammoniumion(NH4
+) or gaseous free ammonia (NH3). These two species together arecalledammonia-nitrogen(NH4-N),andremaininequilibriumaccordingtothefollowingrelationship:
NH4+⇌NH3+H+ (13.1)
ThepHandtemperatureaffecttherelativeconcentrationsofthetwospe-ciesinwater,asillustratedinFigure 13.1.
The removal of ammonia-nitrogen or ammonia from water is carriedoutbybiological (a)nitrification–denitrificationprocess, (b)nitritation–denitritationprocess,and (c)deammonificationprocess.Descriptionsofeachprocessareprovidedinthefollowingsections.
13.2.1.1 Nitrification–denitrification
Nitrification involves theconversionofammonia tonitrates,whiledeni-trificationinvolvestheconversionofthenitratestonitrogengaswhichisreleased to the atmosphere. The overall nitrification–denitrification pro-cessisillustratedinFigure 13.2.Theconditionsandprocessrequirementsfornitrificationanddenitrificationareverydifferentfromoneanotherasdescribedbelow.
13.2.1.1.1 Nitrif ication stoichiometry
Nitrification is a two-stepprocesswhere ammonia is oxidized tonitrite(NO2
–)inthefirststep,andthenitriteisfurtheroxidizedtonitrate(NO3–)in
thesecondstep,asdescribedpreviouslyinChapter3(Section3.2).Aerobicautotrophicbacteriacarryoutthesereactionsasshownbelow(MetcalfandEddy,2003),
nitrosomonas 2NH4
++3O2____________▶ 2NO2
–+4H++2H2O+energy (13.2)
nitrobacter 2NO2
–+O2 ____________▶ 2NO3–+energy (13.3)
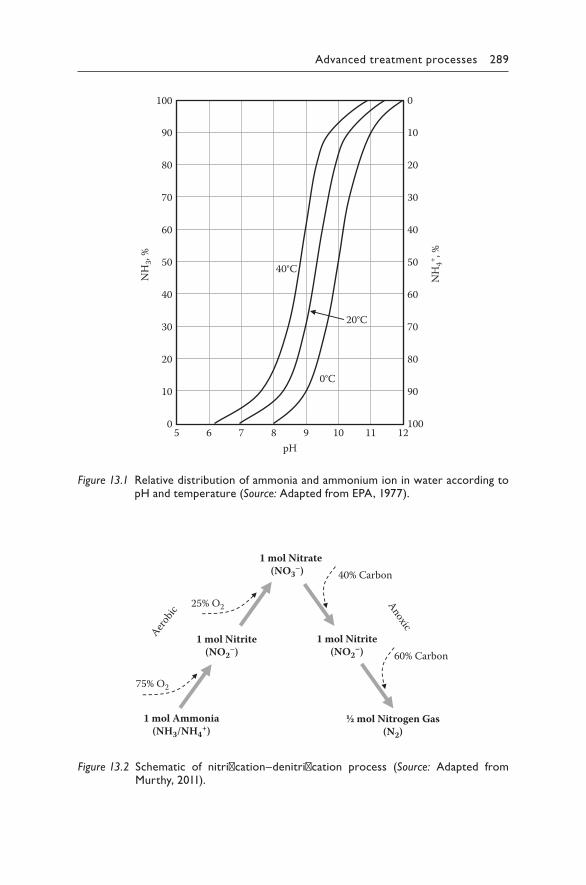
Advanced treatment processes 289
0
10
20
30
40
50
60
70
80
90
100
5 6 7 8pH
10 11 12100
90
80
70
60
50
40
30
20
10
0
9
NH
3, %
NH
4+ , %
0°C
40°C
20°C
Figure 13.1 Relative distribution of ammonia and ammonium ion in water according to pH and temperature (Source: Adapted from EPA, 1977).
1 mol Ammonia(NH3/NH4
+)
1 mol Nitrite(NO2
–)
1 mol Nitrate(NO3
–)
1 mol Nitrite(NO2
–)
½ mol Nitrogen Gas(N2)
75% O2
25% O2
40% Carbon
60% Carbon
Aerobic
Anoxic
Figure 13.2 Schematic of nitrification–denitrification process (Source: Adapted from Murthy, 2011).
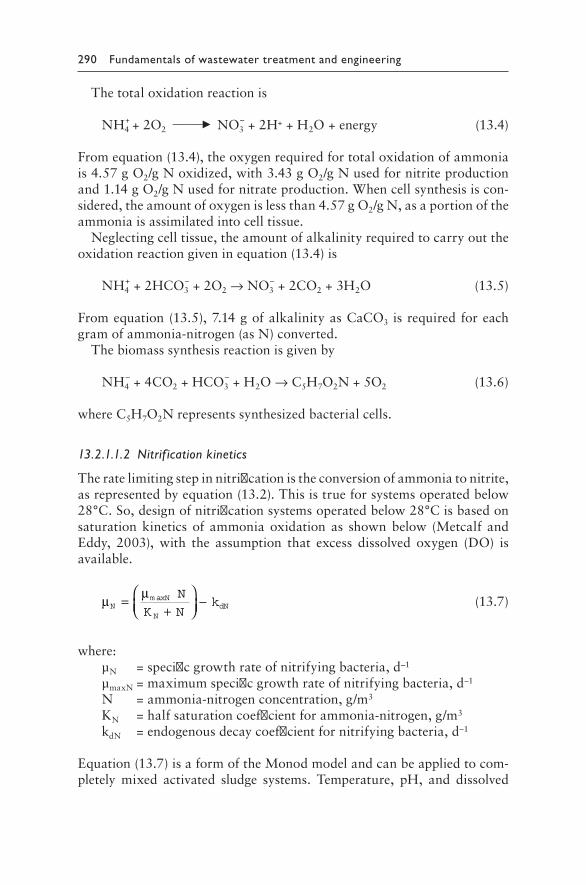
290 Fundamentals of wastewater treatment and engineering
Thetotaloxidationreactionis
NH4+
+2O2____▶ NO3
–+2H++H2O+energy (13.4)
Fromequation(13.4),theoxygenrequiredfortotaloxidationofammoniais4.57gO2/gNoxidized,with3.43gO2/gNusedfornitriteproductionand1.14gO2/gNusedfornitrateproduction.Whencellsynthesisiscon-sidered,theamountofoxygenislessthan4.57gO2/gN,asaportionoftheammoniaisassimilatedintocelltissue.
Neglectingcelltissue,theamountofalkalinityrequiredtocarryouttheoxidationreactiongiveninequation(13.4)is
NH4++2HCO3
–+2O2→NO3–+2CO2+3H2O (13.5)
Fromequation(13.5),7.14gofalkalinityasCaCO3isrequiredforeachgramofammonia-nitrogen(asN)converted.
Thebiomasssynthesisreactionisgivenby
NH4–+4CO2+HCO3
–+H2O→C5H7O2N+5O2 (13.6)
whereC5H7O2Nrepresentssynthesizedbacterialcells.
13.2.1.1.2 Nitrif ication kinetics
Theratelimitingstepinnitrificationistheconversionofammoniatonitrite,asrepresentedbyequation(13.2).Thisistrueforsystemsoperatedbelow28°C.So,designofnitrificationsystemsoperatedbelow28°Cisbasedonsaturationkinetics of ammoniaoxidation as shownbelow (Metcalf andEddy, 2003), with the assumption that excess dissolved oxygen (DO) isavailable.
µ µN
m axN
NdN
N
K Nk=
+
− (13.7)
where:µN=specificgrowthrateofnitrifyingbacteria,d–1
µmaxN=maximumspecificgrowthrateofnitrifyingbacteria,d–1
N=ammonia-nitrogenconcentration,g/m3
KN=halfsaturationcoefficientforammonia-nitrogen,g/m3
kdN=endogenousdecaycoefficientfornitrifyingbacteria,d–1
Equation(13.7)isaformoftheMonodmodelandcanbeappliedtocom-pletely mixed activated sludge systems. Temperature, pH, and dissolved
Advanced treatment processes 291
oxygen concentration are important parameters in nitrification kinetics.Temperatureeffectscanbemodeledbythevan’tHoff–Arrheniusequationas shown in Chapter 8, equation (8.20). The maximum specific growthratefornitrifiersvariesfrom0.25to0.77d–1,dependingonsite-specificconditions(Randalletal.,1992).Thegrowthratefornitrifyingorganismsismuchlowerthanthecorrespondingvaluesforheterotrophicorganisms,requiringmuchlongersolidsretentiontime(SRT)forthenitrificationpro-cess.TypicaldesignSRTvaluesrangefrom10to20dat10°C,and4to7dat20°C.Above28°C,bothammoniaandnitriteoxidationkineticshavetobeconsideredindesign.
Dissolvedoxygenconcentrationsof3to4mg/Linthewatercanincreasenitrificationrates.Toincorporatetheeffectsofdissolvedoxygen,equation(13.7)canbemodifiedasshownbelow,
µ µN
m axN
N odN
N
K N
DO
K DOk=
+
+
− (13.8)
where:DO=dissolvedoxygenconcentration,g/m3
Ko=halfsaturationcoefficientforDO,g/m3
Allothertermsareasdefinedpreviously.Thesekineticmodelsarebestusedtodescribenitrificationinsystemsatlowtomoderateorganicloadings,butwillusuallyoverpredictratesinsystemswithhighorganicloadings.
13.2.1.1.3 Denitrif ication stoichiometry
The final step in biological nitrogen removal is denitrification, whichinvolvesthereductionofnitratetonitricoxide(NO),nitrousoxide(N2O),andnitrogengas,andiscarriedoutbyavarietyofheterotrophicandauto-trophicbacteria.Inwastewaterprocesses,mostarefacultativeanaerobesofthePseudomonasspecies.Themetabolicpathwayofdenitrificationcanberepresentedbythefollowingequation:
NO3–→NO2
–→NO→N2O→N2 (13.9)
Denitrificationcanbeconsideredasatwo-stepprocess,sincenitritesmayappearasanintermediate.Thistwo-stepprocessistermeddissimilation.Thefirststeprepresentsreductionofnitratetonitrite,andthesecondstepareductionofnitritetonitrogengas(McCartyetal.,1969).Nitricoxidegas(NO)isonlyanintermediateproduct,butnitrousoxidegas(N2O)couldbethefinalproductofafewdenitrifiers.Inmostcases,nitrogengas(N2)istheendproductofdenitrification.
292 Fundamentals of wastewater treatment and engineering
Denitrificationtakesplaceinthepresenceofnitrateandabsenceofoxy-gen.Thedissolvedoxygenlevelmustbeatornearzero,andacarbonsupplymustbeavailable for thebacteria.Thenitrateactsasanelectronaccep-torfororganicor inorganicelectrondonors.Sincea lowcarboncontentisrequiredforthepreviousnitrificationstep,additionalcarbonhastobeaddedforthedenitrificationstep.Thiscanbeaddedintheformofprimaryeffluentwastewater,whichhasbiochemicaloxygendemand(BOD),orbyaddinganexternalcarbonsourcesuchasmethanol,ethanol,acetate,orglycerol.Anexternalcarbonsource isusedwhen it isdesiredtoachieveverylowlevelsofnitrogenintheeffluentduetoregulatoryrequirements.
Whenwastewateristheelectrondonorfordenitrification,thereactioncanbeasfollows(MetcalfandEddy,2003):
C10H19O3N+10NO3–→5N2+10CO2+3H2O+NH3+10OH (13.10)
whereC10H19O3Nisageneralizedformulaforthewastewater.Thefollowingreactiontakesplacewithmethanolastheelectrondonor:
5CH3OH+6NO3–→3N2+5CO2+7H2O+6OH– (13.11)
When ethanol is used as the external carbon source, the reaction is thefollowing:
5CH3CH2OH+12NO3–→6N2+10CO2+9H2O+12OH– (13.12)
Thefollowingreactiontakesplacewithacetateastheelectrondonor:
5CH3COOH+8NO3–→4N2+10CO2+6H2O+8OH– (13.13)
In equations (13.10)–(13.13), one equivalent of alkalinity (OH–) is pro-ducedperequivalentofNO3–Nreduced.Thisamountsto3.57galkalin-ityasCaCO3pergnitrogenreduced.Thisindicatesthatabouthalfofthealkalinityconsumedinnitrificationcanberecoveredindenitrification.Theoxygenequivalentsofnitrateandnitritecanbecalculatedas2.86gO2/gNO3–Nand1.71gO2/gNO2–N,respectively.
Thedenitrificationpotentialofwastewaterisprimarilydeterminedasthestoichiometricratiobetweentheorganiccompoundusedandthenitrate,whichisusuallyexpressedasthechemicaloxygendemand(COD)/NortheBOD/Nratio.An importantdesignparameter fordenitrificationprocessis theamountofBODorbiodegradablesolubleCOD(bsCOD)requiredaselectrondonorfornitrogenremovalfromwastewater.Thiscanbeesti-matedfromthefollowingrelationship.ReadersarereferredtoMetcalfandEddy(2003)foracompletederivationofthefollowing:
Advanced treatment processes 293
gbsCOD/gNO3–N=2 86
1 1 42
.
.− Yn
(13.14)
where:Yn=netbiomassyield,gvolatilesuspendedsolids(VSS)/gbsCOD1.42=oxygenequivalentofbiomass,gO2/gVSS2.86=oxygenequivalentofnitrate,gO2/gNO3–N
The net biomass yield can be calculated from the following equation(MetcalfandEddy,2003):
YY
kn
d c
=+1 θ
(13.15)
where:Y=biomassyieldfordenitrifiers,gVSS/gbsCODkd=decaycoefficientfordenitrifiers,d–1
θc=anoxicSRT,d
13.2.1.1.4 Denitrif ication kinetics
The Monod model similar to equation (13.7) can be developed for thedenitrifyingbacteria.Thespecificdenitrificationrate(SDNR)ortherateofsubstrateutilizationcanbecalculatedfromtheMonodmodelandtheconceptspresentedinChapter8,togetherwithatermtoaccountforthelowerutilizationrateintheanoxiczone.
rS X
Y K Ssu
m ax
S
= −+( )
µ η (13.16)
where:rsu=rateofsubstrateutilization,mg/L·dη=fractionofdenitrifyingbacteriainthebiomass
Allothertermsareasdefinedpreviously.Thevalueofηcanrangefrom0.2to0.8forpreanoxicdenitrification(StenselandHorne,2000).Forpostan-oxicprocessesηis1.0,wherethebiomassismainlydenitrifyingbacteria.
13.2.1.1.5 External carbon sources for denitrif ication
Whenawastewatertreatmentplantrequiressignificantnitrogenremoval,theorganicmatternaturallypresentinthewastewatermaybeinsufficient
294 Fundamentals of wastewater treatment and engineering
toachievetherequiredlevelofdenitrification.Thisrequirestheadditionofanexternalcarbonsource.Someexternalcarbonsourcesincludemetha-nol,ethanol,aceticacid,glucose,glycerol,etc.Inthelasttwodecades,asignificantamountofresearchhasbeenconductedoninvestigatingdiffer-entcarbonsources,theirapplications,kineticparameters,andtemperatureeffects.Theimpetusforthishasbeenconcernsofdetrimentalenvironmen-taleffectsofeffluentnitrogendischargestowaterbodies.
Oneexampleofthis is the loweringofeffluent limitsto3to4mg/LoftotalNforwastewatertreatmentplantsdischargingintotheChesapeakeBaywatershed in theeasternUnitedStates.TheChesapeakeBay is the largestestuaryintheUnitedStates,encompassingsixstates—Delaware,Maryland,NewYork,Pennsylvania,Virginia,andWestVirginia—andtheDistrictofColumbia.Bothpointandnonpointsourceshavecontributedexcessnutrientstothebay,resultinginseveredeteriorationandimpairedwaters.Asaresult,stricter effluent limitshavebeen imposedon thepoint sources,whicharemainlythewastewatertreatmentplants.Mostofthetreatmentplantsinthatareauseanexternalcarbonsourcefordenitrification.Butsizingandopera-tionoftreatmentunitsbasedonpreviousexistingkineticparametershavefailedtoproducethedesiredresults,especiallyatlowtemperatures.Thathasprovidedthemomentumfornewresearchinmethodologyanddetermina-tionofkineticparametersfordenitrificationwithexternalcarbonsources.Understandingthekineticsandstoichiometryofthedenitrifyingorganismsisofprimeimportanceindesigningandoptimizingnitrogenremovalprocesses.
Researchondenitrificationhasbeenconductedforseveraldecadesnow.Various researchers have measured kinetic parameters of denitrificationforavarietyofprocessconfigurations.Inearlierstudies,usingmethanol(MeOH)astheexternalcarbon,Stenseletal.(1973)reportedmaximumspecific growth rates (µmaxDEN) of 1.86 and 0.52 d–1 at 20°C and 10°C,respectively.Decaycoefficientsat these two temperatureswere0.04and0.05d–1,respectively.RecentresearchershaveobservedlowergrowthratesformethanolutilizersinextensivestudiesconductedatalargenumberoftreatmentplantsintheeasternUnitedStates.Doldetal.(2008)observedmaximumspecificgrowthrateof1.3d–1at20°CwithanArrheniuscoef-ficient (θ) of 1.13, based on a decay rate (kdDEN) of 0.04 d–1. Nichols etal. (2007) obtained maximum specific growth rate of 1.25 d–1 at 20°Cwith anArrhenius coefficient of 1.13.The carbon tonitrogen ratiowasapproximately 4.73 mg MeOH COD/mg NO3–N. The variation of µmaxwithtemperatureisillustratedinFigure 13.3,withthedashedlinerepre-sentingthevan’tHoff–Arrheniusmodel.Maximumspecificgrowthratesof1.0and0.5d–1at19°Cand13°C,withanArrheniuscoefficientof1.12,wereobservedbyMokhayerietal. (2006).The lowgrowthrate(similartothatofnitrifiers)indicatedthatsystemsshouldbedesignedbasedonalongenoughanoxicSRTtoensurestablegrowthandavoidwashout.This
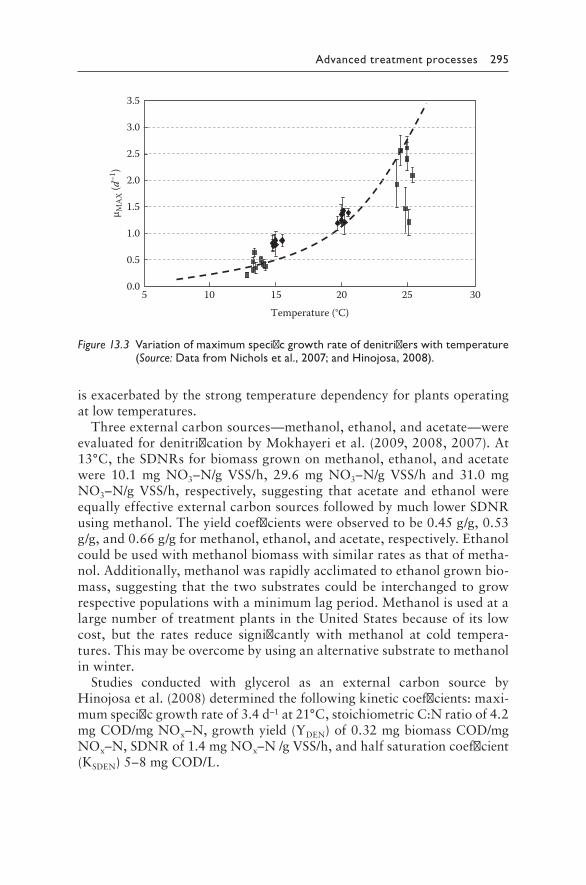
Advanced treatment processes 295
isexacerbatedbythestrongtemperaturedependencyforplantsoperatingatlowtemperatures.
Threeexternalcarbonsources—methanol,ethanol,andacetate—wereevaluatedfordenitrificationbyMokhayerietal.(2009,2008,2007).At13°C,theSDNRsforbiomassgrownonmethanol,ethanol,andacetatewere 10.1 mg NO3–N/g VSS/h, 29.6 mg NO3–N/g VSS/h and 31.0 mgNO3–N/g VSS/h, respectively, suggesting that acetate and ethanol wereequallyeffectiveexternalcarbonsourcesfollowedbymuchlowerSDNRusingmethanol.Theyieldcoefficientswereobservedtobe0.45g/g,0.53g/g,and0.66g/gformethanol,ethanol,andacetate,respectively.Ethanolcouldbeusedwithmethanolbiomasswithsimilarratesasthatofmetha-nol.Additionally,methanolwasrapidlyacclimatedtoethanolgrownbio-mass,suggestingthatthetwosubstratescouldbe interchangedtogrowrespectivepopulationswithaminimumlagperiod.MethanolisusedatalargenumberoftreatmentplantsintheUnitedStatesbecauseofitslowcost, but the rates reduce significantly with methanol at cold tempera-tures.Thismaybeovercomebyusinganalternativesubstratetomethanolinwinter.
Studies conducted with glycerol as an external carbon source byHinojosaetal.(2008)determinedthefollowingkineticcoefficients:maxi-mumspecificgrowthrateof3.4d–1at21°C,stoichiometricC:Nratioof4.2mgCOD/mgNOx–N,growthyield(YDEN)of0.32mgbiomassCOD/mgNOx–N,SDNRof1.4mgNOx–N/gVSS/h,andhalfsaturationcoefficient(KSDEN)5–8mgCOD/L.
5 10 15 20 25 300.0
0.5
1.0
1.5
2.0
2.5
3.0
3.5
Temperature (°C)
μ MA
X (d
–1)
Figure 13.3 Variation of maximum specific growth rate of denitrifiers with temperature (Source: Data from Nichols et al., 2007; and Hinojosa, 2008).
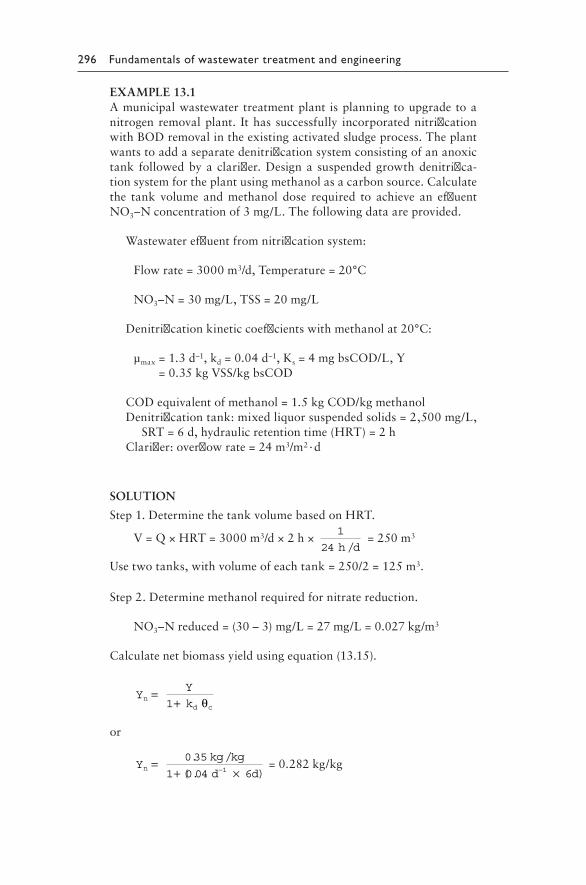
296 Fundamentals of wastewater treatment and engineering
EXAMPLE13.1Amunicipalwastewatertreatmentplant isplanningtoupgradetoanitrogenremovalplant. Ithas successfully incorporatednitrificationwithBODremovalintheexistingactivatedsludgeprocess.Theplantwantstoaddaseparatedenitrificationsystemconsistingofananoxictank followedbya clarifier.Designa suspendedgrowthdenitrifica-tionsystemfortheplantusingmethanolasacarbonsource.Calculatethe tank volume and methanol dose required to achieve an effluentNO3–Nconcentrationof3mg/L.Thefollowingdataareprovided.
Wastewatereffluentfromnitrificationsystem:
Flowrate=3000m3/d,Temperature=20°C
NO3–N=30mg/L,TSS=20mg/L
Denitrificationkineticcoefficientswithmethanolat20°C:
µmax=1.3d–1,kd=0.04d–1,Ks=4mgbsCOD/L,Y=0.35kgVSS/kgbsCOD
CODequivalentofmethanol=1.5kgCOD/kgmethanolDenitrificationtank:mixedliquorsuspendedsolids=2,500mg/L,
SRT=6d,hydraulicretentiontime(HRT)=2hClarifier:overflowrate=24m3/m2·d
SOLUTION
Step1.DeterminethetankvolumebasedonHRT.
V=Q×HRT=3000m3/d×2h×1
24 /h d=250m3
Usetwotanks,withvolumeofeachtank=250/2=125m3.
Step2.Determinemethanolrequiredfornitratereduction.
NO3–Nreduced=(30–3)mg/L=27mg/L=0.027kg/m3
Calculatenetbiomassyieldusingequation(13.15).
YY
kn
d c
=+1 θ
or
Ykg kg
d dn =
+ ×−0 35
1 0 04 61
. /
( . )=0.282kg/kg
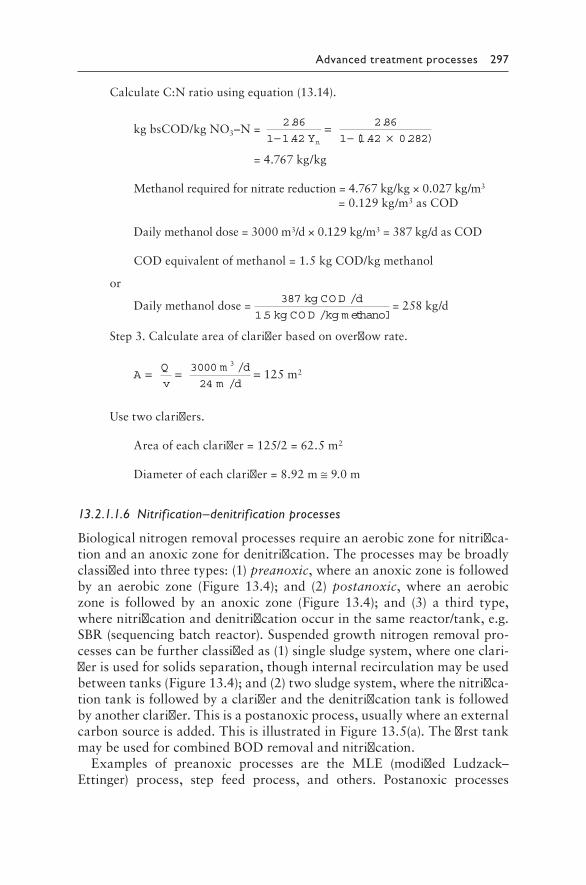
Advanced treatment processes 297
CalculateC:Nratiousingequation(13.14).
kgbsCOD/kgNO3–N=2 86
1 1 42
2 86
1 1 42 0 282
.
.
.
(. . )−=
− ×Yn
=4.767kg/kg
Methanolrequiredfornitratereduction=4.767kg/kg×0.027kg/m3
=0.129kg/m3asCOD
Dailymethanoldose=3000m3/d×0.129kg/m3=387kg/dasCOD
CODequivalentofmethanol=1.5kgCOD/kgmethanol
or
Dailymethanoldose=387
1 5
kg CO D d
kg CO D kg m ethanol
/
. /=258kg/d
Step3.Calculateareaofclarifierbasedonoverflowrate.
AQ
v
m d
m d= = =3000
24
3 /
/125m2
Usetwoclarifiers.
Areaofeachclarifier=125/2=62.5m2
Diameterofeachclarifier=8.92m≅9.0m
13.2.1.1.6 Nitrif ication–denitrif ication processes
Biologicalnitrogenremovalprocessesrequireanaerobiczonefornitrifica-tionandananoxiczonefordenitrification.Theprocessesmaybebroadlyclassifiedintothreetypes:(1)preanoxic,whereananoxiczoneisfollowedby an aerobic zone (Figure 13.4); and (2) postanoxic, where an aerobiczone is followed by an anoxic zone (Figure 13.4); and (3) a third type,wherenitrificationanddenitrificationoccurinthesamereactor/tank,e.g.SBR(sequencingbatchreactor).Suspendedgrowthnitrogenremovalpro-cessescanbefurtherclassifiedas(1)singlesludgesystem,whereoneclari-fierisusedforsolidsseparation,thoughinternalrecirculationmaybeusedbetweentanks(Figure 13.4);and(2)twosludgesystem,wherethenitrifica-tiontankisfollowedbyaclarifierandthedenitrificationtankisfollowedbyanotherclarifier.Thisisapostanoxicprocess,usuallywhereanexternalcarbonsourceisadded.ThisisillustratedinFigure 13.5(a).ThefirsttankmaybeusedforcombinedBODremovalandnitrification.
Examples of preanoxic processes are the MLE (modified Ludzack–Ettinger) process, step feed process, and others. Postanoxic processes
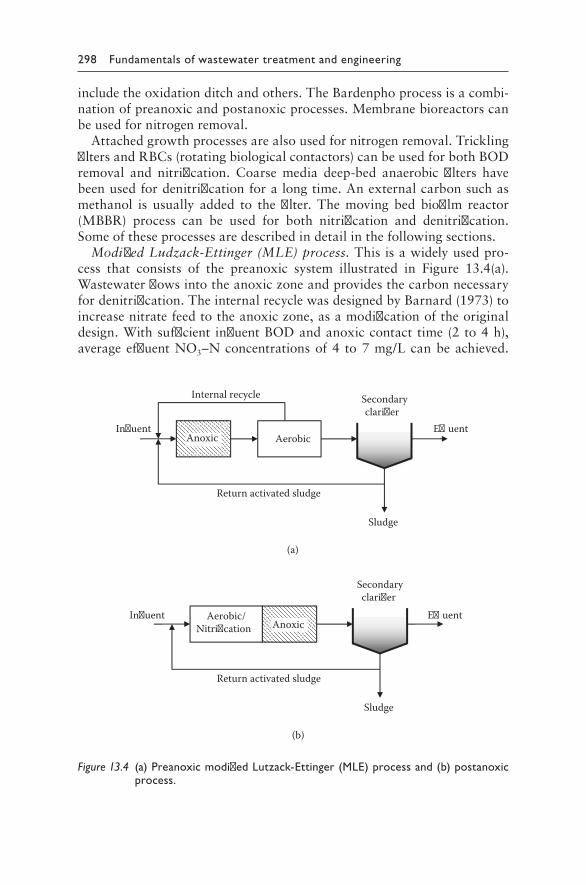
298 Fundamentals of wastewater treatment and engineering
includetheoxidationditchandothers.TheBardenphoprocessisacombi-nationofpreanoxicandpostanoxicprocesses.Membranebioreactorscanbeusedfornitrogenremoval.
Attachedgrowthprocessesarealsousedfornitrogenremoval.TricklingfiltersandRBCs(rotatingbiologicalcontactors)canbeusedforbothBODremoval and nitrification. Coarse media deep-bed anaerobic filters havebeenusedfordenitrificationforalongtime.Anexternalcarbonsuchasmethanol is usually added to the filter. The moving bed biofilm reactor(MBBR) process can be used for both nitrification and denitrification.Someoftheseprocessesaredescribedindetailinthefollowingsections.
Modified Ludzack-Ettinger (MLE) process.Thisisawidelyusedpro-cess that consists of the preanoxic system illustrated in Figure 13.4(a).Wastewaterflowsintotheanoxiczoneandprovidesthecarbonnecessaryfordenitrification.TheinternalrecyclewasdesignedbyBarnard(1973)toincreasenitratefeedtotheanoxiczone,asamodificationoftheoriginaldesign.Withsufficient influentBODandanoxiccontact time(2to4h),averageeffluentNO3–Nconcentrationsof4 to7mg/Lcanbeachieved.
(a)
(b)
E�uent
Secondaryclari�er
Inuent Aerobic/Nitri�cation
Sludge
Return activated sludge
Anoxic
E�uent
Secondaryclari�er
Inuent Aerobic
Sludge
Return activated sludge
Anoxic
Internal recycle
Figure 13.4 (a) Preanoxic modified Lutzack-Ettinger (MLE) process and (b) postanoxic process.
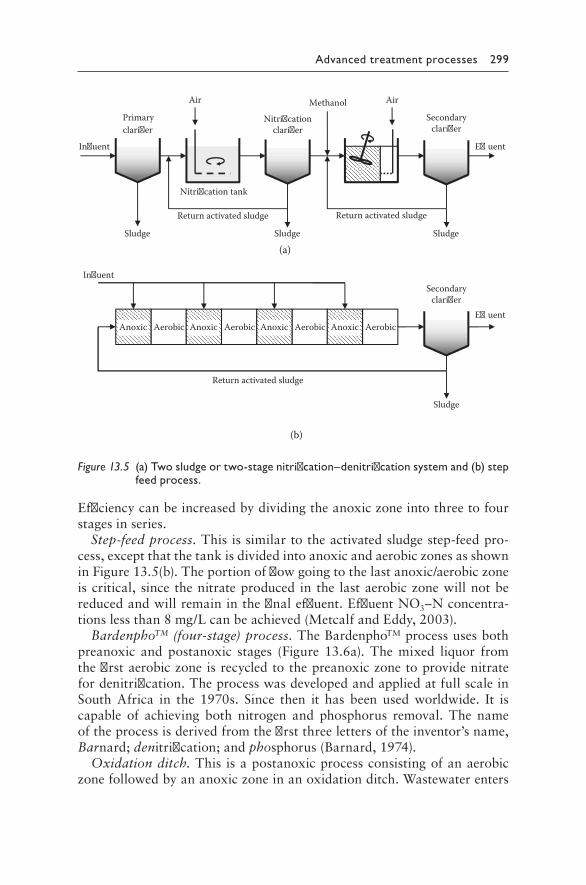
Advanced treatment processes 299
Efficiencycanbeincreasedbydividingtheanoxiczoneintothreetofourstagesinseries.
Step-feed process.Thisissimilartotheactivatedsludgestep-feedpro-cess,exceptthatthetankisdividedintoanoxicandaerobiczonesasshowninFigure 13.5(b).Theportionofflowgoingtothelastanoxic/aerobiczoneiscritical, since thenitrateproduced in the lastaerobiczonewillnotbereducedandwillremaininthefinaleffluent.EffluentNO3–Nconcentra-tionslessthan8mg/Lcanbeachieved(MetcalfandEddy,2003).
BardenphoTM (four-stage) process.TheBardenphoTMprocessusesbothpreanoxic and postanoxic stages (Figure 13.6a). The mixed liquor fromthefirstaerobiczoneisrecycledtothepreanoxiczonetoprovidenitratefordenitrification.TheprocesswasdevelopedandappliedatfullscaleinSouth Africa in the 1970s. Since then it has been used worldwide. It iscapable of achieving both nitrogen and phosphorus removal. The nameoftheprocessisderivedfromthefirstthreelettersoftheinventor’sname,Barnard;denitrification;andphosphorus(Barnard,1974).
Oxidation ditch.This isapostanoxicprocessconsistingofanaerobiczonefollowedbyananoxiczoneinanoxidationditch.Wastewaterenters
(a)
(b)
E�uent
Secondaryclari�er
Inuent
Sludge
Primary clari�er
Sludge
Nitri�cationclari�er
Sludge
Nitri�cation tank
Air
Return activated sludge
Methanol
Return activated sludge
Air
E�uent
Secondaryclari�er
Inuent
Aerobic
Sludge
Return activated sludge
Anoxic Aerobic Anoxic Aerobic Anoxic Aerobic Anoxic
Figure 13.5 (a) Two sludge or two-stage nitrification–denitrification system and (b) step feed process.
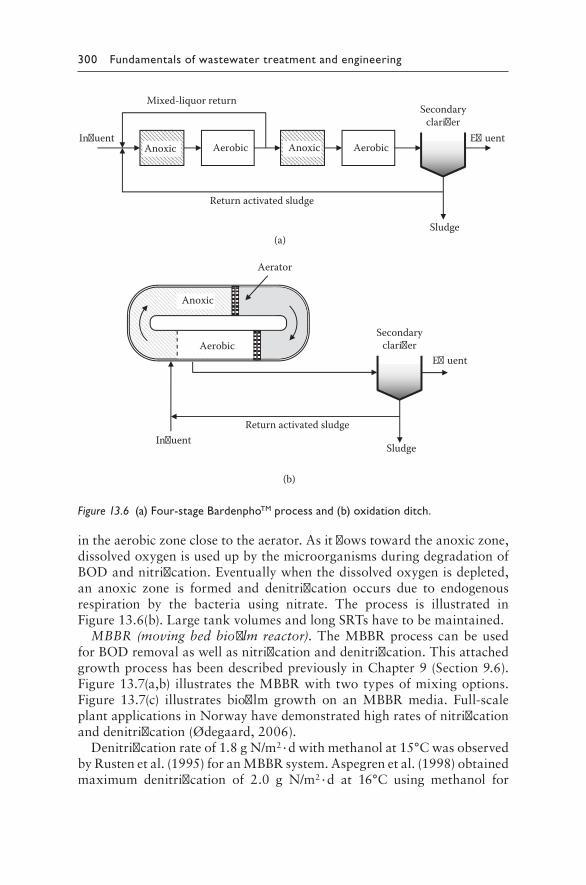
300 Fundamentals of wastewater treatment and engineering
intheaerobiczoneclosetotheaerator.Asitflowstowardtheanoxiczone,dissolvedoxygenisusedupbythemicroorganismsduringdegradationofBODandnitrification.Eventuallywhenthedissolvedoxygenisdepleted,an anoxic zone is formed and denitrification occurs due to endogenousrespiration by the bacteria using nitrate. The process is illustrated inFigure 13.6(b).LargetankvolumesandlongSRTshavetobemaintained.
MBBR (moving bed biofilm reactor).TheMBBRprocesscanbeusedforBODremovalaswellasnitrificationanddenitrification.ThisattachedgrowthprocesshasbeendescribedpreviouslyinChapter9(Section9.6).Figure 13.7(a,b) illustrates theMBBRwithtwotypesofmixingoptions.Figure 13.7(c) illustrates biofilm growth on an MBBR media. Full-scaleplantapplicationsinNorwayhavedemonstratedhighratesofnitrificationanddenitrification(Ødegaard,2006).
Denitrificationrateof1.8gN/m2·dwithmethanolat15°CwasobservedbyRustenetal.(1995)foranMBBRsystem.Aspegrenetal.(1998)obtainedmaximum denitrification of 2.0 g N/m2·d at 16°C using methanol for
(a)
(b)
Secondaryclari�er
Sludge In�uent
Return activated sludge
Aerobic
Anoxic
Aerator
E�uent
E�uent
Secondaryclari�er
In�uent
Sludge
Return activated sludge
Aerobic Anoxic AerobicAnoxic
Mixed-liquor return
Figure 13.6 (a) Four-stage BardenphoTM process and (b) oxidation ditch.
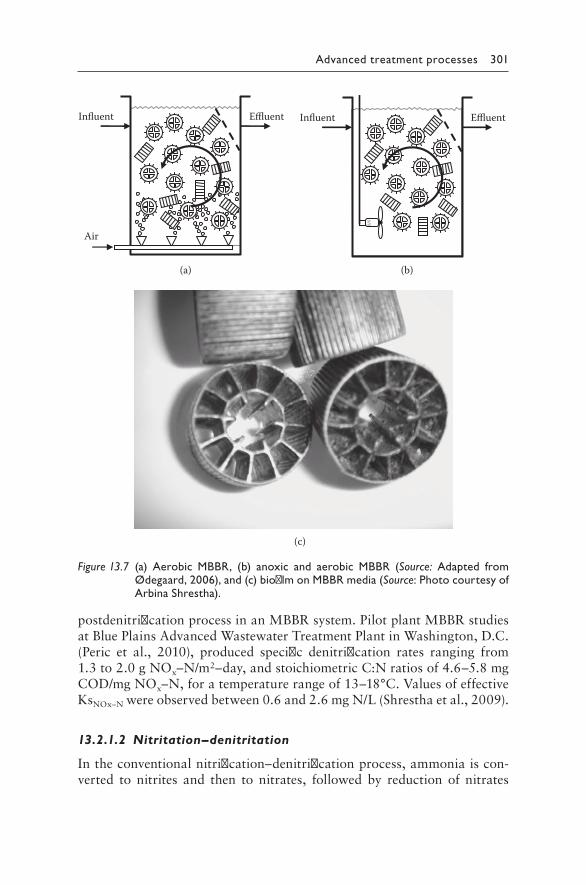
Advanced treatment processes 301
postdenitrificationprocessinanMBBRsystem.PilotplantMBBRstudiesatBluePlainsAdvancedWastewaterTreatmentPlantinWashington,D.C.(Peric et al., 2010), produced specific denitrification rates ranging from1.3to2.0gNOx–N/m2–day,andstoichiometricC:Nratiosof4.6–5.8mgCOD/mgNOx–N,foratemperaturerangeof13–18°C.ValuesofeffectiveKsNOx–Nwereobservedbetween0.6and2.6mgN/L(Shresthaetal.,2009).
13.2.1.2 Nitritation–denitritation
Intheconventionalnitrification–denitrificationprocess,ammoniaiscon-verted to nitrites and then to nitrates, followed by reduction of nitrates
Influent Effluent
Air
Influent Effluent
(b)(a)
(c)
Figure 13.7 (a) Aerobic MBBR, (b) anoxic and aerobic MBBR (Source: Adapted from Ødegaard, 2006), and (c) biofilm on MBBR media (Source: Photo courtesy of Arbina Shrestha).
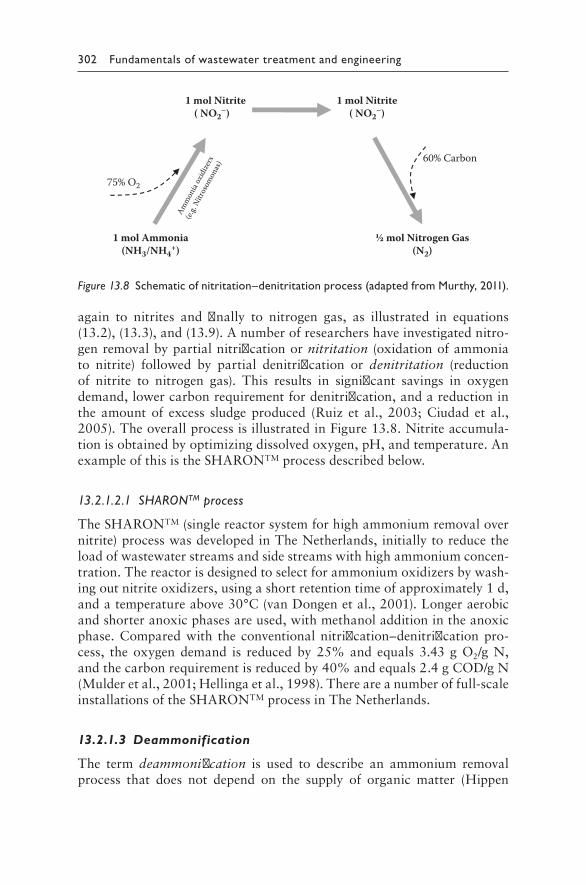
302 Fundamentals of wastewater treatment and engineering
again to nitrites and finally to nitrogen gas, as illustrated in equations(13.2),(13.3),and(13.9).Anumberofresearchershaveinvestigatednitro-genremovalbypartialnitrificationornitritation (oxidationofammoniato nitrite) followed by partial denitrification or denitritation (reductionof nitrite to nitrogen gas). This results in significant savings in oxygendemand,lowercarbonrequirementfordenitrification,andareductioninthe amountof excess sludgeproduced (Ruiz et al., 2003;Ciudad et al.,2005).TheoverallprocessisillustratedinFigure 13.8.Nitriteaccumula-tionisobtainedbyoptimizingdissolvedoxygen,pH,andtemperature.AnexampleofthisistheSHARONTMprocessdescribedbelow.
13.2.1.2.1 SHARONTM process
TheSHARONTM(singlereactorsystemforhighammoniumremovalovernitrite)processwasdevelopedinTheNetherlands,initiallytoreducetheloadofwastewaterstreamsandsidestreamswithhighammoniumconcen-tration.Thereactorisdesignedtoselectforammoniumoxidizersbywash-ingoutnitriteoxidizers,usingashortretentiontimeofapproximately1d,andatemperatureabove30°C(vanDongenetal.,2001).Longeraerobicandshorteranoxicphasesareused,withmethanoladditionintheanoxicphase.Comparedwith the conventionalnitrification–denitrificationpro-cess, theoxygendemand is reducedby25%and equals3.43gO2/gN,andthecarbonrequirementisreducedby40%andequals2.4gCOD/gN(Mulderetal.,2001;Hellingaetal.,1998).Thereareanumberoffull-scaleinstallationsoftheSHARONTMprocessinTheNetherlands.
13.2.1.3 Deammonification
The term deammonification is used to describe an ammonium removalprocess that does not depend on the supply of organic matter (Hippen
1 mol Ammonia(NH3/NH4
+)
1 mol Nitrite( NO2
–) 1 mol Nitrite
( NO2–)
½ mol Nitrogen Gas(N2)
75% O2
60% Carbon
Amm
onia
oxid
izers
(e.g.
Nitros
omon
as)
Figure 13.8 Schematic of nitritation–denitritation process (adapted from Murthy, 2011).
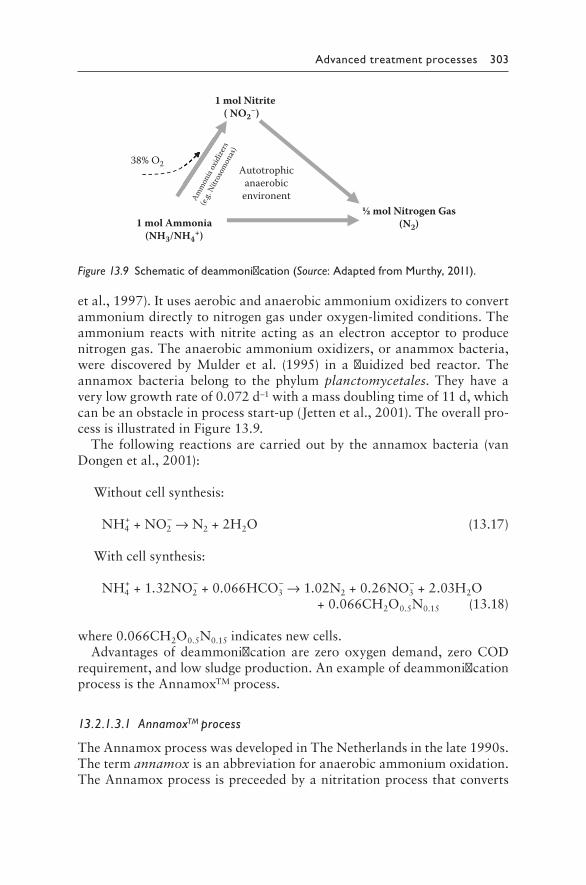
Advanced treatment processes 303
et al.,1997).Itusesaerobicandanaerobicammoniumoxidizerstoconvertammoniumdirectlytonitrogengasunderoxygen-limitedconditions.Theammoniumreactswithnitriteactingasanelectronacceptor toproducenitrogengas.Theanaerobicammoniumoxidizers,oranammoxbacteria,were discovered by Mulder et al. (1995) in a fluidized bed reactor. Theannamox bacteria belong to the phylum planctomycetales. They have averylowgrowthrateof0.072d–1withamassdoublingtimeof11d,whichcanbeanobstacleinprocessstart-up(Jettenetal.,2001).Theoverallpro-cessisillustratedinFigure 13.9.
The followingreactionsarecarriedoutby theannamoxbacteria (vanDongenetal.,2001):
Withoutcellsynthesis:
NH4++NO2
–→N2+2H2O (13.17)
Withcellsynthesis:
NH4++1.32NO2
–+0.066HCO3–→1.02N2+0.26NO3
–+2.03H2O +0.066CH2O0.5N0.15 (13.18)
where0.066CH2O0.5N0.15indicatesnewcells.Advantagesof deammonification are zerooxygendemand, zeroCOD
requirement,andlowsludgeproduction.AnexampleofdeammonificationprocessistheAnnamoxTMprocess.
13.2.1.3.1 AnnamoxTM process
TheAnnamoxprocesswasdevelopedinTheNetherlandsinthelate1990s.Thetermannamoxisanabbreviationforanaerobicammoniumoxidation.TheAnnamoxprocessispreceededbyanitritationprocessthatconverts
1 mol Ammonia(NH3/NH4
+)
1 mol Nitrite( NO2
–)
½ mol Nitrogen Gas(N2)
38% O2 Autotrophicanaerobic
environentAmm
onia
oxid
izers
(e.g.
Nitros
omon
as)
Figure 13.9 Schematic of deammonification (Source: Adapted from Murthy, 2011).
304 Fundamentals of wastewater treatment and engineering
halfoftheammoniumtonitrite,withoutsubsequentconversionofnitriteto nitrate. The oxygen uptake based on initial ammonium concentra-tionis1.72gO2/gN,or38%oftheoxygendemandforoxidationofalltheammoniumtonitrate (Gut,2006).After thisnitritationprocess, theAnammoxprocess (equations13.17and13.18) followswithoutadditionofanyorganicmaterialinaseparatereactor(vanLoosdrechtetal.,2004).
13.2.2 Physicochemical process for nitrogen removal
Physicochemicalprocessesmaybeusedforremovalofnitrogenandsimul-taneousammoniarecoveryfromwastewater.Airstrippersorsteamstrip-pers are used at a number of full-scale installations inEurope. In somecases,ammoniaisrecoveredasanammoniumnitratefertilizerproduct.
13.2.2.1 Air stripping
Theprocessofairstrippinginvolvestheconversionofaqueousammoniumion(NH4
+)togaseousammonia(NH3)andreleasingittotheatmosphere.Theequilibriumbetweenthetwospecieswasoutlinedinequation(13.1)andFigure 13.1.FromFigure 13.1,abovepH11or11.5,morethan99%ofammoniawillbepresentinthegaseousphase.
TheprocessconsistsofpretreatmentofthewastewaterwithlimetoraisethepHabove11.5.Enoughlimehastobeaddedtoprecipitatethealka-linityand raise thepH to thedesired level.Once the conversion togas-eousammonia iscomplete,strippingordegasification isconducted.Oneofthemostefficientreactorsisthecountercurrentspraytower,illustratedinFigure 13.10(Peavy,1985).Largevolumesofairarerequired.Packingmaterialisprovidedtominimizefilmresistancetogastransferandtoaidinformationofliquiddroplets.Airpollutioncontrolmayberequiredforammoniaemissions.Anotherdisadvantageisreductioninefficiencyatcoldtemperatures.Theprocessiseconomicalwhenlimeprecipitationofphos-phorusisalsodesired.
13.3 PHOSPHORUS REMOVAL
Phosphorus iscontributed towastewatermainly fromhumanwastesandfromsyntheticwastessuchasdetergents.Theprincipalformofphosphorusinwastewaterisorthophosphate,togetherwithsomepolyphosphatesandorganically bound phosphorus. Polyphosphates originate from detergentsandcanbehydrolyzedtoorthophosphates.Organicallyboundphosphoruscomesfrombodyandfoodwastesandisbiologicallydegraded/convertedtoorthophosphates.Thephosphorusororthophosphatescanberemovedfromwastewaterbychemicalorbiologicalprocesses.Thesearedescribedbelow.
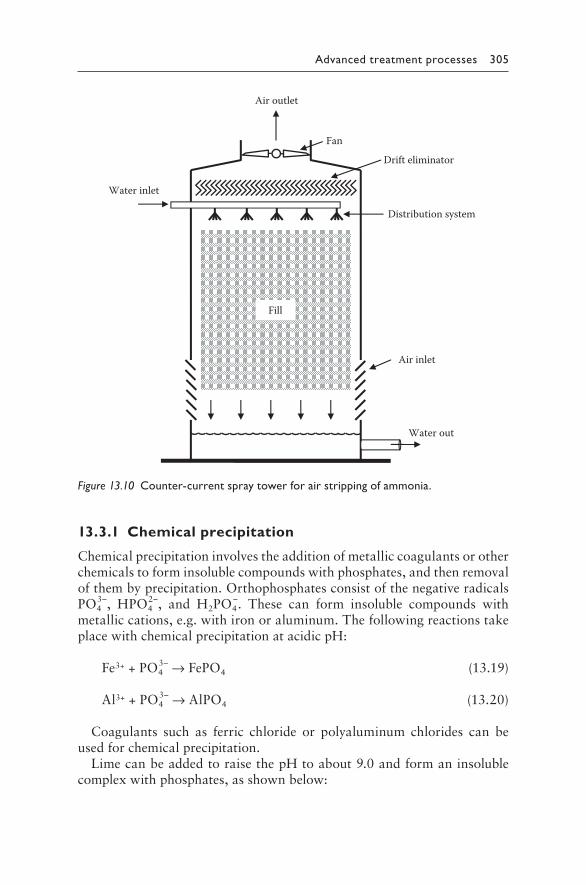
Advanced treatment processes 305
13.3.1 Chemical precipitation
Chemicalprecipitationinvolvestheadditionofmetalliccoagulantsorotherchemicalstoforminsolublecompoundswithphosphates,andthenremovalofthembyprecipitation.OrthophosphatesconsistofthenegativeradicalsPO4
3–, HPO42–, and H2PO4
–. These can form insoluble compounds withmetalliccations,e.g.withironoraluminum.ThefollowingreactionstakeplacewithchemicalprecipitationatacidicpH:
Fe3++PO43–→FePO4 (13.19)
Al3++PO43–→AlPO4 (13.20)
Coagulants such as ferric chloride or polyaluminum chlorides can beusedforchemicalprecipitation.
LimecanbeaddedtoraisethepHtoabout9.0andformaninsolublecomplexwithphosphates,asshownbelow:
Air outlet
Fan
Drift eliminator
Water inlet
Water out
Air inlet
Fill
Distribution system
Figure 13.10 Counter-current spray tower for air stripping of ammonia.
306 Fundamentals of wastewater treatment and engineering
Ca(OH)2+PO43–→Ca5(OH)(PO4)3+H2O (13.21)
Metallic coagulants and lime consume alkalinity from the wastewater.Thuschemicaldosagesareusuallytwotothreetimesgreaterthanthatpre-dictedfromstoichiometry.Coagulantsmaybeaddedtotheprimaryorsec-ondaryunitsforcombinedremovalwithsolidsandBOD,orseparatelyinatertiaryunit.Applicationinprimaryclarifiersisbeneficial,sinceitresultsin enhanced clarification of BOD and solids. But polymers are requiredforflocculation(Peavy,1985).Applicationinatertiaryunitresultsinthemostefficientuseofcoagulantswiththehighestremovalefficiency.Italsohasthehighestcapitalcostandmetalleakage.Tertiaryunitsforphospho-rusprecipitationcanbedesignedasflocculatorclarifiers,within-linemix-ingofcoagulants.Coagulationandflocculationisfollowedbysettlingtoremovetheprecipitatedcompounds.
13.3.2 Biological phosphorus removal
Biologicalphosphorusremoval(BPR)isaccomplishedbyagroupofbacte-riacollectivelyknownasPAOs(phosphorus-accumulatingorganisms).ThePAOsincorporatelargeamountsofphosphorusintocellbiomass,whichissubsequently removedfromtheprocessbysludgewasting.PAOs includeAcinetobacter, Arthrobacter, Aeromonas, Nocardia, and Pseudomonas(Davis,2011).PhosphoruscontentinPAOscanrangefrom0.2to0.3gP/gVSS,whileinordinaryheterotrophicbacteriaitrangesfrom0.01to0.02gP/gVSS.
Thebasicbiologicalphosphorusremovalprocessconsistsofananaer-obic zone or tank followed by an aeration tank. The anaerobic zone iscalledaselector,sinceitprovidesthefavorableconditionsforgrowthandproliferationofPAOs,withashortHRTof0.5to1.0h.AfractionofthebiodegradableCODis fermentedtoacetateandconsumedbythePAOs.TheyproduceintracellularPHB(poly-hydroxy-butyrate)storageproductsandreleaseorthophosphates.Intheaerobiczone,PHBismetabolizedfornewcellsynthesis.TheenergyreleasedfromPHBoxidationisusedtoformpolyphosphatebondsincellstorage,leadingtoremovaloforthophosphatesfromsolutionandincorporationintopolyphosphateswithinthebacterialcell (Metcalf and Eddy, 2003). Phosphorus is removed from the systemwhenthebiomassiswasted.Maximumspecificgrowthrateof0.95d–1wasobservedforPAOsbyBarkerandDold(1997).
Fromstoichiometry,itisestimatedthatabout10gofbiodegradablesol-ubleCODisrequiredtoremove1gPbythebiologicalstoragemechanism.Thisvalueisbasedonthefollowingassumptions(MetcalfandEddy,2003):(1)1.06gacetate/gbsCODisproducedintheanaerobiczone;(2)cellyieldis0.3gVSS/gacetate;and(3)cellphosphoruscontentofPAOis0.3gP/gVSS. In biological systems, other cations associated with polyphosphate
Advanced treatment processes 307
storage,suchasCa,Mg,andK,mustalsobeavailableinsufficientquanti-tiesforefficientphosphorusremoval.Municipalwastewatersusuallyhavethecationsinrequiredquantities.
13.3.2.1 Selected processes for BPR
The following are descriptions of selected processes used for biologi-cal phosphorus removal. Sequencing Batch Reactors (SBRs) can also beused for combined nitrogen and phosphorus removal,where the reactorsequencesthroughanaerobic/anoxic/aerobicphases.
13.3.2.2 Phoredox
ThetermphoredoxwasusedbyBarnard(1975)todesignateanyBPRpro-cesswithananaerobic/aerobicsequence,asillustratedinFigure 13.11(a).Theanaerobicdetentiontimeis0.5to1h.LowoperatingSRTisusedtopreventnitrificationintheaerobiczone.SRTvaluesrangefrom2to3dat20°C,and4to5dat10°C,topromotephosphorusremovalwithoutsimultaneousnitrification(Gradyetal.,1999).AvariationofthisprocesswithmultiplestageswaspatentedastheA2/OTMprocess.
13.3.2.3 A2OTM process
TheA2OTMprocessisusedforcombinednitrogenandphosphorusremoval.Ananoxiczone isprovidedbetweentheanaerobicandaerobiczones,asillustrated in Figure 13.11(b). Anoxic zone detention time is about 1 h.Chemically bound oxygen in the form of nitrate is introduced into theanoxiczonebyrecirculatingeffluentfromtheaerobiczone.Thisreducestheamountofnitratefedtotheanaerobiczoneinthereturn-activatedsludge.
13.3.2.4 Modified BardenphoTM (five stage)
Thefive-stageBardenphoTMprocessillustratedinFigure 13.11(c)isusedforcombinedcarbon,nitrogen,andphosphorusremoval.Theanaerobic,anoxic,andaerobicstagesprovidephosphorus,nitrogen,andcarbonremoval.Asec-ondanoxicstageachievesadditionaldenitrificationusingnitrateproducedintheaerobiczoneandendogenousorganiccarbon.Thefinalaerobicstageisusedtostripnitrogengasfromsolutionandminimizethereleaseofphospho-rusinthefinalclarifier.ProcessSRTrangesfrom10to20d.
13.3.2.5 UCT process
TheUCTprocesswasdevelopedattheUniversityofCapeTowninSouthAfrica, and hence its name. The standard UCT process is illustrated in
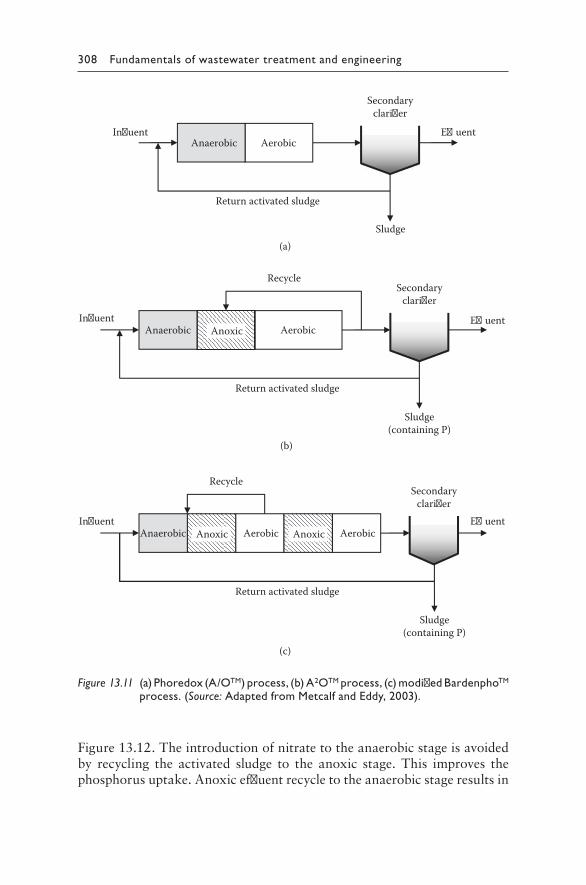
308 Fundamentals of wastewater treatment and engineering
Figure 13.12.Theintroductionofnitratetotheanaerobicstageisavoidedby recycling the activated sludge to the anoxic stage. This improves thephosphorusuptake.Anoxiceffluentrecycletotheanaerobicstageresultsin
(a)
(b)
(c)
E�uent
Secondaryclari�er
Aerobic
Return activated sludge
In�uent Anaerobic Anoxic
Recycle
Aerobic Anoxic
Sludge(containing P)
E�uent
Secondaryclari�er
Aerobic
Return activated sludge
In�uent Anaerobic Anoxic
Recycle
Sludge(containing P)
E�uent
Secondaryclari�er
In�uent Anaerobic Aerobic
Sludge
Return activated sludge
Figure 13.11 (a) Phoredox (A/OTM) process, (b) A2OTM process, (c) modified BardenphoTM process. (Source: Adapted from Metcalf and Eddy, 2003).
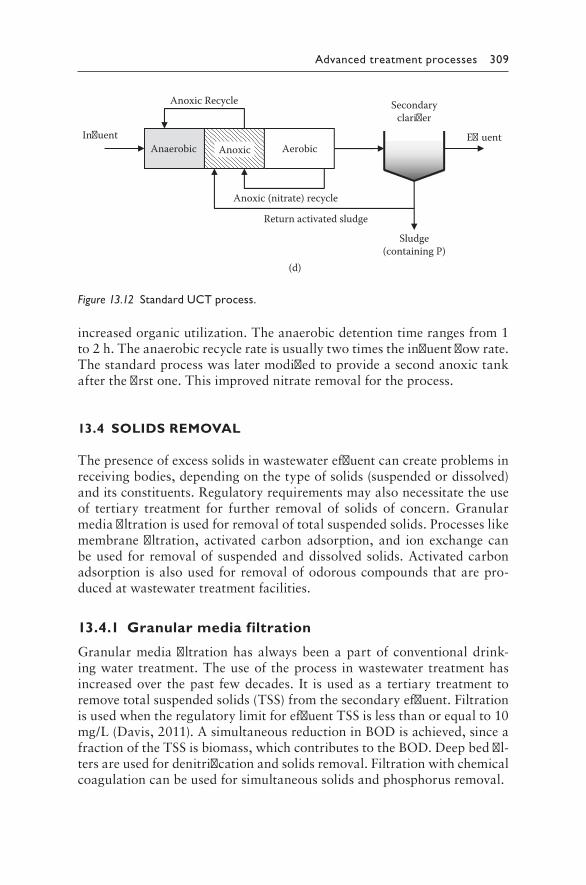
Advanced treatment processes 309
increasedorganicutilization.Theanaerobicdetentiontimerangesfrom1to2h.Theanaerobicrecyclerateisusuallytwotimestheinfluentflowrate.Thestandardprocesswaslatermodifiedtoprovideasecondanoxictankafterthefirstone.Thisimprovednitrateremovalfortheprocess.
13.4 SOLIDS REMOVAL
Thepresenceofexcesssolidsinwastewatereffluentcancreateproblemsinreceivingbodies,dependingonthetypeofsolids(suspendedordissolved)anditsconstituents.Regulatoryrequirementsmayalsonecessitatetheuseof tertiary treatment for further removal of solids of concern. Granularmediafiltrationisusedforremovaloftotalsuspendedsolids.Processeslikemembranefiltration,activatedcarbonadsorption,and ionexchange canbeusedforremovalofsuspendedanddissolvedsolids.Activatedcarbonadsorptionisalsousedforremovalofodorouscompoundsthatarepro-ducedatwastewatertreatmentfacilities.
13.4.1 Granular media filtration
Granularmediafiltrationhasalwaysbeenapartof conventionaldrink-ingwatertreatment.Theuseoftheprocess inwastewatertreatmenthasincreasedover thepast fewdecades. It isusedasa tertiary treatment toremovetotalsuspendedsolids(TSS)fromthesecondaryeffluent.FiltrationisusedwhentheregulatorylimitforeffluentTSSislessthanorequalto10mg/L(Davis,2011).AsimultaneousreductioninBODisachieved,sinceafractionoftheTSSisbiomass,whichcontributestotheBOD.Deepbedfil-tersareusedfordenitrificationandsolidsremoval.Filtrationwithchemicalcoagulationcanbeusedforsimultaneoussolidsandphosphorusremoval.
(d)
E�uent
Secondaryclari er
Aerobic
Anoxic (nitrate) recycle
In�uent Anaerobic Anoxic
Anoxic Recycle
Sludge(containing P)
Return activated sludge
Figure 13.12 Standard UCT process.
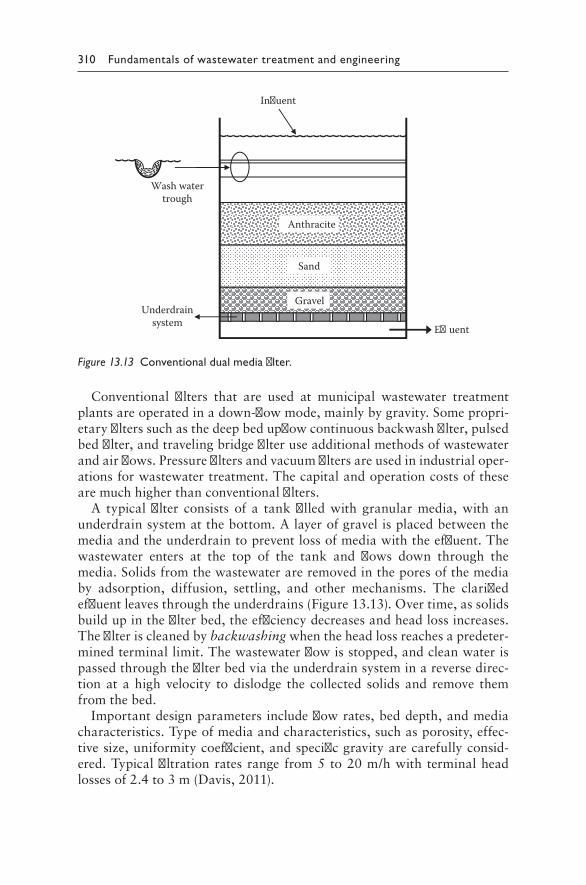
310 Fundamentals of wastewater treatment and engineering
Conventional filters that are used at municipal wastewater treatmentplantsareoperatedinadown-flowmode,mainlybygravity.Somepropri-etaryfilterssuchasthedeepbedupflowcontinuousbackwashfilter,pulsedbedfilter,andtravelingbridgefilteruseadditionalmethodsofwastewaterandairflows.Pressurefiltersandvacuumfiltersareusedinindustrialoper-ationsforwastewatertreatment.Thecapitalandoperationcostsofthesearemuchhigherthanconventionalfilters.
A typical filter consists of a tankfilledwith granularmedia,with anunderdrainsystematthebottom.Alayerofgravelisplacedbetweenthemediaandtheunderdraintopreventlossofmediawiththeeffluent.Thewastewater enters at the top of the tank and flows down through themedia.Solidsfromthewastewaterareremovedintheporesofthemediaby adsorption, diffusion, settling, and other mechanisms. The clarifiedeffluentleavesthroughtheunderdrains(Figure 13.13).Overtime,assolidsbuildupinthefilterbed,theefficiencydecreasesandheadlossincreases.Thefilteriscleanedbybackwashingwhentheheadlossreachesapredeter-minedterminallimit.Thewastewaterflowisstopped,andcleanwaterispassedthroughthefilterbedviatheunderdrainsysteminareversedirec-tionat ahighvelocity todislodge the collected solids and remove themfromthebed.
Importantdesignparameters includeflowrates,beddepth,andmediacharacteristics.Typeofmediaandcharacteristics,suchasporosity,effec-tivesize,uniformitycoefficient,andspecificgravityarecarefullyconsid-ered.Typicalfiltrationratesrange from5to20m/hwith terminalheadlossesof2.4to3m(Davis,2011).
Gravel
Sand
Anthracite
Underdrainsystem E�uent
In�uent
Wash watertrough
Figure 13.13 Conventional dual media filter.
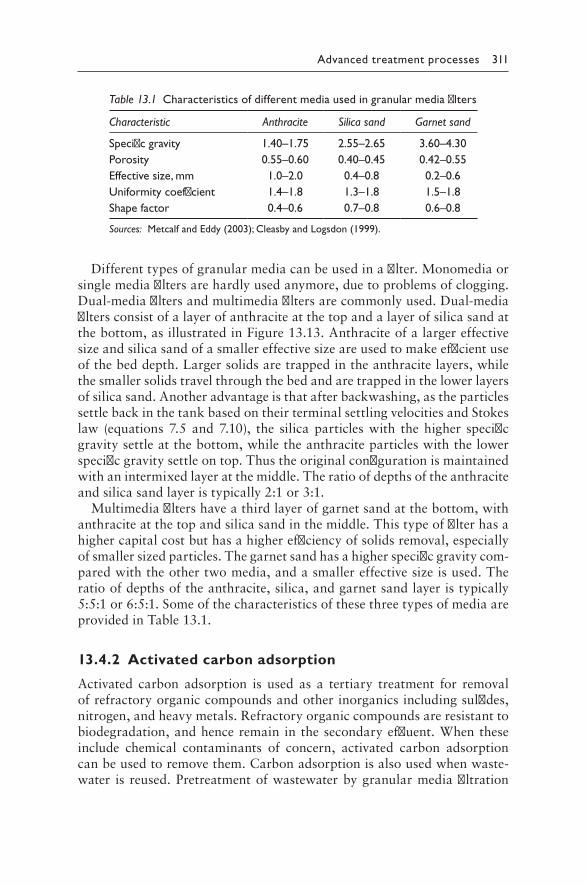
Advanced treatment processes 311
Differenttypesofgranularmediacanbeusedinafilter.Monomediaorsinglemediafiltersarehardlyusedanymore,duetoproblemsofclogging.Dual-mediafiltersandmultimediafiltersarecommonlyused.Dual-mediafiltersconsistofalayerofanthraciteatthetopandalayerofsilicasandatthebottom,asillustratedinFigure 13.13.Anthraciteofalargereffectivesizeandsilicasandofasmallereffectivesizeareusedtomakeefficientuseofthebeddepth.Largersolidsaretrappedintheanthracitelayers,whilethesmallersolidstravelthroughthebedandaretrappedinthelowerlayersofsilicasand.Anotheradvantageisthatafterbackwashing,astheparticlessettlebackinthetankbasedontheirterminalsettlingvelocitiesandStokeslaw (equations7.5 and7.10), the silicaparticleswith thehigher specificgravitysettleatthebottom,whiletheanthraciteparticleswiththelowerspecificgravitysettleontop.Thustheoriginalconfigurationismaintainedwithanintermixedlayeratthemiddle.Theratioofdepthsoftheanthraciteandsilicasandlayeristypically2:1or3:1.
Multimediafiltershaveathirdlayerofgarnetsandatthebottom,withanthraciteatthetopandsilicasandinthemiddle.Thistypeoffilterhasahighercapitalcostbuthasahigherefficiencyofsolidsremoval,especiallyofsmallersizedparticles.Thegarnetsandhasahigherspecificgravitycom-paredwiththeothertwomedia,andasmallereffectivesizeisused.Theratioofdepthsoftheanthracite,silica,andgarnetsandlayeristypically5:5:1or6:5:1.SomeofthecharacteristicsofthesethreetypesofmediaareprovidedinTable 13.1.
13.4.2 Activated carbon adsorption
Activated carbon adsorption is used as a tertiary treatment for removalofrefractoryorganiccompoundsandotherinorganicsincludingsulfides,nitrogen,andheavymetals.Refractoryorganiccompoundsareresistanttobiodegradation,andhenceremaininthesecondaryeffluent.Whentheseinclude chemical contaminants of concern, activated carbon adsorptioncanbeusedtoremovethem.Carbonadsorptionisalsousedwhenwaste-water is reused.Pretreatmentofwastewaterbygranularmediafiltration
Table 13.1 Characteristics of different media used in granular media filters
Characteristic Anthracite Silica sand Garnet sand
Specific gravity 1.40–1.75 2.55–2.65 3.60–4.30Porosity 0.55–0.60 0.40–0.45 0.42–0.55Effective size, mm 1.0–2.0 0.4–0.8 0.2–0.6Uniformity coefficient 1.4–1.8 1.3–1.8 1.5–1.8Shape factor 0.4–0.6 0.7–0.8 0.6–0.8
Sources: Metcalf and Eddy (2003); Cleasby and Logsdon (1999).
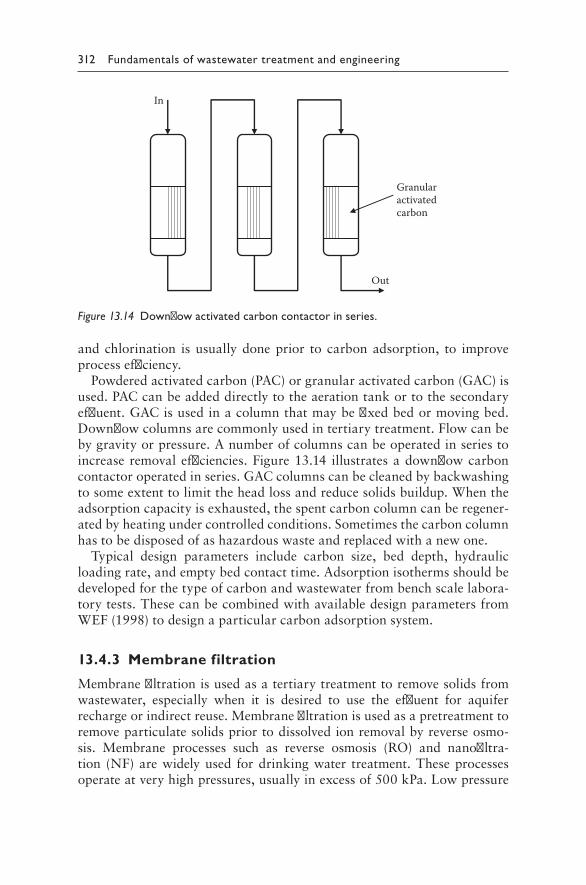
312 Fundamentals of wastewater treatment and engineering
andchlorination isusuallydoneprior to carbonadsorption, to improveprocessefficiency.
Powderedactivatedcarbon(PAC)orgranularactivatedcarbon(GAC)isused.PACcanbeaddeddirectlytotheaerationtankortothesecondaryeffluent.GACisusedinacolumnthatmaybefixedbedormovingbed.Downflowcolumnsarecommonlyusedintertiarytreatment.Flowcanbebygravityorpressure.Anumberofcolumnscanbeoperatedinseriestoincrease removalefficiencies.Figure 13.14 illustratesadownflowcarboncontactoroperatedinseries.GACcolumnscanbecleanedbybackwashingtosomeextenttolimittheheadlossandreducesolidsbuildup.Whentheadsorptioncapacityisexhausted,thespentcarboncolumncanberegener-atedbyheatingundercontrolledconditions.Sometimesthecarboncolumnhastobedisposedofashazardouswasteandreplacedwithanewone.
Typical design parameters include carbon size, bed depth, hydraulicloadingrate,andemptybedcontacttime.Adsorptionisothermsshouldbedevelopedforthetypeofcarbonandwastewaterfrombenchscalelabora-torytests.ThesecanbecombinedwithavailabledesignparametersfromWEF(1998)todesignaparticularcarbonadsorptionsystem.
13.4.3 Membrane filtration
Membranefiltrationisusedasatertiarytreatmenttoremovesolidsfromwastewater, especially when it is desired to use the effluent for aquiferrechargeorindirectreuse.Membranefiltrationisusedasapretreatmenttoremoveparticulatesolidspriortodissolvedionremovalbyreverseosmo-sis. Membrane processes such as reverse osmosis (RO) and nanofiltra-tion (NF)arewidelyused fordrinkingwater treatment.Theseprocessesoperateatveryhighpressures,usuallyinexcessof500kPa.Lowpressure
In
Out
Granularactivatedcarbon
Figure 13.14 Downflow activated carbon contactor in series.
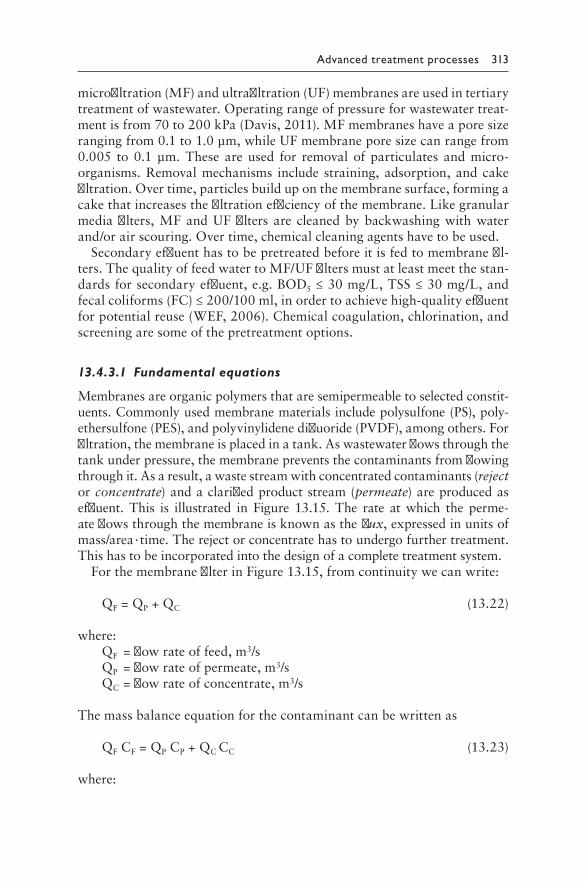
Advanced treatment processes 313
microfiltration(MF)andultrafiltration(UF)membranesareusedintertiarytreatmentofwastewater.Operatingrangeofpressureforwastewatertreat-mentisfrom70to200kPa(Davis,2011).MFmembraneshaveaporesizerangingfrom0.1to1.0µm,whileUFmembraneporesizecanrangefrom0.005 to0.1µm.These areused for removal of particulates andmicro-organisms.Removalmechanisms include straining,adsorption,andcakefiltration.Overtime,particlesbuilduponthemembranesurface,formingacakethatincreasesthefiltrationefficiencyofthemembrane.Likegranularmediafilters,MFandUFfilters are cleanedbybackwashingwithwaterand/orairscouring.Overtime,chemicalcleaningagentshavetobeused.
Secondaryeffluenthastobepretreatedbeforeitisfedtomembranefil-ters.ThequalityoffeedwatertoMF/UFfiltersmustatleastmeetthestan-dardsforsecondaryeffluent,e.g.BOD5≤30mg/L,TSS≤30mg/L,andfecalcoliforms(FC)≤200/100ml,inordertoachievehigh-qualityeffluentforpotentialreuse(WEF,2006).Chemicalcoagulation,chlorination,andscreeningaresomeofthepretreatmentoptions.
13.4.3.1 Fundamental equations
Membranesareorganicpolymersthataresemipermeabletoselectedconstit-uents.Commonlyusedmembranematerialsincludepolysulfone(PS),poly-ethersulfone(PES),andpolyvinylidenedifluoride(PVDF),amongothers.Forfiltration,themembraneisplacedinatank.Aswastewaterflowsthroughthetankunderpressure,themembranepreventsthecontaminantsfromflowingthroughit.Asaresult,awastestreamwithconcentratedcontaminants(reject orconcentrate)andaclarifiedproductstream(permeate)areproducedaseffluent. This is illustrated in Figure 13.15. The rate at which the perme-ateflowsthroughthemembraneisknownastheflux,expressedinunitsofmass/area·time.Therejectorconcentratehastoundergofurthertreatment.Thishastobeincorporatedintothedesignofacompletetreatmentsystem.
ForthemembranefilterinFigure 13.15,fromcontinuitywecanwrite:
QF=QP+QC (13.22)
where:QF=flowrateoffeed,m3/sQP=flowrateofpermeate,m3/sQC=flowrateofconcentrate,m3/s
Themassbalanceequationforthecontaminantcanbewrittenas
QFCF=QPCP+QCCC (13.23)
where:
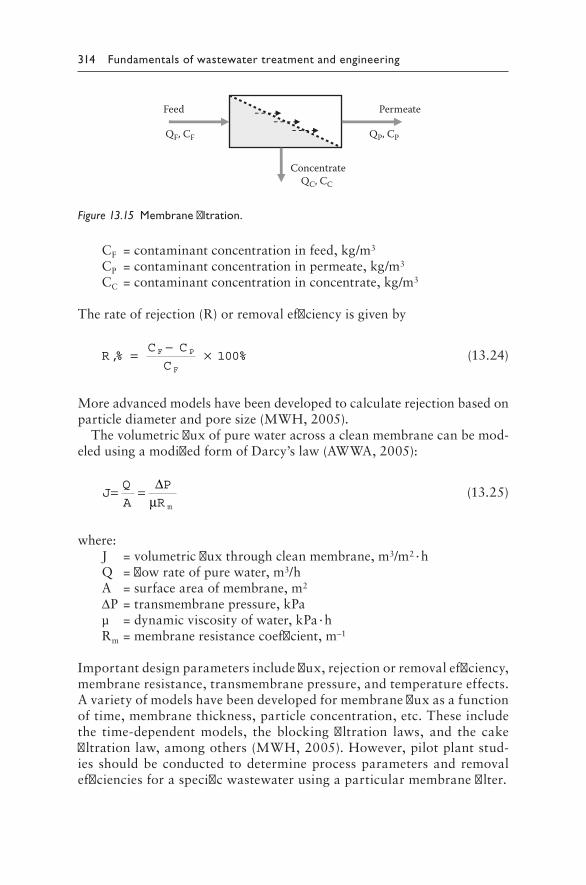
314 Fundamentals of wastewater treatment and engineering
CF=contaminantconcentrationinfeed,kg/m3
CP=contaminantconcentrationinpermeate,kg/m3
CC=contaminantconcentrationinconcentrate,kg/m3
Therateofrejection(R)orremovalefficiencyisgivenby
RC C
CF P
F
,% %= − × 100 (13.24)
Moreadvancedmodelshavebeendevelopedtocalculaterejectionbasedonparticlediameterandporesize(MWH,2005).
Thevolumetricfluxofpurewateracrossacleanmembranecanbemod-eledusingamodifiedformofDarcy’slaw(AWWA,2005):
JQ
A
P
R m
= = ∆µ
(13.25)
where:J=volumetricfluxthroughcleanmembrane,m3/m2·hQ=flowrateofpurewater,m3/hA=surfaceareaofmembrane,m2
ΔP=transmembranepressure,kPaµ=dynamicviscosityofwater,kPa·hRm=membraneresistancecoefficient,m–1
Importantdesignparametersincludeflux,rejectionorremovalefficiency,membraneresistance,transmembranepressure,andtemperatureeffects.Avarietyofmodelshavebeendevelopedformembranefluxasafunctionoftime,membranethickness,particleconcentration,etc.Theseincludethe time-dependent models, the blocking filtration laws, and the cakefiltrationlaw,amongothers(MWH,2005).However,pilotplantstud-ies shouldbeconducted todetermineprocessparametersandremovalefficienciesforaspecificwastewaterusingaparticularmembranefilter.
Feed
QF, CF QP, CP
QC, CC
Permeate
Concentrate
Figure 13.15 Membrane filtration.
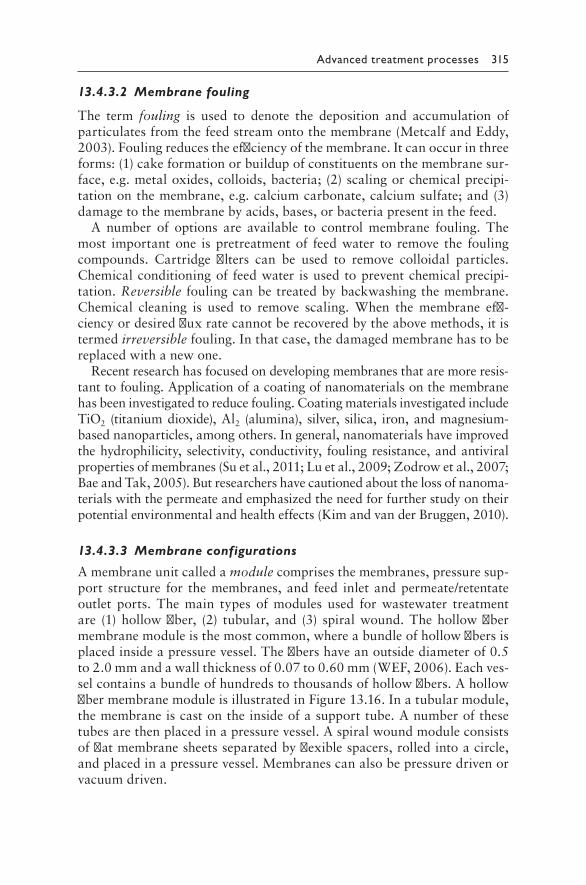
Advanced treatment processes 315
13.4.3.2 Membrane fouling
The term fouling is used to denote the deposition and accumulation ofparticulatesfromthefeedstreamontothemembrane(MetcalfandEddy,2003).Foulingreducestheefficiencyofthemembrane.Itcanoccurinthreeforms:(1)cakeformationorbuildupofconstituentsonthemembranesur-face,e.g.metaloxides,colloids,bacteria;(2)scalingorchemicalprecipi-tationonthemembrane,e.g.calciumcarbonate,calciumsulfate;and(3)damagetothemembranebyacids,bases,orbacteriapresentinthefeed.
A number of options are available to control membrane fouling. Themost importantone ispretreatmentof feedwater to remove the foulingcompounds. Cartridge filters can be used to remove colloidal particles.Chemicalconditioningof feedwater isusedtopreventchemicalprecipi-tation.Reversible foulingcanbetreatedbybackwashingthemembrane.Chemical cleaning is used to remove scaling. When the membrane effi-ciencyordesiredfluxratecannotberecoveredbytheabovemethods,itistermedirreversiblefouling.Inthatcase,thedamagedmembranehastobereplacedwithanewone.
Recentresearchhasfocusedondevelopingmembranesthataremoreresis-tanttofouling.Applicationofacoatingofnanomaterialsonthemembranehasbeeninvestigatedtoreducefouling.CoatingmaterialsinvestigatedincludeTiO2 (titaniumdioxide),Al2 (alumina), silver, silica, iron,andmagnesium-basednanoparticles,amongothers.Ingeneral,nanomaterialshaveimprovedthehydrophilicity, selectivity,conductivity, foulingresistance,andantiviralpropertiesofmembranes(Suetal.,2011;Luetal.,2009;Zodrowetal.,2007;BaeandTak,2005).Butresearchershavecautionedaboutthelossofnanoma-terialswiththepermeateandemphasizedtheneedforfurtherstudyontheirpotentialenvironmentalandhealtheffects(KimandvanderBruggen,2010).
13.4.3.3 Membrane configurations
Amembraneunitcalledamodulecomprisesthemembranes,pressuresup-port structure for themembranes, and feed inletandpermeate/retentateoutlet ports. The main types of modules used for wastewater treatmentare (1)hollowfiber, (2) tubular, and (3) spiralwound.Thehollowfibermembranemoduleisthemostcommon,whereabundleofhollowfibersisplacedinsideapressurevessel.Thefibershaveanoutsidediameterof0.5to2.0mmandawallthicknessof0.07to0.60mm(WEF,2006).Eachves-selcontainsabundleofhundredstothousandsofhollowfibers.AhollowfibermembranemoduleisillustratedinFigure 13.16.Inatubularmodule,themembraneiscastontheinsideofasupporttube.Anumberofthesetubesarethenplacedinapressurevessel.Aspiralwoundmoduleconsistsofflatmembranesheetsseparatedbyflexiblespacers,rolledintoacircle,andplacedinapressurevessel.Membranescanalsobepressuredrivenorvacuumdriven.
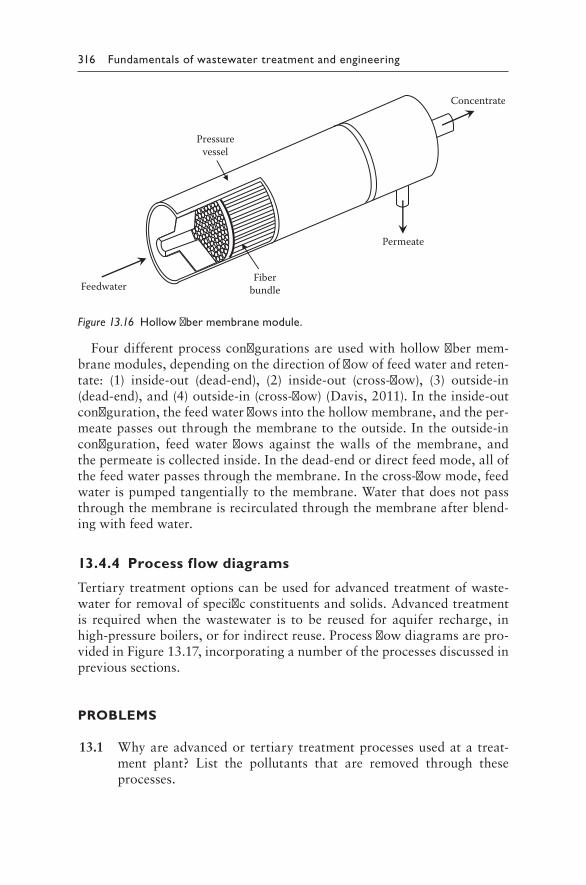
316 Fundamentals of wastewater treatment and engineering
Fourdifferentprocessconfigurationsareusedwithhollowfibermem-branemodules,dependingonthedirectionofflowoffeedwaterandreten-tate: (1) inside-out (dead-end), (2) inside-out (cross-flow), (3) outside-in(dead-end),and(4)outside-in(cross-flow)(Davis,2011).Intheinside-outconfiguration,thefeedwaterflowsintothehollowmembrane,andtheper-meatepassesoutthroughthemembranetotheoutside.Intheoutside-inconfiguration, feed water flows against the walls of the membrane, andthepermeateiscollectedinside.Inthedead-endordirectfeedmode,allofthefeedwaterpassesthroughthemembrane.Inthecross-flowmode,feedwaterispumpedtangentiallytothemembrane.Waterthatdoesnotpassthroughthemembraneisrecirculatedthroughthemembraneafterblend-ingwithfeedwater.
13.4.4 Process flow diagrams
Tertiarytreatmentoptionscanbeusedforadvancedtreatmentofwaste-waterforremovalofspecificconstituentsandsolids.Advancedtreatmentis requiredwhen thewastewater is tobe reused for aquifer recharge, inhigh-pressureboilers,orforindirectreuse.Processflowdiagramsarepro-videdinFigure 13.17,incorporatinganumberoftheprocessesdiscussedinprevioussections.
PROBLEMS
13.1 Whyareadvancedortertiarytreatmentprocessesusedatatreat-ment plant? List the pollutants that are removed through theseprocesses.
Feedwater
Permeate
Concentrate
Pressurevessel
Fiberbundle
Figure 13.16 Hollow fiber membrane module.
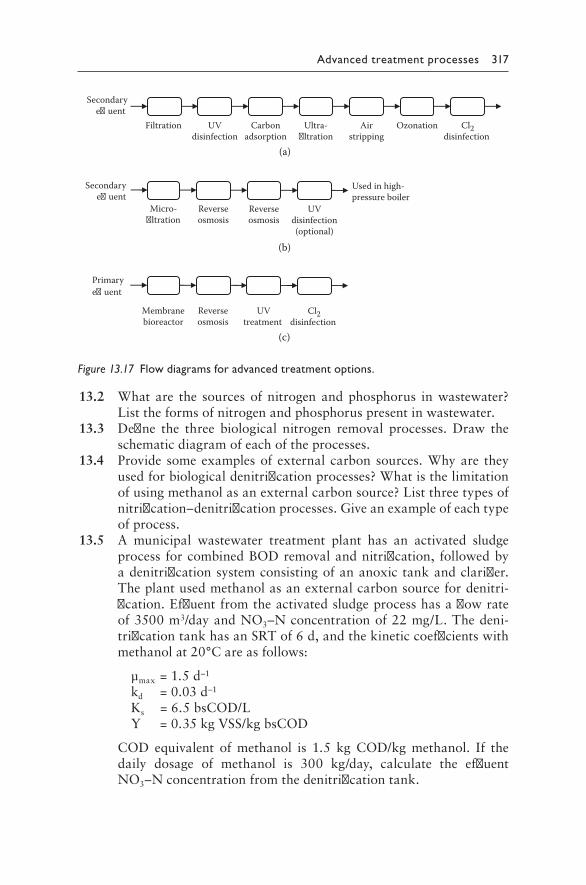
Advanced treatment processes 317
13.2 What are the sourcesofnitrogenandphosphorus inwastewater?Listtheformsofnitrogenandphosphoruspresentinwastewater.
13.3 Define the three biological nitrogen removal processes. Draw theschematicdiagramofeachoftheprocesses.
13.4 Provide someexamplesof external carbon sources.Whyare theyusedforbiologicaldenitrificationprocesses?Whatisthelimitationofusingmethanolasanexternalcarbonsource?Listthreetypesofnitrification–denitrificationprocesses.Giveanexampleofeachtypeofprocess.
13.5 A municipal wastewater treatment plant has an activated sludgeprocess forcombinedBODremovalandnitrification, followedbyadenitrificationsystemconsistingofananoxictankandclarifier.Theplantusedmethanolasanexternalcarbonsourcefordenitri-fication.Effluentfromtheactivatedsludgeprocesshasaflowrateof3500m3/dayandNO3–Nconcentrationof22mg/L.Thedeni-trificationtankhasanSRTof6d,andthekineticcoefficientswithmethanolat20°Careasfollows:
μmax=1.5d–1
kd =0.03d–1
Ks =6.5bsCOD/L Y =0.35kgVSS/kgbsCOD
COD equivalent of methanol is 1.5 kg COD/kg methanol. If thedaily dosage of methanol is 300 kg/day, calculate the effluentNO3–Nconcentrationfromthedenitrificationtank.
(a)
(b)
(c)
Micro-�ltration
Reverseosmosis
Reverseosmosis
UVdisinfection(optional)
Secondarye�uent
Used in high-pressure boiler
Membranebioreactor
Reverseosmosis
UVtreatment
Cl2disinfection
Primary e�uent
Filtration UVdisinfection
Carbonadsorption
Ultra-�ltration
Airstripping
Ozonation Cl2disinfection
Secondarye�uent
Figure 13.17 Flow diagrams for advanced treatment options.
318 Fundamentals of wastewater treatment and engineering
Why is limepretreatmentnecessary for the air strippingprocess?Whatarethedisadvantagesofthisprocess?
13.6 Describetheprocessofchemicalprecipitationforremovalofphos-phorus.Whyare the chemical requirementshigher than stoichio-metricrequirements?
13.7 What chemicals can be used to enhance biological phosphorusremoval?Giveanexampleofaprocessusedforbiologicalphospho-rusremoval.
13.8 Whyisfiltrationusedinwastewatertreatment?Listtheadvantagesofusingdual-mediaormultimediafilters.
13.9 What ismembrane fouling?Why is it of concernandhowcan itbecontrolled?Whataretheadvantagesanddisadvantagesofusingnanomaterialsonmembranes?
13.10 Amunicipalwastewaterwithatotaldissolvedsolids(TDS)concen-trationof3000g/m3istobetreatedusingmembranefiltration.Forregulatoryrequirement,theproductwater istohaveaTDSofnomorethan200g/m3.Estimatetherejectionrateandtheconcentra-tionoftheconcentratestream.Assume90%ofthewaterisrecov-eredbythesystem.
13.11 Apilotmembranefiltrationplantissetuptodeterminetheoperationalparametersofanoveltypeofmembrane.Theflowrateofpurewaterthrougha20cm2membrane is0.5mL/min. If the transmembranepressureis2500kPa,calculatethemembraneresistancecoefficient.
REFERENCES
Aspegren,H.,Nyberg,U.,Andersson,B.,Gotthardsson, S., and Jansen, J. (1998)“PostDenitrificationinaMovingBedBiofilmReactorProcess.”Water Science and Technology,vol.38,no.1,pp.31–38
AWWA(2005)Microfiltration and Ultrafiltration Membranes for Drinking Water.AWWAManualM53,AmericanWaterWorksAssociation,Denver,CO.
Bae, T., and Tak, T. (2005) “Preparation of Tio2 Self-Assembled PolymericNanocomposite Membranes and Examination of Their Fouling MitigationEffectsinaMembraneBioreactorSystem.”Journal of Membrane Science,vol.266,no.1–2,pp.1–5.
Barker,P.S.,andDold,P.L.(1997)“GeneralModelforBiologicalNutrientRemovalin Activated Sludge Systems: Model Presentation.” Water Environment Research,vol.69,no.5,pp.969–984.
Barnard,J.(1973)“BiologicalDenitrification.”Water Pollution Control(G.B.),vol.72,no.6,pp.705–720.
Barnard,J.(1974)“CutPandNwithoutChemicals.”Water and Wastes Engineering,vol.11,pp.41–44.
Barnard,J.(1975)“BiologicalNutrientRemovalwithouttheAdditionofChemicals.”Water Research,vol.9,pp.485–490.
Advanced treatment processes 319
Ciudad,G.,Robilar,O.,Muñoz,P.,Ruiz,G.,Chamy,R.,Vergara,C.,andJeison,D.(2005)“PartialNitrificationofHighAmmoniaConcentrationWastewaterasaPartofaShortcutBiologicalNitrogenRemovalProcess.”Process Biochemistry, vol. 40,pp.1715–1719.
Cleasby, J.L., andLogsdon,G. S. (1999)“GranularBedandPrecoatFiltration.”In Water Quality and Treatment. Fifth edition, edited by R. D. Letterman.AmericanWaterWorksAssociation,McGraw-Hill,NewYork,pp.8.1–8.99.
Davis,M.(2011)Water and Wastewater Engineering: Design Principles and Practice.McGraw-Hill,Inc.,NewYork.
Dold, P.,Takacs, I.,Mokhayeri,Y.,Nichols,A.,Hinojosa, J.,Riffat,R.,Bott,C.,Bailey, W., and Murthy, S. (2008) “Denitrification with Carbon Addition:KineticConsiderations.”Water Environment Research, vol.80,no.5,417–427.
EPA(1977)Process Design Manual for Nitrogen Control.UnitedStatesEnvironmentalProtectionAgency,TechnologyTransferOffice,Washington,D.C.
Grady, C. P. L. Jr., Daigger, G.T., and Lim, H. C. (1999) Biological Wastewater Treatment.Secondedition.MarcelDekker,Inc.,NewYork.
Gut,L. (2006)Assessment of a Partial Nitritation/Annamox System for Nitrogen Removal.LicentiateThesis,SilesianUniversityofTechnology,KTH,Sweden,ISBN:91-7178-167-6.
Hellinga,C., Schellen,A.A. J.C.,Mulder, J.W., vanLoosdrecht,M.C.M., andHeijnen, J. J. (1998) “The SHARON Process: An Innovative Method forNitrogen Removal from Ammonium-Rich Wastewater.” Water Science and Technology,vol.37,no.9,pp.135–142.
Hinojosa,J.(2008)A Study of Denitrification Kinetics Using Methanol and Glycerol as External Carbon Sources.Master’sThesis,GeorgeWashingtonUniversity,Washington,D.C.
Hinojosa, J., Riffat, R., Fink, S., Murthy, S., Selock, K., Bott, C., Wimmer, R.,Dold,P.,andTakacs,I.(2008)Estimating the Kinetics and Stoichiometry of Heterotrophic Denitrifying Bacteria with Glycerol as an External Carbon Source. Proceedings of 81st Annual Conference of Water EnvironmentFederation,WEFTEC’08,Chicago,IL.
Hippen,A.,Rosenwinkel,K.H.,Baumgarten,G.,andSeyfried,C.F.(1997)“AerobicDeammonification: A New Experience in the Treatment of Wastewaters.”Water Science and Technology,vol.35,no.10,pp.111–120.
Jetten,M.S.M.,Wagner,M.,Fuerst,J.,vanLoosdrecht,M.C.M.,Kuenen,G.,andStrous,M.(2001)“MicrobiologyandApplicationofAnaerobicAmmoniumOxidation(‘Anammox’)Process.”Current Opinion in Biotechnology,vol.12,pp.283–288.
Kim, J., andvanderBruggen,B. (2010)“TheUseofNanoparticles inPolymericandCeramicMembraneStructures:ReviewofManufacturingProceduresandPerformance Improvement for Water Treatment.” Environmental Pollution, vol.158,no.7,pp.2335–2349.
Lu, Y., Yu, S., and Meng, L. (2009) “Preparation of Poly(Vinylidene Fluoride)UltrafiltrationMembraneModifiedbyNano-SizedAluminaandItsAntifoulingPerformance.”Harbin Gongye Daxue Xuebao/Journal of Harbin Institute of Technology, vol.41,no.10,pp.64–69.
320 Fundamentals of wastewater treatment and engineering
McCarty, P. L., Beck, L., and Amant, P. S. (1969)“Biological Denitrification ofWastewaters by Addition of Organic Materials.” Proceedings of the 24th Industrial Waste Conference,PurdueUniversity,Indiana.pp.1271–1285.
Metcalf and Eddy, Inc. (2003) Wastewater Engineering: Treatment and Reuse.Fourthedition.McGraw-Hill,Inc.,NewYork.
Mokhayeri,Y.,Riffat,R.,Murthy, S.,Bailey,W. ,Takacs, I., andBott,C. (2009)“BalancingYield,KineticsandCostforThreeExternalCarbonSourcesUsedforSuspendedGrowthPostDenitrification.”Water, Science and Technology,vol.60,no.10,pp.2485–2491.
Mokhayeri,Y.,Riffat,R.,Takacs,I.,Dold,P.,Bott,C.,Hinojosa,J.,Bailey,W.,andMurthy,S.(2008)“CharacterizingDenitrificationKineticsatColdTemperatureUsingVariousCarbonSourcesinLab-ScaleSequencingBatchReactors.”Water Science and Technology,vol.58,no.1,pp.233–238.
Mokhayeri, Y., Murthy, S., Riffat, R., Bott, C., Dold, P., and Takacs, I. (2007)“DenitrificationKineticsUsingExternalCarbonSources:Methanol,EthanolandAcetate.”Proceedings of 80th Annual Conference of Water Environment Federation,WEFTEC’07,SanDiego,CA.
Mokhayeri,Y.,Nichols,A.,Murthy, S.,Riffat,R.,Dold,P. andTakacs, I. (2006)“ExaminingtheInfluenceofSubstratesandTemperatureonMaximumSpecificGrowthRateOfDenitrifiers.”Water Science and Technology,vol.54,no.8,pp.155–162.
Mulder,M.W., vanLoosdrecht,M.C.M.,Hellinga,C., andKempen,R. (2001)“Full-ScaleApplicationoftheSHARONProcessforTreatmentofRejectionWaterofDigestedSludgeDewatering.”Water Science and Technology, vol.43,no.11,pp.127–134.
Mulder, A., van der Graaf, A. A., Robertson, L. A., and Kuenen, J. G. (1995)“AnaerobicAmmoniumOxidationDiscoveredinaDenitrifyingFluidizedBedReactor.”FEMS Microbiology and Ecology,vol.16,no.3,pp.177–184.
Murthy,S.(2011)Personalcommunication.MWH (2005) Water Treatment: Principles and Design, John Wiley & Sons,
Hoboken,NJ,pp.882–894.Nichols,A.,Hinojosa, J.,Riffat,R.,Dold, P.,Takacs, I.,Bott,C.,Bailey,W., and
Murthy, S. (2007) “Maximum Methanol Utilizer Growth Rate: Impact ofTemperatureonDenitrification.”Proceedings of 80th Annual Conference of Water Environment Federation,WEFTEC’07,SanDiego,CA.
Ødegaard, H. (2006) “Innovations in Wastewater Treatment: The Moving BedBiofilmProcess.”Water Science and Technology,vol.53,no.9,pp.17–33.
Peavy,H.S.,Rowe,D.R.,andTchobanoglous,G.(1985)Environmental Engineering,McGraw-Hill,Inc.,NewYork.
Peric,M.,Shrestha,A.,Riffat,R.,Stinson,B.andMurthy,S.(2010)“ObservationofSelfRegulationofBiofilmThicknessinDenitrifyingMBBR.”Proceedings of the Annual Conference and Exhibition of Water Environment Federation,WEFTEC,NewOrleans.
Randall,C.W.,Barnard, J.L., andStensel,H.D. (1992)“DesignandRetrofitofWastewaterTreatmentPlantsforBiologicalNutrientRemoval.”Water Quality Management Library,vol.5,TechnomicPublishingCo.,Lancaster,PA.
Advanced treatment processes 321
Ruiz, G., Jeison, D., and Chamy, R. (2003) “Nitrification with High NitriteAccumulation for the Treatment of Wastewater with High AmmoniaConcentration.”Water Research, vol.37.no.6,pp.1371–1377.
Rusten,B.,Hem,L.J.,andØdegaard,H.(1995)“NitrogenRemovalfromDiluteWastewater in Cold Climate Using Moving-Bed Biofilm Reactors.” Water Environment Research,vol.67,no.1,pp.65–74.
Shrestha,A.,Riffat,R.,Bott,C.,Takacs,I.,Stinson,B.,Peric,M.,Neupane,D.,andMurthy, S. (2009)“Process Consideration toAchieve Nitrogen Removal inaMovingBedBiofilmReactor.”Proceedings of 82nd Annual Conference of Water Environment Federation,WEFTEC’09,Orlando,FL.
Stensel, H. D., and Horne, G. (2000)“Evaluation of Denitrification Kinetics atWastewater Treatment Facilities.” Research Symposium Proceedings, 73rd Annual Water Environment Federation Conference,Anaheim,CA.
Stensel,H.D.,Loehr,R.C.,Lawrence,A.W.(1973)“BiologicalKineticsofSuspended-GrowthDenitrification.”Journal of Water Pollution Control Federation,vol.45,pp.249.
Su,Y.,Huang,C.,Pan,J.R.,Hsieh,W.,andChu,M.(2011)“FoulingMitigationbyTiO2CompositeMembraneinMembraneBioreactors.”Journal of Environmental Engineering (ASCE),doi:10.1061/(ASCE)EE.1943-7870.0000419.
vanDongen,L.G.J.M.,Jetten,M.S.M.,andvanLoosdrecht,M.C.M.(2001)“TheSharon-Anammox Process for Treatment of Ammonium Rich Wastewater.”Water Science and Technology,vol.44.no.1,pp.153–160.
vanLoosdrecht,M.C.M,Hao,X.,Jetten,M.S.M.,andAbma,W.(2004)“UseofAnammoxinUrbanWastewaterTreatment.”Water Science and Technology: Water Supply,vol.4,no.1,pp.87–94.
WEF (2006) Membrane Systems for Wastewater Treatment. Water EnvironmentFederation,Alexandria,VA.
WEF (1998) Design of Municipal Wastewater Treatment Plants. Fourth edition.WaterEnvironmentFederation,ManualofPractice8,Alexandria,VA.
Zodrow, K., Brunet, L., Mahendra, S., Li, D., Zhang,A., Li, Q., andAlvarez, P.J. (2007) “Polysulfone Ultrafiltration Membranes Impregnated with SilverNanoparticles Show Improved Biofouling Resistance and Virus Removal.”Polymers for Advanced Technologies, vol.18,no.7,pp.562–568.

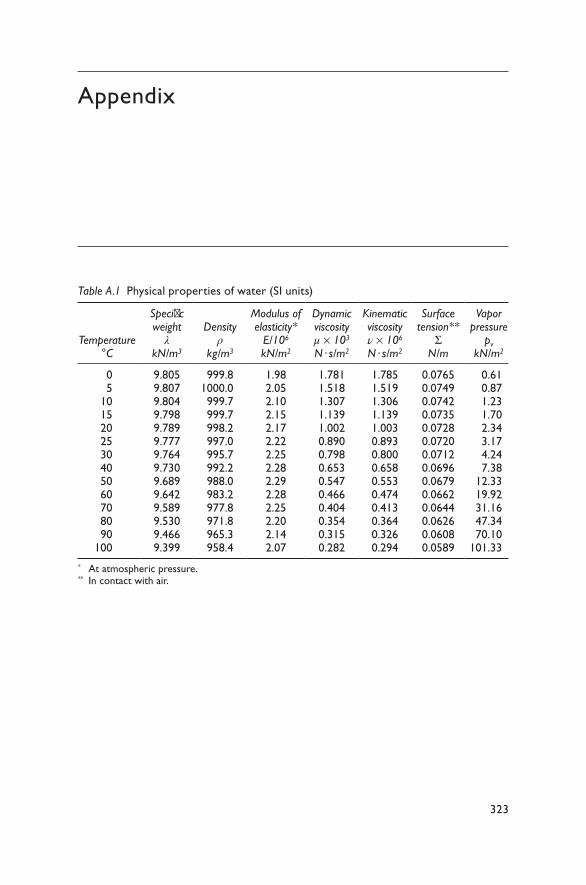
323
Appendix
Table A.1 Physical properties of water (SI units)
Temperature °C
Specific weight
λkN/m3
Density ρ
kg/m3
Modulus of elasticity*
E/106 kN/m2
Dynamic viscosity μ × 103 N · s/m2
Kinematic viscosity ν × 106 N · s/m2
Surface tension**
Σ N/m
Vapor pressure
pv kN/m2
05
1015202530405060708090
100
9.8059.8079.8049.7989.7899.7779.7649.7309.6899.6429.5899.5309.4669.399
999.81000.0999.7999.7998.2997.0995.7992.2988.0983.2977.8971.8965.3958.4
1.982.052.102.152.172.222.252.282.292.282.252.202.142.07
1.7811.5181.3071.1391.0020.8900.7980.6530.5470.4660.4040.3540.3150.282
1.7851.5191.3061.1391.0030.8930.8000.6580.5530.4740.4130.3640.3260.294
0.07650.07490.07420.07350.07280.07200.07120.06960.06790.06620.06440.06260.06080.0589
0.610.871.231.702.343.174.247.38
12.3319.9231.1647.3470.10
101.33* At atmospheric pressure.** In contact with air.
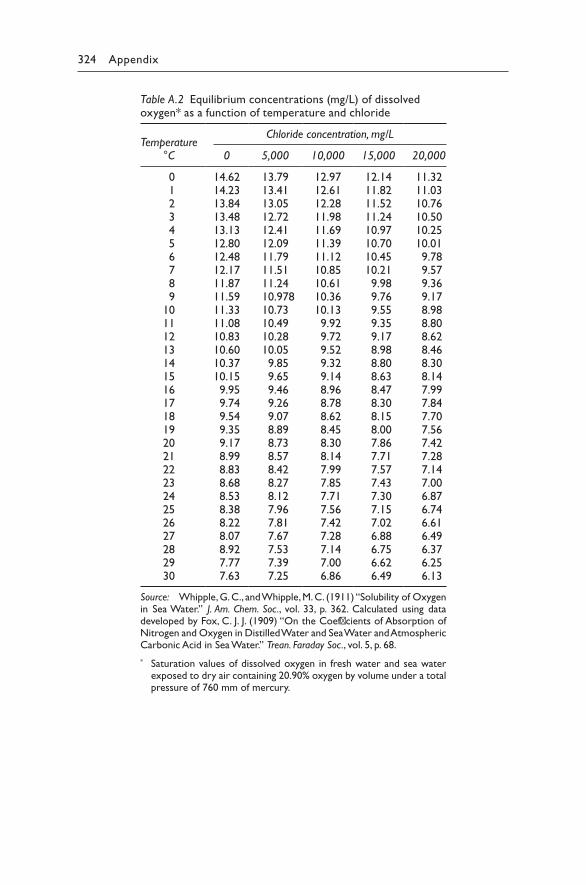
324 Appendix
Table A.2 Equilibrium concentrations (mg/L) of dissolved oxygen* as a function of temperature and chloride
Temperature °C
Chloride concentration, mg/L
0 5,000 10,000 15,000 20,000
0 1 2 3 4 5 6 7 8 9101112131415161718192021222324252627282930
14.6214.2313.8413.4813.1312.8012.4812.1711.8711.5911.3311.0810.8310.6010.3710.15 9.95 9.74 9.54 9.35 9.17 8.99 8.83 8.68 8.53 8.38 8.22 8.07 8.92 7.77 7.63
13.7913.4113.0512.7212.4112.0911.7911.5111.24
10.97810.7310.4910.2810.05 9.85 9.65 9.46 9.26 9.07 8.89 8.73 8.57 8.42 8.27 8.12 7.96 7.81 7.67 7.53 7.39 7.25
12.9712.6112.2811.9811.6911.3911.1210.8510.6110.3610.13 9.92 9.72 9.52 9.32 9.14 8.96 8.78 8.62 8.45 8.30 8.14 7.99 7.85 7.71 7.56 7.42 7.28 7.14 7.00 6.86
12.1411.8211.5211.2410.9710.7010.4510.21 9.98 9.76 9.55 9.35 9.17 8.98 8.80 8.63 8.47 8.30 8.15 8.00 7.86 7.71 7.57 7.43 7.30 7.15 7.02 6.88 6.75 6.62 6.49
11.3211.0310.7610.5010.2510.01 9.78 9.57 9.36 9.17 8.98 8.80 8.62 8.46 8.30 8.14 7.99 7.84 7.70 7.56 7.42 7.28 7.14 7.00 6.87 6.74 6.61 6.49 6.37 6.25 6.13
Source: Whipple, G. C., and Whipple, M. C. (1911) “Solubility of Oxygen in Sea Water.” J. Am. Chem. Soc., vol. 33, p. 362. Calculated using data developed by Fox, C. J. J. (1909) “On the Coefficients of Absorption of Nitrogen and Oxygen in Distilled Water and Sea Water and Atmospheric Carbonic Acid in Sea Water.” Trean. Faraday Soc., vol. 5, p. 68.* Saturation values of dissolved oxygen in fresh water and sea water
exposed to dry air containing 20.90% oxygen by volume under a total pressure of 760 mm of mercury.
ISBN: 978-0-415-66958-0
9 780415 669580
90000
Environmental Engineering
As the world’s population has increased, sources of clean water have decreased, shifting the focus toward pollution reduction and control. Disposal of wastes and wastewater without treatment is no longer an option. Fundamentals of Wastewater Treatment and Engineering introduces readers to the essential concepts of wastewater treatment, as well as the engineering design of unit processes for the sustainable treatment of municipal wastewater.
Filling the need for a textbook focused on wastewater, it first covers history, current practices, emerging concerns, and pertinent regulations and then examines the basic principles of reaction kinetics, reactor design, and environmental microbiology, along with natural purification processes. The text also details the design of unit processes for primary, secondary, and advanced treatment as well as solids processing and removal. Using detailed calculations, it discusses energy production from wastewater.
Comprehensive and accessible, the book addresses each design concept with the help of an underlying theory, followed by a mathematical model or formulation. Worked-out problems demonstrate how the mathematical formulations are applied in design. Throughout, the text incorporates recent advances in treatment technologies.
Based on a course taught by the author for the past 18 years, the book is designed for undergraduate and graduate students who have some knowledge of environmental chemistry and fluid mechanics. Readers will get a strong grounding in the principles and learn how to design the unit processes used in municipal wastewater treatment operations. Profes-sionals in the wastewater industry will also find this a handy reference.
Dr. Rumana Riffat is a professor in the Civil and Environmental Engineer-ing Department at George Washington University in Washington, D.C. Her research interests are in wastewater treatment, specifically anaerobic treatment of wastewater and biosolids, as well as nutrient removal.
FUN
DA
MEN
TALS O
F WA
STEWATER
TREATM
ENT A
ND
ENG
INEER
ING
RIFFAT FUNDAMENTALS OF
WASTEWATERTREATMENT ANDENGINEERING
RUMANA RIFFAT
w w w . s p o n p r e s s . c o m
Y117901
A S P O N P R E S S B O O K
Y117901 cvr mech.indd 1 7/24/12 10:20 AM