Embed Size (px)
Citation preview

FY2014/3 Second Quarter Results BriefingFY2014/3 Second Quarter Results BriefingFY2014/3 Second Quarter Results BriefingFY2014/3 Second Quarter Results Briefing
November 2013November 2013
S iti d 6268S iti d 6268
The forecast data presented herein reflects assumed results based on conditions that are subject to change.
Securities code: 6268Securities code: 6268
Nabtesco Corporation does not make representations as to, or warrant, in whole or in part, the attainment or realization of any of the forecasted results presented in this document.

AgendaAgenda
I.I. Consolidated Results for the First Half of FY2014/3Consolidated Results for the First Half of FY2014/3I. I. Consolidated Results for the First Half of FY2014/3Consolidated Results for the First Half of FY2014/3II.II. Forecast for FY2014/3 Consolidated ResultsForecast for FY2014/3 Consolidated ResultsIIIIII Transition of AnnualTransition of Annual ConsolidatedConsolidated ResultsResults andandIII.III. Transition of AnnualTransition of Annual Consolidated Consolidated ResultsResults and and
ForecastsForecasts by by Business Business SegmentSegmentIVIV C lid t dC lid t d R lt bR lt b G hiG hi S tS tIV.IV. ConsolidatedConsolidated Results by Results by Geographic Geographic SegmentSegmentV.V. Balance Sheet SummaryBalance Sheet SummaryVI.VI. CAPEX, R&D and DepreciationCAPEX, R&D and DepreciationVII.VII. Consolidated Cash FlowConsolidated Cash FlowVIII.VIII. LongLong--term Visionterm VisionIX.IX. TopicsTopics
2
IX.IX. TopicsTopics

Consolidated Results for the First Half of FY2014/3Consolidated Results for the First Half of FY2014/3(Comparison with the same period of the previous fiscal year)(Comparison with the same period of the previous fiscal year)
2014/3 H12014/3 H1(From April to September)
Both sales and OP increased in H1 YoY.Profits exceeded the initial forecast though the sales target was not achieved.
(JPY million)(JPY million) 2013/3 H1 2013/3 H1 resultresult
2014/3 H12014/3 H1(previous (previous forecast)forecast)
2014/3 H1 2014/3 H1 resultresult VariationVariation RatioRatio
SalesSales 90,66690,666 94,70094,700 93,45893,458 2,7912,791 3.1%3.1%
Remark: Extraordinary profit and loss
(Main contents)
Remark: Extraordinary profit and loss
(Main contents)
Operating profitOperating profit 7,5957,595 7,4007,400 7,9387,938 343343 4.5%4.5%NonNon--operating operating profit and lossprofit and loss 874874 -- 1,7341,734 859859 98.2%98.2%
Ordinary profitOrdinary profit 8 4708 470 8 6008 600 9 6739 673 1 2031 203 14 2%14 2% (Main contents)
Disappearance of negative goodwill
-1.0 billion yen
A loss on reivisions to
(Main contents)
Disappearance of negative goodwill
-1.0 billion yen
A loss on reivisions to
Ordinary profitOrdinary profit 8,4708,470 8,6008,600 9,6739,673 1,2031,203 14.2%14.2%Extraordinary Extraordinary profit and lossprofit and loss 973973 -- --896896 --1,8701,870 --192%192%
Profit before Profit before 9 4449 444 8 7768 776 667667 7%7% A loss on reivisions to the retirement benefit plan
-0.8 billion yen
A loss on reivisions to the retirement benefit plan
-0.8 billion yen
taxestaxes 9,4449,444 -- 8,7768,776 --667667 --7%7%
Net profitNet profit 6,5136,513 4,6004,600 5,0375,037 --1,4751,475 --22.7%22.7%Net profit per Net profit per share (yen)share (yen) 51.3351.33 36.2536.25 39.5239.52 --11.8111.81share (yen)share (yen)
Dividend per Dividend per share (yen)share (yen) 1818 1818 1818 00
3*Three-month time lag should be considered for all overseas subsidiaries of Nabtesco.
(Their accounting period is from January to December.)*Three-month time lag should be considered for all overseas subsidiaries of Nabtesco.
(Their accounting period is from January to December.)
Consolidated Profit & Loss for 2014/3 H1 Consolidated Profit & Loss for 2014/3 H1 (Analysis of Changes in Operating Profit)(Analysis of Changes in Operating Profit)
Increase in costdue to the
Productivity improvement etc Decrease
Increase in SG&A
(JPY billion)(JPY billion)
7 6 7.90.9 0.7 0.2
0.2
10 Cost reduction
due to the depreciation of yen
(within Japan)
improvement, etc
Decrease of sales *
Decrease in D&A
in SG&Aexpenses,
etc
7.6-0.7 -0.8 -0.2
5FOREX effect **13/3 H1(result) US$1=¥79.78 RMB1=¥12.65 EUR1=¥103.76 CHF1=¥86.2314/3 H1(result) US$1= ¥95 90 RMB1=¥15 44 EUR1=¥125 79 CHF1=¥102 2914/3 H1(result) US$1= ¥95.90 RMB1=¥15.44 EUR1=¥125.79 CHF1=¥102.29
*Fluctuations in operating profit owing to the increase or decrease of sales are based on the calculation without FOREX effect.
0 2013/3 H1result
2014/3 H1result
4
FOREX effect.
**FOREX sensitivity in O. P. (US$):JPY 44 million, (RMB): JPY 38 million, (EUR): minimal, (CHF): minimal
(This represents the effect to be expected on operating profit if the exchange rate fluctuates by one yen.)
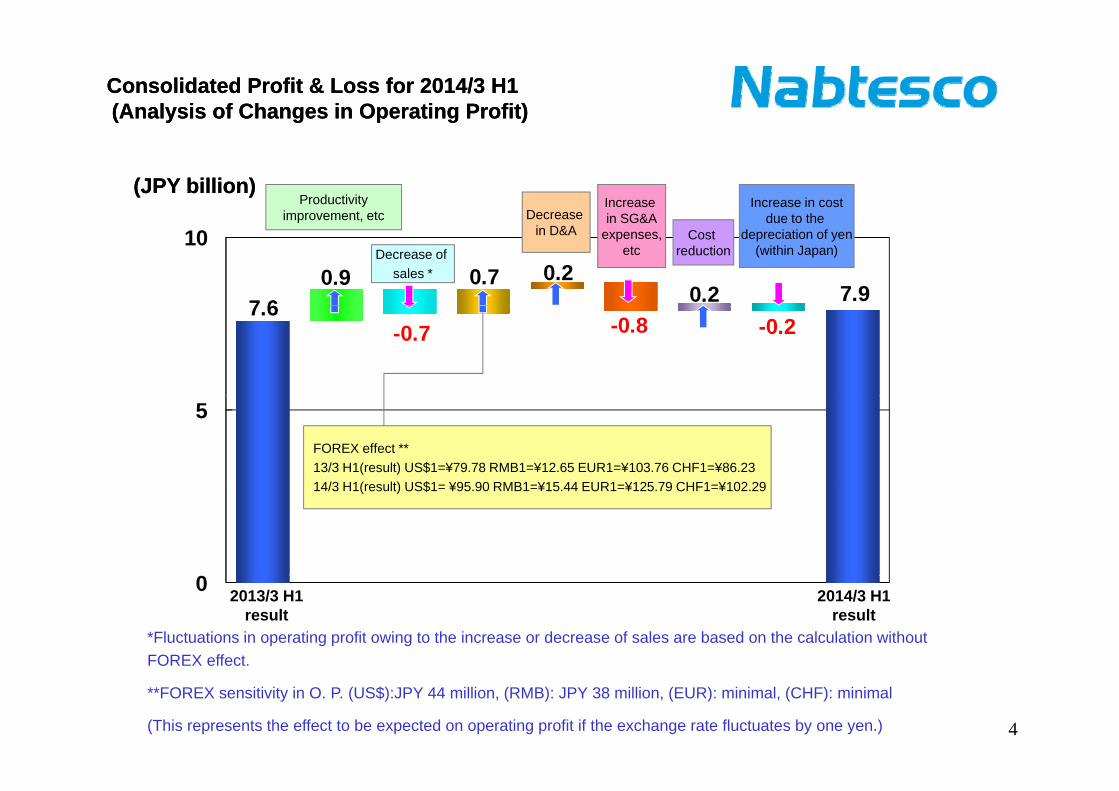
Forecast for FY2014/3 Consolidated ResultsForecast for FY2014/3 Consolidated Results・・The whole year forecast has been revised down in consideration of the latest business environment.The whole year forecast has been revised down in consideration of the latest business environment.
2013/32013/3 2014/32014/3
yy・・There is no revision to the initial forecast for dividend.There is no revision to the initial forecast for dividend.
(JPY million)(JPY million) H1 H1 resultresult
H2H2resultresult
FullFull--year year resultresult
FullFull--yearyear(previous (previous forecast)forecast)
H1 H1 resultresult
H2 H2 forecastforecast
FullFull--year year forecastforecast
SalesSales 90,66690,666 88,87688,876 179,543179,543 201,000201,000 93,45893,458 105,442105,442 198,900198,900(year(year--onon--year)year) ((--7.2%7.2%)) ((--11.9%11.9%)) ((--9.6%9.6%)) (+12.0%)(+12.0%) (+3.1%)(+3.1%) (+18.6%)(+18.6%) (+10.8%)(+10.8%)
Operating profitOperating profit(year(year--onon--year)year)
7,5957,595((--37.9%37.9%))
7,4187,418((--30.2%30.2%))
15,01315,013((--34.3%34.3%))
22,00022,000(+46.5%)(+46.5%)
7,9387,938(+4.5%)(+4.5%)
10,56210,562(+42.4%)(+42.4%)
18,50018,500(+23.2%)(+23.2%)
O ti fitO ti fitOperating profit Operating profit marginmargin 8.4%8.4% 8.3%8.3% 8.4%8.4% 10.9%10.9% 8.5%8.5% 10.0%10.0% 9.3%9.3%
Ordinary profitOrdinary profit(year(year--onon--year)year)
8,4708,470((--35.8%35.8%))
9,4199,419((--17.8%17.8%))
17,89017,890((--27.4%27.4%))
25,10025,100(+40.3%)(+40.3%)
9,6739,673(+14.2%)(+14.2%)
12,42712,427(+31.9%)(+31.9%)
22,10022,100(+23.5%)(+23.5%)
Net profitNet profit(year(year--onon--year)year)
6,5136,513((--22.0%22.0%))
6,7566,756(+5.5%)(+5.5%)
13,26913,269((--10.1%10.1%))
15,90015,900(+19.8%)(+19.8%)
5,0375,037((--22.7%22.7%))
8,8638,863(+31.3%)(+31.3%)
13,90013,900(+4.7%)(+4.7%)
ROA 6.5%6.5% 6.4%FOREX effect
ROE 12.5%12.5% 12.3%
Dividend per Dividend per 1818 1616 3434 3838(forecast)(forecast) 1818 2020(forecast)(forecast) 3838(forecast)(forecast)
14/3 1H (premise)US$1=¥90 RMB1=¥14.30 EUR1=¥118 CHF1=¥98
5
share(yen)share(yen) 1818 1616 3434 3838(forecast)(forecast) 1818 2020(forecast)(forecast) 3838(forecast)(forecast)
Dividend payout Dividend payout ratioratio 32.5%32.5% 30.3%30.3% 34.9%34.9%
(forecast)(forecast)

Profit & Loss Forecast for FY2014/3 Profit & Loss Forecast for FY2014/3 (Analysis of Changes in Operating Profit)(Analysis of Changes in Operating Profit)( y g p g )( y g p g )
30(JPY billion)(JPY billion)
Remark:Increase in R&D expensesIncrease in SG&A expenses
for further growth (headquarter’s training cost and increase in overseas subsidiaries’ SG&A)
2 1 0 2
30
Productivity i t t *
Increase of sales ** Cost
reduction
Increase in costdue to the
depreciation of yen(within Japan)
Decrease in D&A
Increase in SG&A
expenses, etc
1518.5
1.52.6 2.1 0.2
-30.6
-0.520
improvement, etc *
10FOREX ff t ***
0
FOREX effect ***13/3 full-year (result) US$1=¥80.12 RMB1=¥12.70 EUR1=¥103.46 CHF1=¥85.9014/3 H2 (premise) US$1= ¥97 RMB1=¥15.60 EUR1=¥127 CHF1=¥104
* Including decrease in quality-related cost +0.3 billion yen.** Fluctuations in operating profit owing to the increase or decrease of sales are based on the calculation without FOREX effect
2013/3result
2014/3forecast
6
FOREX effect.
*** FOREX sensitivity in O. P. (US$):JPY 111 million, (RMB): JPY 36 million, (EUR): minimal, (CHF): minimal
(This represents the effect to be expected on operating profit if the exchange rate fluctuates by one yen.)
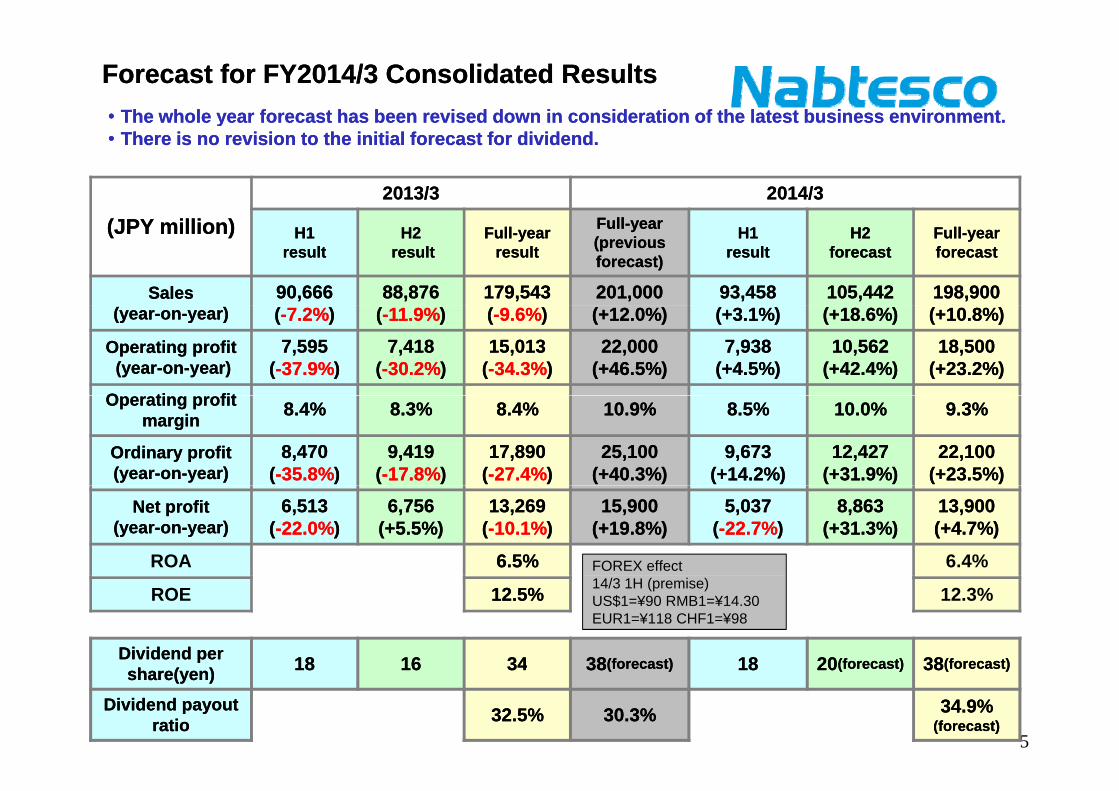
Transition of Consolidated Annual Results and Forecasts by Business Segment
(JPY illi )(JPY illi )
198,900179,543
198,527
169 303174 254200,000
250,000
SalesSales
(JPY million)(JPY million)
48,98146,765 48,182
48,28944,262
49,800
32,91228,026
15,278
32,438
44,19941,578
43,300,169,303
126,249
158,170174,254
100 000
150,000
35 725 31 987 29 47,956 53,400
56,634 51,390 41,49259,106
64,240 45,746 52,400
,41,888
41 798
50,000
100,000
PrecisionPrecisionTransportTransportAircraft & HydraulicAircraft & Hydraulic
35,725 31,987 27,589 29,575 47,95641,7980
Operating Profit & Net ProfitOperating Profit & Net Profit
(JPY million)(JPY million)
IndustrialIndustrial
Operating Profit & Net ProfitOperating Profit & Net Profit
Operating Operating ProfitProfit
PrecisionPrecisionTransportTransport
Net ProfitNet Profit
7
TransportTransportAircraft & HydraulicAircraft & HydraulicIndustrialIndustrial

Precision EquipmentPrecision Equipment(JPY billion)Sales
Rapid prototyping machinesPrecision Reduction Gears
Others
(JPY billion)Sales
39.439.0
Vacuum equipment
1 0 1 1 2 1 1 7 2 5 4.3
19.3 20.1 17.821.2
1.0 1.1 2.1 1.7 2.5
H1result
H2result
Full-yearresult
H1result
H2forecast
Full-yearforecast
2013/3 2014/3
※Due to the establishment of the New Energy Business Development Division in April 2013
Drive units for wind turbines
Precision reduction gears
Main Products and Customers
※Due to the establishment of the New Energy Business Development Division in April 2013,the sales of drive units for wind turbine generators were transferred from the Aircraft & Hydraulic Segment to the Precision Equipment Segment from 2014/3.
Solar tracking equipment・Precision reduction gearsIndustrial Robots: Fanuc, Yaskawa Electric,
KUKA Roboter (Germany), ABB Robotics (Sweden) Machine Tools: Yamazaki Mazak, Okuma, DMG Mori Seiki
8
・New energy businessSolar Thermal Power Tower Plant: Cobra Thermosolar Plant (Spain)Drive Units for Wind Turbines: Mitsubishi Heavy Industries, etc.

Precision EquipmentPrecision Equipment
Results and forecast
2013/32013/3 2014/3
(JPY million)(JPY million)
2013/32013/3 2014/3
H1H1resultresult
H2H2resultresult
FullFull--yearyearresultresult
FullFull--yearyear(previous (previous forecast)forecast)
H1H1resultresult
H2 H2 forecastforecast
FullFull--year year forecastforecast
SalesSales(year(year--onon--year)year)
20,31420,314((--4.6%4.6%))
21,26321,263((--7.2%7.2%))
41,57841,578((--5.9%5.9%))
44,60044,600(+7.3%)(+7.3%)
19,51319,513((--3.9%3.9%))
23,78723,787(+11.9%)(+11.9%)
43,30043,300(+4.1%)(+4.1%)
Operating profitOperating profit(( ))
2,1462,146(( 45 6%45 6%))
3,2083,208(( 21 1%21 1%))
5,3545,354(( 33 2%33 2%))
7,1007,100( 32 6%)( 32 6%)
2,6652,665( 24 1%)( 24 1%)
3,6353,635( 13 3%)( 13 3%)
6,3006,300( 17 7%)( 17 7%)(year(year--onon--year)year) ((--45.6%45.6%)) ((--21.1%21.1%)) ((--33.2%33.2%)) (+32.6%)(+32.6%) (+24.1%)(+24.1%) (+13.3%)(+13.3%) (+17.7%)(+17.7%)
Operating profit Operating profit marginmargin 10.6%10.6% 15.1%15.1% 12.9%12.9% 15.9%15.9% 13.7%13.7% 15.3%15.3% 14.6%14.6%
Notes:
Precision reduction gears: Sales decreased year on year in H1 due to a drop in demand from industrial robots manufacturers. The industrial robot demand is expected to recover in H2 while its growth is weaker than the initial expectation. Expected sales of solar tracking equipment to be postponed to the next fiscal year due to delay of the targeted project.
O.P. of the segment:Profit in H1 increased owing to a reduction in fixed costs and an improvement in productivity, leading to the achievement of the initial target.Th h l fit i t d t b b l th i iti l f t b f th k d d f i d t i l b t ll
9
The whole year profit is expected to be below the initial forecast because of the weaker demand for industrial robots as wellas increases in overseas purchase cost due to the depreciation of yen.
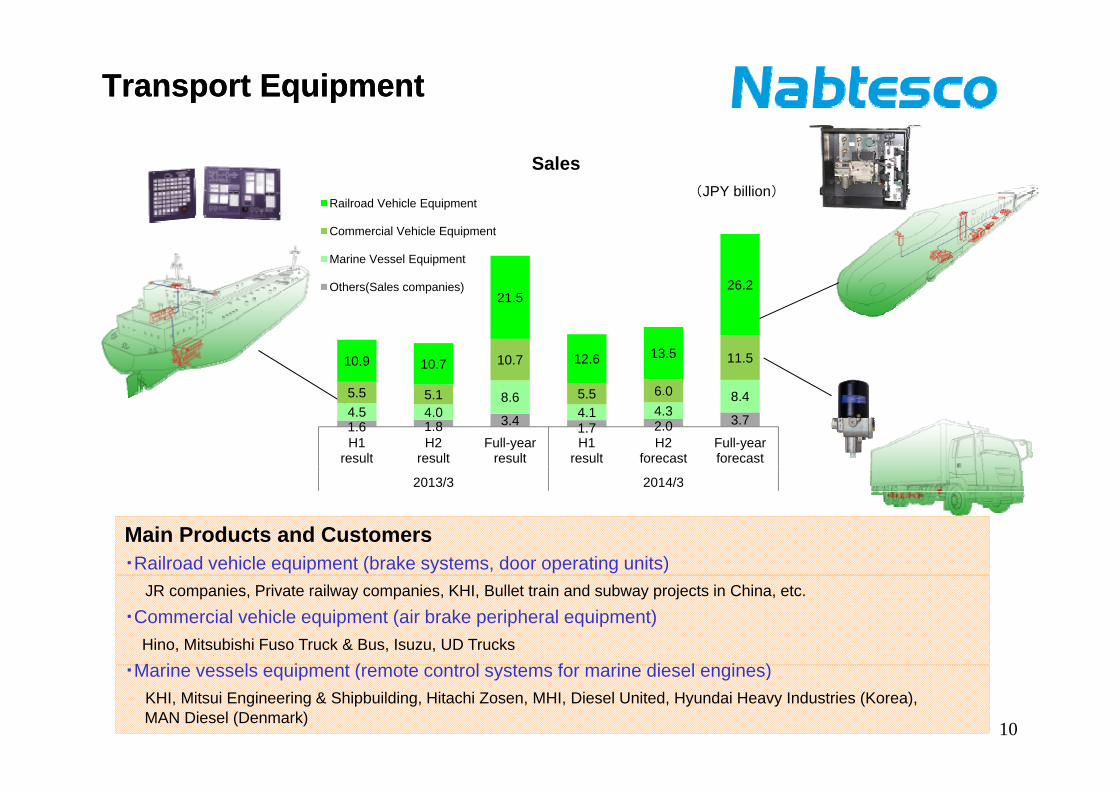
Transport EquipmentTransport Equipment
Sales
Railroad Vehicle Equipment(JPY billion)
21.5 26.2
Commercial Vehicle Equipment
Marine Vessel Equipment
Others(Sales companies)
8 6 8 45 5 5 1
10.7
5 5 6.0
11.5 10.9 10.7 12.6 13.5
1.6 1.8 3.4 1.7 2.0 3.7 4.5 4.0 8.6
4.1 4.3 8.4 5.5 5.1 5.5 6 0
H1result
H2result
Full-yearresult
H1result
H2forecast
Full-yearforecast
2013/3 2014/3
Main Products and Customers・Railroad vehicle equipment (brake systems, door operating units)
2013/3 2014/3
JR companies, Private railway companies, KHI, Bullet train and subway projects in China, etc.
・Commercial vehicle equipment (air brake peripheral equipment)Hino, Mitsubishi Fuso Truck & Bus, Isuzu, UD Trucks
M i l i t ( t t l t f i di l i )
10
・Marine vessels equipment (remote control systems for marine diesel engines)KHI, Mitsui Engineering & Shipbuilding, Hitachi Zosen, MHI, Diesel United, Hyundai Heavy Industries (Korea), MAN Diesel (Denmark)

Transport EquipmentTransport EquipmentResults and forecast
(JPY million)(JPY million)
2013/32013/3 2014/3
H1H1 H2H2 F llF ll FullFull--yearyear H1H1 H2H2 F llF ll(JPY million)(JPY million) H1H1resultresult
H2H2resultresult
FullFull--yearyearresultresult
FullFull yearyear(previous (previous forecast)forecast)
H1H1resultresult
H2 H2 forecastforecast
FullFull--year year forecastforecast
SalesSales(year(year--onon--year)year)
22,56522,565((--3 9%3 9%))
21,69721,697((--12 5%12 5%))
44,26244,262((--8 3%8 3%))
48,70048,700(+10 0%)(+10 0%)
23,96023,960(+6 2%)(+6 2%)
25,84025,840(+19 1%)(+19 1%)
49,80049,800(+12 5%)(+12 5%)(year(year onon year)year) ((--3.9%3.9%)) ((--12.5%12.5%)) ((--8.3%8.3%)) (+10.0%)(+10.0%) (+6.2%)(+6.2%) (+19.1%)(+19.1%) (+12.5%)(+12.5%)
Operating profitOperating profit(year(year--onon--year)year)
2,4522,452((--21.8%21.8%))
1,7621,762((--39.9%39.9%))
4,2144,214((--30.6%30.6%))
5,3005,300(+25.8%)(+25.8%)
2,5812,581(+5.3%)(+5.3%)
2,6192,619(+48.6%)(+48.6%)
5,2005,200(+23.4%)(+23.4%)
Operating profit Operating profit 10 9%10 9% 8 1%8 1% 9 5%9 5% 10 9%10 9% 10 8%10 8% 10 1%10 1% 10 4%10 4%
Notes:
Railroad vehicle equipment: Sales increased year on year in H1 as a result of an increase in the Japanese domestic market.
p g pp g pmarginmargin 10.9%10.9% 8.1%8.1% 9.5%9.5% 10.9%10.9% 10.8%10.8% 10.1%10.1% 10.4%10.4%
Compared with the last fiscal year and the initial forecast, an increase in sales is expected for FY2014/3 due to sales growth in both Japan and China.
Commercial vehicle equipment: Sales decreased year on year in H1 due to the decrease in demand in the Japanese after-service market while demand for commercial vehicles in emerging countries was robust. Whole year sales are expected to be below the FY 2013/3 level and the initial forecast.2013/3 level and the initial forecast.
Marine vessels equipment: Due to stagnancy in the market, sales decreased in H1 and are expected to decrease for the whole year. However, business environment is turning into a positive direction owing to weaker yen. The whole year sales are expected to be beyond the initial forecast and the market demand is expected to hit the bottom within FY2014/3.
O.P. of the segment: Profit increased year on year in H1 due to an increase in sales of railroad vehicle equipment, which has covered
11
g y y q p ,the declining profit from the sales of commercial vehicle equipment and marine vessels equipment. FY2014/3 profit is expected to be increased YoY since the decrease of profit from the sales of both commercial vehicle and marine vessels will be covered by the increase of profit from the sales of railroad vehicle, though the profit will be below the initial forecast.
SalesSales
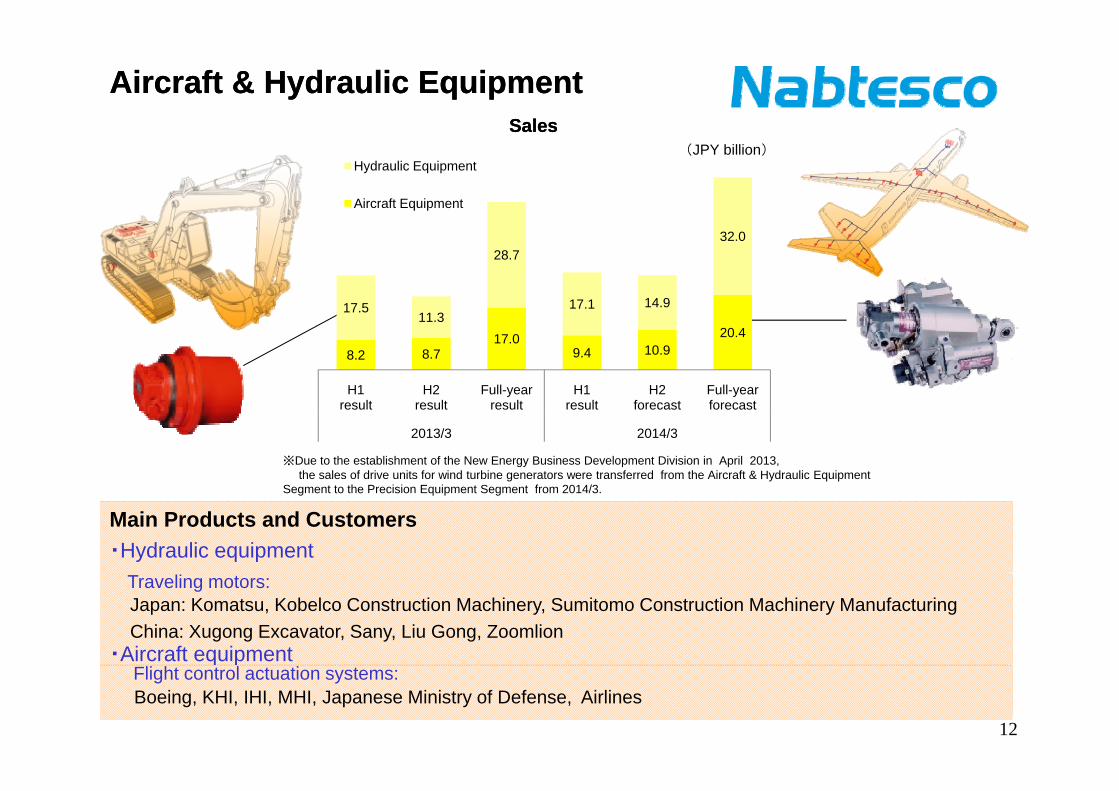
Aircraft & Hydraulic EquipmentAircraft & Hydraulic EquipmentSalesSales
Hydraulic Equipment
Aircraft Equipment
(JPY billion)
17 5
28.7
17 1 14 9
32.0
8.2 8.7 17.0
9.4 10.9 20.4
17.5 11.3
17.1 14.9
H1 H2 Full-year H1 H2 Full-year
※Due to the establishment of the New Energy Business Development Division in April 2013,the sales of drive units for wind turbine generators were transferred from the Aircraft & Hydraulic Equipment
S t t th P i i E i t S t f 2014/3
result resulty
result result forecasty
forecast
2013/3 2014/3
Main Products and Customers・Hydraulic equipment
T li t
Segment to the Precision Equipment Segment from 2014/3.
Traveling motors:Japan: Komatsu, Kobelco Construction Machinery, Sumitomo Construction Machinery ManufacturingChina: Xugong Excavator, Sany, Liu Gong, Zoomlion
・Aircraft equipment
12
q pFlight control actuation systems: Boeing, KHI, IHI, MHI, Japanese Ministry of Defense, Airlines
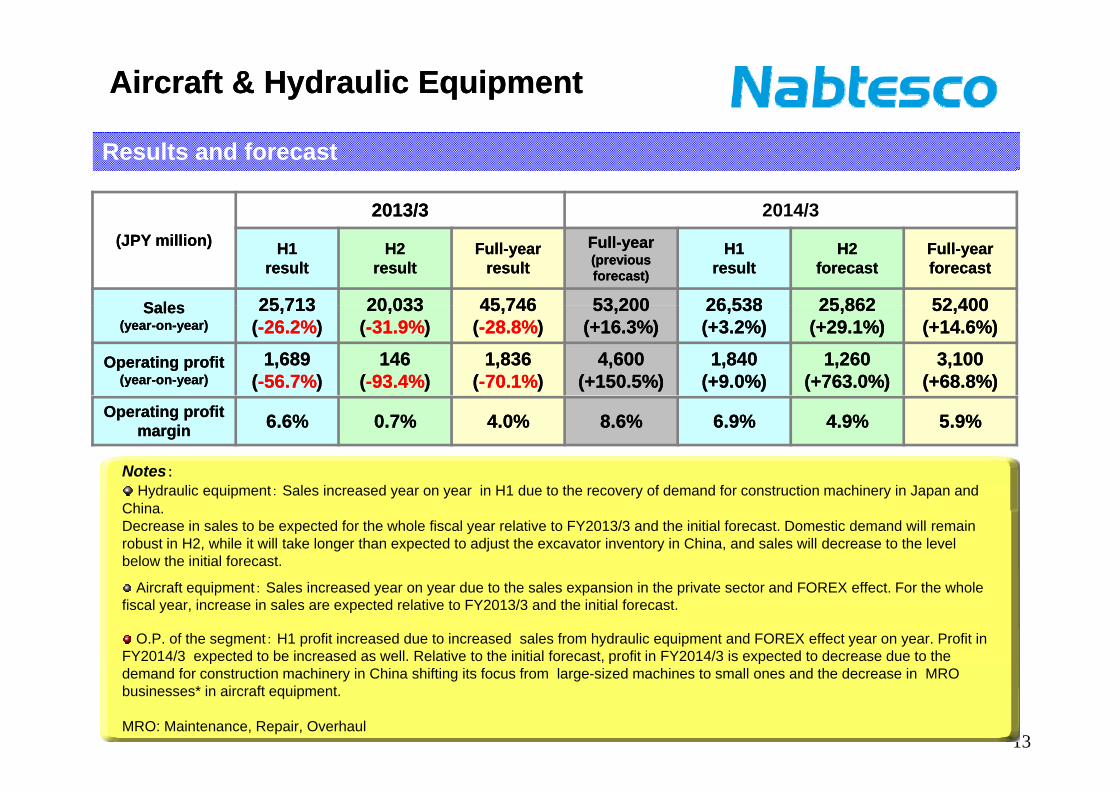
Aircraft & Hydraulic EquipmentAircraft & Hydraulic Equipment
Results and forecast
2013/32013/3 2014/3(JPY million)(JPY million)
2013/32013/3 2014/3
H1H1resultresult
H2H2resultresult
FullFull--yearyearresultresult
FullFull--yearyear(previous (previous forecast)forecast)
H1H1resultresult
H2H2forecastforecast
FullFull--yearyearforecastforecast
SalesSales 25 71325 713 20 03320 033 45 74645 746 53 20053 200 26 53826 538 25 86225 862 52 40052 400SalesSales(year(year--onon--year)year)
25,71325,713((--26.2%26.2%))
20,03320,033((--31.9%31.9%))
45,74645,746((--28.8%28.8%))
53,20053,200(+16.3%)(+16.3%)
26,53826,538(+3.2%)(+3.2%)
25,86225,862(+29.1%)(+29.1%)
52,40052,400(+14.6%)(+14.6%)
Operating profitOperating profit(year(year--onon--year)year)
1,6891,689((--56.7%56.7%))
146146((--93.4%93.4%))
1,8361,836((--70.1%70.1%))
4,6004,600(+150.5%)(+150.5%)
1,8401,840(+9.0%)(+9.0%)
1,2601,260(+763.0%)(+763.0%)
3,1003,100(+68.8%)(+68.8%)
Notes:H d li i t S l i d i H1 d t th f d d f t ti hi i J d
Operating profit Operating profit marginmargin 6.6%6.6% 0.7%0.7% 4.0%4.0% 8.6%8.6% 6.9%6.9% 4.9%4.9% 5.9%5.9%
Hydraulic equipment: Sales increased year on year in H1 due to the recovery of demand for construction machinery in Japan and China. Decrease in sales to be expected for the whole fiscal year relative to FY2013/3 and the initial forecast. Domestic demand will remain robust in H2, while it will take longer than expected to adjust the excavator inventory in China, and sales will decrease to the level below the initial forecast.
Aircraft equipment: Sales increased year on year due to the sales expansion in the private sector and FOREX effect. For the whole fiscal year, increase in sales are expected relative to FY2013/3 and the initial forecast.
O.P. of the segment: H1 profit increased due to increased sales from hydraulic equipment and FOREX effect year on year. Profit in FY2014/3 expected to be increased as well. Relative to the initial forecast, profit in FY2014/3 is expected to decrease due to the
13
demand for construction machinery in China shifting its focus from large-sized machines to small ones and the decrease in MRO businesses* in aircraft equipment.
MRO: Maintenance, Repair, Overhaul

Industrial EquipmentIndustrial Equipment
Special purpose machine toolsSalesSales
Automatic Doors(JPY billion)
36.0 42.2
Packaging Machines
Others
0 7 1 0 1 8 0 7 1 5 2 34.6 5.510.1
4.3 4.68.9
16.719.3 18.4
23.8
Packing machines
0.7 1.0 1.8 0.7 1.5 2.3H1
resultH2
resultFull-year
resultH1
resultH2
forecastFull-yearforecast
2013/3 2014/3
Main Products and Customers
・Automatic doorsAutomatic doors for buildings: Major general contractors, sash manufactures, hospitals, banks, public institutions, etc.
Platform doors: Subway projects in France, China etc
・Packaging machines (Toyo Jidoki Co., Ltd.)
14
Ajinomoto, Marudai Food, ARIAKE JAPAN, KENKO Mayonnaise, P&G, Kao, Lion, Mars (France), food companies in China, American Beverage Corporation (USA)

Industrial EquipmentIndustrial Equipment
Results and forecast
2013/32013/3 2014/3(JPY million)(JPY million)
2013/32013/3 2014/3
H1H1resultresult
H2H2resultresult
FullFull--yearyearresultresult
FullFull--yearyear(previous (previous forecast)forecast)
H1H1resultresult
H2H2forecastforecast
FullFull--yearyearforecastforecast
SalesSales 22 07322 073 25 88325 883 47 95647 956 54 50054 500 23 44523 445 29 95529 955 53 40053 400SalesSales(year(year--onon--year)year)
22,07322,073(+22.3%)(+22.3%)
25,88325,883(+9.0%)(+9.0%)
47,95647,956(+14.7%)(+14.7%)
54,50054,500(+13.6%)(+13.6%)
23,44523,445(+6.2%)(+6.2%)
29,95529,955(+15.7%)(+15.7%)
53,40053,400(+11.4%)(+11.4%)
Operating profitOperating profit(year(year--onon--year)year)
1,3061,306(+4.7%)(+4.7%)
2,3012,301(+64.6%)(+64.6%)
3,6083,608(+36.3%)(+36.3%)
5,0005,000(+38.6%)(+38.6%)
851851((--34.8%34.8%))
3,0493,049(+32.5%)(+32.5%)
3,9003,900(+8.1%)(+8.1%)
Notes:
Operating profit Operating profit marginmargin 5.9%5.9% 8.9%8.9% 7.5%7.5% 9.2%9.2% 3.6%3.6% 10.2%10.2% 7.3%7.3%
Automatic doors:Sales in H1 increased due to FOREX effect though Japan's domestic business remained flat. Sales for FY2014/3 are expected to increase but to be below the initial forecast due to weaker growth in Japan.
Packaging machines: Sales in H1 decreased due to a decrease in sales in the overseas market The whole year sales arePackaging machines: Sales in H1 decreased due to a decrease in sales in the overseas market. The whole year sales are expected to decrease due to the disappearance of the special demand from the sugar industry.Due to the decrease in H1 overseas sales, a decrease in sales is expected for the whole fiscal year relative to the initial plan.
O.P. of the segment:H1 profit decreased due to the diminishing orders for highly profitable projects in automatic doors and
15
O.P. of the segment:H1 profit decreased due to the diminishing orders for highly profitable projects in automatic doors and the decline in sales of packaging machines as well. The whole year sales are expected to increase owing to FOREX year on year. Relative to the initial forecast, a decrease in profit is expected because of changes in the product mix in the domestic automatic door business and an increase of goodwill affected by FOREX.

ConsolidatedConsolidated Results by Results by Geographic Geographic SegmentSegment
North AmericaNorth AmericaJPY 5 6JPY 5 6 billionbillion OthersOthers North AmericaNorth America OthersOthers
2014/32014/3 H1 resultH1 result2013/3 H1 result2013/3 H1 result
JPY 5.6JPY 5.6 billionbillion(6.2%)(6.2%)
OthersOthersJPY 0.1 billion JPY 0.1 billion
(0.2%)(0.2%)JPY 7.1 billionJPY 7.1 billion
(7.7%)(7.7%)
EuropeEurope
OthersOthersJPY 0.2 billionJPY 0.2 billion
(0.2%)(0.2%)
JapanJapanJPY 52.0 billionJPY 52.0 billion
Europe Europe JPYJPY 15.2billion15.2billion
(16.9%)(16.9%)
Other AsiaOther Asia JapanJapan
EuropeEuropeJPY 13.6 billionJPY 13.6 billion
(14.6%)(14.6%)
Other AsiaOther Asia
JPYJPY90 690 6
JPYJPY93 493 4(57.4%)(57.4%)JPY 6.6JPY 6.6 billionbillion
(7.3%)(7.3%)
ppJPY 53.2JPY 53.2 billionbillion
(57.0%)(57.0%)
Other AsiaOther AsiaJPY 6.2JPY 6.2 billionbillion
(6.6%)(6.6%)
90.690.6billionbillion
93.493.4billionbillion
ChinaChinaJPY10.8JPY10.8 billionbillion
(12.0%)(12.0%)
ChinaChinaJPY 12.9JPY 12.9 billionbillion
(13.9%)(13.9%)
Overseas Sales RatioOverseas Sales Ratio42 642 6%%
( )( ) ( )( )
Overseas Sales RatioOverseas Sales Ratio43 043 0%%42.642.6%%
Notes:
Sales to Europe decreased in H1 2014/3 due to the decrease in sales of precision reduction gears
Notes:
Sales to Europe decreased in H1 2014/3 due to the decrease in sales of precision reduction gears
43.043.0%%
Sales to Europe decreased in H1 2014/3 due to the decrease in sales of precision reduction gears,.
Overseas sales increased to JPY 93.4 billion due to the increase in sales to China for hydraulic equipment and the sales to North America for aircraft equipment.
Sales to Europe decreased in H1 2014/3 due to the decrease in sales of precision reduction gears,.
Overseas sales increased to JPY 93.4 billion due to the increase in sales to China for hydraulic equipment and the sales to North America for aircraft equipment.
16

Balance Sheet Summary
(JPY million)(JPY million) 2013/32013/3Full year Full year resultresult
2014/32014/3H1 H1 resultresult VariationVariation
AssetsAssets 203,056203,056 217,114217,114 14,058
((Cash and time depositsCash and time deposits)) 40,903 46,08446,084 5,180
((Accounts receivableAccounts receivable)) 45,13145,131 45,45445,454 322Receivable turnover
period (in days) 94 88 6
((InventoryInventory)) 20,52920,529 23,15023,150 2,620
Remark:
Inventory turnover period (in days) 55 58 3
((Fixed assetsFixed assets)) 54,47554,475 55,89655,896 1,420
Translation adjustment + 4.2 billion yen
LiabilitiesLiabilities 82,19882,198 87,08987,089 4,891
((InterestInterest--bearing debtbearing debt)) 26,38926,389 26,04126,041 -347
Net assetsNet assets 120 857120 857 130 025130 025 9 1679 167Net assetsNet assets 120,857120,857 130,025130,025 9,1679,167
(Stock acquisition right)(Stock acquisition right) 304304 236 -67
((Minority interestsMinority interests)) 6,5146,514 7,6587,658 1,143
17
(( yy )) ,, ,, ,
Equity capitalEquity capital 114,038114,038 122,129122,129 8,0908,090
※ ※ Equity ratio :Equity ratio : 56.2% 56.3%56.3%

CAPEX, R&D and DepreciationCAPEX, R&D and Depreciation
H1 result Full-year result & forecast
(JPY million)(JPY million) 2013/3 2013/3 H1 resultH1 result
2014/32014/3H1 resultH1 result
2013/3 Full2013/3 Full--year year resultresult
2014/3 Full2014/3 Full--yearyear(previous forecast)(previous forecast)
2014/3 Full2014/3 Full--yearyearforecastforecast
CAPEXCAPEX 5,8855,885 3,5573,557 10,19010,190 10,00010,000 8,7008,700
R&DR&D 2,7542,754 3,1113,111 5,5355,535 6,3006,300 6,8006,800
DepreciationDepreciation 3 8333 833 3 6403 640 7 9237 923 8 6008 600 7 8007 800DepreciationDepreciation 3,8333,833 3,6403,640 7,9237,923 8,6008,600 7,8007,800
18

IT I t tIT I t t
Breakdown in CAPEXBreakdown in CAPEXIT Investment
Renewal of the facilities of group companies
IT Investment
Renewal of the facilities of group companies
Precision14%
HQ10% Precision
16%
HQ9%
3,5573,557JPY millionJPY million
8,7008,700JPY millionJPY million
Transport22%
Industrial16%
Transport25%
Industrial20%
Renewal of machinery at the Tarui plant for hydraulic equipmentRenewal of machinery at the Tarui plant for hydraulic equipment
Rationalization investment in the Tsu plant for precision reduction gears
Rationalization investment in the Tsu plant for precision reduction gearsby segment Aircraft &
Hydraulic38%
Aircraft & Hydraulic
30%
Renewal of machinery at the Tarui plant for hydraulic equipmentRenewal of machinery at the Shanghai plant for hydraulic
equipmentRenewal of machinery at the Gifu plant for aircraft equipment
Renewal of machinery at the Tarui plant for hydraulic equipmentRenewal of machinery at the Shanghai plant for hydraulic
equipmentRenewal of machinery at the Gifu plant for aircraft equipment
New Products
New Products
3,5573,557JPY millionJPY million
8,7008,700JPY millionJPY million
9%Production
increase24%
Others31%
10% Production increase
12%
Others28%
by usageRenewal
&Rationalization
36%
Renewal&
Rationalization50%
2014/3 H1 result19
2014/3 forecast
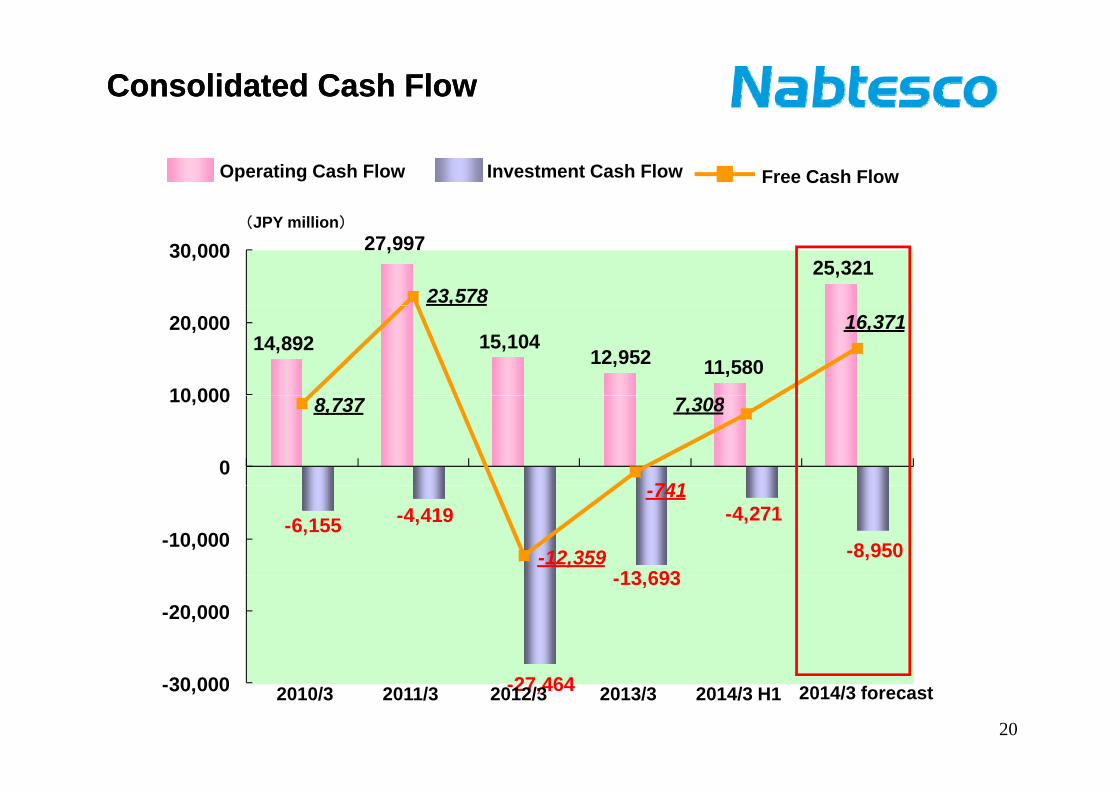
Consolidated Cash FlowConsolidated Cash Flow
( )
Free Cash FlowInvestment Cash FlowOperating Cash Flow
27,99725,321
23,578
30,000(JPY million)
14,892 15,10412,952 11,580
16,371
10 000
20,000
8,737
741
7,308
0
10,000
-6,155 -4,419
13 693
-4,271
-8,950-12,359
-741
-10,000
-13,693-20,000
-27,464-30,000
20
2014/3 H1 2014/3 forecast2010/3 2011/3 2012/3 2013/3
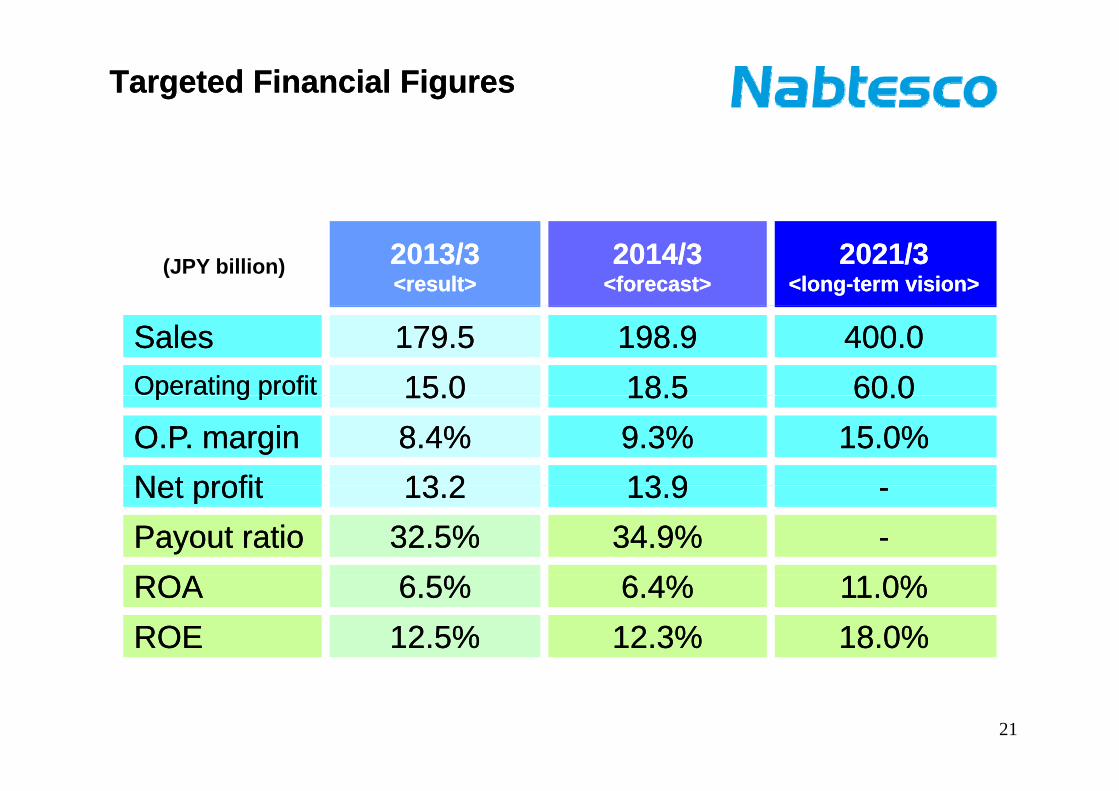
Targeted Financial FiguresTargeted Financial Figures
(JPY billion) 2013/32013/3<result><result>
2014/32014/3<forecast><forecast>
2021/32021/3<long<long--term vision>term vision>
SalesSales 179.5179.5 198.9198.9 400.0400.0Operating profitOperating profit 15.015.0 18.518.5 60.060.0p g pp g p 15.015.0 18.518.5 60.060.0O.P. marginO.P. margin 8.4%8.4% 9.3%9.3% 15.0%15.0%Net profitNet profit 13 213 2 13 913 9Net profitNet profit 13.213.2 13.913.9 --Payout ratioPayout ratio 32.5%32.5% 34.9%34.9% --ROAROA 6 %6 % 6 4%6 4% 11 0%11 0%ROAROA 6.5%6.5% 6.4%6.4% 11.0%11.0%ROEROE 12.5%12.5% 12.3%12.3% 18.0%18.0%
21

Long-term Vision
Organic growth + M&A Organic growth + M&A ⇒⇒ M&A + Organic growthM&A + Organic growth““MarketMarket acquisitionacquisition” is kept in mind.” is kept in mind.
Operation Profit Margin400 JPY billion
15.0% Accelerate M&A investment
Acquisition of market
Acquisition of technology
Acquisition of production capacity
Acquisition of market
Organic Growth
9.3%
Sales: 198 JPY billion
222014/3 2021/3

Topics(Network information)
April: Established a service operation base for commercial aircrafts in SingaporeEnhance after sales services for commercial aircrafts mainly for airliners in Southeast Asia
A il E t bli h d th N E B i D l t Di i i
(Network information)
April:Established the New Energy Business Development DivisionReinforce new energy business which has great potential for growth
April: Established a production base for marine vessels equipment in China Boost sales in the Chinese market
April: Determined to turn wholly owned marketing company in China for precision reduction gears to JV
f CProvide fine-tuned services and products to the FA market and industrial robots industry in China
July: Acquired Canadian Automatic Door Sales Company Porta Service Inc. as a consolidated subsidiaryReinforce the business in North America
August:Established a subsidiary for packing machines in North AmericaBoost sales and enhance service in the North American market
September:Established a sales company as a JV in Shanghai for hydraulic equipmentReinforce sales in the Chinese marketOctober: Established an office in L.A.October: Established an office in L.A. Expand the solar tracking equipment business
23

Topics(Orders and others)
May: Gained orders for Boeing 737 MAX Fly-by-Wire Spoiler ActuatorsLead to sustainable business including after-market
(Orders and others)
August: Manufactured the two millionth Nabco Automatic Door Result of 57 years hard work since our first door appeared in Japan in 1956
September:Won an order for automatic platform gates from Stockholm Metro in SwedenContribute to the improvement of the Nabtesco Group’s position in the global market
(Evaluation and prizes)(Evaluation and prizes)
September:Included in the global benchmarks for socially responsible investment (SRI)
-Dow Jones Sustainability Asia Pacific Index (First time)y ( )-FTSE4Good Index Series (Nine times in a row)
September:Won the 7th Kids Design Award for “Multipurpose Toilet Door”
24
Three years in a row after receiving the award for “Losca Door” and “ Intelligent eco Door System”

Moving it. Stopping it.