Embed Size (px)
Citation preview
Business Results for
the First Quarter of FY2014/3
August 2, 2013 (Fri.)
Nippon Meat Packers, Inc.
2
Copyright (C) 2013 Nippon Meat Packers,Inc.All rights reserved.Contents
Contents
I. Consolidated Business Results for FY2014/3 1Q (Apr.-Jun.)
II. Outlook for FY2014/3
III. Consolidated Financial Results for FY2014/3 1Q (Apr.-Jun.)
3
Copyright (C) 2013 Nippon Meat Packers,Inc.All rights reserved.
I. Consolidated Business Results for FY2014/3 1Q (Apr.-Jun.)
1. Business Results by Operating Segment Data: 1Q (Apr.–Jun.)
2. Operating Segment Data: Processed Foods Business Division
3. Operating Segment Data: Fresh Meats Business Division
4. Operating Segment Data: Affiliated Business Division
5. Business Results in Major Overseas Markets
6. External Customer Net Sales Results in Major Overseas
Geographical Areas
4
Copyright (C) 2013 Nippon Meat Packers,Inc.All rights reserved.
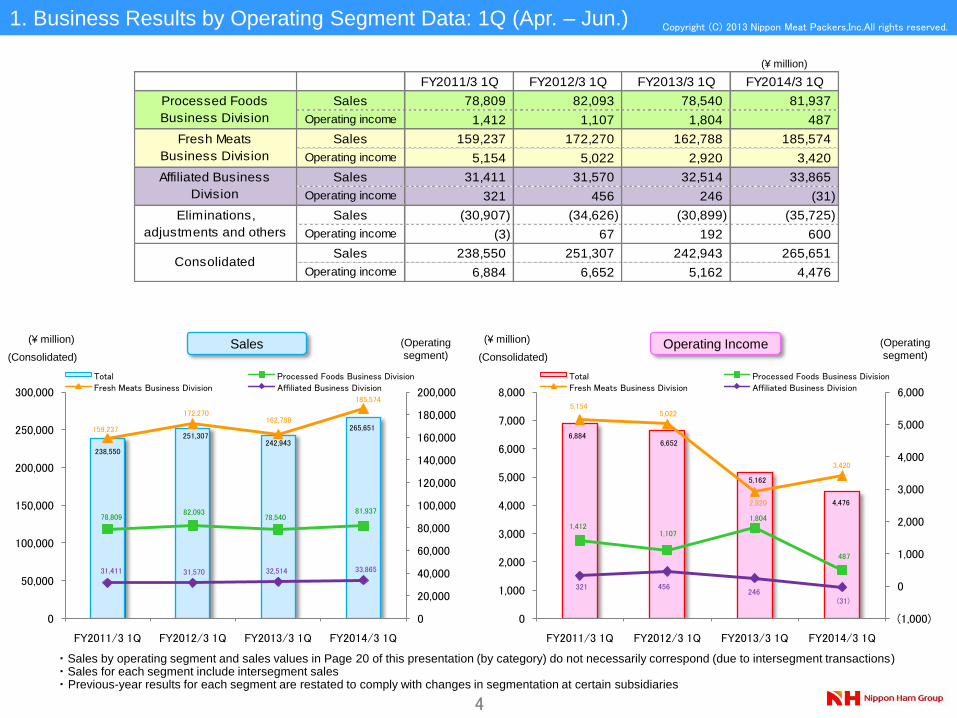
FY2011/3 1Q FY2012/3 1Q FY2013/3 1Q FY2014/3 1Q
Sales 78,809 82,093 78,540 81,937
Operating income 1,412 1,107 1,804 487
Sales 159,237 172,270 162,788 185,574
Operating income 5,154 5,022 2,920 3,420
Sales 31,411 31,570 32,514 33,865
Operating income 321 456 246 (31)
Sales (30,907) (34,626) (30,899) (35,725)
Operating income (3) 67 192 600
Sales 238,550 251,307 242,943 265,651
Operating income 6,884 6,652 5,162 4,476
Affiliated Business
Division
Eliminations,
adjustments and others
Consolidated
Processed Foods
Business Division
Fresh Meats
Business Division
(¥ million)
Sales Operating Income(¥ million)
(Consolidated)
(¥ million) (Operating
segment)(Consolidated)
(Operating
segment)
・ Sales by operating segment and sales values in Page 20 of this presentation (by category) do not necessarily correspond (due to intersegment transactions) ・ Sales for each segment include intersegment sales・ Previous-year results for each segment are restated to comply with changes in segmentation at certain subsidiaries
1. Business Results by Operating Segment Data: 1Q (Apr. – Jun.)
238,550
251,307242,943
265,651
78,80982,093
78,54081,937
159,237
172,270162,788
185,574
31,411 31,570 32,514 33,865
0
20,000
40,000
60,000
80,000
100,000
120,000
140,000
160,000
180,000
200,000
0
50,000
100,000
150,000
200,000
250,000
300,000
FY2011/3 1Q FY2012/3 1Q FY2013/3 1Q FY2014/3 1Q
Total Processed Foods Business DivisionFresh Meats Business Division Affiliated Business Division
6,8846,652
5,162
4,476
1,4121,107
1,804
487
5,1545,022
2,920
3,420
321 456 246
(31)
(1,000)
0
1,000
2,000
3,000
4,000
5,000
6,000
0
1,000
2,000
3,000
4,000
5,000
6,000
7,000
8,000
FY2011/3 1Q FY2012/3 1Q FY2013/3 1Q FY2014/3 1Q
Total Processed Foods Business DivisionFresh Meats Business Division Affiliated Business Division
5
Copyright (C) 2013 Nippon Meat Packers,Inc.All rights reserved.
78,80982,093
78,54081,937
0
10,000
20,000
30,000
40,000
50,000
60,000
70,000
80,000
90,000
100,000
FY2011/3 1Q FY2012/3 1Q FY2013/3 1Q FY2014/3 1Q
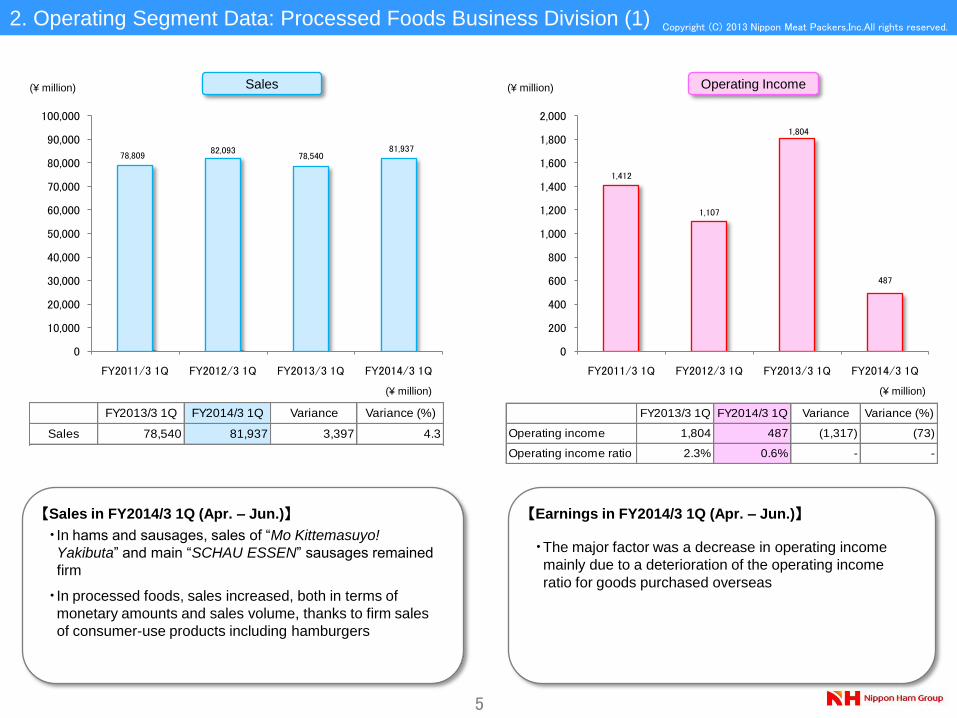
FY2013/3 1Q FY2014/3 1Q Variance Variance (%)
Sales 78,540 81,937 3,397 4.3
【Sales in FY2014/3 1Q (Apr. – Jun.)】
•In hams and sausages, sales of “Mo Kittemasuyo!
Yakibuta” and main “SCHAU ESSEN” sausages remained
firm
•In processed foods, sales increased, both in terms of
monetary amounts and sales volume, thanks to firm sales
of consumer-use products including hamburgers
1,412
1,107
1,804
487
0
200
400
600
800
1,000
1,200
1,400
1,600
1,800
2,000
FY2011/3 1Q FY2012/3 1Q FY2013/3 1Q FY2014/3 1Q
FY2013/3 1Q FY2014/3 1Q Variance Variance (%)
Operating income 1,804 487 (1,317) (73)
Operating income ratio 2.3% 0.6% - -
【Earnings in FY2014/3 1Q (Apr. – Jun.)】
•The major factor was a decrease in operating income
mainly due to a deterioration of the operating income
ratio for goods purchased overseas
2. Operating Segment Data: Processed Foods Business Division (1)
Sales Operating Income(¥ million) (¥ million)
(¥ million) (¥ million)
6
Copyright (C) 2013 Nippon Meat Packers,Inc.All rights reserved.
0 1 2 3
FY2014/3 1Q results
Other factors
Other materials/fuels
Principal raw material prices
Flooding in Thailand
Cost-cutting
FY2013/3 1Q results
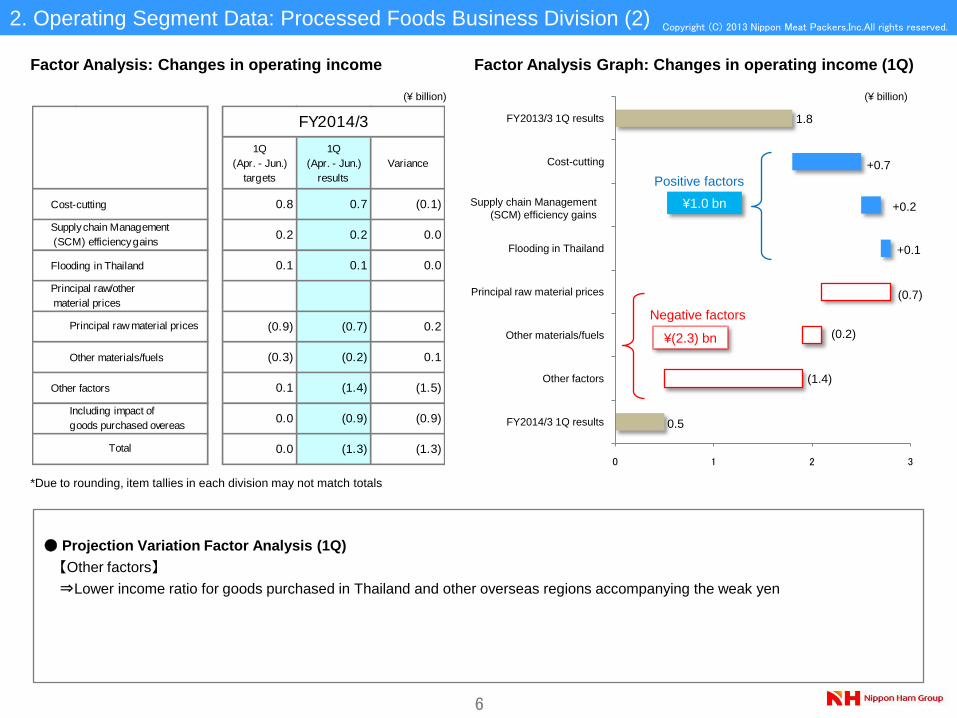
● Projection Variation Factor Analysis (1Q)
【Other factors】
⇒Lower income ratio for goods purchased in Thailand and other overseas regions accompanying the weak yen
1.8
0.5
+0.7
¥1.0 bn
¥(2.3) bn
+0.2
1Q
(Apr. - Jun.)
targets
1Q
(Apr. - Jun.)
results
Variance
Cost-cutting 0.8 0.7 (0.1)
0.2 0.2 0.0
Flooding in Thailand 0.1 0.1 0.0
(0.9) (0.7) 0.2
Other materials/fuels (0.3) (0.2) 0.1
Other factors 0.1 (1.4) (1.5)
0.0 (0.9) (0.9)
0.0 (1.3) (1.3)Total
Supply chain Management
(SCM) efficiency gains
Principal raw/other
material prices
FY2014/3
Including impact of
goods purchased overeas
Principal raw material prices
(1.4)
+0.1
(0.2)
(0.7)
2. Operating Segment Data: Processed Foods Business Division (2)
Factor Analysis: Changes in operating income
Positive factors
Negative factors
(¥ billion)
*Due to rounding, item tallies in each division may not match totals
Supply chain Management
(SCM) efficiency gains
(¥ billion)
Factor Analysis Graph: Changes in operating income (1Q)
7
Copyright (C) 2013 Nippon Meat Packers,Inc.All rights reserved.
FY2014/3 FY2014/3
1Q results 1Q results
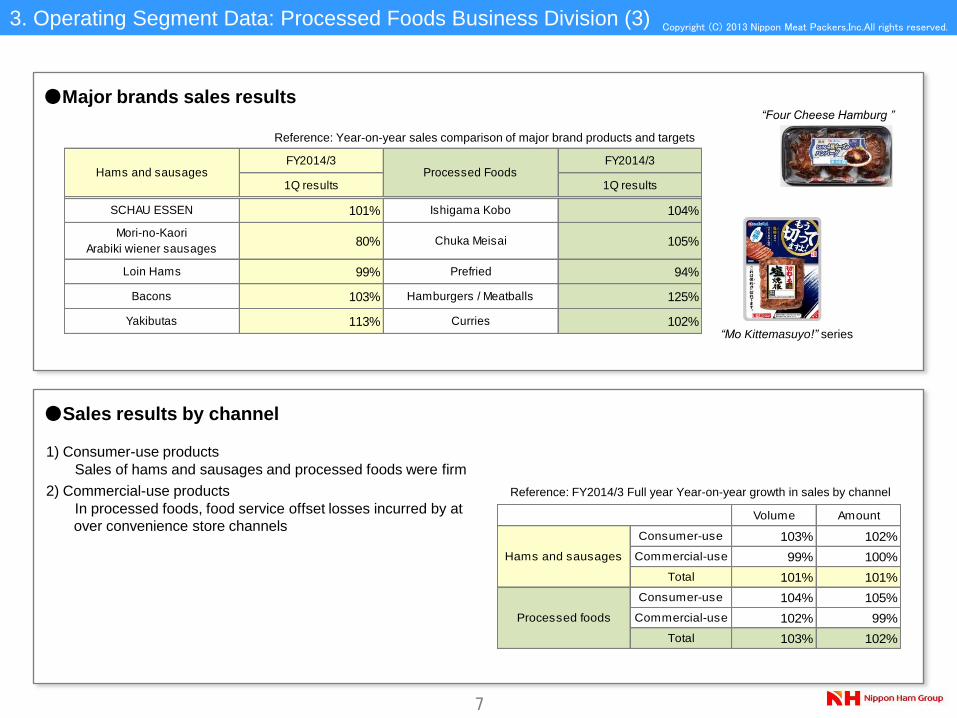
SCHAU ESSEN 101% Ishigama Kobo 104%
Mori-no-Kaori
Arabiki wiener sausages80% Chuka Meisai 105%
Loin Hams 99% Prefried 94%
Bacons 103% Hamburgers / Meatballs 125%
Yakibutas 113% Curries 102%
Processed FoodsHams and sausages
Volume Amount
Consumer-use 103% 102%
Commercial-use 99% 100%
Total 101% 101%
Consumer-use 104% 105%
Commercial-use 102% 99%
Total 103% 102%
Hams and sausages
Processed foods
●Major brands sales results
Reference: Year-on-year sales comparison of major brand products and targets
3. Operating Segment Data: Processed Foods Business Division (3)
“Mo Kittemasuyo!” series
“Four Cheese Hamburg ”
1) Consumer-use products
Sales of hams and sausages and processed foods were firm
2) Commercial-use products
In processed foods, food service offset losses incurred by at
over convenience store channels
●Sales results by channel
Reference: FY2014/3 Full year Year-on-year growth in sales by channel
8
Copyright (C) 2013 Nippon Meat Packers,Inc.All rights reserved.
159,237
172,270
162,788
185,574
0
20,000
40,000
60,000
80,000
100,000
120,000
140,000
160,000
180,000
200,000
FY2011/3 1Q FY2012/3 1Q FY2013/3 1Q FY2014/3 1Q
FY2013/3 1Q FY2014/3 1Q Variance Variance (%)
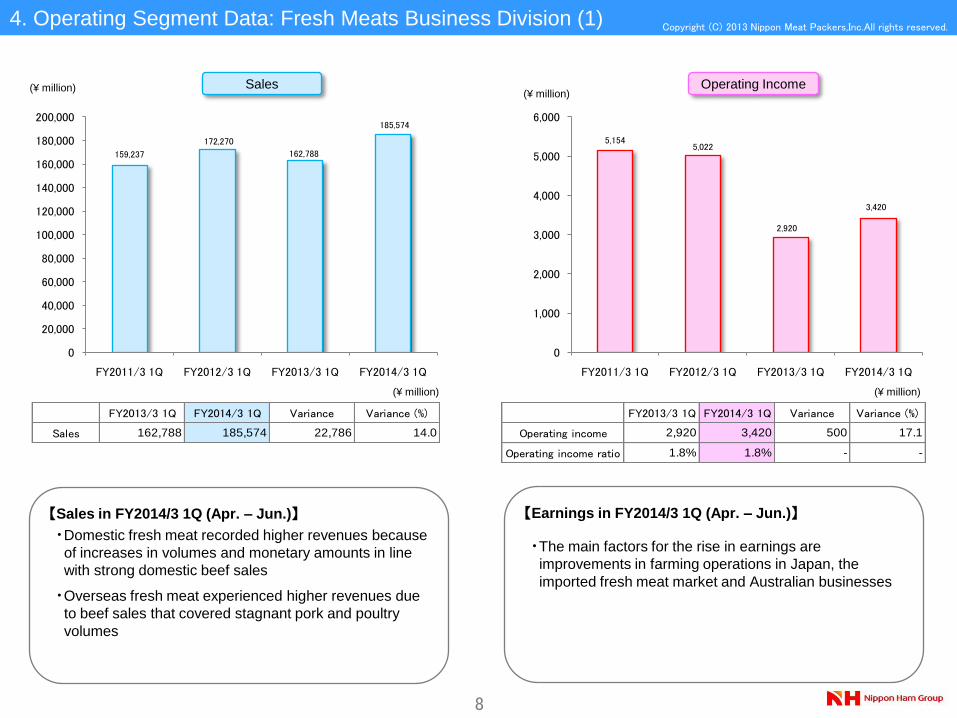
Sales 162,788 185,574 22,786 14.0
5,1545,022
2,920
3,420
0
1,000
2,000
3,000
4,000
5,000
6,000
FY2011/3 1Q FY2012/3 1Q FY2013/3 1Q FY2014/3 1Q
FY2013/3 1Q FY2014/3 1Q Variance Variance (%)
Operating income 2,920 3,420 500 17.1
Operating income ratio 1.8% 1.8% - -
4. Operating Segment Data: Fresh Meats Business Division (1)
Sales Operating Income(¥ million)(¥ million)
(¥ million) (¥ million)
【Sales in FY2014/3 1Q (Apr. – Jun.)】
•Domestic fresh meat recorded higher revenues because
of increases in volumes and monetary amounts in line
with strong domestic beef sales
•Overseas fresh meat experienced higher revenues due
to beef sales that covered stagnant pork and poultry
volumes
【Earnings in FY2014/3 1Q (Apr. – Jun.)】
•The main factors for the rise in earnings are
improvements in farming operations in Japan, the
imported fresh meat market and Australian businesses

9
Copyright (C) 2013 Nippon Meat Packers,Inc.All rights reserved.
● Projection Variance Factor Analysis (1Q)
【Farming operations in Japan】
⇒Although pork market prices entered a recovery phase, they remained below June projections. Poultry market prices also fell
short of projections despite a year-on-year rebound
【Nippon Food Group business】
⇒ Earnings deteriorated as a result of an increase in sales volume failing to reach the year-on-year target of 5%
0 0.5 1 1.5 2 2.5 3 3.5 4 4.5
FY2014/3 1Q results
Other factors
Domestic fresh meat market
Imported fresh meat market
FY2013/3 1Q results 2.9
3.4
+0.4
1Q
(Apr. - Jun.)
targets
1Q
(Apr. - Jun.)
results
Variance
1.0 0.4 (0.6)
0.4 0.3 (0.1)
0.7 0.4 (0.3)
0.1 (0.4) (0.5)
(0.1) (0.2) (0.1)
Other factors (0.1) 0.0 0.1
2.0 0.5 (1.5)Total
FY2014/3
Domestic fresh meat market
Imported fresh meat market
Changes in farming operations in
Japan
Changes in overseas operations
(Australia, Americas)
Nippon Food Group business
conditions
(0.4)
(0.2)
+0.3
+0.4
Factor Analysis: Changes in operating income
3. Operating Segment Data: Fresh Meats Business Division (2)
¥1.1 bn
¥(0.6) bn
Positive factors
Negative factors
(¥ billion)
*Due to rounding, item tallies in each division may not match totals
Changes in overseas
operations
(Australia, Americas)
Nippon Food Group business
conditions
Changes in farming
operations in Japan
(¥ billion)
Factor Analysis Graph: Changes in operating income (1Q)
10
Copyright (C) 2013 Nippon Meat Packers,Inc.All rights reserved.
31,41131,570 32,514
33,865
0
5,000
10,000
15,000
20,000
25,000
30,000
35,000
40,000
FY2011/3 1Q FY2012/3 1Q FY2013/3 1Q FY2014/3 1Q
FY2013/3 1Q FY2014/3 1Q Variance Variance (%)
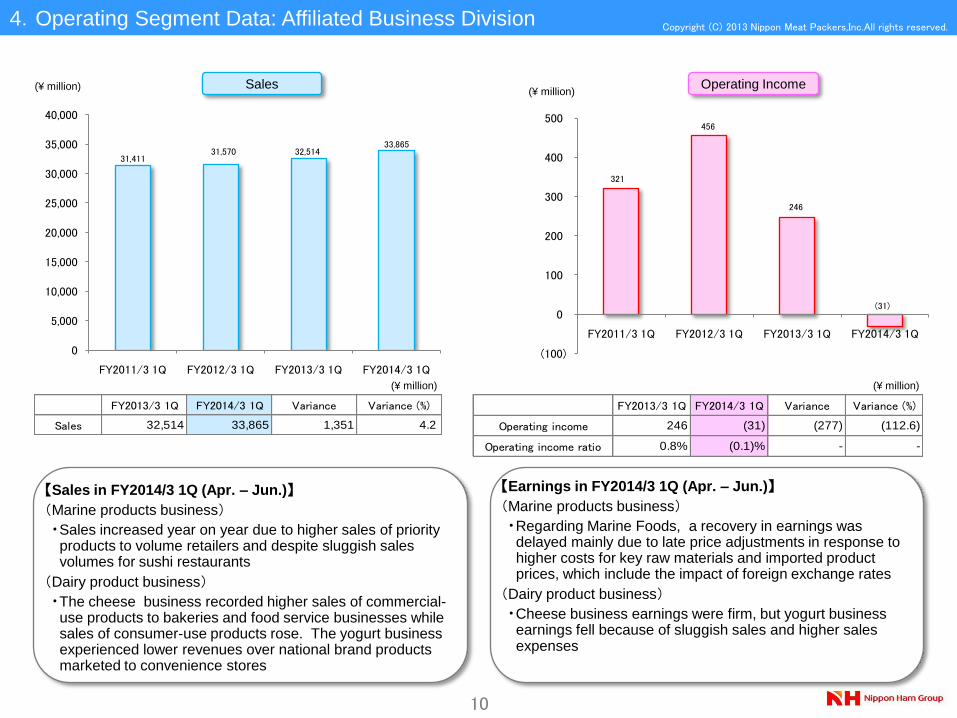
Sales 32,514 33,865 1,351 4.2
321
456
246
(31)
(100)
0
100
200
300
400
500
FY2011/3 1Q FY2012/3 1Q FY2013/3 1Q FY2014/3 1Q
FY2013/3 1Q FY2014/3 1Q Variance Variance (%)
Operating income 246 (31) (277) (112.6)
Operating income ratio 0.8% (0.1)% - -
Sales Operating Income(¥ million)(¥ million)
(¥ million) (¥ million)
4.Operating Segment Data: Affiliated Business Division
【Sales in FY2014/3 1Q (Apr. – Jun.)】
(Marine products business)
•Sales increased year on year due to higher sales of priority products to volume retailers and despite sluggish sales volumes for sushi restaurants
(Dairy product business)
•The cheese business recorded higher sales of commercial-use products to bakeries and food service businesses while sales of consumer-use products rose. The yogurt business experienced lower revenues over national brand products marketed to convenience stores
【Earnings in FY2014/3 1Q (Apr. – Jun.)】
(Marine products business)
•Regarding Marine Foods, a recovery in earnings was delayed mainly due to late price adjustments in response to higher costs for key raw materials and imported product prices, which include the impact of foreign exchange rates
(Dairy product business)
•Cheese business earnings were firm, but yogurt business earnings fell because of sluggish sales and higher sales expenses

11
Copyright (C) 2013 Nippon Meat Packers,Inc.All rights reserved.
FY2014/3 1Q (Apr. – Jun.)(Australia)
• Revenues and earnings increased thanks to higher sales primarily in Asia, China, Russia and the Middle East as well as the
weak Australian dollar
(Americas)
• Earnings decreased due to downward pressure on earnings of overseas export businesses accompanying high U.S. market
prices and the strong U.S. dollar
(Asia)
• Earnings fell because of a deteriorating income ratio accompanying the weak yen and despite increases in sales volume in
China and Thailand
5.Business Results in Major Overseas Markets
1Q Results (Apr.-Jun.)
(Sales: ¥ million)
(Operating income/loss:
¥ million)
(¥ million)
• Sales revenues represent amounts prior to consolidation adjustments(The figures for all overseas segments do not match the overseas sales total, by reason of the elimination of intersegment transactions)
• Other overseas markets are in Asia and Europe
12,87419,920
15,973
19,6278,288
11,371
(440)
381
87
(358)
148
61
(2,000)
(1,500)
(1,000)
(500)
0
500
1,000
1,500
0
10,000
20,000
30,000
40,000
50,000
60,000
FY2013/3 FY2014/3
Australia: Sales Americas: SalesOther regions: Sales Australia: Operating incomeAmericas: Operating income Other regions: Operating income
FY2013/3 1Q FY2014/3 1Q Variance Variance (%)
Sales 36,617 49,868 13,251 36.2
Operating income (216) (90) 126 -
Sales 12,874 19,920 7,046 54.7
Operating income (440) 381 821 -
Sales 15,973 19,627 3,654 22.9
Operating income 87 (358) (445) -
Sales 8,288 11,371 3,083 37.2
Operating income 148 (61) (209) -
Overseas total
Australia
Americas
Other regions
12
Copyright (C) 2013 Nippon Meat Packers,Inc.All rights reserved.
(¥ million)
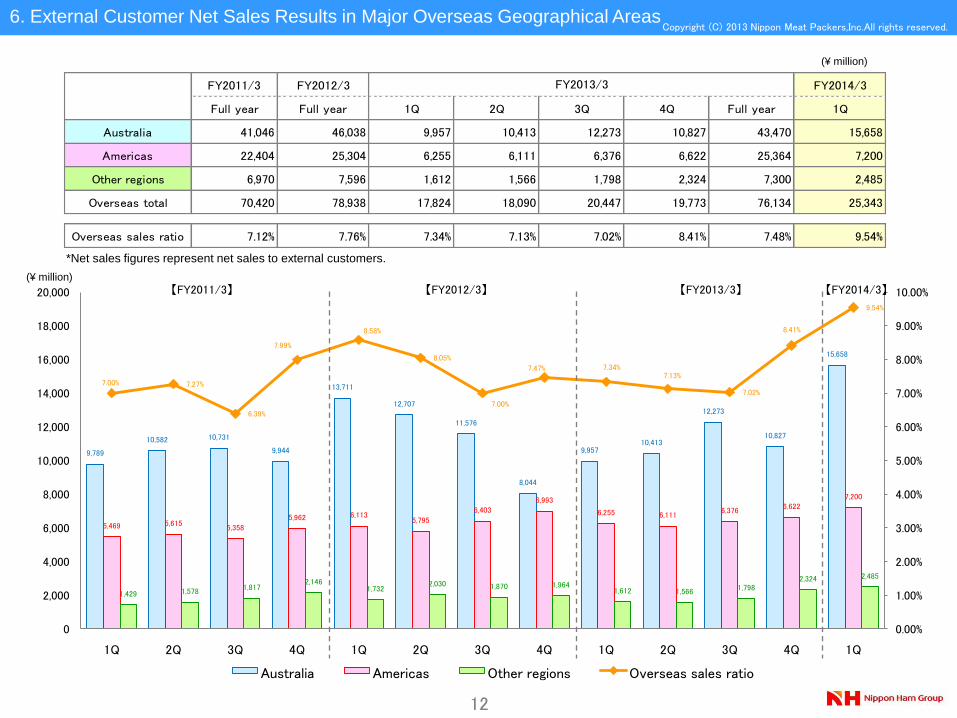
6. External Customer Net Sales Results in Major Overseas Geographical Areas
*Net sales figures represent net sales to external customers.
FY2011/3 FY2012/3 FY2014/3
Full year Full year 1Q 2Q 3Q 4Q Full year 1Q
Australia 41,046 46,038 9,957 10,413 12,273 10,827 43,470 15,658
Americas 22,404 25,304 6,255 6,111 6,376 6,622 25,364 7,200
Other regions 6,970 7,596 1,612 1,566 1,798 2,324 7,300 2,485
Overseas total 70,420 78,938 17,824 18,090 20,447 19,773 76,134 25,343
Overseas sales ratio 7.12% 7.76% 7.34% 7.13% 7.02% 8.41% 7.48% 9.54%
FY2013/3
9,789
10,582 10,731
9,944
13,711
12,707
11,576
8,044
9,95710,413
12,273
10,827
15,658
5,469 5,6155,358
5,962 6,1135,795
6,4036,993
6,255 6,1116,376
6,6227,200
1,429 1,5781,817
2,1461,732
2,030 1,870 1,9641,612 1,566 1,798
2,324 2,485
7.00% 7.27%
6.39%
7.99%
8.58%
8.05%
7.00%
7.47% 7.34%7.13%
7.02%
8.41%
9.54%
0.00%
1.00%
2.00%
3.00%
4.00%
5.00%
6.00%
7.00%
8.00%
9.00%
10.00%
0
2,000
4,000
6,000
8,000
10,000
12,000
14,000
16,000
18,000
20,000
1Q 2Q 3Q 4Q 1Q 2Q 3Q 4Q 1Q 2Q 3Q 4Q 1Q
Australia Americas Other regions Overseas sales ratio
【FY2014/3】【FY2013/3】【FY2012/3】【FY2011/3】(¥ million)

13
Copyright (C) 2013 Nippon Meat Packers,Inc.All rights reserved.
II. Outlook for FY2014/3
1. FY2014/3 Operating Income Forecasts
2. Processed Foods Business Division: Outlook
3. Fresh Meats Business Division: Outlook
4. Affiliated Business Division: Outlook
14
Copyright (C) 2013 Nippon Meat Packers,Inc.All rights reserved.
0
5
10
15
20
25
30
35
FY2014/3
1Q results
FY2014/3
1st half forecasts
FY2014/3
2nd half forecasts
FY2014/3
full year forecasts
FY2013/3 1Q
resultsVariance
FY2013/3
1st half resultsVariance
FY2013/3
2nd half resultsVariance
FY2013/3
full year resultsVariance
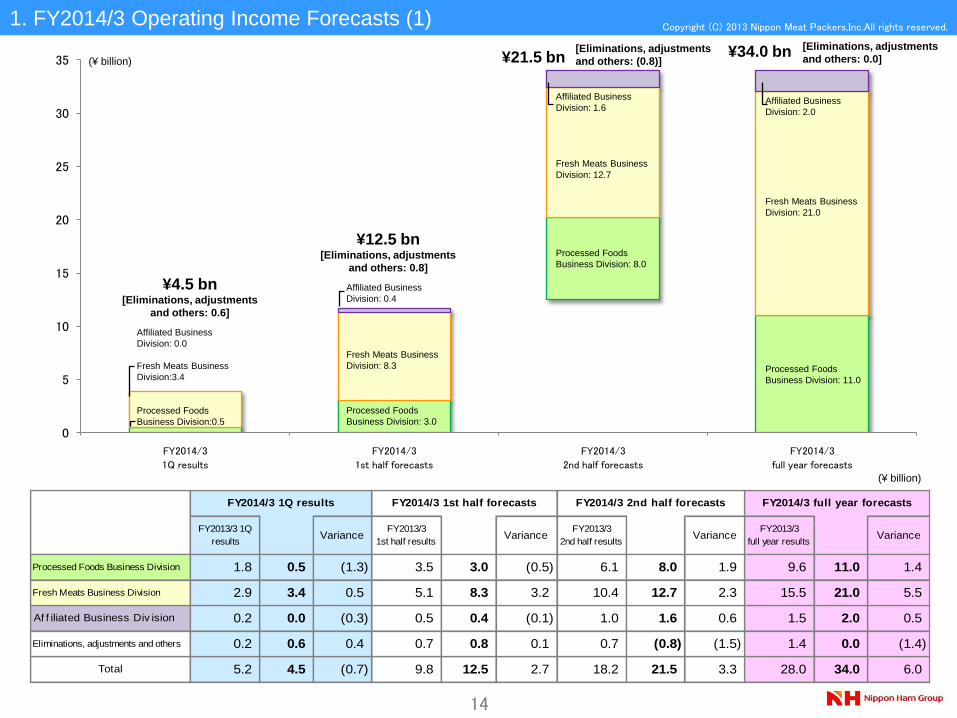
Processed Foods Business Division 1.8 0.5 (1.3) 3.5 3.0 (0.5) 6.1 8.0 1.9 9.6 11.0 1.4
Fresh Meats Business Division 2.9 3.4 0.5 5.1 8.3 3.2 10.4 12.7 2.3 15.5 21.0 5.5
Af f iliated Business Div ision 0.2 0.0 (0.3) 0.5 0.4 (0.1) 1.0 1.6 0.6 1.5 2.0 0.5
Eliminations, adjustments and others 0.2 0.6 0.4 0.7 0.8 0.1 0.7 (0.8) (1.5) 1.4 0.0 (1.4)
Total 5.2 4.5 (0.7) 9.8 12.5 2.7 18.2 21.5 3.3 28.0 34.0 6.0
FY2014/3 full year forecastsFY2014/3 2nd half forecastsFY2014/3 1st half forecastsFY2014/3 1Q results
1. FY2014/3 Operating Income Forecasts (1)
(¥ billion)
Affiliated Business
Division: 0.0
Fresh Meats Business
Division:3.4
Processed Foods
Business Division:0.5
¥4.5 bn[Eliminations, adjustments
and others: 0.6]
Affiliated Business
Division: 0.4
Fresh Meats Business
Division: 8.3
Processed Foods
Business Division: 3.0
¥12.5 bn[Eliminations, adjustments
and others: 0.8]
¥21.5 bn
Affiliated Business
Division: 1.6
Fresh Meats Business
Division: 12.7
Processed Foods
Business Division: 8.0
[Eliminations, adjustments
and others: (0.8)]¥34.0 bn [Eliminations, adjustments
and others: 0.0]
Affiliated Business
Division: 2.0
Fresh Meats Business
Division: 21.0
Processed Foods
Business Division: 11.0
(¥ billion)

15
Copyright (C) 2013 Nippon Meat Packers,Inc.All rights reserved.
【Revision of forecast and variance as of 1Q】
Target Variance Target Variance Target Variance
1.3 (0.3) 1.1 0.7 2.4 0.4
(0.2) (0.5) 0.3 0.1 0.2 (0.4)
Imported fresh meat market 0.7 (0.1) (0.1) 0.1 0.6 0.0
1.1 (0.6) 1.0 0.1 2.1 (0.5)
0.3 0.0 (0.1) 0.2 0.2 0.2
Others 0.0 0.1 0.1 0.3 0.0 0.3
3.2 (1.5) 2.3 1.5 5.5 0.0
Fresh Meats
Business Division
Total
Revision of forecast and variance as of 1Q
1st half 2nd half Full year
Changes in overseas
operations (Australia,
Americas)
Nippon Food Group business
Changes in farming operations
in Japan
Domestic fresh meat market
Target Variance Target Variance Target Variance
Price revision effect 0.9 0.0 1.8 0.0 2.7 0.0
Cost-cutting 1.4 (0.1) 2.4 0.6 3.8 0.5
0.5 0.0 0.8 0.3 1.3 0.3
Principal raw material
prices(1.8) 0.2 (2.5) 0.0 (4.3) 0.2
Other materials/fuels (0.6) 0.1 (1.5) 0.0 (2.1) 0.1
0.2 (0.1) 0.2 0.1 0.4 0.0
Others (1.1) (1.4) 0.8 0.4 (0.3) (1.0)
(0.5) (1.3) 2.0 1.3 1.5 0.0Total
Revision of forecast and variance as of 1Q
Flooding in Thailand
Processed Foods
Business DivisionFull year2nd half1st half
Supply Chain Management
(SCM) effect
Principal raw/other material
prices
【FY2014/3 operating income forecasts】
Initial
forecastsVariance
Initial
forecastsVariance
Initial
forecastsVariance
Initial
forecastsVariance
Processed Foods Business Division 1.8 0.5 (1.3) 4.3 3.0 (1.3) 6.7 8.0 1.3 11.0 11.0 0.0
Fresh Meats Business Division 4.9 3.4 (1.5) 9.8 8.3 (1.5) 11.2 12.7 1.5 21.0 21.0 0.0
Af f iliated Business Div ision 0.3 0.0 (0.3) 0.7 0.4 (0.3) 1.3 1.6 0.3 2.0 2.0 0.0
Eliminations, adjustments and others 0.0 0.6 0.6 0.2 0.8 0.6 (0.2) (0.8) (0.6) 0.0 0.0 0.0
Total 7.0 4.5 (2.5) 15.0 12.5 (2.5) 19.0 21.5 2.5 34.0 34.0 0.0
FY2014/3 full year forecastsFY2014/3 2nd half forecastsFY2014/3 1st half forecastsFY2014/3 1Q results
1. FY2014/3 Operating Income Forecasts (2)
*Due to rounding, item tallies in each division may not match totals. In this case, item tallies in
each division are adjusted to match totals.
*Due to rounding, item tallies in each division may not match totals
*Revision of 1st and 2nd half and full year forecasts after 1Q (¥ billion)
(¥ billion)

16
Copyright (C) 2013 Nippon Meat Packers,Inc.All rights reserved.2. Processed Foods Business Division : Outlook
● Measures to expand sales of major brands and new products
Reference: Gift-giving season sales volume: results for FY2013/3 and targets for FY2014/3
UnitsVariance
FY2012/3Units
Variance
FY2013/3
Summer gift-giving season 2,026 101% 2,080 103%
Year-end gift-giving season 4,759 99% 4,900 103%
Total 6,785 100% 6,980 103%
FY2013/3 results FY2014/3 targets
Hams and sausages FY2014/3 full year targets Processed foods FY2014/3 full year targets
SCHAU ESSEN 103% Ishigama Kobo 103%
Mori-no-Kaori
Arabiki wiener sausages103% Chuka Meisai 103%
Hams 103% Prefried 100%
Bacons 102% Hamburgers / Meatballs 102%
Yakibutas 110% Curries 100%
Amount
Consumer-use 102%
Commercial-use 102%
Total 102%
Consumer-use 102%
Commercial-use 103%
Total 102%
FY2014/3 full year targets
Hams and sausages
Processed foods
(Unit: 1,000)
Reference: Year-on-year sales comparison of major brand products and targets
Reference: Year-on-year growth in sales by channel● Measures to expand sales by channel
1) Consumer-use
• Enhance sales primarily of main hams and sausages and processed
foods brands
2) Commercial-use
• Bolster sales by expanding items mainly targeting convenience stores
and food-service chains
1) Hams and sausages
• Further increase sales of the “Irodori Kitchen”
series and main “SCHAU ESSEN”
sausages, which will reach its 30th anniversary
next year
2) Processed foods
• Boost sales of strong-selling “Four Cheese
Hamburg” along with main and new products
● Measures to increase sales of gift products
• Target 103% growth in both summer and year-end gift sets (year-on-year, total sales volume)
• Sales promotion activities mainly for “Utsukushi-no-Kuni” range
(TV commercials and adverts in magazines, etc.)
• The flagship brand “Utsukushi-no-Kuni” aims at year-on-year sales
growth of over 120%
(Reference)
• Forecasts for summer gift-set performance (Year-on-year, per unit
basis, as of July 31, 2013) approx. unchanged overall
• The flagship brand “Utsukushi-no-Kuni” ... up approx. 116%

17
Copyright (C) 2013 Nippon Meat Packers,Inc.All rights reserved.3. Fresh Meats Business Division: Outlook
● Overseas businesses1) Restructuring of Australian businesses
• Improve income ratio by reducing cost of sales and further expand sales in Japan mainly by increasing sales of brand products
• Strengthen sales of Australian beef to the ASEAN region, China, Russia and the Middle East
2) Americas business
• As numbers of cows being raised declines in beef markets, we expect market prices for fresh meats to remain high
• Forecasted increase over last year in pork market prices
● Production businesses in Japan1) Feed prices
• Although overseas corn prices stabilized, prices are expected to rise this fiscal year accompanying the weakening yen
2) Farming operations in Japan
【Pig farming】
• Pork market prices are anticipated to recover throughout the summer
【Poultry farming】
• Poultry market prices are expected to rebound over last year but fall short of projections
●Domestic operations, Nippon Food Group (meat product marketing companies)• Aim for a continual 1% increase in market share by further strengthening sales to volume
retailers as well as sales capabilities based on new business development
• Expand sales volume within three major livestock categories in Japan, particularly for beef
• Boost sales of brand fresh meat, including Sakurahime brand chicken, Whyalleaf and Kenko (Healthy) Pork
Sakurahime brand chicken consumer pack*
to be released in July 2013
18
Copyright (C) 2013 Nippon Meat Packers,Inc.All rights reserved.4. Affiliated Business Division: Outlook
●Measures to increase marine product sales(Marine Foods Corporation)
• Expand sales of items produced in-house in Japan by strengthening product development capability
• Improve market share by increase sales centered on priority shrimp- and salmon-related products via volume retailer channels
• Enhance kinds of sushi using proposal-based marketing via sushi restaurant channels and increase sales of domestic items produced in-
house
(Hoko Co., Ltd.)
• In marine products, bolster downstream strategies, including volume retailer and food-service channels
• In the room-temperature (canned) product business, strengthen sales from its Hachinohe Factory, which has reinforced production
capacity
●Measures to increase dairy product sales(Cheese)
• Increase sales by strengthening proposal-based marketing through mainstay channels
• Expand sales of consumer-use products by strengthening product lineups
(Yogurt)
• Strengthen cup beverage and other private-brand products marketed to convenience stores while enhancing national-brand product
development
• Target volume retailers and co-operative store channels for sales of mainstay vanilla yogurt products, etc.
●Trends in principal raw and other materials• Cheese ingredient prices are expected to jump significantly due to the drought in production regions (Oceania) and the impact of foreign
exchange rates
• In yogurt ingredients, prices will likely remain high due to a shortage of fat-free milk powder made in Japan
• In overseas milk powder production, prices will increase because of lower production volume in Oceania, an important production region

19
Copyright (C) 2013 Nippon Meat Packers,Inc.All rights reserved.
III. Consolidated Financial Results for FY2014/3 1Q (Apr.-Jun.)
1. FY2014/3 Business Results at a Glance and Full year Forecasts
2. Growth Rate by Sales Category, and by Geographical Segment
3. Selling, General and Administrative Expenses / Other Operating
Costs and Expenses (Income) / Other Income (Expenses)
4. Balance Sheets / Property, Plant and Equipment / Depreciation
and Amortization
20
Copyright (C) 2013 Nippon Meat Packers,Inc.All rights reserved.
1Q 1Q
results results
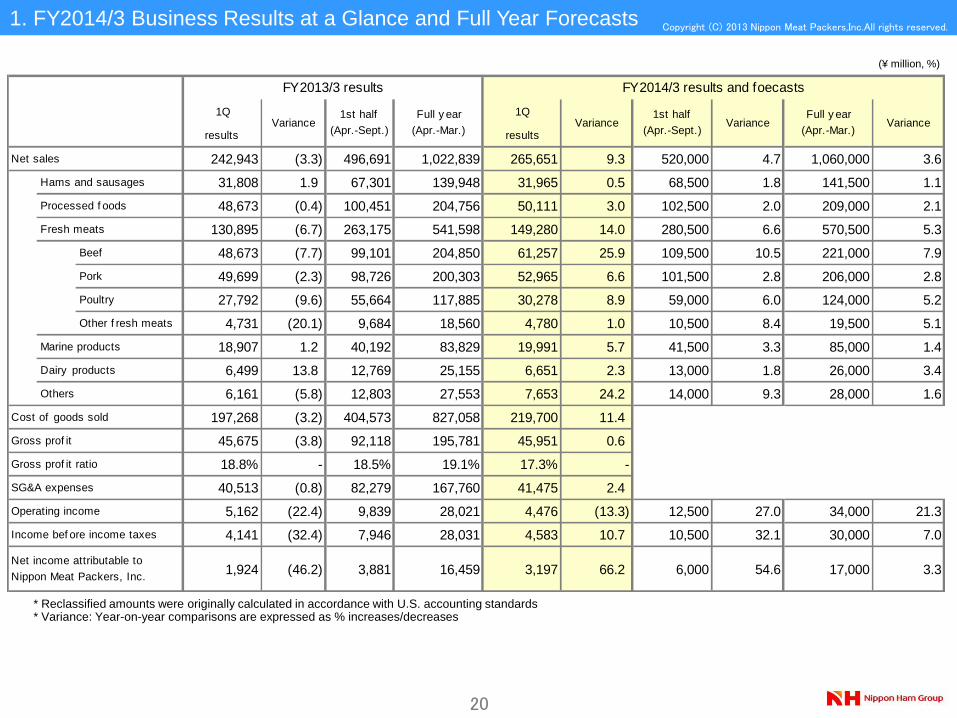
Net sales 242,943 (3.3) 496,691 1,022,839 265,651 9.3 520,000 4.7 1,060,000 3.6
Hams and sausages 31,808 1.9 67,301 139,948 31,965 0.5 68,500 1.8 141,500 1.1
Processed f oods 48,673 (0.4) 100,451 204,756 50,111 3.0 102,500 2.0 209,000 2.1
Fresh meats 130,895 (6.7) 263,175 541,598 149,280 14.0 280,500 6.6 570,500 5.3
Beef 48,673 (7.7) 99,101 204,850 61,257 25.9 109,500 10.5 221,000 7.9
Pork 49,699 (2.3) 98,726 200,303 52,965 6.6 101,500 2.8 206,000 2.8
Poultry 27,792 (9.6) 55,664 117,885 30,278 8.9 59,000 6.0 124,000 5.2
Other f resh meats 4,731 (20.1) 9,684 18,560 4,780 1.0 10,500 8.4 19,500 5.1
Marine products 18,907 1.2 40,192 83,829 19,991 5.7 41,500 3.3 85,000 1.4
Dairy products 6,499 13.8 12,769 25,155 6,651 2.3 13,000 1.8 26,000 3.4
Others 6,161 (5.8) 12,803 27,553 7,653 24.2 14,000 9.3 28,000 1.6
Cost of goods sold 197,268 (3.2) 404,573 827,058 219,700 11.4
Gross prof it 45,675 (3.8) 92,118 195,781 45,951 0.6
Gross prof it ratio 18.8% - 18.5% 19.1% 17.3% -
SG&A expenses 40,513 (0.8) 82,279 167,760 41,475 2.4
Operating income 5,162 (22.4) 9,839 28,021 4,476 (13.3) 12,500 27.0 34,000 21.3
Income bef ore income taxes 4,141 (32.4) 7,946 28,031 4,583 10.7 10,500 32.1 30,000 7.0
1,924 (46.2) 3,881 16,459 3,197 66.2 6,000 54.6 17,000 3.3
Full y ear
(Apr.-Mar.)
Full y ear
(Apr.-Mar.)
1st half
(Apr.-Sept.)
Net income attributable to
Nippon Meat Packers, Inc.
FY2013/3 results FY2014/3 results and foecasts
1st half
(Apr.-Sept.)Variance Variance Variance Variance
(¥ million, %)
* Reclassified amounts were originally calculated in accordance with U.S. accounting standards* Variance: Year-on-year comparisons are expressed as % increases/decreases
1. FY2014/3 Business Results at a Glance and Full Year Forecasts

21
Copyright (C) 2013 Nippon Meat Packers,Inc.All rights reserved.
1Q 1Q
results results
225,261 461,110 947,388 240,519 6.8 478,400 3.7 975,800 3.0
External customers 225,119 460,777 946,705 240,308 6.7 478,000 3.7 975,000 3.0
Intersegment 142 333 683 211 48.6 400 20.1 800 17.1
Operating income 5,517 10,824 28,624 4,421 (19.9) 12,000 10.9 32,000 11.8
Operating income ratio 2.4% 2.3% 3.0% 1.8% - 2.5% - 3.3% -
Overseas sales 36,617 75,636 158,873 49,868 36.2 87,600 15.8 177,200 11.5
External customers 17,824 35,914 76,134 25,343 42.2 42,000 16.9 85,000 11.6
Intersegment 18,793 39,722 82,739 24,525 30.5 45,600 14.8 92,200 11.4
Operating income (216) (668) (474) (90) - 500 - 2,000 -
Operating income ratio - - - - - 0.6% - 1.1% -
Domestic sales
FY2013/3 results FY2014/3 results and forecasts
Variance VarianceVariance1st half
(Apr.-Sept.)
Full year
(Apr.-Mar.)
1st half
(Apr.-Sept.)
Full year
(Apr.-Mar.)
Sales volume Sales revenues Sales volume Sales revenues
Hams and sausages 4.1 1.9 (0.7) 0.5
Processed foods (0.4) (0.4) 3.4 3.0
Fresh meats 1.7 (6.7) 2.9 14.0
Beef (11.5) (7.7) 18.2 25.9
Pork 2.8 (2.3) (2.9) 6.6
Poultry 13.6 (9.6) (0.5) 8.9
Other fresh meats (9.8) (20.1) (4.6) 1.0
Category FY2014/3 1Q (Year-on-year comparison)FY2013/3 1Q (Year-on-year comparison)
2. Growth Rate by Sales Category, and by Geographical Segment
Growth Rate by Sales Category (%)
(¥ million, %)Geographical Segment
* Sales by geographic segment are before intersegment elimination* Variance: Year-on-year comparisons are expressed as % increases/decreases
22
Copyright (C) 2013 Nippon Meat Packers,Inc.All rights reserved.
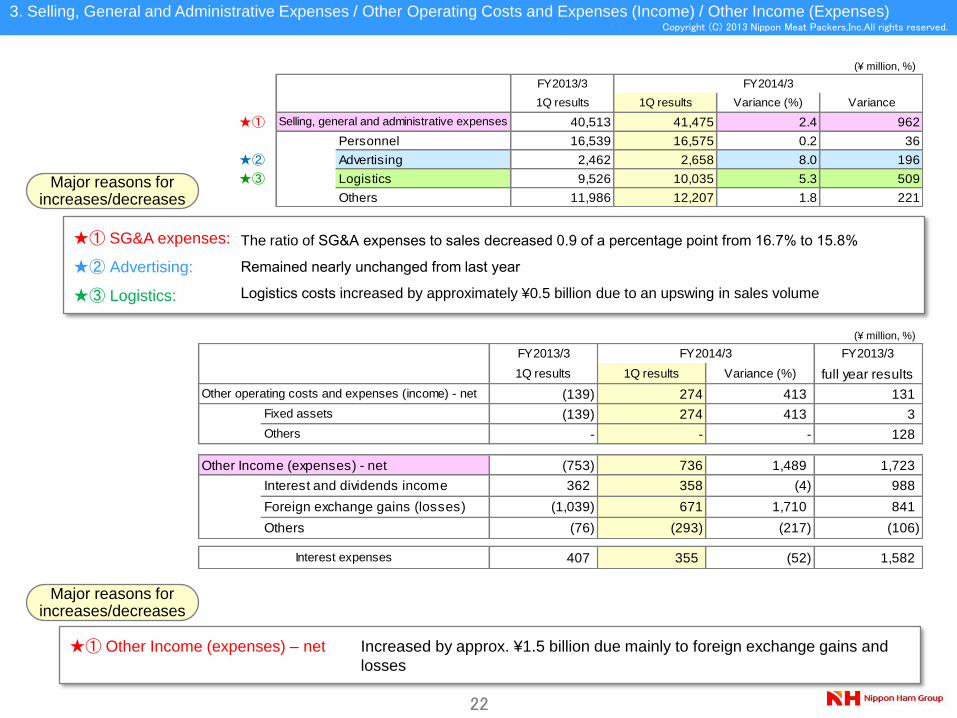
FY2013/3
1Q results 1Q results Variance (%) Variance
★① Selling, general and administrative expenses 40,513 41,475 2.4 962
Personnel 16,539 16,575 0.2 36
★② Advertising 2,462 2,658 8.0 196
★③ Logistics 9,526 10,035 5.3 509
Others 11,986 12,207 1.8 221
FY2014/3
★① SG&A expenses:
★② Advertising:
★③ Logistics:
FY2013/3 FY2013/3
1Q results 1Q results Variance (%) full year results
Other operating costs and expenses (income) - net (139) 274 413 131
Fixed assets (139) 274 413 3
Others - - - 128
Other Income (expenses) - net (753) 736 1,489 1,723
Interest and dividends income 362 358 (4) 988
Foreign exchange gains (losses) (1,039) 671 1,710 841
Others (76) (293) (217) (106)
407 355 (52) 1,582Interest expenses
FY2014/3
★① Other Income (expenses) – net Increased by approx. ¥1.5 billion due mainly to foreign exchange gains and
losses
The ratio of SG&A expenses to sales decreased 0.9 of a percentage point from 16.7% to 15.8%
Remained nearly unchanged from last year
Logistics costs increased by approximately ¥0.5 billion due to an upswing in sales volume
3. Selling, General and Administrative Expenses / Other Operating Costs and Expenses (Income) / Other Income (Expenses)
Major reasons for increases/decreases
Major reasons for increases/decreases
(¥ million, %)
(¥ million, %)
23
Copyright (C) 2013 Nippon Meat Packers,Inc.All rights reserved.
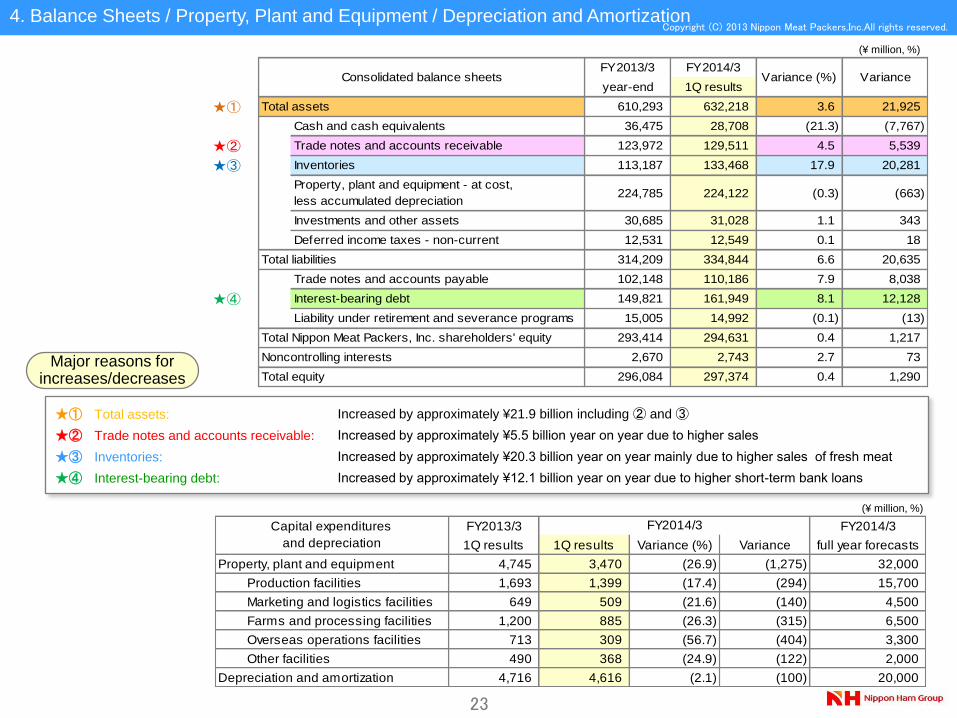
★① Total assets:
★② Trade notes and accounts receivable:
★③ Inventories:
★④ Interest-bearing debt:
FY2013/3 FY2014/3
1Q results 1Q results Variance (%) Variance full year forecasts
Property, plant and equipment 4,745 3,470 (26.9) (1,275) 32,000
Production facilities 1,693 1,399 (17.4) (294) 15,700
Marketing and logistics facilities 649 509 (21.6) (140) 4,500
Farms and processing facilities 1,200 885 (26.3) (315) 6,500
Overseas operations facilities 713 309 (56.7) (404) 3,300
Other facilities 490 368 (24.9) (122) 2,000
Depreciation and amortization 4,716 4,616 (2.1) (100) 20,000
FY2014/3Capital expenditures
and depreciation
FY2013/3 FY2014/3
year-end 1Q results
★① Total assets 610,293 632,218 3.6 21,925
Cash and cash equivalents 36,475 28,708 (21.3) (7,767)
★② Trade notes and accounts receivable 123,972 129,511 4.5 5,539
★③ Inventories 113,187 133,468 17.9 20,281
Property, plant and equipment - at cost,
less accumulated depreciation224,785 224,122 (0.3) (663)
Investments and other assets 30,685 31,028 1.1 343
Deferred income taxes - non-current 12,531 12,549 0.1 18
Total liabilities 314,209 334,844 6.6 20,635
Trade notes and accounts payable 102,148 110,186 7.9 8,038
★④ Interest-bearing debt 149,821 161,949 8.1 12,128
Liability under retirement and severance programs 15,005 14,992 (0.1) (13)
Total Nippon Meat Packers, Inc. shareholders' equity 293,414 294,631 0.4 1,217
Noncontrolling interests 2,670 2,743 2.7 73
Total equity 296,084 297,374 0.4 1,290
Variance (%) VarianceConsolidated balance sheets
Increased by approximately ¥21.9 billion including ② and ③
Increased by approximately ¥5.5 billion year on year due to higher sales
Increased by approximately ¥20.3 billion year on year mainly due to higher sales of fresh meat
Increased by approximately ¥12.1 billion year on year due to higher short-term bank loans
4. Balance Sheets / Property, Plant and Equipment / Depreciation and Amortization
(¥ million, %)
Major reasons for increases/decreases
(¥ million, %)
24
Copyright (C) 2013 Nippon Meat Packers,Inc.All rights reserved.
Contact
Public & Investor Relations Department
Nippon Meat Packers, Inc.
14F ThinkPark Tower
2-1-1 Osaki, Shinagawa-ku, Tokyo 141-6014
Tel: 81-3-4555-8024 Fax: 81-3-4555-8189
Forward-looking statements
This presentation includes forecasts regarding targets, strategies and earnings. These
forecasts are based on information available at the current time and contain certain
assumptions about the future. They are subject to numerous external uncertainties in
areas such as economic environment, market trends and exchange rates.
Actual performance may differ significantly from the targets in this presentation, and
investment decisions should not be based exclusively on them.