Embed Size (px)
Citation preview
1
Gastrocnemius medialis muscle architecture and physiological cross sectional area in adult males
with Duchenne Muscular Dystrophy.
Morse, C.I.1, Smith, J.1,2, Denny, A.1, Tweedale, J.1, Searle, N.D.1
1Institute for Performance Research, Department of Exercise and Sport Science, Manchester
Metropolitan University Cheshire, CW1 5DU, United Kingdom.
2The Neuromuscular Centre, Winsford, Cheshire CW7 4EH, United Kingdom.
Running Head: Muscle size in Muscular Dystrophy
2
Abstract
Objectives: To describe muscle size and architecture of the gastrocnemius medialis (GM) muscle in
eleven adult males with Duchenne Muscular Dystrophy (DMD, age 24.5 ± 5.4 years), and a control
group of eleven males without DMD (CTRL, age 22.1 ± 0.9 years).
Methods: GM anatomical cross sectional area (ACSA), volume (VOL), physiological cross sectional
area (PCSA), fascicle length (Lf) and pennation angle (θ) were assessed using B-Mode
Ultrasonography. GM ACSA was measured at 25, 50 and 75% of muscle length (Lm), from which VOL
was calculated. At 50% of Lm, sagittal plane images were analysed to determine GM Lf and θ. GM
PCSA was calculated as: VOL/Lf. The ratio of Lf and Lm was also calculated.
Results: GM ACSA at 50% Lm, VOL and PCSA were smaller in DMD males compared to CTRL males by
36, 47 and 43%, respectively (P<0.01). There were no differences in Lf and θ. GM Lm was 29%
shorter in DMD compared to CTRL. Lf/Lm was 29% longer in DMD (P<0.01).
Conclusions: Unlike previous data in children with DMD, our results show significant atrophy in adult
males with DMD, and no change in Lf or θ. The shorter Lm may have implications for joint flexibility.
Key Words: Duchenne Muscular Dystrophy, Atrophy, Gastrocnemius, Muscle Architecture,
Ultrasonography.
3
Introduction
Duchenne muscular dystrophy (DMD) is characterised by an absence of dystrophin, a cytoskeletal
protein that is normally found on the sarcolemma membrane of striated muscle 1. Although the
genetic and molecular basis of DMD is well established, and the consequent decline in physical
function is well documented 2, there remains no comparison of skeletal muscle morphology in adults
with the condition.
Children with DMD present with a “pseudohypertrophy” of the quadriceps 3 and plantarflexors 4, an
apparent increase in muscle size associated with an accumulation of non-contractile material.
Specifically magnetic resonance imaging (MRI) scans reveal a larger Anatomical Cross Sectional Area
(ACSA-the area of the muscle compartment at right angles to the longitudinal axis of the muscle),
but with a composition that consists of a higher proportion of fat and connective tissue 3.
Interestingly however, this increase in ACSA appears to be muscle specific, and occurs to a lesser
extent in children over 11 yrs of age 4. At present there is only limited age matched comparisons of
muscle size between DMD and unaffected counterparts; however, murine muscle with reduced
dystrophin (MDX Mice) also shows a characteristic pseudohypertrophy of the limb muscles 5, 6, and
an associated impairment in muscle strength 7. In humans with DMD, there is currently no data to
describe the decline in muscle strength with changes in muscle size; however in other forms of
human muscular dystrophy, progression of the disease is associated with reductions in muscle size
and an associated worsening of motor disability scores 8. It is likely therefore, considering this
continuous loss of motor function in DMD, that a smaller contractile mass may be observed in adults
with the condition, however there are no direct comparisons of muscle mass between adults with
and without DMD.
The assessment of muscle architecture in pennate muscle allows for a more complete measure of
contractile area i.e. Physiological Cross Sectional Area (PCSA) considers the pennate arrangement of
fascicles within the muscle volume, whereas ACSA may underestimate the contractile area in a
pennate muscle 9. Furthermore, measurements of fascicle length and pennation angle allows for the
consideration of changes to the number of sarcomeres in series, and mechanical efficiency of the
fascicles within the muscle, respectively 10. Consistent with the lack of data on muscle size in adults
with DMD, there is no extant data on muscle architecture in adults with DMD. In MDX mice showing
pseudohypetrophy, pennation angle is reported to be increased 6, but with no difference in fascicle
length 7; a finding that is consistent with architectural adaptations following hypertrophy, secondary
to resistance training 11.
4
The medial head of the gastrocnemius (GM) muscle, is frequently investigated in regards to muscle
size and architectural characteristics (e.g. Fukunaga et al. 1992), and the validity of ultrasound
imaging techniques are well established in this muscle 13. Based on previous reports in children, it is
not clear whether adults with DMD will present with larger GM muscle size and architecture
resulting from pseudohyportrophy (Jones et al. 1983; Mathur et al. 2010); or whether the lower
levels of physical activity in DMD 14, will result in a disuse related atrophy of the GM, as has been
observed in otherwise healthy adult males who have experienced disuse following lower limb injury
15. However, as mentioned the muscle architecture and size of the GM is unreported in adults with
DMD.
Therefore, the aim of the present investigation was to compare the muscle size and architectural
characteristics of the GM muscle in a group of adult males with and without DMD. We hypothesise
that based on the observation that although pseudohypertrophy is observed in children with DMD,
atrophy may be present in adults with the condition, as a trend towards atrophy has been reported
in older children with DMD, compared to younger children 4.
Materials and Methods
Eleven healthy young men [age: 22.1 ± 0.9 years (range 22-24 years), height: 1.84 ± 0.09 m, mass:
83.8 ± 11.3 kg, mean ± SD] and 11 non-ambulatory men diagnosed with DMD [age: 24.6 ± 5.43 years
(range 20-38 years), height: 1.67 ± 0.10 m, mass: 67.0 ± 17.6 kg] volunteered to participate in this
study. All control participants (CTRL) self-reported as being recreationally active (undertaking no
more than 1 hour of “moderate” physical activity per week) and not undertaking any structured
training regime. Ethical approval was obtained through the Department of Exercise and Sport
Science, Manchester Metropolitan University and all participants signed informed consent prior to
taking part in the study. All procedures complied with the latest revision of the Declaration of
Helsinki World Medical 16.
Procedures
Participants were tested in a single session; the DMD group were recruited and tested at The
Neuromuscular Centre (Winsford, UK) and the Control group were tested at MMU (Cheshire, UK).
Ultrasound scans were recorded using a portable device for the DMD participants (MyLab25, Esaote
Biomedica, Genoa, Italy) and a free standing device for the control participants (AU5 Harmonic,
Esaote Biomedica, Genoa, Italy). All tests were taken from the self-reported dominant limb in all
participants.
Anthropometric measures
5
In the control group stature and mass were measured using a wall mounted stadiometer
(Harpenden stadiometer, Holtain Crymych, UK) and digital scales (Seca model 873, Seca, Germany)
respectively. In the DMD group, stature was assessed using point to point (index finger, elbow,
shoulder and across midline) span, and were weighed in a set of seated scales. In order to account
for the known discrepancy between standing height and arm span measures, a correction was
applied consistent with regression data from adult Caucasian males, the known error of making this
correction is 3.5% 17. Participant height is presented as this corrected value.
Muscle Volume
A real-time B-mode ultrasound was used to measure the ACSA at three points along the length of
the GM muscle, from which muscle volume and PCSA were calculated. ACSA was measured using
transverse plane ultrasound scans (7.5-MHz linear array probe) at 25, 50 and 75% of GM muscle
length (Lm). GM Lm was measured using a tape measure over the skin as the distance from the
visible origin of the GM at the posterior aspect of the femur to the distal formation of the
myotendinous junction, identified using sagittal plane ultrasonography. Due to the limited mobility
within the knee and ankle joint of the DMD group, all participants (DMD and Control) remained
seated throughout ultrasound testing (both for volume and architecture measurement), with the
dominant leg raised and supported so the hip and ankle were in alignment.
Strips of echoabsoptive tape (Transpore, 3M, USA) were placed longitudinally across the GM over
the three regions of interest (25, 50 and 75% muscle length), at approximately 3.5 cm intervals.
These strips of tape were used as echo absorptive markers that project a shadow onto the
ultrasound image to provide a positional reference into the scanned structures. With the probe in a
transverse plane, a digital recording of the probe moving from the medial to the lateral border of the
GM was obtained. Consistent, minimal pressure was placed on the muscle during scanning to avoid
compression of the muscle. The ultrasound was recorded in real time onto a PC at 25 frames per
second (Adobe Premier pro Version 6). At each 3.5 cm interval, individual images were acquired
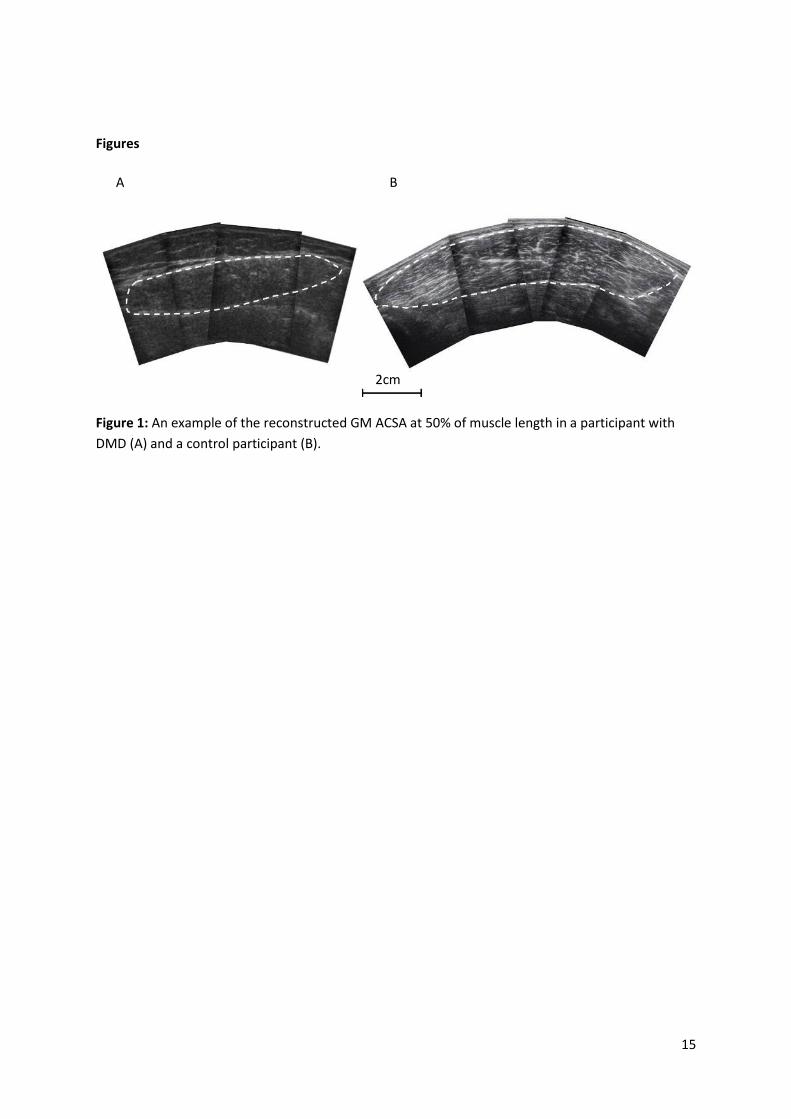
using capturing software (Adobe Premier Elements, version 10). The shadows casted by the echo-
absorptive markers allowed the images to be aligned by the contour of the muscle and the entire
GM ACSA to be recreated in a single image (Adobe Photoshop Elements, version 10, Figure 1). The
GM ACSA was then measured using digitising software (ImageJ 1.45, National Institutes of Health,
USA). This method for using ultrasound to measure ACSA has previously been accepted as reliable
and valid when compared to MRI, with a reported interclass correlation between 0.998 and 0.999,
for reliability and validity respectively 18.
6
GM muscle volume (VOL) was calculated from the three ACSA measurements by adopting the
truncated cone method 18, 19. Three ACSA measures were taken at 25, 50 and 75% of GM muscle
length (ACSA25%, ACSA50%, and ACSA75%, respectively), as previous estimates of muscle volume
have been shown to be improved with multiple rather than single ACSAs 20. Volumes for the GM
regions between 0-25% and 75-100% of GM muscle length (Lm) were calculated assuming a conical
volume VOL = 1/3 ACSALm 0-25%. The GM volume between 25-50% and 50-75% of GM Lm were
calculated using the truncated cone approach e.g:
GM VOL was then calculated as the sum of the segment volumes along the length of the GM (0-
25,25-50,50-75,75-100% Lm).
Muscle architecture
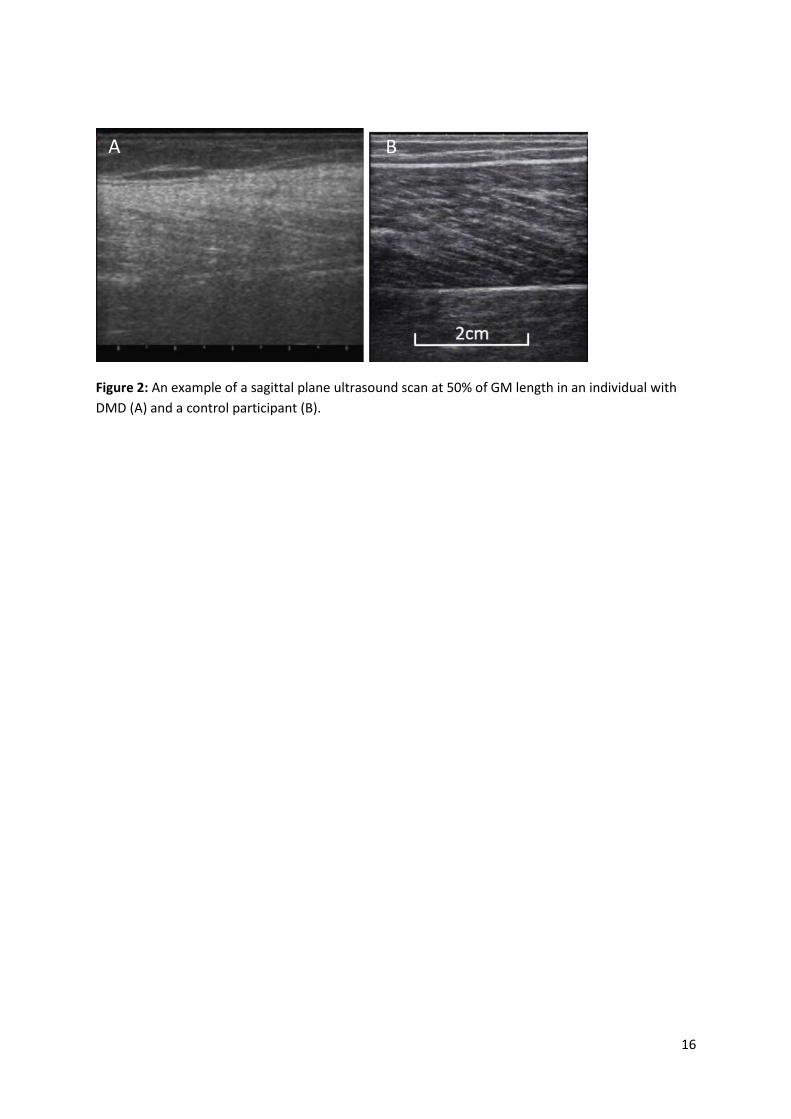
Resting fascicle length (Lf) and pennation angle (θ) were measured using B-Mode, real time
ultrasonography, as shown in Figure 2. A scan of the muscle fascicles was obtained for the GM along
the mid-sagittal plane at the mid-distance between the proximal and distal tendon insertion and the
muscle borders. The head of the probe was held perpendicular to the dermal surface to show both
the superficial and deep aponeuroses and a number of clearly visible fasciculi that could be followed
between each aponeuroses. Water-soluble transmission gel was placed over the ultrasound probe
head to improve acoustic coupling. GM and Achilles tendon muscle-tendon unit (MTU) length was
measured using sagittal plane scans to identify the distance from the GM myotendinous junction, to
the insertion of the Achilles tendon into the calcaneus 21, this distance was then added to GM Lm.
GM PCSA was estimated as GM VOL/Lf consistent with Maganaris, Baltzopoulos 22.
Statistics
IBM SPSS Statistics 21 software was used to analyse the data. All data are presented as mean ± SD.
All variables showed homogeneity of variance (Levene’s test, P>0.05); only pennation angle violated
the parametric assumption of normal distribution (Shapiro-Wilk test, P < 0.05), all other variables
were normally distributed. Differences between the two groups [DMD and healthy controls] were
analysed using an independent Students t-test. However, as pennation angle failed to satisfy a
normal distribution, differences between the two groups were analysed using an independent
Mann-Whitney U test.
7
In order to assess the impact of height as a covariate, ANCOVA was performed following a regression
analysis between all dependent variables and stature.
The critical level of statistical significance was set at 5%.
Results
DMD participants demonstrated significant differences in height (-9.0 %) and mass (-20.0 %)
compared to CTRL participants (P<0.05). There was no difference in the age of the participant
groups.
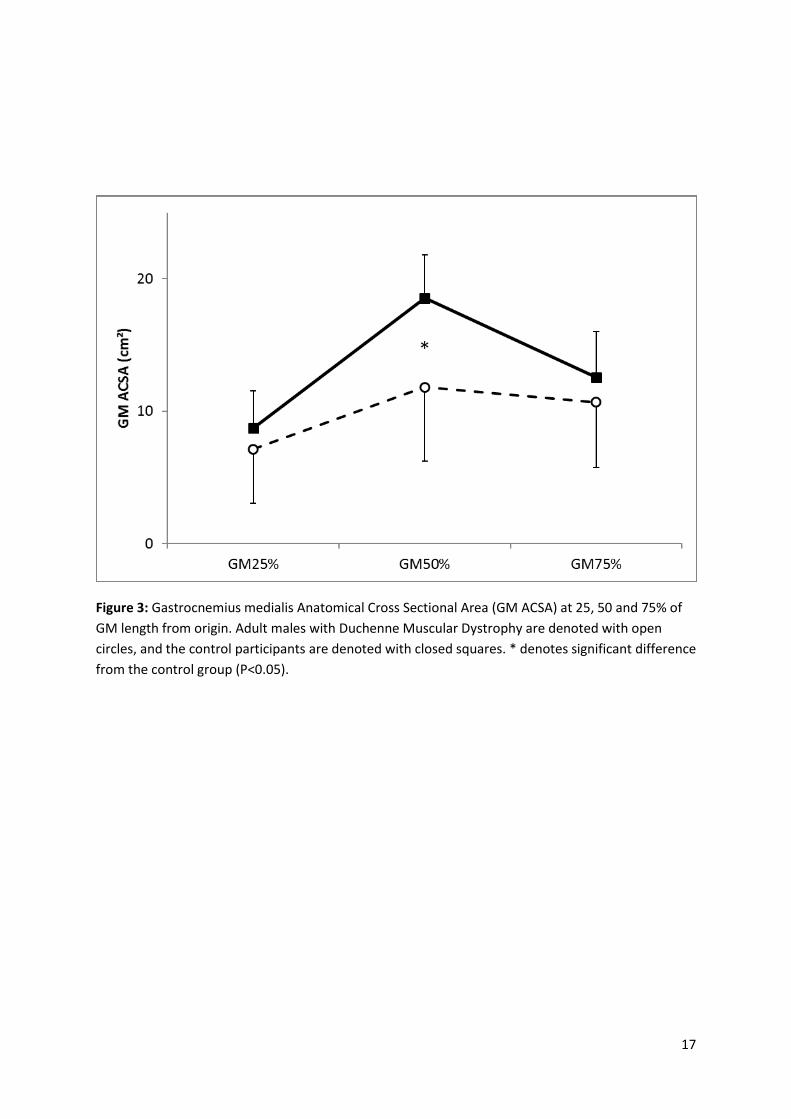
GM ACSA was 36.3% smaller in the DMD group compared to the CTRL participants at 50% of GM Lm,
(P<0.01, Figure 3). There was no significant difference in GM ACSA between DMD and CTRL
participants at 25% or 75% of GM length (Figure 3).
The GM length was 28.8% shorter in the DMD participants (P<0.01, Table 1), and the GM muscle-
tendon unit length was 10.3% shorter in the DMD participants compared to control participants
(P<0.01, Table 1). The relative contribution of the GM muscle to the MTU length as a whole was
significantly less in DMD (38.1 ± 3.8%) compared to control participants (47.7 ± 3.4%, P<0.01, Table
1).
GM muscle architectural parameters Lf and θ were not significantly different between the two
participant groups (Table 1). However, Lf relative to Lm was 29.4% longer in the DMD participants
compared to the control group (Table 1, P<0.01).
GM Volume was 47.0% smaller in the DMD group compared to the CTRL group (P<0.01, Table 1). GM
PCSA was 43.1% smaller in the DMD participants compared to the control participants (Table 1,
P<0.01).
ANCOVA was performed on the four dependent variables that achieved a significant correlation with
participant height (Table 2). All four variables (GM ACSA50%,GM VOL, GM PCSA and GM Lm)
remained significantly different between the DMD and CTRL participants when height was included
as a covariable (P<0.05).
8
Discussion
The main findings from this study have shown that adult males with DMD demonstrate significantly
smaller GM muscle size (ACSA50%, VOL and PCSA) than age matched males without muscular
dystrophy. Furthermore, the adult males with DMD showed no significant differences in absolute
GM fascicle length or pennation angle, but a significantly smaller GM muscle length, and as a result,
a larger GM fascicle: muscle length ratio.
In the present study, all measures of GM muscle size (ACSA50%, VOL and PCSA) were significantly
smaller in DMD compared to controls. This represents the first data on muscle size from an adult
population with DMD, and surprisingly, is the first to report atrophy in adults with DMD. This
observation of smaller muscle size is in contrast to previous data that has consistently reported
larger muscle size in children 3 and MDX mice 5, 7. In children, the “pseudohypertrophy” of DMD
muscle is attributed to the accumulation of fat and connective tissue within the muscle
compartment 3. Although speculative at present, the current observation of a smaller muscle size in
adults with DMD is consistent with the stem cell exhaustion model of muscle regeneration in mdx
mice 23. The previous reports of pseudohypertrophy in children with DMD is likely to correspond
with a period of elevated inflammatory cell infiltration 24, cycles of muscle cell degeneration and
regeneration in their remaining muscle 23, and corresponds with an accumulation of fat and non-
contractile material within this muscle 25. As the disease progresses with age, there is evidence of
muscle wasting in adult mice, which corresponds with a decline in muscle stem cell regenerative
capacity 23. It is possible therefore, that the smaller muscle size observed in the GM in the present
study represents the progression of the dystrophic condition, rather than an anomaly when
compared to the pseudohypertrophy observed in children with DMD, where the atrophying muscle
is offset by the elevated inflammatory response and accumulation of non-contractile material 3.
The architectural data obtained from the present study was unexpected, but as with muscle size
there are no comparable data from adult population groups with DMD. In MDX mice, consistent with
the fascicle data from the present study, fibre length appears to be unaltered from healthy age
matched mice 7. It is possible that the pseudohypertrophy from the MDX models contributes to both
the maintained fascicle length and the higher pennation angles reported from MDX data 6, but not
the adult humans in the present study. Indeed, in the present study, there is apparent proportionate
atrophy whereby architectural parameters are maintained in the presence of a smaller muscle size
and length.
9
Although there is no known extant data from adults or children with muscular dystrophy, the
present observation of no difference in GM Lf or θ, appears to be at odds with data from disuse
atrophy in adult humans. Given the known relationship between in series sarcomeres and muscle
length, it would be hypothesised that both muscle length and fascicle length would decline in unison
26. In contrast, here we have observed a relative shortening of the GM muscle length, with no change
in Lf and a relatively longer GM tendon. Similarly, based on previous observations from disuse
atrophy, both Lf and θ would be expected to reduce in accordance with a decrease in muscle volume
15. It is likely therefore, that the present observations are as a result of the seated position imposed
from the dystrophic condition, where participants have an almost constant knee- and dorsi- flexed
posture. It is known that sustained immobilisation with the MTU in a shortened position can result in
a shortening of MTU length 27 consistent with the observations from the present adult males with
DMD. However, in contrast with disuse data 15, the anomaly of GM length being shorter, with no
difference in Lf, may be explained by the biarticular nature of this muscle; whereby a knee flexed
position may result in a shortening stimulus from the proximal origin, with the extended
gastrocnemius tendon absorbing the stretch influence from the seated dorsiflexed ankle posture.
Indeed, Herbert and Crosbie 27, reported a relative shortening of proximal fascicle length, in the
presence of lengthening of the distal fascicles within the shortened MTU (albeit non-significantly
over the 14 day immobilisation period).
The speculative nature of the mechanisms of adaptation we have described from these initial
observations in the GM highlights the paucity of data at the in vivo level in humans with DMD. When
compared with the only other published data comparing muscle mass in children with and without
DMD 3, 4, our findings from the adult GM, suggest that at some point in development there is a
transition from pseudohypertrophy to atrophy, likely corresponding with the progression of the
dystrophic participants to powered wheel chairs, and a sustained seated posture. However, this
remains to be observed experimentally. Considering the progression of pseudohypertrophy towards
atrophy in DMD, it should be noted that three of the DMD participants included within our data
demonstrated GM ACSA at 25, and 75% of muscle length larger than means for both CTRL and DMD
participants. For example, compared to the controls these three DMD participants had 13% larger
GM ACSA, in contrast to the remaining DMD participants who’s GM ACSA at the equivalent muscle
length was 43% smaller. Future research should therefore consider the progression of muscle
atrophy into adulthood within DMD.
In the present study, height was 9% less in adult males with DMD compared to controls. This has
been consistently reported in children with DMD. For example, others 28-30 have reported
10
significantly shorter stature in boys with the dystrophic condition compared to age matched
counterparts. In order to account for height as a covariable, ANCOVA was performed, and although
height did have a significant correlation with ACSA50%, VOL, PCSA and Lm; the groups differences
persisted when included as a covariable. This would suggest that although associated with measures
of muscle size, accounting for height differences between the groups does not entirely account for
differences in muscle mass between the participants with and without muscular dystrophy in the
present study.
The clinical significance of changes in muscle architecture are often discussed considering the
functional implications associated with contractile properties of the muscle 10. Given the inability of
the adult Duchenne GM muscle to produce measurable forces, it is irrelevant to discuss the
functional significance of the present architectural findings as they pertain to muscle contraction,
and the production of contractile force. It is of greater relevance perhaps, to consider the
implications for joint range-of-motion in DMD. Children with DMD experience a loss of joint range of
motion 31, and undertake surgical interventions for this loss of flexibility in the lower limb 32; these
previous observations on a loss of range of motion may be consistent with our observations of a
shortened MTU in adult males with DMD, however this remains to be shown experimentally. As
previously mentioned, there remains no data on the architectural characteristics from the muscles
of adults with DMD. Our observations of a shortening of the MTU, and the GM muscle specifically
may provide the first experimental observations of a shortening within the MTU. However, there
are no in vivo measures of passive stiffness from the Duchenne MTU or the contribution of the
altered muscle mass or the in series elastic components of the MTU to limitations in flexibility from a
dystrophic population, similar to those we have made in other neuromuscular conditions e.g.33.
Furthermore, the smaller GM muscle mass reported in the DMD adults in the present study is likely
to have implications for resting energy expenditure and daily calorific requirements. If the reported
atrophy from the present study is indicative of other muscles around the body, this would
significantly reduce the daily energy requirements of adults with DMD beyond those expected from
a lack of physical activity, consistent with observations from children with DMD 34.
In conclusion, we have observed an atrophy in the GM muscle of adult males with DMD that is
indicative of the progressive nature of the condition rather than being at odds with previous data
reporting pseudohypertrophy in children with DMD. The architectural observations of a shortening
in GM muscle length, may provide a mechanism that contributes to the loss of joint range of motion
in children with the condition. However, it is apparent that as the first descriptive data from adult
11
muscle with DMD, a more complete picture of the longitudinal impairments to skeletal muscle is
needed from this population.
Acknowledgements: Mr J Smith received a postgraduate studentship from Dream it, Believe It,
Achieve it (Northwich, UK. Registered Charity Number: 1153116).
References
1. Hoffman, E.P., R.H. Brown, Jr., and L.M. Kunkel, Dystrophin: the protein product of the Duchenne muscular dystrophy locus. Cell, 1987:6: 919-28.
2. Blake, D.J., et al., Function and genetics of dystrophin and dystrophin-related proteins in muscle. Physiological reviews, 2002:2: 291-329.
3. Jones, D.A., et al., Size and composition of the calf and quadriceps muscles in Duchenne muscular dystrophy. A tomographic and histochemical study. Journal of the neurological sciences, 1983:2: 307-22.
4. Mathur, S., et al., Age-related differences in lower-limb muscle cross-sectional area and torque production in boys with Duchenne muscular dystrophy. Archives of physical medicine and rehabilitation, 2010:7: 1051-1058.
5. Lynch, G.S., et al., Force and power output of fast and slow skeletal muscles from mdx mice 6-28 months old. J Physiol, 2001:Pt 2: 591-600.
6. Lovering, R.M., et al., Architecture of healthy and dystrophic muscles detected by optical coherence tomography. Muscle Nerve, 2013:4: 588-90.
7. Dellorusso, C., et al., Tibialis anterior muscles in mdx mice are highly susceptible to contraction-induced injury. Journal of muscle research and cell motility, 2001:5: 467-75.
8. Nakayama, T., et al., Estimation of net muscle volume in patients with muscular dystrophy using muscle CT for prospective muscle volume analysis: an observational study. BMJ Open, 2013:10: e003603.
9. Alexander, R.M. and A. Vernon, The dimensions of knee and ankle muscles and the forces they exert. Journal of Human Movement Studies, 1975:1: 115-123.
10. Lieber, R.L. and J. Friden, Clinical significance of skeletal muscle architecture. Clin Orthop Relat Res, 2001:383: 140-51.
11. Morse, C.I., et al., Gastrocnemius specific force is increased in elderly males following a 12-month physical training programme. Eur J Appl Physiol, 2007:5: 563-70.
12. Fukunaga, T., et al., Physiological cross‐sectional area of human leg muscles based on magnetic resonance imaging. Journal of Orthopaedic Research, 1992:6: 926-934.
13. Kwah, L.K., et al., Reliability and validity of ultrasound measurements of muscle fascicle length and pennation in humans: a systematic review. Journal of Applied Physiology, 2013:6: 761-769.
14. McDonald, C.M., et al., Use of step activity monitoring for continuous physical activity assessment in boys with Duchenne muscular dystrophy. Archives of physical medicine and rehabilitation, 2005:4: 802-808.
15. Narici, M. and P. Cerretelli, Changes in human muscle architecture in disuse-atrophy evaluated by ultrasound imaging. J Gravit Physiol, 1998:1: P73-4.
16. Association, W.M., World Medical Association Declaration of Helsinki: ethical principles for medical research involving human subjects. JAMA, 2013:20: 2191-4.
12
17. Reeves, S., C. Varakamin, and C. Henry, The relationship between arm-span measurement and height with special reference to gender and ethnicity. European Journal of Clinical Nutrition, 1996:6: 398-400.
18. Reeves, N.D., C.N. Maganaris, and M.V. Narici, Ultrasonographic assessment of human skeletal muscle size. Eur J Appl Physiol, 2004:1: 116-8.
19. Morse, C.I., H. Degens, and D.A. Jones, The validity of estimating quadriceps volume from single MRI cross-sections in young men. Eur J Appl Physiol, 2007:3: 267-74.
20. Nordez, A., et al., Comparison of methods to assess quadriceps muscle volume using magnetic resonance imaging. Journal of Magnetic Resonance Imaging, 2009:5: 1116-1123.
21. Maganaris, C.N., Validity of procedures involved in ultrasound-based measurement of human plantarflexor tendon elongation on contraction. J Biomech, 2005:1: 9-13.
22. Maganaris, C.N., et al., In vivo specific tension of human skeletal muscle. Journal of applied physiology, 2001:3: 865-872.
23. Sacco, A., et al., Short telomeres and stem cell exhaustion model Duchenne muscular dystrophy in mdx/mTR mice. Cell, 2010:7: 1059-71.
24. Chen, Y.W., et al., Early onset of inflammation and later involvement of TGFbeta in Duchenne muscular dystrophy. Neurology, 2005:6: 826-34.
25. Greco, S., et al., Common micro-RNA signature in skeletal muscle damage and regeneration induced by Duchenne muscular dystrophy and acute ischemia. FASEB J, 2009:10: 3335-46.
26. Williams, P. and G. Goldspink, Changes in sarcomere length and physiological properties in immobilized muscle. Journal of Anatomy, 1978:Pt 3: 459.
27. Herbert, R. and J. Crosbie, Rest length and compliance of non-immobilised and immobilised rabbit soleus muscle and tendon. European journal of applied physiology and occupational physiology, 1997:5: 472-479.
28. Crabtree, N.J., et al., Regional changes in bone area and bone mineral content in boys with Duchenne muscular dystrophy receiving corticosteroid therapy. The Journal of pediatrics, 2010:3: 450-455. e1.
29. Söderpalm, A.-C., et al., Low bone mineral density and decreased bone turnover in Duchenne muscular dystrophy. Neuromuscular Disorders, 2007:11: 919-928.
30. King, W.M., et al., Skeletal health in Duchenne dystrophy: Bone‐size and subcranial dual‐energy X‐ray absorptiometry analyses. Muscle & nerve, 2014:4: 512-519.
31. Bartels, B., et al., Upper limb function in adults with Duchenne muscular dystrophy. Journal of Rehabilitation Medicine, 2011:9: 770-775.
32. Sussman, M., Duchenne muscular dystrophy. Journal of the American Academy of Orthopaedic Surgeons, 2002:2: 138-151.
33. Hussain, A.W., et al., Passive stiffness of the gastrocnemius muscle in athletes with spastic hemiplegic cerebral palsy. Eur J Appl Physiol, 2013:9: 2291-9.
34. Hankard, R., et al., Resting energy expenditure and energy substrate utilization in children with Duchenne muscular dystrophy. Pediatric research, 1996:1: 29-33.
13
Tables
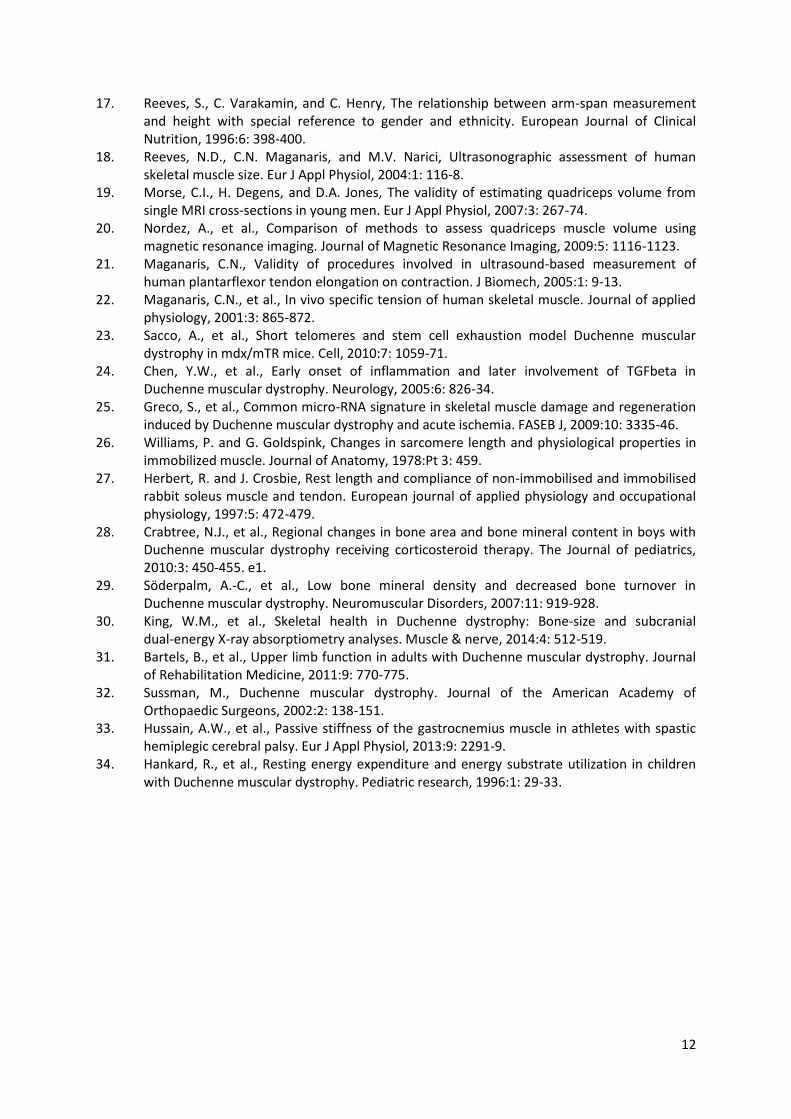
Table 1. Gastrocnemius Medialis (GM) muscle morphology and architecture from adult males.
DMD Control
GM Lm (cm) 18.6 ± 1.4* 26.2 ± 2.6
MTU Length (cm) 49.1 ± 3.9* 54.7 ± 2.6
GM Volume (cm3) 124 ± 57 * 234 ± 49
Lf (cm) 5.33 ± 0.72 5.77 ± 1.02
θ (deg) 27.0 ± 7.27 24.9 ± 6.5
GM Lf/Lm 0.29 ± 0.04 * 0.22 ± 0.04
GM PCSA (cm2) 23.5 ± 11.1* 41.3 ± 9.6
Values are means ± SD. * P < 0.01 significant difference from controls.
DMD, Duchenne Muscular Dystrophy; Lf, fascicle length; θ, fascicle pennation angle; Lm,
muscle length; MTU, muscle-tendon unit; PCSA, Physiological cross sectional area.
14
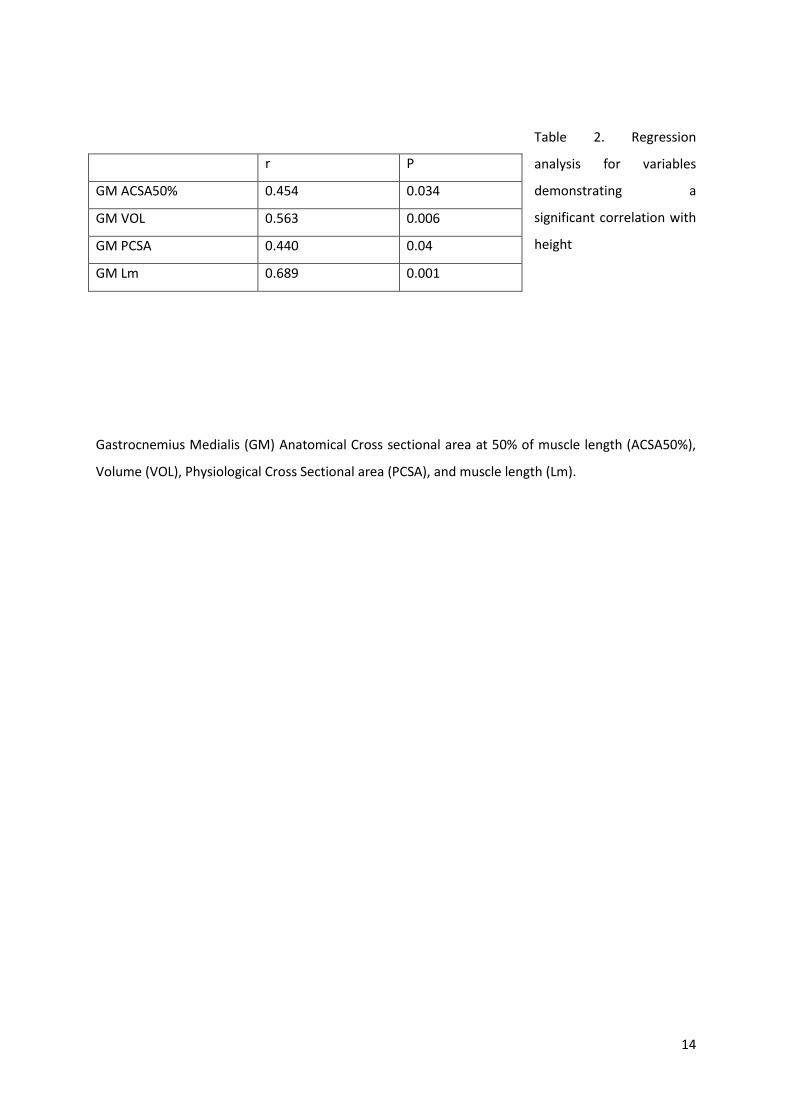
Table 2. Regression
analysis for variables
demonstrating a
significant correlation with
height
Gastrocnemius Medialis (GM) Anatomical Cross sectional area at 50% of muscle length (ACSA50%),
Volume (VOL), Physiological Cross Sectional area (PCSA), and muscle length (Lm).
r P
GM ACSA50% 0.454 0.034
GM VOL 0.563 0.006
GM PCSA 0.440 0.04
GM Lm 0.689 0.001
15
Figures
Figure 1: An example of the reconstructed GM ACSA at 50% of muscle length in a participant with
DMD (A) and a control participant (B).
A B
2cm
16
Figure 2: An example of a sagittal plane ultrasound scan at 50% of GM length in an individual with
DMD (A) and a control participant (B).
A B
17
Figure 3: Gastrocnemius medialis Anatomical Cross Sectional Area (GM ACSA) at 25, 50 and 75% of
GM length from origin. Adult males with Duchenne Muscular Dystrophy are denoted with open
circles, and the control participants are denoted with closed squares. * denotes significant difference
from the control group (P<0.05).


![· Stretching group, static stretching of the gastrocnemius muscle was performed for 30 seconds 15 minutes after exercise. [Results] On the first day, muscle hardness prior to exercise](https://img.pdfslide.net/doc/110x75/5e1b738ab9e96c65bc59e51b/stretching-group-static-stretching-of-the-gastrocnemius-muscle-was-performed-for.jpg)