Embed Size (px)
Citation preview
Using Phylogenomic Patterns and Gene Ontology toIdentify Proteins of Importance in Plant Evolution
Angelica Cibrian-Jaramillo*,�,1,2, Jose E. De la Torre-Barcena�,3, Ernest K. Lee1, Manpreet S. Katari3,Damon P. Little2, Dennis W. Stevenson2, Rob Martienssen4, Gloria M. Coruzzi3, and Rob DeSalle1
1Sackler Institute for Comparative Genomics, American Museum of Natural History, New York, New York2Molecular Systematics, The New York Botanical Garden, Bronx, New York3Center for Genomics and Systems Biology, Department of Biology, New York University4Cold Spring Harbor Laboratory, Cold Spring Harbor, New York
*Corresponding author: E-mail: [email protected].
�These authors contributed equally to this work.
Accepted: 14 March 2010
Abstract
We use measures of congruence on a combined expressed sequenced tag genome phylogeny to identify proteins that have
potential significance in the evolution of seed plants. Relevant proteins are identified based on the direction of partitioned
branch and hidden support on the hypothesis obtained on a 16-species tree, constructed from 2,557 concatenated
orthologous genes. We provide a general method for detecting genes or groups of genes that may be under selection in
directions that are in agreement with the phylogenetic pattern. Gene partitioning methods and estimates of the degree and
direction of support of individual gene partitions to the overall data set are used. Using this approach, we correlate positive
branch support of specific genes for key branches in the seed plant phylogeny. In addition to basic metabolic functions, such
as photosynthesis or hormones, genes involved in posttranscriptional regulation by small RNAs were significantly overre-presented in key nodes of the phylogeny of seed plants. Two genes in our matrix are of critical importance as they are
involved in RNA-dependent regulation, essential during embryo and leaf development. These are Argonaute and the RNA-
dependent RNA polymerase 6 found to be overrepresented in the angiosperm clade. We use these genes as examples of our
phylogenomics approach and show that identifying partitions or genes in this way provides a platform to explain some of the
more interesting organismal differences among species, and in particular, in the evolution of plants.
Key words: phylogenomics, orthologs, partition metrics, gene ontology, micro-RNAs, small interfering RNAs.
Introduction
The integration of evolution and genomics has been advo-
cated for many years as a fruitful and convenient feedback
relationship (Eisen 1998; Eisen and Wu 2002; Mitchell-Olds
and Clauss 2002; DeSalle et al. 2003). Phylogenomics,
originally defined as a combination of phylogenetic tree
construction, integration of experimental data and differen-
tiation between orthologs and paralogs, has been proposed
to improve predictions of gene function (Eisen 1998; Eisen
and Fraser 2003; Sjolander 2004; Brown and Sjolander
2006). This area of scientific endeavor has gradually evolved
as a broader concept that encompasses all the key aspects
that characterize the symbiosis between systematics and
genomics. Such phylogenomic approaches include orthology
determination through phylogeny (Chiu et al. 2006;
Paramvir and Jeffrey 2006) and phylogenetic shadowing
the use of character state reconstruction analysis of genefunction (Thornton et al. 2003; Bridgham et al. 2007; Dean
and Thornton 2007) and evolutionary analysis of rates and
patterns of gene evolution (Eisen 1998; Eisen and Fraser
2003). Phylogenomic approaches can greatly enhance our
understanding of difficult problems and improve the predic-
tion of, for instance, terminal or small exons, microRNA
(miRNA) precursors, and small peptide-encoding open read-
ing frames or combine gene prediction with expression and/or homology information to identify conserved gene candi-
dates between two or more genomes and/or identification
of novel coding regions and splice variants (Windsor and
Mitchell-Olds 2006).
ª The Author(s) 2010. Published by Oxford University Press on behalf of the Society for Molecular Biology and Evolution.
This is an Open Access article distributed under the terms of the Creative Commons Attribution Non-Commercial License (http://creativecommons.org/licenses/by-nc/
2.5), which permits unrestricted non-commercial use, distribution, and reproduction in any medium, provided the original work is properly cited.
Genome Biol. Evol. 2:225–239. doi:10.1093/gbe/evq012 Advance Access publication March 24, 2010 225
GBE by on M
ay 27, 2010 http://gbe.oxfordjournals.org
Dow
nloaded from

To date, traditional phylogenomic studies concentrate onthe search for orthology groups in gene family trees to infer
the function of unknown proteins, yet the use of such phy-
logenies to ascertain the function of the encoded proteins is
overlooked. In particular, the potential to uncover insights
into gene function by simultaneous character analysis of
large multigene (or genome-wide) phylogenies has been
less explored. Characters from different data sets are tradi-
tionally used to produce a phylogeny by total evidence ap-proaches (Kluge 1989), conditional combination of data sets
(Bull et al. 1993), and taxonomic congruence (Nelson 1979).
Gatesy et al. (1999) point out that there is little consensus on
how conflict among data sets is quantified in traditional and
even more recent methods (see references within) and
propose a set of phylogenetic metrics that measure the con-
gruence of gene partitions and individual characters in a phy-
logenetic analysis that focuses on variations of methods toassess support or conflict for a particular branch.
In the present study, we suggest that congruence meas-
ures of character evolution such as consistency, degree of
support, and hidden support as described by Gatesy et al.
(1999) are useful in mining genomes for patterns of protein
function, and we demonstrate their use in plants. We are
mostly concerned with partitioned branch support (PBS)
(Baker and DeSalle 1997) and partitioned hidden branchsupport (PHBS) (Gatesy et al. 1999) and their use in the as-
sessment of the overall contribution (positive, negative, or
neutral) of a particular gene to the various branches or no-
des in a phylogenetic hypothesis. The Gatesy et al. (1999)
review came at a time when systematists were using at most
20 gene partitions and perhaps a single morphological par-
tition in their analyses. With the onslaught of genome level
sequencing and large expressed sequenced tag (EST) studiesin the past years, the number of gene partitions and ways of
partitioning phylogenetic information have expanded
greatly. In this study, we use measures of branch support
to identify proteins and characters that may have functional
significance in the evolution of seed plants based on the di-
rection of their support from the concatenated hypothesis
obtained in a seed plant phylogenomic tree, constructed
from 2,557 orthologous genes spanning 16 species.
Materials and Methods
Phylogenetic Hypothesis and Orthology Determina-tionWe used a combination of amino acid sequences from
whole genomes and EST projects (table 1) to extend a previ-
ously published phylogeny of seed-free and seed plants(De la Torre-Barcena et al. 2009). We assembled a matrix of
all availablegenomic andESTdata to date for16 plant species
that includes the following 11 seed plants: five angiosperms
(Amborella, rice,Arabidopsis, poplar, andgrape)andsixgym-
nosperms (Cryptomeria, pine, two cycads, gingko, Gnetum,
and Welwitschia) and four seed-free plants: Filicalian fern
(Adiantum), a thalloid liverwort (Marchantia), a moss (Phys-comitrella), and a Lycophyte (Selaginella).
To construct this matrix, we established orthology ofgenes using the OrthologID platform first (Chiu et al.
2006) http://nypg.bio.nyu.edu/orthologid, which uses an
automated approach to sort query sequences into gene
family membership and determines sets of orthologs from
the gene trees. All ortholog groups reflecting coded
genes were then assembled into a concatenated matrix
of 1,062,841 amino acids representing 2,557 proteins (re-
ferred to as genes thereafter), with delineated data parti-tions for each gene in NEXUS format using the ASAP
program (Sarkar et al. 2008). Because orthology is not nec-
essarily a one-to-one relationship, a gene from one species
can be orthologous to multiple genes from another species,
which is often true in plants due to gene and genome du-
plications. In these cases, only one of the equally valid ortho-
logs were selected for inclusion in the matrix (Box 1). Indeed,
the phylogenetic method (OrthologID) we used to select setsof orthologs for analysis works the same regardless of the
number of duplications and as a result should be unbiased
with respect to the branches that have undergone genome
duplication. We only included partitions with at least two
gymnosperms to ensure even representation across angio-
sperms and gymnosperms.
A maximum parsimony tree was generated using all con-
catenated genes in a simultaneous analysis (SA) and individ-ually (partitioned data). Parsimony analysis was performed in
PAUP* 4b10 using equal weights (Swofford 2003). Branch
support was evaluated using the nonparametric bootstrap
and jackknife methods in PAUP (Felsenstein 1985; Farris
et al. 1996). This tree complements previously published
Table 1
Species List and Corresponding Genomic Databases
Species Genomic Database
Adiantum capillus-veneris TIGR, PlantTA
Amborella trichopoda TIGR, PlantTA
Arabidopsis thalianaa TAIR
Cryptomeria japonica TIGR, PlantTA
Cycas rumphii CSHL, TIGR, PlantTA
Ginkgo biloba CSHL, TIGR, PlantTA
Gnetum gnemon CSHL, TIGR, PlantTA
Marchantia polymorpha JCVI
Oryza sativaa JGI
Pinus taeda TIGR, PlantTA
Populus trichocarpaa JGI
Selaginella moellendorffii TIGR, PlantTA
Vitis viniferaa Genoscope
Welwitschia mirabilis TIGR, PlantTA
Zamia fischeri CSHL, TIGR, PlantTA
aComplete genomes: TIGR, http://www.tigr.org/tdb/e2k1/ath1; PlantTA, http://
plantta.jcvi.org; CSHL, http://www.cshl.edu; JCVI, http://www.jcvi.org; JGI, http://
www.jgi.doe.gov; Genoscope, http://www.genoscope.cns.fr/spip.
Cibrian-Jaramillo et al. GBE
226 Genome Biol. Evol. 2:225–239. doi:10.1093/gbe/evq012 Advance Access publication March 24, 2010
by on May 27, 2010
http://gbe.oxfordjournals.orgD
ownloaded from

likelihood and parsimony trees constructed with a matrix with
fewer partitions (De la Torre-Barcena et al. 2009).
By simultaneously incorporating multiple genes, we min-
imize the risk of retrieving a topology that reflects the history
of a single gene or gene family. Furthermore, new genes and
new taxa can be added to our pipeline, allowing the inte-
gration of rapidly generated genomic data from public data-bases. We use an SA approach (Nixon and Carpenter 1996)
that is equivalent to a concatenated analysis at the genome
level (Rokas et al. 2003). With this approach, we are finding
the most parsimonious tree (MPT) through character con-
gruence first and then using the partitions to say something
about their function. The delineation of data partitions al-
lows the contribution of a gene (partition) to a branch to
be assessed using congruence measures of support. Thesemeasures are calculated per branch (see next section). As
with all phylogenetic reconstructions, a tree represents a hy-
pothesis of species relationships. However, we have the
most robust solution (100% bootstrap at each branch) given
the data available for plants; indeed, our results do not con-
tradict any of the major phylogenies to date (see Discussion).
Evaluation of Character Evolution Using the SeedPlant Phylogenetic HypothesesWe used ASAP and a customized Perl script to calculate in-
dividual tree statistics such as the total number of characters,
the number of phylogenetically informative characters, the
consistency index (CI), retention index (RI), rescaled consis-
tency (RC) index, and the variations of traditional Bremer
support. These values measure the stability of a group (clade)
by quantifying the difference in character steps (tree length)between a tree containing a group of interest and a similar
tree where this group is absent. High positive Bremer Sup-
port (BS) values reflect the stability or robustness of the
group in question. Modified elaborations of Bremer sup-
port—PBS and PHBS (Baker and DeSalle 1997; Gatesy
et al. 1999)—apply Bremer support metrics to trees con-
structed from combining data from various sources (e.g.,
morphological and DNA, mitochondrial and nuclear DNA,or genes/proteins from different functional categories),
whereby the contribution of particular/individual data sets
(partitions) can be evaluated to measure the stability of re-
lationships in the context of the SA of concatenated data
sets.
By definition, for a particular combined data set, a partic-
ular node (branch) and a particular data partition, PBS is the
minimum number of character steps for that partition on theshortest topologies for the combined data set that do not
contain that node minus the minimum number of character
steps for that partition on the shortest topologies for the
combined data set that do contain that node (Baker and
DeSalle 1997). PHBS is the difference between PBS for that
data partition and the Bremer support value (Bremer 1988,
1994) for that node for that data partition (Gatesy et al.
1999). Values for these metrics can be positive, zero, or neg-ative, and the value indicates the direction of support for the
overall concatenated hypothesis: positive lends support,
zero is neutral, and negative gives conflicting support
(Gatesy et al. 1999) (Summarized in Box 2).
Distribution of GO Categories with PhylogeneticRelevanceWe established a Gene Ontology (GO) term based on orthol-ogy with an Arabidopsis chromosome/AIG number using
the current TAIR v8 database (http://www.
arabidopsis.org, accessed 1 February, 2009). To compare
the extent of sampling in our matrix with the Arabidopsisgenome, we mapped the distribution of our genes with
all of their counts onto the annotated Arabidopsis genes
and then compared the distribution of each main GO cat-
egory in the Arabidopsis genome to our GO distribution.As mentioned, an SA of a particular matrix, in this case of
seed and seed-free plants, reveals relationships that may not
be supported by any of the separate analyses (individual
genes). In this context, we were particularly interested in
determining if the branches contain an enrichment, or
Box 1. Establishing Orthology
For equally orthologous genes from the same spe-
cies, only one is picked (with equal probability) for in-
clusion in the SA matrix. For instance, in the following
rooted gene tree:
ðA1; ððB1; B2Þ; ðC1;C2ÞÞÞ
where A, B, and C represent different species, A1 is
orthologous to B1, B2, C1, and C2; B1 is orthologous
to A1, C1, and C2, etc. In this case, (A1, B1, C1) could
be chosen to be included in the SA matrix. Other com-
binations, such as (A1, B2, C1), would be equally valid
from a phylogenetic standpoint. In fact, this points to
the strength of our tree-based analysis using Ortho-
logID, as opposed to reciprocal-best-hit-based meth-ods which may not identify the genes above as
orthologous if, for instance, B1’s best hit is A1,
whereas A1’s best hit is B2. It is certainly true that ESTs
included in our analysis may include multiple alleles for
a single gene. However, these multiple alleles will
likely show up as orthologous to the same set of
genes, in which case they would be indistinguishable
from duplicated genes. They are therefore treated thesame ways as ‘‘many-to-many’’ orthologs, where one
of the equally orthologous genes from each species is
chosen to be included in the SA matrix. In the example
above, either B1 or B2 can be chosen to be included in
the SA matrix whether they are duplicated genes or in
fact multiple alleles of the same gene.
Phylogenomics and Gene Function GBE
Genome Biol. Evol. 2:225–239. doi:10.1093/gbe/evq012 Advance Access publication March 24, 2010 227
by on May 27, 2010
http://gbe.oxfordjournals.orgD
ownloaded from

overrepresentation, of a certain molecular or biological
function allowing us to associate a molecular phenotypeto the branches. We searched for statistically overrepre-
sented GO categories to each of our partitions compared
with the distribution of that GO term in the Arabidopsis ge-
nome (null distribution). Because each branch is comprised
of partitions which represent genes that provide positive,
negative, or neutral support, we first grouped genes into
four sets: 1) genes that had a positive value for PBS (appar-
ent), 2) genes that had a positive value for PHBS (hidden)support, 3) genes with neutral PBS, and 4) genes with neu-
tral (zero) PHBS. We then compared these sets to set of
genes under that category in the Arabidopsis genome (this
is our null distribution) to identify which category contained
overrepresented GO terms. After culling to eliminate parti-
tions with too few taxa to provide phylogenetic resolution,
remaining neutral scores belong to partitions that presum-
ably have no impact on the phylogeny and have a minimalevolutionary signature for each branch; thus, providing a null
hypothesis of GO term overrepresentation and contribution
to a particular branch.
We used Sungear (Poultney et al. 2007), one of the tools
available in VirtualPlant (http://www.virtualplant.org), to
compare different sets of gene lists. Sungear allows for
the visual and statistical analysis of overlapping relationships
among different lists of data and Boolean combinations.Sungear can also be used to determine if there is a GO term
that is overrepresented in a given intersect, compared withthe distribution of that GO term in the Arabidopsis genome,
again as a null distribution. GO term overrepresentation is
measured by a z score (also known as standard or normal
score) representing the number of standard deviations
(SDs) a particular observation (i.e., number of genes) is
above or below the mean (Dudoit et al. 2004). Generally,
a score of ±7 is considered to be a threshold of significance
although when dealing with limited random subsets (suchas orthologous partitions derived from EST libraries), the in-
formation given by a negative score (underrepresentation) is
practically null. Sungear creates a polygon with vertices, or
anchors, which in this case correspond to a particular branch
in the phylogeny. The circles with arrows within the polygon
are called vessels, which represent genes with a positive zscore. The size of the vessel is proportional to the number
of genes contained within that subset. Vessels can be eithershared across branches or can be unique to a branch, and
this is easily visualized in the polygon.
We further investigated partitions with overrepresented
GO terms and positive PBS within the angiosperms, nodes
4–7, using the Biomaps tool (Wang et al. 2004) as imple-
mented in VirtualPlant. We compared the observed distribu-
tion of genes at each branch with the distribution of those
GOs terms associated to Arabidopsis genes found in the ma-trix, using a hypergeometric distribution and a P , 0.05 as
the limit for statistically significant terms.
Results
Our analysis of the phylogenomic matrix of amino acid se-
quences for 2,557 genes/partitions across 16 seed plant spe-
cies provided insights into the function of genes supportingkey branches. The concatenated matrix (1,062,841 amino
acid sites) with delineated data partitions for each gene
in NEXUS format is included in supplementary table 1 (Sup-
plementary Material online). A phylogenetic hypothesis on
the relationships among seed and nonseed plants was
generated with this matrix in a maximum parsimony frame-
work. We obtained a single MPT (fig. 1). The various support
parameters for each individual partition present in our dataset are shown in supplementary table 2 (Supplementary Ma-
terial online). The maximum parsimony (MP) tree shown in
figure 1 is identical in topology to that described in De la
Torre-Barcena et al. (2009), which resulted from both MP
and maximum likelihood (ML) analyses using fewer parti-
tions (1,200) and various combinations of ingroup and
outgroup taxa. A series of searches, with different combina-
tions of ingroup and outgroup taxa, were tested until fur-ther addition of taxa and sequences had no effect on
topology. These manipulations (as well as other details re-
garding phylogenetic analyses) are summarized in De la
Torre-Barcena et al. (2009). In this communication, we focus
only on the MP tree given that measures of congruence
Box 2. Congruence Measures of Support
Partitioned Bremer support localizes nodes at
which data partitions disagree, by indicating the con-
tribution of a particular data partition to the SA sup-
port at every node. Once the MPT using all data
partitions is calculated, PBS equals the length of a par-
tition of interest on the MPT minus the length of that
partition on the MPTwhere the supported clade is ab-sent. A positive PBS value indicates that the partition
provides support for the node. Negative PBS means
that the length of partition is shorter on an alternative
tree (i.e., that partition provides contradictory evi-
dence). The sum of PBS values for each data partition
always equals BS for combined data.
Hidden Bremer support (HBS) measures increased
support for a node in a combined analysis relative
to combined support in individual analyses of separate
partitions (1. 2, 3. . .).
HBS 5 BScombined � ðBS1 þ BS2 þ BS3 . . . Þ:
Partitioned HBS (PHBS) is the contribution of eachdata partition to HBS.
Cibrian-Jaramillo et al. GBE
228 Genome Biol. Evol. 2:225–239. doi:10.1093/gbe/evq012 Advance Access publication March 24, 2010
by on May 27, 2010
http://gbe.oxfordjournals.orgD
ownloaded from

apply only to a parsimony framework and that the recoveredtrees were identical with consistently high level of support
across optimality criteria (MP and ML).
There is always risk of homoplasy, resulting in an ‘‘in-
correct’’ phylogeny, which could bias the distribution of over-
represented genes that are at each node. However, this is
the case with any phylogenetic reconstruction, a phylogeny
is an informed hypothesis of species’ evolutionary history. A
robust phylogeny that reflects the true organismal relation-ships is alwaysdesired,but regardlessof the tree,our analyses
will identify genes that are contributing disproportionately to
acladeandthat is themaingoalofourapproach.Thesesetsof
genes themselvesareahypothesis, andtheir relevance to that
node can be tested further based on measures of selection
(see last section of our Discussion). We obtained a single tree
with high measures of branch support, with bootstrap and
jackknife values all or nearly all at 100% (fig. 1, congruentwith De la Torre-Barcena et al. 2009) and our manipulations
consistently retrieved the same basic topology. Thus, we are
confident of our phylogenetic reconstruction.
Most of our genes, 1,706 and 66.7% of all 2,557 parti-
tions, had an identifiable Arabidopsis ortholog. A subset of
1,503 (58.7%) had at least one functional GO category. Be-
cause some genes had more than one functional GO cate-
gory, the total number of GO categories matched is 1,872. Alist of all 2,557 of these genes and their associated GO cat-
egories are included in supplementary table 3 (Supplemen-
tary Material online). Genes from our matrix are distributed
throughout all five Arabidopsis chromosomes (supplemen-
tary fig. 1, Supplementary Material online) and with the ex-
ception of genes in the ‘‘Other Molecular Function,’’ theirdistribution into functional categories is similar to those in
Arabidopsis (table 2, fig. 2). This should minimize biases
in patterns of overrepresentation when comparing our
matrix with the Arabidopsis genome (vs. a particular node
with our matrix as background).
Correlating Function with Partition Metrics Acrossa Seed Plant Phylogeny (Sungear Analysis)Except for all GO categories having a high CI, there was no
discernible correlation observed for any GO categorieswithin nodes in relation to other tree statistics, including
FIG. 1.—Phylogenetic relationships of seed plants using 2,557 proteins inferred using maximum parsimony (single tree; length 932,201). All nodes
showed Bootstrap and Jackknife values above 99%. Bootstrap consensus (2,000 replicates) and Jackknife (with 50% removal and 1,000 replicates).
Table 2
Counts Per Functional Categories Based on GO
Functional Categories Counts
Transcription factor activity 41
Other molecular functions 42
Kinase activity 47
Structural molecule activity 54
Transporter activity 75
Transferase activity 138
Protein binding 142
Hydrolase activity 169
Other binding 170
Other enzyme activity 238
DNA or RNA bindinga 344
Unknown molecular functions 477
Total number of genes with a GOb 1937
aIncludes nucleotide binding and nucleic acid binding.
bIncludes hits with more than one GO.
Phylogenomics and Gene Function GBE
Genome Biol. Evol. 2:225–239. doi:10.1093/gbe/evq012 Advance Access publication March 24, 2010 229
by on May 27, 2010
http://gbe.oxfordjournals.orgD
ownloaded from

the average of bootstrap proportions, RI, and RC. We exam-
ined groups of genes providing positive and neutral branch
support for both PBS and PHBS to determine if there was
a particular functional category that was significantly over-represented in any of these gene sets compared with the
observed distribution of GO terms in the Arabidopsis ge-
nome. We found a number of genes belonging to GO cat-
egories with very low probabilities of occurring by chance at
the observed frequencies (based on high z scores, compa-
rable with extremely low P values) for both positive PBS and
PHBS.
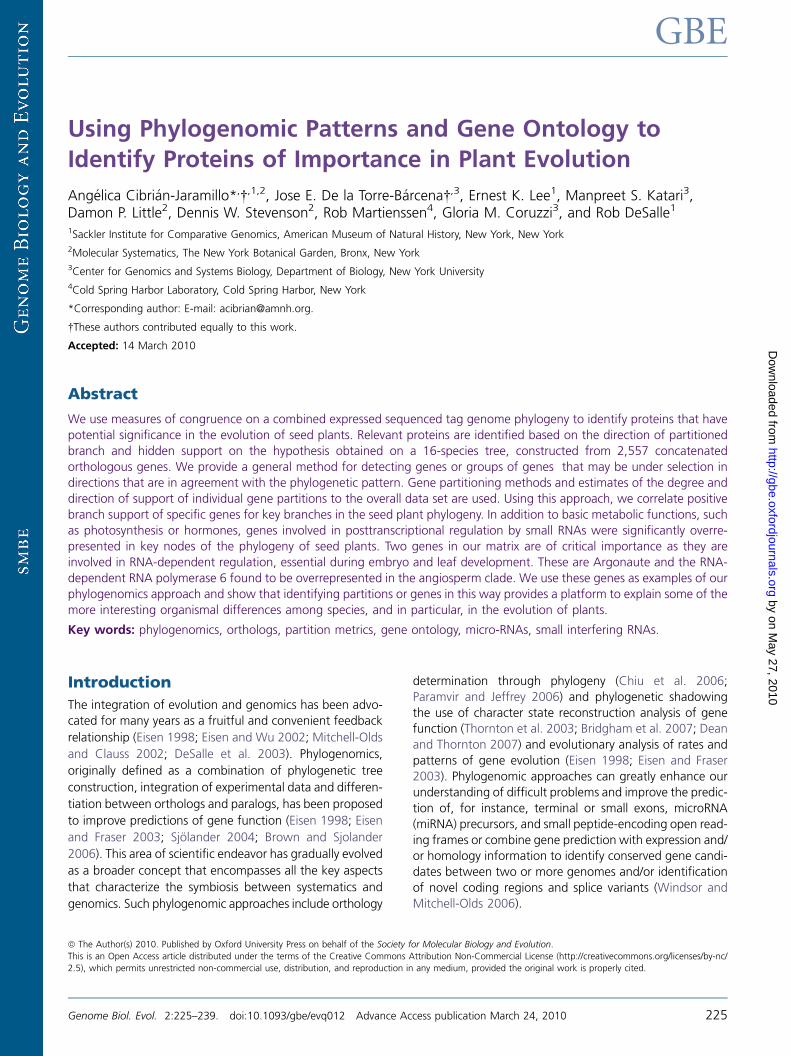
Figure 3 illustrates the distribution of sets of overrepre-sented genes (represented by the circles or vessels) across
nodes as depicted by Sungear (Poultney et al. 2007). As
we expected, neutral PHBS and PBS scores did not show
any significant outliers. The size of the vessel in this figure
is proportional to the number of genes in the vessel,
whereas the z score reflects the significance of the overrep-
resentation (with a þ7 threshold). Vessels near the perime-
ter are composed of genes found only in those nodes or innodes that are pointed to with an arrow. Node 6 (Arabidop-sis, Populus, Vitis) and node 7 (Populus, Vitis) have the larg-
est outlier vessels for both PBS and PHBS. A list of all
overrepresented GO categories, the z score values associ-
ated with PBS and PHBS, and the list of genes they comprise
is reported in supplementary table 4 (Supplementary Mate-
rial online). We were interested in overrepresented genes
that had positive PHBS support in all vessels as well as thosethat were found in outlier vessels only (fig. 4). Positive PHBS
genes provided additional support at a particular node in the
SA of all data partitions and, thus, provided a complement
to genes with positive PBS, which showed support for a node
in a separate analysis of each partition.
Correlating Function with Partition Metrics withinAngiosperms (Biomaps Analysis)The Sungear analysis ranks genes based on number of SDs
that a gene is either above or below the mean, using a zscore. The Biomaps tool on the other hand (Gutierrez
et al. 2007) provides a different measure of overrepresenta-
tion by employing a hypergeometric distribution and signif-
icance based on a P value (P , 0.05). We used Biomaps to
complement the statistical approach in Sungear and to
focus on genes that had positive support based on PBS val-
ues, but only within the angiosperms: nodes 4, 5, 6, and 7.
Most genes were distributed within photosynthesis, devel-opment, and hormone-related functional categories (sup-
plementary table 4, Supplementary Material online; full
list in supplementary table 5, Supplementary Material
online). A few were present only at a single node.
Using Phylogenomics as a Guide for Finding FunctionalSites in ProteinsA functional group within the angiosperms was of excep-
tional interest: genes involved in posttranscriptional gene si-
lencing, in particular Argonaute (AGO1) and RDR6 within
the rosids (Arabidopsis, Populus, Vitis). We used these to
identify known functional sites that may have evolutionary
relevance (fig. 5). Character comparison for AGO1 (fig. 5Aand B) and RDR6 (fig. 5C and D) revealed a number of aminoacid substitutions at regions in proteins with known func-
tional importance (Marchler-Bauer et al. 2007). For
AGO1, we found mutations unique to rice in the PAZ nucleic
acid binding interface and in regions that correspond to the
PIWI 5# guide strand to the anchoring site and the PIWI ac-
tive site. For RDR6, the SHOOTLESS2 (shl2) gene is the rice
ortholog of RDR6 inArabidopsis. The shl2–10 allele, shl2 has
FIG. 2.—Distribution of GO molecular function categories.
Cibrian-Jaramillo et al. GBE
230 Genome Biol. Evol. 2:225–239. doi:10.1093/gbe/evq012 Advance Access publication March 24, 2010
by on May 27, 2010
http://gbe.oxfordjournals.orgD
ownloaded from
a G614D mutation, responsible for that mutant phenotype
(Nagasaki et al. 2007). This specific site is one of those sup-
porting cladogenetic variation in our matrix, that is, provid-
ing positive branch support as apomorphic for monocots.
A separate analysis isolating genes involved in RNA bind-ing, or associated with small interfering RNA (siRNA) path-
ways, revealed no single pattern of support or conflict,
either apparent (PBS) or hidden (PHBS), for these groups
of genes (supplementary table 5, Supplementary Material
online). This suggests diverse evolutionary histories and con-
strains for each gene. However, both AGO1 and RDR6
showed significant positive support values (PBS of 16 and
4, respectively) for the entire SA tree topology, which argued
for their use as examples in subsequent analyses to deter-
mine areas of potential functional importance underlying
support for specific regions (nodes) of the tree.
Discussion
Seed Plant Phylogeny and Partition DynamicsAlthough recent progress has been made using plastid ge-
nome-based phylogenies (Qiu et al. 2006; Barkman et al.
2007; Jansen et al. 2007; Moore et al. 2007; Raubeson
et al. 2007), most plant phylogenies to date rely on only
FIG. 3.—Distribution of genes across nodes. The Sungear figure has a shape of a polygon where the vertices, also referred to as anchors, represent
the different gene lists. The circles with arrows within the polygon (vessels) represent genes. The position and the arrows of the vessels identify which
anchor(s) the genes are from. The size of the vessel is relative to the number of genes in that vessel. Vessels in the center have shared genes from the
different nodes, whereas vessels on the perimeter belong only to one or a few nodes. Shown is the distribution of genes that have neutral PBS (A), PHBS
(C), positive PBS (B), and PHBS (D).
Phylogenomics and Gene Function GBE
Genome Biol. Evol. 2:225–239. doi:10.1093/gbe/evq012 Advance Access publication March 24, 2010 231
by on May 27, 2010
http://gbe.oxfordjournals.orgD
ownloaded from

a few nuclear and plastid markers to infer relationships
(Chase et al. 1993; Bowe et al. 2000; Burleigh and Mathews
2004; Barkman et al. 2007; Zhu et al. 2007; Bouchenak-
Khelladi et al. 2008; Smith and Donoghue 2008; Burleigh
et al. 2009). Our topology recovers major groups of seed
plants as all previous morphological analyses and most mo-
lecular analyses with monophyletic seed plants: the cycads,
the conifers, the gnetophytes, and the angiosperms. Con-gruent with all molecular data sets (Bowe et al. 2000;
Schmidt and Schneider-Poetsch 2002; Burleigh and Math-
ews 2004), except for rbcL (Chase et al. 1993; Albert
et al. 1994), and contrary to morphological analyses (Chase
et al. 1993; Nixon et al. 1994; Rothwell and Serbet 1994),
the gymnosperms are clearly a monophyletic group. One in-
teresting disparity in topologies derived from most previous
molecular data sets involves the placement of the gneto-phytes (Bowe et al. 2000; Schmidt and Schneider-Poetsch
2002; Burleigh and Mathews 2004). Our analyses support
the gnetophytes as the sister group to all other gymnosperms,
congruent with phylogenetic studies using phytochrome
genes (Mathews and Donoghue 2000; Schmidt and
Schneider-Poetsch 2002; Mathews 2009), AGAMOUS-like
genes (Winter et al. 1999; Becker et al. 2003), and FLORICAU-LA/LEAFY (Frohlich and Parker 2000).
Within the angiosperms, our tree for the most part is con-gruent with the Angiosperm Phylogeny Group (APG III)
(APGIII 2009). Not surprisingly, Amborella is sister to all
the angiosperms (Lockhart and Penny 2005). The single
Monocot in our tree (Oryza) is well supported as an early
divergent group sister to the rosids Arabidopsis, Populus,and Vitis. Controversial relationships of monocots with
other groups, such as the placement of monocots and eu-
dicots clade sister to the Magnolids (Chase et al. 2006), ormonocots sister to Magnolids (Duvall et al. 1993; Davis et al.
FIG. 4.—Distribution of relevant genes with positive PHBS that are also overrepresented across our phylogeny. Circle size is shown at the node and
corresponds to z scores (.7; see key). Red circles and red labels correspond to categories that were only in gene clusters unique to that particular node (vessels
near the perimeter on Sungear). Black circles and labels are genes that are found across the node and thus can be shared with other nodes in the phylogeny.
Cibrian-Jaramillo et al. GBE
232 Genome Biol. Evol. 2:225–239. doi:10.1093/gbe/evq012 Advance Access publication March 24, 2010
by on May 27, 2010
http://gbe.oxfordjournals.orgD
ownloaded from

2006), remain to be tested. Three taxa relationships in ourtree will be explored further with the inclusion of more spe-
cies and more genes, in particular the placement of Vitis.The systematics of Vitaceae has been uncertain (reviewed
in Soltis et al. 2005, 2007; Jansen et al. 2006). Our SA places
Vitis with Populus (fig. 1), in contrast to its placement as sis-
ter to the clade including both Arabidopsis and Populusbased mostly on plastid genomes and a couple nuclear
genes (Wang et al. 2009). The generally low support forits placement in most phylogenies to date and its position
in our phylogeny, however, suggest that the relation of Vitisto the rest of the rosids will be only resolved with the addi-
tion of more nuclear genes/genomes, other rosids as
ingroup taxa and asterids as outgroups.
Most of our overrepresented genes provide congruentsupport from the tips to the base of the node of interest,
minimizing the risk that new, additional taxa cause a major
shift the nodes at which those genes are overrepresented.
More ESTs and full genomes could theoretically improve
support (e.g., measures for support are highest within
the angiosperms probably driven by the complete genomes
in that group). A more detailed explanation of the impor-
tance of an SA, as well as of support dynamics, the roleof outgroup choice, taxon sampling, and missing data for
the same tree as figure 1 is discussed (De la Torre-Barcena
et al. 2009). Our main goal in this study is to exploit this large
phylogenomic matrix to analyze the function of proteins and
residues supporting the key nodes of seed plant evolution.
FIG. 5.—Character comparison for AGO1 (A, B) and RDR6 (C, D) among angiosperms without Amborella, Arabidopsis (Arab), rice (Oryz), poplar
(Popu), and grape (Viti), reveals a number of amino acid substitutions at regions in proteins with known functional importance. For AGO1, (A) shows
the complete alignment; inset is represented in (B) for both Arabidopsis and rice, yellow highlighted regions correspond to the PAZ nucleic acid binding
interface, green regions correspond to the PIWI 5# guide strand to the anchoring site, and brown regions to PIWI active site. Mutations unique to rice
are underlined in red. For RDR6, (C) shows the complete alignment, whereas the inset (D) corresponds to the RDR6 domain. In (D), the shl2 gene is the
rice ortholog of RDR6 (from Arabidopsis). In the shl2–10 allele, shl2 has a G614D mutation. This substitution is responsible for the mutant phenotype,
that is, functionally important site (Nagasaki et al. 2007). This site is one of those supporting cladogenetic variation in our matrix, that is, providing
positive branch support for the split between monocots and the rest of the angiosperms—see node 6 on the tree. Substitutions unique to rice
throughout the domain are underlined in red. Approximations of domain span for both AGO1 and RDR6 are based on Marchler-Bauer et al. (2007).
Phylogenomics and Gene Function GBE
Genome Biol. Evol. 2:225–239. doi:10.1093/gbe/evq012 Advance Access publication March 24, 2010 233
by on May 27, 2010
http://gbe.oxfordjournals.orgD
ownloaded from

Using Branch Support Measures to Mine Genes ofInterestWe suggest that a powerful way to tease apart the role ofevolutionary change in protein function is to study the be-
havior of the genes used to reconstruct phylogeny through
analysis of their effect on tree topology and branch support
and their potential correlation(s) with functional processes
of interest. This approach allows all character information
to interact freely and reveal a more accurate description
of species relationships and at the same time makes it pos-
sible to observe snapshots of how genes or groups of genesmay have evolved in the context of the overall phylogeny. If
one assumes that the tree obtained from concatenated
analysis best represents the evolutionary history of the taxa
involved, then partitions that are in agreement or in conflict
with the overall evolutionary history of the groups in the
analysis can be detected and used to explain some of the
more interesting organismal differences among the taxa
in an analysis. Phylogenetic incongruence between a parti-
tioned functional class of genes (such as RNA silencing
genes) and the organismal phylogeny would suggest that
the partition has experienced a unique evolutionary historyrelative to the organisms. In this way, incongruence of a par-
ticular class of genes in a partitioned analysis allows us to
establish hypotheses about the evolution and potential
function of these gene classes. Detection of such sequences
is given by character information, meaning that no previous
knowledge about the gene or gene function is required.
Apart from its blind, unbiased nature, this approach allows
for the discovery of candidate proteins with potential evo-lutionary and functional relevance. Once these proteins are
detected, additional experimental valida-tion may ascertain
their specific functional role.
Seed Plant Divergence: Genes with Basic MetabolicFunctionOverrepresented functional categories that are common
throughout nodes are largely metabolic processes. One such
FIG. 5.—Continued
Cibrian-Jaramillo et al. GBE
234 Genome Biol. Evol. 2:225–239. doi:10.1093/gbe/evq012 Advance Access publication March 24, 2010
by on May 27, 2010
http://gbe.oxfordjournals.orgD
ownloaded from
category is photosynthesis and categories related to it (e.g.,plastids or pigments). Their prevalence throughout our phy-
logeny is somewhat expected, as they are among the best-
characterized and widely annotated plant genes (Leister
2003). Nonetheless, their distribution also echoes the impor-
tance of key biochemical pathways that plants have devel-
oped to deal with novel environments. In their transition
from water to land, emerging plant lineages had to evolve
an array of genetic mechanisms that would allow for rapidadaption to changes in light and stress from desiccation,
whereas simultaneously being restricted by their sedentary life
form. For instance, changes in photosynthetic chemical path-
ways are used not only to adapt to novel light conditions but
also to reduce evaporative water loss (Bohnert et al. 1988).
The Gnetophyta (node 13) had the highest number of
overrepresented photosynthetic genes (supplementary
table 4, Supplementary Material online). Within this group,Welwitschia mirabilis is well known for its crassulacean acid
metabolism photosynthetic pathway in which stomata are
open at night, avoiding water diffusion during the day
(von Willert et al. 2005). Ephedra is found in Mediterranean
climates and in semi-to desert conditions on all continents
except Australia. Thus, all species of Ephedra experience wa-
ter stress during part of the year, although little is known
about their physiology. Most Gnetum species are distributedin lowland tropical rainforests and are uniquely character-
ized by a relatively lower photosynthetic capacity as well
as reduced capacity for stem water transport (Feild and Ba-
lun 2008). Interestingly, all gnetophytes have the smallest
known chloroplast genomes in photosynthetic vascular
plants, possibly as a result of selection to reduce costs in
stressful or competitive environments (Wu et al. 2009). Wel-witschia mirabilis, Ephedra equisetina, and the congener toour Gnetum gnemon, G. parvifolium, all have highly re-
duced chloroplast genomes, with high proportions of cod-
ing versus noncoding regions (Wu et al. 2009). Our
approach sets the framework for exploring evolutionary
mechanisms acting upon photosynthetic genes that are
uniquely overrepresented in this group. For instance, it is
possible to test for selective advantages specifically in the
Gnetales, where some representatives are adapted to ex-treme environments (Welwitschia) and others have under-
gone drastic genome reductions (Gnetum). Estimates for
Gnetum fossils could provide a timeline for specific genomic
and gene changes. Genes such as NADPþ reduction, PSAO
photosystem I subunit O, photosystem II subunit Q-2, and
those genes may have been preferentially conserved during
gnetophyte genome reduction would be key targets for
measuring selection patterns. We come back to this inthe last section of the Discussion.
Seed Plant Divergence: Specialized GenesSome of the overrepresented genes are directly associated
to a single trait or phenotype, characteristic of that clade.
For example, overrepresented amylopectin genes at theconifers (node 9) and mannose biosynthesis genes at the cy-
cad node (node 11) have a direct association to their mor-
phology. Amylopectic is fundamental to the manoxylic
wood in cycads and differs from the pycnoxylic wood in
conifers and the Gnetales, in which mannose is an important
component (Greguss 1955). Another example is napthoate
synthase genes involved in cleavage of carbon–carbon
bonds. These are overrepresented in the node that includesthe Japanese cypress (Cryptomeria) and pine. Soils in cypress
and pine forests are acidic and have increased oxidized iron
(i.e., are lateritic), which requires active degradation of hy-
drocarbons, one of the main functions of napthoate syn-
thases (Ohashi and Gyokusen 2007; Sawata and Kato
2007).
Toward Epigenetic Regulation—PosttranscriptionalRegulation by Small RNAsWe found that genes involved in posttranscriptional regula-
tion by small RNAs are highly overrepresented functional
categories at particular clades in our phylogeny (see fig. 2
and supplementary table 6, Supplementary Material online).
Posttranscriptional gene silencing and mismatch repair re-ceived high z-values at several nodes, for PHBS and/or
PBS in both gymnosperms and angiosperms. The functional
role of highly conserved miRNAs and siRNAs is well known.
Mutations in conserved small RNA pathways for instance are
important for developmental phenotypes in different tissues
(Willman and Poetig 2005; Sunkar and Zhu 2007; Wang
et al. 2007). Therefore, overrepresented siRNAs and miRNAs
that provide positive support for a particular node are inter-esting as they may have a novel or specific function. Among
the highest significance values (also with Biomaps) for over-
represented genes are found in the node that defines the
split between Amborella and the rest of the Angiosperms
(node 4) and in the split between Monocots and the rest
of the rosids (node 5).
Genes Correlated with Divergence within the Angio-sperms (Biomaps Analysis)With the highest proportion of annotated genes, two com-plete genomes (Oryza and Arabidopsis) and robust mono-
phyly based on both molecular and morphological data
(Loconte and Stevenson 1990; Chase et al. 1993; Schmidt
and Schneider-Poetsch 2002; Doyle 2006; Mathews 2009),
the angiosperms in our matrix provide an ideal platform for
identifying genes of evolutionary interest node. Plant hor-
mones and genes involved in circadian clock and photope-
riodism were among the most interesting overrepresentedpartitions. Plant hormones are often part of complex net-
works with a common set of signaling components and
common target genes (Nemhauser et al. 2006). Brassinos-
teroids were found to be uniquely overrepresented in the
angiosperm clade (node 4). Carotenoid biosynthesis factors,
Phylogenomics and Gene Function GBE
Genome Biol. Evol. 2:225–239. doi:10.1093/gbe/evq012 Advance Access publication March 24, 2010 235
by on May 27, 2010
http://gbe.oxfordjournals.orgD
ownloaded from

involved in shoot-branching and long-range signaling (Mou-chel and Leyser 2007), were identified in the same node.
Although widely distributed across plants, brassinosteroid
hormones differ in their signaling from other hormones,
with a relatively longer pathway than either auxin or giber-
ellin (Bajguz and Tretyn 2003). It would be interesting to test
if the function of brassinosteroids and carotenoid-derived
hormones differs across angiosperms.
Genes uniquely overrepresented in the angiosperms in-cluded genes overrepresented in the rosids (node 6) that
are involved in the regulation of the circadian clock and
photoperiodism, often part of quantitative trait loci (Balasu-
bramanian et al. 2006). Of particular interest was csn1 (pre-
viously fus6), which provides support for the node separating
monocots from the rest of the angiosperms (node 5) and
which was not found to be overrepresented elsewhere in
the phylogeny. This protein was originally discovered as aphotomorphogenic mutant in Arabidopsis and is a member
of to the multisubunit COP9 signalosome (CSN) complex
(Staub et al. 1996), which is ubiquitous to all eukaryotes
(Wei and Deng 1992). In plants, the COP9 signalosome has
been shown to be involved a variety of cellular processes
throughout development, including signaling, defense,
and growth (Serino and Deng 2003). The CSN not only reg-
ulates multiple cullin-based E3 ubiquitin ligases (Gusmaroliet al. 2007) but also functions as a kinase and conversely
can be targeted by kinases (for review, see Wang et al.
2003; Harari-Steinberg and Chamovitz 2004). Its specific
function in the monocots and the rest of the angiosperms
must be tested in future studies, but its relevance is high-
lighted with our approach.
Character Analyses Toward Revealing Function—AGO1 and RDR6Two genes in our matrix are of utmost importance in RNA-
dependent regulation during vital plant processes, such as
embryo and leaf development. These are AGO1 and the
RNA-dependent RNA polymerase 6 (RDR6). These genes
have roles in various stages of embryo and leaf develop-
ment, polarity, and shape through siRNA and miRNA path-
ways (Kidner and Martienssen 2004, 2005; Peragine et al.2004). Our results show that AGO1 provides 11 steps of
positive hidden support for our tree for the angiosperms
(node 4), five steps for the split of Amborella and the rest
of the angiosperms (node 5), and the dicots only (node
6). RDR6 provides five steps of positive hidden support
for the dicots (node 6). Sequence variation at these impor-
tant nodes may define relevant differences in leaf structure
and overall development among the divergent groups de-fined by those nodes.
One important predictive aspect of the approach we out-
line is that once a gene or gene category has been identified,
the specific amino acids that are contributing to the cor-
relations can then be analyzed further (i.e., through muta-
tion, overexpression, and in situ experiments) to determineif they have any functional implication. We analyzed the
aminoacid sequences from both AGO1 and RDR6 and
searched for correlations with known mutants. Figure 5
shows color-coded alignments of data partitions containing
seed plant orthologs of the (A) AGO1 and (B) RDR6 proteins.
Character analysis reveals a number of amino acid substitu-
tions among species in the clades with high support, at re-
gions in the proteins with known functional importance(e.g., the RDRp or ‘‘RNA-dependent RNA polymerase,’’
domain in RDR6; and the PIWI and PAZ domains in
AGO1). Further mutagenesis or expression analysis using
these sequence variants may confirm a role for these amino
acid residues in determining significant phenotypic effects,
similar to differences seen in nature among the species in-
volved. A very interesting finding is that mutants in RDR6,
which support the dicot clade, have much milder pheno-types in Arabidopsis than in the monocot rice (Adenot
et al. 2006; Fahlgren et al. 2006; Nagasaki et al. 2007),
in which asymmetry and shoot meristem organization in
the monocotyledonous embryo are profoundly affected,
whereas the symmetrical dicotyledonous embryo of Arabi-dopsis is left almost unchanged. Unique changes to rice are
also sites of potentially important mutants. One of the fun-
damental splits of monocots and dicots is indeed the embryomorphology. Overall, our results implicate both AGO1 and
RDR6 (and thence the processing or transport of trans-act-
ing siRNA), in this defining feature of the angiosperm seed.
Establishing a Framework for Selection StudiesNatural selection isacriticalprocess forplantmorphologyand
phenology, but identifying genes involved in these patterns is
oftenadifficult task,eveninmodelspecies.By identifyingsub-sets of genes that are overrepresented and provide positive
support for a particular clade—without a priori knowledge
of their role or function—, we establish independent hypoth-
eses (e.g., different sets of genes) regarding the evolution of
that plant group, which can be tested relative to selection
studies.Withourapproach, it is feasible to test fordirectional,
balancing, or positive selection on sets of overrepresented
genes, using likelihood tests for positive selection (i.e., esti-mates of nonsynonymous substitution dN, rate as compared
with synonymous substitution rates dS) (Yang and Nielsen
1998) or other commonly used tests (Yang and Bielawski
2000; Creevey and McInerney 2002; Huelsenbeck and Dyer
2004; Biswas and Akey2006). These results can then becom-
pared, validated, and complemented with genome-wide
scans for selection signals (e.g., Zayed and Whitfield 2008;
Pickrell et al. 2009). Although the main goal of our paper isto identify those genes providing positive support for a clade,
genes with high negative support could also be tested for se-
lection, as they may be reflecting other aspects of the species
treehistory, inaddition to thehistoryof thegenes themselves.
Given our phylogenetic framework, it is also possible to
Cibrian-Jaramillo et al. GBE
236 Genome Biol. Evol. 2:225–239. doi:10.1093/gbe/evq012 Advance Access publication March 24, 2010
by on May 27, 2010
http://gbe.oxfordjournals.orgD
ownloaded from

estimatethe impact—andinsomecasesthetimingof—majorevolutionary processes occurred, such as major climatic
events, large-scale changes in geographic distribution, geno-
mic rearrangements or duplications, or major disease out-
breaks, to name a few (Garrigan and Hedrick 2003; Franks
et al. 2007; Hongyan et al. 2009). Presumably, these events
leave evidence of selection pressure on the gene and/or
protein sequences, which can bedetectedby comparingevo-
lutionary rates among species and timed within our phyloge-netic context (Palme et al. 2009). Sets of overrepresented
genes (and their measures of conflict or support) can be
then correlated to these processes and their distribution pat-
terns tested as hypothesis that could explain species’ adapta-
tions. Ideally, it would also be possible to identify the actual
amino acid change(s) that could account for the selective ad-
vantageand/or speciationevent, aswediscuss forAGO1sup-
porting node 4 and RDR6 in the monocots. Functionallaboratory analyses targeting thosegenes could further verify
theroleofacandidategeneorgenefamily inspecificmorpho-
logical or biological changes that may allowed that species to
adapt,persist, and/ordiverge. Interestingly, this canbe readily
tested in model species or on groups with a large number of
domesticatedspecies (e.g.,Vitis,Oryza) thatareknowntoun-
dergo intense selective pressure (Purugganan and Fuller
2009).Wearecurrently testingthisapproachwithvarioussetsof genes throughout our phylogeny and given the rapid tech-
nological advances, we can expect to apply this approach to
nonmodel species in the near future.
Conclusions
By studying the behavior of clade-specific variation of phy-
logenetic characters in a partitioned context, the effect of
individual genes or groups of genes (i.e., GO categories)
on support metrics and their statistical correlation with func-
tional processes of interest (such as seed development andposttranscriptional gene silencing) can be determined. In
this way, we demonstrate a novel method for using a phy-
logenomic perspective to postulate hypotheses of gene
function distributions and evolutionary mechanisms that
can be tested experimentally. Upon testing, functional hy-
potheses can be further coupled with expression and ge-
netic data, to arrive at better gene annotations and
functional analyses for genome level studies, and ultimatelya better understanding of plant evolution.
Supplementary Material
Supplementary figure 1 and supplementary tables 1–6 are
available at Genome Biology and Evolution online (http://
www.oxfordjournals.org/our_journals/gbe/).
Acknowledgments
We thank the members of the New York Plant Genomics
Consortium, Barbara Ambrose (NYBG), Sergios-Orestis
Kolokotronis (AMNH), and Richard H. Baker (AMNH) forhelpful comments on the manuscript, GO Sungear patterns,
and measures of support. This work was supported by US
National Science Foundation Plant Genome Grant (DBI-
0421604) to G.M.C., R.D, D.W.S, and R.M., which provided
support to E.K.L., M.S.K., R.D., and E.K.L. We thank the
Lewis B. and Dorothy Cullman Program in Molecular Sys-
tematics, the Sackler Institute for Comparative Genomics,
and the Korein Family Foundation, all at the AMNH, forcontinued support. A.C.J. thanks the Lewis B. and Dorothy
Cullman Program in Molecular Systematics at both NYBG
and AMNH.
Literature CitedAdenot X, et al. 2006. DRB4-dependent TAS3 trans-acting siRNAs
control leaf morphology through AGO7. Curr Biol. 16:927–932.
Albert VA, et al. 1994. Functional constraints and rbcL evidence for land
plant phylogeny. Ann Mo Bot Gard. 81:534–567.
APGIII. 2009. An update of the Angiosperm Phylogeny Group
classification for the orders and families of flowering plants:
aPG III. Bot J Linn Soc. 161:105–121.
Bajguz A, Tretyn A. 2003. The chemical characteristic and distribution of
brassinosteroids in plants. Phytochemistry. 62:1027–1046.
Baker RH, DeSalle R. 1997. Multiple sources of character information
and the phylogeny of Hawaiian drosophilids. Syst Biol. 46:
654–673.
Balasubramanian S, et al. 2006. The PHYTOCHROME C photoreceptor
gene mediates natural variation in flowering and growth responses
of Arabidopsis thaliana. Nat Genet. 38:711–715.
Barkman TJ, et al. 2007. Mitochondrial DNA suggests at least 11 origins
of parasitism in angiosperms and reveals genomic chimerism in
parasitic plants. BMC Evol Biol. 7:248.
Becker A, Saedler H, Theissen G. 2003. Distinct MADS-box gene
expression patterns in the reproductive cones of the gymnosperm
Gnetum gnemon. Dev Genes Evol. 213:567–572.
Biswas S, Akey JM. 2006. Genomic insights into positive selection.
Trends Genet. 22:437–446.
Bohnert HJ, et al. 1988. Mesembryanthemum crystallinum, a higher
plant model for the study of environmentally induced changes in
gene expression. Plant Mol Biol Rep. 6:10–28.
Bouchenak-Khelladi Y, et al. 2008. Large multi-gene phylogenetic trees
of the grasses (Poaceae): progress towards complete tribal and
generic level sampling. Mol Phylogenet Evol. 47:488–505.
Bowe LM, Coat G, dePamphilis CW. 2000. Phylogeny of seed plants
based on all three genomic compartments: extant gymnosperms are
monophyletic and Gnetales’ closest relatives are conifers. Proc Natl
Acad Sci U S A. 97:4092–4097.
Bremer K. 1988. The limits of amino acid sequence data in angiosperm
phylogenetic reconstruction. Evolution. 42:795–803.
Bremer K. 1994. Branch support and tree stability. Cladistics.
10:295–304.
Bridgham JB, Carroll SM, Thornton JW. 2007. Evolution of hormone-
receptor complexity by molecular exploitation. Science. 312:
87–101.
Brown D, Sjolander K. 2006. Functional classification using phyloge-
nomic inference. PLoS Comput Biol. 2:e77.
Bull J, Huelsenbeck J, Cunningham C, Swofford D, Waddell P. 1993.
Partitioning and combining data in phylogenetic analysis. Syst Biol.
42:384–397.
Phylogenomics and Gene Function GBE
Genome Biol. Evol. 2:225–239. doi:10.1093/gbe/evq012 Advance Access publication March 24, 2010 237
by on May 27, 2010
http://gbe.oxfordjournals.orgD
ownloaded from

Burleigh JG, Hilu KW, Soltis DE. 2009. Inferring phylogenies with
incomplete data sets: a 5-gene, 567-taxon analysis of angiosperms.
BMC Evol Biol. 9:61.
Burleigh JG, Mathews S. 2004. Phylogenetic signal in nucleotide data
from seed plants: implications for resolving the seed plant tree of
life. Am J Bot. 91:1599–1613.
Chase MW, et al. 1993. Phylogenetics of seed plants: an analysis of
nucleotide sequences from the plastid gene rbcL. Ann Mo Bot Gard.
80:528–580.
Chase MW, et al. 2006. Multigene analyses of monocot relationships:
a summary. Aliso. 22:63–75.
Chiu JC, et al. 2006. OrthologID: automation of genome-scale ortholog
identification within a parsimony framework. Bioinformatics.
22:699–707.
Creevey CJ, McInerney JO. 2002. An algorithm for detecting directional
and non-directional positive selection, neutrality and negative
selection in protein coding DNA sequences. Gene. 300:43–51.
Davis JI, et al. 2006. Are mitochondrial genes useful for the analysis of
monocot relationships? Taxon. 55:857.
De la Torre-Barcena JE, et al. 2009. The impact of outgroup choice and
missing data on major seed plant phylogenetics using genome-wide
EST data. PLoS One. 4(6):e5764.
Dean AM, Thornton JW. 2007. Mechanistic approaches to the study of
evolution: the functional synthesis. Nat Rev Genet. 8:675–688.
DeSalle R, Branham MA, O’Grady P, Gatesy J. 2003. The evolution of
HOM-C homeoboxes in the Dipteran family Drosophilidae. Insect
Mol Biol. 12:345–351.
Doyle JA. 2006. Seed ferns and the origin of angiosperms. J Torrey Bot
Soc. 133:169–209.
Dudoit S, van der Laan MJ, Pollard KS. 2004. Multiple testing. Part I.
Single-step procedures for control of general type I error rates. Stat
App Genet Mol Biol. 3:1–69.
Duvall MR, et al. 1993. Phylogenetic hypotheses for the monocotyle-
dons constructed from rbcL sequence data. Ann Mo Bot Gard.
80:607–619.
Eisen JA. 1998. Phylogenomics: improving functional predictions for
uncharacterized genes by evolutionary analysis. Genome Res.
8:163–167.
Eisen JA, Fraser CM. 2003. Phylogenomics: intersection of evolution and
genomics. Science. 300:1706–1707.
Eisen JA, Wu M. 2002. Phylogenetic analysis and gene functional
predictions: phylogenomics in action. Theor Popul Biol. 61:
481–488.
Fahlgren N, et al. 2006. Regulation of AUXIN RESPONSE FACTOR3 by
TAS3 ta-siRNA affects developmental timing and patterning in
Arabidopsis. Curr Biol. 9:939–944.
Farris J, Albert V, Kallersjo M, Lipscomb D, Kluge A. 1996. Parsimony
jackknifing outperforms neighbor-joining. Cladistics. 12:99–124.
Feild TS, Balun L. 2008. Xylem hydraulic and photosynthetic function of
Gnetum (Gnetales) species from Papua New Guinea. New Phytol.
177:665–675.
Felsenstein J. 1985. Confidence limits on phylogenies: an approach
using the bootstrap. Evolution. 39:783–791.
Franks SJ, Sim S, Weis AE. 2007. Rapid evolution of flowering time by an
annual plant in response to a climate fluctuation. Proc Natl Acad Sci
U S A. 104:1278.
Frohlich MW, Parker DS. 2000. The mostly male theory of flower
evolutionary origins: from genes to fossils. Syst Bot. 25:155–170.
Garrigan D, Hedrick PW. 2003. Perspective: detecting adaptive
molecular polymorphism: lessons from the MHC. Evolution. 57:
1707–1722.
Gatesy J, O’Grady P, Baker RH. 1999. Corroboration among data sets in
simultaneous analysis: hidden support for phylogenetic relationships
among higher level artiodactyl taxa. Cladistics. 15:271–313.
Greguss P. 1955. Identification of living gymnosperms on the basis of
xylotomy. Translated by L. Jocsik. Budapest (Hungary): Akademiai
Kiado.
Gusmaroli G, Figueroa P, Serino G, Deng XW. 2007. Role of the MPN
subunits in COP9 signalsome assembly and activity, and their
regulatory interaction with Arabidopsis Cullin3-based E3 ligases.
Plant Cell. 19:564–581.
Gutierrez R, Lejay L, Chiaromonte F, Shasha DE, Gm C. 2007. Qualitative
network models and genome-wide expression data define carbon/
nitrogen-responsive biomodules in Arabidopsis. Genome Biol. 8:R7.
Harari-Steinberg O, Chamovitz DA. 2004. The COP9 signalosome:
mediating between kinase signaling and protein degradation. Curr
Protein Pept Sci. 5:185–189.
Hongyan S, et al. 2009. Evolution of plant MADS box transcription
factors: evidence for shifts in selection associated with early
angiosperm diversification and concerted gene duplications. Mol
Biol Evol. 26:2229–2244.
Huelsenbeck JP, Dyer KA. 2004. Bayesian estimation of positively
selected sites. J Mol Evol. 58:661–672.
Jansen RK, et al. 2007. Analysis of 81 genes from 64 plastid genomes
resolves relationships in angiosperms and identifies genome-scale
evolutionary patterns. Proc Natl Acad Sci U S A. 104:19369–19374.
Jansen RK, et al. 2006. Phylogenetic analyses of Vitis (Vitaceae) based
on complete chloroplast genome sequences: effects of taxon
sampling and phylogenetic methods on resolving relationships
among rosids. BMC Evol Biol. 6:32.
Kidner CA, Martienssen RA. 2004. Spatially restricted microRNA directs
leaf polarity through ARGONAUTE1. Nature. 428:81–84.
Kidner CA, Martienssen RA. 2005. The role of ARGONAUTE1 (AGO1) in
meristem formation and identity. Dev Biol. 280:504–517.
Kluge A. 1989. A concern for evidence and a phylogenetic hypothesis of
relationships among Epicrates (Boidae, Serpentes). Syst Biol. 38:7–25.
Leister D. 2003. Chloroplast research in the genomic age. Trends Genet.
19:47–56.
Lockhart P, Penny D. 2005. The place of Amborella within the radiation
of angiosperms. Trends Plant Sci. 10:201–202.
Loconte H, Stevenson DW. 1990. Cladistics of the Spermatophyta.
Brittonia. 42:197–211.
Marchler-Bauer A, et al. 2007. CDD: a conserved domain database for
interactive domain family analysis. Nucleic Acids Res. 35:D237–D240.
Mathews S. 2009. Phylogenetic relationships among seed plants:
persistent questions and the limits of molecular data. Am J Bot. 96:
228–236.
Mathews S, Donoghue MJ. 2000. Basal angiosperm phylogeny inferred
from duplicate phytochromes A and C. Int J Plant Sci. 161:41–55.
Mitchell-Olds T, Clauss MJ. 2002. Plant evolutionary genomics. Curr
Opin Plant Biol. 5:74–79.
Moore MJ, Bell CD, Soltis PS, Soltis DE. 2007. Using plastid genome-
scale data to resolve enigmatic relationships among basal angio-
sperms. Proc Natl Acad Sci U S A. 104:19363–19368.
Mouchel CF, Leyser O. 2007. Novel phytohormones involved in long-
range signaling. Curr Opin Plant Biol. 10:473–476.
Nagasaki H, et al. 2007. The small interfering RNA production pathway
is required for shoot meristem initiation in rice. Proc Natl Acad Sci
U S A. 104:14867–14871.
Nelson G. 1979. Cladistic analysis and synthesis: principles and
definitions, with a historical note on Adanson’s Familles des Plantes
(1763-1764). Syst Biol. 28:1–21.
Cibrian-Jaramillo et al. GBE
238 Genome Biol. Evol. 2:225–239. doi:10.1093/gbe/evq012 Advance Access publication March 24, 2010
by on May 27, 2010
http://gbe.oxfordjournals.orgD
ownloaded from
Nemhauser JL, Hong F, Chory J. 2006. Different plant hormones
regulate similar processes through largely nonoverlapping transcrip-
tional responses. Cell. 126:467–475.
Nixon KC, Carpenter JM. 1996. On simultaneous analysis. Cladistics.
12:221–241.
Nixon KC, Crepet WL, Stevenson D, Friis EM. 1994. A reevaluation of
seed plant phylogeny. Ann Mo Bot Gard. 81:484–533.
Ohashi M, Gyokusen K. 2007. Temporal change in spatial variability of
soil respiration on a slope of Japanese cedar (Cryptomeria japonica
D. Don) forest. Soil Biol Biochem. 39:1130–1138.
Palme A, Pyhajarvi T, Waxhiwiak W, Savolainen O. 2009. Selection on
nuclear genes in a Pinus phylogeny. Mol Biol Evol. 26:893–905.
Paramvir D, Jeffrey B. 2006. A phylogenomic gene cluster resource: the
Phylogenetically Inferred Groups (PhIGs) database. BMC Bioinfor-
matics. 7:201.
Peragine A, Yoshikawa M, Wu G, Albrecht HL, Poethig RS. 2004. SGS3
and SGS2/SDE1/RDR6 are required for juvenile development and the
production of trans-acting siRNAs in Arabidopsis. Genes Dev.
18:2368–2379.
Pickrell JK, et al. 2009. Signals of recent positive selection in a worldwide
sample of human populations. Genome Res. 19:826.
Poultney CS, et al. 2007. Sungear: interactive visualization and functional
analysis of genomic datasets. Bioinformatics. 23:259–261.
Purugganan M, Fuller D. 2009. The nature of selection during plant
domestication. Nature. 457:843–848.
Qiu YL, et al. 2006. The deepest divergences in land plants inferred from
phylogenomic evidence. Proc Natl Acad Sci U S A.
103:15511–15516.
Raubeson LA, et al. 2007. Comparative chloroplast genomics: analyses
including new sequences from the angiosperms Nuphar advena and
Ranunculus macranthus. BMC Genomics. 8:174.
Rokas A, Williams BL, King N, Carroll SB. 2003. Genome-scale
approaches to resolving incongruence in molecular phylogenies.
Nature. 425:798–804.
Rothwell GW, Serbet R. 1994. Lignophyte phylogeny and the evolution
of spermatophytes: a numerical cladistic analysis. Syst Bot.
19:443–482.
Sarkar IN, Egan MG, Coruzzi GM, Lee EK, DeSalle R. 2008. Automated
simultaneous analysis phylogenetics (ASAP): an enabling tool for
phlyogenomics. BMC Bioinformatics. 9:103.
Sawata S, Kato H. 2007. Chemical properties of surface soil in relation
to the quantity of stemflow, throughfall and litter in a mixed forest
of Japanese cedar (Cryptomeria japonica) and beech (Fagus crenata)
trees. Jap J Forest Envir. 49:93–101.
Schmidt M, Schneider-Poetsch HA. 2002. The evolution of gymno-
sperms redrawn by phytochrome genes: the Gnetatae appear at the
base of the gymnosperms. J Mol Evol. 54:715–724.
Serino G, Deng XW. 2003. The COP9 signalosome: regulating plant
development through the control of proteolysis. Annu Rev Plant
Biol. 54:165–182.
Sjolander K. 2004. Phylogenomic inference of protein molecular
function: advances and challenges. Bioinformatics. 20:170–179.
Smith SA, Donoghue MJ. 2008. Rates of molecular evolution are linked
to life history in flowering plants. Science. 322:86–89.
Soltis DE, Gitzendanner MA, Soltis PS. 2007. A 567-Taxon data set for
angiosperms: the challenges posed by Bayesian analyses of large
data sets. Int J Plant Sci. 168:137–157.
Soltis DE, Soltis PS, Endress PK, Chase MW. 2005. Phylogeny and
evolution of Angiosperms. Sunderland (MA): Sinauer Associates Inc.
Staub JM, Wei N, Deng XW. 1996. Evidence for FUS6 as a component of
the nuclear-localized COP9 complex in Arabidopsis. Plant Cell.
8:2047–2056.
Sunkar R, Zhu JK. 2007. Micro RNAs and short-interfering RNAs in
plants. J Integr Plant Biol. 49:817–826.
Swofford D. 2003. PAUP*: phylogenetic analysis using parsimony (*and
other methods). Sunderland (MA): Sinauer Associates.
Thornton J, Need E, Crews D. 2003. Resurrecting the ancestral steroid
receptor: ancient origin of estrogen signalling. Science.
301:1714–1717.
von Willert DJ, Armbruster N, Drees T, Zaborowski M. 2005. Welwitschia
mirabilis: cAM or not CAM—what is the answer? Funct Plant Biol.
32:389–395.
Wang H, et al. 2009. Rosid radiation and the rapid rise of angiosperm-
dominated forests. Proc Natl Acad Sci U S A. 106:3853.
Wang R, et al. 2004. Genomic analysis of the nitrate response using
a nitrate reductase-null mutant of Arabidopsis. Plant Physiol.
136:2512–2522.
Wang X, et al. 2003. The COP9 signalosome interacts with SCF UFO and
participates in Arabidopsis flower development. Plant Cell.
15:1071–1082.
Wang Y, Stricker HM, Gou D, Liu L. 2007. MicroRNA: past and present.
Front Biosci. 12:2316–2329.
Wei N, Deng XW. 1992. COP9: a new genetic locus involved in light-
regulated development and gene expression in Arabidopsis. Plant
Cell. 4:1507–1518.
Willman MR, Poetig RS. 2005. Time to grow up: the temporal role of
small RNAs in plants. Curr Opin Plant Biol. 8:548–552.
Windsor AJ, Mitchell-Olds T. 2006. Comparative genomics as a tool for
gene discovery. Curr Opin Biotechnol. 17:161–167.
Winter KU, et al. 1999. MADS-box genes reveal that gnetophytes are
more closely related to conifers than to flowering plants. Proc Natl
Acad Sci U S A. 96:7342–7347.
Wu CS, Lai YT, Lin CP, Wang YN, Chaw SM. 2009. Evolution of reduced
and compact chloroplast genomes (cpDNAs) in gnetophytes:
selection toward a lower-cost strategy. Mol Phylogenet Evol.
52:115–124.
Yang Z, Bielawski JP. 2000. Statistical methods for detecting molecular
adaptation. Trends Ecol Evol. 15(12):496–503.
Yang Z, Nielsen R. 1998. Synonymous and nonsynonymous
rate variation in nuclear genes of mammals. J Mol Evol. 46:
409–481.
Zayed A, Whitfield C. 2008. A genome-wide signature of positive
selection in ancient and recent invasive expansions of the honey bee
Apis mellifera. PNAS. 105:3421–3426.
Zhu XY, et al. 2007. Mitochondrial matR sequences help to resolve deep
phylogenetic relationships in rosids. BMC Evol Biol. 7:217.
Associate editor: Michael Purugganan
Phylogenomics and Gene Function GBE
Genome Biol. Evol. 2:225–239. doi:10.1093/gbe/evq012 Advance Access publication March 24, 2010 239
by on May 27, 2010
http://gbe.oxfordjournals.orgD
ownloaded from