Embed Size (px)
Citation preview


Contents
Executive Summary and Key findings
1 Introduction .................................................................................................................. 3
2 Purpose of this report .................................................................................................. 3
3 Improvement to benchmarks ...................................................................................... 3
4 Data source .................................................................................................................. 4
5 Sector wide findings .................................................................................................... 4
5.1 Gender balance .................................................................................................................... 5
5.1.1 Staff on academic contracts ........................................................................................ 5
5.1.2 Staff on non-academic contracts ............................................................................... 6
5.2 Gender pay gap .................................................................................................................. 11
5.2.1 All staff ......................................................................................................................... 11
5.2.2 Staff on academic contracts ..................................................................................... 13
5.2.3 Staff on non-academic contracts ............................................................................. 14
5.3 Gender stratification across the 51 point pay spine ...................................................... 16
5.4 Gender stratification across the 51 point pay spine by age group ............................. 17
6 Findings split by University Group (Russell Group, Other Pre 92, and Post 92) .. 22
6.1 Gender pay gap by University Group and contract level ............................................. 22
6.2 Gender balance gap by University Group and contract level ...................................... 28
6.3 Gender distribution across the 51 point pay spine by university group ..................... 34
7 Next steps ................................................................................................................... 37
7.1 Equal pay audits and reviews ........................................................................................... 37
7.2 New gender pay reporting requirements ........................................................................ 37
8 Resources for members ............................................................................................ 37
Guidance: Tackling the Gender Pay Gap ................................................................................... 37
Rate for the Job pay comparison website .................................................................................. 38

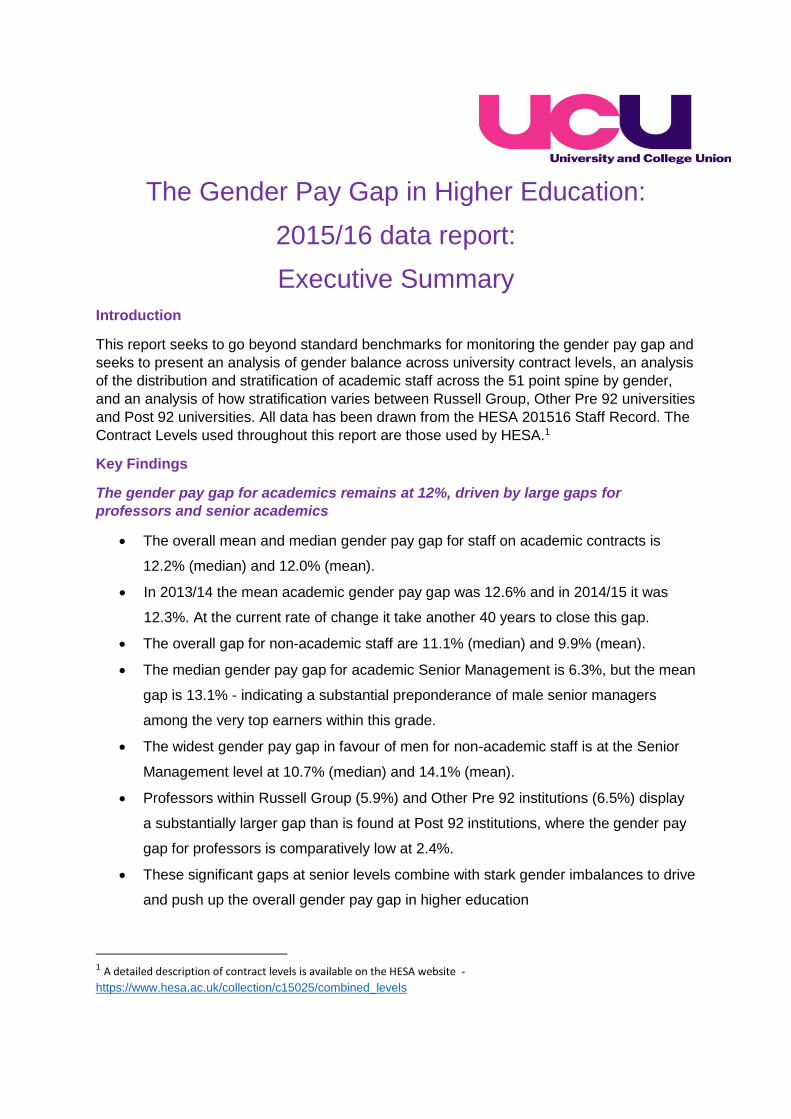
The Gender Pay Gap in Higher Education:
2015/16 data report:
Executive Summary
Introduction
This report seeks to go beyond standard benchmarks for monitoring the gender pay gap and
seeks to present an analysis of gender balance across university contract levels, an analysis
of the distribution and stratification of academic staff across the 51 point spine by gender,
and an analysis of how stratification varies between Russell Group, Other Pre 92 universities
and Post 92 universities. All data has been drawn from the HESA 201516 Staff Record. The
Contract Levels used throughout this report are those used by HESA.1
Key Findings
The gender pay gap for academics remains at 12%, driven by large gaps for
professors and senior academics
The overall mean and median gender pay gap for staff on academic contracts is
12.2% (median) and 12.0% (mean).
In 2013/14 the mean academic gender pay gap was 12.6% and in 2014/15 it was
12.3%. At the current rate of change it take another 40 years to close this gap.
The overall gap for non-academic staff are 11.1% (median) and 9.9% (mean).
The median gender pay gap for academic Senior Management is 6.3%, but the mean
gap is 13.1% - indicating a substantial preponderance of male senior managers
among the very top earners within this grade.
The widest gender pay gap in favour of men for non-academic staff is at the Senior
Management level at 10.7% (median) and 14.1% (mean).
Professors within Russell Group (5.9%) and Other Pre 92 institutions (6.5%) display
a substantially larger gap than is found at Post 92 institutions, where the gender pay
gap for professors is comparatively low at 2.4%.
These significant gaps at senior levels combine with stark gender imbalances to drive
and push up the overall gender pay gap in higher education
1 A detailed description of contract levels is available on the HESA website -
https://www.hesa.ac.uk/collection/c15025/combined_levels

The large gender imbalance among senior academic staff is a primary driver of the
intransigent gender pay gap.
While the gender balance for the total academic workforce is 45.3% women / 54.7%
men, women outnumber men at the early career contract levels of research
assistant, teaching assistant and early career lecturers/researchers.
There is then a very clear and continuous decline in the proportion of women as
seniority increases. Only 39.2% of those at Senior or Principal Lecturer, Reader, and
Principal Research Fellow level are women.
Less than one quarter (23.9%) of Professors are women. This stark imbalance,
when coupled with the large monetary gender pay gap among professors (£5,116 per
year), is a primary driver of the overall gender pay gap for academics
At the elite research intensive Russell Group universities the imbalance is even
greater – just over a third (35.3%) of senior lecturers are women, and only 22.7% of
professors are women. At non-Russell Group Pre 92 universities only 23.7% of
professors are women, and at Post 92 universities 29.1% of professors are women.
The stratification of men and women across the pay scale begins at the early career
stage and is further entrenched as careers progress
Higher education staff below professorial or function head level are paid on a single 51 point
pay spine2 and there is a normal expectation of incremental career progression on this spine
within each of 5 academic grades. In 2015/16 the point 1 on the spine was £14,323 and
point 51 was £58,754.
Proportions of men and women shift as the pay spine progresses. At every spine
point up to 43 there are proportionally more women than men (with equal numbers at
points 38 and 41) but at the most senior points from 44 onwards there are
proportionately more men than women.
This is particularly evident at the very top of the scale where there are significantly
more men (12.5% vs.7.9%) than women on points 49 – 51. This imbalance precedes
the even larger and entrenched imbalance at the professorial level beyond the top of
the 51 point spine.
Female academics aged 30-39 years proportionately outnumber males at every
single point of the scale below point 38, and then at every single point of the scale
from point 38 and beyond, men outnumber women.
23.2% of female academics aged 40-49 years are at or above point 45 of the spine,
whereas 32.5% of male academics in that age group are at or above point 45. This
is a 40.0% overrepresentation of men at the top of the spine.
2Details of the pay spine are available here: https://www.ucu.org.uk/he_singlepayspine
Within the Russell Group this gender stratification is very evident at points 49, 50 and
51, the very top of the scale. 13.3% of male academics at Russell Group institutions
are at these top three points, compared to only 8.0% of women
Among non-Russell Group Pre 92 academics 9.6% of men and 5.6% of women are
at points 48-51
At Post 92 universities, stratification is not entrenched at the early or mid-career
stages, and there are very similar percentages of men and women at all spine points
up to point 48. However, men outnumber women from point 49 onwards, with 9.8%
of men and 7.0% of women occupying points 49 to 51 of the scale.
UCU’s next steps to tackle the gender pay gap
Some higher education employers have engaged positively with UCU and in collaboration
have produced thorough equal pay audits with clear plans for action. However, it is clear
that many employers are not currently carrying out equal pay reviews with UCU branches.
Of equal concern is that too many employers are producing documents that don’t contain the
level of detail needed to identify the causes of unequal pay and are failing to commit to
concrete action to actually close the gender pay gap.
UCU is frustrated with the lack of action on gender pay at New JNHCES. We are now taking
the approach of submitting local equal pay claims at individual universities as the first step
towards identifying and rectifying the intransigent problem of unequal pay.
Resources for members
Guidance: Tackling the Gender Pay Gap
UCU has published detailed guidance on requesting and scrutinising an equal pay audit,
assessing, equal pay cases, and determining the drivers of the gender pay gap at your
institution. The guidance provides detailed steps to follow for every part of the process from
assessing your current position, to requesting and analysing an audit, to submitting a claim
and negotiating favourable outcomes.
The guidance is available to members here: https://www.ucu.org.uk/genderpay
Rate for the Job pay comparison website
UCU’s Rate for the Job online comparison tool allows you to access the average salaries for
men and women at your institution by contract level and gender, and allows you to compare
up to five institutions at a time. It also allows comparison with VC pay and contains a toll for
calculating the real hourly wages of hourly paid teaching staff.
All the information on the site is presented in an accessible graphical format that can easily
be adapted for local campaigning.
Rate for the Job can be accessed by members here: https://www.ucu.org.uk/rateforthejob
Addressing the gender pay gap is a key priority for UCU, and branches are encouraged to
discuss how this can be done at their institution with their regional office.

2

3
1 Introduction The New JNCHES Higher Education Gender pay gap data report was published by UCEA in
September 2016 and was endorsed by four of the five New JNCHES unions. UCU did not
endorse the report due to concerns about the way that both time series and individual year
data was presented.
This report has been prepared as UCU’s response to the published report using the most
current data available (HESA 2015/16 Staff Record).
2 Purpose of this report The purpose of this report is to draw attention to the significant mean and median gender
pay gaps that exist across various contract levels in higher education, but that have not been
highlighted by reports published elsewhere. In order to provide as clear an analysis as
possible, all tables are presented showing mean and median male and female salaries for
2015/16, the monetary difference the two, and the % gender pay gap at each HESA contract
level.
One of UCU’s primary criticisms of the above report was that there appeared to be
significant cherry picking of data including the removal of senior part time female staff from
gender pay gap data, and the lack of emphasis given to gender pay gaps at contract levels
where women did not account for 40% of the total workforce.
This report seeks to address these weaknesses by presenting all gender pay gap data for all
contract levels in every table. Furthermore, this report includes clearly stated gender
balance figures for every contract level, and also focuses on issues of gender balance within
contract levels, a primary driver of the gender pay gap in UK universities, and the
phenomenon of gender stratification within the national 51 point pay spine by gender and
age.
3 Improvement to benchmarks Since the publication of the report UCEA have agreed to reframe their benchmarks to
include mean and median salaries and full time, part time and all staff (excluding atypical).
This change was forced by significant pressure from UCU, in addition to ensuring that future
reporting aligns with the Government’s mandatory gender pay gap reporting requirements to
cover all employees and the ONS’ headline gender pay gap figures for full-time employees.
This change to the benchmark measures will ensure greater transparency in future gender
pay gap reporting by New JNCHES. The current benchmarks to be reported annually are
shown in the following table.
Metric Gender pay gap measure Employee groups Source
1 Gender pay gap for HE staff by staff
category (median and mean)
Full-time, part-time and both (all
employees excluding atypical and
dormant staff)
HESA

4
Metric Gender pay gap measure Employee groups Source
2 Gender pay gap for HE staff by contract
level (median)
Full-time, part-time and both (all
employees excluding atypical and
dormant staff)
HESA
3 Gender pay gaps for HE sector,
education sector and whole economy
(median and mean)
Full-time, part-time and all
employees
ONS
4 Gender pay gaps for HE and ‘Not HE’
professional occupations (median)
Full-time, part-time and all
employees
ONS
5 Gender pay gaps for HE teaching
professionals (SOC2311) in the sector,
HE teaching professionals not in the HE
sector and secondary teaching
professionals (median)
Full-time, part-time and all
employees
ONS
4 Data source
All data included in this report has been drawn from the HESA 2015/16 Staff Record. The
HESA rounding methodology and suppression strategy have been adhered to in all data
reproduced in this report. All numbers are rounded to the nearest 5 and all instances where
mean or median salaries and percentages are calculated from less than seven people have
been suppressed and replaced with “N/A”.
The Contract Levels used throughout this report are those used by HESA, and based on a
combination of UCEA and XpertHR categories.
A full description of the purpose, typical reporting structure and experience required at each
of the combined contract levels is available on the HESA website:
https://www.hesa.ac.uk/collection/c15025/combined_levels
5 Sector wide findings
This report focuses on two factors that have been identified as primary drivers of the gender
pay gap in Higher Education - the gap expressed in terms of average salary (both median
and mean) and gender balance/imbalance for both academic and non-academic staff. As
both of these factors increase with seniority, all tables and charts in this report are presented
showing all contract levels.
It also presents an analysis of distribution of academic staff across the 51 point spine by
gender, and an analysis of how stratification varies across the Russell Group, Other 92
institutions and Post 92 universities.
Throughout the report, the mean median and mean gender pay gap and gender
balance/imbalance are presented for all staff employed on non-atypical contracts at UK
5
Higher Education institutions, for staff employed on academic contracts, and for staff
employed on non-academic contracts. This is in order to provide as much detail as possible
about the career points where differences become most apparent and to demonstrate the
career points where they have the most impact.
The gender pay gap is calculated throughout the report in the following way:
(Male salary – Female salary) / (Male salary) x 100 = % Gender Pay Gap
Average salaries are presented as median and mean averages, with the gender pay gap shown in monetary and percentage terms. The UCEA gender pay data report states that it considers that “a ‘significant’ pay gap is where the figure is outside the ±5 per cent boundary. However it should be noted that ‘recurring differences of 3 per cent or more merit further investigation’ according to the Equality and Human Rights Commission’s equal pay review guidance for larger organisations”3 By contrast, this report considers all gender pay gaps worthy of reporting and does not seek to diminish any gaps by placing an arbitrary judgement on whether they should be considered significant.
5.1 Gender balance
The gender balance (or imbalance) of staff at Higher Education institutions in the UK is one
of the primary drivers of the sector’s continuing gender pay gap. The UCEA report includes
gender balance in its analysis but underplays its impact by grouping contract levels into “staff
on the 51 point spine” and senior staff”. Their report groups all contract levels from A0 to F2
as “senior staff”. This grouping includes professors, where the largest gender pay gap and
gender imbalance among active academic staff is found. Grouping professors with senior
management in this way obscures the scale of the issue in relation to professors. Similarly,
the grouping all staff on the 51 point pay spine together obscures some of the clear and
rapid declines in gender balance between individual contract levels with the 51 point spine,
particularly for staff on academic contracts. For this reason, all results in this report are
presented at Table 1 below by individual contract level, along with the total number of staff
occupying each contract level, so that a sense of the number of people impacted by any
differences can be seen.
5.1.1 Gender balance among staff on academic contracts
While the gender balance for the total academic workforce is 45.3% women / 54.7% men,
there is a very clear and continuous decline in the number of women present as contract
levels progress into the mid-career and senior academic levels.
There are proportionally more women than men at all contracts levels up to K0 (Lecturer A in
Pre 92 HEIs, Lecturer in Post 92 HEIs, Research Fellow, Researcher, Teaching Fellow) with
the exception of N0. The K0 contract level is more or less equally balanced (50.1% women).
However, from 48.5% women at contract level J0 (Lecturer B at Pre 92 HEIs or Senior
3 UCEA, New JNCHES Higher Education Gender Pay Gap Data Report,
http://www.ucea.ac.uk/en/publications/index.cfm/hegenderpaygap , page 4
6
Lecturer at Post 92s, Senior Research Fellow) upwards there are proportionally more men
than women present at every contract level
Only 39.2% of those at contract level I0 (Senior/Principal Lecturer, Reader, Principal
Research Fellow) are women as are 37.7% of F2 Function Heads.
Less than one quarter (23.9%) of Professors are women. This stark imbalance, when
coupled with the large monetary gender pay gap among professors, is a primary driver of the
overall gender pay gap for academics working the UK.
The cumulative impact of the gender imbalance throughout the main academic contract
levels on access to senior management is also very evident – women account for only
30.4% of senior managers at contact levels A0 to C2 and 36.2% at contract levels D & E
Heads of Schools/Senior Function Heads.
5.1.2 Gender balance among staff on non-academic contracts
Overall, 62.7% of non-academic staff are female, but less than half of the most senior non-
academic staff in UK universities are women. 40.5% of A0 to C2 Senior Managers are
women and 47.6% of Heads of Schools/Senior Function Heads are women.
52.2% of F2 Function Heads and 51.1% of I0 Non-academic Section Managers are women.
There is significantly higher female representation at all contracts levels below these,
particularly at the administrative grades L0 Senior Administrative staff (62.9% female), M0
Assistant Professional Staff, Administrative Staff (70.7% female) N0 Junior Administrative
staff, Clerical Staff (67.4%).
7
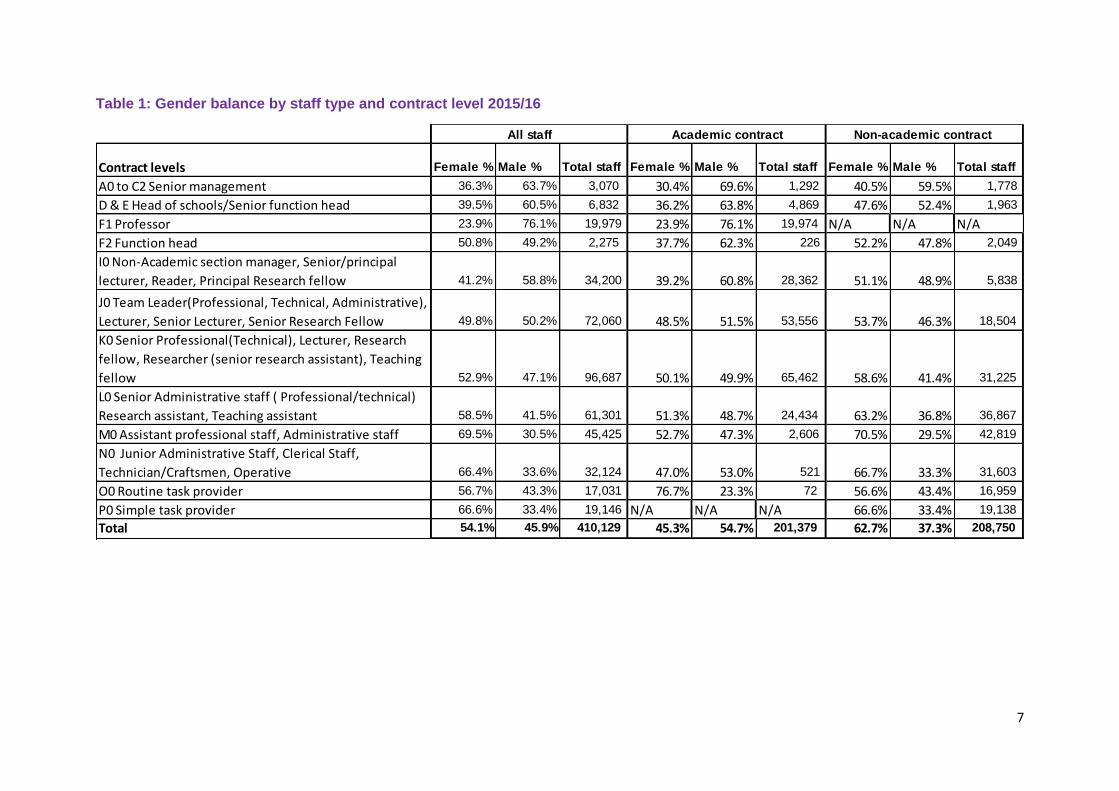
Table 1: Gender balance by staff type and contract level 2015/16
Contract levels Female % Male % Total staff Female % Male % Total staff Female % Male % Total staff
A0 to C2 Senior management 36.3% 63.7% 3,070 30.4% 69.6% 1,292 40.5% 59.5% 1,778
D & E Head of schools/Senior function head 39.5% 60.5% 6,832 36.2% 63.8% 4,869 47.6% 52.4% 1,963
F1 Professor 23.9% 76.1% 19,979 23.9% 76.1% 19,974 N/A N/A N/A
F2 Function head 50.8% 49.2% 2,275 37.7% 62.3% 226 52.2% 47.8% 2,049
I0 Non-Academic section manager, Senior/principal
lecturer, Reader, Principal Research fellow 41.2% 58.8% 34,200 39.2% 60.8% 28,362 51.1% 48.9% 5,838
J0 Team Leader(Professional, Technical, Administrative),
Lecturer, Senior Lecturer, Senior Research Fellow 49.8% 50.2% 72,060 48.5% 51.5% 53,556 53.7% 46.3% 18,504
K0 Senior Professional(Technical), Lecturer, Research
fellow, Researcher (senior research assistant), Teaching
fellow 52.9% 47.1% 96,687 50.1% 49.9% 65,462 58.6% 41.4% 31,225
L0 Senior Administrative staff ( Professional/technical)
Research assistant, Teaching assistant 58.5% 41.5% 61,301 51.3% 48.7% 24,434 63.2% 36.8% 36,867
M0 Assistant professional staff, Administrative staff 69.5% 30.5% 45,425 52.7% 47.3% 2,606 70.5% 29.5% 42,819
N0 Junior Administrative Staff, Clerical Staff,
Technician/Craftsmen, Operative 66.4% 33.6% 32,124 47.0% 53.0% 521 66.7% 33.3% 31,603
O0 Routine task provider 56.7% 43.3% 17,031 76.7% 23.3% 72 56.6% 43.4% 16,959
P0 Simple task provider 66.6% 33.4% 19,146 N/A N/A N/A 66.6% 33.4% 19,138
Total 54.1% 45.9% 410,129 45.3% 54.7% 201,379 62.7% 37.3% 208,750
All staff Academic contract Non-academic contract

8
Figure 1: Gender balance: All staff by contract level 2015/16

9
Figure 2: Gender balance: Academic staff by contract level 2015/16
There are proportionally more
women than men at all contracts
levels up to K0 (Lecturer A in Pre
92 HEIs, Lecturer in Post 92 HEIs,
Research Fellow, Researcher,
Teaching Fellow) with the
exception of N0. The K0 contract
level is more or less equally
balanced (50.1% women).
However, from 48.5% women at
contract level J0 (Lecturer B at Pre
92 HEIs or Senior Lecturer at Post
92s, Senior Research Fellow)
upwards there are proportionally
more men than women present at
every contract level
Only 39.2% of those at contract
level I0 (Senior/Principal Lecturer,
Reader, Principal Research Fellow)
are women as are 37.7% of F2
Function Heads.
Less than one quarter (23.9%) of
Professors are women. This stark
imbalance, when coupled with the
large monetary gender pay gap
among professors, is a primary
driver of the overall gender pay gap
for academics working the UK.
10
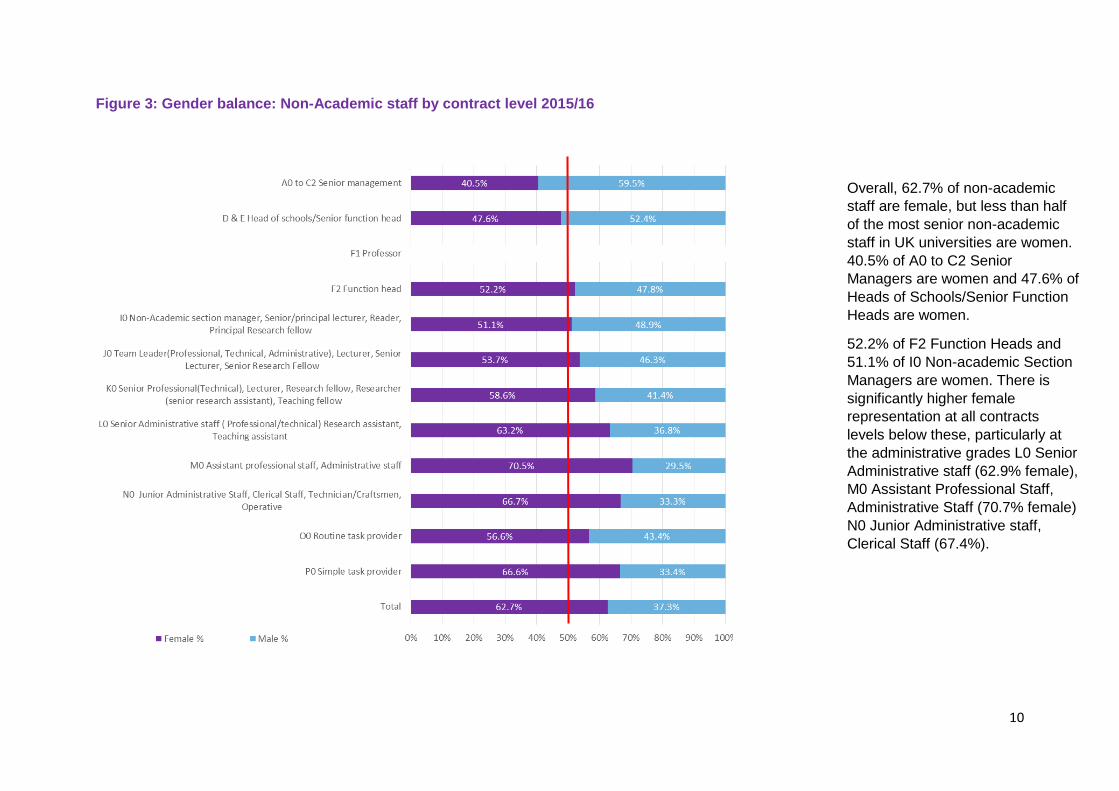
Figure 3: Gender balance: Non-Academic staff by contract level 2015/16
Overall, 62.7% of non-academic
staff are female, but less than half
of the most senior non-academic
staff in UK universities are women.
40.5% of A0 to C2 Senior
Managers are women and 47.6% of
Heads of Schools/Senior Function
Heads are women.
52.2% of F2 Function Heads and
51.1% of I0 Non-academic Section
Managers are women. There is
significantly higher female
representation at all contracts
levels below these, particularly at
the administrative grades L0 Senior
Administrative staff (62.9% female),
M0 Assistant Professional Staff,
Administrative Staff (70.7% female)
N0 Junior Administrative staff,
Clerical Staff (67.4%).

11
5.2 Gender pay gap
5.2.1 All staff
Tables 2 and 3 below the median and mean gender pay gap for all staff employed at UK
universities during 2015/16 (excluding atypical staff) by contract level, and show both the
monetary and percentage gender pay gap at each of the twelve available contract levels.
Table 2: Median salary gender pay gap all staff 2015/16
Contract levels
Female
Median
salary (£)
Male
Median
salary (£)
£
difference
% Gender
pay gap
A0 to C2 Senior management 87,873 100,000 12,127 12.1%
D & E Head of schools/Senior function head 65,655 70,122 4,467 6.4%
F1 Professor 71,685 76,519 4,834 6.3%
F2 Function head 59,823 62,590 2,767 4.4%
I0 Non-Academic section manager, Senior/principal lecturer, Reader,
Principal Research fellow 55,389 55,389 - 0.0%
J0 Team Leader(Professional, Technical, Administrative), Lecturer, Senior
Lecturer, Senior Research Fellow 46,414 46,414 - 0.0%
K0 Senior Professional(Technical), Lecturer, Research fellow, Researcher
(senior research assistant), Teaching fellow 36,672 36,672 - 0.0%
L0 Senior Administrative staff ( Professional/technical) Research assistant,
Teaching assistant 29,848 30,738 890 2.9%
M0 Assistant professional staff, Administrative staff 24,298 24,298 - 0.0%
N0 Junior Administrative Staff, Clerical Staff, Technician/Craftsmen,
Operative 20,400 20,400 - 0.0%
O0 Routine task provider 17,209 17,153 56- -0.3%
P0 Simple task provider 14,953 15,258 305 2.0%
Total 32,600 37,768 5,168 13.7%

12
Table 3: Mean salary gender pay gap all staff 2015/16
Tables 2 and 3 above demonstrate why it is important to use both median and median when
analysing the gender pay gap. The median salaries displayed in Table 2 show no gender
pay gap at five separate contract levels including contract levels I0, J0 and K0 which are
equivalent to points 26 to 51 of the national pay spine. Whilst the mean averages shown at
Table 3 show gender pay gaps of between 2.3% and 0.9% at each of these levels. The
mean gender pay is also larger at senior levels at 15.4% A0 to C2 for senior managers
(12.1% median), 9.2% D&E for Head of schools/Senior function head (6.4% median). For
the Professors, the mean and median gender pay gaps are the same, at 6.3%. For F2
Function Heads there is wide variation between the mean (8.3%) and the median (4.4%).
The only gender pay gap in favour of women at any contract level is the median and mean
for the second most junior contract level of O0 Routine Task Provider, which is 0.3% and
0.4% respectively.
The overall gender pay gap of 13.7% (median) and 17.8% (mean) primarily results from the
combination of large gender pay gaps among more senior grades (A0 to C2 Senior
management, D & E Heads of Schools/Senior Function Head, F1 Professors and F2
Function Heads) combined with, detailed in the previous section of this report, significant
gender imbalances at these grades.
Contract levelsFemale Mean
salary (£)
Male Mean
salary (£)
£
difference
% Gender
pay gap
A0 to C2 Senior management 95,055 112,313 17,258 15.4%
D & E Head of schools/Senior function head 68,307 75,206 6,899 9.2%
F1 Professor 76,062 81,178 5,116 6.3%
F2 Function head 60,455 65,957 5,502 8.3%
I0 Non-Academic section manager, Senior/principal lecturer, Reader, Principal
Research fellow 56,126 57,426 1,300 2.3%
J0 Team Leader(Professional, Technical, Administrative), Lecturer, Senior
Lecturer, Senior Research Fellow 45,554 45,949 395 0.9%
K0 Senior Professional(Technical), Lecturer, Research fellow, Researcher
(senior research assistant), Teaching fellow 36,679 37,092 413 1.1%
L0 Senior Administrative staff ( Professional/technical) Research assistant,
Teaching assistant 30,439 31,021 582 1.9%
M0 Assistant professional staff, Administrative staff 24,381 24,703 322 1.3%
N0 Junior Administrative Staff, Clerical Staff, Technician/Craftsmen,
Operative 20,725 20,750 25 0.1%
O0 Routine task provider 17,661 17,599 62- -0.4%
P0 Simple task provider 15,341 15,627 286 1.8%
Total 34,659 42,152 7,493 17.8%

13
5.2.2 Academic staff
Table 4: Median salary gender pay gap staff on academic contract 2015/16
Table 5: Mean salary gender pay gap staff on academic contract 2015/16
The overall mean and median gender pay gaps for staff on academic contracts is lower than
for all staff at 12.2% (median) and 12.0% (mean) but there are still very significant gaps
present, particularly at the four most senior contract levels.
Contract levels
Female
Median
salary (£)
Male
Median
salary (£)
£
difference
% Gender
pay gap
A0 to C2 Senior management 100,000 106,742 6,742 6.3%
D & E Head of schools/Senior function head 65,224 70,124 4,900 7.0%
F1 Professor 71,685 76,561 4,876 6.4%
F2 Function head 77,189 80,761 3,572 4.4%
I0 Non-Academic section manager, Senior/principal lecturer, Reader,
Principal Research fellow 55,389 55,389 - 0.0%
J0 Team Leader(Professional, Technical, Administrative), Lecturer, Senior
Lecturer, Senior Research Fellow 46,414 46,414 - 0.0%
K0 Senior Professional(Technical), Lecturer, Research fellow, Researcher
(senior research assistant), Teaching fellow 35,897 35,609 288- -0.8%
L0 Senior Administrative staff ( Professional/technical) Research assistant,
Teaching assistant 30,738 31,655 917 2.9%
M0 Assistant professional staff, Administrative staff 25,023 24,298 725- -3.0%
N0 Junior Administrative Staff, Clerical Staff, Technician/Craftsmen,
Operative 24,055 24,055 - 0.0%
O0 Routine task provider 57,136 57,041 95- -0.2%
P0 Simple task provider N/A N/A N/A N/A
Total 40,082 45,658 5,576 12.2%
Contract levelsFemale Mean
salary (£)
Male Mean
salary (£)
£
difference
% Gender
pay gap
A0 to C2 Senior management 107,150 123,298 16,148 13.1%
D & E Head of schools/Senior function head 68,033 75,778 7,745 10.2%
F1 Professor 76,058 81,180 5,122 6.3%
F2 Function head 73,752 81,818 8,066 9.9%
I0 Non-Academic section manager, Senior/principal lecturer, Reader, Principal
Research fellow 56,671 57,810 1,139 2.0%
J0 Team Leader(Professional, Technical, Administrative), Lecturer, Senior
Lecturer, Senior Research Fellow 45,570 45,874 304 0.7%
K0 Senior Professional(Technical), Lecturer, Research fellow, Researcher
(senior research assistant), Teaching fellow 36,695 37,064 369 1.0%
L0 Senior Administrative staff ( Professional/technical) Research assistant,
Teaching assistant 31,305 31,859 554 1.7%
M0 Assistant professional staff, Administrative staff 25,286 24,508 778- -3.2%
N0 Junior Administrative Staff, Clerical Staff, Technician/Craftsmen,
Operative 22,805 22,451 354- -1.6%
O0 Routine task provider 51,769 48,668 3,101- -6.4%
P0 Simple task provider N/A N/A N/A N/A
Total 43,726 49,709 5,983 12.0%
14
In 2013/14 the mean academic gender pay gap was 12.6% and in 2014/15 it was 12.3%. At
the current rate of change it take another 40 years to close this gap.
The median gender pay gap for A0 to C2 Senior Management is 6.3%, but the mean gap is
13.1% - an indication that there is a substantial preponderance of male senior managers
among the very top earners in this grade. The same phenomenon is displayed, although
slightly mitigated, at the D&E Head of Schools/Senior Function Head level, where the
median gender pay gap is 7.0% but the mean gap is 10.2%.
The herding effect of the national spine on median salaries is again evident at the I0
Senior/Principal Lecturer, Reader, Principal Research Fellow and J0 Lecturer B, Senior
Lecturer, Senior Research Fellow contract levels. The median shows no gender pay gap
whatsoever for these levels, however the mean shows a gap of 2.0% at contract level I0 and
0.7% at contract level J0.
There are three contract levels with a slight pay gap in favour of women at the median (K0
0.8%, M0 3.0% and O0 0.2%) and three at the mean (M0 3.2%, N0 1.6% and O0 6.4%).
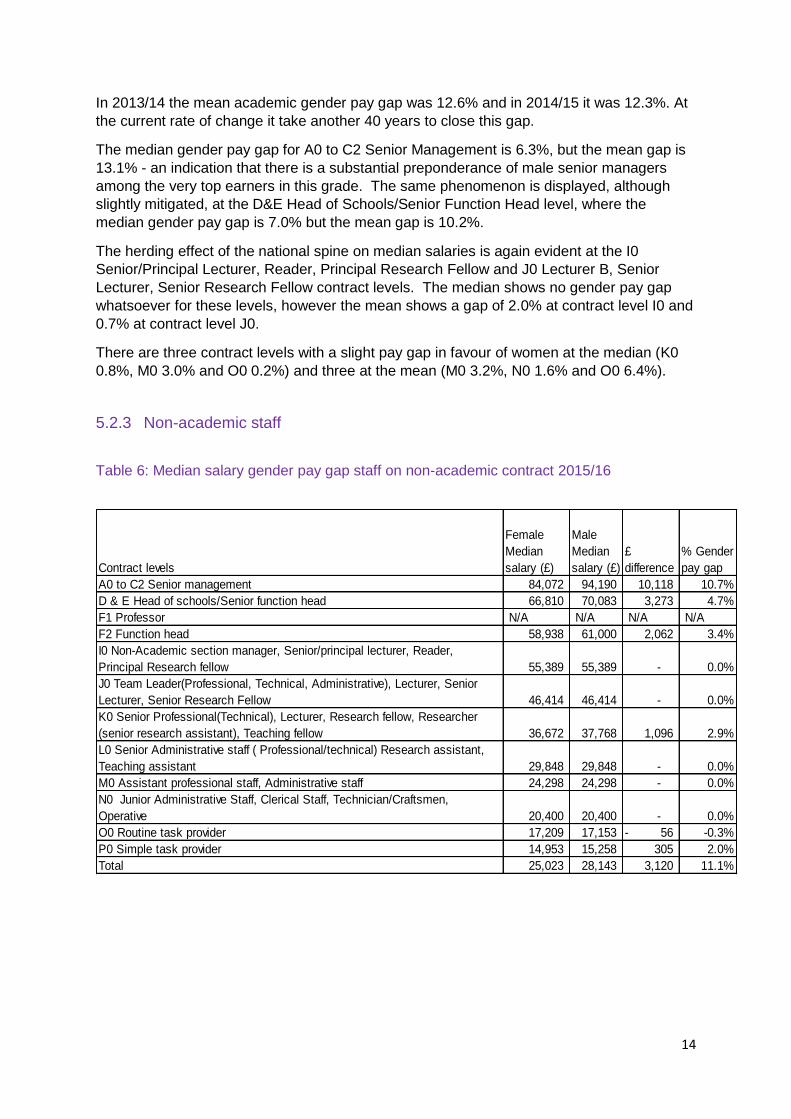
5.2.3 Non-academic staff
Table 6: Median salary gender pay gap staff on non-academic contract 2015/16
Contract levels
Female
Median
salary (£)
Male
Median
salary (£)
£
difference
% Gender
pay gap
A0 to C2 Senior management 84,072 94,190 10,118 10.7%
D & E Head of schools/Senior function head 66,810 70,083 3,273 4.7%
F1 Professor N/A N/A N/A N/A
F2 Function head 58,938 61,000 2,062 3.4%
I0 Non-Academic section manager, Senior/principal lecturer, Reader,
Principal Research fellow 55,389 55,389 - 0.0%
J0 Team Leader(Professional, Technical, Administrative), Lecturer, Senior
Lecturer, Senior Research Fellow 46,414 46,414 - 0.0%
K0 Senior Professional(Technical), Lecturer, Research fellow, Researcher
(senior research assistant), Teaching fellow 36,672 37,768 1,096 2.9%
L0 Senior Administrative staff ( Professional/technical) Research assistant,
Teaching assistant 29,848 29,848 - 0.0%
M0 Assistant professional staff, Administrative staff 24,298 24,298 - 0.0%
N0 Junior Administrative Staff, Clerical Staff, Technician/Craftsmen,
Operative 20,400 20,400 - 0.0%
O0 Routine task provider 17,209 17,153 56- -0.3%
P0 Simple task provider 14,953 15,258 305 2.0%
Total 25,023 28,143 3,120 11.1%

15
Table 7: Mean salary gender pay gap staff on non-academic contract 2015/16
Tables 6 and 7 show overall gaps for non-academic staff of 11.1% (median) and 9.9%
(mean). Again, the widest gender pay gap in favour of men is seen at the A0 to C2 Senior
Management level at 10.7% (median) and 14.1% (mean). There is a 3.7% median gap for
non-academic D&E Head of Schools / Senior Function Heads and a 6.4% mean gap at this
level. The limited value of assessing median gender pay gaps against the 51 point pay
spine can be seen again, with five separate contract levels showing 0.0% gaps at the
median while the equivalent mean salaries show gaps in favour of men of up to 1.8%.
Contract Level O0 Routine Task Provider shows a median gap in favour of women of 0.3%.
Contract levelsFemale Mean
salary (£)
Male Mean
salary (£)
£
difference
% Gender
pay gap
A0 to C2 Senior management 88,457 102,980 14,523 14.1%
D & E Head of schools/Senior function head 68,824 73,475 4,651 6.3%
F1 Professor N/A N/A N/A N/A
F2 Function head 59,399 63,677 4,278 6.7%
I0 Non-Academic section manager, Senior/principal lecturer, Reader, Principal
Research fellow 54,094 55,108 1,014 1.8%
J0 Team Leader(Professional, Technical, Administrative), Lecturer, Senior
Lecturer, Senior Research Fellow 45,514 46,191 677 1.5%
K0 Senior Professional(Technical), Lecturer, Research fellow, Researcher
(senior research assistant), Teaching fellow 36,651 37,163 512 1.4%
L0 Senior Administrative staff ( Professional/technical) Research assistant,
Teaching assistant 29,973 30,287 314 1.0%
M0 Assistant professional staff, Administrative staff 24,340 24,722 382 1.5%
N0 Junior Administrative Staff, Clerical Staff, Technician/Craftsmen,
Operative 20,701 20,705 4 0.0%
O0 Routine task provider 17,465 17,528 63 0.4%
P0 Simple task provider 15,340 15,627 287 1.8%
Total 28,343 31,458 3,115 9.9%

16
5.3 Gender stratification across the 51 point pay spine Looking at the gender balance of academic staff at each point of the national 51 point pay spine helps to give an indication of the career points
where divergence may contribute to the gender pay gap. Figure 4 below shows the percentage of female and male staff on academic contracts
at each point of the scale. As might be expected, there are large spikes for both at point 36 (the AC2/AC3 threshold), points 43 and 44 (the
AC3/AC4 threshold) and at point 49 (the top of AC4). However, the most striking part of the chart is the subtle shift in proportions of men and
women as the pay spine progresses. At every spine point up to 43 there are proportionally more women than men (with equal numbers at
points 38 and 41) but at every point from 44 onwards there are proportionately more men. This is particularly evident at the very top of the
scale where there are significantly more men (7.9% vs.12.5%) than women on points 49 – 51. This imbalance precedes the even larger and
entrenched imbalance at the professorial level beyond the top of the 51 point spine.
Figure 4: Percentage of female and male academic staff per spine point 2015/16

17
5.4 Gender stratification across the 51 point pay spine by age group Looking at the gender balance by spine point split into age groups provides greater detail of the career stage where the above imbalance starts
to occur and could provide an indication of where greater efforts in terms of career development and access to progression are required.
Figures 5 to 9 below present the same spine point data for all academic staff as shown above, but split into ten year age groups.
Splitting the data in this way shows that gender based divergence occurs early on in academic careers and is firmly entrenched by the mid-
career stage with very stark stratification apparent in the 40-49 year age group.
Figure 5: Percentage of female and male academic staff by spine point 2015/16 (<30 years)
For academics aged under 30 years there are more women than men across the early AC1 grades, but from point 28 to point 34 (the upper
points of AC1 and the entirety of AC2) there are more men than women.
F15and
belowF16 F17 F18 F19 F20 F21 F22 F23 F24 F25 F26 F27 F28 F29 F30 F31 F32 F33 F34 F35 F36 F37 F38 F39 F40 F41 F42 F43 F44 F45
F46and
above
Female 1.7% 2.3% 0.4% 0.7% 0.3% 0.2% 1.9% 2.8% 3.5% 6.1% 5.2% 6.8% 6.5% 3.4% 7.9% 12.1% 9.4% 8.2% 6.0% 4.0% 2.2% 2.6% 1.9% 1.5% 1.1% 0.5% 0.3% 0.1% 0.1% 0.1% 0.1% 0.0%
Male 1.7% 2.4% 0.3% 0.6% 0.2% 0.3% 1.8% 2.2% 3.6% 5.0% 4.8% 4.7% 6.0% 4.3% 9.6% 13.1% 10.6% 8.2% 6.1% 4.1% 2.2% 2.4% 1.8% 1.4% 1.0% 0.6% 0.2% 0.2% 0.2% 0.1% 0.1% 0.1%
0.0%
2.0%
4.0%
6.0%
8.0%
10.0%
12.0%
14.0%
Academic staff 30 years and under
18
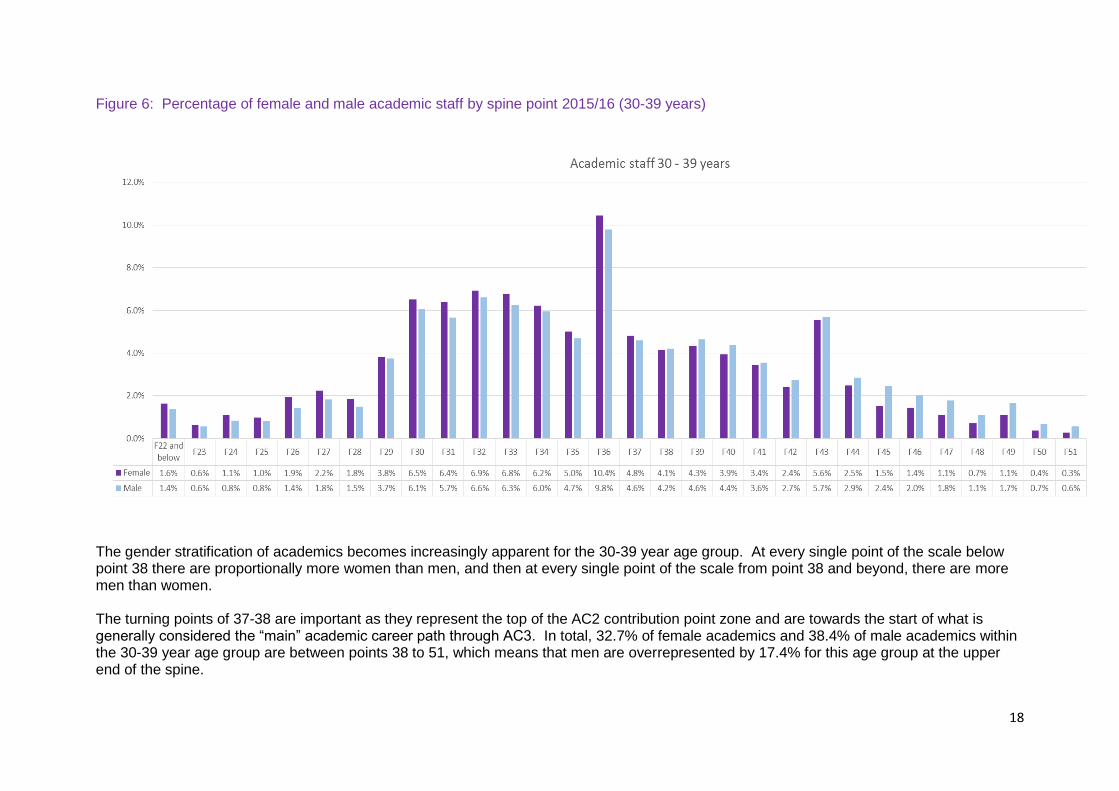
Figure 6: Percentage of female and male academic staff by spine point 2015/16 (30-39 years)
The gender stratification of academics becomes increasingly apparent for the 30-39 year age group. At every single point of the scale below point 38 there are proportionally more women than men, and then at every single point of the scale from point 38 and beyond, there are more men than women. The turning points of 37-38 are important as they represent the top of the AC2 contribution point zone and are towards the start of what is generally considered the “main” academic career path through AC3. In total, 32.7% of female academics and 38.4% of male academics within the 30-39 year age group are between points 38 to 51, which means that men are overrepresented by 17.4% for this age group at the upper end of the spine.

19
Figure 7: Percentage of female and male academic staff by spine point 2015/16 (40-49 years)
For academics aged 40-49 years men outnumber women at every point from 45 onwards, whereas women proportionately outnumber men at
every spine point below 45. There are particular spikes in the representation of women around the AC3 – AC4 threshold points of 43 and 44.
From those points onwards men outnumber women with significantly larger proportional gaps than there are at the lower spine points where
women outnumber men.

20
Overall, 23.2% of female academics aged 40-49 years are at or above point 45 of the spine, whereas 32.5% of male academics in that age
group are at or above point 45. This represents a 40.0% overrepresentation of men at the top of the spine.
Figure 8: Percentage of female and male academic staff by spine point 2014/15 (50-59 years)
The divergence pattern among academics aged 50-59 is very similar to that seen for the 40-49 year age group, but shows increased clustering
at the very top, from point 49 to point 51. There are proportionally more men than women at every spine point from 44 onwards, and again
significantly more men than women from point 49 to point 51. 15.5% of female academics and 26.1% of male academics aged 50-59 years are
between points 49-51 of the scale, a male overrepresentation of 68.4%.

21
Figure 9: Percentage of female and male academic staff by spine point 2015/16 (60+ years)
The same significant overrepresentation of men at the very top of the spine shown at previous age groups is evident for academics aged 60
years and over. There is a 37.2% overrepresentation of men at top three points of the scale. Additionally, there is the re-emergence of an
overrepresentation of male academics at spine points 43 and 44, something evident at the 30-39 year age group but not seen at for the age
groups of 40-49 years or 50-59 years.

22
6 Findings split by University Group (Russell Group, Other Pre 92, and Post 92)
6.1 Gender pay gap by University Group and contract level
The analysis that follows presents the gender pay gap, gender balance and distribution of academic staff across the 51 point pay spine for
three separate groups of universities – the Russell Group, Other Pre 92 institutions that are not part of the Russell Group, and Post 92
institutions.
The Russell Group comprises 24 of the largest and most research intensive universities in the UK, and all members of the Russell Group are
Pre 92 Universities. The “Other Pre 92” category includes 42 institutions that predate the conversion of a large number of Polytechnics and
Colleges of Higher Education to University status in 1992. The “Post 92” category used here includes the 78 “new” universities that had their
status converted in this way. Although there are some differences between job titles across the 51 point spine (e.g. Senior lecturer at Post 92
institutions covers the same points as Lecturer B in Pre 92 and Russell Group instructions) the 51 point pay spine should be applied in the
same way at all UK Higher Education Institutions.
Nineteen performing arts institutions classed by HESA as not being either Pre or Post 92 institutions have been excluded from this analysis.
These exclusions have the effect of removing 2.2% of total academic staff from the analysis.
As table 8 below shows, the largest gender pay gap is for staff employed by the 24 elite Russell Group Institutions, where the mean average
male salary is 20.1% higher than the mean average female salary. This difference is equal to an average deficit of £8,882 for each female
employee each year. Other Pre 92 institutions have an average gender pay gap of 18.5%, an average of £7,801 per year. At Post 92
institutions, the mean average gender pay gap for all staff is 13.1%, £5,140 annually.
The largest pay gap at any contract level is found among A0 to C2 Senior Managers at Russell Group institutions, where men earn an average
of £18,897 (14.7%) more than women. At Post 92 institutions, there is a gap among these most senior staff of 14.0% (£14,813 per year), and
within the Other Pre 92 grouping, there are double digit pay gaps at both the A0 to C2 Senior Managers level (13.6%) and the D & E Head of
school / Senior function head level (13.5%).
Among the professoriate, Pre 92 institutions display significantly larger gaps than Post 92 institutions. Within the Russell Group the professorial
gender pay gap stands at 5.9% (£4,984 per year), and for the Other Pre 92 institutions the gap is even higher at 6.5% (£5,235 per year). At
Post 92 institutions, the professorial gender pay gap is smaller at 2.4% (£1,631).

23
Table 8: All staff by university group and contract level
Contract levels
Female
Mean
salary (£)
Male
Mean
salary (£)
£
difference
%
Gender
pay gap
Female
Mean
salary (£)
Male
Mean
salary (£)
£
differenc
e
%
Gender
pay
gap
Female
Mean
salary
(£)
Male
Mean
salary (£)
£
difference
%
Gender
pay
gap
Female
Mean
salary (£)
Male
Mean
salary (£)
£
difference
%
Gender
pay gap
A0 to C2 Senior management £109,905 £128,802 £18,897 14.7% £96,763 £112,048 £15,285 13.6% £91,275 £106,088 £14,813 14.0% £74,392 £87,306 £12,914 14.8%
D & E Head of schools/Senior function head £80,673 £87,280 £6,607 7.6% £69,699 £80,569 £10,870 13.5% £63,735 £66,419 £2,684 4.0% £51,660 £54,771 £3,111 5.7%
F1 Professor £79,427 £84,411 £4,984 5.9% £75,556 £80,791 £5,235 6.5% £65,988 £67,619 £1,631 2.4% £69,117 £61,717 -£7,400 -12.0%
F2 Function head £67,599 £73,027 £5,428 7.4% £61,094 £64,496 £3,402 5.3% £56,301 £58,818 £2,517 4.3% £38,927 £44,942 £6,015 13.4%
I0 Non-Academic section manager, Senior/principal lecturer,
Reader, Principal Research fellow £58,753 £59,742 £989 1.7% £55,807 £56,479 £672 1.2% £53,000 £54,077 £1,077 2.0% £48,933 £50,134 £1,201 2.4%
J0 Team Leader(Professional, Technical, Administrative), Lecturer,
Senior Lecturer, Senior Research Fellow £46,371 £46,893 £522 1.1% £45,370 £45,623 £253 0.6% £44,976 £45,269 £293 0.6% £44,369 £43,820 -£549 -1.3%
K0 Senior Professional(Technical), Lecturer, Research fellow,
Researcher (senior research assistant), Teaching fellow £36,405 £36,362 -£43 -0.1% £37,556 £38,027 £471 1.2% £35,847 £36,308 £461 1.3% £42,201 £48,028 £5,827 12.1%
L0 Senior Administrative staff ( Professional/technical) Research
assistant, Teaching assistant £31,074 £31,944 £870 2.7% £30,001 £29,877 -£124 -0.4% £30,133 £30,624 £491 1.6% £27,987 £30,109 £2,122 7.0%
M0 Assistant professional staff, Administrative staff £24,642 £24,925 £283 1.1% £24,166 £24,515 £349 1.4% £24,275 £24,565 £290 1.2% £23,844 £24,935 £1,091 4.4%
N0 Junior Administrative Staff, Clerical Staff,
Technician/Craftsmen, Operative £21,271 £20,898 -£373 -1.8% £20,391 £20,681 £290 1.4% £20,366 £20,655 £289 1.4% £19,917 £20,377 £460 2.3%
O0 Routine task provider £17,490 £17,455 -£35 -0.2% £18,341 £17,522 -£819 -4.7% £17,438 £17,892 £454 2.5% £17,130 £17,930 £800 4.5%
P0 Simple task provider £15,466 £15,838 £372 2.3% £15,245 £15,547 £302 1.9% £15,268 £15,387 £119 0.8% £15,628 £15,816 £188 1.2%Total £35,352 £44,234 £8,882 20.1% £34,411 £42,212 £7,801 18.5% £33,993 £39,133 £5,140 13.1% £34,881 £41,330 £6,449 15.6%
Russell Group Other pre-92 Post 92 Other

24
Table 9: Academic contract by university group
Contract levels
Female
Mean
salary (£)
Male
Mean
salary (£)
£
difference
%
Gender
pay gap
Female
Mean
salary (£)
Male
Mean
salary (£)
£
difference
%
Gender
pay
gap
Female
Mean
salary
(£)
Male
Mean
salary (£)
£
difference
%
Gender
pay
gap
Female
Mean
salary (£)
Male
Mean
salary (£)
£
difference
%
Gender
pay gap
A0 to C2 Senior management £123,177 £139,562 £16,385 11.7% £103,455 £123,252 £19,797 16.1% £108,349 £119,777 £11,428 9.5% £73,857 £88,963 £15,106 17.0%
D & E Head of schools/Senior function head £80,911 £88,183 £7,272 8.2% £71,332 £82,761 £11,429 13.8% £64,199 £66,787 £2,588 3.9% £51,924 £54,859 £2,935 5.4%
F1 Professor £79,429 £84,414 £4,985 5.9% £75,538 £80,791 £5,253 6.5% £65,988 £67,619 £1,631 2.4% £69,117 £61,717 -£7,400 -12.0%
F2 Function head £76,022 £84,309 £8,287 9.8% N/A N/A N/A N/A N/A £56,993 £56,994 100.0% N/A N/A N/A N/A
I0 Non-Academic section manager, Senior/principal lecturer,
Reader, Principal Research fellow £59,465 £60,165 £700 1.2% £56,086 £56,697 £611 1.1% £53,562 £54,439 £877 1.6% £50,879 £50,351 -£528 -1.0%
J0 Team Leader(Professional, Technical, Administrative), Lecturer,
Senior Lecturer, Senior Research Fellow £46,245 £46,803 £558 1.2% £45,400 £45,462 £62 0.1% £45,204 £45,380 £176 0.4% £45,455 £44,178 -£1,277 -2.9%
K0 Senior Professional(Technical), Lecturer, Research fellow,
Researcher (senior research assistant), Teaching fellow £35,989 £35,820 -£169 -0.5% £37,698 £38,161 £463 1.2% £36,038 £36,431 £393 1.1% £43,889 £50,028 £6,139 12.3%
L0 Senior Administrative staff ( Professional/technical) Research
assistant, Teaching assistant £32,181 £33,202 £1,021 3.1% £29,420 £29,370 -£50 -0.2% £31,781 £31,776 -£5 0.0% £28,224 £28,130 -£94 -0.3%
M0 Assistant professional staff, Administrative staff £26,381 £24,634 -£1,747 -7.1% £24,543 £25,356 £813 3.2% £24,224 £23,955 -£269 -1.1% £25,843 £23,157 -£2,686 -11.6%
N0 Junior Administrative Staff, Clerical Staff,
Technician/Craftsmen, Operative £27,260 £25,787 -£1,473 -5.7% £23,987 £24,061 £74 0.3% £20,633 £20,222 -£411 -2.0% N/A N/A N/A N/A
O0 Routine task provider N/A N/A N/A N/A £56,552 £55,678 -£874 -1.6% N/A N/A N/A 0.0% N/A N/A N/A N/A
P0 Simple task provider N/A N/A N/A N/A N/A N/A N/A N/A N/A N/A N/A 0.0% N/A N/A N/A N/ATotal £44,509 £52,427 £7,918 15.1% £43,400 £49,922 £6,522 13.1% £43,065 £45,577 £2,512 5.5% £43,849 £48,151 £4,302 8.9%
Russell Group Other pre-92 Post 92 Other

25
Table 9, above, shows that as is the case for all staff, the gender pay gap for academic staff is concentrated at the more senior contracts levels.
A0 to C2 Senior Managers have a gap of 11.7% at Russell Group institutions, 16.1% at Other Pre 92 institutions, and 9.5% at Post 92
institutions. The gap for staff at D & E Head of school / senior function head level is also highest in the Other Pre 92 grouping at 13.8%,
compared to 8.2% within the Russell Group and 3.9% at Post 92 institutions.
Among Professors the Russell Group (5.9%) and Other Pre 92 institutions (6.5%) display a substantially larger gap than is found at Post 92
institutions, where the gender pay gap is comparatively low at 2.4%.
In fact, the overall gender pay gap is substantially smaller for Post 92 universities than it is for Pre 92 institutions. For academic staff at all
contract levels the gap is 5.5% at Post 92 institutions, whereas within the Russell Group it is 15.1% and at Other Pre 92 institutions it is 13.1%.
In addition to the higher gender pay gap seen among professors at Russell Group and Other Pre 92 universities in comparison with Post 92
institutions, the fact that Russell Group and Pre 92s employ a proportionally larger number of professors is likely to contribute to this. For
example, professors account for 14.2% of academic staff at Russell Group universities, and 10.4% at Other Pre 92 institutions, but only 4.5% of
academic staff at Post 92 institutions.
The larger pay gap seen among the professoriate in combination with the very large gender imbalance in favour of men is the main contributor
to the overall gender pay gap for academic staff. The much lower representation of professors in the Post 92 academic staffing cohort means
that these factors have less of an impact on the overall gap at Post 92 institutions than they do at Russell Group and Other Pre 92 universities.

26
Table 10: Non-academic contract by university mission group
Contract levels
Female
Mean
salary (£)
Male
Mean
salary (£)
£
difference
%
Gender
pay gap
Female
Mean
salary (£)
Male
Mean
salary (£)
£
difference
%
Gender
pay
gap
Female
Mean
salary
(£)
Male
Mean
salary (£)
£
difference
%
Gender
pay
gap
Female
Mean
salary (£)
Male
Mean
salary (£)
£
difference
%
Gender
pay gap
A0 to C2 Senior management £104,006 £120,713 £16,707 13.8% £93,133 £103,518 £10,385 10.0% £81,254 £93,159 £11,905 12.8% £74,697 £85,454 £10,757 12.6%
D & E Head of schools/Senior function head £80,402 £85,008 £4,606 5.4% £67,528 £74,043 £6,515 8.8% £62,446 £65,193 £2,747 4.2% £51,082 £54,349 £3,267 6.0%
F1 Professor N/A N/A N/A N/A N/A N/A N/A N/A N/A N/A N/A N/A N/A N/A N/A N/A
F2 Function head £65,737 £69,374 £3,637 5.2% £61,093 £64,481 £3,388 5.3% £56,307 £58,866 £2,559 4.3% £38,743 £44,882 £6,139 13.7%
I0 Non-Academic section manager, Senior/principal lecturer,
Reader, Principal Research fellow £56,239 £57,003 £764 1.3% £54,753 £55,171 £418 0.8% £50,661 £52,079 £1,418 2.7% £45,385 £49,551 £4,166 8.4%
J0 Team Leader(Professional, Technical, Administrative), Lecturer,
Senior Lecturer, Senior Research Fellow £46,581 £47,093 £512 1.1% £45,312 £46,025 £713 1.5% £43,744 £44,583 £839 1.9% £40,278 £42,244 £1,966 4.7%
K0 Senior Professional(Technical), Lecturer, Research fellow,
Researcher (senior research assistant), Teaching fellow £37,004 £37,550 £546 1.5% £37,292 £37,683 £391 1.0% £35,411 £35,948 £537 1.5% £35,247 £37,020 £1,773 4.8%
L0 Senior Administrative staff ( Professional/technical) Research
assistant, Teaching assistant £30,290 £30,442 £152 0.5% £30,372 £30,377 £5 0.0% £29,594 £30,010 £416 1.4% £27,934 £30,810 £2,876 9.3%
M0 Assistant professional staff, Administrative staff £24,549 £24,953 £404 1.6% £24,152 £24,438 £286 1.2% £24,277 £24,628 £351 1.4% £23,731 £25,092 £1,361 5.4%
N0 Junior Administrative Staff, Clerical Staff,
Technician/Craftsmen, Operative £21,252 £20,886 -£366 -1.8% £20,324 £20,488 £164 0.8% £20,361 £20,669 £308 1.5% £19,898 £20,417 £519 2.5%
O0 Routine task provider £17,490 £17,455 -£35 -0.2% £17,477 £17,222 -£255 -1.5% £17,441 £17,894 £453 2.5% £17,130 £17,930 £800 4.5%
P0 Simple task provider £15,466 £15,838 £372 2.3% £15,243 £15,549 £306 2.0% £15,267 £15,387 £120 0.8% £15,628 £15,816 £188 1.2%Total £29,265 £32,205 £2,940 9.1% £28,329 £31,545 £3,216 10.2% £27,199 £30,304 £3,105 10.2% £28,165 £32,083 £3,918 12.2%
Russell Group Other pre-92 Post 92 Other
27
The overall gender pay gap among non-academic staff is smaller than for academic staff for all three university groups. The gap for non-
academic staff at Russell Group universities is 9.1%, and for both Other Pre 92 universities and Post 92 institutions it is 10.2%. As is the case
for academic staff, the overall gaps for non-academic staff are driven by very large gaps at the most senior levels. Among the Russell Group,
the gap for A0 to C2 Senior Management is 13.8%, for Other Pre 92 institutions it is 10.0% and for Post 92 institutions it is 12.8%. There are
also substantial gaps at the D &E Head of School / Senior Function Head Level of 5.4%, 8.8% and 4.2% at Russell Group, Other Pre 92 and
Post 92 instructions respectively. Large gaps continue at the F2 Function Head contact level where the Russell Group shows a gender pay
gap of 5.2%, Other Pre 92 institutions report a gap of 5.3% and Post 92 institutions report a gap of 4.3%. There are insufficient professors
employed on non-academic contracts to calculate their gender pay gap.
Post 92 institutions have higher gender pay gaps than Russell Group and Other Pre 92 institutions at the mid and junior contract levels. At the
I0 Non-academic section manager level Post 92s show a gender pay gap of 2.7%, compared to 1.3% for the Russell Group and 0.8% for Other
Pre 92s. At Russell Group and Other Pre 92 universities N0 and O0 level staff undertaking administrative, clerical and routine work have either
small gender pay gaps in favour of women or small gaps in favour of men, whereas at Post 92 universities there are gaps of 1.5% and 2.5% in
favour of men.

28
5.2 Gender balance gap by University Group and contract level
Figure 9: Gender balance by university group Academic contract (Russell Group)
Figure 9 shows how gender imbalance
is entrenched with seniority at Russel
Group universities. There are
proportionally more women than men at
the three lowest paid contract levels N0,
M0 and L0, but more men than women
at every level above this. This chart
shows how the imbalance increases
significantly to 64.7% male at the I0
Senior/Principal Lecturer, Reader,
Principal Research Officer level
(framework grade AC4) from 54.4%
male at the Lecturer/ Senior Lecturer,
Senior Research Fellow level
(framework grade AC3).
This difference is significant as there is
no expectation of automatic movement
between AC3 and AC4 as these is
between AC2 and AC3, and this
coincides with a significant and lasting
decline in the gender balance – Women
are only 36.6% of F2 Function Heads
and only 27.8% of Heads of schools /
Senior Functions Heads at within the
Russell Group. Alarmingly, only 22.7%
of Professors at Russell Group
institutions are women, and this huge
imbalance, coupled with the pay gap of
5.9% within the professorial contract
level, is a primary driver of the overall
gender pay gap within the Russell
Group.

29
Figure 10: Gender balance by university group Academic contract – Other Pre 92
At Other Pre 92 Universities there is
a distinct gender imbalance from
the I0 Senior/principal lecturer,
Reader, Principal Research Fellow
contract level onwards. Again,
women are vastly underrepresented
among the professoriate, and make
up only 23.7% of professors at
Other Pre 92 institutions. Women
are also less than a third of staff at
the D&E Head of Scholl/Senior
Function Head level and at the A0
to C2 Senior Management level.
There are more women than men at
the early career contract levels of
L0 Research Assistant, Teaching
Assistant (AC1) and the AC2
contract level of K0 Lecturer A
/Researcher. From here the
balance declines to 47.4% women
at the J0 Lecturer B, Senior
Research Fellow level and 40.0% at
the AC4 contract level of I0 Senior
Lecturer/Senior Research Fellow.
Overall, although the increase in
gender imbalance with career
progression is not as stark for Other
Pre 92 institutions as it is within the
Russell Group, the number of
women still declines significantly as
seniority increases.

30
Figure 11: Gender balance by university group Academic contract – Post 92
There is an even gender
balance at the first six contract
levels at Post 92 universities,
from O0 Routine task provider
to J0 Senior Lecturer, Senior
Research Fellow. However,
men proportionally outnumber
women at every level from I0
Principal Lecturer, Principal
Research Fellow to A0 to C2
Senior Management.
Although the imbalance is not
as severe as it is for Russell
Group or Pre 92 institutions,
there is still a dearth of women
at the most senior academic
level. Only 29.1% of
professors at Post 92
universities are women, and
only a third A0 to C2 Senior
Managers are women.
Representation of women at
the D &E Head of
school/Senior Function Head
level is higher than for the
Russell Group and Pre 92
institutions, at 42.8%, but still
significantly short of gender
balance.

31
Figure 12: Gender balance by university group Non-academic contract (Russell Group)
The following three charts (figures 12, 13
and 14) show the gender balance among
non-academic staff at each of the three
university groups. For all three groups
there are more women than men at most
contract levels, although men
proportionately outnumber women at the
most senior non-academic levels within
each of the three university groups.
At Russell Group institutions there are
more non-academic men than women
from F2 Function Head and above and just
over a third (35.3%) of A0 to C2 Senior
Managers are women.
At other Pre 92 institutions there are more
women than men among non-academic
staff at every contract level up to F2
Function Head, and an even split at D & E
Head of School/ Senior Function Head.
37.1% of senior managers are women.
At Post 92 institutions, women outnumber
men at every contract level except the two
most senior levels – D & E Head of School
/ Senior Function Head and A0 to C2
Senior Management. Whilst there is still
an imbalance with women accounting for
47.5% of staff at D&E and 44.8% at A0 to
C2, it is much less pronounced than at
Russell Group and Other Pre 92
institutions.

32
Figure 13: Gender balance by university group Non-academic contract (Other Pre 92)

33
Figure 14: Gender balance by university group Non-academic contract (Post 92)

34
6.3 Gender distribution across the 51 point pay spine by university group
The charts that follow show percentage of female and male academic staff at each point of the 51 point spine for each of the three university
groups (Russell Group, Other Pre 92, and Post 92). Analysing the distribution of staff across the 51 point spine in this way allows us to see
whether stratification is occurring and the points at which may occur. It also allows us to determine whether any gender based stratification is
entrenched from the point that it occurs. The results are presented below for each of the three university groups – Russell Group, Other Pre 92
institutions, and Post 92 institutions.
Figure 15: Percentage female and male academic staff by spine point 2015/16 (Russell Group)
At Russell Group institutions women proportionally outnumber men at every spine point up to point 38, and then from point 38 onwards there
are more men than women at nearly every point (with the exception of the equal percentage at point 41 and a higher percentage of women at
point 43. This gender stratification is very evident at points 49, 50 and 51, the very top of the scale. 13.3% of male academics at Russell

35
Group institutions are at these top three points, compared to only 8.0% of women. This means that male academics are overrepresented by
66.3% at points 48-51 of the scale.
Also of note is the clustering of staff at two specific points – 36 and 43, and in particular the clustering of women at these points. Point 36
represents the transition over the “soft” barrier between the AC2 Lecturer A and AC3 Lecturer B grades at Pre 92 universities, and the fact that
there are proportionally more women than men at point 36, and then proportionally more men than women from point 39 onwards warrants
further close investigation. As an initial analysis of figure 15 suggests that women are not progressing through the AC2/AC3 barrier at the
same rate as men, or that women are dropping out of the higher education workforce at Russell Group institutions at a greater rate than men at
this mid-career level.
Figure 16: Percentage female and male academic staff by spine point 2015/16 (Other Pre 92)

36
A similar phenomenon is apparent at Other Pre 92 universities. There are proportionally more men than women at every point form point 44
onwards (the start of the AC4 grade). There is also a large spike of men at point 49 (the top of AC4). There are 9.6% of men at point 29 and
5.6% of women. 28.6% of male academics at Other Pre 92 institutions are on points 44 to 51(AC4-AC5) as are 21.0% of women. This means
that men are overrepresented by 36.2% from points 44 onwards.
Figure 17: Percentage female and male academic staff by spine point 2015/16 (Post 92)
The stratification seen at the AC3/AC3 and AC4 grade barrier points seen for Russell Group and Other Pre 92 institutions is not apparent for
Post 92 institutions for most of the 51 point spine. There are very similar percentages of men and women at all spine points up to point 48.
However, stratification is evident from point 49 onwards, with 9.8% of men and 7.0% of women occupying points 49 to 51 of the scale.

37
7 Next steps
7.1 Equal pay audits and reviews In higher education, the Joint Negotiating Committee for Higher Education Staff (JNCHES)
pay agreement 2006-09 strongly recommended that equal pay reviews be carried out in
each institution within 12 months of implementing the framework agreement for the
modernisation of HE pay structures and periodically thereafter. This was reiterated in
JNCHES guidance issued in 2013.
This guidance also explicitly recommends full involvement of the recognised trade unions in
both the review/audit and any subsequent actions identified as necessary, but there is little
evidence of wide spread adoption of this recommendation in the higher education sector.
Some higher education employers have engaged positively with UCU and in collaboration
have produced thorough equal pay audits with clear plans for action. However, it is clear
that many employers are not currently carrying out equal pay reviews with UCU branches.
Of equal concern is that some employers that do complete equal pay reviews, too many are
producing documents that don’t contain the level of detail needed to identify the causes of
unequal pay and are failing to commit to concrete action to actually close the gender pay
gap.
UCU is frustrated with the lack of action on gender pay at New JNHCES. We are now taking
the approach of formulating and submitting local equal pay claims at individual universities
as the first step towards identifying and rectifying the intransigent problem of unequal pay.
7.2 New gender pay reporting requirements New legislation enacted this year states that all employers with more than 250 staff must
publish six key indicators of gender pay by April 2018 and annually thereafter. This
legislation presents an opportunity for higher education employers to extend the minimal
statutory reporting requirements to a detailed and meaningful equal pay review.
More information on what is required of employers and on the required reporting standards
can be found on the ACAS website here: http://www.acas.org.uk/index.aspx?articleid=5768
8 Resources for members
Guidance: Tackling the Gender Pay Gap
UCU has published detailed guidance on requesting and scrutinising an equal pay audit,
assessing, equal pay cases, and determining the drivers of the gender pay gap at your
institution.
The guidance provides detailed steps to follow for every part of the process from assessing
your current position, to requesting and analysing an audit, to submitting a claim and
negotiating favourable outcomes.
The guidance is available to members available to members here:
UCU Guidance: Tackling the Gender Pay Gap

38
Rate for the Job pay comparison website
UCU’s Rate for the Job online comparison tool allows you to access the average salaries for
men and women at your institution by contract level and gender, and allows you to select up
to five institutions at a time for comparison. It also allows comparison with VC pay and
contains a toll for calculating the real hourly wages of hourly paid teaching staff.
All the information on the site is presented in an accessible graphical format that can easily
be adapted for local campaigning.
Rate for the Job can be accessed by members here
Addressing the gender pay gap is a key priority for UCU, and branches are encouraged to
discuss how this can be done at their institution with their regional office.

39