Embed Size (px)
Citation preview
Generalized Indices of Abundance SERO-LAPP-2014-01 DRAFT Discussion Document January 15, 2014
1
A generalized approach to generating indices of abundance for exploited stocks Nicholas A. Farmer, Ph.D. LAPP/DM Branch NOAA Fisheries Service Southeast Regional Office 263 13th Ave S St. Petersburg, FL 33701 [email protected] Introduction
The National Marine Fisheries Service (NMFS) Southeast Fisheries Science Center (SEFSC) assesses the status of managed stocks through the formal Southeast Data Assessment and Review (SEDAR) process. Benchmark and update assessments generate management status determination benchmarks as well as a recommended time series of fishery yields. Of the 31 stocks in the Gulf of Mexico Fishery Management Council (Gulf Council)’s Reef Fish Fishery Management Unit (FMU), 20 (65%) have been assessed. Of the 56 stocks in the South Atlantic Fishery Management Council (SAFMC)’s Snapper-Grouper and Dolphin-Wahoo FMUs, 44 (79%) have not been assessed. NMFS is required by law to set Allowable Biological Catch (ABC) and Annual Catch Limits (ACLs) for most managed stocks, including stocks that have never been assessed. To address this issue, the SAFMC’s Scientific and Statistical Committee (SSC) has recently developed an “Only Reliable Catch Stocks” (ORCS) method (NMFS-SEFSC-616) for setting Allowable Biological Catch (ABC) for data-limited managed species. With the ORCS method, a time series of either total catch or landings is used to assess the trend of the stock, as well as to develop the catch statistic used to set ABC. A critical assumption of the ORCS method is that this catch statistic is derived from a time period during which effort was stable. If this assumption is violated, the ABC may be set too high or low, resulting in overfishing or underutilization of the available resource.
Due to data limitations and tasking of analytical duties to priority stocks, many stocks have not been assessed through the SEDAR process. Trends in catch per unit effort (CPUE) can be used to infer population trends of an exploited stock. Standardized time series of CPUE are often regarded as indices of abundance. Indices of abundance of unassessed stocks could be useful to: (1) identify periods of stable CPUE for deriving a catch statistic, (2) improve upon the ORCS method, and (3) provide annual information on population trends. We can develop preliminary indices of abundance for all managed stocks by applying a generalized method to self-reported fishery-dependent data. These data are currently available from the Marine Recreational Information Program, the NMFS Southeast Headboat Survey, and the NMFS SEFSC Commercial Coastal Fisheries Logbook program. Although the resulting CPUE indices do not control for all potential sources of species-specific bias, they do account for most misidentification-, seasonal-, spatial- and management-related impacts as a SEDAR-type standardized index of abundance would, and follow a similar delta-lognormal generalized linear modeling approach (SEDAR 2008).
This report describes a generalized approach to generate standardized indices of abundance for stocks managed by the SAFMC and Gulf of Mexico Fishery Management Council
Generalized Indices of Abundance SERO-LAPP-2014-01 DRAFT Discussion Document January 15, 2014
2
(GMFMC). The standardized annual CPUEs generated are compared to available SEDAR indices for magnitude and trend. Additionally, trends in standardized annual indices for some unassessed stocks are compared to trends in catch alone. This approach may be useful in ORCS trend categorization and catch statistic selection, selection of appropriate ABC values, Council risk tolerance consideration and population status and trend summaries.
Methods
Recreational landings and discards in the southeastern U.S. are collected by the:
1. Marine Recreational Fisheries Statistics Survey (MRFSS), including the For-hire survey; 2. Southeast Headboat Survey (HBS); and, 3. Texas Parks and Wildlife Department (TPWD) Creel Survey.
MRFSS uses a combination of dockside intercepts (catch data) and phone surveys (effort
data) to estimate landings in both numbers and whole weight (lbs) by two-month wave (e.g., Wave 1 = Jan/Feb, … Wave 6 = Nov/Dec), area fished (inland, state, and federal waters), mode of fishing (charter, private/rental, shore), and state (east Florida, Georgia, South Carolina, and North Carolina). Headboat landings are collected through logbooks completed by headboat operators. Landings (numbers and lbs) are reported by vessel, day/month, and statistical reporting area (i.e., area 1 = Hatteras, N.C., …, area 17 = Dry Tortugas (South Atlantic waters, areas 18-29 = Gulf of Mexico waters)). As with most SEDAR assessments, TPWD estimates were not used to generate indices of abundance.
Trip-level commercial landings and discards in southeastern U.S. are collected by the NMFS coastal logbook program. Since 1993, logbooks have been required from all federally-licensed commercial captains. Landings (lbs) are reported by vessel, day/month, and statistical reporting areas. Reporting areas are defined on 1° by 1° geographic grids.
Standardized indices of abundance were constructed for all species in the SAFMC’s Snapper-Grouper and Dolphin-Wahoo Fisheries Management Units (FMUs) and GMFMC’s Reef Fish FMU (SAFMC: Table 1, GMFMC: Table 2) following approaches outlined in SEDAR (2008). For this ‘proof-of-concept’ exercise, only a few species were examined in detail. SAS code was obtained from the SEFSC, and modified according to recommendations emerging from a meeting between Nick Farmer and SEFSC staff (J. Walter, S. Cass-Calay, S. Saul, B. Linton, M. Bryan, and K. McCarthy) in November, 2012. Recommendations included treatment of individual species versus grouping for misidentification, linear modeling approaches, proper handling of seasonal closures and bag limits, and levels of recommended data-parsing (i.e., year, month/season/wave, area, etc.).
Trip-level CPUEs for each managed stock were computed from MRFSS by summing total catch on a trip (landings plus discards, in numbers) and dividing by the targeted effort, expressed as angler-hours (SEFSC MRFSS Catch-Effort Files, accessed May 2013). Trip-level CPUEs for each managed stock were computed from the HBS by summing landings on a trip reported to headboat logbooks, divided by the targeted effort, expressed as angler-hours. Discards reported to the headboat logbooks were not incorporated as they are considered to be unreliably estimated and have only been collected since the mid-2000s. Trip-level CPUEs for
Generalized Indices of Abundance SERO-LAPP-2014-01 DRAFT Discussion Document January 15, 2014
3
each managed stock were computed from the SEFSC’s commercial coastal logbook program (accessed March 2013). Logbook records summarize landings on a trip level, with information including landings in pounds whole weight (lb ww), primary gear used, and primary area and depth of capture. Logbook catches and effort were summarized at the trip-level by species and gear. CPUE indices were only developed for vertical line gear. Unlike the recreational indices, the commercial indices were expressed in pounds of landed catch (rather than numbers) per unit effort (hook-hours). Because commercial discards are only reported on 20% of trips through a supplemental logbook, and are only reported in numbers (an inconsistent unit with the landed catch, no conversion factor provided), they were not considered for these approaches. Commercial trips from 1993-2012 were evaluated, ensuring reasonable species identification and high reporting rates from all states, as only 20% of captains from the state of Florida were required to report landings prior to 1993 (SEFSC, pers. comm.).
Targeted trips for a given species included those that reported the species or any associated species. Associated species were identified using multivariate statistical analyses, hierarchical cluster analyses, Pearson correlation matrices, and nodal analyses conducted on five fishery-dependent (i.e., MRFSS, Southeast Headboat Survey, Commercial Logbook: Vertical Line, Commercial Logbook: Longline, Reef Fish Observer Program) and one fishery-independent (SAFMC: MARMAP, GMFMC: NMFS-Bottom Longline) datasets (Table 3, SAFMC: SERO-LAPP-2010-06; Table 4, GMFMC: SERO-LAPP-2010-03). This approach was taken, as opposed to the more commonly used Stephens and MacCall (2004) approach, because many of the stocks of primary interest in this report are incidentally landed during targeted trips for a managed stock. These catch associations, along with life history associations, were used to establish stock complexes for management in the SAFMC and GMFMC in 2011.
Stocks that might be frequently misidentified with each other were grouped into these complexes as well, per recommendations from SEFSC staff. Red hind and rock hind were lumped into a “Hinds” complex. Lesser amberjack, almaco jack, and banded rudderfish were lumped into a “Jacks” complex. Greater amberjack was treated separately and also lumped into the “Jacks” complex. Mutton snapper was treated separately, and also lumped into a “Shallow-water snapper” complex that included cubera snapper, gray snapper, lane snapper, dog snapper, mahogany snapper. Margate, knobbed porgy, saucereye porgy, and jolthead porgy were lumped into a “Porgies” complex. Indices were not split for time periods with different bag or size limits; again, it is unlikely this would impact the stocks of interest to this report, as few bag or size limits are in effect for unassessed species (Table 5).
Standardized indices were generated using a SAS macro %GLIMMIX (Wolfinger & O'Connell 1993) and Proc Mixed, coded to fit delta-lognormal models to each managed stock (see Appendix for SAS Code). Factors incorporated as main effects in all delta-lognormal models were year, month (commercial and headboat) or wave (MRFSS), mode of fishing (Charter vs. Private: MRFSS only), state (MRFSS only), and area fished. Tables were produced of strata sample sizes. Further guidance from the SEFSC is needed to provide ‘rules of thumb’ for identification and handling of sample size issues that may have arisen. No efforts were made to identify outliers in this initial effort. Further guidance is also needed from SEFSC to ascertain where outliers exist and how to handle them. Certain months or waves were removed on a species-specific basis if the month or wave had been closed to that stock during any point in the time series (Table 6). A minimum of six months were considered for all unassessed species with
Generalized Indices of Abundance SERO-LAPP-2014-01 DRAFT Discussion Document January 15, 2014
4
the exceptions of Gulf of Mexico deepwater grouper (4 months) and tilefish (3 months). No similar effort was made to identify and remove areas that were closed during portions of the time period; however, most past closures were more discrete than the resolution of data reporting, and it is unlikely discrete closed areas would impact the principle stocks of interest for this method (i.e., unassessed stocks).
Stock-specific figures were automatically exported to PDF for all managed species, showing standardized CPUE trends for the three fishery-dependent data sources. Mean and 95% confidence limits for CPUE trends for each stock-specific plot were scaled to the mean for each fishery-dependent data source to allow for easier comparison. Qualitative validation of the standardized indices of abundance approach was performed by visually comparing indices generated by this study’s more generalized method to the more species-specific indices generated for SEDAR assessments. Standardized indices from SEDAR assessments were re-standardized to the 1993-2012 period, to facilitate comparison. Indices were re-standardized by dividing by the mean CPUE for the 1993-2012 time period; future efforts should obtain the non-normalized standardized indices of abundance output from SEDAR.
As a ‘proof-of-concept’, SEDAR indices for South Atlantic black sea bass, greater amberjack and vermilion snapper, and Gulf of Mexico gag, greater amberjack and red grouper were compared to the generalized indices. Visually comparing magnitudes and trends allowed for a qualitative evaluation of how well the generalized method captures the trends expressed in the SEDAR indices. These SEDAR-assessed species were selected because their time series were sufficiently long to facilitate comparison, MRFSS landings from Monroe County were assigned to the Gulf of Mexico, and the commercial indices were based on vertical line CPUE. Other SEDAR-assessed species either lumped the Gulf of Mexico and South Atlantic into a single unit stock for the assessment, handled MRFSS landings from Monroe County differently, or focused on commercial longline CPUE; these treatments were inconsistent with the generalized approach explored herein. Pearson correlation analyses were used to evaluate statistical significance of associations between SEDAR and generalized indices.
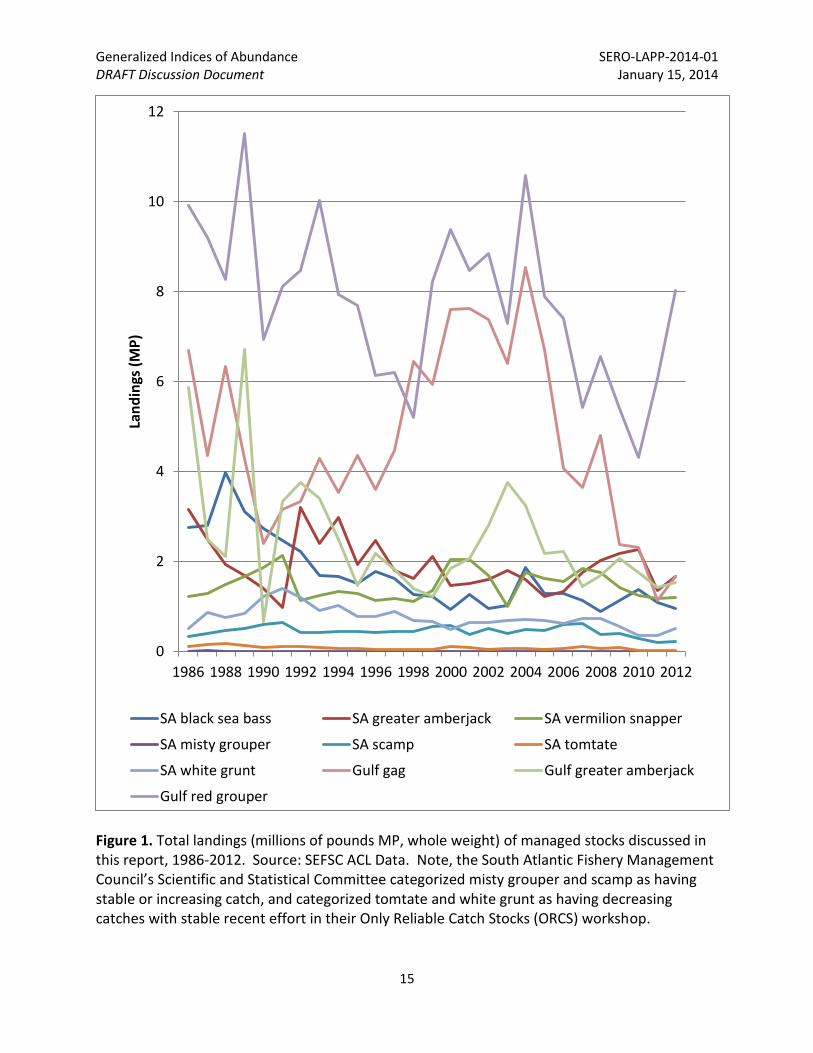
Additionally, indices of abundance for South Atlantic scamp, misty grouper, tomtate, and white grunt were compared to trends in catch alone (Figure 1). These unassessed stocks were all evaluated by the South Atlantic SSC ORCS workgroup. Indices of abundance for several South Atlantic stocks were visually assessed for time periods of three or more years that exhibited a stable or increasing trend in CPUE. The SEFSC ACL Recreational (Sept 2013; MRIP-based) and Commercial (July 2013) datasets were then used to determine mean, standard deviation, and median landings in millions of pounds whole weight (MP) for these periods of stable or increasing CPUE. These potential catch statistics were then compared to existing and ORCS-recommended ABC values. Results
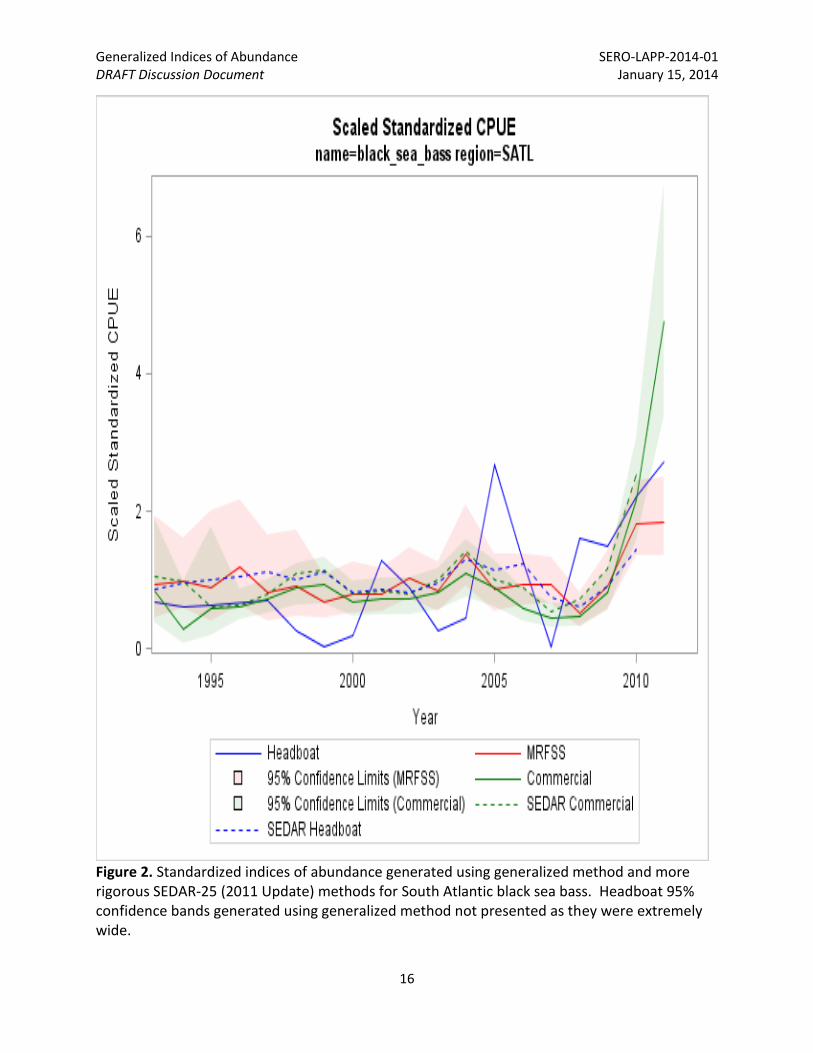
For South Atlantic black sea bass (Figure 2), the generalized approach generated indices of abundance that were mostly consistent with the more rigorous SEDAR-generated (SEDAR-25 2011) standardized indices of abundance. The commercial indices tracked in trend and magnitude. The generalized headboat index failed to converge for the 1993-2012 time period, and the index produced for the 1993-2011 time period had extremely wide confidence intervals. This 1993-2011 generalized headboat index fluctuated more than the standardized
Generalized Indices of Abundance SERO-LAPP-2014-01 DRAFT Discussion Document January 15, 2014
5
index, and showed higher estimated CPUE from 2007-2011, although the rate of the increase was consistent. This inconsistency may have arisen because some months were closed for the first time in the last two years (October-December). These closed months were eliminated from the entire time series for the generalized method, but were likely retained by SEDAR, as the final data year in SEDAR-25 (2011) was 2010, prior to quota closures in February 2011 for the 2010/11 season and October 2011 for the 2011/12 season. No MRFSS index of abundance was available from SEDAR. The headboat SEDAR and generalized indices were not significantly correlated (P > 0.05). The commercial SEDAR and generalized indices were highly correlated (P < 0.0001).
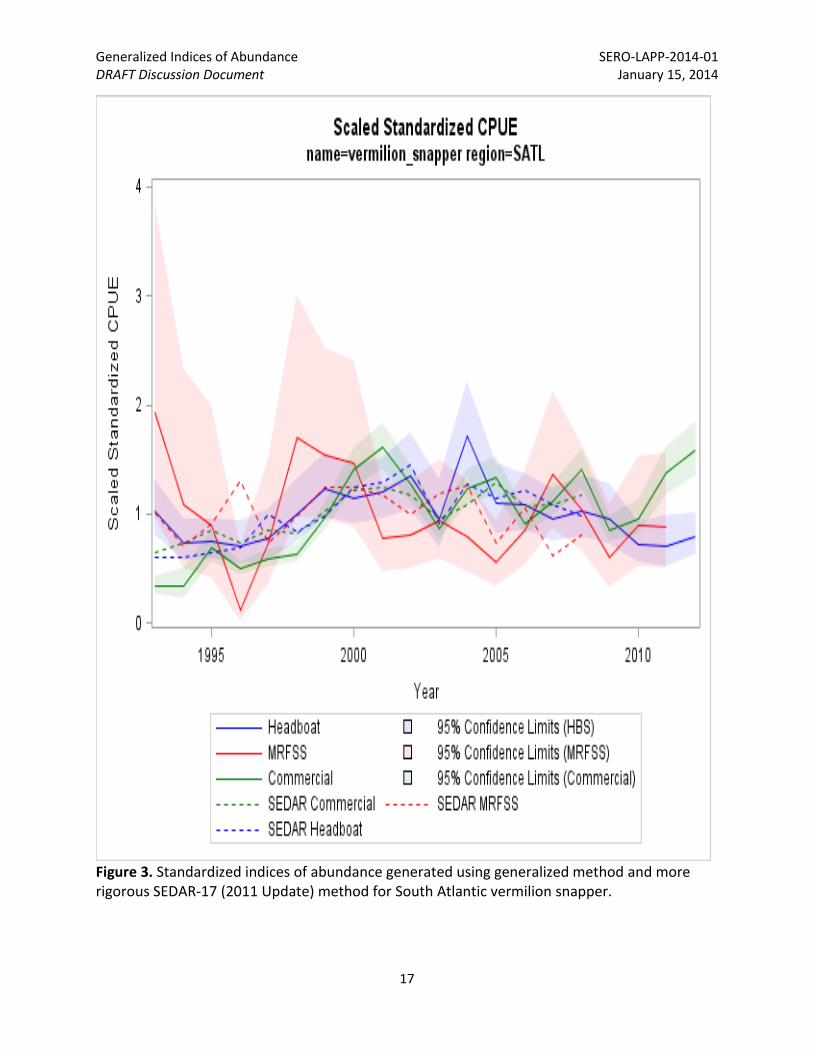
For South Atlantic vermilion snapper (Figure 3), the generalized approach generated indices of abundance that were mostly consistent with the more rigorous SEDAR-generated (SEDAR-17 2012) standardized indices of abundance. The commercial and headboat indices tracked in trend and magnitude. The generalized MRFSS index was reasonably consistent with the SEDAR index except for 1996 and 2007. The inconsistency in 2007 is likely due to the 12” size limit for vermilion snapper implemented on October 23, 2006, which was not considered in the development of the generalized index. The MRFSS indices were not significantly correlated (P > 0.05); whereas the headboat (P < 0.005) and commercial (P< 0.0001) indices were highly correlated. A period of stable/increasing CPUE was observed in the time series: 1996-1999. This period had mean and median catches slightly higher than the current ABC of 1.109 MP (1996-1999: 1.12 ± 0.12 mean ± SD, 1.16 MP median).
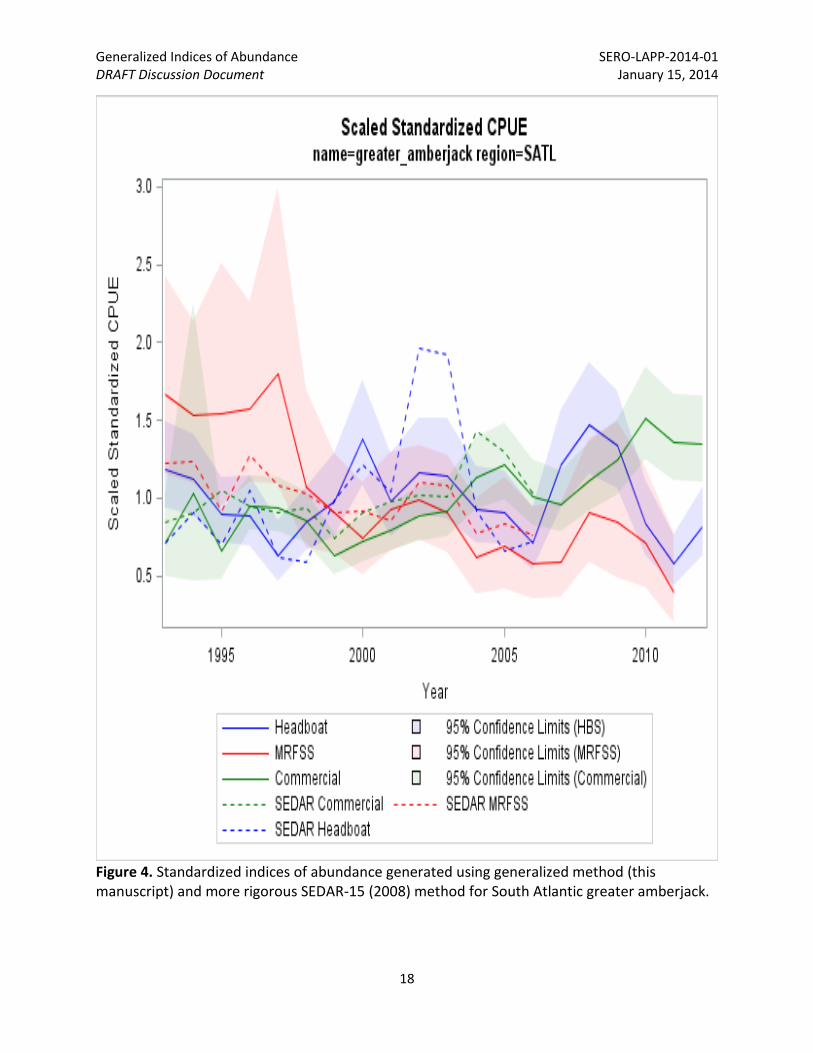
For South Atlantic greater amberjack (Figure 4), the generalized approach generated indices of abundance that were mostly consistent with the more rigorous SEDAR-generated (SEDAR-15 2008) standardized indices of abundance. The commercial, headboat, and MRFSS indices tracked in trend. The generalized MRFSS index estimated higher CPUE prior to 1998. The generalized headboat index showed a much smaller peak in CPUE during 2002-2003, but the trend was consistent. The commercial indices showed similar trends across years. MRFSS (P < 0.005), headboat (P < 0.05), and commercial (P < 0.01) SEDAR and generalized indices were correlated. Two periods of stable/increasing CPUE were observed in the time series: 2001-2003 and 2006-2008. Both periods had catch statistics slightly less than the current ABC of 1.97 MP (2001-2003: 1.64 ± 0.15 mean ± SD, 1.60 MP median; 2006-2008: 1.70 ± 0.34 MP mean ± SD, 1.74 MP median).
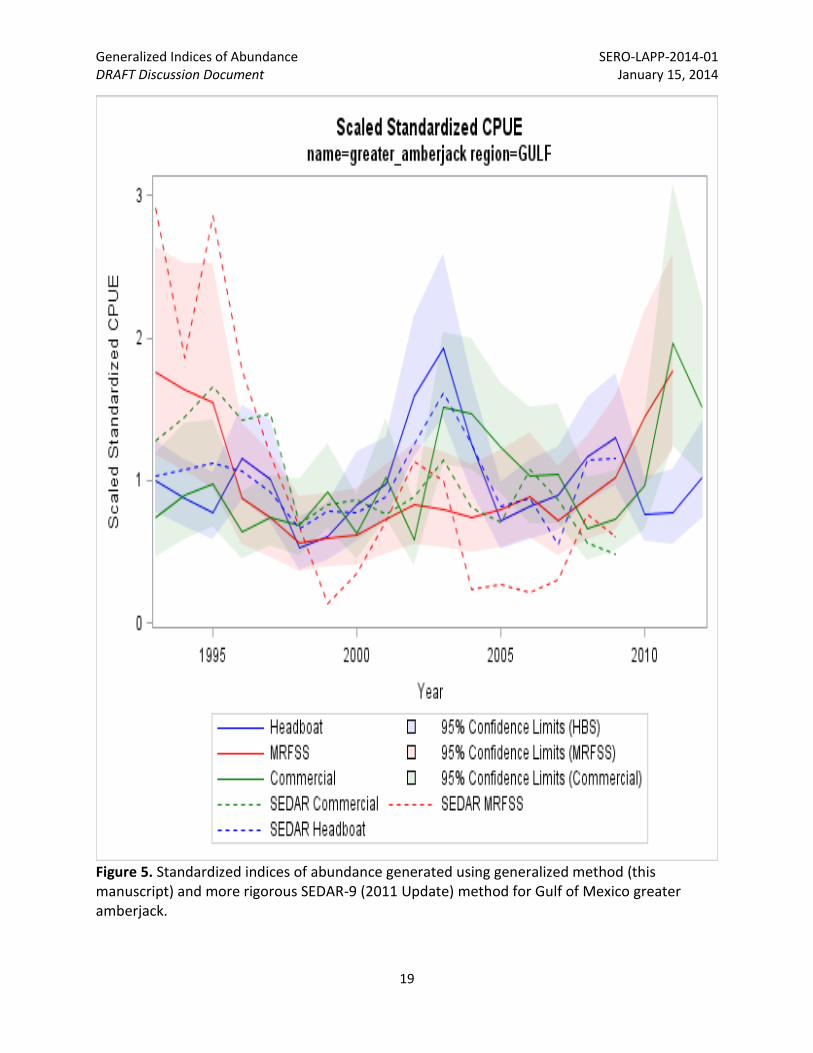
For Gulf of Mexico greater amberjack (Figure 5), the generalized approach generated indices of abundance that were mostly consistent with the more rigorous SEDAR-generated (SEDAR-9 2011) standardized indices of abundance. The commercial, headboat, and MRFSS indices tracked in trend. The MRFSS SEDAR index showed higher CPUEs prior to 1996 and lower post-2003. The MRFSS SEDAR index was extremely high in the 1986-1989 time period, which may have accentuated the long-term trend in the re-standardized index used for comparison. The headboat index tracked trends extremely well. The commercial index showed opposite peaks in 2001 and 2006, but was consistent for other years. The MRFSS (P < 0.0001) and headboat indices (P < 0.0001) were highly correlated, but the commercial indices produced by SEDAR and the generalized method were not significantly correlated (P > 0.05).
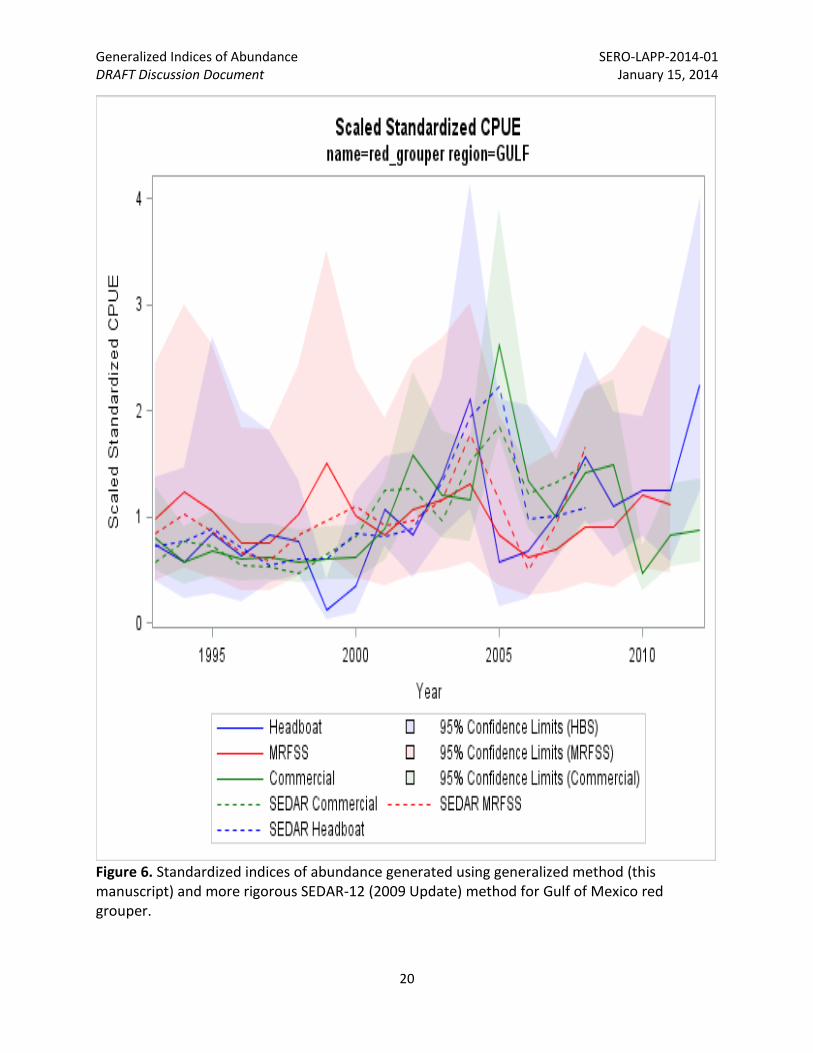
For Gulf of Mexico red grouper (Figure 6), the generalized approach generated indices of abundance that were mostly consistent with the more rigorous SEDAR-generated (SEDAR-12 2009) standardized indices of abundance. The commercial, headboat, and MRFSS indices
Generalized Indices of Abundance SERO-LAPP-2014-01 DRAFT Discussion Document January 15, 2014
6
tracked in trend. The generalized MRFSS index was synchronous with the SEDAR-based index, although it peaked more strongly in 1999 and was smoother in recent years, possibly due to the longer generalized time series. The SEDAR headboat index was split for a size limit change in 1991. Despite this difference, the generalized headboat index tracked trends well, although magnitudes were different and the trend was inconsistent for 2005. The commercial index tracked very well and was highly correlated (P < 0.0001).
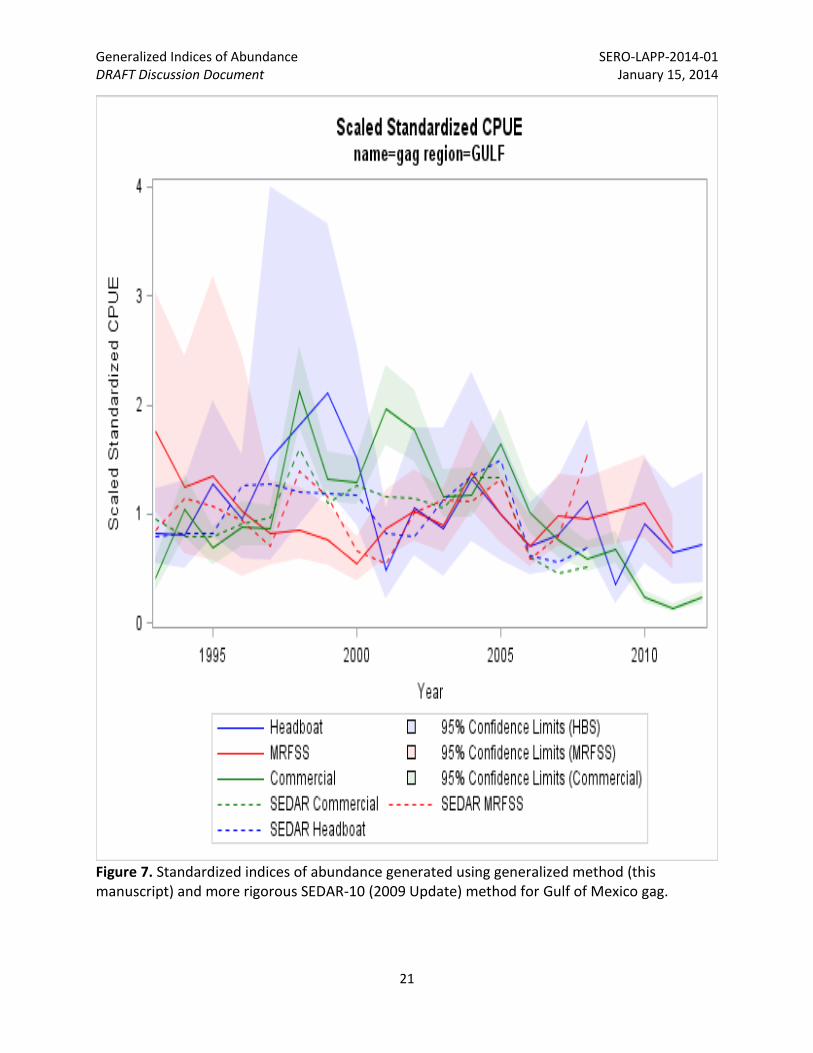
For Gulf of Mexico gag (Figure 7), the generalized approach generated indices of abundance that were somewhat consistent with the more rigorous SEDAR-generated (SEDAR-10 2009) standardized indices of abundance. The generalized MRFSS index was synchronous with the SEDAR-based index, although the generalized index was smoother, possibly due to the longer time series. The SEDAR headboat index was split for the size limit change between 1986-1989, 1990-2000, and 2000-2008. The generalized headboat index, which did not account for these size limit changes, tracked trends well, although magnitudes of fluctuations were much higher than those observed for the SEDAR index. The SEDAR commercial index was similarly split; however, trends and magnitudes were very consistent with the generalized commercial index, for which no such splits were performed. The commercial indices were significantly correlated (P < 0.0005).
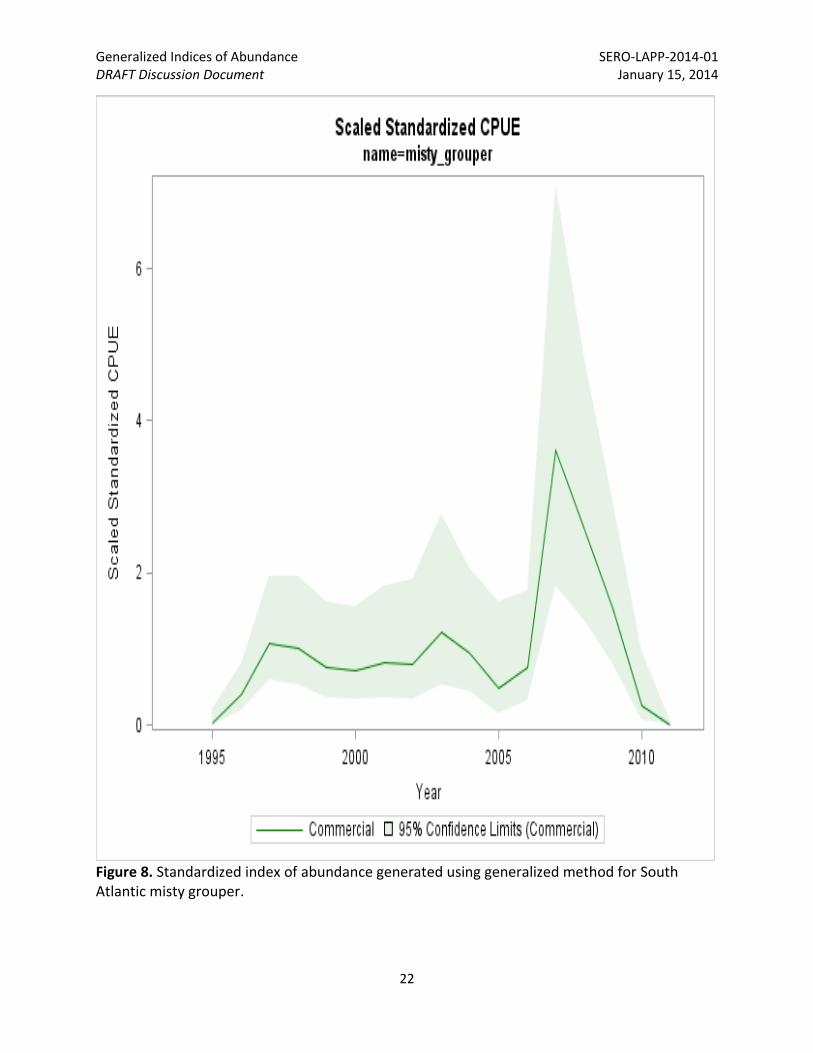
Only a commercial index could be developed for South Atlantic misty grouper due to extremely low landings in other sectors (Figure 8). The index for misty grouper shows variable but stable CPUE since 1997. A potential period of stable/increasing CPUE followed by increasing CPUE is visible from 1997-2010. Total landings during this period averaged 2,004 ± 1,130 lb∙yr-1 (median = 2,253 lb∙yr-1).
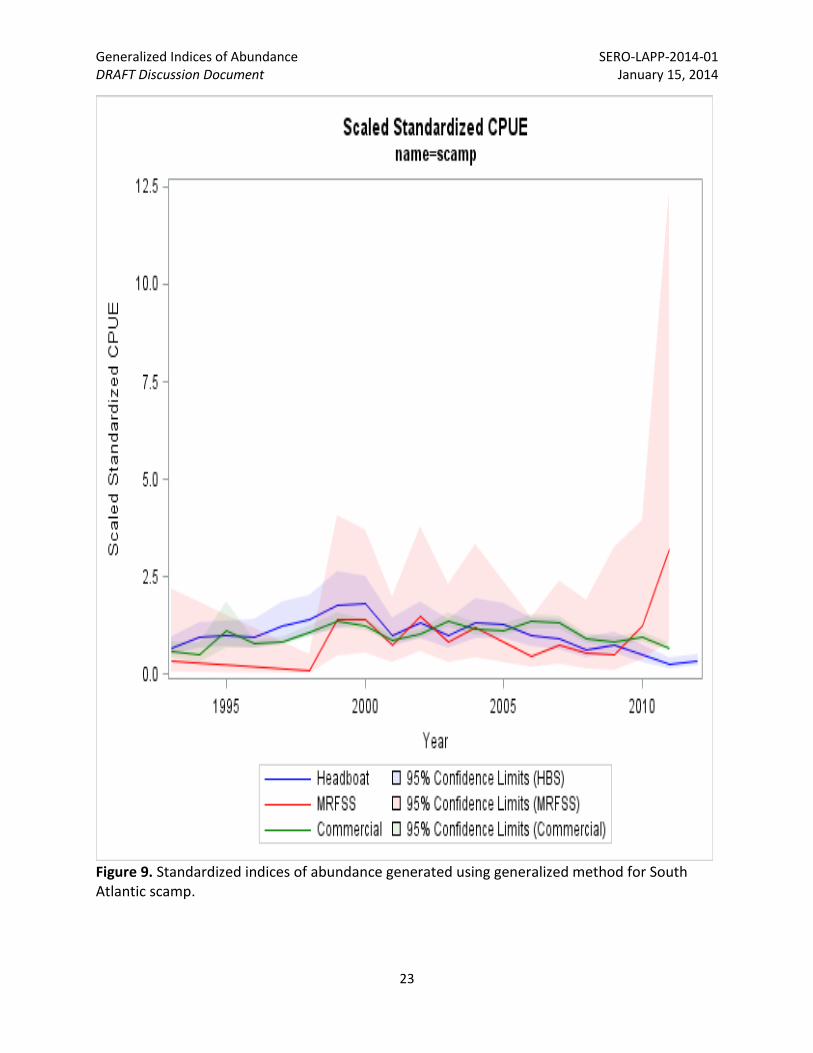
Indices were developed for all three sectors for South Atlantic scamp (Figure 9). Both the headboat and commercial indices showed subtle dome-shaped trends, with declines in recent years. The MRFSS index showed an increasing trend with high uncertainty from 2009-2012. A potential period of stable/increasing CPUE followed by increasing CPUE is visible in all indices from 1996-2000. Total landings during this period averaged 486,872 ± 78,758 lb∙yr-1 (median = 446,937 lb∙yr-1). This is slightly lower than the current ABC of 509,788 lb ww, and much lower than the proposed ORCS-based ABC of 522,269 lb ww.
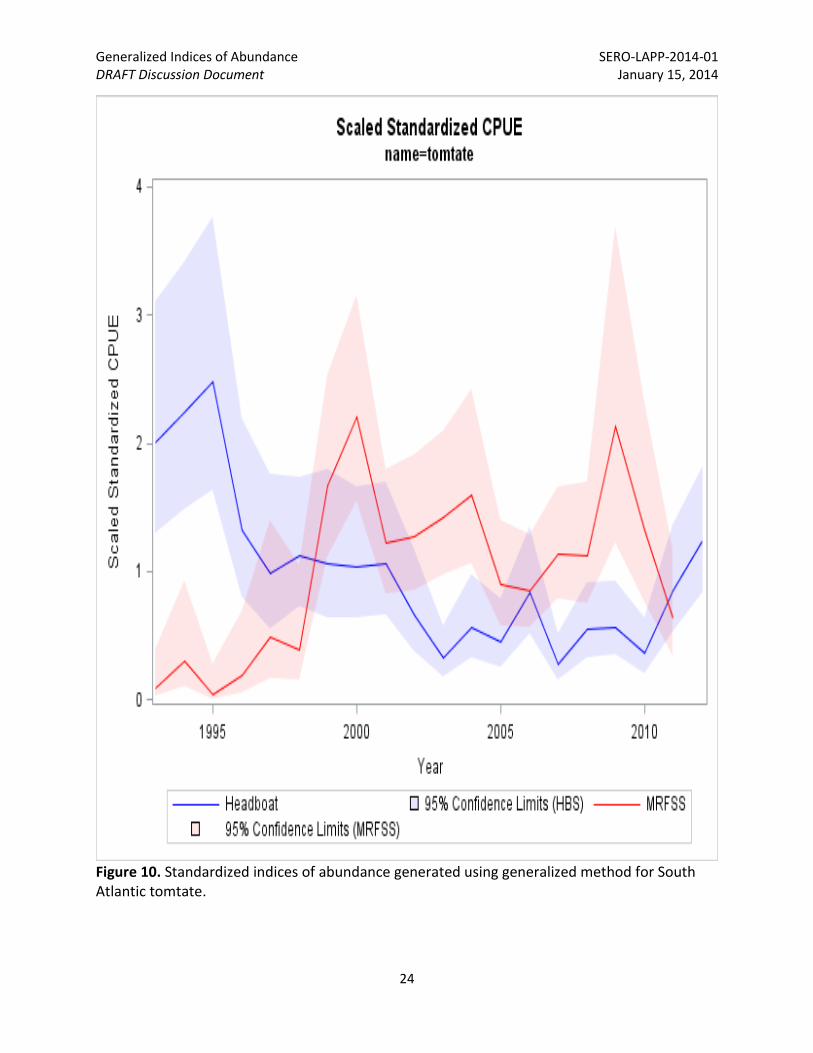
Only recreational indices could be generated for South Atlantic tomtate due to low commercial landings (Figure 10). Both indices showed wide inter-annual fluctuations. The headboat index generally declined from 1995-2010, but showed an increase from 2010-2012. The MRFSS index generally declined from 2000-2008, peaked in 2009, then declined from 2010-2011. A potential period of stable/increasing CPUE is visible in both indices from approximately 2007-2009. Total landings during this period averaged 87,629 ± 15,478 lb∙yr-1 (median = 95,138 lb∙yr-1). These values are very similar to the current ABC of 80,056 lb ww and the proposed ORCS-based ABC of 92,670 lb ww.
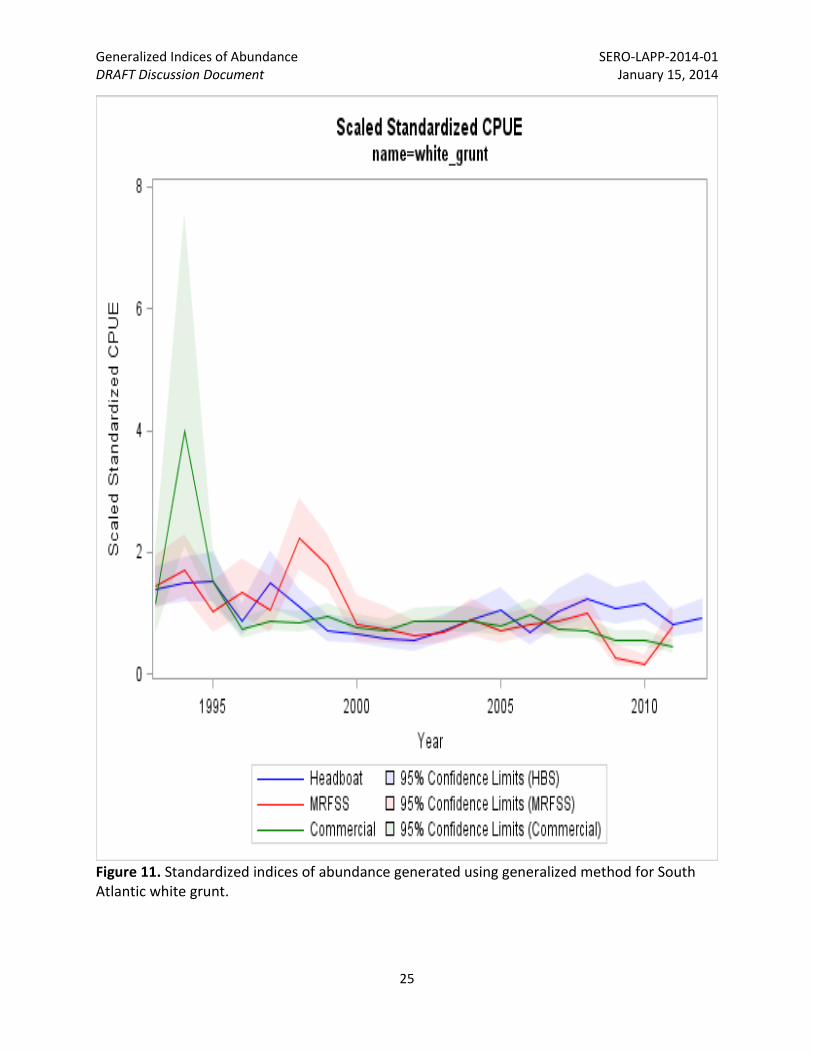
South Atlantic white grunt showed reasonable long-term stability in all three indices (Figure 11). The MRFSS index showed a decline in 2009-2010 followed by an increase back to 2000-2008 levels. A slight decline was visible in the commercial index in recent years, but a corresponding slight increase was observed in the headboat index. A potential period of stable/increasing CPUE followed by increasing CPUE is visible in all indices from approximately 2000-2008. Total landings during this period averaged 662,049 ± 75,058 lb∙yr-1 (median =
Generalized Indices of Abundance SERO-LAPP-2014-01 DRAFT Discussion Document January 15, 2014
7
681,601 lb∙yr-1). These values are very similar to the current ABC of 674,033 lb ww and the proposed ORCS-based ABC of 689,881 lb ww.
Discussion
Overall, the comparison between indices of abundance computed from this approach to SEDAR assessment-based indices of abundance indicated that the generalized approach does a reasonable job of capturing changes in magnitude of indices of abundance. More important from an ORCS perspective, the approach captured general increases or declines apparent from the more rigorous SEDAR assessment indices, and captured most peaks and troughs. Comparisons with SEDAR-based indices elucidated a variety of measures that could be taken to improve the generalized approach. Identification of periods where size limit or bag limit changes may require separating indices, or size limits/bag limits may need to be explicitly incorporated as a factor in the regression model. It may be worth investigating indices restricted to time periods of consistent regulations. Inclusion of headboat discards could potentially eliminate the need to consider size- and bag-limit changes for the recreational sector, although these discards are less reliably reported and have only been collected since the mid-2000s. A method for automatically identifying and excluding outliers would also be useful. More effort is needed to determine how to most effectively handle the changes in targeting behavior in the Gulf of Mexico commercial indices following inception of the red snapper (2007) and grouper-tilefish (2010) individual fishing quota (IFQ) programs. The Deepwater Horizon/BP oil spill in 2010 resulted in a variety of fishery closures in the Gulf of Mexico and is not currently handled as a discrete event by the generalized modeling approach. A more thorough investigation into the impacts of these closures upon the various Gulf of Mexico indices is probably warranted. It should also be noted that two of the indices (MRFSS and Headboat) are providing CPUE based on numbers of fish caught (MRFSS) or landed (Headboat); indices based on numbers of fish implicitly assume no change in the average size of fish. If average size has changed substantially due to changes in the underlying population structure or changes in selectivity (i.e., gear used, area fished, bait used, etc.)
This generalized approach towards generating indices of abundance may provide a useful tool to evaluate population responses to management regulations. The generalized approach would likely work better for unassessed stocks due to the reduced complexity of management history. Inclusion of headboat discards might also make the index less sensitive to management changes. Model diagnostics could be used to determine which indices should receive more weighting in instances where trends between indices are inconsistent.
Recent trends in indices of abundance might be evaluated by the Council when considering risk tolerance for a proposed management action. A downturn in an index might indicate an ACL is set too high to be sustainable under current conditions, or vice versa. These indices might be useful to the Southeast Regional Office in potential “Stock Status and Trends” reports that could be released to constituents via the Web. Trends in the indices of abundance produced for managed stocks may also be useful to identification of periods of stability in CPUE. Periods of stable or increasing CPUE may be useful in identifying periods where harvest may have been at a sustainable level. Allowable Biological Catch could be set using the mean or median of observed landings during this stable time period as a catch statistic.
Generalized Indices of Abundance SERO-LAPP-2014-01 DRAFT Discussion Document January 15, 2014
8
Although the CPUE approach described herein is imperfect, it is likely more informative than catch alone with regards to directionality of trends in stock abundance. An evaluation of four unassessed stocks considered by the ORCS approach indicated that CPUE trends may be different from catch trends. Misty grouper and scamp were categorized by the ORCS workgroup as having stable or increasing catch; however, recent CPUE trends for misty grouper are decreasing, and 2 of 3 scamp indices show a gradual decline. It should be noted that misty grouper landings are extremely low, and thus the CPUE trend may be an artifact of limited data. Additionally, this stock was subject to a closure outside 240-ft depth from January 2011-May 2012; however, the decline observed in the CPUE trend started in 2008. Tomtate and white grunt were categorized by the ORCS workgroup as having decreasing catch trends. Recent CPUE trends for tomtate appear quite variable, with the MRFSS trend showing long-term stability and the headboat trend showing a long-term decline with an increase in the last two years. White grunt CPUE appears to be stable or increasing in both recreational indices with a gradual decline in the commercial index. These discrepancies highlight the need to have indices of abundance for use in the ORCS approach. Interestingly, in all four cases examined, the landings in the year following the identified period of stable CPUE were substantially higher than the mean landings during the stable period. This provides additional support to the use of a catch statistic derived from a period of stable CPUE for setting ABC. References Southeast Data Assessment and Review (SEDAR). 2008. Abundance indices workshop:
Developing protocols for submission of abundance indices to the SEDAR process. SEDAR Procedures Workshop 1: October 14-17, 2008. Miami, Florida. 106 pp.
SEDAR-9. 2011. Gulf of Mexico greater amberjack stock assessment update. SEDAR, North Charleston, SC.
SEDAR-10. 2009. Gulf of Mexico gag stock assessment update. SEDAR, North Charleston, SC. SEDAR-12. 2009. Gulf of Mexico red grouper stock assessment update. SEDAR, North
Charleston, SC. SEDAR-15. 2008. South Atlantic greater amberjack stock assessment report. SEDAR, North
Charleston, SC. SEDAR-17. 2012. South Atlantic vermilion snapper stock assessment update. SEDAR, North
Charleston, SC. SEDAR-25-SAR3. 2011. South Atlantic black sea bass assessment update. SEDAR, North
Charleston, SC.
Generalized Indices of Abundance SERO-LAPP-2014-01 DRAFT Discussion Document January 15, 2014
9
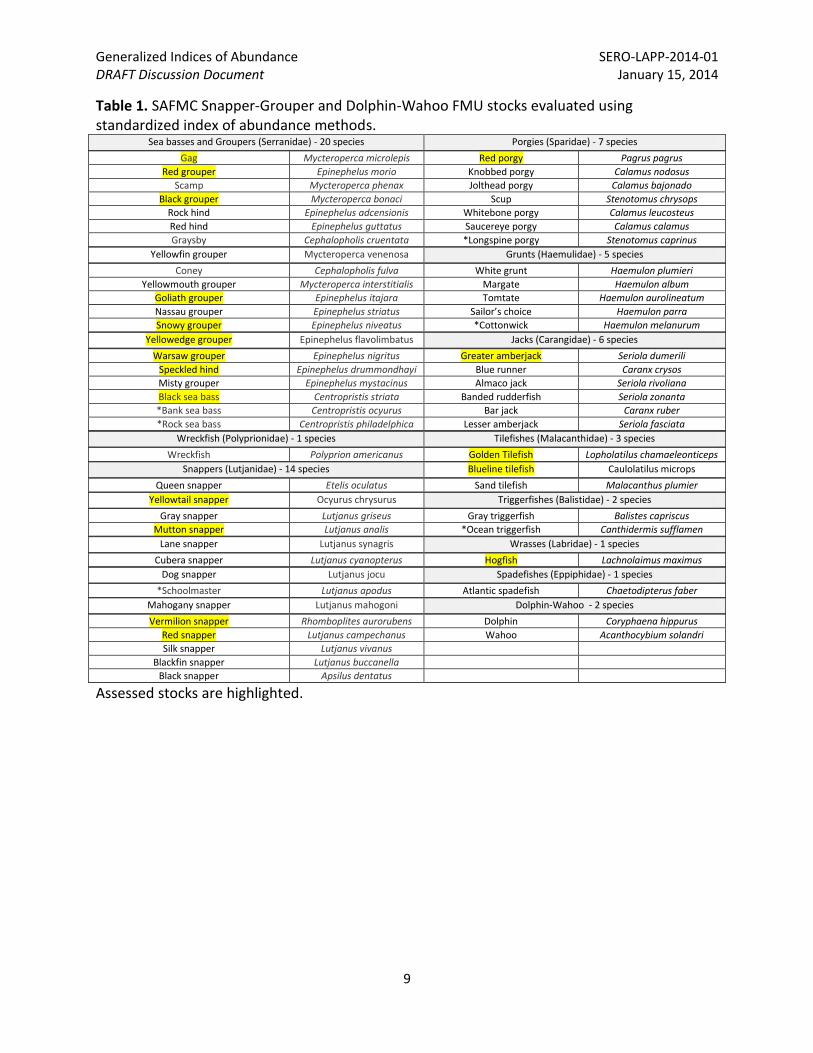
Table 1. SAFMC Snapper-Grouper and Dolphin-Wahoo FMU stocks evaluated using standardized index of abundance methods.
Sea basses and Groupers (Serranidae) - 20 species Porgies (Sparidae) - 7 species
Gag Mycteroperca microlepis Red porgy Pagrus pagrus
Red grouper Epinephelus morio Knobbed porgy Calamus nodosus
Scamp Mycteroperca phenax Jolthead porgy Calamus bajonado
Black grouper Mycteroperca bonaci Scup Stenotomus chrysops
Rock hind Epinephelus adcensionis Whitebone porgy Calamus leucosteus
Red hind Epinephelus guttatus Saucereye porgy Calamus calamus
Graysby Cephalopholis cruentata *Longspine porgy Stenotomus caprinus
Yellowfin grouper Mycteroperca venenosa Grunts (Haemulidae) - 5 species
Coney Cephalopholis fulva White grunt Haemulon plumieri
Yellowmouth grouper Mycteroperca interstitialis Margate Haemulon album
Goliath grouper Epinephelus itajara Tomtate Haemulon aurolineatum
Nassau grouper Epinephelus striatus Sailor’s choice Haemulon parra
Snowy grouper Epinephelus niveatus *Cottonwick Haemulon melanurum
Yellowedge grouper Epinephelus flavolimbatus Jacks (Carangidae) - 6 species
Warsaw grouper Epinephelus nigritus Greater amberjack Seriola dumerili
Speckled hind Epinephelus drummondhayi Blue runner Caranx crysos
Misty grouper Epinephelus mystacinus Almaco jack Seriola rivoliana
Black sea bass Centropristis striata Banded rudderfish Seriola zonanta
*Bank sea bass Centropristis ocyurus Bar jack Caranx ruber
*Rock sea bass Centropristis philadelphica Lesser amberjack Seriola fasciata
Wreckfish (Polyprionidae) - 1 species Tilefishes (Malacanthidae) - 3 species
Wreckfish Polyprion americanus Golden Tilefish Lopholatilus chamaeleonticeps
Snappers (Lutjanidae) - 14 species Blueline tilefish Caulolatilus microps
Queen snapper Etelis oculatus Sand tilefish Malacanthus plumier
Yellowtail snapper Ocyurus chrysurus Triggerfishes (Balistidae) - 2 species
Gray snapper Lutjanus griseus Gray triggerfish Balistes capriscus
Mutton snapper Lutjanus analis *Ocean triggerfish Canthidermis sufflamen
Lane snapper Lutjanus synagris Wrasses (Labridae) - 1 species
Cubera snapper Lutjanus cyanopterus Hogfish Lachnolaimus maximus
Dog snapper Lutjanus jocu Spadefishes (Eppiphidae) - 1 species
*Schoolmaster Lutjanus apodus Atlantic spadefish Chaetodipterus faber
Mahogany snapper Lutjanus mahogoni Dolphin-Wahoo - 2 species
Vermilion snapper Rhomboplites aurorubens Dolphin Coryphaena hippurus
Red snapper Lutjanus campechanus Wahoo Acanthocybium solandri
Silk snapper Lutjanus vivanus
Blackfin snapper Lutjanus buccanella
Black snapper Apsilus dentatus
Assessed stocks are highlighted.
Generalized Indices of Abundance SERO-LAPP-2014-01 DRAFT Discussion Document January 15, 2014
10
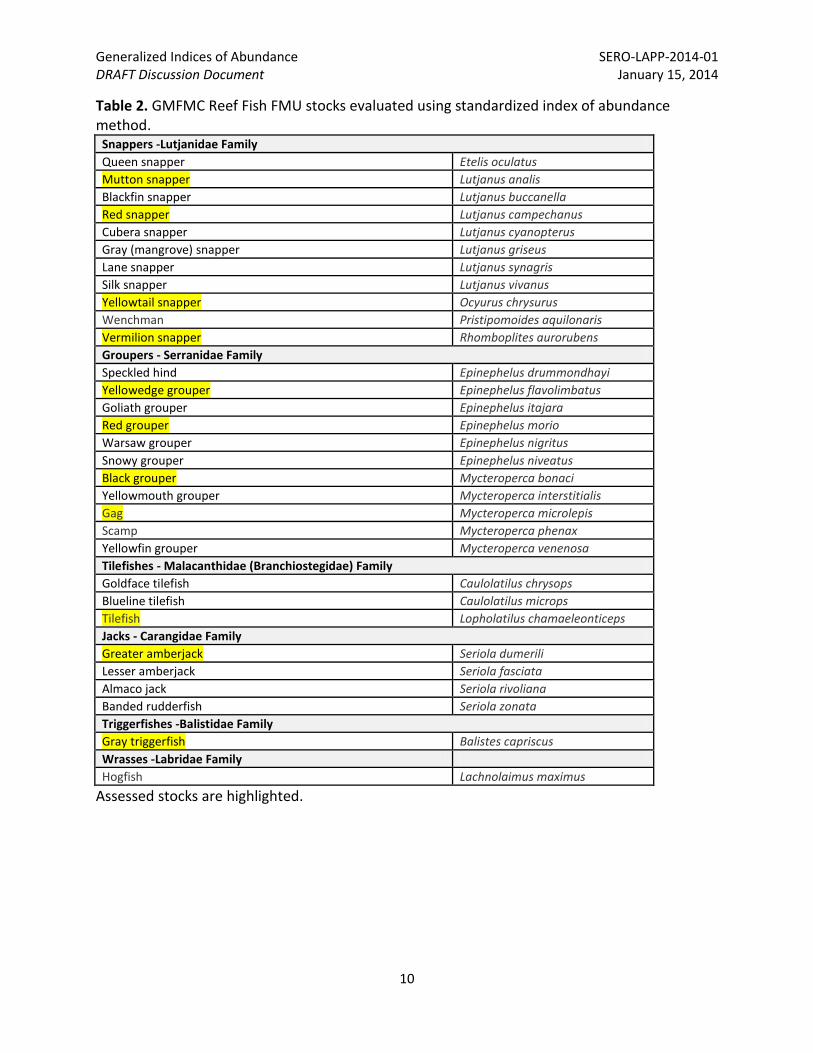
Table 2. GMFMC Reef Fish FMU stocks evaluated using standardized index of abundance method.
Snappers -Lutjanidae Family
Queen snapper Etelis oculatus
Mutton snapper Lutjanus analis
Blackfin snapper Lutjanus buccanella
Red snapper Lutjanus campechanus
Cubera snapper Lutjanus cyanopterus
Gray (mangrove) snapper Lutjanus griseus
Lane snapper Lutjanus synagris
Silk snapper Lutjanus vivanus
Yellowtail snapper Ocyurus chrysurus
Wenchman Pristipomoides aquilonaris
Vermilion snapper Rhomboplites aurorubens
Groupers - Serranidae Family
Speckled hind Epinephelus drummondhayi
Yellowedge grouper Epinephelus flavolimbatus
Goliath grouper Epinephelus itajara
Red grouper Epinephelus morio
Warsaw grouper Epinephelus nigritus
Snowy grouper Epinephelus niveatus
Black grouper Mycteroperca bonaci
Yellowmouth grouper Mycteroperca interstitialis
Gag Mycteroperca microlepis
Scamp Mycteroperca phenax
Yellowfin grouper Mycteroperca venenosa
Tilefishes - Malacanthidae (Branchiostegidae) Family
Goldface tilefish Caulolatilus chrysops
Blueline tilefish Caulolatilus microps
Tilefish Lopholatilus chamaeleonticeps
Jacks - Carangidae Family
Greater amberjack Seriola dumerili
Lesser amberjack Seriola fasciata
Almaco jack Seriola rivoliana
Banded rudderfish Seriola zonata
Triggerfishes -Balistidae Family
Gray triggerfish Balistes capriscus
Wrasses -Labridae Family
Hogfish Lachnolaimus maximus
Assessed stocks are highlighted.
Generalized Indices of Abundance SERO-LAPP-2014-01 DRAFT Discussion Document January 15, 2014
11
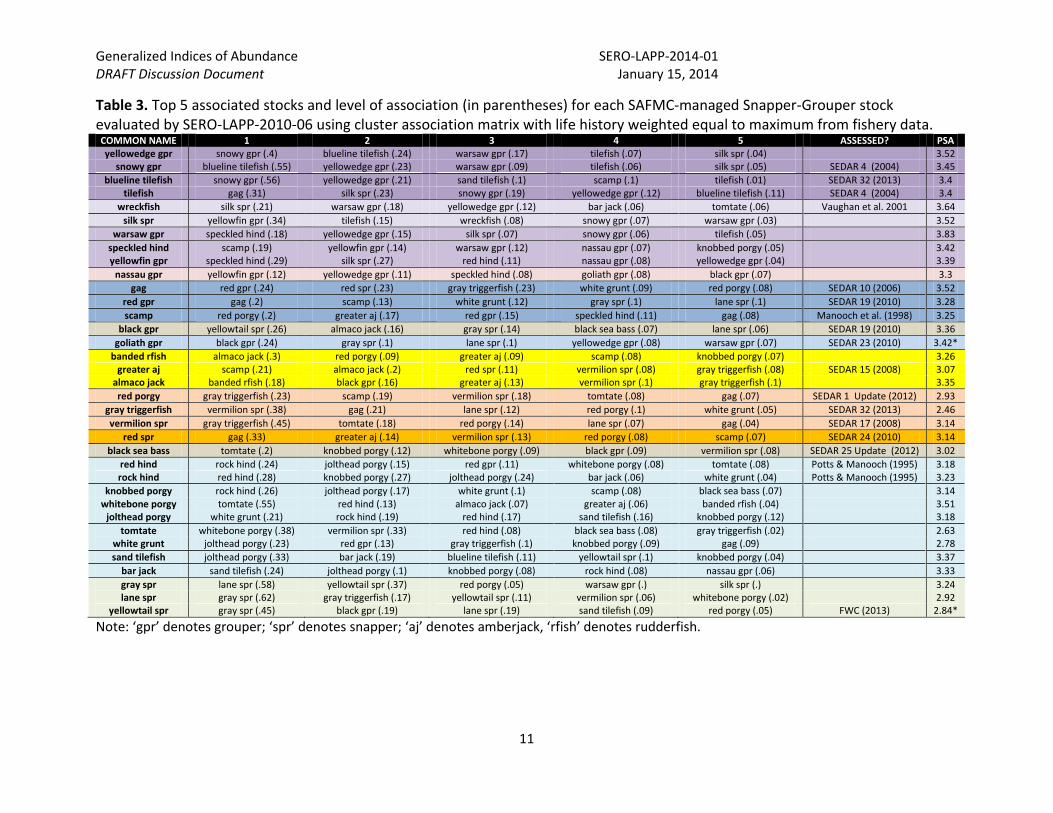
Table 3. Top 5 associated stocks and level of association (in parentheses) for each SAFMC-managed Snapper-Grouper stock evaluated by SERO-LAPP-2010-06 using cluster association matrix with life history weighted equal to maximum from fishery data. COMMON NAME 1 2 3 4 5 ASSESSED? PSA yellowedge gpr snowy gpr (.4) blueline tilefish (.24) warsaw gpr (.17) tilefish (.07) silk spr (.04) 3.52
snowy gpr blueline tilefish (.55) yellowedge gpr (.23) warsaw gpr (.09) tilefish (.06) silk spr (.05) SEDAR 4 (2004) 3.45
blueline tilefish snowy gpr (.56) yellowedge gpr (.21) sand tilefish (.1) scamp (.1) tilefish (.01) SEDAR 32 (2013) 3.4 tilefish gag (.31) silk spr (.23) snowy gpr (.19) yellowedge gpr (.12) blueline tilefish (.11) SEDAR 4 (2004) 3.4
wreckfish silk spr (.21) warsaw gpr (.18) yellowedge gpr (.12) bar jack (.06) tomtate (.06) Vaughan et al. 2001 3.64
silk spr yellowfin gpr (.34) tilefish (.15) wreckfish (.08) snowy gpr (.07) warsaw gpr (.03) 3.52
warsaw gpr speckled hind (.18) yellowedge gpr (.15) silk spr (.07) snowy gpr (.06) tilefish (.05) 3.83
speckled hind scamp (.19) yellowfin gpr (.14) warsaw gpr (.12) nassau gpr (.07) knobbed porgy (.05) 3.42 yellowfin gpr speckled hind (.29) silk spr (.27) red hind (.11) nassau gpr (.08) yellowedge gpr (.04) 3.39
nassau gpr yellowfin gpr (.12) yellowedge gpr (.11) speckled hind (.08) goliath gpr (.08) black gpr (.07) 3.3
gag red gpr (.24) red spr (.23) gray triggerfish (.23) white grunt (.09) red porgy (.08) SEDAR 10 (2006) 3.52
red gpr gag (.2) scamp (.13) white grunt (.12) gray spr (.1) lane spr (.1) SEDAR 19 (2010) 3.28
scamp red porgy (.2) greater aj (.17) red gpr (.15) speckled hind (.11) gag (.08) Manooch et al. (1998) 3.25
black gpr yellowtail spr (.26) almaco jack (.16) gray spr (.14) black sea bass (.07) lane spr (.06) SEDAR 19 (2010) 3.36
goliath gpr black gpr (.24) gray spr (.1) lane spr (.1) yellowedge gpr (.08) warsaw gpr (.07) SEDAR 23 (2010) 3.42*
banded rfish almaco jack (.3) red porgy (.09) greater aj (.09) scamp (.08) knobbed porgy (.07) 3.26 greater aj scamp (.21) almaco jack (.2) red spr (.11) vermilion spr (.08) gray triggerfish (.08) SEDAR 15 (2008) 3.07
almaco jack banded rfish (.18) black gpr (.16) greater aj (.13) vermilion spr (.1) gray triggerfish (.1) 3.35
red porgy gray triggerfish (.23) scamp (.19) vermilion spr (.18) tomtate (.08) gag (.07) SEDAR 1 Update (2012) 2.93
gray triggerfish vermilion spr (.38) gag (.21) lane spr (.12) red porgy (.1) white grunt (.05) SEDAR 32 (2013) 2.46
vermilion spr gray triggerfish (.45) tomtate (.18) red porgy (.14) lane spr (.07) gag (.04) SEDAR 17 (2008) 3.14
red spr gag (.33) greater aj (.14) vermilion spr (.13) red porgy (.08) scamp (.07) SEDAR 24 (2010) 3.14
black sea bass tomtate (.2) knobbed porgy (.12) whitebone porgy (.09) black gpr (.09) vermilion spr (.08) SEDAR 25 Update (2012) 3.02
red hind rock hind (.24) jolthead porgy (.15) red gpr (.11) whitebone porgy (.08) tomtate (.08) Potts & Manooch (1995) 3.18 rock hind red hind (.28) knobbed porgy (.27) jolthead porgy (.24) bar jack (.06) white grunt (.04) Potts & Manooch (1995) 3.23
knobbed porgy rock hind (.26) jolthead porgy (.17) white grunt (.1) scamp (.08) black sea bass (.07) 3.14 whitebone porgy tomtate (.55) red hind (.13) almaco jack (.07) greater aj (.06) banded rfish (.04) 3.51
jolthead porgy white grunt (.21) rock hind (.19) red hind (.17) sand tilefish (.16) knobbed porgy (.12) 3.18
tomtate whitebone porgy (.38) vermilion spr (.33) red hind (.08) black sea bass (.08) gray triggerfish (.02) 2.63 white grunt jolthead porgy (.23) red gpr (.13) gray triggerfish (.1) knobbed porgy (.09) gag (.09) 2.78
sand tilefish jolthead porgy (.33) bar jack (.19) blueline tilefish (.11) yellowtail spr (.1) knobbed porgy (.04) 3.37
bar jack sand tilefish (.24) jolthead porgy (.1) knobbed porgy (.08) rock hind (.08) nassau gpr (.06) 3.33
gray spr lane spr (.58) yellowtail spr (.37) red porgy (.05) warsaw gpr (.) silk spr (.) 3.24 lane spr gray spr (.62) gray triggerfish (.17) yellowtail spr (.11) vermilion spr (.06) whitebone porgy (.02) 2.92
yellowtail spr gray spr (.45) black gpr (.19) lane spr (.19) sand tilefish (.09) red porgy (.05) FWC (2013) 2.84*
Note: ‘gpr’ denotes grouper; ‘spr’ denotes snapper; ‘aj’ denotes amberjack, ‘rfish’ denotes rudderfish.
Generalized Indices of Abundance SERO-LAPP-2014-01 DRAFT Discussion Document January 15, 2014
12
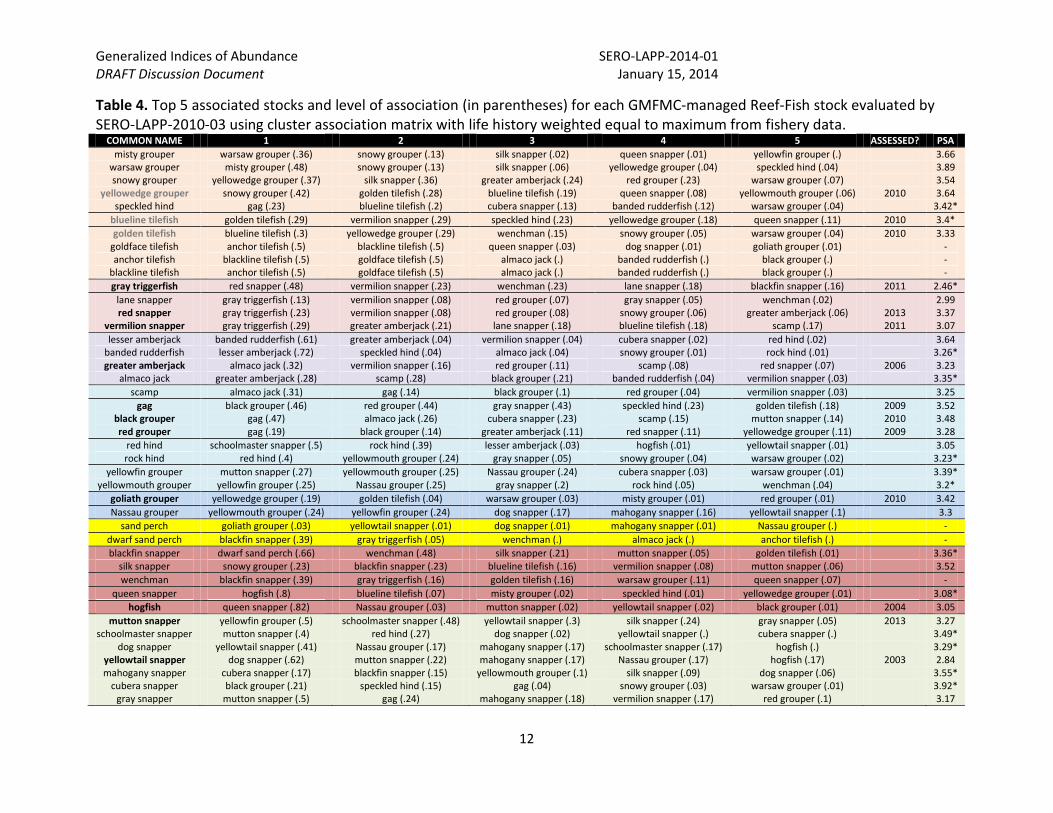
Table 4. Top 5 associated stocks and level of association (in parentheses) for each GMFMC-managed Reef-Fish stock evaluated by SERO-LAPP-2010-03 using cluster association matrix with life history weighted equal to maximum from fishery data.
COMMON NAME 1 2 3 4 5 ASSESSED? PSA
misty grouper warsaw grouper (.36) snowy grouper (.13) silk snapper (.02) queen snapper (.01) yellowfin grouper (.) 3.66 warsaw grouper misty grouper (.48) snowy grouper (.13) silk snapper (.06) yellowedge grouper (.04) speckled hind (.04) 3.89 snowy grouper yellowedge grouper (.37) silk snapper (.36) greater amberjack (.24) red grouper (.23) warsaw grouper (.07) 3.54
yellowedge grouper snowy grouper (.42) golden tilefish (.28) blueline tilefish (.19) queen snapper (.08) yellowmouth grouper (.06) 2010 3.64 speckled hind gag (.23) blueline tilefish (.2) cubera snapper (.13) banded rudderfish (.12) warsaw grouper (.04) 3.42*
blueline tilefish golden tilefish (.29) vermilion snapper (.29) speckled hind (.23) yellowedge grouper (.18) queen snapper (.11) 2010 3.4*
golden tilefish blueline tilefish (.3) yellowedge grouper (.29) wenchman (.15) snowy grouper (.05) warsaw grouper (.04) 2010 3.33 goldface tilefish anchor tilefish (.5) blackline tilefish (.5) queen snapper (.03) dog snapper (.01) goliath grouper (.01) - anchor tilefish blackline tilefish (.5) goldface tilefish (.5) almaco jack (.) banded rudderfish (.) black grouper (.) -
blackline tilefish anchor tilefish (.5) goldface tilefish (.5) almaco jack (.) banded rudderfish (.) black grouper (.) -
gray triggerfish red snapper (.48) vermilion snapper (.23) wenchman (.23) lane snapper (.18) blackfin snapper (.16) 2011 2.46*
lane snapper gray triggerfish (.13) vermilion snapper (.08) red grouper (.07) gray snapper (.05) wenchman (.02) 2.99 red snapper gray triggerfish (.23) vermilion snapper (.08) red grouper (.08) snowy grouper (.06) greater amberjack (.06) 2013 3.37
vermilion snapper gray triggerfish (.29) greater amberjack (.21) lane snapper (.18) blueline tilefish (.18) scamp (.17) 2011 3.07
lesser amberjack banded rudderfish (.61) greater amberjack (.04) vermilion snapper (.04) cubera snapper (.02) red hind (.02) 3.64 banded rudderfish lesser amberjack (.72) speckled hind (.04) almaco jack (.04) snowy grouper (.01) rock hind (.01) 3.26* greater amberjack almaco jack (.32) vermilion snapper (.16) red grouper (.11) scamp (.08) red snapper (.07) 2006 3.23
almaco jack greater amberjack (.28) scamp (.28) black grouper (.21) banded rudderfish (.04) vermilion snapper (.03) 3.35*
scamp almaco jack (.31) gag (.14) black grouper (.1) red grouper (.04) vermilion snapper (.03) 3.25
gag black grouper (.46) red grouper (.44) gray snapper (.43) speckled hind (.23) golden tilefish (.18) 2009 3.52 black grouper gag (.47) almaco jack (.26) cubera snapper (.23) scamp (.15) mutton snapper (.14) 2010 3.48 red grouper gag (.19) black grouper (.14) greater amberjack (.11) red snapper (.11) yellowedge grouper (.11) 2009 3.28
red hind schoolmaster snapper (.5) rock hind (.39) lesser amberjack (.03) hogfish (.01) yellowtail snapper (.01) 3.05 rock hind red hind (.4) yellowmouth grouper (.24) gray snapper (.05) snowy grouper (.04) warsaw grouper (.02) 3.23*
yellowfin grouper mutton snapper (.27) yellowmouth grouper (.25) Nassau grouper (.24) cubera snapper (.03) warsaw grouper (.01) 3.39* yellowmouth grouper yellowfin grouper (.25) Nassau grouper (.25) gray snapper (.2) rock hind (.05) wenchman (.04) 3.2*
goliath grouper yellowedge grouper (.19) golden tilefish (.04) warsaw grouper (.03) misty grouper (.01) red grouper (.01) 2010 3.42
Nassau grouper yellowmouth grouper (.24) yellowfin grouper (.24) dog snapper (.17) mahogany snapper (.16) yellowtail snapper (.1) 3.3
sand perch goliath grouper (.03) yellowtail snapper (.01) dog snapper (.01) mahogany snapper (.01) Nassau grouper (.) -
dwarf sand perch blackfin snapper (.39) gray triggerfish (.05) wenchman (.) almaco jack (.) anchor tilefish (.) -
blackfin snapper dwarf sand perch (.66) wenchman (.48) silk snapper (.21) mutton snapper (.05) golden tilefish (.01) 3.36* silk snapper snowy grouper (.23) blackfin snapper (.23) blueline tilefish (.16) vermilion snapper (.08) mutton snapper (.06) 3.52
wenchman blackfin snapper (.39) gray triggerfish (.16) golden tilefish (.16) warsaw grouper (.11) queen snapper (.07) -
queen snapper hogfish (.8) blueline tilefish (.07) misty grouper (.02) speckled hind (.01) yellowedge grouper (.01) 3.08*
hogfish queen snapper (.82) Nassau grouper (.03) mutton snapper (.02) yellowtail snapper (.02) black grouper (.01) 2004 3.05
mutton snapper yellowfin grouper (.5) schoolmaster snapper (.48) yellowtail snapper (.3) silk snapper (.24) gray snapper (.05) 2013 3.27 schoolmaster snapper mutton snapper (.4) red hind (.27) dog snapper (.02) yellowtail snapper (.) cubera snapper (.) 3.49*
dog snapper yellowtail snapper (.41) Nassau grouper (.17) mahogany snapper (.17) schoolmaster snapper (.17) hogfish (.) 3.29* yellowtail snapper dog snapper (.62) mutton snapper (.22) mahogany snapper (.17) Nassau grouper (.17) hogfish (.17) 2003 2.84 mahogany snapper cubera snapper (.17) blackfin snapper (.15) yellowmouth grouper (.1) silk snapper (.09) dog snapper (.06) 3.55*
cubera snapper black grouper (.21) speckled hind (.15) gag (.04) snowy grouper (.03) warsaw grouper (.01) 3.92* gray snapper mutton snapper (.5) gag (.24) mahogany snapper (.18) vermilion snapper (.17) red grouper (.1) 3.17
Generalized Indices of Abundance SERO-LAPP-2014-01 DRAFT Discussion Document January 15, 2014
13
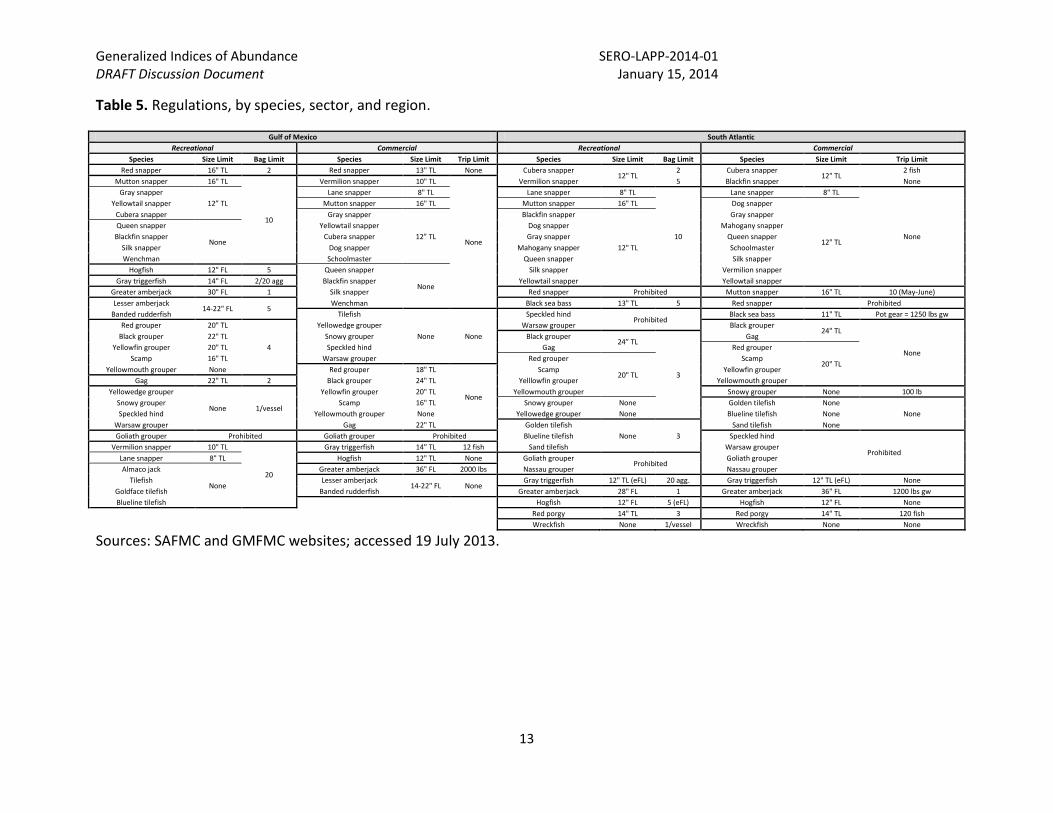
Table 5. Regulations, by species, sector, and region.
Gulf of Mexico South Atlantic
Recreational Commercial Recreational Commercial
Species Size Limit Bag Limit Species Size Limit Trip Limit Species Size Limit Bag Limit Species Size Limit Trip Limit
Red snapper 16" TL 2 Red snapper 13" TL None Cubera snapper 12" TL
2 Cubera snapper 12" TL
2 fish
Mutton snapper 16" TL
10
Vermilion snapper 10" TL
None
Vermilion snapper 5 Blackfin snapper None
Gray snapper
12” TL
Lane snapper 8" TL Lane snapper 8" TL
10
Lane snapper 8" TL
None
Yellowtail snapper Mutton snapper 16" TL Mutton snapper 16" TL Dog snapper
12" TL
Cubera snapper Gray snapper
12” TL
Blackfin snapper
12" TL
Gray snapper
Queen snapper
None
Yellowtail snapper Dog snapper Mahogany snapper
Blackfin snapper Cubera snapper Gray snapper Queen snapper
Silk snapper Dog snapper Mahogany snapper Schoolmaster
Wenchman Schoolmaster Queen snapper Silk snapper
Hogfish 12" FL 5 Queen snapper
None
Silk snapper Vermilion snapper
Gray triggerfish 14" FL 2/20 agg Blackfin snapper Yellowtail snapper Yellowtail snapper
Greater amberjack 30" FL 1 Silk snapper Red snapper Prohibited Mutton snapper 16" TL 10 (May-June)
Lesser amberjack 14-22" FL 5
Wenchman Black sea bass 13" TL 5 Red snapper Prohibited
Banded rudderfish Tilefish
None None
Speckled hind Prohibited
Black sea bass 11" TL Pot gear = 1250 lbs gw
Red grouper 20" TL
4
Yellowedge grouper Warsaw grouper Black grouper 24" TL
None
Black grouper 22" TL Snowy grouper Black grouper 24” TL
3
Gag
Yellowfin grouper 20" TL Speckled hind Gag Red grouper
20" TL Scamp 16" TL Warsaw grouper Red grouper
20" TL
Scamp
Yellowmouth grouper None Red grouper 18" TL
None
Scamp Yellowfin grouper
Gag 22" TL 2 Black grouper 24" TL Yelllowfin grouper Yellowmouth grouper
Yellowedge grouper
None 1/vessel
Yellowfin grouper 20" TL Yellowmouth grouper Snowy grouper None 100 lb
Snowy grouper Scamp 16" TL Snowy grouper None Golden tilefish None
None Speckled hind Yellowmouth grouper None Yellowedge grouper None Blueline tilefish None
Warsaw grouper Gag 22" TL Golden tilefish
None 3
Sand tilefish None
Goliath grouper Prohibited Goliath grouper Prohibited Blueline tilefish Speckled hind
Prohibited Vermilion snapper 10" TL
20
Gray triggerfish 14" TL 12 fish Sand tilefish Warsaw grouper
Lane snapper 8" TL Hogfish 12" TL None Goliath grouper Prohibited
Goliath grouper
Almaco jack
None
Greater amberjack 36" FL 2000 lbs Nassau grouper Nassau grouper
Tilefish Lesser amberjack 14-22" FL None
Gray triggerfish 12" TL (eFL) 20 agg. Gray triggerfish 12" TL (eFL) None
Goldface tilefish Banded rudderfish Greater amberjack 28" FL 1 Greater amberjack 36" FL 1200 lbs gw
Blueline tilefish
Hogfish 12" FL 5 (eFL) Hogfish 12" FL None
Red porgy 14" TL 3 Red porgy 14" TL 120 fish
Wreckfish None 1/vessel Wreckfish None None
Sources: SAFMC and GMFMC websites; accessed 19 July 2013.
Generalized Indices of Abundance SERO-LAPP-2014-01 DRAFT Discussion Document January 15, 2014
14
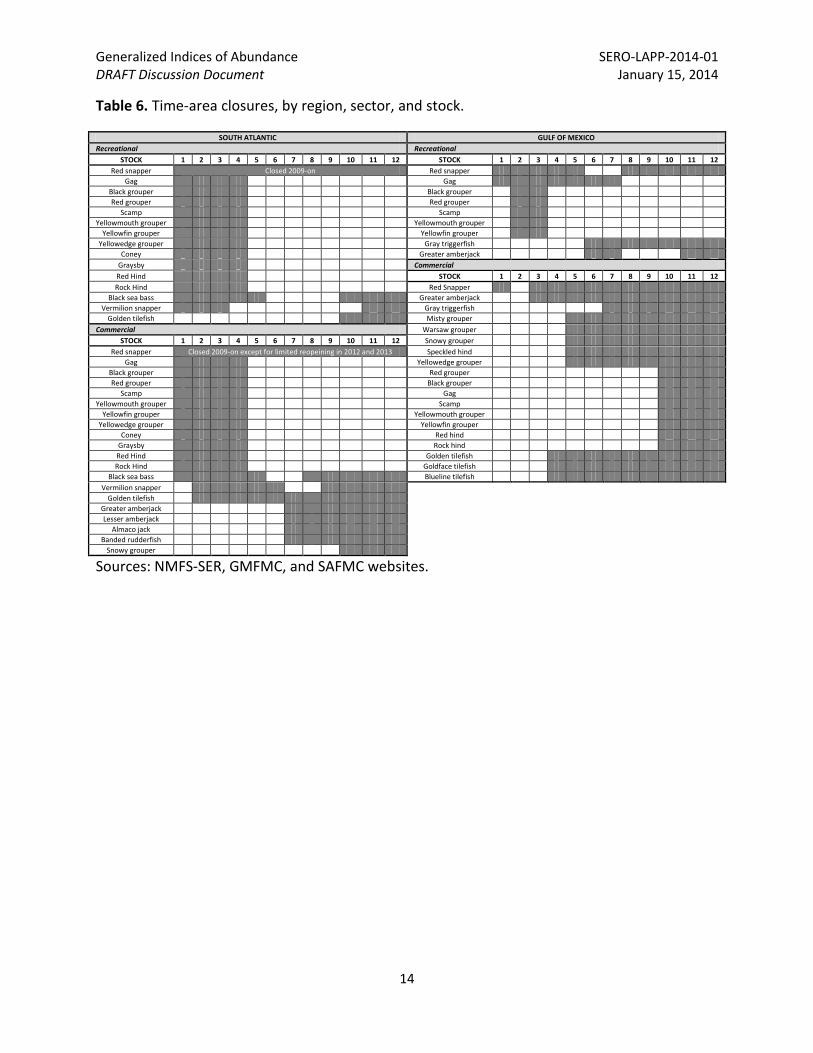
Table 6. Time-area closures, by region, sector, and stock.
SOUTH ATLANTIC GULF OF MEXICO
Recreational Recreational
STOCK 1 2 3 4 5 6 7 8 9 10 11 12 STOCK 1 2 3 4 5 6 7 8 9 10 11 12
Red snapper Closed 2009-on Red snapper
Gag Gag
Black grouper Black grouper
Red grouper Red grouper
Scamp Scamp
Yellowmouth grouper Yellowmouth grouper
Yellowfin grouper Yellowfin grouper
Yellowedge grouper Gray triggerfish
Coney Greater amberjack
Graysby Commercial
Red Hind STOCK 1 2 3 4 5 6 7 8 9 10 11 12
Rock Hind Red Snapper
Black sea bass Greater amberjack
Vermilion snapper Gray triggerfish
Golden tilefish Misty grouper
Commercial Warsaw grouper
STOCK 1 2 3 4 5 6 7 8 9 10 11 12 Snowy grouper
Red snapper Closed 2009-on except for limited reopeining in 2012 and 2013 Speckled hind
Gag Yellowedge grouper
Black grouper Red grouper
Red grouper Black grouper
Scamp Gag
Yellowmouth grouper Scamp
Yellowfin grouper Yellowmouth grouper
Yellowedge grouper Yellowfin grouper
Coney Red hind
Graysby Rock hind
Red Hind Golden tilefish
Rock Hind Goldface tilefish
Black sea bass Blueline tilefish
Vermilion snapper Golden tilefish Greater amberjack Lesser amberjack Almaco jack Banded rudderfish Snowy grouper
Sources: NMFS-SER, GMFMC, and SAFMC websites.
Generalized Indices of Abundance SERO-LAPP-2014-01 DRAFT Discussion Document January 15, 2014
15
Figure 1. Total landings (millions of pounds MP, whole weight) of managed stocks discussed in this report, 1986-2012. Source: SEFSC ACL Data. Note, the South Atlantic Fishery Management Council’s Scientific and Statistical Committee categorized misty grouper and scamp as having stable or increasing catch, and categorized tomtate and white grunt as having decreasing catches with stable recent effort in their Only Reliable Catch Stocks (ORCS) workshop.
0
2
4
6
8
10
12
1986 1988 1990 1992 1994 1996 1998 2000 2002 2004 2006 2008 2010 2012
Lan
din
gs (
MP
)
SA black sea bass SA greater amberjack SA vermilion snapper
SA misty grouper SA scamp SA tomtate
SA white grunt Gulf gag Gulf greater amberjack
Gulf red grouper
Generalized Indices of Abundance SERO-LAPP-2014-01 DRAFT Discussion Document January 15, 2014
16
Figure 2. Standardized indices of abundance generated using generalized method and more rigorous SEDAR-25 (2011 Update) methods for South Atlantic black sea bass. Headboat 95% confidence bands generated using generalized method not presented as they were extremely wide.
Generalized Indices of Abundance SERO-LAPP-2014-01 DRAFT Discussion Document January 15, 2014
17
Figure 3. Standardized indices of abundance generated using generalized method and more rigorous SEDAR-17 (2011 Update) method for South Atlantic vermilion snapper.
Generalized Indices of Abundance SERO-LAPP-2014-01 DRAFT Discussion Document January 15, 2014
18
Figure 4. Standardized indices of abundance generated using generalized method (this manuscript) and more rigorous SEDAR-15 (2008) method for South Atlantic greater amberjack.
Generalized Indices of Abundance SERO-LAPP-2014-01 DRAFT Discussion Document January 15, 2014
19
Figure 5. Standardized indices of abundance generated using generalized method (this manuscript) and more rigorous SEDAR-9 (2011 Update) method for Gulf of Mexico greater amberjack.
Generalized Indices of Abundance SERO-LAPP-2014-01 DRAFT Discussion Document January 15, 2014
20
Figure 6. Standardized indices of abundance generated using generalized method (this manuscript) and more rigorous SEDAR-12 (2009 Update) method for Gulf of Mexico red grouper.
Generalized Indices of Abundance SERO-LAPP-2014-01 DRAFT Discussion Document January 15, 2014
21
Figure 7. Standardized indices of abundance generated using generalized method (this manuscript) and more rigorous SEDAR-10 (2009 Update) method for Gulf of Mexico gag.
Generalized Indices of Abundance SERO-LAPP-2014-01 DRAFT Discussion Document January 15, 2014
22
Figure 8. Standardized index of abundance generated using generalized method for South Atlantic misty grouper.
Generalized Indices of Abundance SERO-LAPP-2014-01 DRAFT Discussion Document January 15, 2014
23
Figure 9. Standardized indices of abundance generated using generalized method for South Atlantic scamp.
Generalized Indices of Abundance SERO-LAPP-2014-01 DRAFT Discussion Document January 15, 2014
24
Figure 10. Standardized indices of abundance generated using generalized method for South Atlantic tomtate.
Generalized Indices of Abundance SERO-LAPP-2014-01 DRAFT Discussion Document January 15, 2014
25
Figure 11. Standardized indices of abundance generated using generalized method for South Atlantic white grunt.