Embed Size (px)
Citation preview

Generic design assessment AP1000 nuclear power plant design by Westinghouse Electric Company LLC
Assessment report Independent dose assessment

Environment Agency – Independent dose assessment of AP-1000 design for GDA Page ii
We are the Environment Agency. It's our job to look after your environment and make it a better place - for you, and for future generations. Your environment is the air you breathe, the water you drink and the ground you walk on. Working with business, Government and society as a whole, we are making your environment cleaner and healthier. The Environment Agency. Out there, making your environment a better place.
Published by: Environment Agency Rio House Waterside Drive, Aztec West Almondsbury, Bristol BS32 4UD Tel: 0870 8506506 Email: [email protected] www.environment-agency.gov.uk © Environment Agency All rights reserved. This document may be reproduced with prior permission of the Environment Agency.
Author(s): C.A. Robinson, S. Saleh, A. Punt Dissemination Status: Publicly available Keywords: New Nuclear Power Stations; GDA; Public Dose; Westinghouse; AP1000 Contractor: Enviros Consulting Ltd Environment Agency’s Project Manager: E.J. Tooley and J.G. Titley Collaborator(s): Advice taken from the Health Protection Agency and the Food Standards Agency IMAS Report Number: TR/2010/06
Reference number/code GEHO0510BSKO-E-E

Environment Agency – Independent dose assessment of AP-1000 design for GDA Page iii
Executive summary The Health and Safety Executive and the Environment Agency (the nuclear regulators) are working together to ensure that any new nuclear power stations built in the UK meet the highest standard of safety, security, environmental protection and waste management. Together we have established a generic design assessment process to consider the acceptability of the new nuclear power station plants. One of the stages in the processes is consideration of the environmental acceptability of the design. In the first stage of the GDA process, we are carrying out detailed assessments of the environmental effects of each design, which will lead to a statement about the acceptability of the design. The statement on acceptability will be non-binding but will give a strong indication of whether a design is likely to be acceptable in principle in the UK with respect to matters that the Environment Agency regulates. Westinghouse Electric Company (WEC) has submitted its AP1000 Generic Design for evaluation under the GDA arrangements. In their submission, WEC provided assessments of potential doses to members of the public from discharges of radioactive waste to atmosphere and to the marine environment. As part of the GDA process, an independent assessment of the potential impact of liquid and gaseous discharges of radioactive wastes from the AP1000 design has been carried out, on behalf of the Environment Agency, in accordance with the generic design assessment approach outlined in our Process and Information Document for Generic Assessment of Candidate Nuclear Power Plant Designs [Ref. 1]. This assessment takes account of the discharge information, design and the generic site description, provided by WEC. The aim of the independent assessment was to:
• Validate and verify the assumptions made by WEC in their dose assessments; • Validate and verify the outcomes of the dose assessments carried out by
WEC; • Carry out independent dose assessments to demonstrate that the dose
assessments carried out by WEC are realistic. In the WEC submission, it assumed that the AP1000 would be located on the coast. WEC applied the Environment Agency’s initial radiological assessment approach. Using this approach, a dose of 7.6 µSv/y and 12 µSv/y are assessed to local residents from the annual representative and annual limit discharges to atmosphere respectively. The highest dose to an adult fisherman from marine discharges was assessed as 2.3 µSv/y for representative discharges and 3.8 µSv/y for annual limit discharges. It was possible to repeat these assessments using the WEC assumptions. The WEC assessment of direct radiation was based on measured values for Sizewell B which is the only PWR operating in the UK. The direct radiation dose rate measured at the site perimeter fence during 2007 of 4 µSv/y was used in the WEC assessment. WEC also assessed the impact of short duration releases to

Environment Agency – Independent dose assessment of AP-1000 design for GDA Page iv
atmosphere at higher discharge rates as 12 µSv/y. The total dose assessed by WEC to the representative person from the site was therefore 14 µSv/y for representative discharges and 20 µSv/y for discharges at possible annual limits, including a contribution from short-term releases. This is based on a conservative summation of doses from atmospheric discharges, liquid discharges and direct radiation. WEC did not undertake a detailed assessment which is sometimes made following on from the initial radiological assessment. A more detailed independent assessment was undertaken on behalf of the Environment Agency. This assessment took into account good practice and published assessment guidance and used PC CREAM 98, a long recognised system for dose assessment developed for the EC. At the discharges to atmosphere assumed by WEC, a dose of around 4 µSv/y to the most exposed local residents consuming locally produced terrestrial foods has been estimated. This assumes an effective stack height that takes account of the effects of adjacent buildings. On the basis of the expected liquid discharges estimated by WEC, effective doses of around 1 µSv/y to an adult fisherman have been assessed. The assessment of direct radiation was based on measured values for Sizewell B for 2007, for which a value of 4 µSv/y has been published. The representative person dose from the site assessed in the more detailed independent assessment has been predicted to be 8 µSv/y, including a contribution from direct radiation but without the inclusion of a contribution from short-term releases. Doses from short duration releases are presented separately. WEC assessment outcomes were higher than the independent assessment because it is based on conservative assumptions from the initial assessment system and more conservative assumptions about combinations of exposures than those applied in the independent assessment. Doses predicted from WEC assessment and from the independent assessment were very low and well below the dose constraint of 300 µSv/y or the proposed constraint for new nuclear power stations of 150 µSv/y. The independent assessment of collective doses was essentially equivalent to that presented in the WEC submission. A dose of 11-13 µSv (depending on age group) has been predicted to arise from a single short-term release to atmosphere – where one month’s discharge is assumed to occur over a short time scale. This compares to 12 µSv predicted by WEC. There are some small differences in the application of the atmospheric dispersion model for this scenario however the outcomes are similar.

Environment Agency – Independent dose assessment of AP-1000 design for GDA Page v
Contents Executive summary iii Introduction 1 Assessments made 1 Discharge data for assessments 2 Assessment Methodology 2 Exposure pathways 3 Candidates for the representative person 4 Results 5 Discussion 7 Comparison of the WEC and independent assessments 8 Uncertainty in results 8 Doses to the foetus and breast fed infants 8 Conclusions 9 References 10 Appendix 1 – Verification of radiological assessment and short term assessment for Westinghouse AP1000 Design 14 Appendix 2 – Review of assessment of Westinghouse AP1000 design; assessment approach and summary of key independent parameters 23 Appendix 3 – Independent radiological assessment of discharges to atmosphere 42 Appendix 4 – Independent radiological assessment of liquid discharges 54 Appendix 5 – Independent radiological assessment of collective doses 67 Appendix 6 – Independent radiological assessment of doses from potential short term releases 72 Appendix 7 – The effect of alternative assumptions on the independent assessment 79 Appendix 8 – Independent assessment of doses from direct radiation 85 Appendix 9 – Independent assessment of site dose and total dose 87

Environment Agency – Independent dose assessment of AP-1000 design for GDA Page 1
Introduction 1 The Environment Agency has established a Generic Design Assessment (GDA) process,
together with the Health and Safety Executive (HSE), to consider the acceptability of candidate designs for new nuclear power plant designs, proposed by Requesting Parties (RPs). The Westinghouse Electric Company LLC (WEC), as a RP, has submitted its AP1000 nuclear power plant design for evaluation under these GDA arrangements.
2 As required by the Environment Agency’s Process and Information Document [Ref. 1], the
WEC submission included an assessment of annual individual and collective doses arising from potential liquid and gaseous discharges, and of potential short-term doses from the maximum short-term planned discharges in a single month [Ref. 2]. These assessments were based on generic design and hypothetical site characteristics [Ref. 2, 3, 4].
3 The WEC submission assumed that the AP1000 would be located at the coast. WEC
proposed characteristics of the generic coastal site to encompass the range of conditions likely to occur at any coastal nuclear site in England and Wales [Ref. 2, 4]. Generic information on the location of the closest habitation, farms and population centres were also derived on the basis of information from a range of existing nuclear sites in England and Wales [Ref. 2, 4].
4 The WEC submission has been critically reviewed and verified and an independent
assessment of the impact of liquid and gaseous discharges has been undertaken.
Assessments made 5 An independent assessment has been undertaken of the WEC submission, on behalf of the
Environment Agency, in order to: • Validate and verify the assumptions made by WEC in their dose assessments; • Validate and verify the outcomes of the dose assessments carried out by WEC; • Carry out independent dose assessments to determine whether the dose assessments
carried out by WEC are realistic. 6 The first stage of this independent approach was application of the Environment Agency’s
Initial Radiological Assessment approach [Ref. 5], followed by a more detailed assessment using PC CREAM 98 [Ref. 6] and comparison with the corresponding assessment undertaken by WEC [Ref. 2].
7 The WEC initial radiological assessment was verified by repeating it using the same
assumptions and models. Similar results were obtained for both atmospheric and liquid discharges, as described in more detail in Appendix 1.
8 A review of assumptions and parameters used in approach adopted by WEC, has been
undertaken. This review also informed the approach taken in the independent re-assessment made on behalf of the Environment Agency. The results of this review and a comparison of the bases for the WEC and independent assessments are presented in Appendix 2. The differences are also highlighted in that appendix.
9 An independent assessment has been made of the annual doses to the public from the
representative annual discharges and annual limit radioactive discharges to the atmosphere and to the marine environment and from direct radiation. An assessment has also been made of the potential short-term dose from the maximum short-term discharge, based on the highest planned discharge in a single month. The collective doses arising from the representative annual releases to atmosphere and of radioactive liquid discharge have also been assessed.

Environment Agency – Independent dose assessment of AP-1000 design for GDA Page 2
Discharge data for assessments 10 The expected annual releases to the atmosphere from different buildings and stack heights
were provided [Ref. 2, 3] by WEC and are summarised in Table 1. These data were used in the independent detailed assessment. Alternative discharge assumptions were also provided and used by WEC in their initial radiological assessment [Ref. 2]. These discharges and the assessments are discussed in more detail in Appendix 1. WEC indicate [Ref. 2] that the effective stack heights of the main vent and turbine building vent are both around 22.5 m, allowing for the effect of the adjacent reactor buildings. Around 12% of the total atmospheric release was considered to take place from the turbine building vent. For the purposes of the initial radiological and collective dose assessments, WEC assumed all atmospheric releases to be discharged from a single stack with an effective stack height of 22.5 m [Ref. 2, 3].
11 The maximum short-term discharges to atmosphere, envisaged to occur under normal
operational conditions [Ref. 2], are presented in Table 2; the expected annual liquid discharges [Ref. 2, 3] are shown in Table 3. The limited pumping capacity from liquid discharge tanks is considered by WEC to preclude the potential for significant short-term liquid discharges from this route [Ref. 2].
12 The discharge assumptions used by WEC in their initial radiological assessment are
presented in Appendix 1. The more detailed data presented in Tables 1 and 3 were used in the independent verification assessment. The effects of an adjacent building (of height 70 m) on dispersion were also taken into account in the independent initial and more detailed assessments by modifying the effective stack height to 23 m, as described in more detail in Appendices 1 and 2, respectively.
Assessment Methodology 13 The first stage of the independent assessment was to apply the Environment Agency’s Initial
Radiological Assessment approach [Ref. 5]. This provides radionuclide specific dose per unit release factors derived from generic parameters, which allows conservative estimates of dose to be made in a transparent and consistent manner. WEC undertook an initial assessment of their expected discharges using this system. This report presents a verification of this initial assessment stage by repeating the WEC assessment, as described in Appendix 1.
14 The next stage of this work was a critical review of the WEC assessment and supporting
reports, in order to:
• identify the assessment approach, assumptions and parameters used; • comment on the applicability of the approach; and, • determine the basis for an independent assessment.
15 The review was undertaken using consistency matrices that identified each of the key
assessment stages. These matrices are provided in Appendix 2 for ease of reference. 16 The final stage of the work was to undertake an independent detailed assessment taking into
account the review of the WEC initial radiological assessment. The review is summarised in the matrices in Appendix 2. The independent assessment also took account of guidance provided by the UK National Dose Assessment Working Group (NDAWG). The NDAWG provides a technical forum dealing with dose assessment matters for the UK and involves the Environment Agency and other regulatory and advisory organisations.
17 WEC did not undertake a more detailed assessment because their estimated doses from
representative discharges were less than 20 µSv/y, and therefore further assessments would not be required for discharge authorisation purposes [Ref. 5]
18 An assessment spreadsheet was created, using dispersion, environmental transfer and other
relevant information from the PC CREAM 98 programme [Ref. 6]. Allowance for the effects of adjacent buildings on plume dispersion was made and an effective stack height of 23 m was

Environment Agency – Independent dose assessment of AP-1000 design for GDA Page 3
applied. The independent assessment was designed to allow the Environment Agency to take an independent view of the outcome of the discharges.
19 The methodology used for the more detailed independent assessment of the radiological
impact of radioactive discharges, is described in more detail in the appendices, as follows:
• Appendix 3: Radiological assessment of discharges of gaseous radioactive waste to atmosphere using predicted environmental concentrations; obtained from modelling carried out using the PC CREAM 98 model [Ref. 6];
• Appendix 4: Radiological assessment of discharges of liquid radioactive to the marine environment using predicted environmental concentrations; obtained from modelling carried out using the PC CREAM 98 model [Ref. 6];
• Appendix 5: Radiological assessment of collective doses from atmospheric and liquid discharges;
• Appendix 6: Potential doses from anticipated short-term atmospheric releases; • Appendix 7: A discussion about some of the main uncertainties associated with the dose
assessments;. • Appendix 8: The methodology used for the assessment of the potential contribution from
direct radiation • Appendix 9: Estimated site doses and total doses.
20 It is assumed that no radioactive discharges will be made directly to the freshwater
environment from the AP1000 therefore no assessment of doses from the freshwater environment has been made. Furthermore, no release information was provided for site incinerators and it has also been assumed that there are no discharges from this route.
21 Given the generic nature of the site, it has been assumed that there are no current and future
discharges from adjacent sources, or from historic discharges from previous operations. The total doses arising from the AP1000 have therefore been used for comparison with the site dose constraint and the annual effective dose limit for members of the public of 1000 µSv/y. If the AP1000 power plant were to be positioned in the vicinity of a present or previous nuclear site, these dose assessments would need to be modified to take account of any additional contributions to radiation dose that might arise from these sources.
Exposure pathways 22 Members of the public can be exposed to radionuclides discharged to atmosphere or to the
marine environment by a range of exposure pathways. The exposure pathways considered in the independent assessment were based on information provided by WEC on the nature of the generic site [Ref. 3], along with Environment Agency knowledge of the typical nature of nuclear sites gained through radiological assessments of discharges from other sites.
23 For discharges to atmosphere, the WEC initial radiological assessment and the more detailed
independent assessment consider:
• Internal irradiation following inhalation of radionuclides discharged to atmosphere; • Internal irradiation from the ingestion of radionuclides incorporated into locally produced
foods following deposition of radionuclides discharged to atmosphere; • External irradiation from radionuclides in the atmosphere and deposited on the ground
following discharge to atmosphere. 24 For discharges of liquids to coastal waters the WEC initial radiological assessment and the
independent assessment consider:
• External irradiation following incorporation of radionuclides into coastal sediment;

Environment Agency – Independent dose assessment of AP-1000 design for GDA Page 4
• Internal irradiation following the ingestion of radionuclides in marine fish and shellfish caught along the coast. Inhalation of sea spray incorporating radionuclides;
The following additional minor pathways were included in the more detailed independent assessment, which were not included in that undertaken by WEC:
• External irradiation from exposure to the skin from handling of fishing gear which has
come into contact with the sediment; • Internal irradiation from inhalation of sea spray incorporating radionuclides and
following the inadvertent intake of coastal sediment incorporating radionuclides along the coast.
25 Both the WEC and independent assessments consider:
• External irradiation due to direct radiation from the site. The approaches adopted were similar.
Candidates for the representative person 26 Given the nature of this assessment, specific information on the land use and location of
members of the public around the generic site are not available. As a consequence, it has been necessary to make some general assumptions about the environment around the generic site. In their submission, WEC assumed that the AP1000 nuclear power plant is located at a coastal site and proposed generic assumptions regarding the characteristics of the terrestrial and marine environments that were intended to be conservative and to envelop those of existing UK nuclear sites. Both assessments assume that commercial fish and shellfish may be sourced at or near to the generic site.
27 For the independent assessment, the mode of radioactive waste discharge, information on
generic habits and previous radiological assessments for other sites have been used to identify candidates for the representative person. The candidates for the representative person were chosen to reflect the residential and other communities in the area closest to a generic coastal site. The approach taken in the independent assessment is described more fully in Appendices 3 and 4. Candidates for the representative person most exposed to liquid discharges may also be exposed via consumption of terrestrial foods and other atmospheric pathways and vice versa. However, one or the other discharge tends to dominate and the dominant exposure routes have been used to categorise appropriate candidates for the representative person into: local residents, who are primarily exposed to atmospheric discharge pathways; and a local fisherman and family, who are primarily exposed to liquid discharges.
Candidates for the representative person 28 The WEC assessment is based on the Environment Agency Initial Radiological Assessment
approach [Ref. 5], and the assumptions underlying this approach are presented in more detail in Appendix 2. WEC did not undertake a more detailed assessment.
29 For the independent assessment which is more detailed there was consideration of:
• CRP1 Local residents For the purposes of this generic assessment, it is assumed that a family (adults, children and infants) live in the nearest habitation (assumed to be 100 m from the atmospheric discharge point), are exposed to atmospheric discharges, direct radiation and to liquid discharges in the marine environment. It is assumed that members

Environment Agency – Independent dose assessment of AP-1000 design for GDA Page 5
of this family spend most of their time at home, some of which is spent outside. They get their green vegetables, root vegetables and fruit from their garden or other local source (within 100 m from the atmospheric discharge point) and milk and meat from local farms close to the site (assumed to be located at 500 m from the atmospheric discharge point). They also eat small amounts of local fish and shellfish. Generic habit data were used as the basis for the occupancy and food intakes of the members of this family or families as outlined in Appendix 3. The estimated direct radiation dose is described in Appendix 8.
• CRP2 Fisherman and family For the purposes of this assessment, it is assumed that the
fishermen and their families are exposed to liquid discharges from the site by spending some time on the intertidal sediments in the area and consuming high levels of locally caught fish and shellfish in addition to small amounts of locally produced foodstuffs (fruit and vegetables), originating from local sources (100 and 500 m from the atmospheric discharge point). This group are assumed to live at sufficient distance from the site to not receive exposure from direct radiation or inhalation of atmospheric releases. Generic habit data were used to define the occupancy and food intakes of the members of this family or families, as outlined in more detail in Appendix 4.
30 Generic habit data, based on NRPB-W41 [Ref. 7] have been used together with standard
dose coefficients for internal and external exposure [Ref. 8, 9]. The sources of other assessment parameters are presented in Appendices 3 and 4.
Results Verification of the assessment of doses supplied by WEC. 31 The results of the initial radiological assessment, undertaken by the WEC, are summarised in
Table 4. The effective doses from discharges to atmosphere from the AP1000 plant were predicted to be 7.6 μSv/y for representative discharges and 12 μSv/y for annual limit discharges. The effective doses from liquid discharges from the AP1000 power plant were predicted to be 2.3 μSv/y for representative discharges and 3.8 μSv/y for annual limit discharges. It was possible to reproduce these doses using the same assumptions and model.
32 The WEC assessment of collective doses could be reproduced. 33 The WEC assessment of effective doses arising from short-term releases could be broadly
reproduced, as discussed in more detail in Appendix 1. WEC have predicted an effective dose of 12 µSv to arise from a single release, while doses of between 11 and 13 µSv have been predicted in the independent assessment depending on age group.
Independent assessment of doses undertaken in this work 34 The individual doses to the candidates for the representative person calculated independently
in more detail using generic site and habits data, are summarised in Table 5 for representative annual discharges. At these levels, the effective doses from discharges to atmosphere from the AP1000 power plant to a potential terrestrial candidate representative person of local residents have been predicted to be around 4.4 μSv/y (infants), and 2.9 μSv/y (children) and 2.6 μSv/y (adults). The dose resulting from all discharges to infant candidates for the representative person, broken down by radionuclide and by pathway, is included in Appendix 3. The main pathway contributing to the highest of these doses (to infants) was consumption of C-14 in milk.
35 At the expected annual radioactive liquid discharge level, the effective doses candidates for
the representative person (local fisherman family) from representative discharges from the AP1000 have been predicted to be around 0.1 μSv/y (infants), 0.3 μSv/y (children) and 1 μSv/y (adults). The main pathways were consumption of carbon-14 in fish and shellfish. A

Environment Agency – Independent dose assessment of AP-1000 design for GDA Page 6
breakdown of the dose by radionuclide and by pathway (arising from all discharges) to adult candidates for the representative person are provided in Appendix 4.
Individual doses to candidates for the representative person arising from direct radiation 36 Exposure of the public from direct radiation from nuclear sites in the UK is the responsibility of
the HSE. HSE require site operators to measure direct radiation at the site perimeter and estimate exposure to a reference group on an annual basis. The total dose from direct radiation from the AP1000 power plant was assessed as 4 μSv/y as outlined in Appendix 8. It is based on measured gamma dose rates for Sizewell B in 2007 [Ref. 10], the only PWR in the UK.
Representative person for the AP1000 power plant 37 The representative person for discharges at the predicted levels and direct radiation from the
AP1000 power plant are infant local residents, who received a total dose of 8.4 μSv/y, of which 4.4 μSv/y is from discharges and 4 μSv/y from direct radiation.
38 WEC estimated direct radiation doses of around 4 µSv/y, based on measurements at the
Sizewell B perimeter fence in 2007. This estimate is consistent with that used for the independent assessment. WEC estimated the total dose for the representative discharges from AP1000 to be 14 µSv/y, based on the sum of the atmospheric and marine components of dose and the direct radiation estimate of 4 µSv/y.
Site dose from proposed discharges 39 Site dose is calculated by taking into account the potential combined doses arising from the
radioactive source in question (in this case the AP1000 nuclear plant) and from any other sources with which it is co-located. Given the generic nature of the site considered in this assessment, it has been assumed that the AP1000 is the only source located at this site. The site dose is, in this case, equivalent to that from the AP1000.
Total dose 40 Total dose is generally calculated by taking into account doses from predicted discharges from
the site along with doses resulting from any residues from previous discharges from this site, and doses from other sites (nearby or more distant).. The calculation of these contributions to total dose is highly site specific. At this stage, it has been assumed that the AP1000 is located, in isolation, at a site which has not previously been occupied by a source of radioactive discharges and at some distance from any other such sources. In this case, the total dose may therefore be assumed to be equivalent to the total dose from discharges and direct radiation from the AP1000. If the AP1000 were to be located on a current nuclear licensed site, for example, these assumptions would need to be reviewed.
Collective doses to UK, Europe and the World 41 The average collective doses per year of discharge (truncated to 500 years) arising from
discharges to atmosphere and discharges to the sea were calculated as detailed in Appendix 5 and are as follows:
• Discharges to atmosphere from the AP1000 power plant at predicted levels –
0.26 manSv for the UK population, 1.97 manSv for European population, and 12.4 manSv for the World population for representative discharges; and 0.40 manSv for UK population, 3.08manSv for European population and 19.5 manSv for World population for annual limit discharges.

Environment Agency – Independent dose assessment of AP-1000 design for GDA Page 7
• Discharges to the sea from the AP1000 power plant at predicted levels – 0.0008 manSv for the UK population, 0.0039 manSv for European population, and 0.053 manSv for the World population for representative discharges; and 0.0013 manSv for UK population, 0.0061 manSv for European population and 0.084 manSv for World population for annual limit discharges.
42 The majority of the collective dose from discharges to atmosphere arises from carbon-14. The
majority of the collective dose from discharges to sea varies depending upon the location of the site considered. The highest radionuclide contribution is from carbon-14.
Doses from potential short-term releases 43 The doses arising to members of the public as a consequence of potential short-term releases
to atmosphere have been calculated as set out in Appendix 6. The dose from a single short term release to atmosphere has been estimated to be 13 µSv to adults and 11 µSv to other age groups. This arises primarily from the inhalation of carbon-14.
Discussion 44 At the estimated annual discharge levels, provided by WEC, the independent assessment has
predicted an effective dose to the representative person, from the AP1000 power plant including direct radiation of 8.43 μSv/y. This value is less than the dose constraint of 300 μSv/y, or the proposed dose constraint for new nuclear power stations of 150 μSv/y [Ref. 11, 12].
45 In order to make an assessment of the site and total dose to the representative person for
comparison with either the site constraint (of 500 µSv/y) or the dose limit for members of the public of 1000 μSv/y [Ref. 11], it is necessary to take account of discharges from all operations on the same site or from all practices. This information would ideally require specific information about the location of the power plant. In the absence of such information, it has been assumed that the AP1000 is located at a new site and at some distance from any other radioactive sources. Under these circumstances the representative person doses above may be compared with the site constraint and dose limit. This would not be the case if the AP1000 were co-located on a current nuclear licensed site.
46 The independent assessment predicted a collective dose of around 12 manSv due to
atmospheric discharges per year of discharge to the world population (truncated at 500 years). Discharges to the marine environment were predicted to give rise to much lower collective doses of less than 0.1 manSv per year of discharge. There is no legal dose limit on collective doses.
47 Collective doses may be used to derive the average individual dose to members of different
population groups, known as per caput doses. The UK regulatory and advisory agencies have stated that discharges giving rise to per caput doses in the range of nanosieverts per year of discharge can be regarded as miniscule [Ref 11]. The average per caput dose for representative discharges to atmosphere from the AP1000 power plant are highest for the UK population at 4.7 nSv per year of discharge. The average per caput doses from the AP1000 power plant for discharges to the sea at the predicted levels are 0.024 nSv. These average per caput doses may be regarded as trivial.
48 The potential dose to a representative member of the public from a single short-term release
to atmosphere was estimated to be 11-13 µSv depending on age group. Although the dose from a single short-term release is low, there is the potential for multiple releases during the course of the year and, at this level, the contribution of short-term releases would be of a similar level as those predicted for continuous discharge.

Environment Agency – Independent dose assessment of AP-1000 design for GDA Page 8
Comparison of the WEC and independent assessments 49 At the estimated annual discharge levels, WEC assessed the effective dose to the
representative person from the AP1000 power plant to be 14 μSv/y for representative discharges and 20 μSv/y for discharges at proposed annual limits. It is based on the assumption that the predicted doses from the atmospheric and liquid discharges and direct radiation can be added. It includes a 4 μSv/y contribution from direct radiation. The dose from atmospheric discharges accounts for more than 50% of the effective representative person dose at 7.6 μSv/y for representative discharges.
50 The detailed independent assessment gives a representative person dose of 8.4 µSv/y. This
includes a 4 μSv/y contribution from direct radiation. The dose from discharges to atmosphere was 4.4 μSv/y from an assumed effective stack of 23 m. Less pessimistic assumptions about combinations of exposures have been made in calculating effective doses from the source.
51 WEC has estimated the collective doses to the world population (truncated at 500 years) from
representative atmospheric discharges to be of the order of 12 to 13 manSv per year of discharge to atmosphere and 0.05 to 0.055 from representative liquid discharges. The independent assessment results of 12.2 to 12.6 manSv per year for atmospheric discharges and 0.052 to 0.054 manSv per year for liquid discharge are effectively equivalent.
Uncertainty in results 52 The assessments show that individual doses from representative discharges (excluding short
duration releases) are well below the dose constraints of 300 μSv/y and also below lower dose criterion for the ‘threshold of optimisation’ of 20 μSv/y. Given the relatively low doses, a limited assessment of uncertainty in the results has been made.
53 For example, the potential for a variability of around a factor of 2 in atmospheric
concentrations may be associated with the assumptions about wind direction, as discussed in more detail in Appendix 7. The dose assessment will also be influenced by the choice of distance of the receptor from the release point. In the independent assessment, standard assumptions regarding the habitation and domestic fruit and vegetable production (100 m) and agricultural produce (500 m). The air concentrations at these locations are around 70% and 50% of those estimated at the location with the maximum air concentration, as discussed in more detail in Appendix 7.
54 The doses have also been presented separately for internal and external exposure, in
Appendix 7 to allow that uncertainties in the calculations of each to be considered in more detail if required.
Doses to the foetus and breast fed infants 55 The independent assessment also considered the possibility that pregnant women and breast-
feeding infants could be present in the candidates for the representative person, and an estimate of doses to the foetus and breast-fed infant during the first few months of life was made. The predicted doses were slightly higher than those to the adult. This assessment is reported in more detail in Appendix 7.

Environment Agency – Independent dose assessment of AP-1000 design for GDA Page 9
Conclusions 56 An independent assessment was undertaken, on behalf of the Environment Agency, in order
to:
• Validate and verify the assumptions made by WEC in their dose assessments; • Validate and verify the outcomes of the dose assessments carried out by WEC; • Carry out independent dose assessments to demonstrate that the dose assessments
carried out by WEC are realistic.
57 WEC undertook an assessment using the Environment Agency Initial Radiological Assessment approach. The approach was repeated with the same results.
58 The WEC and independent approaches to assess the dose from direct radiation are similar. In
both cases, measurements of the dose rates around the perimeter of the only operating PWR in the UK (Sizewell B) have been used to represent those likely to arise from the operation of the AP1000. The value of 4 µSv/y measured in 2007 has been used in both assessments.
59 A more detailed independent prospective radiological assessment has been undertaken for
expected annual radioactive discharges for the AP1000 nuclear power plant, using the generic site characteristics and parameters agreed with the Environment Agency, identified in Appendix 2. The assessment has considered releases from atmospheric discharges from the PWR plant, liquid discharges and direct radiation.
60 The representative person for the expected discharges and direct radiation from the AP1000
nuclear power plant, using the generic site information and the expected annual discharges provided by WEC, is an infant member of the local population (CRP1), who has been predicted to receive a dose of 8.4 μSv/y with the majority of the dose arising from atmospheric discharges and direct radiation.
61 The doses associated with the expected annual discharges from the AP1000 nuclear power
plant are therefore less than the existing source dose constraint of 300 μSv/y and the proposed dose constraint for new nuclear power stations of 150 μSv/y.
62 In order to make an assessment of the site and total dose to the representative person for
comparison with either the site constraint (of 500 Sv/y) or the dose limit for members of the public of 1000 μSv/y [Ref. 10], it is necessary to take account of discharges from all operations on the same site or from all practices. For the purposes of this assessment, it has been assumed that the AP1000 is located on a site at some distance from any existing or previous sources of radioactive discharges. As a consequence, the contribution of historic sources or from discharges of other practices on the same or other sites would be negligible. Under these circumstances the representative person doses above may be compared with the site constraint and dose limit. This would not be the case if the AP1000 were co-located on a current nuclear licensed site.
63 Collective doses to the UK, Europe and the world population, truncated at 500 years, have
been assessed on the basis of representative annual discharges. The assessment made by WEC and that made independently are in agreement. The highest dose is around 13 manSv per year of discharge to atmosphere to the world population. Doses to European population were around 2 manSv and the UK were less than 1 manSv per year of discharge. Doses to the world population were around 0.05 manSv for liquid discharges. The highest average per caput doses (to the UK population) are of the order of 5 nSv per year of discharge. Per caput doses at this level may be regarded as trivial [Ref 10].
Environment Agency – Independent dose assessment of AP-1000 design for GDA Page 10
References 1. Environment Agency. The Environment Agency’s Process and Information Document for Generic
Assessment of Candidate Nuclear Power Plant Designs version 1 (http://publications.environment-agency.gov.uk/pdf/GEHO0107BLTN-e-e.pdf) (2007).
2. Eisenstatt, L, UK AP1000 Environment Report, WEC, UKP-GW-GL-790, Revision3, April 2010. 3. Parker, R, Assumed Data for Dose Assessments, Westinghouse Electric Company, Technical
Report, 3000333-000-00-192-K-003 Rev A6 (UK-GW-GL-032, Revision 0), 11 November 2008. 4. Eisenstatt, L. R.,. Characteristics of a Generic Site for a Nuclear Power Station, Westinghouse
Electric Company, UKP-GW-GL-025, Revision 1, 9 January 2010. 5. Environment Agency, Initial Radiological Assessment Methodology (Parts 1 and 2), Science
Report SC030162/SR1 (2006). 6. Mayall A, Cabianca T, Attwood C, Fayers C A, Smith J G, Penfold J, Steadman D, Martin G,
Morris T P and Simmonds J R. PC CREAM-97 (PC CREAM-98 code update) NRPB Chilton NRPB-SR-296 (EUR 17791) (1997).
7. Smith, K R and Jones A L, Generalised Habit Data for Radiological Assessments, NRPB-W41,
NRPB, Chilton (2003). 8. ICRP (1996) Age-dependent dose to members of the public from intake of radionuclides: Part 5.
Compilation of ingestion and inhalation dose coefficients. ICRP Publication 72. Ann, ICRP 26 (1). 9. EPA (1993). External Exposure to Radionuclides in Air, Water, and Soil. Federal Guidance
Report No. 12, EPA-402-R-93-081(Oak Ridge National Laboratory, Oak Ridge, TN; U.S. Environmental Protection Agency, Washington, DC).
10. Food Standards Agency and Joint Environment Agencies’ Report, Radioactivity in Food and the
Environment, 2007 (RIFE-13) (2008). 11. The Radioactive Substances (Basic Safety Standards) (England and Wales) Direction 2000.
DEFRA (May 2000). 12. Health Protection Agency, HPA Advice on the Application of the ICRP’s 2007 Recommendations
to the UK, Consultation Document, HPA, Chilton, (2008). 13. Clarke, R. H., Model for Short and Medium Range Dispersion of Radionuclides Released to the
Atmosphere, NRPB-R91, Chilton, Didcot (1979).

Environment Agency – Independent dose assessment of AP-1000 design for GDA Page 11
Table 1 Expected Annual Discharges to Atmosphere
Predicted Atmospheric Discharges (TBq/y)
Radionuclide Reactor Building
(Stack 1) Turbine Hall
(Stack 2) Ar-41 1.30E+00 - Ba-140 1.50E-07 - C-14 6.06E-01 - Co-58 8.60E-06 - Co-60 3.20E-06 - Cr-51 1.90E-07 - Cs-134 8.30E-07 - Cs-137 1.30E-06 - H-3 1.80E+00 - I-131 2.10E-04 3.40E-06 I-133 3.50E-04 3.70E-06 Kr-85 3.10E+00 2.60E-02 Kr-85m 1.70E-02 7.80E-03 Kr-87 1.70E-02 2.20E-03 Kr-88 1.80E-02 8.50E-03 Mn-54 1.10E-07 - Nb-95 8.90E-07 - Sr-89 1.10E-06 - Sr-90 4.10E-07 - Xe-131m 1.30E+00 8.10E-02 Xe-133 9.60E-01 2.90E-01 Xe-133m 8.10E-02 3.50E-02 Xe-135 1.70E-01 2.60E-01 Xe-135m 1.30E-01 5.90E-02 Xe-137 3.40E-02 1.60E-02 Xe-138 5.90E-02 2.90E-02 Zr-95 3.70E-07 -
Table 2 Predicted Short term Discharges to Atmosphere
Radionuclide Total release in 30 minutes Bq
Emission Rate over 30 minutes (Bq/s)
H-3 2.42E+11 1.34E+08 C-14 8.30+10 4.61E+07 Ar-41 1.71E+11 9.50E+07 Co-58* 1.02E+06 5.67E+02 Co-60 2.69E+05 1.49E02 Kr-85** 3.30E+12 1.84E+09 Sr-90 3.70E+04 2.06E+01 I-131 1.73E+07 9.61E+03 I-133*** 4.96E+07 2.76E+04 Xe-133 1.87E+11 1.04E+08 Cs-137 1.11E+05 6.17E+01
* C0-58 is surrogate for all particulate discharges other than Co-60, Sr-90 and Cs-137; ** Kr-85 is surrogate for all noble gasses other than Ar-4 and Xe-133; *** I-133 is surrogate for all radio-iodides other than I-131

Environment Agency – Independent dose assessment of AP-1000 design for GDA Page 12
Table 3 Expected Annual Liquid Discharges to the Sea
Radionuclide Predicted Marine Discharges (TBq/y) Ag-110m 2.60E-05 Ba-140 1.30E-05 C-14 3.3E-03 Ce-144 9.00E-05 Co-58 4.10E-04 Co-60 2.30E-04 Cr-51 4.60E-05 Cs-134 7.60E-06 Cs-136 9.30E-06 Cs-137 2.30E-05 Fe-55 4.90E-04 Fe-59 5.00E-06 H-3 3.34E+01 I-131 1.50E-05 I-133 2.90E-05 La-140 1.80E-05 Mn-54 3.20E-05 Na-24 3.80E-05 Nb-95 6.10E-06 Ni-63 5.40E-04 Pr-144 8.00E-05 Pu-241 8.00E-08 Ru-103 1.20E-04 Sr-89 2.40E-06 Sr-90 2.50E-07 Tc-99m 1.80E-05 Y-91 9.10E-08 Zn-65 1.00E-05 Zr-95 6.90E-06

Environment Agency – Independent dose assessment of AP-1000 design for GDA Page 13
Table 4 Summary of Individual Doses from the WEC Initial Radiological Assessment based on Representative Annual Discharges and Short Term Releases (μSv/y)
AP1000 Power Plant Discharges and Short Term Releases Candidate for the
Representative Person Stack 1 (22.5 m)
Liquid (130 m/s exchange rate)
Direct Radiation
Short Term releases
Total
Local resident based on combined results of initial radiological assessment
7.6 2.3 4.0 5.1 19.0
Table 5 Summary of Individual Doses to Candidates for the Representative person arising from Discharges and Direct Radiation based on Predicted Maximum Discharges (μSv/y)*
AP1000 Power plant Discharges Candidates for the
Representative person
Age Group
Stack 1 Stack 2 Liquid Direct Radiation Total
Adult 2.6 0.01 0.1 4.0 6.7 Child 2.9 0.01 0.04 4.0 6.9
CRP1 - local resident (high rate terrestrial food consumer) Infant 4.4 0.01 0.04 4.0 8.4
Adult 1.6 0.01 1.0 0.0 2.6 Child 1.9 0.01 0.3 0.0 2.2
CRP2 - local fishing family (high marine exposure)
Infant 2.1 0.01 0.1 0.0 2.2 * Rounded 2 two significant figures
Environment Agency – Independent dose assessment of AP-1000 design for GDA Page 14
Appendix 1 – Verification of radiological assessment and short term assessment for Westinghouse AP1000 Design Introduction A1.1 In accordance with the established principles and guidance for prospective assessment of
public doses, a staged approach has been applied in the independent assessment of representative person dose.. The first stage, also applied by WEC, was the application of the simple and cautious approach provided by the Environment Agency’s Initial Radiological Assessment (IRA) [Ref. A1.1]. This provides dose per unit release values which allow a simple, single step conservative assessment of doses from discharges to be made. It is recommended that if effective doses from this approach are less than 20 µSv/y that no further assessment would be warranted for the purpose of authorising discharge of radioactive waste to the environment.
A1.2 The IRA approach has been applied for the representative and annual limit atmospheric and
liquid discharges, provided in the WEC submission [Ref. A1.2] and the results compared with those provided by WEC [Ref. A1.2]. The results of verification activities on the WEC assessments of short term releases from the AP1000 design collective dose are also presented in this appendix.
Stage 1 Initial Radiological Assessment A1.3 No information on a Stage 1 initial radiological assessment was provided by WEC in their
Environment Report [Ref. A1.2] Stage 2 Initial Radiological Assessment
A1.4 The assumed atmospheric and liquid discharges presented by WEC are provided in Tables
A1.1 and A1.2 respectively [Ref. A1.2]. In Stage 2 of the Environment Agency’s Initial Radiological Assessment, an effective stack height of 22.5 m was applied to take account of the building wake effects of the nearby building (of 70 m), in accordance with the approach adopted by WEC [Ref. A1.2]. A volumetric exchange rate of 130 m3/s is considered to be more representative of the local marine compartment. The results from the application of the relevant dose per unit release values are presented in Tables A1.3, A1.4, A1.5 and A1.6 respectively.
A1.5 A dose of 7.6 µSv/y and 12 µSv/y were assessed to local residents from the annual
representative and annual limit discharges to atmosphere respectively. The highest dose to an adult fisherman from marine discharges was assessed as 2.3 µSv/y for representative discharges and 3.8 µSv/y for annual limit discharges.
A1.6 The direct radiation dose rate was 4 µSv/y as used in the WEC assessment. The doses from
liquid and gaseous discharges at representative and annual limit discharges including direct radiation are 14 µSv/y and 20 µSv/y respectively.
A1.7 The effective doses estimated in Stage 2 presented by WEC could be repeated.

Environment Agency – Independent dose assessment of AP-1000 design for GDA Page 15
Stage 3 More Detailed Radiological Assessment A1.8 WEC did not undertake a detailed (Tier 3) assessment of doses to candidates for the
representative person from either atmospheric or marine discharges; the results of Stage 2 initial radiological assessments, for representative discharges, were below the threshold dose (20 µSv/y) for further assessment [Ref.A1.2].
Short duration releases to atmosphere A1.9 WEC also undertook an assessment of short duration releases to atmosphere. This made
use of the ADMS model code for dispersion [Ref. A1.3]. It was possible to verify the short term dispersion modelling assessment undertaken by WEC to a reasonably good degree, as demonstrated in the summary of the validated parameters in Table A1.7. The modelled ground level concentrations, deposition rates and gamma doses were similar to the results reported in UKP-GW-GL-790 Revision 2 [Ref. A1.2].
A1.10 WEC estimated the highest effective dose from short-term releases to be 12 µSv per
discharge to the local inhabitant exposure group. A more detailed breakdown of doses from different pathways and to different age groups was not provided. It was not therefore possible to verify the WEC assessment. Instead an independent assessment was made which gave similar results.
Collective Dose A1.11 The collective dose results included in the WEC submission are presented in Table A1.8
The highest total collective dose to the UK was estimated to be 0.27 manSv, while the corresponding values for the European and World populations were estimated to be 2.1 and 13 manSv respectively.
A1.12 For atmospheric discharges, collective dose per unit release (DPUR) were calculated using
PC CREAM for UK, EU and World populations, and for releases from the Dungeness, Hartlepool, Heysham, Hinkley Point and Sizewell sites in accordance with WEC methodology. The results were then combined with discharge data to obtain the actual doses to the population groups. The results for the individual sites were then statistically combined, in line with the WEC approach. Some minor differences in the percentage contributions to different population arose, which might be attributed to rounding differences.
Summary A1.13 Stage 2 of the Environment Agency Initial Radiological Assessment (IRA) [Ref. A1.1]
approach was applied for the atmospheric and liquid discharges, for default assumptions and for the stack heights and volumetric exchange rates presented in the WEC submission. The total doses were essentially equivalent to those presented by WEC.
A1.14 It was possible to validate WEC modelling of the dispersion and cloud gamma doses arising
from short-term releases to the atmosphere. A1.15 The collective dose estimates presented by WEC could be repeated with the same values,
although there were some minor differences in the percentage contributions to different radionuclides.
References

Environment Agency – Independent dose assessment of AP-1000 design for GDA Page 16
A1.1 Environment Agency, Initial Radiological Assessment Methodology (Parts 1 and 2), Science Report SC030162/SR1 (2006).
A1.2 Eisenstatt, L, Environment Report, WEC, UKP-GW-GL-790, Revision 3 (April 2010) A1.3 ADMS 4, Industrial Air Pollution Model, http://www.cerc.co.uk/software/adms4.htm
Environment Agency – Independent dose assessment of AP-1000 design for GDA Page 17
Table A1.1: Atmospheric Discharges used in Initial Radiological Assessment
Radionuclide Representative 12-
Month Plant Discharge (D) (TBq/y)
Calculated Annual Limit (TBq/y)
Radioiodines1(I-133) 3.88E-04 7.00E-04
Noble Gases2(Kr-85) 9.34E-01 1.00E+00
Tritium 1.87E+00 3.00E+00
Carbon-14 6.38E-01 1.00E+00
Argon-41 1.32E+00 2.00E+00
Cobalt-60 3.22E-06 5.00E-06
Krypton-85 4.07E+00 7.00E+00
Strontium-90 4.44E-07 7.00E-07
Iodine-131 2.07E-04 3.00E-04
Xenon-131m 1.76E+00 3.00E+00
Xenon-133 1.34E+00 2.00E+00
Caesium-137 1.33E-06 2.00E-06
Other particulates (Co-58) 1.22E-05 2.00E-05
Total Beta particulate3 6.00E-09 2.30E-06
Total 11.93 19.00
1. Radioiodines - taken to be all radioiodines apart from iodine-131. I-133 has been used as the representative radionuclide.
2. Noble gases - taken to be all isotopes of krypton and xenon apart from krypton-85 and xenon-133. Kr-85 used as the representative radionuclide.
3. Total beta particulate - taken to be all particulates apart from cobalt-60, strontium-90, and ceasium-137. Co-58 used as the representative radionuclide. Table A1.2: Liquid Discharges used in Initial Radiological Assessment
Radionuclide
Representative 12-Month Plant Discharge (D) (TBq/y)
Calculated Annual Limit (TBq/y)
Tritium 3.51E+01 6.00E+01
Non-tritium 7.70E-03 1.00E-02
Carbon-14 4.42E-03 7.00E-03
Iron-55 6.42E-04 1.00E-03
Cobalt-58 5.44E-04 9.00E-04
Cobalt-60 3.01E-04 5.00E-04
Nickel-63 6.91E-04 1.00E-03
Strontium-90 3.24E-07 5.00E-07
Caesium-137 3.01E-05 5.00E-05
Plutonium-241 1.08E-07 2.00E-07
Other isotopes1 1.07E-03 2.00E-03
Total 35.104 60

Environment Agency – Independent dose assessment of AP-1000 design for GDA Page 18
Note: 1. Other isotopes = Non-tritium isotopes – (C-14+ Fe-55+Co-58+Co-60+Ni-63+Sr-90+Cs-137+Pu-241). Table A1.3 Estimated Doses from Stage 2 IRA from AP1000 from WEC Representative Annual Atmospheric Radioactive Discharge (effective stack height 22.5 m)*
Radionuclide Surrogate radionuclide
Local Habitant Dose μSv/y % Contribution
Tritium - 1.9E-01 2.51%
Carbon-14 - 7.0E+00 92.21%
Argon-41 - 1.3E-01 1.68% Other particulate radionuclides (excl. Co-60, Sr-90 & Cs-137) Co-58 1.3E-04 0.00%
Cobalt-60 - 1.1E-03 0.01% Other noble gasses (excl. Ar-41 & Xe-133) Krypton-85 4.7E-03 0.03%
Strontium-90 - 9.6E-05 0.00%
Iodine-131 - 2.6E-01 3.40%
Other radio-iodides I-133 1.5E-02 0.13%
Xenon-133 - 2.8E-03 0.04%
Caesium-137 - 4.1E-04 0.01%
Total dose 7.6 μSv/y Table A1.4 Estimated Doses from Stage 2 IRA from AP1000 from WEC Annual Limit Atmospheric Radioactive Discharge (effective stack height 22.5 m)*
Radionuclide Surrogate radionuclide
Local Habitant Dose μSv /y % Contribution
Tritium - 3.1E-01 2.58%
Carbon-14 - 1.1E+01 92.42%
Argon-41 - 1.9E-01 1.62% Other particulate radionuclides (excl. Co-60, Sr-90 & Cs-137) Co-58 2.1E-04 0.00%
Cobalt-60 - 1.8E-03 0.01% Other noble gasses (excl. Ar-41 & Xe-133) Krypton-85 7.8E-03 0.03%
Strontium-90 - 1.5E-04 0.00%
Iodine-131 - 3.7E-01 3.15%
Other radio-iodides I-133 2.5E-02 0.15%
Xenon-133 - 4.2E-03 0.04%
Caesium-137 - 6.2E-04 0.01%
Total dose 12 μSv/y
* Scaling factors: 0.03 (inhalation and external dose); 0.3 (food).
Environment Agency – Independent dose assessment of AP-1000 design for GDA Page 19
Table A1.5 Estimated Doses from Stage 2 IRA from AP1000 from WEC Representative Annual Liquid Radioactive Discharge (130 m3/s volumetric exchange rate)
Radionuclide Surrogate radionuclide
Fisherman dose μSv/y % Contribution
Tritium - 2.4E-02 1.05%
Carbon-14 - 1.6E+00 68.50%
Iron-55 - 1.5E-04 0.01%
Cobalt-58 - 2.9E-02 1.26%
Cobalt-60 - 6.5E-01 28.40%
Nickel-63 - 1.9E-03 0.08%
Strontium-90 - 1.5E-06 0.00%
Caesium-137 - 3.5E-03 0.15%
Other radionuclides Cerium-144 1.2E-02 0.54%
Total dose 2.3 μSv/y Table A1.6 Estimated Doses from Stage 2 IRA from AP1000 from WEC Representative Annual Liquid Radioactive Discharge (130 m3/s volumetric exchange rate)
Radionuclide Surrogate radionuclide
Fisherman dose μSv/y % Contribution
Tritium - 4.1E-02 1.12%
Carbon-14 - 2.5E+00 67.41%
Iron-55 - 2.3E-04 0.01%
Cobalt-58 - 4.8E-02 1.30%
Cobalt-60 - 1.1E+00 29.31%
Nickel-63 - 2.8E-03 0.08%
Strontium-90 - 2.3E-06 0.00%
Caesium-137 - 5.8E-03 0.16%
Other radionuclides Cerium-144 2.3E-02 0.63%
Total dose 3.7 μSv/y

Environment Agency – Independent dose assessment of AP-1000 design for GDA Page 20
Table A1.7 Verification of Dispersion Modelling for Short Term Dose Assessment Criteria RP (WEC
Approach) This work
Comment
Model used ADMS 4.1 ADMS 4.1 No comment
Radionuclides modelled using ADMS
H-3
C-14
Ar-41
Co-60
Kr-85
Sr-90
I-131
Xe-133
Cs-137
Other Radioiodoines (as I-133)
Other noble gases (as Kr-85)
Other particulates (as Co-58)
H-3
C-14
Ar-41
Co-60
Kr-85
Sr-90
I-131
Xe-133
Cs-137
Other Radioiodoines (as I-133)
Other noble gases (as Kr-85)
Other particulates (as Co-58)
Dry deposition velocity
Noble gases = 0m/s
Iodines = 0.1m/s
All other radionuclide’s = 0.001m/s
Noble gases = 0m/s
Iodines = 0.1m/s
All other radionuclide’s = 0.001m/s
No comment
Wet deposition
Calculated using washout co-efficient of 0.0001s-1
Calculated using washout co-efficient of 0.0001s-1
No comment
Meteorology Wind from 270º and wind speed 3m/s, 800m boundary layer height
Wind from 270º and wind speed 3m/s, 800m boundary layer height, reciprocal of the monin-obukhov length 0m
Other parameters defining neutral conditions (heat flux, cloud cover or reciprocal of the monin-obukhov length) not recorded
Surface roughness
0.3m 0.3m No comment
Stack location 0,0 0,0 No comment
Receptor locations
100m (100, 0) and 500m (500, 0) downwind
100m (100, 0) and 500m (500, 0) downwind
No comment

Environment Agency – Independent dose assessment of AP-1000 design for GDA Page 21
Criteria RP (WEC Approach)
This work
Comment
Temperature 15º C 15º C No comment
Stack emission parameters (elevated release)
height = 60m
diameter = 1m
volumetric flow = 0m3/s
efflux velocity = 0m/s
height = 60m
diameter = 1m
volumetric flow = 0m3/s
efflux velocity = 0m/s
RP used a release height of 60m. This is based on a physical stack height of 55.7m plus a calculated plume rise of 6.7m = 62.4m. The emission height of 62.4m was rounded down to 60m. Emission parameters to set to assume a zero plume rise (e.g. 0 m/s efflux velocity and 0 m3/s volumetric flow) by RP. This effectively lead to separate calculation of plume rise; (stack height equivalent to the physical stack plus plume rise; modelling the emissions assuming there is no plume rise).
Assuming a zero plume rise will increase the ground level air concentrations for the following reasons:
- Plume rise varies with distance from the source due to velocity and temperature (see Figure A1.1). The value used by the RP is likely to represent the plume rise immediately downwind of the source and assumes that this remains constant. This leads to less plume rise than allowing the ADMS plume rise module to the ADMS value and would lead to higher predicted concentrations
- Assuming a zero volumetric flow does not allow for initial dilution of the stack gases. This would lead to higher predicted concentrations than modelling the actual volumetric flow of stack gases.
- Although a plume rise of 6.7m was calculated, the RP used a value of 4.3m. This would lead to higher predicted concentrations than using the calculated value. The RP rounded the stack height down to 60m for consistency with the long term assessment approach.
Gamma dose (elevated release)
Modelled using the ADMS Gamma Dose module without building at a stack height of 22.5m
Modelled using the ADMS Gamma Dose module without building at a stack height of 22.5m
ADMS cannot calculate gamma dose with the buildings module on - an equivalent stack height without a building was determined by the RP which resulted in similar concentrations than the with building scenario). No further comment
Building H 70m, L 43m, W 43m
H 70m, L 43m, W 43m No comment
Building location
upwind of stack upwind of stack No comment

Environment Agency – Independent dose assessment of AP-1000 design for GDA Page 22
Table A1.8: Highest Collective Doses for Representative Discharges from AP1000 (WEC Assessment) UK Europe World
Atmospheric Discharges 0.27 2.1 13
Liquid Discharges 0.0012 0.0046 0.055 Collective dose
(manSv) Total 0.27 2.1 13.1
Figure A1.1: Calculated plume centreline for a 55.7m stack using the Enviros emissions parameters

Environment Agency – Independent dose assessment of AP-1000 design for GDA Page 23
Appendix 2 – Review of assessment of Westinghouse AP1000 design; assessment approach and summary of key independent parameters A2.1 Following the initial radiological assessment (the results of which are presented in Appendix
1), the next stage of this work was to undertake a detailed critical review of the approach and parameters used in the assessments presented for consideration by WEC [Ref. A2.1]. This review was undertaken using matrices for each assessment process. The criteria and approaches used were compared with the latest regulatory and advisory body guidance. Supporting notes and comments and decisions regarding the approaches to be adopted during the subsequent independent assessment outlined in this report are noted in Tables A2.1 to A2.7 and key points noted below.
A2.2 This work has not assessed the validity of expected annual discharges provided by WEC. Review Findings A2.3 The review of the assumptions and data used by WEC was carried out against previous
assessments and advisory body guidance. The WEC approach primarily involved the use of the Environment Agency’s initial radiological assessment [Ref. A2.2]. The assumptions and parameters used to derive the dose per unit discharge values, on which this approach is based, are necessarily conservative. For example, assumptions made in the combination of habits are generally pessimistic. By adopting a generic approach it is possible to be more realistic in some key areas.
A2.4 The following difference in key input data between the WEC initial and the independent more
detailed assessment has also been identified: • The initial assessment approach is based on an atmospheric stability category of 50%
D. On the coasts of England and Wales the stability category varies from 55% D to 80% D. Category of 60% D was used a the most representative value for the potential coastal sites.
A2.5 The location of the candidate representative person from atmospheric releases (100 m from
release) and the origin of terrestrial foods (500 m) applied in Reference A2.2 and the WEC initial assessment. The same general approach was also applied for the independent assessment, although green and root vegetables and domestic fruit were assumed to be derived from 100 m.
A2.6 All terrestrial foods are assumed to be locally derived and consumed at high rates in the
derivation of the Dose per unit Release (DPUR) values in Reference A2.2, modified by a factor to allow for a 22.5 m effective stack height were used by WEC [Ref. A2.1]. For the independent assessment, habit data for the candidate representative person from atmospheric pathways were based on the ‘top two’ approach, in which the two terrestrial foods giving rise to the highest doses are assumed to be consumed at high rates while other foods are consumed at average rates.
A2.7 For the assessment of marine discharges, the relevant DPUR values from Reference A2.2
were applied in the WEC assessment, based on a volumetric exchange rate of 130 m3/s. For the purposes of the independent assessment, the marine compartment characteristics for the potential coastal site with the lowest volumetric exchange rate have been applied. The

Environment Agency – Independent dose assessment of AP-1000 design for GDA Page 24
independent assessment also includes the following additional minor pathways: inhalation of seaspray, external exposure from handling fishing nets, and inadvertent ingestion of sediment and seawater during leisure activities.
A2.8 In the WEC assessment, the direct radiation dose was calculated on the basis of the dose
rates measured in the vicinity of Sizewell B in 2007 (of 4 µSv/y). The same value has been applied for the purpose of the independent assessment.
A2.9 WEC also undertook an assessment of short duration releases to atmosphere [Ref. A2.1].
This made use of the ADMS model code for dispersion [Ref. A2.3]. The discharge assessment could not be verified completely. A key matter in the assessment of impacts from short-term releases that remains to be resolved is the application of a stack height of 60 m, when there is an adjacent building of 70 m. The lower relative height of the stack to the adjacent building is contrary to established practice. Further, the assumptions regarding any potential releases from the Condenser Air Removal Stack warrant further consideration. Cloud gamma doses were modelled using ADMS and an equivalent stack height of 22.5 m, while the independent assessment was based on FGR12 [Ref. A2.4] to assess gamma dose rates from the cloud and deposited material.
A2.10 PC CREAM 98 [A2.5] has been used to assess collective doses in the WEC and independent
assessments. The basis for these assessments were similar (to the UK, European and World populations, truncated at 500 years), and in accordance with guidance from UK regulatory and advisory bodies [Ref. A2.6]. For both assessment, the range of collective doses from atmospheric and liquid discharges were assessed for the range of potential sites. The assumptions on effective stack height and stability categories were consistent with those used for the individual assessments and were therefore the same for the WEC and independent assessment, as outlined above. For marine discharges, the marine compartment characteristics of each potential site were implicitly applied.
References A2.1 Eisenstatt, L, Environment Report, WEC, UKP-GW-GL-790, Revision 3 April 2010 A2.2 Environment Agency, Initial Radiological Assessment Methodology (Parts 1 and 2), Science
Report SC030162/SR1 (2006). A2.3 ADMS 4, Industrial Air Pollution Model, http://www.cerc.co.uk/software/adms4.htm A2.4 Environmental Protection Agency. External Exposure to Radionuclides in Air, Water, and Soil.
Federal Guidance Report No. 12, EPA-402-R-93-081 (Oak Ridge National Laboratory, Oak Ridge, TN; U.S. Environmental Protection Agency, Washington, DC) (1993).
A2.5 Mayall A, Cabianca T, Attwood C, Fayers CA, Smith JG, Penfold J, Steadman D, Martin G,
Morris TP and Simmonds JR. PC CREAM-97 (PC CREAM-98 code update) NRPB, Chilton NRPB-SR-296 (EUR 17791) (1997).
A2.6 Joint Agencies (Environment Agency, SEPA, DoE NI, NRPB and FSA), Interim Guidance,
Authorisation of Discharges of Radioactive Waste to the Environment. A2.7 Environment Agency, Environmental Risk Assessment (Parts 1 and 2) Simple assessment of
environmental risk for accidents, odour, noise and fugitive emissions, EPR-H1 Report (2008). A2.8 Jones, J A, The Fifth Report of the Working Group on Atmospheric Dispersion: Models to
Allow for the Effects of Coastal Sites, Plume Rise and Buildings on Dispersion of Radionuclides and Guidance on the Value of Deposition Velocity and Washout Coefficients, , NRPB-R157, NRPB, Chilton, 1983.
A2.9 Smith, K R and Jones A L, Generalised Habit Data for Radiological Assessments, NRPB-W41,
NRPB, Chilton (2003).

Environment Agency – Independent dose assessment of AP-1000 design for GDA Page 25
A2.10 International Atomic Energy Agency, Generic Models for use in Assessing the Impact of
Discharges of Radioactive Substances to the Environment, Safety Reports Series No. 19, IAEA, Vienna (2001).
A2.11 International Commission on Radiological Protection, Publication No. 72, Age-Dependent
Doses to the Members of the Public from Intake of Radionuclides Part 5, Compilation Of Ingestion And Inhalation Coefficients (1996).
A2.12 European Commission, Basic Safety Standards, Directive 96/29/Euratom Commission of the
European Communities, Official Journal of EC, Series L, No 159 (1996). A2.13 Parker, R, Assumed Data for Dose Assessments, Westinghouse Electric Company, Technical
Report, 3000333-000-00-192-K-003 Rev A6 (UK-GW-GL-032, Revision 0), 11 November 2008.
A2.14 Eisenstatt, L. R., Characteristics of a Generic Site for a Nuclear Power Station, Westinghouse
Electric Company, UKP-GW-GL-025, Revision 1, 9 January 2010. A2.15 European Commission (1995). Methodology for Assessing the Radiological Consequences of
Routine Releases of Radionuclides to the Environment. Radiation Protection 72. EUR 15760 EN.
A2.16 International Atomic Energy Agency, Sediment Distribution Coefficients and Concentration
Factors for Biota in the Marine Environment, Technical Reports Series No. 422, IAEA, Vienna (2004).
A2.17 Smith, J G, Bedwell, P, Walsh C and Haywood, S M, A Methodology for Assessing Doses
from Short-term Planned Discharges to Atmosphere, NRPB-W54, NRPB, Chilton (Issue 5, 2006).
A2.18 Eisenstatt, L., UK AP1000, Environment Report UKP-GW-GL-790, Westinghouse Electric
Company (not reviewed). A2.19 Eckerman, K F and Sjoreen, AL, Radiological Toolbox User’s Manual, ORNL/TM-2004/27,
Oak Ridge National Laboratory (2004). A2.20 Titley, J., personal communication on work in progress by the National Dose Assessment
Working Group (2009) A2.21 Eisenstatt, L.R, Assumed Data for Dose Assessments, UKP-GW-GL-032 (11 November
2008). A2.22 Eisenstatt, L.R, Dose Assessment Assumptions – short term releases (TQ-AP1000-151)

Environment Agency – Independent dose assessment of AP-1000 design for GDA Page 26
Table A2.1: Summary and Review of WEC Approach for Assessment of Individual Dose - Discharges to Atmosphere Section Criteria WEC
Approach Comments on WEC Approach
Independent Approach
Discharge assumptions
Discharges grouped as follows: tritium (tritiated water); C-14; Ar-41; Xe-133; All other noble gases (Kr-85); I-131 All other iodines (I-133); C0-60; Sr-90; Cs-137; All other radionuclides (Co-58).
Based on DPUR values from Environment Agency Initial Assessment Methodology [Ref. A2.2]; 50th year discharge.
The same list of radionuclides as those used by WEC used for the inital assessment. The full list of radionuclides was applied in the more detailed assessment, in line with the data in Reference A2.1.
Release Points Main vent (88% discharge): 60 m
Turbine vent (12%): 40 m
An effective stack height of 22.5 m was used for the assessment.
Discharges were modelled as being released from a single stack for the purpose of the assessment.
Assumed data for dose assessments indicates that stack height 55.7 m with plume rise 6.7 m, nearby building height 70 m. 22.5 m has been used as effective stack height.
This stack height takes account of the building wake effects of a nearby building of 70 m height. According to guidance from the Working Group Atmospheric Dispersion, an effective stack height of 1/3rd of the building may be applied [A2. 8].
Following discussion of Environment Agency Guidance for Environmental Permitting (H1 Guidance) [Ref A2.7] the effective height for a release would be 0 m where the height of a stack is less than the height of any nearby building. It was agreed with the Environment Agency that 1/3 physical stack height be used [Ref A2. 8].
Discharges
Incineration release
No incineration
Capability included in spreadsheet
Receptor Points and pathways
Representative person Habits
Habitation Locations and habits – as defined by the DPUR in the Environment Agency Initial Assessment Methodology [Ref A2.2]. Habitation 100 m (in effluent plume).
From generic site characteristics; nearest
Environment Agency requested that habitation be assumed at 100 m and agricultural food production at 500 m, in line with initial assessment methodology [Ref A2.2].

Environment Agency – Independent dose assessment of AP-1000 design for GDA Page 27
Section Criteria WEC Approach
Comments on WEC Approach
Independent Approach
habitation at 80 m (closest of 5 representative sites); 50 and 100 m isolated properties and farms within 1 and 2 km respectively (also most restrictive of representative sites).
Food origin Terrestrial foods derived from 500 m from plume; DPUR approach; all local origin and all consumed at critical rates.
Agricultural production location 500 m. Green and root vegetables and fruit from 100 m other foods from 500 m.
Internal and external exposure
External External dose from cloud immersion and ground deposition at habitation (100 m).
Similar approach
Inhalation DPUR values from Environment Agency Initial Assessment methodology [Ref A2.2] applied for ‘local resident family’. Based on inhalation of activity in the plume at 100 m; indoor and outdoor air concentrations assumed to be equal.
Similar approach
Exposure Pathways
Ingestion Terrestrial foods originating from 500 m from discharge.
Similar approach for agricultural products; vegetables and domestic fruits derived from 100 m.
Meteorology 50% Pasquill Stability Category assumed
Alternative assumptions may lead to higher doses to the candidate representative person.
Environment Agency requested that most conservative coastal atmospheric case of 55-60% Category D.
Modelling of Environmental Concentrations
Deposition Dry deposition velocity: 0.001 m/s with the exception of inorganic forms of iodine (0.01 m/s); zero m/s for noble gases (no deposition). Deposition of H-3 and C-14 based on specific activity approach
Standard assumptions. Same approach
Surface 0.3 m Corresponds to rural Same approach

Environment Agency – Independent dose assessment of AP-1000 design for GDA Page 28
Section Criteria WEC Approach
Comments on WEC Approach
Independent Approach
roughness environment.
Terrestrial food concentrations
FARMLAND used to derive activity concentrations in foods integrated over 50-year interval for unit deposition rate (Bq/kg per Bq m-2 s-1)
C-14: assuming specific activity in food equal to that in atmosphere (1.5 E-04 kg/m3); H-3 activity in foods based on atmospheric water vapour concentration (8 E-03 kg/m3).
Values consistent with those derived from PC CREAM/FARMLAND [Ref A2.5].
Similar approach
Occupancy At location 100% occupancy at the habitation.
Similar approach
Indoor/outdoor Fraction of time indoors: 0.9 (infant), 0.8 (child), 0.5 (adult).
Similar approach
Inhalation Reference A79 inhalation rates used
0.22, 0.64 and 0.92 m3/h for infants, children and adults respectively.
Consistent with Reference A2.9.
Similar approach
Habits Data
Ingestion Terrestrial foods
Technical reports on generic site and information for dose assessment – habits data consistent with Reference A2.9.
All foods of local origin and all consumed at critical rates.
Environment Agency confirmed use of top 2 approach using ingestion rates from Reference A2.9, with exclusion of grain and milk products.
Dose to Terrestrial Candidate Representative person
External dose coefficients
Cloud emersion from Reference A2.4
Source consistent with that used for external dose rate factors in Reference A2.4 and Ref A2.2.
Similar source of dose coefficients; Environment Agency noted preference for use of data from Reference A2.4.
Standard location factor of 0.2 applied.
External dose from deposit
GRANIS [Ref. A2.5] – dose rates above wet generic soil (5 compartments to depth of 1 m). This approach includes full decay chains and daughters.
Environment Agency noted preference for use of Reference A2.4. Standard location factors used

Environment Agency – Independent dose assessment of AP-1000 design for GDA Page 29
Section Criteria WEC Approach
Comments on WEC Approach
Independent Approach
Internal dose per unit intake values
Derived from Reference A2.11 or Reference A2.12
Data for all radionuclides available.
Environment Agency confirmed that standard values from Reference A2.11 or Ref A2.12 are appropriate.

Environment Agency – Independent dose assessment of AP-1000 design for GDA Page 30
Table A2.2: Summary and Review of WEC Approach for Assessment of Individual Dose – Liquid Discharges to the Marine Environment Section Criteria WEC
Approach Comments on WEC Approach
Independent Approach
Local Compartment Characteristics
Based on initial radiological assessment approach [Ref.A2.2 method]
Parameters provided p. 162 (Table E3) in Part 2 of the methodology report [Ref. A2.2].
NB various assumptions were used in scoping the Ref A2.2 approach. The volumetric exchange rate has the greatest effect on subsequent dose.
The characteristics of the local marine box with the lowest volumetric exchange rate chosen (North Sea Central).
Discharge assumptions
Stage 2: grouped discharges: H-3 (tritiated water); C-14; Fe-55; C0-58; C0-60; Ni-63; Sr-90; Cs-137; Pu-241 all other radionuclides (Ce-144).
Supporting Technical Report on Assumed Data for Dose Assessments [Ref A2.13] provides more detailed breakdown of discharges by radionuclide.
The reasoning for the use of Ce-144 to represent the ‘other radionuclides’ is not clear.
Independent assessment: the same list of radionuclides used for the initial assessment and the full list of radionuclides discharged used for the detailed assessment.
Discharges
Release point characteristics
Stage 2: 130 m3/s assumed
Supporting Technical Report on the characteristics of a generic site [Ref. A2.13] indicates that the generic site exchange rate of 130 m3/s was chosen as the most conservative (lowest) of the 5 coastal nuclear sites considered to be typical of the range of coastal sites in the UK.
The marine compartment characteristics related to the potential site with the lowest volumetric exchange rate was used.
Receptor Points and
Representative DPUR for fisherman
Additional data presented in technical reports on generic
100% local fish, crustaceans and molluscs
Environment Agency – Independent dose assessment of AP-1000 design for GDA Page 31
Section Criteria WEC Approach
Comments on WEC Approach
Independent Approach
person Habits family applied site and information for dose assessment – habits data consistent with Reference A2.9.
DPUR approach based on all pathways at critical rates.
assumed at Reference A2.9 critical intake rates.
Local compartment
100% of beach occupancy assigned to local rather than regional compartment
Similar approach Occupancy
Beach occupancy– Reference A2.9 rates used
Beach occupancy: 30, 300 and 2000 h/y for infant, child and adult respectively.
Consistent with Reference A2.9.
Similar approach
Inhalation – Reference A2.7 rates used
Standard inhalation rates used for terrestrial and coastal occupancy (see above).
Similar approach
Ingestion - Reference A2.9 rates used
Standard consumption rates for marine foods assumed;
Similar approach
Sewage workers
Habit data are provided in the technical report on generic site but not used.
Not included.
pathways
Intakes
Children playing in brook
Habit data are provided in the technical report on generic site but not used.
Not included (although inadvertent ingestion of sediment and seawater during beach occupancy included).
Internal irradiation from consumption of seafood
Exposure Pathways
Internal and external exposure
DPUR approach includes internal and external irradiation pathways
External irradiation from beach occupancy (bait digging).
Includes same pathways and additional internal doses from seaspray and inadvertent ingestion and external dose from net handling

Environment Agency – Independent dose assessment of AP-1000 design for GDA Page 32
Section Criteria WEC Approach
Comments on WEC Approach
Independent Approach
Water Concentrations
DORIS used to determine activity concentrations in filtered seawater
Initial Radiological Assessment includes up to one progeny and models parent and progeny separately
Standard DORIS output used directly.
Sediment Concentrations
Partitioning based on coastal sediment partition coefficients
Beach sediment assumed to consist of top seabed sediment layer with depth 0.1 m.
Partition coefficients from the EA Initial Radiological Assessment Methodology
Modelling of Environmental Concentrations
Marine Food concentrations
Molluscs and crustaceans derived from local compartment; fish 50% local and 50% regional compartment
Based on concentration in filtered seawater and Concentration Factor (CF) for seafood in question.
CF values are derived from Reference A2.15 or Reference A2.10, where data not available in the Reference A2.16 is the most recent source currently available.
100% from local compartment assumed
Dose to Marine Candidate Representative person
Dose Calculations
Dose Coefficients for external exposure to sediment based on Reference A2.4.
Data for soil of depth 0.15 m applied and converted from volume to per unit mass by using soil density of 1,600 kg/m3.
External dose factors include decay and ingrowth of progeny – assumed to be in secular equilibrium with parent to derive dose rates [Ref. A2.2]
Dose coefficients taken from Reference A 2.4 for infinite depth, modified for a factor of 2 to allow deviation from semi-infinite source
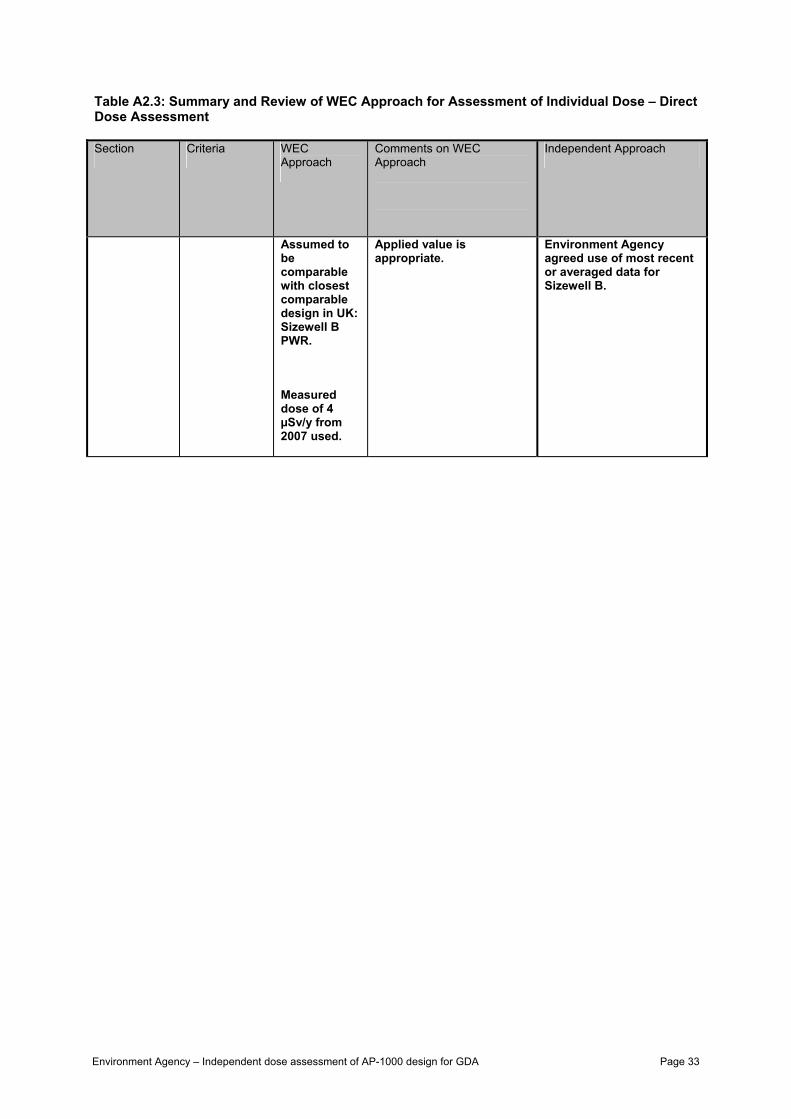
Environment Agency – Independent dose assessment of AP-1000 design for GDA Page 33
Table A2.3: Summary and Review of WEC Approach for Assessment of Individual Dose – Direct Dose Assessment Section Criteria WEC
Approach Comments on WEC Approach
Independent Approach
Assumed to be comparable with closest comparable design in UK: Sizewell B PWR.
Measured dose of 4 µSv/y from 2007 used.
Applied value is appropriate.
Environment Agency agreed use of most recent or averaged data for Sizewell B.

Environment Agency – Independent dose assessment of AP-1000 design for GDA Page 34
Table A2.4: Summary and Review of WEC Approach for Assessment of Individual Dose – Short-term Releases Section Criteria RP (WEC
Approach) Comments on the WEC Approach
Independent Approach
Discharges Gaseous atmospheric discharges assessed only for the radionuclide groups defined for annual discharge.
No short-term liquid discharges considered on basis that the discharge tanks cannot release a month’s liquid discharge over a period of a few hours. Also, as the discharges are some distance from the near shore, the travel times to exposure locations are much longer than short term atmospheric discharges
Liquid discharges assessed using continuous method (see Table A2.2).
Approach reasonable. Consultation with HPA indicated that potential for significantly non-homogeneous impacts from liquid discharges less than for atmospheric
Same approach used for independent assessment.
Radionuclide’s Same as for the long term assessment
No comment on overall approach
Same approach applied for independent assessment.
General approach
Methodology Based on NRPB-W54 [Ref A2.17]. Modelling using ADMS 4 [Ref. A2.2]
Suitable methodology for assessing short term discharges to atmosphere
NRPB-W54 method applied where possible for independent assessment
Dispersion modelling of environmental concentrations
Stack height See Table A1.9 for details of the WEC approach
See Table A1.9 for detailed comments on the WEC approach
It is not clear if there are any short term emissions from the Condenser Air Removal Stack. If there is likely to be short term releases, we would recommend that this source is specifically included in the short term modelling.
Independent assessment utilised a stack height of 55.7m and assumed all short term releases from this emission point (i.e. all short term emissions from the Main Plant Vent). Common practice for industrial installations is that the stack should be higher than any nearby buildings to reduce building wake effects and protect on-site personnel working at ground level. For this assessment, we would normally recommend
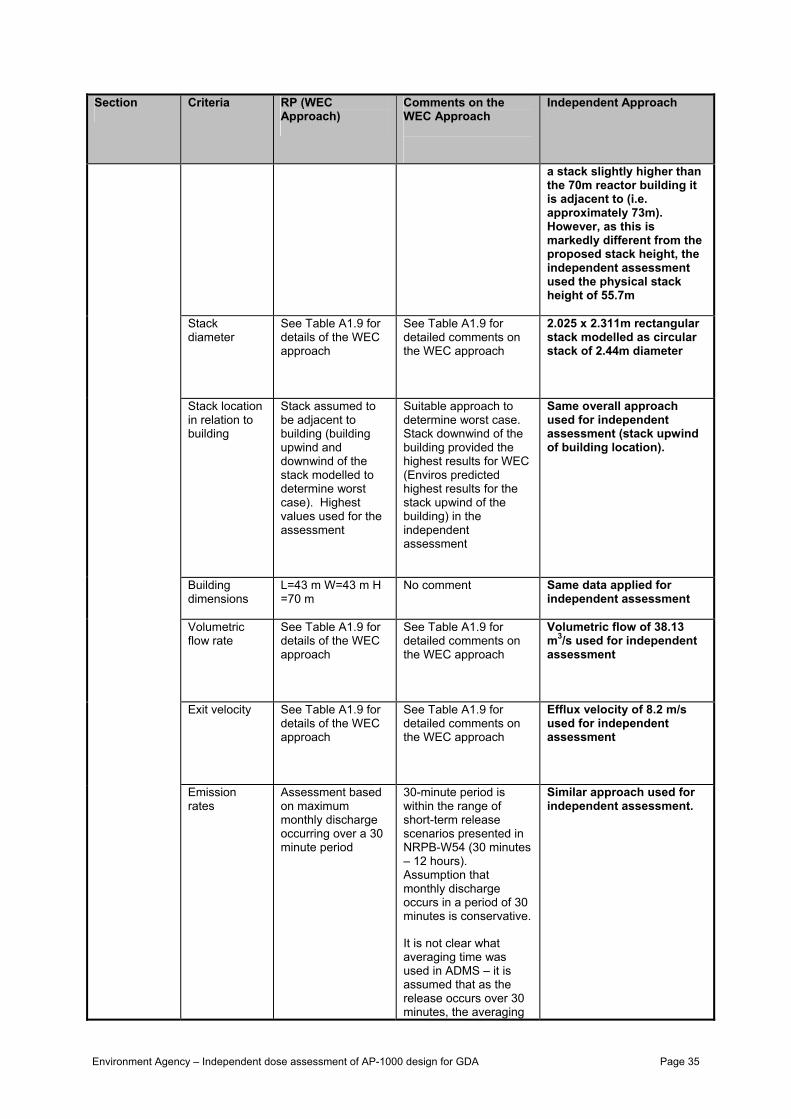
Environment Agency – Independent dose assessment of AP-1000 design for GDA Page 35
Section Criteria RP (WEC Approach)
Comments on the WEC Approach
Independent Approach
a stack slightly higher than the 70m reactor building it is adjacent to (i.e. approximately 73m). However, as this is markedly different from the proposed stack height, the independent assessment used the physical stack height of 55.7m
Stack diameter
See Table A1.9 for details of the WEC approach
See Table A1.9 for detailed comments on the WEC approach
2.025 x 2.311m rectangular stack modelled as circular stack of 2.44m diameter
Stack location in relation to building
Stack assumed to be adjacent to building (building upwind and downwind of the stack modelled to determine worst case). Highest values used for the assessment
Suitable approach to determine worst case. Stack downwind of the building provided the highest results for WEC (Enviros predicted highest results for the stack upwind of the building) in the independent assessment
Same overall approach used for independent assessment (stack upwind of building location).
Building dimensions
L=43 m W=43 m H =70 m
No comment Same data applied for independent assessment
Volumetric flow rate
See Table A1.9 for details of the WEC approach
See Table A1.9 for detailed comments on the WEC approach
Volumetric flow of 38.13 m3/s used for independent assessment
Exit velocity See Table A1.9 for details of the WEC approach
See Table A1.9 for detailed comments on the WEC approach
Efflux velocity of 8.2 m/s used for independent assessment
Emission rates
Assessment based on maximum monthly discharge occurring over a 30 minute period
30-minute period is within the range of short-term release scenarios presented in NRPB-W54 (30 minutes – 12 hours). Assumption that monthly discharge occurs in a period of 30 minutes is conservative.
It is not clear what averaging time was used in ADMS – it is assumed that as the release occurs over 30 minutes, the averaging
Similar approach used for independent assessment.

Environment Agency – Independent dose assessment of AP-1000 design for GDA Page 36
Section Criteria RP (WEC Approach)
Comments on the WEC Approach
Independent Approach
time was set to 30 minutes
Stability Stability category D, boundary layer depth 800m
See Table A1.9 for details of the WEC approach
Use of neutral stability follows approach in NRPB-W54 [Ref. A2.17]
See Table A1.9 for detailed comments on the WEC approach
Same approach applied for independent assessment. Boundary layer height of 800m and reciprocal of the monin-obukhov length of 0m-1 as per the approach in NRPB-W54
Wind speed Wind speed of 3 m/s
Within the range of wind speeds listed in NRPB-W54 (3 – 5m/s). 3 m/s corresponds to Realistically Cautious Case [Ref.A2.17]
Same data applied for independent assessment
Wind direction Towards receptors
Consistent with NRPB-W54 [Ref. A2.17]
Suitable approach
Same data applied for independent assessment
Rainfall See Table A1.9 for details of the WEC approach
Washout co-efficient of 0.0001s-1 is equivalent to a rainfall rate of 1mm/hour which is higher than the range of rainfall rates specified in NRPB-W54 (0.1 – 0.6mm/hour) [Ref. A2.17]
0.1 mm/hour is specified in NRPB-W54 for the Realistically Cautious Case [Ref. A2.17]
Rainfall rate of 0.1 mm/hr utilised for independent assessment. Washout co-efficient calculated using rainfall rate and default ADMS parameters A and B as per the approach in NRPB-W54 [Ref. A2.17].
Surface roughness
Surface roughness of 0.3m
Appropriate value for rural location
Same data applied for independent assessment
Deposition method
Dry and wet deposition modelled simultaneously and not independently using ADMS
Approach suitable
Same approach applied for independent assessment
Deposition parameters
See Table A1.9 for details of the WEC approach
Approach suitable
Same dry deposition velocities utilised for independent assessment
Wet deposition: Calculated using ADMS default washout coefficients A (0.0001) and B (0.64) and using rainfall rate of 0.1mm/hour

Environment Agency – Independent dose assessment of AP-1000 design for GDA Page 37
Section Criteria RP (WEC Approach)
Comments on the WEC Approach
Independent Approach
Radioactive decay
Radioactive decay was modelled, although stated in TQ-151 response that did not have significant impact due to short distances/timescales
No comment No decay assumed for independent assessment due to relatively short distance and travel times and consistent with NRPB-54 [A2.17]
Gamma dose Modelled explicitly using Gamma Dose module in ADMS
As the buildings module cannot be used simultaneously with the Gamma Dose module, in order to model the Gamma Dose, a stack height of 22.5m was utilised to represent the emissions from a 60m stack with the buildings module turned on. This approach seems reasonable, although no evidence was supplied to support the approach used
Independent assessment determined Gamma Dose using factors based on air concentrations and deposition values at the receptor locations for the 55.7m stack height with buildings module turned on. Gamma Dose was not specifically modelled using ADMS.
Receptors Receptor at 100m and 500 m downwind from release point
Location consistent with the continuous release assumptions and consistent with initial assessment approach.
Receptor at 100m and 500m downwind of release point modelled for independent assessment
Pathways External dose From plume and deposited material Period of passage and deposition in year following release
Reasonable approach Similar approach
Inhalation For period of plume passage
Reasonable approach Similar approach
Ingestion of foods
In the year following release
Reasonable approach Similar approach
Environmental Modelling
Food concentrations
FARMLAND (PC CREAM) Used transfer factors per unit time derived from PC CREAM output to derive crop and animal uptake per unit deposition, adjusted for single, instantaneous deposition [A2.22].
C-14 and tritium
Simple pragmatic approach – reasonable initial assumptions
Similar approach

Environment Agency – Independent dose assessment of AP-1000 design for GDA Page 38
Section Criteria RP (WEC Approach)
Comments on the WEC Approach
Independent Approach
crop uptakes based on air concentration.
Occupancy & Location factors
100% at location; Indoor. Occupancy factors derived from NRPB-W54 [Ref. A2.17]
Reasonable approach No location factors applied
Intakes Inhalation rates derived from NPRB-W54 [Ref. A2.17]
Reasonable approach Generalised factors used
Representative person Habits
Terrestrial food intakes from NPRB-W54 [Ref. A2.16]
Reasonable approach
Similar approach
External (plume)
24 hour exposure Indoor/outdoor locations used and standard (ADMS) dose coefficients for immersion.
Dose rate calculations repeated. For independent assessment used dose rate factors for immersion based on FGR 12 [Ref. A2.4]
Dose calculation
External (deposit)
Year following release
Ground contamination from ADMS, radioactive decay. Occupancy and location factors for indoor and outdoor occupancy taken into account; dose coefficients for deposit
Dose rate calculations repeated.
Dose Coefficients
From Environment Agency Initial Radiological Assessment [A2.2]
Reasonable approach Consistent with the source of coefficients used in the independent assessment

Environment Agency – Independent dose assessment of AP-1000 design for GDA Page 39
Table A2.5: Summary and Review of WEC Approach for Assessment of Individual Dose – Total Dose Section Criteria WEC Approach Comments on WEC Approach
Independent Approach
Total annual doses from representative and annual limit liquid discharges
Annual dose from representative and annual limit atmospheric discharges
Dose from single short-term atmospheric release.
Direct radiation
All doses from annual discharges from atmospheric and liquid discharges added on the basis that it cannot be ruled out that each group will not be exposed to both.
Representative person also assumed to be exposed from single short-term release and site fence direct radiation.
Likely to be conservative.
Marine group plus average terrestrial foods from 100 and 300 m.
Terrestrial group and average marine occupancy of 2000 hours on beach (for adult).

Environment Agency – Independent dose assessment of AP-1000 design for GDA Page 40
Table A2.6: Summary and Review of WEC Approach for Assessment of Collective Dose – Discharges to Atmosphere Section Criteria WEC Approach Comments on WEC
Approach
Independent Approach
Discharge assumptions
Grouped as follows: tritium (tritiated water), C-14, Ar-41, Co-60; Sr-90; I-131; Xe-133; Cs-137 other noble gases (Kr-85), other iodines (I-131); other particulates (Co-58)
Ref: Eisenstatt, L, Environment Report, WEC, UKP-GW-GL-790, Revision 2 [Ref. A2.1].
The same list of radionuclides applied.
Release Points
22.5 m effective stack height
Assumed that all discharges from main stack. There is no effect on results since the same effective stack is used for both release points.
The same effective stack height used
Discharges
Meteorology 50% atmospheric stability category D
Reasonable for coastal site, although other stability category assumptions may lead to higher doses.
Similar approach
Receptor Points and pathways
Collective Dose assessment
UK, Europe and World, truncated at 500 y
Population groups and truncation period in accordance with Reference A2.6
Collective dose from global circulation for tritium, C-14 and Kr-85.
Similar approach
Population and agricultural grids
For representative sites
Dependence of calculations on grids requires specific rather than generic site assumptions to be made; representative sites for which calculations undertaken: Dungeness, Hartlepool, Heysham, Hinkley Point, Sizewell.
Similar approach adopted.
Interpretation of results
Maximum, average and minimum values
Demonstration of the range of values for 5 sites.
The same approach applied
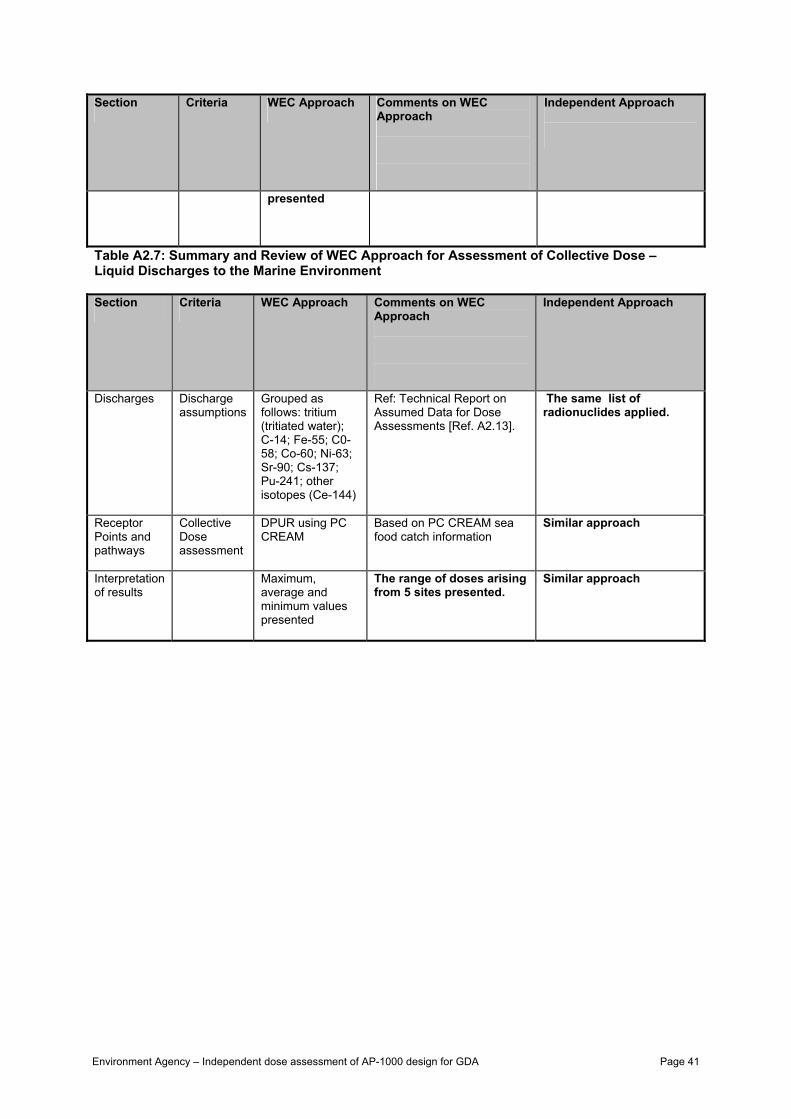
Environment Agency – Independent dose assessment of AP-1000 design for GDA Page 41
Section Criteria WEC Approach Comments on WEC Approach
Independent Approach
presented
Table A2.7: Summary and Review of WEC Approach for Assessment of Collective Dose – Liquid Discharges to the Marine Environment Section Criteria WEC Approach Comments on WEC
Approach
Independent Approach
Discharges Discharge assumptions
Grouped as follows: tritium (tritiated water); C-14; Fe-55; C0-58; Co-60; Ni-63; Sr-90; Cs-137; Pu-241; other isotopes (Ce-144)
Ref: Technical Report on Assumed Data for Dose Assessments [Ref. A2.13].
The same list of radionuclides applied.
Receptor Points and pathways
Collective Dose assessment
DPUR using PC CREAM
Based on PC CREAM sea food catch information
Similar approach
Interpretation of results
Maximum, average and minimum values presented
The range of doses arising from 5 sites presented.
Similar approach

Environment Agency – Independent dose assessment of AP-1000 design for GDA Page 42
Appendix 3 – Independent radiological assessment of discharges to atmosphere Introduction A3.1 The assessment undertaken by Westinghouse Electric Company (WEC) of discharges of
radioactive wastes to atmosphere from the AP1000 Generic Design power plant was reviewed in Appendix 1 and 2. This review showed that some key assumptions may not be appropriate to a more detailed radiological assessment.
A3.1 An independent radiological assessment has been made on the basis of the expected annual
discharges of the full list of radionuclides presented in the WEC submissions [Ref. A3.1]. A3.2 This work is based on predicted discharges to atmosphere as presented by WEC. The
validity of these predictions has not been assessed. Discharges to Atmosphere A3.2 The information provided by WEC showed that the main discharges would be made from 2
main release points: the plant vent and the turbine building vent. A3.3 The radiological assessment has been made on the basis of the predicted discharges of the
full list of radionuclides presented in the WEC report [Ref. A3.1] and summarised in Table 1. A3.4 Details of the atmospheric discharge points on the AP1000 Generic Design power plant are
provided in Table A3.1 and predicted levels of activity discharged in Table A3.2. The plant vent is the release point for approaching 90% of the activity discharged to atmosphere, and represents the release path for containment venting, auxiliary building ventilation, annex building releases and radioactive waste building releases. The turbine building vent is the release path for condenser air removal, gland seal condenser exhaust and turbine building ventilation releases. Both stacks are assumed to be located close to a building of 70 m in height. For the purposes of this assessment, both release points have been assessed and the effective stack height of 1/3rd of the building height (23 metres) has been assumed for both release points, in accordance with the approach outlined in NPRB-R157 [Ref. A3.2].
Receptor Points and Candidates for the representative person A3.5 For the purposes of this assessment, candidates for the representative person affected by
atmospheric discharges (CRP1) has been identified to be potential local residents living close to the proposed power plant. Generic habit profiles were developed, on the basis of the Environment Agency Initial Radiological Assessment Methodology [Ref. A3.3] and NRPB-W41 [Ref. A3.4], to represent those likely to be the most exposed individuals to atmospheric discharges from the AP1000 power plant.
A3.6 On the basis of information provided by WEC, the AP1000 power plant has been assumed to
be located at a coastal site. It is therefore assumed that commercial fishing is in operation, for fish and shellfish along the coast, where the liquid discharges from the site are made. Fishing families may also receive exposures from atmospheric discharges from locally derived terrestrial foods.
A3.7 The following candidates for the representative person have been identified to reflect the
residential, farming and working communities in the area closest to the AP1000 power plant.

Environment Agency – Independent dose assessment of AP-1000 design for GDA Page 43
• CRP1 Local residents. For the purposes of this assessment, it is assumed that families
(adults, children (10 years) and infants (1 year)) living in the nearest habitation (assumed to be located at approximately 100 m from the discharge point), are exposed to atmospheric discharges, direct radiation and, to a lesser extent, to liquid discharges in the marine environment. It is assumed that members of this family spend most of their time at home, some of which is spent outside. They get their green vegetables, root vegetables and fruit from their garden or other local source (100 m from the discharge point) and milk and meat from local farms close to the site whose livestock graze approximately 500 m from the site. Some local fish and shellfish are also consumed. Generic habit data for this group were derived from NRPB-W41 [Ref. A3.4].
A3.8 Each age group in CRP1 has been assumed to consume 2 terrestrial foods at critical rates, in
accordance with the approach recommended guidance from the National Dose Assessment Working Group (NDAWG) [Ref. A3.5], for use where no site-specific information is available. Generic assumptions regarding the proportion of time spent indoors and outdoors were assumed, from NRPB-W41 [Ref. A3.4]; higher than average outdoor occupancy rates for adults and children have been considered appropriate for a farming family.
Exposure Pathways A3.9 The exposure pathways considered were:
• internal exposure to radionuclides from ingestion of local fruit and vegetable produce (green vegetable and root vegetable), cow and sheep meat and cow milk;
• internal exposure via inhalation of radionuclides from the plume and secondary inhalation of radionuclides deposited on the ground and resuspended; and,
• external doses from exposure to the plume (‘cloudshine’) and beta and gamma radiation from radionuclides deposited on the ground (‘groundshine’).
A3.10 Assessment of exposure to direct radiation from the site was taken into account where
appropriate (Appendix 8). Modelling of Environmental Concentrations A3.11 Air concentrations and deposition at 100 m (local residence) and 500 m (local farmland) from
the site relevant to the assessment of exposure of local terrestrial representative person members have been assessed.
A3.12 The Gaussian plume atmospheric dispersion model, Plume, in PC-CREAM [Ref A3.6] have
been used to calculate air activity concentrations (dispersion factors) and ground deposition values for each radionuclide [Table A3.3]. A uniform wind rose has been assumed and the average weather category for the Gaussian plume model has been assumed to be 60% (category D). This category is considered to represent the conditions at potential sites that would be likely to give rise to the highest doses to CRP1.
A3.13 For radionuclides discharged to atmosphere, which deposit on the ground (all radionuclides
except tritium and noble gases), a deposition velocity of 0.001 m/s has been used to calculate the deposition rate for use in the calculation of food activity concentrations and external dose rates for all the depositing radionuclides except iodine, where a deposition velocity of 0.01 m/s was used [Ref A3.7]. A washout coefficient of 10-4 s-1 was used to calculate wet deposition.
A3.14 Concentrations in terrestrial foodstuffs and animal products at the nearest allotments and
gardens around residences (100 m) and farmland (500 m) have been predicted from the air concentrations. For all nuclides except tritium and carbon-14 food concentrations have been derived using deposition velocity and food activity concentration per unit deposition rate factors. For tritium and carbon-14, food concentrations have been calculated from food

Environment Agency – Independent dose assessment of AP-1000 design for GDA Page 44
activity concentration per unit air activity concentration factors [Ref A3.7]. The food activity concentration factors are shown in Table A3.4.
Habits Data A3.15 Doses to candidates for the representative person have been calculated using the predicted
environmental concentrations and generic habits data: information concerning food intakes and occupancy of the environment at the nearest habitation and the nearest farm; occupancy at the locations; time spent indoors and outdoors; and, breathing rates. The assessment has used information derived from the Environment Agency’s Initial Radiological Assessment Methodology [Ref. A3.3] and NRPB-W41 [Ref. A3.4]. The corresponding adult, child and infant habit data is provided in Table A3.5.
A3.16 Generic breathing rates have been used throughout the assessment, these are presented in
Table A3.6 [Ref. A3.4]. It has been assumed that CRP1 spent 90% of their time at their homes, but that the time spent indoors is assumed to vary with age group. Adults have been assumed to spend 50% of their time indoors while children and infants have been assumed to spend 80% and 90% respectively [Ref. 3.4].
A3.17 Generic shielding factors have been used to modify the external dose to take account of time
spent indoors. A location factor of 0.1 was used for shielding from material deposited in the ground [Ref A3.7]. A shielding factor of 0.2 was used for shielding of external radiation from material in the plume [Ref A3.7].
Doses to the Terrestrial Candidates for the Representative person A3.18 The generic habits data which were chosen were considered to considered to provide a
conservative estimate of doses to candidates for representative person for gaseous releases (CRP1) from the AP1000 power plant.
A3.19 Doses to infant, child and adult candidates for the representative person have been
calculated using assessment spreadsheets customised for the AP1000 power plant. A3.20 For internal exposure, inhalation and ingestion dose coefficients [Table A3.7] from the
Euratom Basic Safety Standards Directive [Ref A3.8] and the predicted concentrations of radionuclides in the environment and foods have been used. For external exposure cloudshine and groundshine factors have been used and were derived from the updated version of FGR-12 [Ref A3.9] available on the US EPA web site (Table A3.8).
A3.21 The doses associated with the discharges predicted by WEC [Ref. A3.1] have been
calculated from the dose per unit release data and the source term for each stack modelled for each radionuclide using generic habits data.
A3.22 The doses from atmospheric discharges from the AP1000 power plant based predicted
discharges, plus the contribution to dose from predicted marine discharges (see Appendix 4), are shown in Table A3.9. The doses to all the terrestrial candidate for the representative person from discharges have been found to be less than 5 μSv/y.
A3.23 A breakdown of the representative person dose arising from the AP1000 power plant for the
infant CRP1, at the predicted discharges by radionuclide and pathway is provided in Table A3.10.
A3.24 The dose from aerial discharges from the AP1000 power plant accounts for over 99% of the
dose to the terrestrial representative person from discharges (aerial and marine). References
Environment Agency – Independent dose assessment of AP-1000 design for GDA Page 45
A3.1 Eisenstatt, L, Environment Report, WEC, UKP-GW-GL-790 Revision 3 April 2010. A3.2 Jones, J A, The Fifth Report of the Working Group on Atmospheric Dispersion: Models to
Allow for the Effects of Coastal Sites, Plume Rise and Buildings on Dispersion of Radionuclides and Guidance on the Value of Deposition Velocity and Washout Coefficients, , NRPB-R157, NRPB, Chilton, 1983.
A3.3 Environment Agency, Initial Radiological Assessment Methodology (Parts 1 and 2), Science
Report SC030162/SR1 (2006) A3.4 Smith, K R and Jones A L, Generalised Habit Data for Radiological Assessments, NRPB-W41,
NRPB, Chilton (2003). A3.5 NDAWG, Acquisition and Use of Habits Data for Prospective Assessments, NDAWG/2/2009,
http://www.ndawg.org/NDAWGpapers.htm A3.6 Mayall A, Cabianca T, Attwood C, Fayers CA, Smith JG, Penfold J, Steadman D, Martin G,
Morris TP and Simmonds JR. PC CREAM-97 (PC CREAM-98 code update) NRPB, Chilton NRPB-SR-296 (EUR 17791) (1997).
A3.7 European Commission (1995). Methodology for Assessing the Radiological Consequences of
Routine Releases of Radionuclides to the Environment. Radiation Protection 72. EUR 15760 EN.
A3.8 Council Directive 96/29 Euratom of 13 May 1996, Laying Down Basic Safety Standards for the
Protection of the Health of Workers and the General Public Against the Dangers Arising from Ionising Radiation. Official Journal of the European Communities, L159, Volume 39, 29 June 1996.
A3.9 EPA (1993). External Exposure to Radionuclides in Air, Water, and Soil. Federal Guidance
Report No. 12, EPA-402-R-93-081(Oak Ridge National Laboratory, Oak Ridge, TN; U.S. Environmental Protection Agency, Washington, DC).

Environment Agency – Independent dose assessment of AP-1000 design for GDA Page 46
Table A3.1 Atmospheric Discharge Points from the AP1000 Power plant
Stack Name Discharge Position Effective Discharge Height (metres)
Main Plant Stack (Stack 1) Reactor Building 23 Condenser Air Removal Stack (Stack 2) Turbine Hall 23
Table A3.2 Predicted Discharges used in the Assessment for Aerial Discharges to Atmosphere
Predicted Atmospheric Discharges (TBq/y)
Radionuclide Reactor Building
(Stack 1) Turbine Hall
(Stack 2) Ar-41 1.30E+00 - Ba-140 1.50E-07 - C-14 6.06E-01 - Co-58 8.60E-06 - Co-60 3.20E-06 - Cr-51 1.90E-07 - Cs-134 8.30E-07 - Cs-137 1.30E-06 - H-3 1.80E+00 - I-131 2.10E-04 3.40E-06 I-133 3.50E-04 3.70E-06 Kr-85 3.10E+00 2.60E-02 Kr-85m 1.70E-02 7.80E-03 Kr-87 1.70E-02 2.20E-03 Kr-88 1.80E-02 8.50E-03 Mn-54 1.10E-07 - Nb-95 8.90E-07 - Sr-89 1.10E-06 - Sr-90 4.10E-07 - Xe-131m 1.30E+00 8.10E-02 Xe-133 9.60E-01 2.90E-01 Xe-133m 8.10E-02 3.50E-02 Xe-135 1.70E-01 2.60E-01 Xe-135m 1.30E-01 5.90E-02 Xe-137 3.40E-02 1.60E-02 Xe-138 5.90E-02 2.90E-02 Zr-95 3.70E-07 -

Environment Agency – Independent dose assessment of AP-1000 design for GDA Page 47
Table A3.3 Air Concentration Factors and Ground Deposition
Air concentration Bq/m3 per TBq/y
Ground deposition Bq/m2/s per TBq/y Discharge
Point Nuclide
at home at farm
Resuspended Air conc at
home Bq s/m3 per Bq/m2/s for
1y at home at farm
Ar-41* 3.81E-02 2.95E-02 Ba-140 3.81E-02 2.98E-02 7.81E+06 5.71E-05 4.12E-05 C-14 3.81E-02 2.98E-02 Co-58 3.81E-02 2.98E-02 1.33E+07 5.71E-05 4.12E-05 Co-60 3.81E-02 2.98E-02 2.40E+07 5.71E-05 4.12E-05 Cr-51 3.81E-02 2.98E-02 1.03E+07 5.71E-05 4.12E-05 Cs-134 3.81E-02 2.98E-02 2.10E+07 5.71E-05 4.12E-05 Cs-137 3.81E-02 2.98E-02 2.92E+07 5.71E-05 4.12E-05 H-3 3.81E-02 2.98E-02 I-131 3.81E-02 2.95E-02 6.40E+06 3.81E-04 3.08E-04 I-133 3.81E-02 2.95E-02 1.02E+06 3.81E-04 3.08E-04 Kr-85* 3.81E-02 2.98E-02 Kr-85m* 3.81E-02 2.98E-02 Kr-87* 3.81E-02 2.95E-02 Kr-88* 3.81E-02 2.98E-02 Mn-54 3.81E-02 2.98E-02 1.81E+07 5.71E-05 4.12E-05 Nb-95 3.81E-02 2.98E-02 1.10E+07 5.71E-05 4.12E-05 Sr-89 3.81E-02 2.98E-02 1.22E+07 5.71E-05 4.12E-05 Sr-90 3.81E-02 2.98E-02 2.91E+07 5.71E-05 4.12E-05 Xe-131m* 3.81E-02 2.98E-02 Xe-133* 3.81E-02 2.98E-02 Xe-133m* 3.81E-02 2.98E-02 Xe-135* 3.81E-02 2.98E-02 Xe-135m* 3.49E-02 2.76E-02 Xe-137* 3.04E-02 2.22E-02 Xe-138* 3.49E-02 2.76E-02
Stack 1
Zr-95* 3.81E-02 2.98E-02 1.29E+07 5.71E-05 4.12E-05 I-131 3.81E-02 2.95E-02 6.40E+06 3.81E-04 3.08E-04 I-133 3.81E-02 2.95E-02 1.02E+06 3.81E-04 3.08E-04 Kr-85* 3.81E-02 2.98E-02 Kr-85m* 3.81E-02 2.98E-02 Kr-87* 3.81E-02 2.95E-02 Kr-88* 3.81E-02 2.98E-02 Xe-131m* 3.81E-02 2.98E-02 Xe-133* 3.81E-02 2.98E-02 Xe-133m* 3.81E-02 2.98E-02 Xe-135* 3.81E-02 2.98E-02 Xe-135m* 3.49E-02 2.76E-02 Xe-137* 3.04E-02 2.22E-02
Stack 2
Xe-138* 3.49E-02 2.76E-02 * Noble gases where no deposition to ground occurs
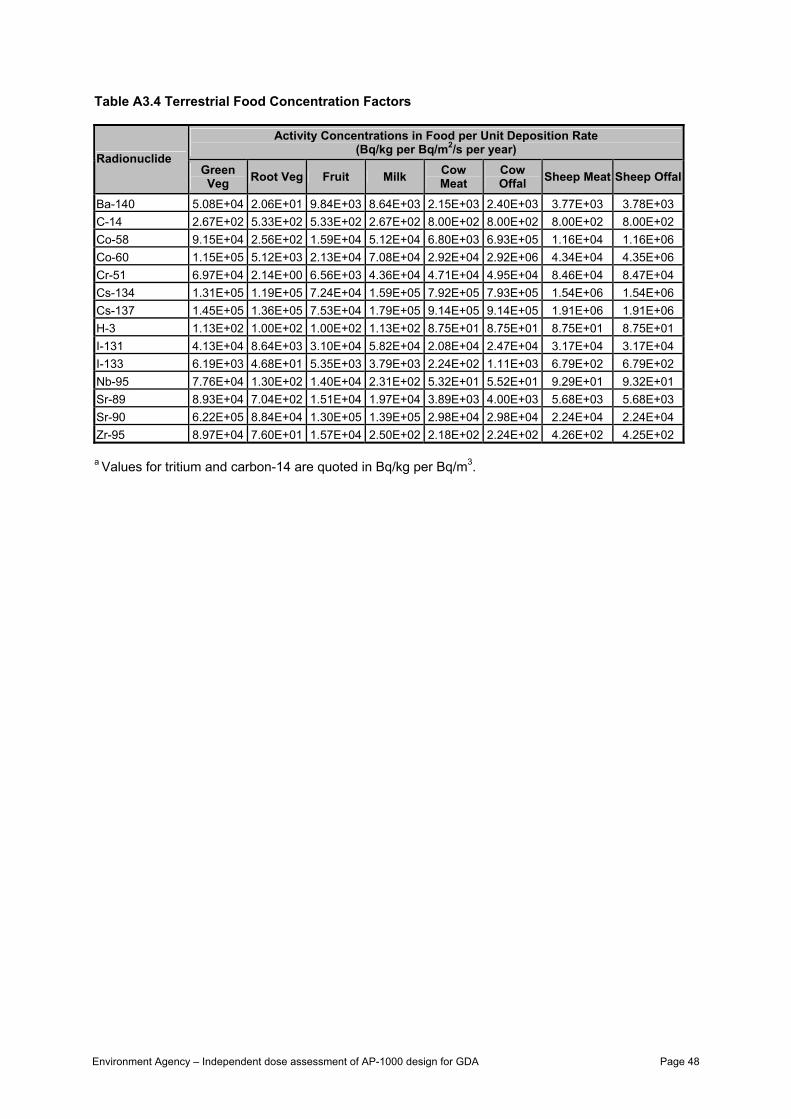
Environment Agency – Independent dose assessment of AP-1000 design for GDA Page 48
Table A3.4 Terrestrial Food Concentration Factors
Activity Concentrations in Food per Unit Deposition Rate (Bq/kg per Bq/m2/s per year)
Radionuclide Green Veg Root Veg Fruit Milk Cow
Meat Cow Offal Sheep Meat Sheep Offal
Ba-140 5.08E+04 2.06E+01 9.84E+03 8.64E+03 2.15E+03 2.40E+03 3.77E+03 3.78E+03 C-14 2.67E+02 5.33E+02 5.33E+02 2.67E+02 8.00E+02 8.00E+02 8.00E+02 8.00E+02 Co-58 9.15E+04 2.56E+02 1.59E+04 5.12E+04 6.80E+03 6.93E+05 1.16E+04 1.16E+06 Co-60 1.15E+05 5.12E+03 2.13E+04 7.08E+04 2.92E+04 2.92E+06 4.34E+04 4.35E+06 Cr-51 6.97E+04 2.14E+00 6.56E+03 4.36E+04 4.71E+04 4.95E+04 8.46E+04 8.47E+04 Cs-134 1.31E+05 1.19E+05 7.24E+04 1.59E+05 7.92E+05 7.93E+05 1.54E+06 1.54E+06 Cs-137 1.45E+05 1.36E+05 7.53E+04 1.79E+05 9.14E+05 9.14E+05 1.91E+06 1.91E+06 H-3 1.13E+02 1.00E+02 1.00E+02 1.13E+02 8.75E+01 8.75E+01 8.75E+01 8.75E+01 I-131 4.13E+04 8.64E+03 3.10E+04 5.82E+04 2.08E+04 2.47E+04 3.17E+04 3.17E+04 I-133 6.19E+03 4.68E+01 5.35E+03 3.79E+03 2.24E+02 1.11E+03 6.79E+02 6.79E+02 Nb-95 7.76E+04 1.30E+02 1.40E+04 2.31E+02 5.32E+01 5.52E+01 9.29E+01 9.32E+01 Sr-89 8.93E+04 7.04E+02 1.51E+04 1.97E+04 3.89E+03 4.00E+03 5.68E+03 5.68E+03 Sr-90 6.22E+05 8.84E+04 1.30E+05 1.39E+05 2.98E+04 2.98E+04 2.24E+04 2.24E+04 Zr-95 8.97E+04 7.60E+01 1.57E+04 2.50E+02 2.18E+02 2.24E+02 4.26E+02 4.25E+02 a Values for tritium and carbon-14 are quoted in Bq/kg per Bq/m3.

Environment Agency – Independent dose assessment of AP-1000 design for GDA Page 49
Table A3.5 Habits Data Profiles for CRP1*
Consumption (kg/y or l/y) Handling and Occupancy (h/y) Age Group
Profile Number
Profile Name
Gre
en v
eg
cons
umpt
ion
Pota
toes
& ro
ot v
eg
Dom
estic
Fru
it
Milk
Cat
tle M
eat
Cow
Offa
l
Shee
p M
eat
Shee
p O
ffal
Sea
Fish
Cru
stac
ea
Mol
lusc
a
Han
dlin
g Fi
shin
g G
ear
Ove
r int
ertid
al m
uda
Inte
rnal
occ
upan
cy
Exte
rnal
occ
upan
cy
1 All critical 80.0 130.0 75.0 240.0 45.0 10.0 25.0 10.0 300 4080 4380 2 All average 35.0 60.0 20.0 95.0 15.0 2.8 8.0 2.8 15.0 1.8 1.8 300 300 4080 4380 Adult 3 Top two approach 35.0 130.0 20.0 240.0 15.0 2.8 8.0 2.8 9.5 0.3 0.3 300 300 4080 4380 1 All critical 35.0 95.0 50.0 240.0 30.0 5.0 10.0 5.0 300 7008 1752 2 All average 15.0 50.0 15.0 110.0 15.0 1.5 4.0 1.5 6.0 1.3 1.3 300 7008 1752 10 y
Child 3 Top two approach 15.0 95.0 15.0 240.0 15.0 1.5 4.0 1.5 4.0 0.1 0.1 300 7008 1752 1 All critical 15.0 45.0 35.0 320.0 10.0 2.8 3.0 2.8 30 7008 1752 2 All average 5.0 15.0 9.0 130.0 3.0 0.5 0.8 0.5 3.5 0.0 0.0 30 7008 1752 1y
infant 3 Top two approach 5.0 15.0 9.0 320.0 3.0 0.5 0.8 0.5 2.0 0.0 0.0 30 7008 1752
a – Time spent over intertidal areas was summed together to give a total occupancy over intertidal areas. It is number that is used in the assessment * The values in italics are included in the assessment spreadsheet for calculation purposes only. These values are included in this table for completeness and ease of reference; they do not represent candidate representative person profiles.

Environment Agency – Independent dose assessment of AP-1000 design for GDA Page 50
Table A3.6 Other Habit Data for Candidates for the Representative Person
Representative person independent factors Factor Adult Child Infant Units Breathing rate per y 8100 5600 1900 m3/y
Breathing rate per h 0.92466 0.639 0.217 m3/h
default fraction of time indoors 0.5 0.8 0.9 -
Default Occupancy 1 1 1 -
Inadvertent ingestion of seawater 0.5 0.5 0.2 l/y
Inadvertent ingestion of sediment 8.30E-03 0.018 0.044 kg/y
Default beach occupancy 300 300 30 h/y Table A3.7 Internal Committed Dose Rate Factors for Expose via Inhalation and Ingestion
ICRP Lung Class Inhalation Sv/Bq Ingestion (Sv/Bq) Radionuclide
A C I A C I A C I
Ba-140 M 5.10E-09 7.60E-09 2.00E-08 2.60E-09 5.80E-09 1.80E-08 C-14 V 2.00E-09 2.80E-09 6.60E-09 5.80E-10 8.00E-10 1.60E-09 Co-58 M 1.60E-09 2.40E-09 6.50E-09 7.40E-10 1.70E-09 4.40E-09 Co-60 M 1.00E-08 1.50E-08 3.40E-08 3.40E-10 1.10E-08 2.70E-08 Cr-51 S 3.70E-11 6.60E-11 2.10E-10 3.80E-11 7.80E-11 2.30E-10 Cs-134 F 6.60E-09 5.30E-09 7.30E-09 1.90E-08 1.40E-08 1.60E-08 Cs-137 F 4.60E-09 3.70E-09 5.40E-09 1.30E-08 1.00E-08 1.20E-08 H-3 V 1.80E-11 2.30E-11 4.80E-11 1.80E-11 2.30E-11 4.80E-11 I-131 F 7.40E-09 1.90E-08 7.20E-08 2.20E-08 5.20E-08 1.80E-07 I-133 F 1.50E-09 3.80E-09 1.80E-08 4.30E-09 1.00E-08 4.40E-08 Mn-54 M 1.50E-09 2.40E-09 6.20E-09 7.10E-10 1.30E-09 3.10E-09 Nb-95 M 1.50E-09 2.20E-09 5.20E-09 5.80E-10 1.10E-09 3.20E-09 Sr-89 M 6.10E-09 9.10E-09 2.40E-08 2.60E-09 5.80E-09 1.80E-08 Sr-90 M 3.60E-08 5.10E-08 1.10E-07 2.80E-08 6.00E-08 7.30E-08 Zr-95 M 4.80E-09 6.80E-09 1.60E-08 9.50E-10 1.90E-09 5.60E-09
A = Adult, C = Child, I = Infant. Note – Inhalation factors for noble gases are zero and are not presented

Environment Agency – Independent dose assessment of AP-1000 design for GDA Page 51
Table A3.8 External Effective Dose Rate Factors for Exposure to Cloudshine and Groundshine
Cloudshine Groundshine Radionuclide Sv/h per Bq/m3 Sv/h per Bq/m2/s
Ar-41 2.2E-10 4.32E-12
Ba-140 2.9E-11 2.79E-13
C-14 9.4E-15 0
Co-58 1.6E-10 6.02E-13
Co-60 4.3E-10 2.63E-11
Cr-51 5E-12 7.92E-15
Cs-134 2.5E-10 8.24E-12
Cs-137 9.2E-11 1.49E-11
H-3 0 0
I-131 6.1E-11 2.82E-14
I-133 9.9E-11 5.07E-15
Kr-85 8.6E-13 9.5E-15
Kr-85m 2.5E-11 5.49E-13
Kr-87 1.48E-10 2.63E-12
Kr-88 4.88E-10 8.41E-12
Mn-54 1.4E-10 2.09E-12
Nb-95 1.3E-10 2.44E-13
Sr-89 1.6E-12 3.81E-17
Sr-90 3.5E-13 2.85E-19
Xe-131m 1.40E-12 7.42E-14
Xe-133 4.8E-12 1.66E-13
Xe-133m 1.05E-11 3.12E-13
Xe-135 4.28E-11 8.71E-13
Xe-135m 1.16E-10 2.40E-12
Xe-137 0 0
Xe-138 6.43E-10 1.16E-11
Zr-95 1.2E-10 8.56E-13 All values derived from updated version of Ref [A2.4] Table A3.9 Doses to the Terrestrial Candidates for the Representative person (CRP1, Local Family) from gaseous releases to atmosphere for discharges at Predicted levels and Contribution from Marine Discharges (µSv/y)
Dose (μSv/y)
Atmospheric Discharges Habits Profile Age
Stack 1 Stack 2
Marine Discharges Total
Adult 2.63 0.01 0.07 2.71 Child 2.86 0.01 0.04 2.91
CRP1 - local resident (high rate terrestrial
food consumer Infant 4.38 0.01 0.04 4.43 Notes * Highest dose for each group, summarised in Table 4 in the main report.

Environment Agency – Independent dose assessment of AP-1000 design for GDA Page 52
Table A3.10 Dose Breakdown for the Candidate for the Representative person (Infant) most exposed to atmospheric discharges at Predicted levels1 (µSv/y)
Terrestrial Pathways
Radionuclide
Inha
latio
n
Clo
ud S
hine
Gro
und
Shin
e
Gre
en v
eget
able
s (h
ome/
gard
en)
Roo
t veg
etab
les
(hom
e/ga
rden
)
Frui
t (h
ome/
gard
en)
Milk
(far
m)
Cow
Mea
t (fa
rm)
Cow
Liv
er (f
arm
)
Shee
p M
eat
(farm
)
Shee
p Li
ver
Tota
l Ter
rest
rial
Path
way
s
Ar-41 0.00E+00 3.43E-02 0.00E+00 0.00E+00 0.00E+00 0.00E+00 0.00E+00 0.00E+00 0.00E+00 0.00E+00 0.00E+00 3.43E-02 Ba-140 2.17E-07 5.22E-10 5.86E-15 3.91E-08 1.43E-10 1.36E-08 3.08E-07 7.18E-10 1.34E-10 3.36E-10 2.10E-10 5.80E-07 C-14 2.89E-01 6.84E-07 0.00E+00 4.93E-02 8.85E-01 1.77E-01 2.47E+00 6.94E-02 1.16E-02 1.85E-02 1.16E-02 3.98E+00 Co-58 4.04E-06 1.65E-07 7.25E-13 9.88E-07 2.49E-08 3.09E-07 2.56E-05 3.18E-08 5.40E-07 1.45E-08 9.05E-07 3.26E-05 Co-60 7.88E-06 1.65E-07 1.18E-11 2.84E-06 1.14E-06 9.45E-07 8.07E-05 3.12E-07 5.20E-06 1.24E-07 7.75E-06 1.07E-04 Cr-51 2.89E-09 1.14E-10 2.11E-16 8.69E-10 2.40E-13 1.47E-10 2.51E-08 2.55E-10 4.46E-11 1.22E-10 7.63E-11 2.96E-08 Cs-134 4.38E-07 2.49E-08 9.58E-13 4.96E-07 4.06E-06 4.94E-07 2.79E-05 1.30E-06 2.17E-07 6.74E-07 4.22E-07 3.60E-05 Cs-137 5.08E-07 1.44E-08 2.71E-12 6.46E-07 5.45E-06 6.03E-07 3.68E-05 1.76E-06 2.94E-07 9.83E-07 6.14E-07 4.77E-05 H-3 6.25E-03 0.00E+00 0.00E+00 1.86E-03 1.48E-02 2.96E-03 9.31E-02 6.76E-04 1.13E-04 1.80E-04 1.13E-04 1.20E-01 I-131 1.11E-03 1.56E-06 5.62E-12 3.02E-03 5.68E-03 4.08E-03 2.20E-01 7.37E-04 1.46E-04 3.00E-04 1.87E-04 2.35E-01 I-133 4.60E-04 4.20E-06 1.67E-12 1.83E-04 1.25E-05 2.85E-04 5.81E-03 3.22E-06 2.66E-06 2.60E-06 1.63E-06 6.76E-03 Kr-85 0.00E+00 3.23E-04 0.00E+00 0.00E+00 0.00E+00 0.00E+00 0.00E+00 0.00E+00 0.00E+00 0.00E+00 0.00E+00 3.23E-04 Kr-85m 0.00E+00 7.44E-05 0.00E+00 0.00E+00 0.00E+00 0.00E+00 0.00E+00 0.00E+00 0.00E+00 0.00E+00 0.00E+00 7.44E-05 Kr-87 0.00E+00 3.42E-04 0.00E+00 0.00E+00 0.00E+00 0.00E+00 0.00E+00 0.00E+00 0.00E+00 0.00E+00 0.00E+00 3.42E-04 Kr-88 0.00E+00 1.55E-03 0.00E+00 0.00E+00 0.00E+00 0.00E+00 0.00E+00 0.00E+00 0.00E+00 0.00E+00 0.00E+00 1.55E-03 Mn-54 4.93E-08 1.85E-09 3.22E-14 1.11E-08 6.90E-09 3.17E-09 5.62E-07 8.05E-09 5.35E-08 3.70E-09 9.07E-08 7.91E-07 Nb-95 3.35E-07 1.39E-08 3.04E-14 6.31E-08 9.51E-10 2.05E-08 8.68E-09 1.87E-11 3.24E-12 8.73E-12 5.47E-12 4.42E-07 Sr-89 1.91E-06 2.11E-10 5.86E-18 5.05E-07 3.58E-08 1.54E-07 5.15E-06 9.53E-09 1.63E-09 3.71E-09 2.32E-09 7.77E-06 Sr-90 3.27E-06 1.72E-11 1.64E-20 5.31E-06 6.80E-06 2.00E-06 5.49E-05 1.10E-07 1.84E-08 2.21E-08 1.38E-08 7.24E-05
1 No contribution from marine discharges.

Environment Agency – Independent dose assessment of AP-1000 design for GDA Page 53
Terrestrial Pathways
Radionuclide
Inha
latio
n
Clo
ud S
hine
Gro
und
Shin
e
Gre
en v
eget
able
s (h
ome/
gard
en)
Roo
t veg
etab
les
(hom
e/ga
rden
)
Frui
t (h
ome/
gard
en)
Milk
(far
m)
Cow
Mea
t (fa
rm)
Cow
Liv
er (f
arm
)
Shee
p M
eat
(farm
)
Shee
p Li
ver
Tota
l Ter
rest
rial
Path
way
s
Xe-131m 0.00E+00 2.32E-04 0.00E+00 0.00E+00 0.00E+00 0.00E+00 0.00E+00 0.00E+00 0.00E+00 0.00E+00 0.00E+00 2.32E-04 Xe-133 0.00E+00 7.20E-04 0.00E+00 0.00E+00 0.00E+00 0.00E+00 0.00E+00 0.00E+00 0.00E+00 0.00E+00 0.00E+00 7.20E-04 Xe-133m 0.00E+00 1.47E-04 0.00E+00 0.00E+00 0.00E+00 0.00E+00 0.00E+00 0.00E+00 0.00E+00 0.00E+00 0.00E+00 1.47E-04 Xe-135 0.00E+00 2.21E-03 0.00E+00 0.00E+00 0.00E+00 0.00E+00 0.00E+00 0.00E+00 0.00E+00 0.00E+00 0.00E+00 2.21E-03 Xe-135m 0.00E+00 2.42E-03 0.00E+00 0.00E+00 0.00E+00 0.00E+00 0.00E+00 0.00E+00 0.00E+00 0.00E+00 0.00E+00 2.42E-03 Xe-138 0.00E+00 6.23E-03 0.00E+00 0.00E+00 0.00E+00 0.00E+00 0.00E+00 0.00E+00 0.00E+00 0.00E+00 0.00E+00 6.23E-03 Zr-95 4.28E-07 5.33E-09 4.43E-14 5.30E-08 4.04E-10 1.67E-08 6.83E-09 5.59E-11 9.57E-12 2.91E-11 1.82E-11 5.11E-07 Total 2.97E-01 4.86E-02 2.36E-11 5.43E-02 9.05E-01 1.84E-01 2.79E+00 7.08E-02 1.18E-02 1.90E-02 1.19E-02 4.39E+00

Environment Agency – Independent dose assessment of AP-1000 design for GDA Page 54
Appendix 4 – Independent radiological assessment of liquid discharges Introduction A4.1 In accordance with information provided by Westinghouse Electric Company (WEC), the
AP1000 Generic Design has been assumed to be located at a coastal site and to discharge liquid radioactive wastes into the coastal environment [Ref A4.1]. The methodology used to assess doses from the predicted liquid discharges from a coastally located AP1000 power plant is described in this Appendix.
A4.2 Discharges would also be made to atmosphere from such a power plant. Assessment of the
dose from predicted atmospheric discharges is described in Appendix 3. A4.3 This work is based on predicted discharges to sea as presented by WEC. The validity of these
predictions has not been assessed. Liquid discharges to Sea A4.4 According to information presented by WEC, a coastally located AP1000 power plant would
discharge liquids at a distance of 150 m offshore into the coastal environment [Ref. A4.1]. The expected total annual activity released from all sources (including shim bleed and equipment drains, miscellaneous wastes and the turbine building) are presented [Ref. A4.1]. The expected annual releases of radionuclides are detailed in Table A4.1.
Receptor Points and Candidates for the representative person A4.5 Assumptions about the pattern of coastal land use and commercial and leisure activities
around the site were based on generic assumptions, derived from the Environment Agency Initial Radiological Assessment Methodology [Ref. A4.2] and NRPB-W41 [Ref. A4.3], to represent those likely to be the most exposed individuals to liquid discharges from the AP1000 power plant.
A4.6 In accordance with the generic site information, provided by WEC [Ref. A4.4], it has been
assumed that there would be commercial fishing in the vicinity of the AP1000 power plant, such that exposure pathways associated with fisheries and marine food consumption should be assessed.
A4.7 The following candidates for the representative person have been chosen to reflect the fishing
communities who could be potentially affected by liquid discharges from an AP1000 power plant which is located at the coast and discharges into the coastal environment:
• CRP2 Fisherman and family. For the purposes of this assessment, it is assumed that
the fishermen and their families (adults, children (10 years) and infants (1 year)) are exposed to liquid discharges from the site by spending time on the intertidal sediments in the area and consuming locally caught fish and shellfish (crustaceans and molluscs). Doses from atmospheric discharges from the AP1000 power plant were also assessed for this group via the consumption of some local produced terrestrial foodstuffs.
A4.1 Doses to the candidates for representative person most exposed to gaseous discharge to
atmosphere (CRP1) were assessed as described in Appendix 3.

Environment Agency – Independent dose assessment of AP-1000 design for GDA Page 55
Exposure Pathways A4.8 The exposure pathways considered were:
• internal exposure to radionuclides from ingestion of sea fish and marine shellfish (crustaceans and molluscs) caught from the local coastal waters;
• external doses from exposure to radionuclides incorporated into coastal sediment; and, • Other exposure pathways such as external exposure from handling fishing gear and
inhalation of sea spray, inadvertent ingestion of sediment and inadvertent ingestion of seawater.
Modelling of Environmental Concentrations A4.9 The assessment of environmental concentrations in the local and regional coastal area per
unit release rate has been performed using the PC DORIS Model, which is part of the PC CREAM software suite of radiological assessment models [Ref A4.5].
A4.10 Activity concentrations per unit release rate of radionuclides in filtered seawater
(Bq/l per TBq/y), unfiltered seawater (Bq/l per TBq/y) and marine sediment (Bq/kg per TBq/y) have been predicted using PC DORIS assuming continuous discharges for a period of 50 years.
A4.11 PC DORIS calculates the activity concentration values in local coastal waters, (‘Local Box’).
For this assessment, the Local Box chosen was the ‘North Sea Central box, whose parameters are pre-defined [Ref A4.6], and are shown in Table A4.2. This marine compartment has been chosen on the basis that it has the lowest volumetric exchange rate of those associated with potential sites, and therefore is likely to give rise to the highest doses to CRP2. The sediment concentration factors used in PC DORIS for the calculation of the environmental concentrations are shown in Table A4.3. The environmental activity concentrations per unit release rate (per Bq/y) for the North Sea Central Local Box are shown in Table A4.4.
A4.12 Concentration factors for sea fish, marine crustacea and marine molluscs are shown in
Table A4.5. The concentration factors and the filtered seawater activity concentration per unit release rate factors have been used to calculate the local sea fish, and shellfish activity concentration per unit release rate values [Table A4.6].
A4.13 The internal dose rates per unit concentration arising from internal exposure to radionuclides
through ingestion of foodstuffs or inhalation are given in Table A4.7 [Ref A4.2; A4.7]. A4.14 External effective dose rates per unit concentration arising from exposure to radionuclides
from occupancy on marine sediment (Sv/h per Bq/kg) have been derived from Reference A4.8 for all radionuclides. These data are based on a semi-infinite expanse of contaminated material. In this case, it is appropriate to apply a modifying factor of 0.5 [Ref A4.8] for exposure to radionuclides in marine sediment to take account of the fact that the beach is not a semi-infinite source. It was assumed that all radionuclides occupy the upper 0.3 m or more of the sediment profile. A sediment density of 1600 kg/m3 was assumed in the derivation of the values as recommended in Reference A4.9. The external effective dose rate factors used in the assessment are provided in Table A4.8.
A4.15 The inadvertent ingestion of sediment and seawater during beach activities have been
included in the assessment. Critical rates of ingestion have been used [Ref A4.10]. The doses have been calculated by determining the radionuclide intake from the appropriate environmental concentration by the level of intake. The radionuclide intake has been multiplied by the ingestion dose coefficient [Ref A4.7] to determine the doses.

Environment Agency – Independent dose assessment of AP-1000 design for GDA Page 56
A4.16 The inhalation of sea-spray has also been taken into account in the assessment. PC CREAM [Ref. 4.5] has been used to determine sea spray concentrations. This output has been used to calculate inhalation doses based on the appropriate age group inhalation rates and occupancy over the inter-tidal sediments.
A4.17 External skin equivalent dose rates have also been calculated, using the external beta skin
dose rate factors (Sv/h per Bq/cm2) [Ref A4.9]. The exposure pathway was handling fishing gear, which had come into contact with marine sediment incorporating radionuclides. The majority of skin dose arises from radionuclides emitting beta radiation. Beta skin dose rates have been calculated using the simple Hunt model [Ref A4.9].
Habits Data A4.18 Doses to the candidates for the representative person have been calculated using the
predicted environmental and seafood concentrations and habits data, including generic information concerning seafood intakes and occupancy of the coastal environment in the UK.
A4.19 The high rate generic intake rates for marine fish, crustaceans and molluscs presented in
NRPB-W41 [Ref. 4.10] have been used to represent the habits of CRP2. Beach occupancy, inhalation rates and inadvertent ingestion rates have also been derived from this source. Adult candidates for the representative person have been assumed to spend their working life (2000 hours per year) on inter-tidal sediments and handling fishing nets. Beach occupancy rates for other age groups are assumed to be based on leisure activities (300 and 30 hours per year for children and infants respectively). Only adults are assumed to handle fishing gear.
A4.20 Habits data applied for CRP2 are presented in Table A4.9. A4.21 It has been assumed that all occupancy and all seafood consumption is associated with the
local marine environment (North Sea Central compartment). Doses to the Candidates for the representative person A4.22 Effective doses to the infant, child and adult candidates for the representative person, CRP2
have been calculated using ingestion and inhalation dose coefficients from the Euratom Basic Safety Standards Directive [Ref A4.7], generic habits data representative of fishing communities in the UK, predicted dose rate data and predicted concentrations of radionuclides in foods and the environment. Doses to CRP2 from liquid discharges, plus the contribution from predicted atmospheric discharges are shown in Table A4.10.
A4.23 A breakdown of the effective dose to the candidates for the representative person arising from
liquid discharges by radionuclide and pathway to the fisherman at the predicted levels is provided in Table A4.11. The majority of the dose is from carbon-14 in fish and shellfish.
References A4.1 Eisenstatt, L., Environment Report, WEC, UKP-GW-GL-790, Revision 3 April 2010. A4.2 Environment Agency, Initial Radiological Assessment Methodology (Parts 1 and 2), Science
Report SC030162/SR1 (2006). A4.3 Smith, K R and Jones A L, Generalised Habit Data for Radiological Assessments, NRPB-W41,
NRPB, Chilton (2003). A4.4 Eisenstatt, L R, Westinghouse Electric Company, Characteristics of a Generic Site for a
Nuclear Power Station, UKP-GW-GL-025, Revision 1, 9 January 2010.

Environment Agency – Independent dose assessment of AP-1000 design for GDA Page 57
A4.5 Mayall A, Cabianca T, Attwood C, Fayers CA, Smith JG, Penfold J, Steadman D, Martin G, Morris TP and Simmonds JR. PC CREAM-97 (PC CREAM-98 code update) NRPB Chilton NRPB-SR-296 (EUR 17791) (1997).
A4.6 Simmonds. J.R., Lawson, G. and Mayall, A., Methodology For Assessing the Radiological
Consequences of Routine Releases of Radionuclides to the Environment. Radiation Protection 72, Report EUR 15760, 1995.
A4.7 Council Directive 96/29 Euratom of 13 May 1996, Laying Down Basic Safety Standards for the
Protection of the Health of Workers and the General Public Against the Dangers Arising from Ionising Radiation. Official Journal of the European Communities, L159, Volume 39, 29 June 1996.
A4.8 EPA (1993). External Exposure to Radionuclides in Air, Water, and Soil. Federal Guidance
Report No. 12, EPA-402-R-93-081 (Oak Ridge National Laboratory, Oak Ridge, TN; U.S. Environmental Protection Agency, Washington, DC).
A4.9 Hunt G, Simple models for prediction of external radiation exposure from aquatic pathways,
1984, Radiation Protection Dosimetry Vol. 8 No. 4 p 215-224 A4.10 Smith, K R and Jones, A L, Generalised Habit data for Radiological Assessment, NRPB-
W41, NRPB, Chilton (2003).

Environment Agency – Independent dose assessment of AP-1000 design for GDA Page 58
Table A4.1 Predicted AP1000 Power Plant Discharges Assumed in the Assessment for Liquid Discharges to Sea
Radionuclide Predicted Marine Discharges (TBq/y)
Ag-110m 2.60E-05 Ba-140 1.30E-05 C-14 3.30E-03 Ce-144 9.00E-05 Co-58 4.10E-04 Co-60 2.30E-04 Cr-51 4.60E-05 Cs-134 7.60E-06 Cs-136 9.30E-06 Cs-137 2.30E-05 Fe-55 4.90E-04 Fe-59 5.00E-06 H-3 3.34E+01 I-131 1.50E-05 I-133 2.90E-05 La-140 1.80E-05 Mn-54 3.20E-05 Na-24 3.80E-05 Nb-95 6.10E-06 Ni-63 5.40E-04 Pr-144 8.00E-05 Pu-241 8.00E-08 Ru-103 1.20E-04 Sr-89 2.40E-06 Sr-90 2.50E-07 Tc-99m 1.80E-05 Y-91 9.10E-08 Zn-65 1.00E-05 Zr-95 6.90E-06
Table A4.2 North Sea Central Local Box Parameters
Parameter Value Source of data/Comments
Release rate (TBq/y) 1.00E+00 User defined. Volume (m3) 2.00E+08
Depth (m) 10 Volumetric Exchange Rate (with North Sea central and North Sea South East regional compartment) (m3/y)
4.0E+9
Suspended Sediment Load (t/m3) 2.00E-04 Sedimentation Rate (t/m3/y) 1.00-E05
Default value from RP-72 [Table A4.5, Ref A4.6]
Sediment density (t/m3) 2.60 Bioturbation Rate (m2/y) 3.60-E05 Diffusion Rate (m2/y) 3.15-E02
Default value from RP-72 [Table A4.7 Ref A4.6]

Environment Agency – Independent dose assessment of AP-1000 design for GDA Page 59
Table A4.3 Marine Sediment Concentration Factors (Bq/t per Bq/m3)
Radionuclide Marine Sediment Concentration Factora
Ag-110m 1.00E+03 Ba-140 5.00E+03 C-14 2.00E+03 Ce-144 2.00E+06 Co-58 2.00E+05 Co-60 2.00E+05 Cr-51 5.00E+04 Cs-134 3.00E+03 Cs-136 3.00E+03 Cs-137 3.00E+03 Fe-55 5.00E+04 Fe-59 5.00E+04 H-3 1.00E+00 I-131 2.00E+01 I-133 2.00E+01 La-140 0.00E+00 Mn-54 2.00E+05 Na-24 1.00E+00 Nb-95 5.00E+05 Ni-63 1.00E+05 Pr-144 2.00E+06 Pu-241 1.00E+05 Ru-103 3.00E+02 Sr-89 1.00E+03 Sr-90 1.00E+03 Tc-99m 1.00E+02 Y-91 1.00E+07 Zn-65 2.00E+04 Zr-95 1.00E+06
a Default values from PC DORIS input file.

Environment Agency – Independent dose assessment of AP-1000 design for GDA Page 60
Table A4.4 Environmental Concentrations per Unit Release Rate to the North Sea Central Local Box
North Sea Central Local Compartment
Radionuclide Unfiltered Sea water
(Bq/l per TBq/y) Filtered Seawater(Bq/l per TBq/y)
Seaspray (Bq/m3 per TBq/y)
Sea Bed Sediment (Bq/kg per TBq/y)
Ag-110m 2.38E-01 1.98E-01 2.10E-14 2.47E-01 Ba-140 1.25E-01 6.26E-02 5.60E-15 2.02E-02 C-14 2.50E-01 1.79E-01 6.00E-17 1.36E+01 Ce-144 2.39E-01 5.96E-04 7.40E-14 1.68E+00 Co-58 2.12E-01 5.16E-03 3.00E-13 3.69E-01 Co-60 2.48E-01 6.05E-03 2.00E-13 1.02E+01 Cr-51 1.71E-01 1.56E-02 2.70E-14 1.09E-01 Cs-134 2.46E-01 1.54E-01 6.40E-15 1.65E+00 Cs-136 1.27E-01 7.95E-02 4.10E-15 1.59E-02 Cs-137 2.50E-01 1.56E-01 2.00E-14 1.19E+01 Fe-55 2.46E-01 2.24E-02 4.10E-13 5.19E+00 Fe-59 1.94E-01 1.77E-02 3.30E-15 1.99E-01 H-3 2.49E-01 2.49E-01 1.61E-01 I-131 9.71E-02 9.67E-02 5.00E-15 6.21E-04 I-133 1.60E-02 1.59E-02 1.60E-15 1.11E-05 La-140 1.40E-01 1.40E-01 8.70E-15 2.30E-02 Mn-54 2.40E-01 5.85E-03 2.60E-14 1.81E+00 Na-24 1.18E-02 1.18E-02 1.50E-15 5.51E-05 Nb-95 2.38E-01 2.36E-03 5.00E-15 5.43E-01 Ni-63 2.50E-01 1.19E-02 4.60E-13 4.13E+01 Pr-144 2.37E-04 5.91E-07 6.50E-17 7.20E-08 Pu-241 2.49E-01 1.19E-02 6.80E-17 2.15E+01 Ru-103 1.89E-01 1.79E-01 7.80E-14 1.11E-02 Sr-89 2.00E-01 1.66E-01 1.60E-15 4.26E-02 Sr-90 2.50E-01 2.08E-01 2.10E-16 4.96E+00 Tc-99m 4.86E-03 4.76E-03 3.00E-16 8.00E-07 Y-91 2.05E-01 1.02E-04 6.40E-07 3.02E-01 Zn-65 2.37E-01 4.75E-02 8.10E-15 1.15E+00 Zr-95 2.08E-01 1.04E-03 4.90E-15 3.34E-01

Environment Agency – Independent dose assessment of AP-1000 design for GDA Page 61
Table A4.5 Fish and Shellfish Concentration Factors (Bq/t per Bq/m3)
Concentration Factors (Bq/kg per Bq/l)a Radionuclide Sea fish Crustacea Mollusca
Ag-110m 5.00E+02 5.00E+03 1.00E+04 Ba-140 1.00E+01 1.00E+00 2.00E+01 C-14 2.00E+04 2.00E+04 2.00E+04 Ce-144 5.00E+01 1.00E+03 5.00E+03 Co-58 1.00E+03 5.00E+03 5.00E+03 Co-60 1.00E+03 5.00E+03 5.00E+03 Cr-51 2.00E+02 5.00E+02 8.00E+02 Cs-134 1.00E+02 3.00E+01 3.00E+01 Cs-136 1.00E+02 3.00E+01 3.00E+01 Cs-137 1.00E+02 3.00E+01 3.00E+01 Fe-55 3.00E+03 5.00E+03 3.00E+04 Fe-59 3.00E+03 5.00E+03 3.00E+04 H-3 1.00E+00 1.00E+00 1.00E+00 I-131 1.00E+01 1.00E+01 1.00E+01 I-133 1.00E+01 1.00E+01 1.00E+01 La-140 0.00E+00 0.00E+00 0.00E+00 Mn-54 4.00E+02 5.00E+02 5.00E+03 Na-24 1.00E-01 1.00E-01 3.00E-01 Nb-95 3.00E+01 2.00E+02 1.00E+03 Ni-63 1.00E+03 1.00E+03 2.00E+03 Pr-144 3.00E+01 1.00E+03 1.00E+03 Pu-241 4.00E+01 3.00E+02 3.00E+03 Ru-103 2.00E+00 1.00E+02 2.00E+03 Sr-89 2.00E+00 2.00E+00 1.00E+00 Sr-90 2.00E+00 2.00E+00 1.00E+00 Tc-99m 3.00E+01 1.00E+03 1.00E+03 Y-91 2.00E+01 1.00E+03 1.00E+03 Zn-65 1.00E+03 5.00E+04 3.00E+04 Zr-95 2.00E+01 2.00E+02 5.00E+03
a Default values taken from PC CREAM and are relative to filtered seawater.

Environment Agency – Independent dose assessment of AP-1000 design for GDA Page 62
Table A4.6 Fish and Shellfish Concentrations per Unit Release to the North Sea Central Local Box (Bq/kg per TBq/y)
Fish and Shellfish Concentrations per Unit Release (Bq/kg per TBq/y)a Radionuclide
Sea fish Crustacea Mollusca Ag-110m 9.90E+01 9.90E+02 1.98E+03 Ba-140 6.26E-01 6.26E-02 1.25E+00 C-14 3.58E+03 3.58E+03 3.58E+03 Ce-144 2.98E-02 5.96E-01 2.98E+00 Co-58 5.16E+00 2.58E+01 2.58E+01 Co-60 6.05E+00 3.03E+01 3.03E+01 Cr-51 3.12E+00 7.80E+00 1.25E+01 Cs-134 1.54E+01 4.62E+00 4.62E+00 Cs-136 7.95E+00 2.39E+00 2.39E+00 Cs-137 1.56E+01 4.68E+00 4.68E+00 Fe-55 6.72E+01 1.12E+02 6.72E+02 Fe-59 5.31E+01 8.85E+01 5.31E+02 H-3 2.49E-01 2.49E-01 2.49E-01 I-131 9.67E-01 9.67E-01 9.67E-01 I-133 1.59E-01 1.59E-01 1.59E-01 La-140 0.00E+00 0.00E+00 0.00E+00 Mn-54 2.34E+00 2.93E+00 2.93E+01 Na-24 1.18E-03 1.18E-03 3.54E-03 Nb-95 7.08E-02 4.72E-01 2.36E+00 Ni-63 1.19E+01 1.19E+01 2.38E+01 Pr-144 1.77E-05 5.91E-04 5.91E-04 Pu-241 4.76E-01 3.57E+00 3.57E+01 Ru-103 3.58E-01 1.79E+01 3.58E+02 Sr-89 3.32E-01 3.32E-01 1.66E-01 Sr-90 4.16E-01 4.16E-01 2.08E-01 Tc-99m 1.43E-01 4.76E+00 4.76E+00 Y-91 2.04E-03 1.02E-01 1.02E-01 Zn-65 4.75E+01 2.38E+03 1.43E+03 Zr-95 2.08E-02 2.08E-01 5.20E+00

Environment Agency – Independent dose assessment of AP-1000 design for GDA Page 63
Table A4.7 Internal Committed Dose Factors for Exposure via Inhalation and Ingestion
ICRP Lung Class Inhalation Sv/Bq Ingestion (Sv/Bq) Radionuclide
A C I A C I A C I
Ag-110m M 7.60E-09 1.20E-08 2.80E-08 2.80E-09 5.20E-09 1.40E-08 Ba-140 M 5.10E-09 7.60E-09 2.00E-08 2.60E-09 5.80E-09 1.80E-08 C-14 V 2.00E-09 2.80E-09 6.60E-09 5.80E-10 8.00E-10 1.60E-09 Ce-144 M 3.60E-08 5.50E-08 1.60E-07 5.20E-09 1.10E-08 3.90E-08 Co-58 M 1.60E-09 2.40E-09 6.50E-09 7.40E-10 1.70E-09 4.40E-09 Co-60 M 1.00E-08 1.50E-08 3.40E-08 3.40E-10 1.10E-08 2.70E-08 Cr-51 S 3.70E-11 6.60E-11 2.10E-10 3.80E-11 7.80E-11 2.30E-10 Cs-134 F 6.60E-09 5.30E-09 7.30E-09 1.90E-08 1.40E-08 1.60E-08 Cs-136 F 1.20E-09 2.00E-09 5.20E-09 3.00E-09 4.40E-09 9.50E-09 Cs-137 F 4.60E-09 3.70E-09 5.40E-09 1.30E-08 1.00E-08 1.20E-08 Fe-55 M 3.80E-10 6.20E-10 1.40E-09 3.30E-10 1.10E-09 2.40E-09 Fe-59 M 3.70E-09 5.50E-09 1.30E-08 1.80E-09 4.70E-09 1.30E-08 H-3 V 1.80E-11 2.30E-11 4.80E-11 1.80E-11 2.30E-11 4.80E-11 I-131 F 7.40E-09 1.90E-08 7.20E-08 2.20E-08 5.20E-08 1.80E-07 I-133 F 1.50E-09 3.80E-09 1.80E-08 4.30E-09 1.00E-08 4.40E-08 La-140 M 1.10E-09 2.00E-09 6.30E-09 2.00E-09 4.20E-09 1.30E-08 Mn-54 M 1.50E-09 2.40E-09 6.20E-09 7.10E-10 1.30E-09 3.10E-09 Na-24 F 2.70E-10 5.70E-10 1.80E-09 4.30E-10 7.70E-10 2.30E-09 Nb-95 M 1.50E-09 2.20E-09 5.20E-09 5.80E-10 1.10E-09 3.20E-09 Ni-63 M 4.80E-10 7.00E-10 1.90E-09 1.50E-10 2.80E-10 8.40E-10 Pr-144 S 1.80E-11 3.40E-11 1.20E-10 5.10E-11 9.50E-11 3.50E-10 Pu-241 M 9.00E-07 8.30E-07 9.70E-07 4.80E-09 5.10E-09 5.70E-09 Ru-103 M 2.40E-09 3.50E-09 8.40E-09 7.30E-10 1.50E-09 4.60E-09 Sr-89 M 6.10E-09 9.10E-09 2.40E-08 2.60E-09 5.80E-09 1.80E-08 Sr-90 M 3.60E-08 5.10E-08 1.10E-07 2.80E-08 6.00E-08 7.30E-08 Tc-99m M 1.90E-11 3.40E-11 9.90E-11 2.20E-11 4.30E-11 1.30E-10 Y-91 S 8.90E-09 1.30E-08 3.40E-08 2.40E-09 5.20E-09 1.80E-08 Zn-65 M 1.60E-09 2.40E-09 6.50E-09 3.90E-09 6.40E-09 1.60E-08 Zr-95 M 4.80E-09 6.80E-09 1.60E-08 9.50E-10 1.90E-09 5.60E-09
A = Adult, C = Child, I = Infant

Environment Agency – Independent dose assessment of AP-1000 design for GDA Page 64
Table A4.8 External Effective Dose Rate Factors for Occupancy Over Marine Sediment
External Effective Dose Rate Factor for Exposure over Sedimentb,c
Gamma fishing gear
Beta skin dose from handling gear
Radionuclide
aSv/s per Bq/m3 uSv/h per TBq/y uSv/h per TBq/y uSv/h per TBq/y
Ag-110m 9.19E-17 6.54E-05 1.72E-06 0.00E+00 Ba-140 5.52E-18 3.21E-07 9.37E-09 5.46E-07 C-14 7.20E-23 2.82E-09 0.00E+00 0.00E+00 Ce-144 3.84E-19 1.86E-06 2.23E-07 6.19E-05 Co-58 3.19E-17 3.39E-05 9.13E-07 0.00E+00 Co-60 8.68E-17 2.55E-03 6.46E-05 0.00E+00 Cr-51 9.34E-19 2.93E-07 8.73E-09 0.00E+00 Cs-134 5.07E-17 2.41E-04 6.48E-06 2.32E-05 Cs-136 7.12E-17 3.26E-06 8.74E-08 1.92E-07 Cs-137 4.02E-21 1.38E-07 1.70E-05 2.56E-04 Fe-55 0.00E+00 0.00E+00 2.22E-08 0.00E+00 Fe-59 4.09E-17 2.34E-05 6.00E-07 2.01E-06 H-3 0.00E+00 0.00E+00 0.00E+00 0.00E+00 I-131 1.16E-17 2.07E-08 6.01E-10 1.03E-08 I-133 1.95E-17 6.23E-10 1.71E-11 3.93E-10 La-140 8.06E-17 5.34E-06 1.35E-07 1.07E-06 Mn-54 2.76E-17 1.44E-04 3.83E-06 0.00E+00 Na-24 1.52E-16 2.41E-08 5.75E-10 2.63E-09 Nb-95 2.51E-17 3.93E-05 1.05E-06 0.00E+00 Ni-63 0.00E+00 0.00E+00 0.00E+00 0.00E+00 Pr-144 1.35E-18 2.80E-13 5.82E-15 2.51E-12 Pu-241 3.16E-23 1.96E-09 3.30E-10 0.00E+00 Ru-103 1.47E-17 4.70E-07 1.33E-08 1.08E-07 Sr-89 4.86E-20 5.96E-09 9.12E-12 2.15E-06 Sr-90 3.77E-21 5.39E-08 2.11E-11 1.61E-04 Tc-99m 2.95E-18 6.80E-12 2.55E-13 0.00E+00 Y-91 1.74E-19 1.51E-07 2.77E-09 1.57E-05 Zn-65 1.98E-17 6.56E-05 1.70E-06 0.00E+00 Zr-95 2.42E-17 2.33E-05 6.25E-07 3.35E-06 a Derived from data in FGR-12 [Ref A4.8] b Assuming a sediment density of 1600 kg/m3, C After applying a modifying factor of 0.5 to take account for time spent on the shoreline or top of
beach

Environment Agency – Independent dose assessment of AP-1000 design for GDA Page 65
Table A4.9 Habit Data Profiles for the Candidates for the Representative Person for Liquid Discharges to the Marine Environment
Terrestrial Food Consumption Rates (kg/y or l/y)
Marine Food Consumption Rates
(kg/y) Handling and Occupancy (h/y)
Age
Gro
up
Gre
en v
eg to
tal
Roo
t veg
tota
l
Frui
t tot
al
Milk
Cow
mea
t*
Cow
live
r*
Shee
p m
eat
Shee
p Li
ver
Fish
(sea
)
Cru
stac
eans
Mol
lusc
s
Han
dlin
g fis
hing
ge
ar
Han
dlin
g se
dim
ent
Inte
rtid
al
occu
panc
y ov
er
mud
Exte
rnal
oc
cupa
ncy
Inte
rnal
oc
cupa
ncy
(use
d)
Adult 35.0 60.0 20.0 95.0 15.0 2.8 8.0 2.8 100.0 20.0 20.0 2000 2000 2000 876 2380.0Child 15.0 50.0 15.0 110.0 15.0 1.5 4.0 1.5 20.0 5.0 5.0 300 876 7008.0Infant 5.0 15.0 9.0 130.0 3.0 0.5 0.8 0.5 5.0 0.0 0.0 30 876 7008.0 Table A4.10 Doses to the Candidates for the Representative Person (CRP2, from Fisherman Family) for Liquid Discharges at Predicted levels and Contribution From Atmospheric Discharges (µSv/y)
Dose (μSv/y)
Atmospheric Discharges Habits Profile Age
Stack 1 Stack 2
Marine Discharges Total
Adult 1.60 0.01 0.98 2.59 Child 1.87 0.01 0.29 2.17
CRP2 - local fisherman (high
marine exposure) Infant 2.13 0.01 0.10 2.23

Environment Agency – Independent dose assessment of AP-1000 design for GDA Page 66
Table A4.11 Dose by Radionuclide and Pathway for Adult Candidates for the Representative Person (CRP2) based on Predicted Liquid Discharges to the Marine Environment from the UK EPR Nuclear Power Plant and Generic Habits Data (μSv/y)
Marine Pathways Dose (μSv/y)
Radionuclide Sum of Ingestion
of Fish
Sum of Ingestion of Crustaceans
Sum of Ingestion
of Molluscs
Sum of External
sediments
Sum of Other
marine pathways
Total Marine
Pathways
Ag-110m 7.21E-04 1.44E-03 2.88E-03 3.40E-06 9.83E-08 5.05E-03 Ba-140 2.12E-06 4.23E-08 8.46E-07 8.35E-09 1.66E-08 3.03E-06 C-14 6.85E-01 1.37E-01 1.37E-01 1.86E-08 4.55E-07 9.59E-01 Ce-144 1.39E-06 5.58E-06 2.79E-05 3.34E-07 1.13E-05 4.65E-05 Co-58 1.57E-04 1.57E-04 1.57E-04 2.78E-05 7.82E-07 4.98E-04 Co-60 4.73E-05 4.73E-05 4.73E-05 1.17E-03 2.97E-05 1.34E-03 Cr-51 5.45E-07 2.73E-07 4.36E-07 2.70E-08 9.54E-10 1.28E-06 Cs-134 2.22E-04 1.33E-05 1.33E-05 3.66E-06 4.71E-07 2.53E-04 Cs-136 2.22E-05 1.33E-06 1.33E-06 6.06E-08 6.98E-09 2.49E-05 Cs-137 4.66E-04 2.80E-05 2.80E-05 6.34E-09 1.26E-05 5.35E-04 Fe-55 1.09E-03 3.62E-04 2.17E-03 0.00E+00 4.86E-08 3.62E-03 Fe-59 4.78E-05 1.59E-05 9.56E-05 2.34E-07 2.70E-08 1.60E-04 H-3 1.50E-03 2.99E-04 2.99E-04 0.00E+00 7.57E-06 2.10E-03 I-131 3.19E-05 6.38E-06 6.38E-06 6.22E-10 1.64E-08 4.47E-05 I-133 1.98E-06 3.97E-07 3.97E-07 3.62E-11 1.02E-09 2.78E-06 La-140 0.00E+00 0.00E+00 0.00E+00 1.92E-07 4.58E-08 2.38E-07 Mn-54 5.32E-06 1.33E-06 1.33E-05 9.21E-06 2.49E-07 2.94E-05 Na-24 1.93E-09 3.86E-10 1.16E-09 1.83E-09 3.40E-10 5.64E-09 Nb-95 2.50E-08 3.34E-08 1.67E-07 4.79E-07 1.33E-08 7.18E-07 Ni-63 9.64E-05 1.93E-05 3.86E-05 0.00E+00 3.79E-08 1.54E-04 Pr-144 7.23E-12 4.82E-11 4.82E-11 4.48E-14 8.86E-13 1.05E-10 Pu-241 1.83E-08 2.74E-08 2.74E-07 3.13E-13 1.16E-10 3.20E-07 Ru-103 3.14E-06 3.14E-05 6.27E-04 1.13E-07 3.75E-08 6.62E-04 Sr-89 2.07E-07 4.14E-08 2.07E-08 2.86E-11 1.09E-08 2.80E-07 Sr-90 2.91E-07 5.82E-08 2.91E-08 2.69E-11 8.19E-08 4.60E-07 Tc-99m 5.65E-09 3.77E-08 3.77E-08 2.45E-13 9.71E-13 8.11E-08 Y-91 4.46E-11 4.46E-10 4.46E-10 2.75E-11 2.88E-09 3.85E-09 Zn-65 1.85E-04 1.85E-03 1.11E-03 1.31E-06 3.90E-08 3.15E-03 Zr-95 1.36E-08 2.73E-08 6.82E-07 3.21E-07 5.55E-08 1.10E-06 Total 6.90E-01 1.41E-01 1.45E-01 1.22E-03 6.37E-05 9.77E-01

Environment Agency – Independent dose assessment of AP-1000 design for GDA Page 67
Appendix 5 – Independent radiological assessment of collective doses A5.1 Collective dose provides an assessment of the radiation exposure in a population. It is the
time integral of the distribution of individual doses within a population. The collective dose may be calculated for different populations and time periods. It has been agreed that the collective doses to the populations of the UK, Europe (the EC population included in PC CREAM 98 population grids) and the World, truncated at 500 years, should be estimated for authorisation purposes [Ref. A5.1]. Such an estimate of collective dose has also been identified as a requirement in the Environment Agency’s Process and Information Document for Generic Assessment of Candidate Nuclear Power Plants [Ref. A5.2]
Calculation of Collective Doses A5.1 Collective doses were calculated for the UK, European and World populations, truncated at
500 years, in accordance with the guidance identified above from Defra [Ref A5.3] for discharges to atmosphere and from discharges to the marine environment.
A5.2 Collective doses to the UK, Europe and World populations were estimated for the expected
discharges and for a range of potential sites, using PC CREAM [Ref. A5.4]. Collective doses are dependent on the release point. The assessment was made at 5 UK coastal nuclear sites (Dungeness, Hartlepool, Heysham, Hinkley Point and Sizewell). A range of collective doses arising from atmospheric and liquid discharges for representative annual discharges and annual limit discharges were calculated. This is the same approach as adopted by Westinghouse.
A5.3 The annual expected discharges to atmosphere and to the marine environment used in the
calculations are shown in Table 1 and Table 3. Assessed Collective Doses A5.4 A summary of collective doses are given in Tables A5.1 to A5.4. The tables contain the
distribution of doses (min, average and max values) to UK, Europe and World populations due to atmospheric and liquid discharges calculated from 5 UK coastal nuclear sites (Dungeness, Hartlepool, Heysham, Hinkley Point and Sizewell).
A5.5 The average collective doses from the representative atmospheric discharges from an
AP1000 power plant have been estimated to be: 0.26 manSv/y to the UK, 1.97 manSv/y to Europe, and 12.4 manSv/y to the World. The average collective doses due to annual limit discharges are estimated to be 0.41 manSv, 3.07 manSv and 19.4 manSv to UK, Europe and the World respectively. The majority of the atmospheric collective doses have been predicted to arise from carbon-14.
A5.6 The average collective doses from representative discharges to sea from a coastally located
AP1000 power plant have been estimated to be 0.0008 manSv/y to the UK, 0.0039 manSv/y to Europe, and 0.053 manSv/y to the World. The average collective doses due to limit discharges are 0.0013 manSv/y, 0.0061 manSv/y and 0.84 manSv/y for UK, Europe and the World respectively. The majority of the marine collective dose arises from a range of radionuclides, depending on the site assumptions considered. These estimates of collective dose were very close to those reported by Westinghouse in their assessment – with small differences due to rounding.

Environment Agency – Independent dose assessment of AP-1000 design for GDA Page 68
A5.7 Average per caput doses (i.e. average individual doses derived from collective dose) were calculated for UK, European and World populations, using the calculated collective doses and the population data for UK, Europe and the World (Table A5.5).
A5.8 Average per caput doses are presented in Table A5.6 (truncated at 500 years). At predicted
levels, the average per caput dose to the UK from the AP1000 power plant was 4.7 nSv, those to Europe were less than 3nSv and to the World were around 1 nSv. Most of this arose from atmospheric discharges.
A5.9 The UK regulatory and advisory agencies have agreed that the risks associated with annual
average per caput doses in the nanosieverts range may considered to be miniscule and should be ignored in the authorisation decision making processes [Ref A5.1]. The results of this study show that the per-caput doses are a few nanosieverts or less, and may therefore be considered as trivial.
References A5.1 Joint Environment Agencies, Principles for the Assessment of Prospective Public Doses
(Interim Guidance), (December 2002). A5.2 Environment Agency. The Environment Agency’s Process and Information Document for
Generic Assessment of Candidate Nuclear Power Plant Designs version 1 (http://publications.environment-agency.gov.uk/pdf/GEHO0107BLTN-e-e.pdf) (2007
A5.3 Defra, The Radioactive Substances (Basic Safety Standards) (England and Wales) Direction
2000. Defra (May 2000). A5.4 Mayall A, Cabianca T, Attwood C, Fayers CA, Smith JG, Penfold J, Steadman D, Martin G,
Morris TP and Simmonds JR. PC CREAM-97 (PC CREAM-98 code update) NRPB Chilton NRPB-SR-296 (EUR 17791) (1997).
A5.5 IAEA, Principles for the exemption of radiation sources and practices from regulatory control.
IAEA Safety Series No.89 (1988). A5.6 IAEA, Clearance of materials resulting from the use of radionuclides in medicine, industry and
research. IAEA TECDOC-1000 (1998).

Environment Agency – Independent dose assessment of AP-1000 design for GDA Page 69
Table A5.1 Collective Dose Data for Representative Atmospheric Discharges Truncated at 500 Years
Collective Dose (ManSv)
UK EU World Radio-nuclides Min Mean Max Min Mean Max Min Mean Max
H-3 2.00E-03 2.64E-03 3.20E-03 6.34E-03 6.94E-03 7.64E-03 6.91E-03 7.51E-03 8.21E-03
C-14 2.22E-01 2.56E-01 2.82E-01 1.79E+00 1.95E+00 2.19E+00 1.22E+01 1.24E+01 1.26E+01
Ar-41 0.00E+00 8.34E-06 3.20E-05 0.00E+00 9.32E-06 2.70E-05 0.00E+00 9.32E-06 2.70E-05
Co-58 8.30E-08 1.13E-07 1.50E-07 1.60E-07 1.84E-07 2.00E-07 1.60E-07 1.84E-07 2.00E-07
Co-60 1.30E-05 1.70E-05 2.20E-05 2.60E-05 2.94E-05 3.20E-05 2.60E-05 2.94E-05 3.20E-05
Kr-85 1.06E-04 1.26E-04 1.47E-04 4.66E-04 4.88E-04 5.16E-04 9.27E-07 2.07E-03 3.38E-03
Sr-90 8.60E-07 1.13E-06 1.30E-06 4.10E-06 5.24E-06 5.90E-06 4.10E-06 5.24E-06 5.90E-06
I-131 6.20E-05 1.38E-04 2.50E-04 6.90E-05 9.42E-05 1.30E-04 6.90E-05 9.42E-05 1.30E-04
I-133 1.60E-05 2.68E-05 4.30E-05 2.40E-05 3.10E-05 4.80E-05 2.40E-05 3.10E-05 4.80E-05
Xe-133 5.80E-05 7.38E-05 9.00E-05 1.20E-04 1.38E-04 1.50E-04 1.20E-04 1.38E-04 1.50E-04
Cs-137 4.60E-06 5.84E-06 7.10E-06 1.40E-05 1.52E-05 1.60E-05 1.40E-05 1.52E-05 1.60E-05Total 0.22 0.26 0.28 1.81 1.97 2.13 12.3 12.4 12.6
Table A5.2 Collective Dose Data for Annual Limit Atmospheric Discharges Truncated at 500 Years
Collective Dose (ManSv)
UK EU World Radio-nuclides Min Mean Max Min Mean Max Min Mean Max
H-3 3.21E-03 4.27E-03 5.21E-03 1.01E-02 1.11E-02 1.21E-02 1.10E-02 1.20E-02 1.30E-02
C-14 3.47E-01 3.99E-01 4.37E-01 2.83E+00 3.07E+00 3.33E+00 1.92E+01 1.94E+01 1.97E+01
Ar-41 0.00E+00 1.25E-05 4.80E-05 0.00E+00 1.40E-05 4.00E-05 0.00E+00 1.40E-05 4.00E-05
Co-58 1.40E-07 1.84E-07 2.40E-07 2.60E-07 3.02E-07 3.30E-07 2.60E-07 3.02E-07 3.30E-07
Co-60 2.00E-05 2.68E-05 3.50E-05 4.10E-05 4.56E-05 4.90E-05 4.10E-05 4.56E-05 4.90E-05
Kr-85 1.78E-04 2.08E-04 2.38E-04 7.64E-04 8.00E-04 8.44E-04 5.47E-03 5.51E-03 5.55E-03
Sr-90 1.30E-06 1.76E-06 2.00E-06 6.40E-06 8.26E-06 9.40E-06 6.40E-06 8.26E-06 9.40E-06
I-131 9.00E-05 2.02E-04 3.60E-04 1.00E-04 1.36E-04 1.90E-04 1.00E-04 1.36E-04 1.90E-04
I-133 2.60E-05 4.52E-05 7.30E-05 4.10E-05 5.22E-05 8.00E-05 4.10E-05 5.22E-05 8.00E-05
Xe-133 8.70E-05 1.09E-04 1.30E-04 1.80E-04 2.06E-04 2.30E-04 1.80E-04 2.06E-04 2.30E-04
Cs-137 6.90E-06 8.74E-06 1.10E-05 2.10E-05 2.28E-05 2.40E-05 2.10E-05 2.28E-05 2.40E-05
Total 0.35 0.40 0.44 2.84 3.08 3.34 19.2 19.5 19.7 Note: The doses to World population from discharges of H-3, C-14 and Kr-82 were derived by adding the ‘first pass’ dispersion dose for Europe to the global dose component for World obtained from PC CREAM in accordance with the methodology adopted by WEC. The maximum collective dose to UK population is due to discharges from Sizewell, while the highest collective doses to Europe and the World are due to Dungeness and Sizewell. The lowest collective dose to UK population is due to discharges from the Dungeness site, while discharges from Heysham and Hartlepool are responsible the lowest doses to EU and World populations. All values from PC CREAM.

Environment Agency – Independent dose assessment of AP-1000 design for GDA Page 70
Table A5.3 Collective Dose Data for Representative Liquid Discharges Truncated at 500 Years
Collective Dose (ManSv)
UK EU World Nuclide min mean max min mean max min mean max
H-3 9.60E-06 1.37E-05 1.90E-05 5.80E-05 7.04E-05 7.80E-05 1.50E-03 1.50E-03 1.50E-03
C-14 4.80E-04 7.86E-04 1.10E-03 2.80E-03 3.72E-03 4.50E-03 5.00E-02 5.12E-02 5.20E-02
Fe-55 1.30E-06 4.14E-06 1.10E-05 4.90E-06 1.45E-05 3.10E-05 4.90E-06 1.47E-05 3.20E-05
Co-58 1.80E-07 5.84E-07 1.30E-06 6.00E-07 1.57E-06 2.60E-06 6.20E-07 1.57E-06 2.60E-06
Co-60 1.60E-06 5.18E-06 1.40E-05 6.80E-06 1.37E-05 2.10E-05 6.90E-06 1.43E-05 2.20E-05
Ni-63 1.40E-07 2.90E-07 5.50E-07 2.00E-07 1.37E-06 2.50E-06 2.00E-07 1.50E-06 2.70E-06
Sr-90 3.40E-11 1.43E-10 2.80E-10 1.70E-10 5.06E-10 7.30E-10 1.90E-10 5.94E-10 8.60E-10
Cs-137 6.90E-08 2.52E-07 4.80E-07 3.60E-07 9.36E-07 1.40E-06 4.00E-07 1.12E-06 1.70E-06
Ce-144 1.40E-06 7.20E-06 1.80E-05 4.50E-06 2.32E-05 4.70E-05 4.60E-06 2.34E-05 4.70E-05
Pu-241 1.80E-10 5.88E-10 1.70E-09 6.70E-10 2.14E-09 4.80E-09 6.70E-10 2.18E-09 4.90E-09
Total 0.0005 0.0008 0.0012 0.0029 0.0039 0.0047 0.052 0.053 0.054 Table A5.4 Collective Dose Data for Annual Limit Liquid Discharges Truncated at 500 Years
Collective Dose (ManSv) 500 years
UK EU World Nuclide min min min min min min min min min
H-3 1.60E-05 2.36E-05 3.30E-05 1.00E-04 1.18E-04 1.30E-04 2.60E-03 2.60E-03 2.60E-03
C-14 7.50E-04 1.27E-03 1.80E-03 4.50E-03 5.94E-03 7.20E-03 8.00E-02 8.14E-02 8.30E-02
Fe-55 2.00E-06 6.20E-06 1.60E-05 7.70E-06 2.27E-05 4.90E-05 7.70E-06 2.27E-05 4.90E-05
Co-58 3.00E-07 9.64E-07 2.10E-06 9.90E-07 2.58E-06 4.20E-06 1.00E-06 2.60E-06 4.30E-06
Co-60 2.60E-06 8.54E-06 2.30E-05 1.10E-05 2.28E-05 3.60E-05 1.10E-05 2.34E-05 3.60E-05
Ni-63 2.00E-07 4.20E-07 8.00E-07 2.80E-07 1.98E-06 3.60E-06 2.90E-07 2.18E-06 3.90E-06
Sr-90 5.20E-11 2.20E-10 4.30E-10 2.70E-10 7.70E-10 1.10E-09 2.90E-10 9.16E-10 1.30E-09
Cs-137 1.10E-07 4.18E-07 7.90E-07 6.00E-07 1.58E-06 2.40E-06 6.60E-07 1.85E-06 2.80E-06
Ce-144 3.10E-07 1.64E-06 4.10E-06 1.00E-06 5.36E-06 1.10E-05 1.10E-06 5.38E-06 1.10E-05
Pu-241 3.40E-10 1.10E-09 3.20E-09 1.20E-09 3.92E-09 8.80E-09 1.20E-09 4.02E-09 9.00E-09
Total 0.0008 0.0013 0.0019 0.0046 0.0061 0.0074 0.082 0.084 0.086 Note: The doses due to H-3 and C-14 are summations of doses from the first pass and global circulation components of the radionuclides. The maximum dose to UK population is due to discharges from the Heysham site, while Sizewell discharges are responsible for the maximum doses to EU and World populations. The lowest calculated collective doses to all population groups are due to discharges from the Hinkley Point site. All values obtained from PC CREAM.

Environment Agency – Independent dose assessment of AP-1000 design for GDA Page 71
Table A5.5 Population Data
Region Population
UK 5.50E+07 Europe 7.00E+08 World 1.00E+10
Table A5.6 Average per Caput Doses at Predicted Discharge Levels Truncated to 500 years (Sv/y of discharge)
Region Aerial Release Marine Discharges
UK 4.69E-09 2.36E-11 Europe 2.78E-09 8.71E-12 World 1.24E-09 8.40E-12

Environment Agency – Independent dose assessment of AP-1000 design for GDA Page 72
Appendix 6 – Independent radiological assessment of doses from potential short term releases Introduction A6.1 The information provided by WEC includes an assessment of the potential short-term
gaseous discharges that may arise, e.g. during routine maintenance operations of the plant. The objective was to determine the potential for higher doses if short duration peak activity concentrations in air and foodstuffs coincide with particular agricultural or other seasonal variations. The timescale of releases to the marine environment are relatively less important; due to the effect of the limitation in pumping capacity of radioactive liquid discharge tanks and the distance at which releases occur from the shore. The methodology used to assess doses from short-term planned discharges to atmosphere is described in this Appendix.
A6.2 The radiological assessments undertaken by WEC and in this independent assessment are
based on the methods outlined in Reference A6.1 and use the ADMS 4.1 atmospheric dispersion model [Ref. A6.2].
A6.3 This assessment is based on the predicted maximal monthly discharge values, as presented
by WEC. The validity of the discharge predictions themselves has not been assessed. Short-term Discharges to Atmosphere A6.4 The predicted short-term discharge rates and the total activities discharged over a 30 minute
release period are presented in Table A6.1. In accordance with information provided by WEC, these releases are assumed to occur from a 55.7 m high stack (main plant vent) located on a building with dimensions 70 x 43 x 50 m. The building was assumed to be downwind of the stack in order to provide a conservative estimate of doses.
A6.5 The ADMS 4.1 dispersion model was used to estimate activity concentrations in the air and
deposited on the ground at potential receptor locations of 100 m and 500 m. These distances were chosen to maintain consistency with those used in the assessment of continuous discharges, as outlined in Appendix 3. Dry and wet deposition was modelled simultaneously, using the default deposition velocities specified within the ADMS 4.1 model set out in Table A6.2. Meteorological data were defined on the basis of recommendations set out in Reference A6.1, and are summarised in Table A6.3.
Receptor Points and Habit Data A6.6 The most exposed members of the public from short-term discharges were assumed to be
located at a habitation at 100 m from the point of release, which is assumed to be the location of the candidate representative person from continuous atmospheric discharges, as outlined in Appendix 3.
A6.7 Activity concentrations were determined at ground level at 100 and 500 m downwind of the
release point. The activity concentrations in air, related to the defined release rates, and the deposition rate and cumulative deposition were determined using ADMS 4.1, and are presented in Table A6.4.
A6.8 It is assumed that the most exposed members of the public remain at this location throughout
the duration of passage of the short-term release plume (30 minutes) outdoors. No location

Environment Agency – Independent dose assessment of AP-1000 design for GDA Page 73
factor has therefore been applied to doses from irradiation from the cloud. An indoor occupancy of 0.9 and a location factor of 0.1 have been applied to calculation of external dose over a year following deposition, in accordance with the approach adopted in NRPB-W54 [Ref. 6.1].
A6.9 Doses from food pathways are based on similar receptor points and habits as for the
continuous discharge assessment.. Green and root vegetables and fruit have been assumed to be sourced at 100 m from the discharge; other agricultural products have been assumed to be from 500 m.
Exposure Pathways A6.10 The exposure pathways considered were:
• Internal exposure from inhalation of radionuclides from the plume. The secondary inhalation of radionuclides which have been deposited on the ground and resuspended was not included, since the release did not include radionuclides for which this pathway is likely to provide a significant contribution to dose [Ref. A6.1].;
• External dose from exposure to radionuclides in the short-term release plume (‘cloudshine’) and beta and gamma radiation from radionuclides deposited on the ground (’groundshine’);
• Internal dose from radionuclides from ingestion of local fruit and vegetable produce, cow and sheep meat and cow milk.
Doses from Short-term Releases
A6.11 Inhalation rates for adults, children and infants were derived from those in Reference A6.3.
Activity concentrations in air at 100 m were used and assumed to be equivalent indoors and outdoors. Dose coefficients for inhalation and ingestion were taken from the Euratom Basic Safety Standards [Ref. A6.4] and external dose factors for ‘cloudshine’ were taken from FGR-12 [Ref. A6.5]. These values are presented in Table A6.5 and A6.6 respectively.
A6.12 The doses arising from deposited activity were estimated on the basis of data presented in
Reference 6.1. The external doses arising from deposition were based on the integrated effective doses after an integrated deposit of 1 Bq m-2 over 1 year and the total deposit at 100 m.
A6.13 Doses arising from terrestrial food pathways were estimated on the basis of food
concentration factors derived from the equilibrium factors provided in the FARMLAND model incorporated within PC CREAM [Ref. A6.6]. These factors were divided by the number of seconds in one year, in a manner consistent with that applied by WEC. These factors are presented in Table A6.7.
A6.14 The estimated dose arising from a single short-term release, from the exposure pathways
above, is of the order of 13 µSv to an adult and around 11 µSv to other age groups. Inhalation has been predicted to be the primary exposure pathway, and carbon-14 was found to be the main contributor to inhalation dose, as indicated in Table A6.8.
A6.15 Reference A6.1 recommends that a first order approximation of the impact of multiple
releases may be made by multiplying the dose estimated for a single release by a factor of 10.

Environment Agency – Independent dose assessment of AP-1000 design for GDA Page 74
References A6.1 Smith, J G, Bedwell, P, Walsh C and Haywood, S M, A Methodology for Assessing Doses
from Short-term Planned Discharges to Atmosphere, NRPB-W54, NRPB, Chilton (Issue 5, 2006).
A6.2 ADMS 4, Industrial Air Pollution Model, http://www.cerc.co.uk/software/adms4.htm A6.3 Smith, K R and Jones A L, Generalised Habit Data for Radiological Assessments, NRPB-W41,
NRPB, Chilton (2003). A6.4 Council Directive 96/29 Euratom of 13 May 1996, Laying Down Basic Safety Standards for the
Protection of the Health of Workers and the General Public Against the Dangers Arising from Ionising Radiation. Official Journal of the European Communities, L159, Volume 39, 29 June 1996.
A6.5 EPA (1993). External Exposure to Radionuclides in Air, Water, and Soil. Federal Guidance
Report No. 12, EPA-402-R-93-081 (Oak Ridge National Laboratory, Oak Ridge, TN; U.S. Environmental Protection Agency, Washington, DC).
A6.6 Mayall A, Cabianca T, Attwood C, Fayers CA, Smith JG, Penfold J, Steadman D, Martin G,
Morris TP and Simmonds JR. PC CREAM-97 (PC CREAM-98 code update) NRPB Chilton NRPB-SR-296 (EUR 17791) (1997).

Environment Agency – Independent dose assessment of AP-1000 design for GDA Page 75
Table A6.1 Predicted Short-Term Discharges to Atmosphere
Radionuclide Total release in 30 minutes (TBq)
Emission rate over 30 minutes (TBq/s)
H-3 2.42E-01 1.34E-04
C-14 8.30E-02 4.61E-05
Ar-41 1.71E-01 9.50E-05
Co-60 2.69E-07 1.49E-10 Kr-85 1.27E+00 7.05E-04 Sr-90 3.70E-08 2.06E-11 I-131 1.73E-05 9.61E-09 Xe-133 1.87E-01 1.04E-04 Cs-137 1.11E-07 6.17E-11 Other radio-iodines (I-133) 3.23E-05 1.79E-08
Other noble gases (Kr-85) 5.73E-01 3.18E-04
Other particulates (Co-58) 6.03E-07 3.35E-10
Table A6.2 Deposition and Washout Coefficients
Radionuclide Deposition Velocity (m/s) Washout Coefficient
H-3 0 0 C-14 0 0 Ar-41 0 0 Co-60 0.001 0.0001 Kr-85 0 0 Sr-90 0.001 0.0001 I-131 0.01 0.0001 Xe-133 0 0 Cs-137 0.001 0.0001 Other radiodiodides (I-133) 0.010 0.0001 Other noble gases (Kr-85) 0 0 Other particulates (Co-58) 0.001 0.0001
*washout coefficient determined using ADMS default values for constants A and B and based on 0.1mm/hr rainfall Table A6.3 Meteorological Assumptions
Condition Value Rainfall 0.1mm/hour Wind speed 3m/s Boundary layer height 800m reciprocal of the Monin-Obukhov length
0

Environment Agency – Independent dose assessment of AP-1000 design for GDA Page 76
Table A6.4 Activity Concentrations for Short-term Release Rates 100 m 500 m
Nuclide Air Concentration
(Bq/m3)
Total deposition (Bq/m2/s)
Total deposition for
a 30 minute release (Bq/m2)
Air Concentration
(Bq/m3)
Total deposition (Bq/m2/s)
Total deposition
for a 30 minute release (Bq/m2)
H-3 5.80E+03 0.00E+00 0.00E+00 1.11E+03 0.00E+00 0.00E+00 C-14 1.99E+03 0.00E+00 0.00E+00 3.81E+02 0.00E+00 0.00E+00 Ar-41 4.10E+03 0.00E+00 0.00E+00 7.85E+02 0.00E+00 0.00E+00 Co-60 6.44E-03 2.53E-05 4.55E-02 1.22E-03 5.21E-06 9.39E-03 Kr-85 3.04E+04 0.00E+00 0.00E+00 5.83E+03 0.00E+00 0.00E+00 Sr-90 8.86E-04 3.46E-06 6.22E-03 1.68E-04 7.14E-07 1.29E-03 I-131 4.10E-01 5.30E-03 9.54E+00 7.25E-02 9.80E-04 1.76E+00 Xe-133 4.48E+03 0.00E+00 0.00E+00 8.59E+02 0.00E+00 0.00E+00 Cs-137 2.66E-03 1.04E-05 1.87E-02 5.05E-04 2.14E-06 3.86E-03 Other radiodiodides (I-133)
7.65E-01 9.90E-03 1.78E+01 1.35E-01 1.83E-03 3.30E+00
Other noble gases (Kr-85)
1.37E+04 0.00E+00 0.00E+00 2.63E+03 0.00E+00 0.00E+00
Other particulates (Co-58)
1.44E-02 5.66E-05 1.02E-01 2.74E-03 1.17E-05 2.10E-02
Table A6.5 Inhalation Dose Coefficients
Age group Radionuclide ICRP Lung class
Inhalation Sv/Bq
Ingestion Sv/Bq
H-3 V 1.8E-11 1.8E-11 C-14 V 2E-09 5.8E-10
Co-58 M 1.6E-09 7.4E-10 Co-60 M 1E-08 3.4E-10 Sr-90 M 3.6E-08 2.8E-08
Cs-137 F 4.6E-09 1.3E-08 I-131 F 7.4E-09 2.2E-08
Adult
I-133 F 1.5E-09 4.3E-09 H-3 V 2.3E-11 2.3E-11
C-14 V 2.8E-09 8E-10 Co-58 M 2.4E-09 1.7E-09 Co-60 M 1.5E-08 1.1E-08 Sr-90 M 5.1E-08 6.0E-08
Cs-137 F 3.7E-09 1E-08 I-131 F 1.9E-08 5.2E-08
Child
I-133 F 3.8E-09 1E-08 H-3 V 4.8E-11 4.8E-11
C-14 V 6.6E-09 1.6E-09 Co-58 M 6.5E-09 4.4E-09 Co-60 M 3.4E-08 2.7E-08 Sr-90 M 1.1E-07 7.3E-08
Cs-137 F 5.4E-09 1.2E-08 I-131 F 7.2E-08 1.8E-07
Infant
I-133 F 1.8E-08 4.4E-08

Environment Agency – Independent dose assessment of AP-1000 design for GDA Page 77
Table A6.6 Factors for External Dose Rates used in the assessment.
Radionuclide
Cloud Shine (Sv/s per
Bq/m3) Deposited Gamma (Sv/y per Bq/m2)*
H-3 0 0
C-14 2.61E-18 0
Ar-41 6.11E-14 0
Co-60 1.19E-13 4.38E-08
Kr-85 2.39E-16 0
Sr-90 9.72E-17 0
I-131 1.69E-14 2.48E-10
Xe-133 2.56E-14 0
Cs-137 2.75E-14 1.08E-08
Other radiodiodides (I-133) 2.39E-16 5.99E-10
Other noble gases (Kr-85) 4.44E-14 0
Other particulates (Co-58) 1.33E-15 0 *From NRPB-W54 [Ref. A6.1]
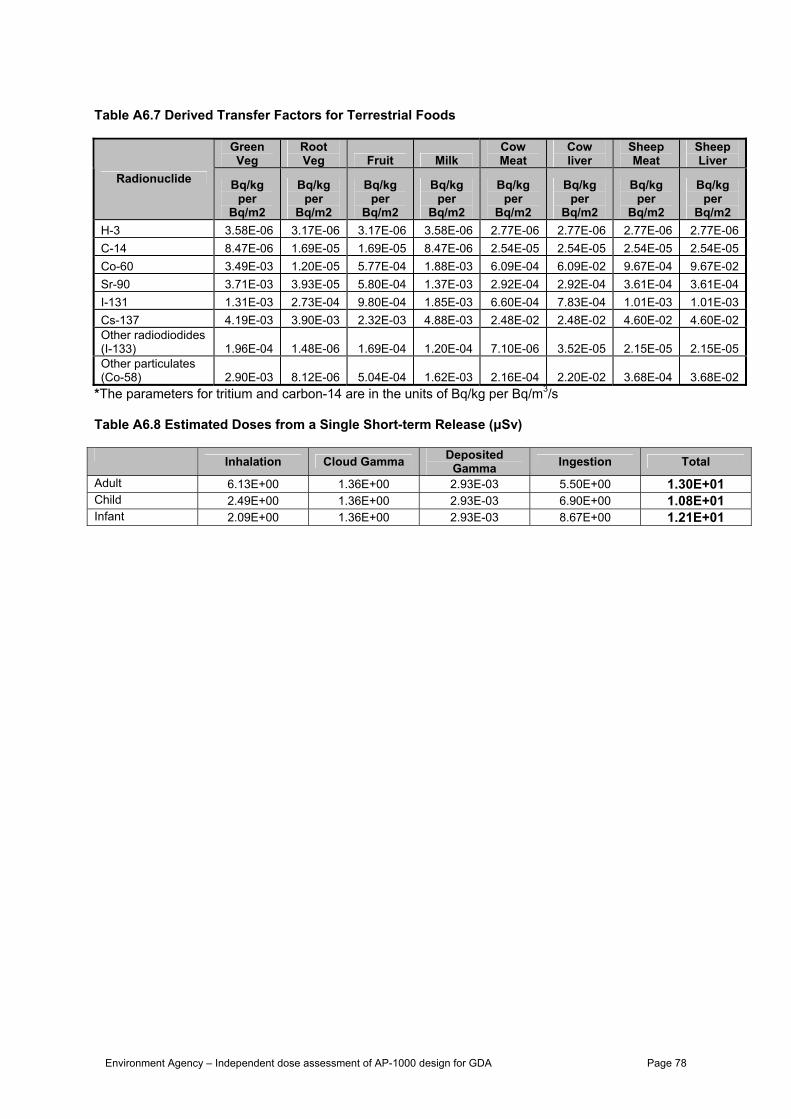
Environment Agency – Independent dose assessment of AP-1000 design for GDA Page 78
Table A6.7 Derived Transfer Factors for Terrestrial Foods
Green Veg
Root Veg Fruit Milk
Cow Meat
Cow liver
Sheep Meat
Sheep Liver
Radionuclide Bq/kg per
Bq/m2
Bq/kg per
Bq/m2
Bq/kg per
Bq/m2
Bq/kg per
Bq/m2
Bq/kg per
Bq/m2
Bq/kg per
Bq/m2
Bq/kg per
Bq/m2
Bq/kg per
Bq/m2 H-3 3.58E-06 3.17E-06 3.17E-06 3.58E-06 2.77E-06 2.77E-06 2.77E-06 2.77E-06C-14 8.47E-06 1.69E-05 1.69E-05 8.47E-06 2.54E-05 2.54E-05 2.54E-05 2.54E-05Co-60 3.49E-03 1.20E-05 5.77E-04 1.88E-03 6.09E-04 6.09E-02 9.67E-04 9.67E-02Sr-90 3.71E-03 3.93E-05 5.80E-04 1.37E-03 2.92E-04 2.92E-04 3.61E-04 3.61E-04I-131 1.31E-03 2.73E-04 9.80E-04 1.85E-03 6.60E-04 7.83E-04 1.01E-03 1.01E-03Cs-137 4.19E-03 3.90E-03 2.32E-03 4.88E-03 2.48E-02 2.48E-02 4.60E-02 4.60E-02Other radiodiodides (I-133) 1.96E-04 1.48E-06 1.69E-04 1.20E-04 7.10E-06 3.52E-05 2.15E-05 2.15E-05Other particulates (Co-58) 2.90E-03 8.12E-06 5.04E-04 1.62E-03 2.16E-04 2.20E-02 3.68E-04 3.68E-02
*The parameters for tritium and carbon-14 are in the units of Bq/kg per Bq/m3/s Table A6.8 Estimated Doses from a Single Short-term Release (μSv) Inhalation Cloud Gamma Deposited
Gamma Ingestion Total
Adult 6.13E+00 1.36E+00 2.93E-03 5.50E+00 1.30E+01 Child 2.49E+00 1.36E+00 2.93E-03 6.90E+00 1.08E+01 Infant 2.09E+00 1.36E+00 2.93E-03 8.67E+00 1.21E+01
Environment Agency – Independent dose assessment of AP-1000 design for GDA Page 79
Appendix 7 – The effect of alternative assumptions on the independent assessment Introduction A7.1 The total doses are predicted to be low from an AP1000 power plant based on predicted
discharges and generic site conditions and within the range of 1 to 10 μSv/y. Given that doses are low, a limited uncertainty assessment has been made, taking into account three main areas:-
• Foetal and breastfed infant dose. The representative person for a prospective site is
likely to include adult women of child bearing age who may be pregnant from time to time. Dose coefficients for foetuses have been published by the ICRP [Ref A7.1] and the HPA have provided factors linking the doses to adults to those to the foetus and breast fed infant [Ref A7.2]. These factors have been used to assess dose to the foetus and infant in the first months of life.
• Uncertainty in internal doses from radionuclides taken into the body exists. Recent
reviews of doses and risks from radionuclides have suggested that uncertainty associated with internal doses from radionuclides may be greater than those for external exposure [e.g. Ref A7.3]. In response to this the Environment Agency has agreed to separate the estimates of effective doses from intakes of radionuclides, from estimates of effective doses from external exposure, so that uncertainty can be considered in more detail if required.
• Variation in wind direction around the generic site. The main assessment of
dispersion of radionuclides discharged to air over the course of a year assumes a uniform wind rose. For a generic site no specific meteorological data exists, nonetheless the effect of a non-uniform wind rose, where the candidates for the representative person are assumed to be located in a predominant downwind location, on the predicted doses has been assessed.
• Location of candidates for the representative person affected by atmospheric
discharges. The assessment of dispersion of radionuclides discharged to air assumes that the candidates for the representative person affected by atmospheric discharges live 100m from the release point and eat food produced at 500m from the release point. Other assessments that will be made assume that candidates for the representative person live and eat food produced at the location where air concentrations are highest. The affect of adopting these latter assumptions on predicted doses can be assessed.
Dose to Foetus and Breastfed Infant A7.2 Doses to the foetus and breastfed infant may be assessed on the basis of the dose to an adult
mother and foetal and breastfed infant dose coefficients [Ref. A7.1, A7.2]. HPA guidance [Ref. 7.3] indicates that explicit assessment of doses to the foetus is often not necessary. Four radionuclides (32P, 33P, 45Ca and 89Sr) are identified for which such assessments are necessary. Sr-89 is the only one of these radionuclides included in the predicted releases from the AP1000. However, for the purposes of providing a scoping assessment of foetal doses from intakes by the foetus and breastfed infants, the doses to adults arising from inhalation and ingestion from atmospheric and marine discharges were multiplied by the time-weighted ratio of the dose coefficients for foetus (9 months) and breastfed infant during breastfeeding (3 months) to those of the adult. The relevant dose coefficients and multiplication factors are given in Table A7.1.

Environment Agency – Independent dose assessment of AP-1000 design for GDA Page 80
A7.3 The contribution to doses from key radionuclides to adults and foetus and breast fed infants
from key who are either CRP1 (atmospheric discharges) or CRP2 (liquid discharges) are presented Table A7.2 and Table A7.3 respectively.
A7.4 The highest foetal/infant dose was 2.5 μSv/y to CRP1 who are most exposed to atmospheric
discharges. This dose was 0.4 μSv/y higher than to the adult mother. Internal/External Exposure A7.5 The internal and external component of effective doses to members of the representative
persons most exposed to aerial and liquid discharges from the AP1000 power plant are given in Tables A7.4 and A7.5.
The Effect of Local Meteorological Conditions A7.6 The assessment made for atmospheric discharges groups the wind uniformly into 12 sectors.
A uniform distribution means that the wind would blows into each sector 8.3% of the time. Doses from aerial discharges are proportional to air concentrations which, in turn are proportional to the frequency of wind blowing into the sector. A uniform windrose means that air concentration and doses are the same regardless of the sector.
A7.7 To assess the effect of a non uniform windrose on the doses it has been assumed that CRP1
are located in a predominant downwind direction such that the wind blows in that direction for 2 times more than that with a uniform windrose. This factor is based on an analysis of the difference in the amount of time the wind blows towards a given 30 degree wind angle for a coastal location in the North West of England, which is close to a number of proposed locations for new nuclear power stations. The resulting factor was between 1.63 and 1.85, which has been rounded to 2 for the purposes of this generic assessment.
A7.8 The range of doses from atmospheric discharges to a candidate for the reference person
(CRP1) who is situated in a predominant downwind direction will be around twice that for a candidate for the reference person assuming a uniform windrose. Thus, such doses would be around 5.2 µSv/y to adult and 8.8 µSv/y to infant, compared with the uniform windrose dose of 2.6 µSv/y to adult and 4.4 µSv/y to infant.
The effect of adopting different locations for candidate reference person A7.9 The dose assessment will also be influenced by the choice of the distance at which the
candidate representative person (or receptor) is assumed to live and derive their foods, from the release point.
A7.10 In the independent assessment, standard assumptions regarding the habitation and domestic
fruit and vegetable production (100 m) and agricultural produce (500 m) were made. In order to determine the likely magnitude of the difference such assumptions could make to the doses assessed, the ratios of the time integrated air concentrations at the assumed locations to the maximum values were determined, using the appropriate plots of air concentrations for a continuing release for 60% Category D conditions, from NRPB-R91 [Ref. A7. 5]. The integrated air concentration at 100 m was found to be around 70% of that at 200 m (the location of the maximum air concentration) and that at 500 m was found to be 50% of this value, as demonstrated in Table A7.5. By making alternative assumptions about the location of the terrestrial candidate representative person, it may therefore be possible to predict doses that are higher by up to a factor of 2 than the independent assessment.
References

Environment Agency – Independent dose assessment of AP-1000 design for GDA Page 81
A7.1 International Commission on Radiological Protection, Doses to the Embryo and Fetus from
Intakes of Radionuclides by the Mother, ICRP Publication No. 88, Corrected Version 2001, Ann. ICRP 31 (1-3) (2001).
A7.2 International Commission on Radiological Protection, Doses to Infants from Ingestion of
Radionuclides in Mother’s Milk, ICRP Publication No. 95, Ann. ICRP 34 (3-4) (2004). A7.3 Guidance on the Application of Dose Coefficients for the Embryo, Fetus and Breastfed Intant
in Dose Assessments for Members of the Public, Health Protection Agency, RCE-5 (2008). A7.4 Committee on Examining Radiation Risks of Internal Emitters, Report (2004).

Environment Agency – Independent dose assessment of AP-1000 design for GDA Page 82
Table A7.1 Adult, Foetal and Breast Feeding Infant Dose Coefficients and Derived Modification factors for Adult doses Radionuclide Inhalation Ingestion
Foetus Infant Adult Foetus Infant Adult
Inhalation factor
Ingestion factor
H-3 6.30E-11 3.00E-11 4.10E-11 3.10E-11 2.00E-11 1.80E-11 1.34E+00 1.57E+00 C-14 8.00E-10 2.60E-10 5.80E-10 8.00E-10 2.60E-10 5.80E-10 1.15E+00 1.15E+00 Sr-89 2.10E-09 4.30E-10 6.10E-09 1.20E-08 2.00E-09 2.60E-09 2.76E-01 3.65E+00 Sr-90 8.80E-09 3.90E-09 3.80E-08 4.30E-08 1.50E-08 3.10E-08 1.99E-01 1.16E+00 I-131 8.10E-09 1.90E-08 7.40E-09 2.30E-08 5.50E-08 2.20E-08 1.46E+00 1.41E+00
Table A7.2 Foetal Dose from discharges from the AP1000 Power plant (pregnant women CRP1 - most exposed to atmospheric discharges)
Adult Dose (µSv/y) Foetal/ infant doses (µSv/y)* Radionuclide Inhalation Ingestion Inhalation Ingestion
H-3 9.64E-03 5.20E-02 1.29E-02 8.16E-02 C-14 3.61E-01 2.10E+00 4.14E-01 2.41E+00 Sr-89 2.00E-06 1.15E-06 5.51E-07 4.19E-06 Sr-90 4.40E-06 3.97E-05 8.77E-07 4.60E-05 I-131 4.71E-04 2.69E-02 6.89E-04 3.79E-02 Total 3.71E-01 2.18E+00 4.27E-01 2.53E+00 *For the period of 12 months in which the foetal dose coefficient applies to 9 months and the dose coefficient for infants during lactation is applied for 3 months Table A7.3 Foetal Dose from discharges from the AP1000 (pregnant women CRP2, - most exposed to liquid discharges)
Adult Dose (µSv/y) Foetal/ infant doses (µSv/y)* Radionuclide Inhalation Ingestion Inhalation Ingestion
H-3 0.00E+00 2.10E-03 0.00E+00 3.30E-03 C-14 0.00E+00 9.59E-01 0.00E+00 1.10E+00 Sr-89 0.00E+00 2.80E-07 0.00E+00 1.02E-06 Sr-90 0.00E+00 4.60E-07 0.00E+00 5.34E-07 I-131 0.00E+00 4.47E-05 0.00E+00 6.30E-05 Total 0.00E+00 9.61E-01 0.00E+00 1.11E+00
*For the period of 12 months in which the foetal dose coefficient applies to 9 months and the dose coefficient for infants during lactation is applied for 3 months

Environment Agency – Independent dose assessment of AP-1000 design for GDA Page 83
Table A7.4 Separation of internal and external doses to CRP1 (infant) who are most exposed to gaseous discharges from Stack 1 of the AP1000 Power plant
Effective Dose to CRP1 AP1000 Power plant μSv/y
Radionuclide
Total External Internal
Ar-41 3.43E-02 3.43E-02 0.00E+00 Ba-140 5.80E-07 5.56E-10 5.79E-07 C-14 3.98E+00 6.84E-07 3.98E+00
Co-58 3.26E-05 1.77E-07 3.24E-05 Co-60 1.07E-04 1.74E-07 1.07E-04 Cr-51 2.96E-08 1.14E-10 2.95E-08
Cs-134 3.60E-05 2.71E-08 3.60E-05 Cs-137 4.77E-05 4.35E-12 4.77E-05
H-3 1.20E-01 2.57E-07 1.20E-01 I-131 2.35E-01 1.68E-06 2.35E-01 I-133 6.76E-03 4.49E-06 6.76E-03 Kr-85 3.23E-04 3.23E-04 0.00E+00
Kr-85m 7.44E-05 7.44E-05 0.00E+00 Kr-87 3.42E-04 3.42E-04 0.00E+00 Kr-88 1.55E-03 1.55E-03 0.00E+00 Mn-54 7.91E-07 1.94E-09 7.89E-07 Nb-95 4.42E-07 1.44E-08 4.28E-07 Sr-89 7.77E-06 3.67E-11 7.77E-06 Sr-90 7.24E-05 1.33E-12 7.24E-05
Xe-131m 2.32E-04 2.32E-04 0.00E+00 Xe-133 7.20E-04 7.20E-04 0.00E+00
Xe-133m 1.47E-04 1.47E-04 0.00E+00 Xe-135 2.21E-03 2.21E-03 0.00E+00
Xe-135m 2.42E-03 2.42E-03 0.00E+00 Xe-138 6.23E-03 6.23E-03 0.00E+00 Zr-95 5.11E-07 5.33E-09 5.05E-07 Total 4.39E+00 4.86E-02 4.34E+00
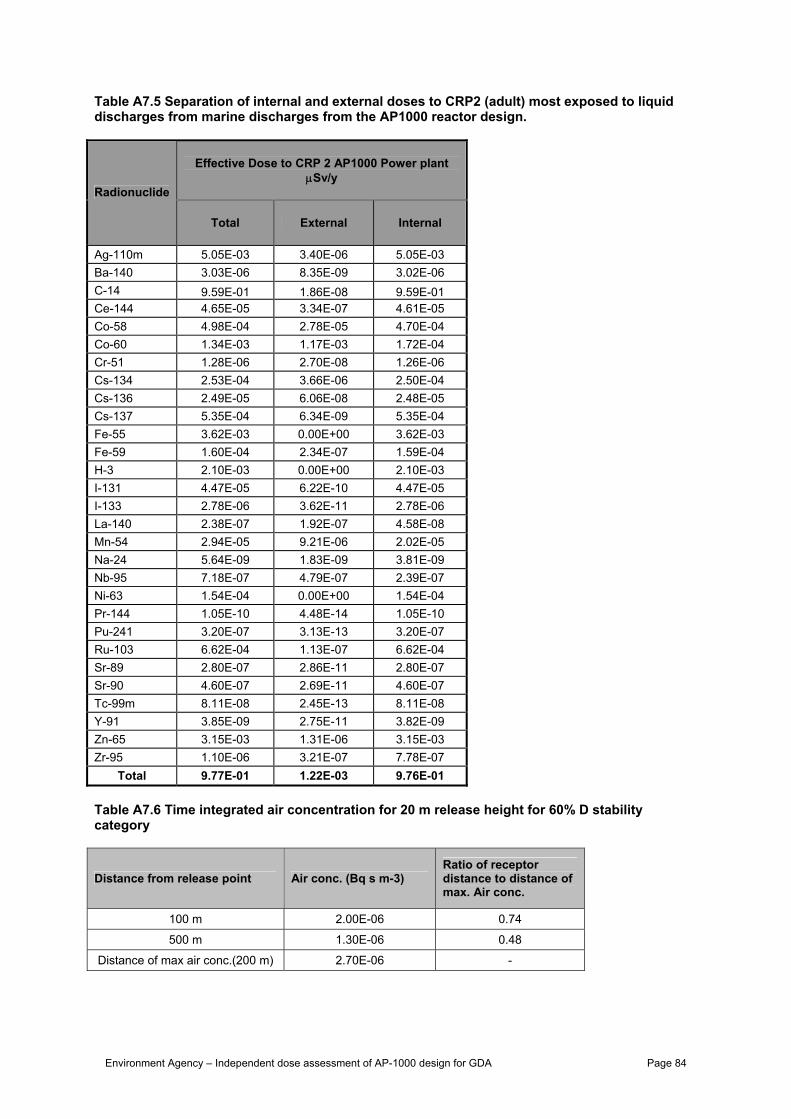
Environment Agency – Independent dose assessment of AP-1000 design for GDA Page 84
Table A7.5 Separation of internal and external doses to CRP2 (adult) most exposed to liquid discharges from marine discharges from the AP1000 reactor design.
Effective Dose to CRP 2 AP1000 Power plant μSv/y
Radionuclide
Total External Internal
Ag-110m 5.05E-03 3.40E-06 5.05E-03 Ba-140 3.03E-06 8.35E-09 3.02E-06 C-14 9.59E-01 1.86E-08 9.59E-01 Ce-144 4.65E-05 3.34E-07 4.61E-05 Co-58 4.98E-04 2.78E-05 4.70E-04 Co-60 1.34E-03 1.17E-03 1.72E-04 Cr-51 1.28E-06 2.70E-08 1.26E-06 Cs-134 2.53E-04 3.66E-06 2.50E-04 Cs-136 2.49E-05 6.06E-08 2.48E-05 Cs-137 5.35E-04 6.34E-09 5.35E-04 Fe-55 3.62E-03 0.00E+00 3.62E-03 Fe-59 1.60E-04 2.34E-07 1.59E-04 H-3 2.10E-03 0.00E+00 2.10E-03 I-131 4.47E-05 6.22E-10 4.47E-05 I-133 2.78E-06 3.62E-11 2.78E-06 La-140 2.38E-07 1.92E-07 4.58E-08 Mn-54 2.94E-05 9.21E-06 2.02E-05 Na-24 5.64E-09 1.83E-09 3.81E-09 Nb-95 7.18E-07 4.79E-07 2.39E-07 Ni-63 1.54E-04 0.00E+00 1.54E-04 Pr-144 1.05E-10 4.48E-14 1.05E-10 Pu-241 3.20E-07 3.13E-13 3.20E-07 Ru-103 6.62E-04 1.13E-07 6.62E-04 Sr-89 2.80E-07 2.86E-11 2.80E-07 Sr-90 4.60E-07 2.69E-11 4.60E-07 Tc-99m 8.11E-08 2.45E-13 8.11E-08 Y-91 3.85E-09 2.75E-11 3.82E-09 Zn-65 3.15E-03 1.31E-06 3.15E-03 Zr-95 1.10E-06 3.21E-07 7.78E-07
Total 9.77E-01 1.22E-03 9.76E-01 Table A7.6 Time integrated air concentration for 20 m release height for 60% D stability category
Distance from release point Air conc. (Bq s m-3) Ratio of receptor distance to distance of max. Air conc.
100 m 2.00E-06 0.74
500 m 1.30E-06 0.48
Distance of max air conc.(200 m) 2.70E-06 -

Environment Agency – Independent dose assessment of AP-1000 design for GDA Page 85
Appendix 8 – Independent assessment of doses from direct radiation Introduction A8.1 Exposure of the public from direct radiation from nuclear sites in the UK is the responsibility of
the HSE, who require site operators to measure direct radiation at the site perimeter and estimate exposure to a reference group on an annual basis.
A8.1 As no UK EPR nuclear power plants have yet been built and operated, it is necessary to
estimate the direct radiation dose that may arise. For the purposes of this estimation, measured direct radiation data from Sizewell B have been used. This is currently the only operational PWR nuclear power station in the UK.
A8.2 Direct radiation exposure is included within this assessment for comparison against the
relevant dose constraints, based on the most recent data available for Sizewell B. A8.3 The assessment of doses from atmospheric and liquid discharges from the AP1000 is outlined
in Appendices 3 and 4, respectively. These data are collated for application of dose constraints in Appendix 9.
Direct Exposure Estimates A8.4 The dose to the representative person from direct radiation from Sizewell B in 2007 was
assessed to be 4 μSv [Ref. A8.1], Table 8.1. The direct radiation measurements in previous years were higher, due to the contribution from the adjacent Magnox station (Sizewell A). The value in 2007 is considered to more appropriate for the purposes of this assessment than an average value due to the fact that Sizewell A ceased generation in 2006, and therefore the 2007 value is less likely to include a contribution from an adjacent source.
A8.5 This direct radiation estimate is assumed to apply to CRP1 only. It is assumed that local
fisherman and their families who are CRP2 do not collect seafood from near to the site and do not live close enough to receive a dose from direct radiation. Application of direct radiation assumptions is summarised in Table 8.2.
References A8.1 Food Standards Agency and Joint Environment Agencies. Radioactivity in Food and the
Environment, 2007(RIFE-13) (2008).
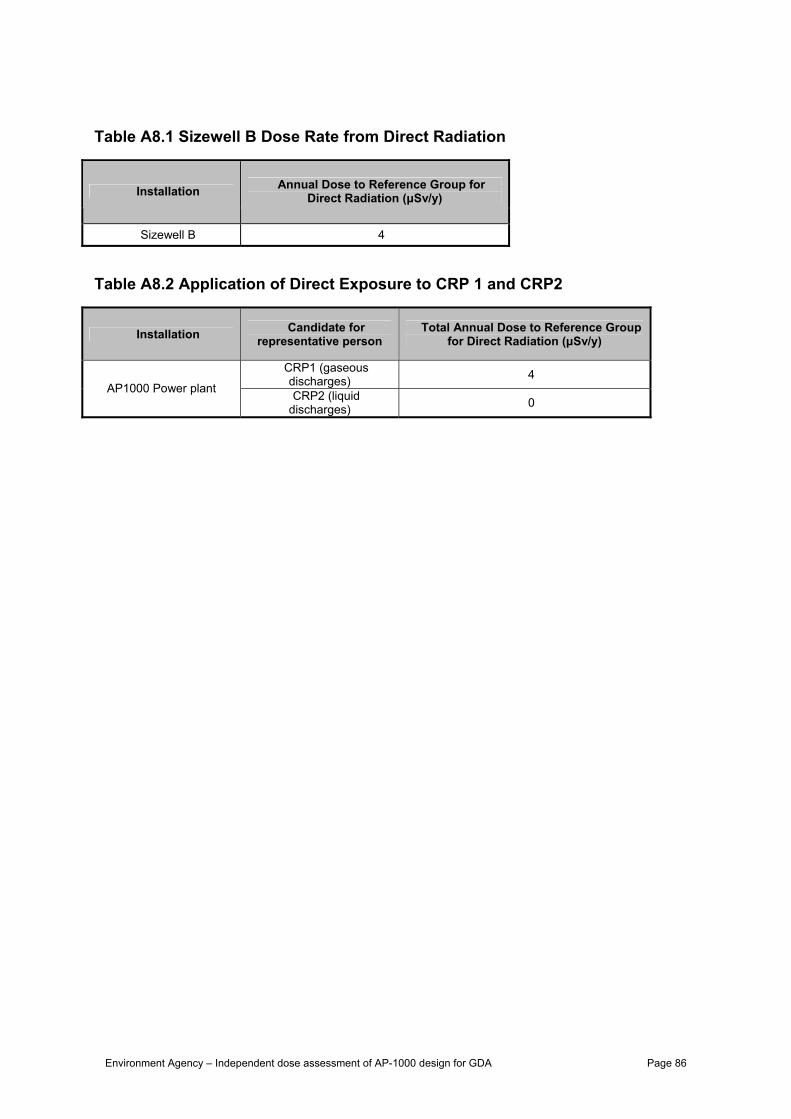
Environment Agency – Independent dose assessment of AP-1000 design for GDA Page 86
Table A8.1 Sizewell B Dose Rate from Direct Radiation
Installation Annual Dose to Reference Group for Direct Radiation (μSv/y)
Sizewell B 4 Table A8.2 Application of Direct Exposure to CRP 1 and CRP2
Installation Candidate for representative person
Total Annual Dose to Reference Group for Direct Radiation (μSv/y)
CRP1 (gaseous discharges) 4
AP1000 Power plant CRP2 (liquid discharges) 0

Environment Agency – Independent dose assessment of AP-1000 design for GDA Page 87
Appendix 9 – Independent assessment of site dose and total dose Introduction A9.1 The Environment Agency has responsibility to assess the maximum doses to individuals
which may result from a defined source for use at the planning stage in radiation protection [Ref A9.1]. The current applicable criteria are:
• 0.3 millisieverts per year (mSv/y) (300 μSv/y) from any source (source dose
constraint); • 0.5 millisieverts per year (mSv/y) (500 μSv/y) from the discharges from any single site
(site dose constraint). A9.2 The Environment Agency has also been directed to ensure that the sum of doses resulting
from exposure to ionising radiation (total dose) does not exceed 1 mSv/y (1,000 µSv/y) [Ref A9.1].
A9.3 In its Consultation Guidance on the application of the 2007 ICRP Recommendations to the
UK [Ref. A9.2], the HPA has recommended that a maximum source constraint for members of the public of 150 µSv/y for new nuclear power stations should be used.
Source Dose A9.4 The dose for comparison with the source dose constraint includes the contribution from
direct radiation. The assessment of doses from predicted future discharges from the AP1000 power plant is outlined in Appendices 3 and 4 for discharges to atmospheric and liquid discharges, respectively. The dose from direct radiation was estimated, as outlined in Appendix 8. The highest effective doses from this source were found to be 8.4 µSv/y, including a contribution of 4 µSv/y from direct radiation. These dose estimates are summarised in Tables A9.1 are well below the existing source constraint.
A9.5 It is proposed that the annual effective dose to the representative person summed over all
relevant exposure pathways should be for comparison with the proposed dose constraint from new nuclear power stations [Ref.9.2]. It is therefore assumed that this would include the potential contribution from direct radiation from the power plant. The summed doses assessed from atmospheric and liquid discharges and from direct radiation are therefore also compared with the proposed maximum dose constraint for new nuclear power stations [Ref.9.2]. The doses, presented in Table A9.1, are also well below this level.
Site Dose A9.1 To assess the dose from an AP1000 nuclear power plant located at a given site, for
comparison with the 500 µSv/y site dose constraint, it would be necessary to include doses from future discharges from any other sources on the site and other sites with contingent boundaries. For the purposes of this assessment, it is assumed that the AP1000 is the only source located at the generic site. In this case, the source dose and site dose are equivalent. The representative person dose of 8.4 µSv/y is also significantly lower than the site constraint of 500 µSv/y.

Environment Agency – Independent dose assessment of AP-1000 design for GDA Page 88
A9.2 If the AP1000 were to be co-located with another current or past source of radioactive discharges, the site dose would need to be reassessed accordingly.
Total dose A9.6 An assessment of total dose for comparison with the dose limit would take account of:
• Historical discharges from any other power plants or practices with which the AP1000 power plant is co-located;
• Historical discharges from other sites that lead to elevated levels of radioactivity in the area;
• Future discharges from the AP1000 and co-located power plants or other practices; • Direct radiation from the AP1000 and co-located reactors or other practices; and, • Future discharges from other sites that lead to elevated levels of radioactivity in the
area. A9.7 For a generic assessment it is not possible to make a realistic or meaningful estimate of
the total dose, given that information on the location of the AP1000 nuclear power plant, co-located reactors or other sources cannot been defined. In the absence of such information, it may be assumed that the AP1000 is located at an isolated location at some distance from any existing or previous sources of radioactive discharges. In this case, the total dose would be equivalent to the source and site dose. The total representative person dose of 8.4 µSv/y is also significantly less than the dose limit of 1000 µSv/y.
A9.8 If the UK EPR were to be located in the vicinity of another source of radioactive
discharges, the total dose would need to be reassessed accordingly taking into account discharges and direct radiation from any other sites.
. References A9.1 Joint Agencies, Principles for the Assessment of Prospective Public Doses (Interim
Guidance) December 2002. A9.2 Health Protection Agency, HPA Advice on the Application of the ICRP’s 2007
Recommendations to the UK, Consultation Document, HPA, Chilton, (2008).

Environment Agency – Independent dose assessment of AP-1000 design for GDA Page 89
Table A9.1 Summary of Doses from the AP1000 Power plant for Predicted Discharges (μSv/y) for Comparison against the Source Constraint and Proposed Maximum Dose Constraint for New Nuclear Power Stations
AP1000 Power plant Dose (μSv/y) Candidate Representative persona Age group Atmospheric
Discharges Marine
Discharges
Direct Radiation
Total SourceDose
Adult 2.64 0.07 4 6.71 Child 2.87 0.04 4 6.91
Family at nearest dwelling (CCG1)
Infant 4.39 0.04 4 8.43 Adult 1.61 0.98 0 2.59 Child 1.87 0.29 0 2.17
Fisherman and family (CCG2)
Infant 2.13 0.10 0 2.23

Would you like to find out more about us, or about your environment? Then call us on 08708 506 506* (Mon-Fri 8-6) email [email protected] or visit our website www.environment-agency.gov.uk incident hotline 0800 80 70 60 (24hrs) floodline 0845 988 1188 * Approximate calls costs: 8p plus 6p per minute (standard landline). Please note charges will vary across telephone providers
Environment first: This publication is printed on paper made from 100 per cent previously used waste. By-products from making the pulp and paper are used for composting and fertiliser, for making cement and for generating energy.


![UK ABWR Generic Design AssessmentE03]UKABW… · 5.3. Gathering Evidence ... Candidate Nuclear Power Plant Designs”, version 3, October 2016. [Ref-2] Hitachi-GE Nuclear Energy,](https://img.pdfslide.net/doc/110x75/5f761fed3e57827b5e4aacbd/uk-abwr-generic-design-e03ukabw-53-gathering-evidence-candidate-nuclear.jpg)