Embed Size (px)
Citation preview
Genetic and Environmental Influences on Temperament in Middle Childhood: Analyses ofTeacher and Tester RatingsAuthor(s): Stephanie Schmitz, Kimberly J. Saudino, Robert Plomin, David W. Fulker, J. C.DeFriesSource: Child Development, Vol. 67, No. 2 (Apr., 1996), pp. 409-422Published by: Blackwell Publishing on behalf of the Society for Research in Child DevelopmentStable URL: http://www.jstor.org/stable/1131823 .Accessed: 24/08/2011 15:22
Your use of the JSTOR archive indicates your acceptance of the Terms & Conditions of Use, available at .http://www.jstor.org/page/info/about/policies/terms.jsp
JSTOR is a not-for-profit service that helps scholars, researchers, and students discover, use, and build upon a wide range ofcontent in a trusted digital archive. We use information technology and tools to increase productivity and facilitate new formsof scholarship. For more information about JSTOR, please contact [email protected].
Blackwell Publishing and Society for Research in Child Development are collaborating with JSTOR to digitize,preserve and extend access to Child Development.
http://www.jstor.org
Genetic and Environmental Influences on
Temperament in Middle Childhood: Analyses of Teacher and Tester Ratings
Stephanie Schmitz
University of Colorado, Boulder
Kimberly J. Saudino and Robert Plomin The Pennsylvania State University
David W. Fulker and J. C. DeFries
University of Colorado, Boulder
SCHMITZ, STEPHANIE; SAUDINO, KIMBERLY J.; PLOMIN, ROBERT; FULKER, DAVID W.; and DEFRIES, J. C. Genetic and Environmental Influences on Temperament in Middle Childhood: Analyses of Teacher and Tester Ratings. CHILD DEVELOPMENT, 1996, 67, 409-422. Parent ratings of temper- ament in infancy and childhood yield evidence for genetic influence in twin studies but not in adoption studies. The present study used the sibling adoption design to investigate teacher and tester ratings of temperament in middle childhood. When each child was 7 years old, ratings on the Colorado Childhood Temperament Inventory were obtained from a teacher and tester for more than 50 pairs each of adoptive and nonadoptive siblings in the Colorado Adoption Project. Significant genetic influence emerged for both teacher and tester ratings of Activity, for tester ratings of Sociability, and for teacher ratings of Emotionality. Results obtained from bivariate genetic analysis suggest that the modest covariance between teacher and tester ratings of Activity is entirely mediated genetically. Except for teacher ratings of Attention Span, evidence of shared family environment was nonsignificant, despite the power of the sibling adoption design to detect it.
Introduction
The evidence for genetic influence on temperament in childhood largely comes from twin studies using parental ratings (Plomin, 1986). However, the first parent- offspring and sibling adoption study of pa- rental ratings of temperament found no evi- dence for genetic influence from 1 to 7 years of age (Plomin, Coon, Carey, DeFries, & Fulker, 1991). It is possible that the dramati- cally discrepant results for twin and adop- tion studies are due to nonadditive genetic variance, that is, interaction between genes, which are shared completely by identical twins but to lesser extents by parents and
offspring and by siblings. Thus, if nonaddi- tive genetic variance for a character is sub- stantial, significant genetic influence may be detected in twin studies, but not in parent- offspring or sibling studies in which nonad- ditive genetic variance plays a lesser role. Another possibility is that parents might ex- aggerate the resemblance of identical twins or the differences between fraternal twins (Plomin, Chipuer, & Loehlin, 1990). In sup- port of this hypothesis is the finding that identical twin correlations for parental rat- ings of temperament are about .60, whereas fraternal twin correlations are near zero (Buss & Plomin, 1984; Stevenson & Field- ing, 1985).
This research was supported by grants HD-10333 and HD-18426 from the National Institute of Child Health and Human Development, and by grant MH-43899 from the National Institutes of Mental Health. The analyses were facilitated by BRSG Grant RR-07013-25 awarded to the University of Colorado by the Biomedical Research Support Grant Program, Division of Research Resources, National Institutes of Health. The article was written while the first author was supported in part by Grant HD-07289 from NICHD and the second author was funded by a postdoctoral fellowship awarded by the Social Sciences and Humanities Research Council of Canada. The authors wish to thank the four anonymous reviewers for their comments. Mailing address: Stephanie Schmitz, Institute for Behavioral Genetics, Campus Box 447, University of Colorado, Boulder, CO 80309-0447; e-mail: [email protected].
[Child Development, 1996, 67, 409-422. ? 1996 by the Society for Research in Child Development, Inc. All rights reserved. 0009-3920/96/6702-0009$01.00]
410 Child Development
These problems suggest the need to in- vestigate the etiology of individual differ- ences in temperament using measures other than parental ratings and methods other than the twin method (Plomin, 1981). One ap- proach to measurement involves objective measures such as actometers to measure ac- tivity level (Plomin & Foch, 1980; Saudino & Eaton, 1991, in press). Another approach is to use ratings based on videotape observa- tions in the laboratory or home (Goldsmith & Campos, 1986; Matheny, 1989; Plomin et al., 1993). A variant of this approach is the use of ratings by testers following adminis- tration of developmental tasks. For example, the Infant Behavior Record (IBR) was devel- oped by Nancy Bayley in order to assess temperament-like behavior seen during ad- ministration of the Bayley Scales of Infant Development (Bayley, 1969). In infancy, IBR ratings have shown reasonable and rep- licable patterns of genetic influence in twin studies (Goldsmith & Gottesman, 1981; Ma- theny, 1980; Saudino, DeFries, & Plomin, in press). Moreover, unlike parental ratings, twin analyses of the IBR yield results similar to those found in a sibling adoption analysis that compared resemblance of nonadoptive siblings and adoptive siblings (Braungart, Plomin, DeFries, & Fulker, 1992). Although it is a narrow window through which testers view temperament, tester ratings have three advantages. First, unlike most parents, test- ers have experience with a broad range of children and thus have an adequate standard of comparison for ratings of children's tem- perament. Second, although the testing situ- ation is a limited context in which to observe children's behavior, it is a standard situation that facilitates comparisons among children. Third, the testing situation can be somewhat stressful, which may enrich observations of certain temperament-like behaviors.
Although not previously used in genetic research on temperament, teachers also seem likely to be a useful source of informa- tion about temperament in middle child- hood. The school environment is a much wider window both in terms of time and con- texts than a test session of a few hours' dura- tion upon which tester ratings are based. Like testers, teachers have experience with sufficient numbers of children to make rela- tive comparisons about temperament. The validity of teacher ratings is supported by moderate correlations found across ratings by different teachers for temperament (Keogh, 1982) and problem behaviors (Achenbach, McConaughy, & Howell, 1987).
Because the contexts of teacher and tes- ter ratings are dissimilar, teacher and tester ratings are not expected to correlate highly. We are not aware of reported correlations for temperament, but for behavioral problems teacher and tester ratings correlate about .30 (Achenbach et al., 1987). Use of both teacher and tester ratings permits novel analyses of the genetic underpinnings of the situational specificity of temperament. An obvious question is whether the magnitude of ge- netic influence differs for teacher and tester ratings. A more subtle question involves the extent to which genetic effects on teacher ratings overlap with genetic effects on tester ratings. A transsituational view of tempera- ment would predict that what is in common between teacher and tester ratings is herita- ble, even though the phenotypic correlation between teacher and tester ratings may be modest. In contrast, a contextual view of temperament would be compatible with finding independent genetic influences on temperament as seen by teachers and test- ers. Of course, any combination of these two extreme positions is possible for different di- mensions of temperament. This issue can be addressed using multivariate genetic analy- ses which focus on genetic and environmen- tal contributions to the covariance between variables-in this case, teacher and tester ratings of temperament-rather than the variance of each variable considered sepa- rately (Martin & Eaves, 1977; Plomin & DeFries, 1979).
The purpose of the present study is to investigate genetic influence at 7 years of age using teacher as well as tester ratings of temperament and the sibling adoption de- sign of the Colorado Adoption Project (CAP; DeFries, Plomin, & Fulker, 1994). Because tester ratings of temperament show genetic influence in sibling adoption analyses as well as in twin analyses in infancy and early childhood, we hypothesized that, unlike par- ent ratings, genetic influence would emerge from our sibling adoption analyses. Al- though teacher ratings have not been used previously in genetic research on tempera- ment, we predicted that teacher ratings would also yield evidence of some genetic influence, as suggested by preliminary anal- yses of the CAP sibling data (Schmitz, 1994). Finally, although multivariate genetic analy- ses of the covariance between teacher and tester ratings have not been reported previ- ously, we hypothesized that the covariance between these two sources of information about temperament is due at least in part to heritable influences.
Schmitz et al. 411
Method
Sample.-The Colorado Adoption Proj- ect (CAP) is an ongoing, prospective longitu- dinal study of behavioral development that assesses adoptive and matched nonadoptive children with a multitude of developmen- tal measures. The CAP sample and selec- tion procedures are described elsewhere in detail (Plomin & DeFries, 1985; Plomin, DeFries, & Fulker, 1988; DeFries et al., 1994). Briefly, the adopted children were separated from their biological mothers at the average age of 4 days and were placed in their adoptive homes at the average age of 28 days. Nonadoptive families were matched to adoptive families on the basis of the child's age and gender as well as the number of children in the family and the fa- ther's educational and occupational status.
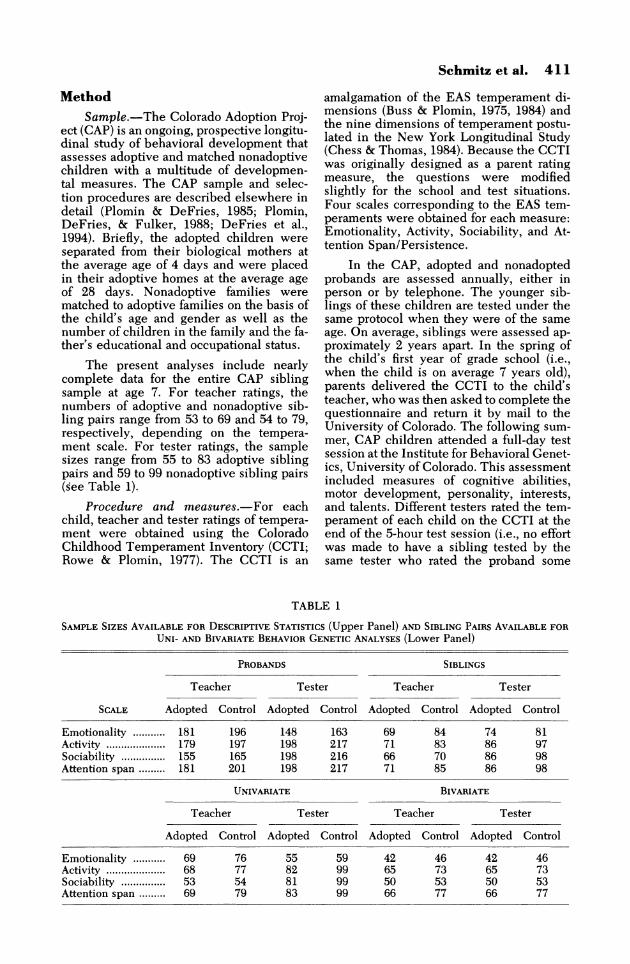
The present analyses include nearly complete data for the entire CAP sibling sample at age 7. For teacher ratings, the numbers of adoptive and nonadoptive sib- ling pairs range from 53 to 69 and 54 to 79, respectively, depending on the tempera- ment scale. For tester ratings, the sample sizes range from 55 to 83 adoptive sibling pairs and 59 to 99 nonadoptive sibling pairs (see Table 1).
Procedure and measures.-For each child, teacher and tester ratings of tempera- ment were obtained using the Colorado Childhood Temperament Inventory (CCTI; Rowe & Plomin, 1977). The CCTI is an
amalgamation of the EAS temperament di- mensions (Buss & Plomin, 1975, 1984) and the nine dimensions of temperament postu- lated in the New York Longitudinal Study (Chess & Thomas, 1984). Because the CCTI was originally designed as a parent rating measure, the questions were modified slightly for the school and test situations. Four scales corresponding to the EAS tem- peraments were obtained for each measure: Emotionality, Activity, Sociability, and At- tention Span/Persistence.
In the CAP, adopted and nonadopted probands are assessed annually, either in person or by telephone. The younger sib- lings of these children are tested under the same protocol when they were of the same age. On average, siblings were assessed ap- proximately 2 years apart. In the spring of the child's first year of grade school (i.e., when the child is on average 7 years old), parents delivered the CCTI to the child's teacher, who was then asked to complete the questionnaire and return it by mail to the University of Colorado. The following sum- mer, CAP children attended a full-day test session at the Institute for Behavioral Genet- ics, University of Colorado. This assessment included measures of cognitive abilities, motor development, personality, interests, and talents. Different testers rated the tem- perament of each child on the CCTI at the end of the 5-hour test session (i.e., no effort was made to have a sibling tested by the same tester who rated the proband some
TABLE 1
SAMPLE SIZES AVAILABLE FOR DESCRIPTIVE STATISTICS (Upper Panel) AND SIBLING PAIRS AVAILABLE FOR
UNI- AND BIVARIATE BEHAVIOR GENETIC ANALYSES (Lower Panel)
PROBANDS SIBLINGS
Teacher Tester Teacher Tester
SCALE Adopted Control Adopted Control Adopted Control Adopted Control
Emotionality ........ 181 196 148 163 69 84 74 81 Activity ................. 179 197 198 217 71 83 86 97 Sociability ............ 155 165 198 216 66 70 86 98 Attention span ......... 181 201 198 217 71 85 86 98
UNIVARIATE BIVARIATE
Teacher Tester Teacher Tester
Adopted Control Adopted Control Adopted Control Adopted Control
Emotionality ........... 69 76 55 59 42 46 42 46 Activity ................. 68 77 82 99 65 73 65 73 Sociability ............ 53 54 81 99 50 53 50 53 Attention span ......... 69 79 83 99 66 77 66 77
412 Child Development
years previously). Internal consistencies of Emotionality are .90 for teacher and .79 for tester ratings, .93 and .81 for Activity, .89 for both teacher and tester ratings of Sociability, and .93 for both ratings of Attention Span/ Persistence (Cronbach's alpha).
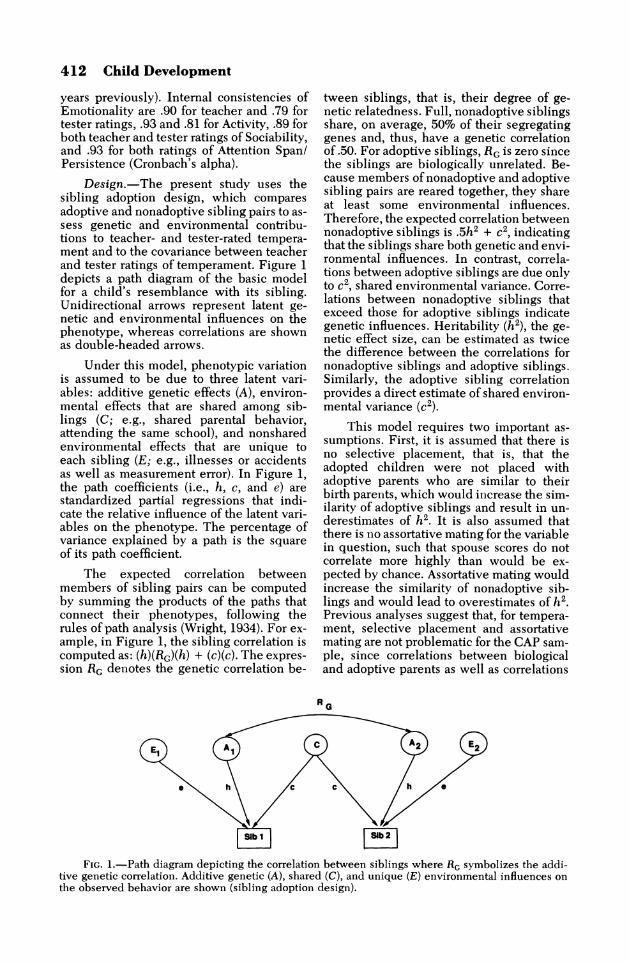
Design.-The present study uses the sibling adoption design, which compares adoptive and nonadoptive sibling pairs to as- sess genetic and environmental contribu- tions to teacher- and tester-rated tempera- ment and to the covariance between teacher and tester ratings of temperament. Figure 1 depicts a path diagram of the basic model for a child's resemblance with its sibling. Unidirectional arrows represent latent ge- netic and environmental influences on the phenotype, whereas correlations are shown as double-headed arrows.
Under this model, phenotypic variation is assumed to be due to three latent vari- ables: additive genetic effects (A), environ- mental effects that are shared among sib- lings (C; e.g., shared parental behavior, attending the same school), and nonshared environmental effects that are unique to each sibling (E; e.g., illnesses or accidents as well as measurement error). In Figure 1, the path coefficients (i.e., h, c, and e) are standardized partial regressions that indi- cate the relative influence of the latent vari- ables on the phenotype. The percentage of variance explained by a path is the square of its path coefficient.
The expected correlation between members of sibling pairs can be computed by summing the products of the paths that connect their phenotypes, following the rules of path analysis (Wright, 1934). For ex- ample, in Figure 1, the sibling correlation is computed as: (h)(Rc)(h) + (c)(c). The expres- sion RG denotes the genetic correlation be-
tween siblings, that is, their degree of ge- netic relatedness. Full, nonadoptive siblings share, on average, 50% of their segregating genes and, thus, have a genetic correlation of .50. For adoptive siblings, RG is zero since the siblings are biologically unrelated. Be- cause members of nonadoptive and adoptive sibling pairs are reared together, they share at least some environmental influences. Therefore, the expected correlation between nonadoptive siblings is .5h2 + c2, indicating that the siblings share both genetic and envi- ronmental influences. In contrast, correla- tions between adoptive siblings are due only to c2, shared environmental variance. Corre- lations between nonadoptive siblings that exceed those for adoptive siblings indicate genetic influences. Heritability (h2), the ge- netic effect size, can be estimated as twice the difference between the correlations for nonadoptive siblings and adoptive siblings. Similarly, the adoptive sibling correlation provides a direct estimate of shared environ- mental variance (c2).
This model requires two important as- sumptions. First, it is assumed that there is no selective placement, that is, that the adopted children were not placed with adoptive parents who are similar to their birth parents, which would increase the sim- ilarity of adoptive siblings and result in un- derestimates of h2. It is also assumed that there is no assortative mating for the variable in question, such that spouse scores do not correlate more highly than would be ex- pected by chance. Assortative mating would increase the similarity of nonadoptive sib- lings and would lead to overestimates of h2. Previous analyses suggest that, for tempera- ment, selective placement and assortative mating are not problematic for the CAP sam- ple, since correlations between biological and adoptive parents as well as correlations
RG
El Al C A2 E2
h 0 c h 0
Sib 1
,1 la01
FIG. 1.-Path diagram depicting the correlation between siblings where Rc symbolizes the addi- tive genetic correlation. Additive genetic (A), shared (C), and unique (E) environmental influences on the observed behavior are shown (sibling adoption design).
Schmitz et al. 413
between mothers and fathers for all three groups (adoptive, biological, and control) are generally small and nonsignificant (Plomin et al., 1991; Schmitz, 1994).
Uni- and bivariate estimates of compo- nents of variance.-In addition to examin- ing adoptive and nonadoptive sibling cor- relations, parameter estimates for the univariate case were obtained using the structural equation modeling program Mx (Neale, 1994), based on the model outlined above. These parameter estimates can be tested for their statistical significance by comparing a model with the parameter to a reduced model that constrains this parame- ter to be zero. The resulting change in X2 and model fit is the test statistic for the pa- rameter excluded from the reduced model.
The sibling adoption design can also be used to examine the degree to which genetic and environmental factors mediate the co- variation between teacher and tester ratings for each of the four assessed temperament dimensions. The essence of genetic analysis of covariance is the cross-sibling correlation, that is, the correlation between one sibling's score for a teacher-rated temperament di- mension and the other sibling's score for tes- ter ratings of the same dimension. If the co- variance between teacher and tester ratings of temperament is genetically mediated, nonadoptive cross-sibling correlations will exceed those for adoptive siblings.
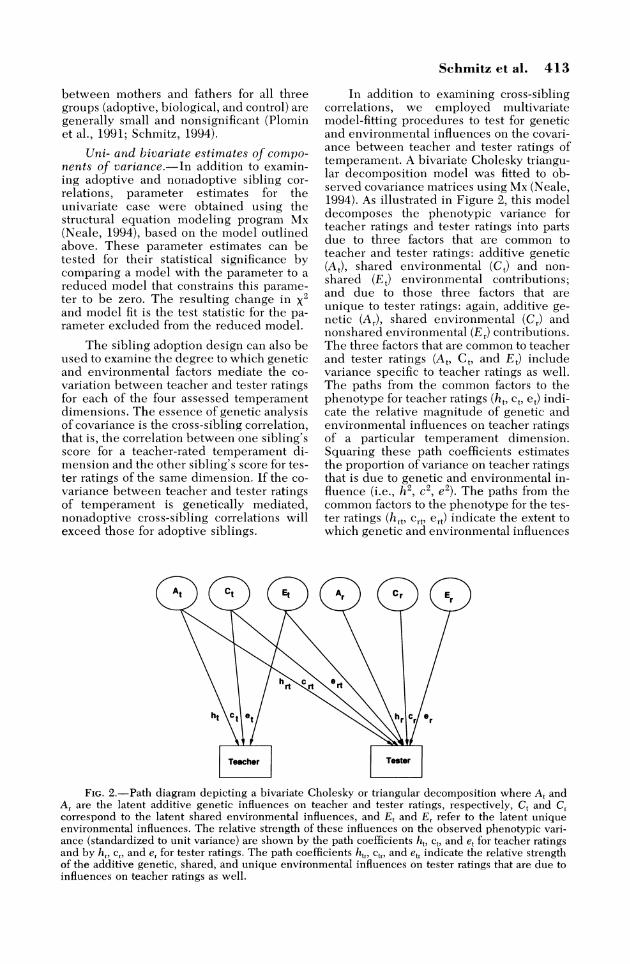
In addition to examining cross-sibling correlations, we employed multivariate model-fitting procedures to test for genetic and environmental influences on the covari- ance between teacher and tester ratings of temperament. A bivariate Cholesky triangu- lar decomposition model was fitted to ob- served covariance matrices using Mx (Neale, 1994). As illustrated in Figure 2, this model decomposes the phenotypic variance for teacher ratings and tester ratings into parts due to three factors that are common to teacher and tester ratings: additive genetic (At), shared environmental (Ct) and non- shared (Et) environmental contributions; and due to those three factors that are unique to tester ratings: again, additive ge- netic (Ar), shared environmental (Cr) and nonshared environmental (E,) contributions. The three factors that are common to teacher and tester ratings (At, Ct, and Et) include variance specific to teacher ratings as well. The paths from the common factors to the phenotype for teacher ratings (ht, ct, et) indi- cate the relative magnitude of genetic and environmental influences on teacher ratings of a particular temperament dimension. Squaring these path coefficients estimates the proportion of variance on teacher ratings that is due to genetic and environmental in- fluence (i.e., h2, C2, e2). The paths from the common factors to the phenotype for the tes- ter ratings (hrt, crt, ert) indicate the extent to which genetic and environmental influences
At t Et Ar Cr E r
h rt
c rt
9 rt
ht Ct ot hrCr r
Teacher Tester
FIG. 2.-Path diagram depicting a bivariate Cholesky or triangular decomposition where At and Ar are the latent additive genetic influences on teacher and tester ratings, respectively, Ct and Cr correspond to the latent shared environmental influences, and Et and Er refer to the latent unique environmental influences. The relative strength of these influences on the observed phenotypic vari- ance (standardized to unit variance) are shown by the path coefficients ht, ct, and et for teacher ratings and by hr, c,, and er for tester ratings. The path coefficients htr, ctr, and eT indicate the relative strength of the additive genetic, shared, and unique environmental influences on tester ratings that are due to influences on teacher ratings as well.
414 Child Development
on teacher ratings are common to tester rat- ings. The paths from the three unique factors to the phenotype for tester ratings (h,, Cr, er) represent genetic and environmental influ- ences on tester ratings that are independent of genetic and environmental influences on teacher ratings. The proportion of variance of tester ratings that is due to genetic or envi- ronmental influences is estimated by sum- ming the squared path coefficient for the path leading from the common factor to the tester rating and the squared path coefficient leading from the unique factor to the tester rating (e.g., h2 +
hr). The product of the
genetic paths from At, the common genetic factor, to the teacher and tester phenotypes, i.e., (ht)(hr),
estimates the genetic contribu- tion to the phenotypic correlation between teacher and tester ratings. The order of vari- ables included in this model is arbitrary; that is, modeling common factors for tester rat- ings and unique factors for teacher ratings will give identical results regarding the rela- tive size of the variance components while path coefficients will differ. All parameter estimates (i.e., h2, h2) are standardized to sum to unity.
Results
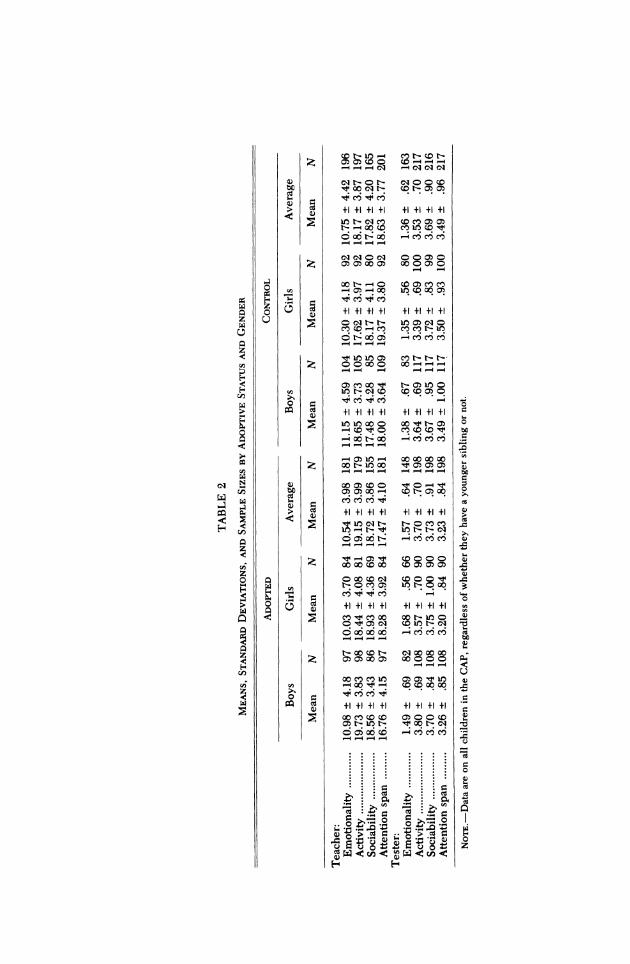
Descriptive statistics.-Table 2 lists the means, standard deviations, and sample sizes, by adoptive status and gender, for teacher and tester ratings of temperament. These descriptive statistics are given for all adopted and nonadopted children, regard- less of whether they have siblings or not. Siblings are not included in these calcula- tions, since siblings in adoptive families could be either the biological child of the adoptive parents or a second adopted child.
To evaluate mean differences in our sample, 2 x 2 analyses of variance were con- ducted (adoptive vs. nonadoptive x gen- der). For teacher ratings each of the four scales consists of five items that are summed to give a scale score. For tester ratings, how- ever, the number of items per scale varies, and an averaged score is therefore given. The sample sizes differ per scale, depending on the availability of ratings. Sample sizes for both descriptive statistics and subse- quent behavior genetic analyses are given in Table 1.
Both teachers and testers rated adopted children, regardless of their gender, as more active and less attentive than nonadoptive children, Activity, F(1, 372) = 5.69, p < .05, for teachers and F(1, 411) = 6.20, p < .05,
for testers, respectively; Attention Span, F(1, 378) = 8.70, p < .01, for teachers and F(1, 411) = 8.41, p < .01, for testers, respec- tively. Additionally, adoptive children were rated as more sociable by teachers, F(1, 316) = 4.20, p < .05, and as more emotional by testers, F(1, 307) = 9.08, p < .01. Boys, re- gardless of their adoption status, were rated as being more emotional, F(1, 373) = 4.30, p < .05, and less attentive, F(1, 378) = 13.13, p < .001, by their teachers, and as more ac- tive by both teachers, F(1, 372) = 8.24, p < .01, and testers, F(1, 411) = 12.42, p < .001. All of these differences, however, were small and accounted for only 1.1%-2.9% of the observed variation. No significant gen- der x adoptive status interactions were found.
Phenotypic correlations between teacher and tester ratings, combining ratings of both adopted and nonadopted children as well as their siblings, are moderate and significant for three of the temperament dimensions: Attention Span, r(521) = .29, p < .001, So- ciability, r(439) = .26, p < .001, and Activity, r(512) = .19, p < .001. Emotionality was the only scale for which the correlation between teacher and tester ratings was nonsignifi- cant, r(398) = .07, p > .05.
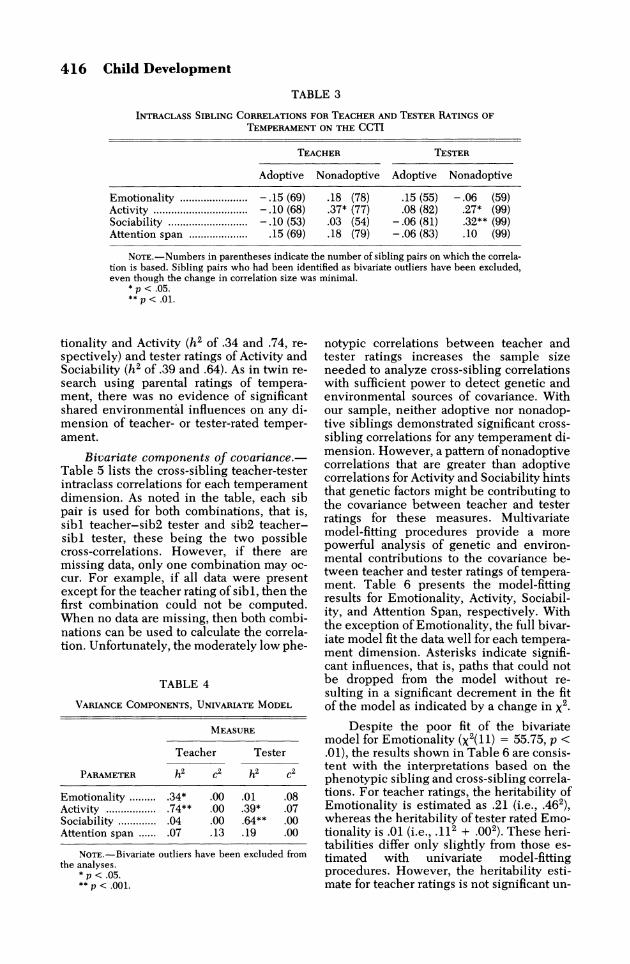
Adoptive and nonadoptive sibling in- traclass correlations for teacher and tester ratings of temperament are presented in Ta- ble 3. Sibling pairs who had been identified as bivariate outliers via Cook's D statistic have been excluded, even though the change in correlation was minimal. For both teachers and testers, the correlations for adoptive siblings are low and nonsignificant. In contrast, nonadoptive sibling correlations are significant for teacher and tester ratings of Activity and for tester ratings of Sociabil- ity. Thus, individual differences on these two measures may be due in part to genetic influences. In addition, teacher ratings of Emotionality may also be genetically influ- enced. Although neither the adoptive nor nonadoptive correlations for teacher ratings of Emotionality are significantly different from zero for this sample size, the correla- tion for nonadoptive siblings is significantly different from that for adoptive siblings.
Univariate components of variance.-- Estimates ofheritability and shared environ- mental variance derived from the univariate model are presented in Table 4. Consistent with our interpretation of sibling intraclass correlations, significant genetic influences were apparent for teacher ratings of Emo-
?c t- In CO t- ? t
$* 114 CO I" CO - J JC Q) '0 C C
> +1 +I +1 +1 +1 +1 +1 +1 +1 U-3 t- cq co cD co m mCS
r- r-4 00 ?c CO in cD V
6 o6 rt o6 c6 c6 c6 r--4 r--4 r-4 r--4 CZ CSl C)~o CS~ o COMO
mm 00 m 00( C) mS C) C r--4 r--
00r--4C) - C C
m0tr--400 o?c0
+ 1 +1 +1 +1 +1 +1 +1 +1
CQ C-CO COCO i 6 t- o6 cS v? c-i c-i
r-- r-- r--4 r--4 ~ ~
o 00000 00---1 r-4r--4 --4 r- -4r H~ m CO 00 t m-Ouk 0
0 Io C
C~ +1 +1 +1 +1 +1 +1 +1 +1
kfnk 000 0 00 -v 0, o 'V0 ? b
o6 t--: o6- ci ci ci c
V5 -1 ~00 00 00 00
eq00 t- 0 00 VM M ( 00 L00 M 'tc 0 bO m CQ~ D 00 t- CD 00 0 C
w co o
'.43C) co
> C +1 +1 +1 +1 +1 +1 +1
4 t- t-- -
mC O) t--- V tn - t- 01l 6 o6 t--: ci coi coi
00 00 ?c00 C M
SL000 c (0q t- m CD t, 00 > O g p 4
C Cj d;-4 COS 0 C d +1 +1 +1 +1 +1 +1 +1 +1
M V M00 00 t-- in CD o c~l rZLn~ cqi
6od od o 6 c6 c6 c,6 s-c
00- 000D t- cq 00 00 00 (m 00 CDI C000000
00 M m i n CDMV in2 o 00 IV (0(00000
c d +1 +1 +1 +1 +1 +1 +1 +1 S 00 m (D (D CD 00(C)
CD t- V- 5t V00f7- cqi " 0 o600(0 c6 c6 cj
* C
C C" C
P.-
4 ?1 o d
H H V.4 " 0
416 Child Development
TABLE 3
INTRACLASS SIBLING CORRELATIONS FOR TEACHER AND TESTER RATINGS OF TEMPERAMENT ON THE CCTI
TEACHER TESTER
Adoptive Nonadoptive Adoptive Nonadoptive
Emotionality ....................... -.15 (69) .18 (78) .15 (55) - .06 (59) Activity ............................. -.10 (68) .37* (77) .08 (82) .27* (99) Sociability ...........................
-.10 (53) .03 (54) - .06 (81) .32** (99) Attention span ................. .15 (69) .18 (79) -.06 (83) .10 (99)
NoTE.-Numbers in parentheses indicate the number of sibling pairs on which the correla- tion is based. Sibling pairs who had been identified as bivariate outliers have been excluded, even though the change in correlation size was minimal.
* p < .05. ** p < .01.
tionality and Activity (h2 of .34 and .74, re- spectively) and tester ratings of Activity and Sociability (h2 of .39 and .64). As in twin re- search using parental ratings of tempera- ment, there was no evidence of significant shared environmenthl influences on any di- mension of teacher- or tester-rated temper- ament.
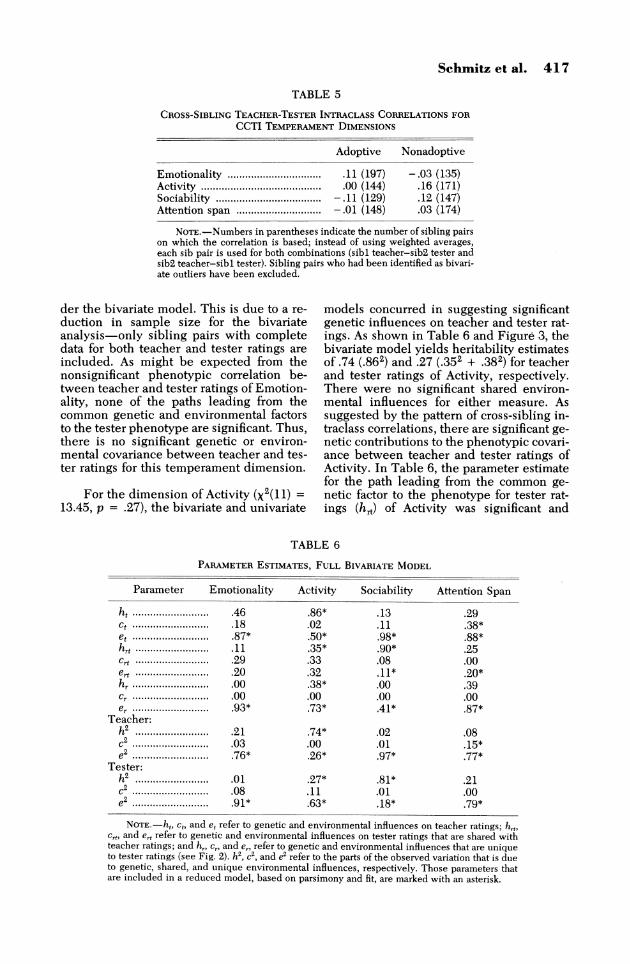
Bivariate components of covariance.- Table 5 lists the cross-sibling teacher-tester intraclass correlations for each temperament dimension. As noted in the table, each sib pair is used for both combinations, that is, sibl teacher-sib2 tester and sib2 teacher- sibl tester, these being the two possible cross-correlations. However, if there are missing data, only one combination may oc- cur. For example, if all data were present except for the teacher rating of sibl, then the first combination could not be computed. When no data are missing, then both combi- nations can be used to calculate the correla- tion. Unfortunately, the moderately low phe-
TABLE 4
VARIANCE COMPONENTS, UNIVARIATE MODEL
MEASURE
Teacher Tester
PARAMETER h2 c2 h2 c 2
Emotionality ......... .34* .00 .01 .08 Activity .............. .74** .00 .39* .07 Sociability ........... 04 .00 .64** .00 Attention span ...... .07 .13 .19 .00
NOTE.-Bivariate outliers have been excluded from the analyses.
* p < .05. ** p < .001.
notypic correlations between teacher and tester ratings increases the sample size needed to analyze cross-sibling correlations with sufficient power to detect genetic and environmental sources of covariance. With our sample, neither adoptive nor nonadop- tive siblings demonstrated significant cross- sibling correlations for any temperament di- mension. However, a pattern of nonadoptive correlations that are greater than adoptive correlations for Activity and Sociability hints that genetic factors might be contributing to the covariance between teacher and tester ratings for these measures. Multivariate model-fitting procedures provide a more powerful analysis of genetic and environ- mental contributions to the covariance be- tween teacher and tester ratings of tempera- ment. Table 6 presents the model-fitting results for Emotionality, Activity, Sociabil- ity, and Attention Span, respectively. With the exception of Emotionality, the full bivar- iate model fit the data well for each tempera- ment dimension. Asterisks indicate signifi- cant influences, that is, paths that could not be dropped from the model without re- sulting in a significant decrement in the fit of the model as indicated by a change in x2.
Despite the poor fit of the bivariate model for Emotionality (X2(11) = 55.75, p < .01), the results shown in Table 6 are consis- tent with the interpretations based on the phenotypic sibling and cross-sibling correla- tions. For teacher ratings, the heritability of Emotionality is estimated as .21 (i.e., .462), whereas the heritability of tester rated Emo- tionality is .01 (i.e., .112 + .002). These heri- tabilities differ only slightly from those es- timated with univariate model-fitting procedures. However, the heritability esti- mate for teacher ratings is not significant un-
Schmitz et al. 417
TABLE 5
CROSS-SIBLING TEACHER-TESTER INTRACLASS CORRELATIONS FOR CCTI TEMPERAMENT DIMENSIONS
Adoptive Nonadoptive
Emotionality ............................. .11 (197) - .03 (135) Activity ..................................... .00 (144) .16 (171) Sociability .............................. -.11 (129) .12 (147) Attention span ............................. -.01 (148) .03 (174)
NoTE.-Numbers in parentheses indicate the number of sibling pairs on which the correlation is based; instead of using weighted averages, each sib pair is used for both combinations (sibl teacher-sib2 tester and sib2 teacher-sibl tester). Sibling pairs who had been identified as bivari- ate outliers have been excluded.
der the bivariate model. This is due to a re- duction in sample size for the bivariate analysis-only sibling pairs with complete data for both teacher and tester ratings are included. As might be expected from the nonsignificant phenotypic correlation be- tween teacher and tester ratings of Emotion- ality, none of the paths leading from the common genetic and environmental factors to the tester phenotype are significant. Thus, there is no significant genetic or environ- mental covariance between teacher and tes- ter ratings for this temperament dimension.
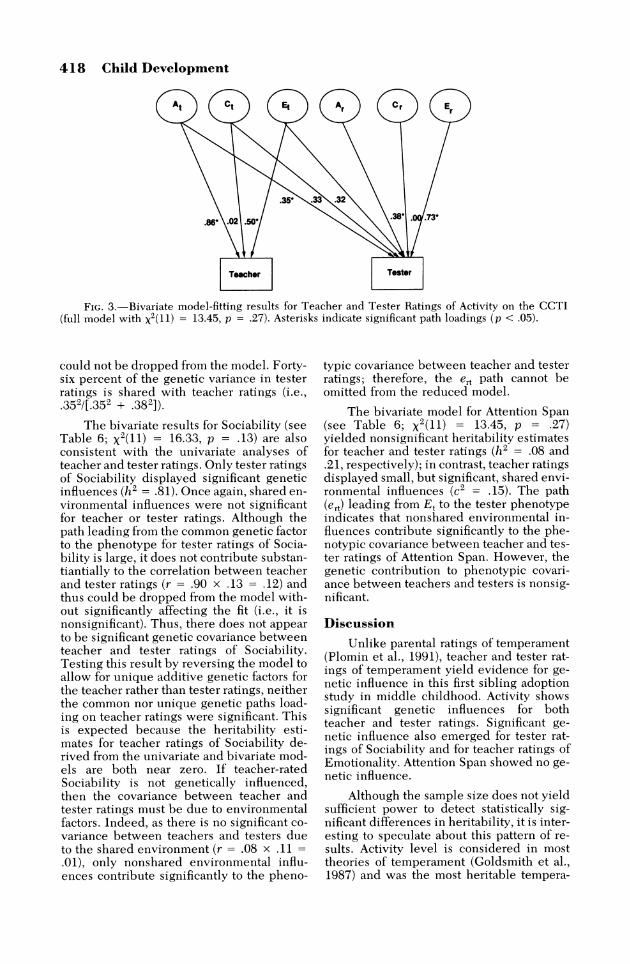
For the dimension of Activity (X2(11) = 13.45, p = .27), the bivariate and univariate
models concurred in suggesting significant genetic influences on teacher and tester rat- ings. As shown in Table 6 and Figure 3, the bivariate model yields heritability estimates of .74 (.862) and .27 (.352 + .382) for teacher and tester ratings of Activity, respectively. There were no significant shared environ- mental influences for either measure. As suggested by the pattern of cross-sibling in- traclass correlations, there are significant ge- netic contributions to the phenotypic covari- ance between teacher and tester ratings of Activity. In Table 6, the parameter estimate for the path leading from the common ge- netic factor to the phenotype for tester rat- ings (hr) of Activity was significant and
TABLE 6
PARAMETER ESTIMATES, FULL BIVARIATE MODEL
Parameter Emotionality Activity Sociability Attention Span
ht .......................... .46 .86* .13 .29 ct .......................... .18 .02 .11 .38* et ....................... .87* .50* .98* .88* hrt ......................... .11 .35* .90* .25 c, ......................... .29 .33 .08 .00 er ......................... .20 .32 .11* .20* hr ....................... .00 .38* .00 .39 Cr ....................... .00 .00 .00 .00 er .......................... .93* .73* .41* .87*
Teacher: h2 ......................... .21 .74* .02 .08 c2 .......................... .03 .00 .01 .15* e2 .......................... .76* .26* .97* .77*
Tester: h2 ......................... .01 .27* .81* .21 c2 .......................... .08 .11 .01 .00 e2 .......................... .91* .63* .18* .79*
NOTE.-hE, ct, and et refer to genetic and environmental influences on teacher ratings; he, c,, and et refer to genetic and environmental influences on tester ratings that are shared with teacher ratings; and h,, Cr, and er, refer to genetic and environmental influences that are unique to tester ratings (see Fig. 2). h2, c2, and e2 refer to the parts of the observed variation that is due to genetic, shared, and unique environmental influences, respectively. Those parameters that are included in a reduced model, based on parsimony and fit, are marked with an asterisk.
418 Child Development
At Ct Et Ar Cr EEr
.35* .33 .32
.86* .02 .50*38* .73*
Teacher Tester
FIG. 3.-Bivariate model-fitting results for Teacher and Tester Ratings of Activity on the CCTI (full model with X2(11) = 13.45, p = .27). Asterisks indicate significant path loadings (p < .05).
could not be dropped from the model. Forty- six percent of the genetic variance in tester ratings is shared with teacher ratings (i.e., .352/[.352 + .382]).
The bivariate results for Sociability (see Table 6; ?2(11) = 16.33, p = .13) are also consistent with the univariate analyses of teacher and tester ratings. Only tester ratings of Sociability displayed significant genetic influences (h2 = .81). Once again, shared en- vironmental influences were not significant for teacher or tester ratings. Although the path leading from the common genetic factor to the phenotype for tester ratings of Socia- bility is large, it does not contribute substan- tiantially to the correlation between teacher and tester ratings (r = .90 x .13 = .12) and thus could be dropped from the model with- out significantly affecting the fit (i.e., it is nonsignificant). Thus, there does not appear to be significant genetic covariance between teacher and tester ratings of Sociability. Testing this result by reversing the model to allow for unique additive genetic factors for the teacher rather than tester ratings, neither the common nor unique genetic paths load- ing on teacher ratings were significant. This is expected because the heritability esti- mates for teacher ratings of Sociability de- rived from the univariate and bivariate mod- els are both near zero. If teacher-rated Sociability is not genetically influenced, then the covariance between teacher and tester ratings must be due to environmental factors. Indeed, as there is no significant co- variance between teachers and testers due to the shared environment (r = .08 x .11 =
.01), only nonshared environmental influ- ences contribute significantly to the pheno-
typic covariance between teacher and tester ratings; therefore, the er path cannot be omitted from the reduced model.
The bivariate model for Attention Span (see Table 6; X2(11) = 13.45, p = .27) yielded nonsignificant heritability estimates for teacher and tester ratings (h2 = .08 and .21, respectively); in contrast, teacher ratings displayed small, but significant, shared envi- ronmental influences (c2 = .15). The path (er) leading from Et to the tester phenotype indicates that nonshared environmental in- fluences contribute significantly to the phe- notypic covariance between teacher and tes- ter ratings of Attention Span. However, the genetic contribution to phenotypic covari- ance between teachers and testers is nonsig- nificant.
Discussion
Unlike parental ratings of temperament (Plomin et al., 1991), teacher and tester rat- ings of temperament yield evidence for ge- netic influence in this first sibling adoption study in middle childhood. Activity shows significant genetic influences for both teacher and tester ratings. Significant ge- netic influence also emerged for tester rat- ings of Sociability and for teacher ratings of Emotionality. Attention Span showed no ge- netic influence.
Although the sample size does not yield sufficient power to detect statistically sig- nificant differences in heritability, it is inter- esting to speculate about this pattern of re- sults. Activity level is considered in most theories of temperament (Goldsmith et al., 1987) and was the most heritable tempera-
Schmitz et al. 419
mental dimension in this study. Activity shows genetic influence in studies of mice (Plomin & Saudino, 1994), in twin and adop- tion research using tester ratings (Braungart et al., 1992; Matheny, 1980; Saudino et al., in press), and in twin research using acto- meters (Saudino & Eaton, 1991, in press). The present study adds to this evidence for significant genetic influence for both teacher and tester ratings at 7 years of age using the sibling adoption design, even though mem- bers of the sibling pairs were rated by differ- ent teachers and testers on average 2 years apart.
The suggestion of genetic influence for tester but not teacher ratings of sociability is at first surprising. Teachers might be ex- pected to be better judges of children's so- ciability than testers, who see the children only in a one-on-one testing situation. How- ever, this might serve as a clue for the differ- ences in genetic results for teacher and tes- ter ratings. Teachers rate gregariousness and other social responses with familiar persons because the teachers were not asked to rate the children until well into the school year, when both the teacher and the other stu- dents are familiar to the rated child. In con- trast, testers rate children's social interac- tions with a stranger (i.e., the tester), which may be more a matter of shyness than socia- bility (Buss & Plomin, 1984). An observa- tional twin study of infants suggests that so- cial responding to a stranger shows genetic influence whereas social responding to a fa- miliar person does not (Plomin & Rowe, 1979). A hypothesis for future research is that social responses to familiar figures may show less genetic influence than social inter- actions with strangers.
For emotionality, some genetic influ- ence was suggested for teacher ratings but not for tester ratings. It seems reasonable to hypothesize that teachers have more oppor- tunity to see children upset than do testers, whose job it is not to upset the children they test.
Attention span shows no significant ge- netic influence, either for teacher or tester ratings. Attention span is one component of impulsivity which was initially included as part of the emotionality-activity-sociability- impulsivity (EASI) temperament theory of Buss and Plomin (1975). However, in a re- view of research findings a decade later, they concluded that although evidence for the heritability of the EAS temperaments had strengthened during the decade, the
picture had become no clearer for impulsiv- ity and thus dropped the "I" from their EASI theory (Buss & Plomin, 1984). The present results support this decision. The greater im- pact of shared environmental influences on this dimension of temperament also implies an intervention strategy that differs from those regarding other aspects of tempera- ment, in that not only unique environmental influences are of importance.
The relation between heritability and the definition of temperament needs clarifi- cation. We agree with the general definition of temperament offered by Bates (1989) that temperament "consists of biologically rooted individual differences in behavior tendencies that are present early in life and are relatively stable across various kinds of situations and over the course of time." The biological roots that interest us are genetic factors, that is, DNA-based differences among individuals that are transmitted he- reditarily. Other biological roots, like the en- docrine or the nervous system, are of special interest to other researchers (Bates & Wachs, 1994). Heritability is our attempt to limit what we mean by the term "biological roots." Personality traits that show no ge- netic influence-such as neonatal behavior (Riese, 1990) and low-arousal emotions such as smiling (Plomin, 1987)-are of less inter- est to us in this context, although such di- mensions of behavior may be of great inter- est to others. If there can be no absolute definition of temperament, all that is impor- tant is for researchers to be clear about set- ting bounds on what they mean by tempera- ment. This situation is not different from that of research on intelligence (McCall in Gold- smith et al., 1987) or other areas.
The present results are interesting in terms of nurture as well as nature. Genetic research on personality as assessed by self- report questionnaire in adolescents and adults clearly attributes environmental vari- ance to nonshared environment rather than shared environment (Plomin & Daniels, 1987). A similar tentative conclusion appears to emerge from twin research using tester ratings, observations, and objective mea- sures of children's temperament. However, twin studies have limited power to detect shared environmental influence because it is indicated by residual twin resemblance not attributable to genetic resemblance (Martin, Eaves, Kearsey, & Davies, 1978). The sibling adoption design has much greater power to detect shared environmen- tal influence because the resemblance of
420 Child Development
adoptive siblings directly estimates shared environmental influence (e.g., Plomin, Chi- puer, & Neiderhiser, 1994). Despite the power of this design, the results for teacher and tester ratings in the present study con- firm the results of twin studies in suggesting that there is no significant shared environ- mental influence. The largest correlation for adoptive siblings (Table 3) is only .15, and model-fitting analyses (Table 4) yield non- significant estimates of shared environ- ment-indeed, most of the estimates are at or near zero.
A novel question raised by the bivariate genetic analyses is the extent to which ge- netic influences on teacher ratings of tem- perament are linked to genetic influences on tester ratings. The answer is clear for activ- ity, the only dimension of temperament that showed significant genetic influence for both teacher and tester ratings. Genetic fac- tors are entirely responsible for the covari- ance between teacher and tester ratings, even though the teacher-tester phenotypic correlation is modest. In other words, what the teachers and testers see in common in children's activity can be entirely attributed to genetic factors. This supports a transsitua- tional view of the genetic underpinnings of activity. However, even for activity, some significant genetic influence is unique to tes- ter ratings. That is, even though the modest covariance between teacher and tester rat- ings can be explained entirely by genetic factors, significant genetic effects on tester ratings of activity are independent of teacher ratings. This latter finding supports a situa- tional specificity view at the level of genetic etiology. With situational specificity we do not mean a sampling of different aspects of the school situation, like classroom and re- cess for the school situation but, rather, the different quality of the school setting versus the laboratory setting.
Situational specificity of genetic influ- ence is obvious for Sociability and Emotion- ality because genetic influence is significant only for tester ratings of sociability and only for teacher ratings of emotionality. Because genetic influence does not contribute to both teacher and tester ratings for these traits, it is not possible for genetic influence to ac- count for the covariance between teacher and tester ratings. Moreover, for emotional- ity, the phenotypic correlation between teacher and tester ratings was nonsignifi- cant. Together these findings suggest that genetic influences are contextually bound to a greater extent than one would expect from
reading the temperament literature. Our in- terpretation is not that there are "tempera- ment genes" unique to different contexts but rather that different contexts provide differ- ent views of temperament and thus engage different genetic influences on processes relevant to each context.
The bivariate results are interesting as well from an environmental perspective. First, because shared environmental influ- ence is of negligible importance for both teacher and tester ratings, it is not surprising that shared environmental factors contribute nothing to the phenotypic covariance be- tween teacher and tester ratings of tempera- ment. Second, nonshared environmental fac- tors are responsible for the covariance between teacher and tester ratings for Atten- tion Span. This finding implies that the etiol- ogy of what teachers and testers both see in relation to children's attention span has to do with events unique to the child that are not shared with the child's sibling. Although research on specific sources of nonshared environment have only begun, findings of this type may provide clues as to what these influences might be. A first guess might be that nonshared environmental influences are situationally specific, but the present find- ings suggest that, whatever they are, non- shared environmental influences on atten- tion span show a transsituational effect that transcends the school and laboratory set- tings.
Although research using other methods and measures is needed to confirm these re- sults, at the least they suggest the usefulness of teacher and tester raters for investigating genetic and environmental influences on temperament in middle childhood. Identical and fraternal twins have been added to the Colorado Adoption Project (CAP), which will make it possible to make direct compari- son between the present sibling adoption re- sults and twin study results when sufficient numbers of twins have been studied at 7 years of age.
This research leaves many more ques- tions than answers. One question of special interest to us is how genetic and environ- mental influences will unfold during devel- opment through the transition to adoles- cence. Because the CAP children in the present study are being studied longitudi- nally at 9, 10, 11, and 12 using the same mea- sures, we will be able to explore this issue in the future.
Schmitz et al. 421
References
Achenbach, T. M., McConaughy, S. H., & Howell, C. T. (1987). Child/adolescent behavioral and emotional problems: Implications of cross- informant correlations for situational speci- ficity. Psychological Bulletin, 101, 213-232.
Bates, J. E. (1989). Concepts and measures of tem- perament. In G. A. Kohnstamm, J. E. Bates, & M. K. Rothbart (Eds.), Temperament in childhood (pp. 3-26). Wiley: New York.
Bates, J. E., & Wachs, T. D. (Eds.). (1994). Tem- perament: Individual differences at the inter- face of biology and behavior. Washington, DC: American Psychological Association.
Bayley, N. (1969). Manual for the Bayley Scales of Infant Development. New York: Psycho- logical Corp.
Braungart, J. M., Plomin, R., DeFries, J. C., & Fulker, D. W. (1992). Genetic influence on tester-rated infant temperament as assessed by Bayley's Infant Behavior Record: Non- adoptive and adoptive siblings and twins. De- velopmental Psychology, 28, 40-47.
Buss, A. H., & Plomin, R. (1975). A temperament theory of personality development. New York: Wiley-Interscience.
Buss, A. H., & Plomin, R. (1984). Temperament: Early developing personality traits. Hills- dale, NJ: Erlbaum.
Chess, S., & Thomas, A. (1984). Origins and evo- lution of behavior disorders: Infancy to early adult life. New York: Brunner/Mazel.
DeFries, J. C., Plomin, R., & Fulker, D. W. (1994). Nature and nurture during middle childhood. Oxford: Blackwell.
Goldsmith, H. H., Buss, A. H., Plomin, R., Roth- bart, M. K., Thomas, A., Chess, S., Hinde, R. A., & McCall, R. B. (1987). Roundtable: What is temperament? Four approaches. Child Development, 58, 505-529.
Goldsmith, H. H., & Campos, J. J. (1986). Funda- mental issues in the study of early tempera- ment: The Denver Twin Temperament Study. In M. E. Lamb, A. L. Brown, & B. Ro- goff (Eds.), Advances in developmental psy- chology (Vol. 4, pp. 231-283). Hillsdale, NJ: Erlbaum.
Goldsmith, H. H., & Gottesman, I. I. (1981). Ori- gins of variation in behavioral style: A longi- tudinal study of temperament in young twins. Child Development, 52, 91-103.
Keogh, B. K. (1982). Children's temperament and teachers' decisions. In R. Porter & G. M. Col- lins (Eds.), Temperamental differences in in- fants and young children (Ciba Foundation Symposium 89). Pitman: London.
Martin, N. G., & Eaves, L. J. (1977). The genetical analysis of covariance structure. Heredity, 38, 79-95.
Martin, N. G., Eaves, L. J., Kearsey, M. J., & Da- vies, P. (1978). The power of the classical twin study. Heredity, 40, 97-116.
Matheny, A. P. J. (1980). Bayley's Infant Behavior Record: Behavioral components and twin analyses. Child Development, 51, 1157-1167.
Matheny, A. P. J. (1989). Children's behavioral in- hibition over age and across situations: Ge- netic similarity for a trait during change. Jour- nal of Personality, 57, 1-21.
Neale, M. C. (1994). Mx: Statistical modeling (2d ed.). Richmond, VA: Medical College of Vir- ginia, Department of Psychiatry.
Plomin, R. (1981). Heredity and temperament: A comparison of twin data for self-report ques- tionnaires, parental ratings, and objectively assessed behavior. In L. Gedda, P. Parisi, & W. E. Nance (Eds.), Progress in clinical and biological research, Twin research 3: Part B. Intelligence, personality, and development (pp. 269-278). New York: Alan R. Liss.
Plomin, R. (1986). Development, genetics, and psychology. Hillsdale, NJ: Erlbaum.
Plomin, R. (1987). Developmental behavioral ge- netics and infancy. In J. Osofsky (Ed.), Hand- book of infant development (2d ed., pp. 363- 417). New York: Wiley-Interscience.
Plomin, R., Chipuer, H. M., & Loehlin, J. C. (1990). Behavioral genetics and personality. In L. A. Pervin (Ed.), Handbook of personal- ity: Theory and research. New York: Guilford.
Plomin, R., Chipuer, H. M., & Neiderhiser, J. M. (1994). Behavioral genetic evidence for the importance of nonshared environment. In E. M. Hetherington, D. Reiss, & R. Plomin (Eds.), Separate social worlds of siblings: Im- portance of nonshared environment on devel- opment (pp. 1-31). Hillsdale, NJ: Erlbaum.
Plomin, R., Coon, H., Carey, G., DeFries, J. C., & Fulker, D. W. (1991). Parent-offspring and sibling adoption analyses of parental ratings of temperament in infancy and childhood. Journal of Personality, 59, 705-732.
Plomin, R., & Daniels, D. (1987). Why are chil- dren in the same family so different from each other? Behavioral and Brain Sciences, 10, 1-16.
Plomin, R., & DeFries, J. C. (1979). Multivariate behavioral genetic analysis of twin data on scholastic abilities. Behavior Genetics, 9, 505-517.
Plomin, R., & DeFries, J. C. (1985). Origins of individual differences in infancy: The Colo- rado Adoption Project. Orlando: Academic.
Plomin, R., DeFries, J. C., & Fulker, D. W. (1988). Nature and nurture during infancy and early childhood. Cambridge: Cambridge Univer- sity Press.
Plomin, R., Emde, R. N., Braungart, J. M.,
422 Child Development
Campos, J., Corley, R., Fulker, D. W., Kagan, J., Reznick, J. S., Robinson, J., Zahn-Waxler, C., & DeFries, J. C. (1993). Genetic change and continuity from 14 to 20 months: The MacArthur Longitudinal Twin Study. Child Development, 64, 1354-1376.
Plomin, R., & Foch, T. T. (1980). A twin study of objectively assessed personality in childhood. Journal of Personality and Social Psychology, 39, 680-688.
Plomin, R., & Rowe, D. C. (1979). A twin study of temperament in young children. Journal of Psychology, 97, 107-113.
Plomin, R., & Saudino, K. J. (1994). Quantitative genetics and molecular genetics. In J. E. Bates & T. D. Wachs (Eds.), Temperament: Individual differences at the interface of bi- ology and behavior (pp. 143-171). Washing- ton, DC: American Psychological Association.
Riese, M. L. (1990). Neonatal temperament in monozygotic and dizygotic twin pairs. Child Development, 61, 1230-1237.
Rowe, D. C., & Plomin, R. (1977). Temperament in early childhood. Journal of Personality As- sessment, 41, 150-156.
Saudino, K. J., DeFries, J. C., & Plomin, R. (in press). Tester-rated temperament at 14, 20, and 24 months: Environmental change and genetic continuity. British Journal of Devel- opmental Psychology.
Saudino, K. J., & Eaton, W. 0. (1991). Infant tem- perament and genetics: An objective twin study of motor activity level. Child Develop- ment, 62, 1167-1174.
Saudino, K. J., & Eaton, W. O. (in press). Continu- ity and change in objectively assessed tem- perament: A longitudinal twin study of activ- ity level. British Journal of Developmental Psychology.
Schmitz, S. (1994). Temperament and personality. In J. C. DeFries, R. Plomin, & D. W. Fulker (Eds.), Nature and nurture during middle childhood (pp. 120-140). Oxford: Blackwell.
Stevenson, J., & Fielding, J. (1985). Ratings of temperament in families of young twins. Brit- ish Journal of Developmental Psychology, 3, 143-152.
Wright, S. (1934). The method of path coefficients. Annals of Mathematical Statistics, 5, 161-215.