Embed Size (px)
Citation preview
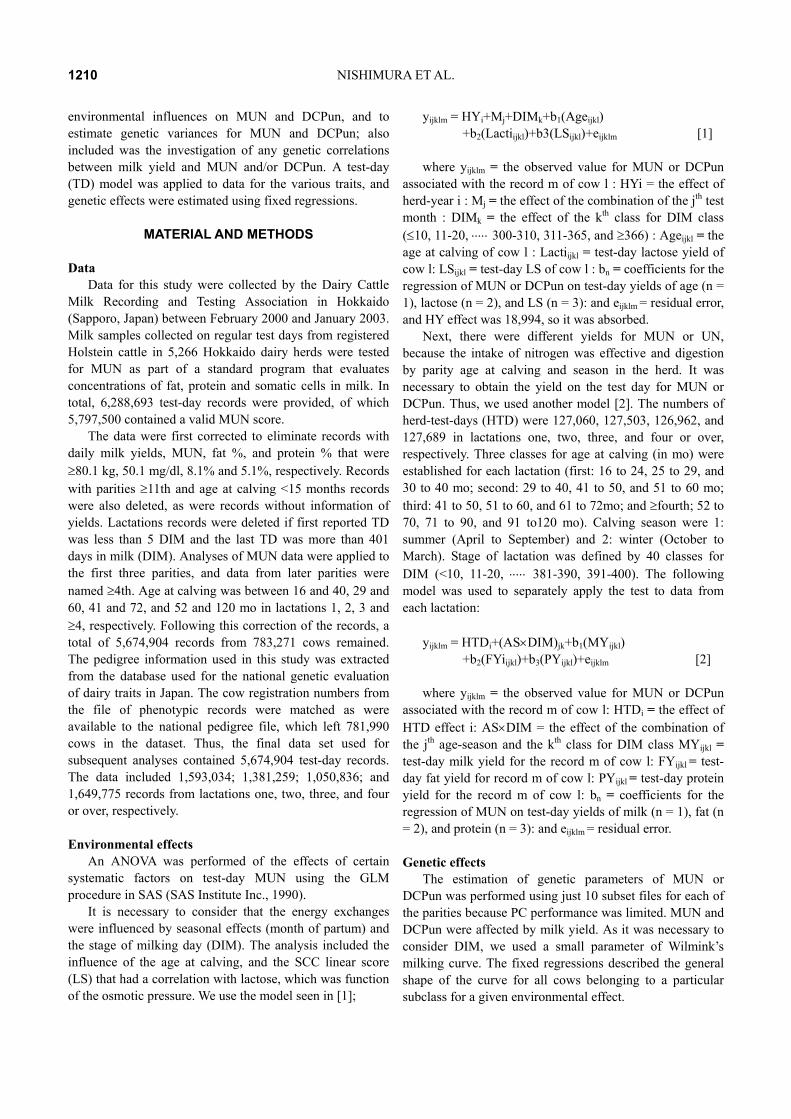
1209
INTRODUCTION If useful tools existed for the prediction of nitrogen
utilization efficiency, and so minimize any negative load on the environment, but not reduce milk yield, the excretion of nitrogen in feces or urine would be reduced; furthermore, it would be possible to better and more economically manage dairy herds. However, it is extremely difficult to effectively use the intake the nutrition to ascertain milk production. Recently, a simple index that uses milk urea nitrogen (MUN) has been used for the estimation of the efficiency of nitrogen utilization.
MUN is a rapid tool to estimate urinary nitrogen (UN) excretion in dairy cows (Jonker et al., 1998). High concentrations of urea in blood and milk can result from excess dietary protein (Baker et al., 1995; Broderick and Clayton, 1997) leading to excess UN, which can have a negative environmental impact (Kohn et al., 1997). It has been reported that protein efficiency (milk protein/feed protein consumed) of dairy cows can be improved by various feeding strategies and dietary manipulations (Baker et al., 1995; Vagnoni and Broderick, 1997; Mackle et al., 1999). Also, Ootani et al. (2001) reported the possibility of
control of a reasonable nitrogen intake by using predicted digestive crude protein percentage of requirement (DCPun), which is an estimation from UN. Therefore, low DCPun reflects high efficiency for nitrogen processed in relation to milk production. Further, high DCPun did not change milk production. Therefore, it is possible to use a simple index whereby DCPun is suggested to assist in avoiding unnecessary excess intake for dairy cows in a herd.
A high producing dairy cow is under conditions of high metabolic demand during the period immediately following parturition, due to the metabolic demands of increased milk production largely achieved through breeding programs that have emphasized increased yields. The ability to handle these stresses without suffering any ill effect is extremely important from the viewpoints of both animal welfare and farm economics. However, excess nitrogen intake is disadvantageous from an economic perspective and in respect to environmental load. Therefore, a simple index that can reflect the efficiency of nutrition control and to support milk production is a necessity.
The objectives of this study were to obtain information regarding genetic factors affecting MUN and DCPun. The measurement and recording of MUN is important for estimating the nutrition status of cows and in identifying energy balance problems (Eicher et al., 1999). The potential exists for this information could be useful for producers in their management from a genetic perspective; also, it is a tool for monitoring the efficiency of various utilizations. This study aimed to determine the effects of systematic
Genetic Relationships between MUN, and Predicted DCPun in Hokkaido Holstein Cows
Kazuyuki Nishimura*, Shinya Miura1 and Mitsuyoshi Suzuki1
Hokkaido Prefectural Agricultural Experiment Station, Nakashibetsu, Hokkaido 080-1100, Japan
ABSTRACT : This study aimed to use field data collected by the Hokkaido Dairy Cattle Milk Recording and Testing programs to estimate genetic parameters for concentration of milk urea nitrogen (MUN) and predicted Digestive Crude Protein Percentage of requirement (DCPun). Edited data consisted of 5,797,500 test-day records of MUN and yields of milk, fat, and protein obtained from 783,271cows in Holstein herds in Hokkaido, Japan. Data were divided into four datasets; for the first, second, third and fourth lactations. Two analyses were performed on data from each lactation. First, ANOVA was used to estimate the significance of the effects of several environmental factors on MUN and DCPun, after absorbing the Herd-Test-Day (HTD) effects. The effects of DIM and age・season effects had significant impact on MUN and DCPun. The second used a multi-traits repeatability model (MTRM) to estimate heritabilities and genetic correlations of milk with MUN and DCPun. Heritability estimates for MUN and DCPun in the first, second, and third lactations were 0.21:0.16, 0.20:0.16, and 0.20:0.18, respectively. Genetic correlations for milk with MUN and DCPun in the first, second, and third lactations were 0.02 ~ 0.17, and -0.25 ~ -0.39, respectively. The results indicate that MUN and DCPun are possibly effective tools for improving the energy balance, but that the relationships between MUN and other economically important traits such as feed efficiency, metabolic disease and fertility are still necessary. (Asian-Aust. J. Anim. Sci. 2005. Vol 18, No. 9 : 1209-1216) Key Words : Hokkaido Holstein, Milk Urea Nitrogen, Predicted Digestive Crude Protein, Herd-test-day, Combined Effect of Age-Season and DIM, Multi-Traits Repeatability Model, Heritability, Genetic Correlations
* Corresponding Author: Kazuyuki Nishimura. Tel: +81(0)153-72-2116, Fax: +81(0)153-73-5329, E-mail: [email protected] 1 Obihiro University of Agriculture and Veterinary Medicine, Obihiro 080-8555, Japan. Received November 1, 2004; Accepted April 26, 2005
NISHIMURA ET AL.
1210
environmental influences on MUN and DCPun, and to estimate genetic variances for MUN and DCPun; also included was the investigation of any genetic correlations between milk yield and MUN and/or DCPun. A test-day (TD) model was applied to data for the various traits, and genetic effects were estimated using fixed regressions.
MATERIAL AND METHODS
Data
Data for this study were collected by the Dairy Cattle Milk Recording and Testing Association in Hokkaido (Sapporo, Japan) between February 2000 and January 2003. Milk samples collected on regular test days from registered Holstein cattle in 5,266 Hokkaido dairy herds were tested for MUN as part of a standard program that evaluates concentrations of fat, protein and somatic cells in milk. In total, 6,288,693 test-day records were provided, of which 5,797,500 contained a valid MUN score.
The data were first corrected to eliminate records with daily milk yields, MUN, fat %, and protein % that were ≥80.1 kg, 50.1 mg/dl, 8.1% and 5.1%, respectively. Records with parities ≥11th and age at calving <15 months records were also deleted, as were records without information of yields. Lactations records were deleted if first reported TD was less than 5 DIM and the last TD was more than 401 days in milk (DIM). Analyses of MUN data were applied to the first three parities, and data from later parities were named ≥4th. Age at calving was between 16 and 40, 29 and 60, 41 and 72, and 52 and 120 mo in lactations 1, 2, 3 and ≥4, respectively. Following this correction of the records, a total of 5,674,904 records from 783,271 cows remained. The pedigree information used in this study was extracted from the database used for the national genetic evaluation of dairy traits in Japan. The cow registration numbers from the file of phenotypic records were matched as were available to the national pedigree file, which left 781,990 cows in the dataset. Thus, the final data set used for subsequent analyses contained 5,674,904 test-day records. The data included 1,593,034; 1,381,259; 1,050,836; and 1,649,775 records from lactations one, two, three, and four or over, respectively.
Environmental effects
An ANOVA was performed of the effects of certain systematic factors on test-day MUN using the GLM procedure in SAS (SAS Institute Inc., 1990).
It is necessary to consider that the energy exchanges were influenced by seasonal effects (month of partum) and the stage of milking day (DIM). The analysis included the influence of the age at calving, and the SCC linear score (LS) that had a correlation with lactose, which was function of the osmotic pressure. We use the model seen in [1];
yijklm = HYi+Mj+DIMk+b1(Ageijkl) +b2(Lactiijkl)+b3(LSijkl)+eijklm [1]
where yijklm = the observed value for MUN or DCPun
associated with the record m of cow l : HYi = the effect of herd-year i : Mj = the effect of the combination of the jth test month : DIMk = the effect of the kth class for DIM class (≤10, 11-20, ⋅⋅⋅⋅⋅ 300-310, 311-365, and ≥366) : Ageijkl = the age at calving of cow l : Lactiijkl = test-day lactose yield of cow l: LSijkl = test-day LS of cow l : bn = coefficients for the regression of MUN or DCPun on test-day yields of age (n = 1), lactose (n = 2), and LS (n = 3): and eijklm = residual error, and HY effect was 18,994, so it was absorbed.
Next, there were different yields for MUN or UN, because the intake of nitrogen was effective and digestion by parity age at calving and season in the herd. It was necessary to obtain the yield on the test day for MUN or DCPun. Thus, we used another model [2]. The numbers of herd-test-days (HTD) were 127,060, 127,503, 126,962, and 127,689 in lactations one, two, three, and four or over, respectively. Three classes for age at calving (in mo) were established for each lactation (first: 16 to 24, 25 to 29, and 30 to 40 mo; second: 29 to 40, 41 to 50, and 51 to 60 mo; third: 41 to 50, 51 to 60, and 61 to 72mo; and ≥fourth; 52 to 70, 71 to 90, and 91 to120 mo). Calving season were 1: summer (April to September) and 2: winter (October to March). Stage of lactation was defined by 40 classes for DIM (<10, 11-20, ⋅⋅⋅⋅⋅ 381-390, 391-400). The following model was used to separately apply the test to data from each lactation:
yijklm = HTDi+(AS×DIM)jk+b1(MYijkl)
+b2(FYiijkl)+b3(PYijkl)+eijklm [2] where yijklm = the observed value for MUN or DCPun
associated with the record m of cow l: HTDi = the effect of HTD effect i: AS×DIM = the effect of the combination of the jth age-season and the kth class for DIM class MYijkl = test-day milk yield for the record m of cow l: FYijkl = test-day fat yield for record m of cow l: PYijkl = test-day protein yield for the record m of cow l: bn = coefficients for the regression of MUN on test-day yields of milk (n = 1), fat (n = 2), and protein (n = 3): and eijklm = residual error.
Genetic effects
The estimation of genetic parameters of MUN or DCPun was performed using just 10 subset files for each of the parities because PC performance was limited. MUN and DCPun were affected by milk yield. As it was necessary to consider DIM, we used a small parameter of Wilmink’s milking curve. The fixed regressions described the general shape of the curve for all cows belonging to a particular subclass for a given environmental effect.
GENETIC RELATIONSHIPS BETWEEN MUN PREDICTED DCP
1211
yijklm = HTDi+(AS×DIM)jk+b1t +b2 exp(-0.05t) +al+pel+eijklm [3]
where, yijklm = the observed value of MUN or DCPun
associated with the record m of cow l: HTDi = the effect of HTD i: AS×DIM = the effect of the combination of the jth age-season and the kth class for DIM class: b1, b2 = coefficients for the regression of the lactation curve by Wilmink: t = DIM: al = additive genetic effect on animal l: pel = permanent environmental effect on animal l: and eijklm
= residual error. 2variate repeatability model was used for milk and
MUN, DCPun. Variance components were estimated with AIREMLF90 (Misztal, 1999).
RESULTS AND DISCUSSION
Environmental effects
The mean MUN concentration for the final dataset of the 5,797,500 test-day records was 11.14 mg/dl with a range from 0 to 50 mg/dl. The distributions of MUN in each lactation were not significantly different from normal. Means and standard deviations for all six traits, in each lactation, are in Table 1. Means for yield traits were within the ranges typically observed in Hokkaido. The mean MUN concentration for primiparous cows of 10.8 mg/dl was lower than the means for second (11.2 mg/dl), third (11.2 mg/dl) or ≥fourth (11.3 mg/dl) lactations. Wood et al. (2003) reported similar trends for MUN. They observed
means of 12.41, 12.80, and 12.74 mg/dl for lactations 1, 2, and 3, respectively. Fergsun (2004) observed means of 12.88, 13.20, and 13.05 mg/dl for lactations 1, 2, and ≥3, respectively. On the other hand, DCPun was 144.8, 138.6, 136.5, and 144.2%, for lactations 1, 2, and 3, respectively (record numbers were reduced after the 4th to the 10th parities, but DCPun was elevated from 137.2% to 152.1%: not to shown in the data) (Table 1).
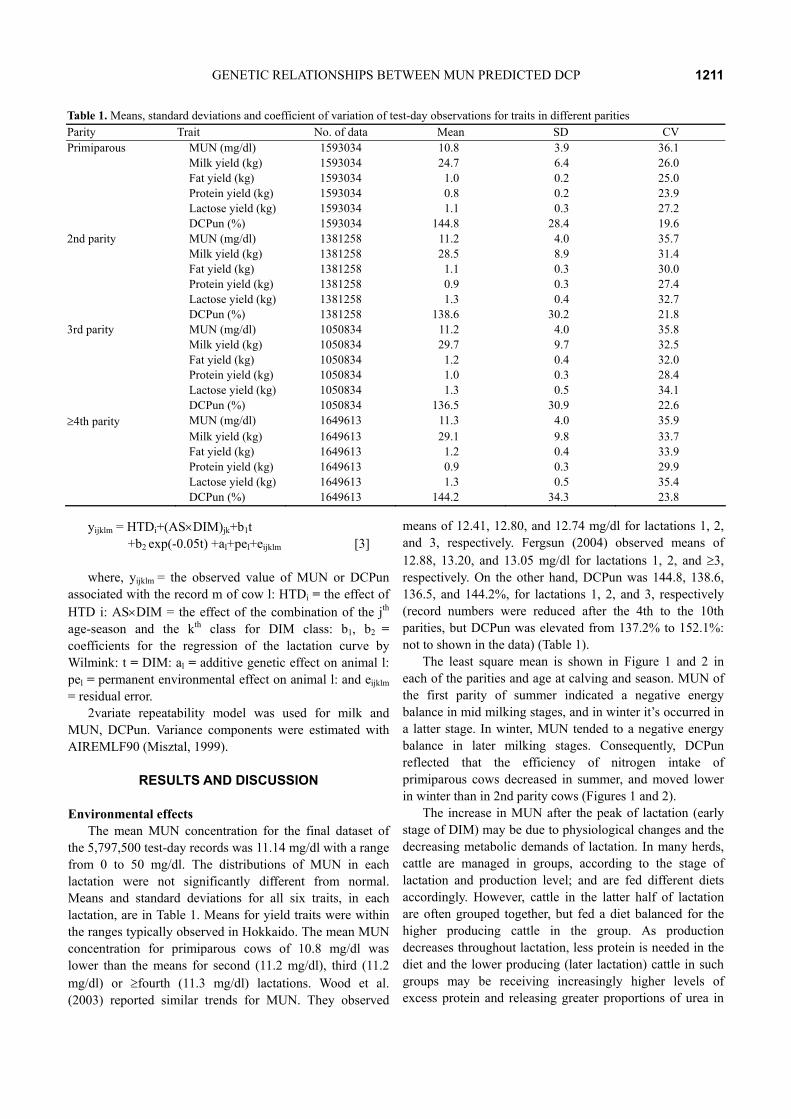
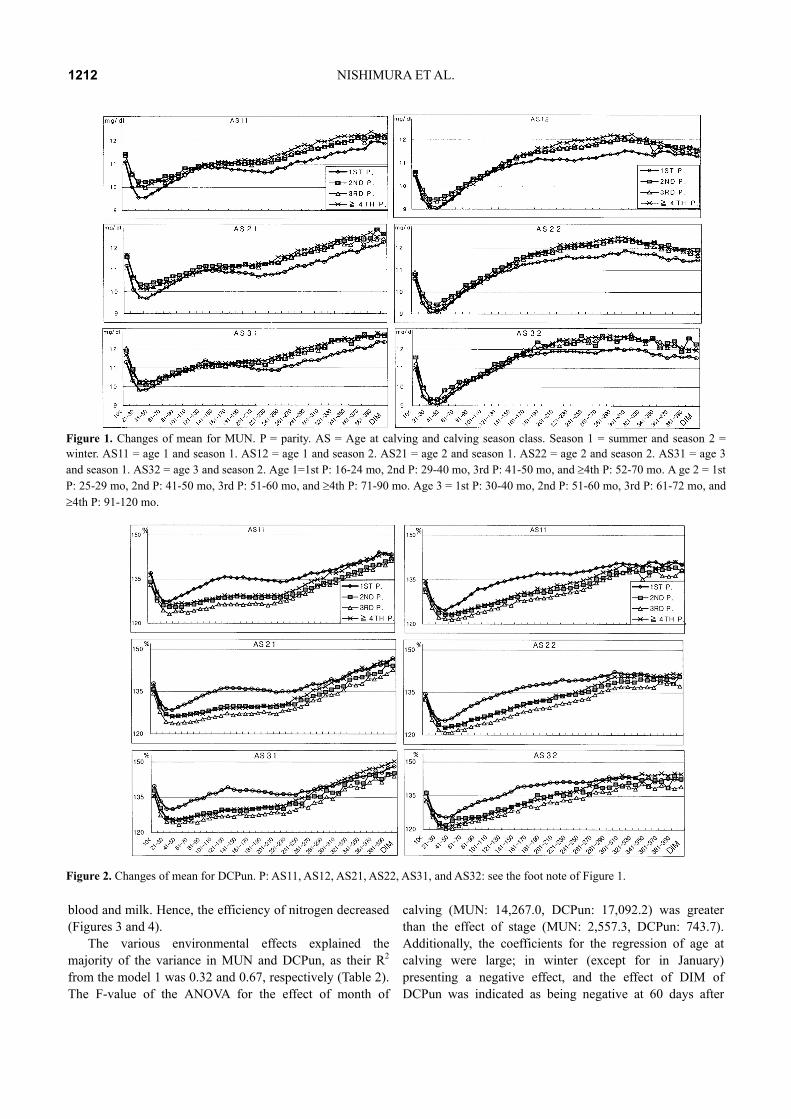
The least square mean is shown in Figure 1 and 2 in each of the parities and age at calving and season. MUN of the first parity of summer indicated a negative energy balance in mid milking stages, and in winter it’s occurred in a latter stage. In winter, MUN tended to a negative energy balance in later milking stages. Consequently, DCPun reflected that the efficiency of nitrogen intake of primiparous cows decreased in summer, and moved lower in winter than in 2nd parity cows (Figures 1 and 2).
The increase in MUN after the peak of lactation (early stage of DIM) may be due to physiological changes and the decreasing metabolic demands of lactation. In many herds, cattle are managed in groups, according to the stage of lactation and production level; and are fed different diets accordingly. However, cattle in the latter half of lactation are often grouped together, but fed a diet balanced for the higher producing cattle in the group. As production decreases throughout lactation, less protein is needed in the diet and the lower producing (later lactation) cattle in such groups may be receiving increasingly higher levels of excess protein and releasing greater proportions of urea in
Table 1. Means, standard deviations and coefficient of variation of test-day observations for traits in different parities Parity Trait No. of data Mean SD CV Primiparous MUN (mg/dl) 1593034 10.8 3.9 36.1 Milk yield (kg) 1593034 24.7 6.4 26.0 Fat yield (kg) 1593034 1.0 0.2 25.0 Protein yield (kg) 1593034 0.8 0.2 23.9 Lactose yield (kg) 1593034 1.1 0.3 27.2 DCPun (%) 1593034 144.8 28.4 19.6 2nd parity MUN (mg/dl) 1381258 11.2 4.0 35.7 Milk yield (kg) 1381258 28.5 8.9 31.4 Fat yield (kg) 1381258 1.1 0.3 30.0 Protein yield (kg) 1381258 0.9 0.3 27.4 Lactose yield (kg) 1381258 1.3 0.4 32.7 DCPun (%) 1381258 138.6 30.2 21.8 3rd parity MUN (mg/dl) 1050834 11.2 4.0 35.8 Milk yield (kg) 1050834 29.7 9.7 32.5 Fat yield (kg) 1050834 1.2 0.4 32.0 Protein yield (kg) 1050834 1.0 0.3 28.4 Lactose yield (kg) 1050834 1.3 0.5 34.1 DCPun (%) 1050834 136.5 30.9 22.6 ≥4th parity MUN (mg/dl) 1649613 11.3 4.0 35.9 Milk yield (kg) 1649613 29.1 9.8 33.7 Fat yield (kg) 1649613 1.2 0.4 33.9 Protein yield (kg) 1649613 0.9 0.3 29.9 Lactose yield (kg) 1649613 1.3 0.5 35.4 DCPun (%) 1649613 144.2 34.3 23.8
NISHIMURA ET AL.
1212
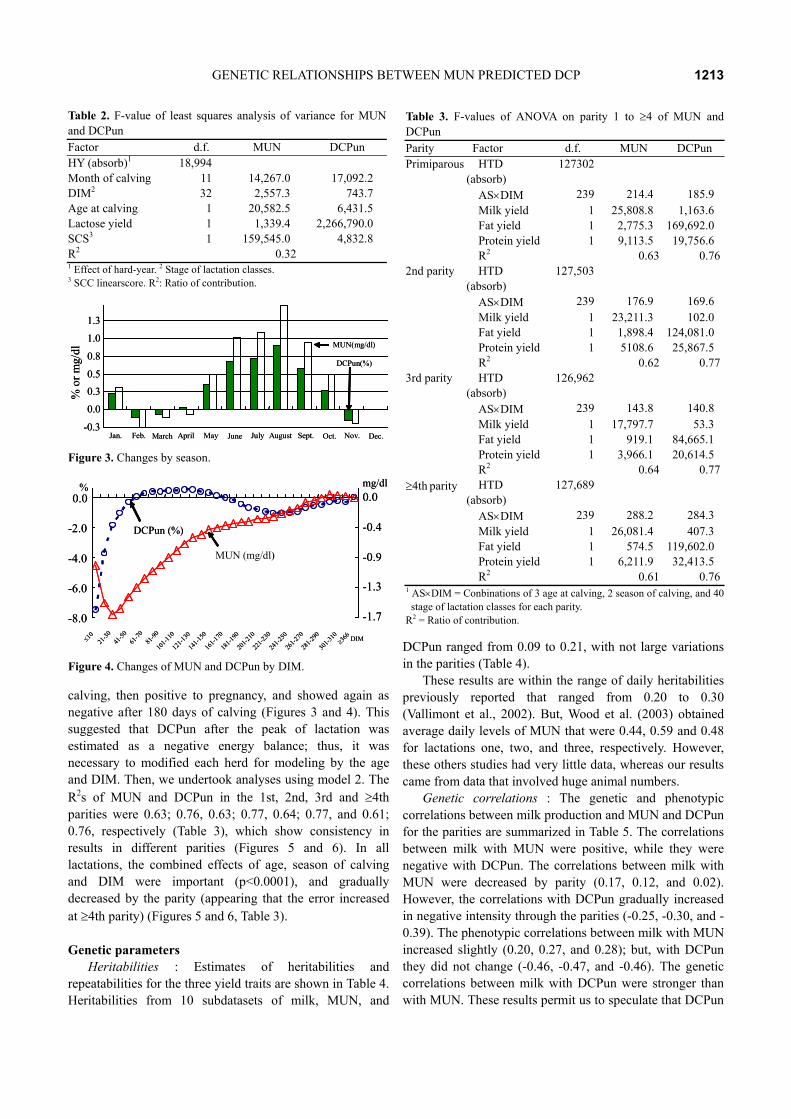
blood and milk. Hence, the efficiency of nitrogen decreased (Figures 3 and 4).
The various environmental effects explained the majority of the variance in MUN and DCPun, as their R2 from the model 1 was 0.32 and 0.67, respectively (Table 2). The F-value of the ANOVA for the effect of month of
calving (MUN: 14,267.0, DCPun: 17,092.2) was greater than the effect of stage (MUN: 2,557.3, DCPun: 743.7). Additionally, the coefficients for the regression of age at calving were large; in winter (except for in January) presenting a negative effect, and the effect of DIM of DCPun was indicated as being negative at 60 days after
Figure 1. Changes of mean for MUN. P = parity. AS = Age at calving and calving season class. Season 1 = summer and season 2 = winter. AS11 = age 1 and season 1. AS12 = age 1 and season 2. AS21 = age 2 and season 1. AS22 = age 2 and season 2. AS31 = age 3 and season 1. AS32 = age 3 and season 2. Age 1=1st P: 16-24 mo, 2nd P: 29-40 mo, 3rd P: 41-50 mo, and ≥4th P: 52-70 mo. A ge 2 = 1st P: 25-29 mo, 2nd P: 41-50 mo, 3rd P: 51-60 mo, and ≥4th P: 71-90 mo. Age 3 = 1st P: 30-40 mo, 2nd P: 51-60 mo, 3rd P: 61-72 mo, and ≥4th P: 91-120 mo.
Figure 2. Changes of mean for DCPun. P: AS11, AS12, AS21, AS22, AS31, and AS32: see the foot note of Figure 1.
GENETIC RELATIONSHIPS BETWEEN MUN PREDICTED DCP
1213
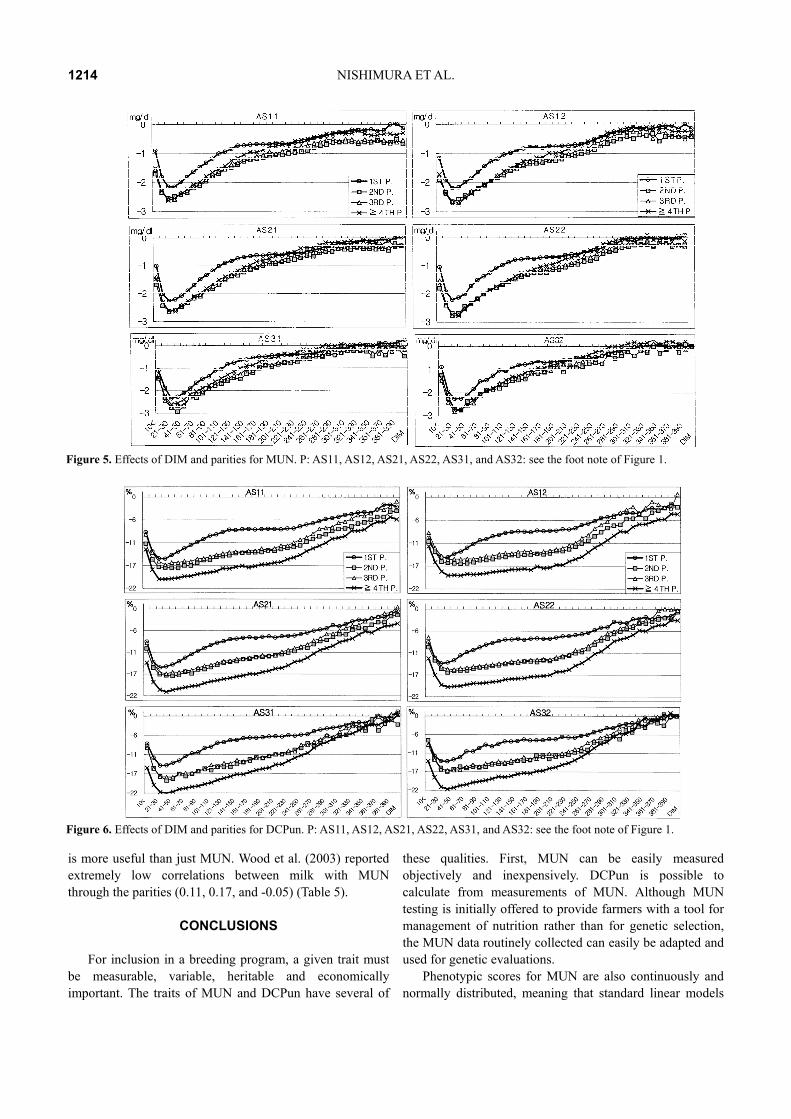
calving, then positive to pregnancy, and showed again as negative after 180 days of calving (Figures 3 and 4). This suggested that DCPun after the peak of lactation was estimated as a negative energy balance; thus, it was necessary to modified each herd for modeling by the age and DIM. Then, we undertook analyses using model 2. The R2s of MUN and DCPun in the 1st, 2nd, 3rd and ≥4th parities were 0.63; 0.76, 0.63; 0.77, 0.64; 0.77, and 0.61; 0.76, respectively (Table 3), which show consistency in results in different parities (Figures 5 and 6). In all lactations, the combined effects of age, season of calving and DIM were important (p<0.0001), and gradually decreased by the parity (appearing that the error increased at ≥4th parity) (Figures 5 and 6, Table 3).
Genetic parameters
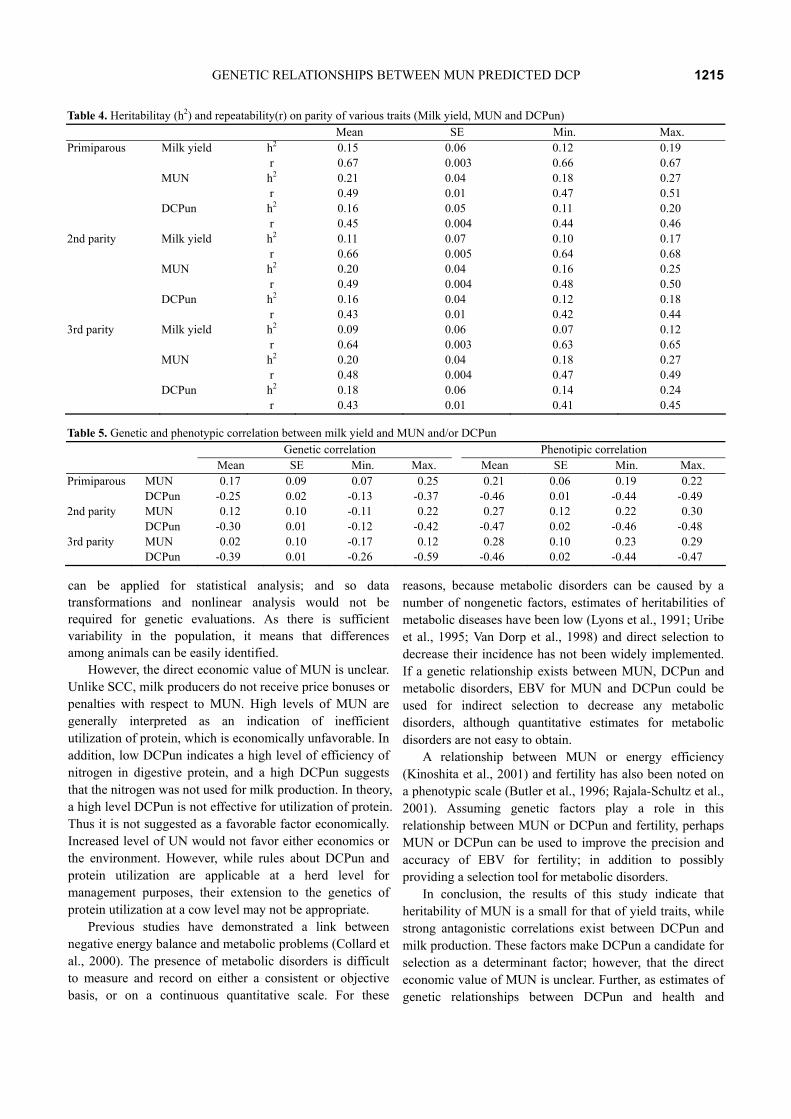
Heritabilities : Estimates of heritabilities and repeatabilities for the three yield traits are shown in Table 4. Heritabilities from 10 subdatasets of milk, MUN, and
DCPun ranged from 0.09 to 0.21, with not large variations in the parities (Table 4).
These results are within the range of daily heritabilities previously reported that ranged from 0.20 to 0.30 (Vallimont et al., 2002). But, Wood et al. (2003) obtained average daily levels of MUN that were 0.44, 0.59 and 0.48 for lactations one, two, and three, respectively. However, these others studies had very little data, whereas our results came from data that involved huge animal numbers.
Genetic correlations : The genetic and phenotypic correlations between milk production and MUN and DCPun for the parities are summarized in Table 5. The correlations between milk with MUN were positive, while they were negative with DCPun. The correlations between milk with MUN were decreased by parity (0.17, 0.12, and 0.02). However, the correlations with DCPun gradually increased in negative intensity through the parities (-0.25, -0.30, and -0.39). The phenotypic correlations between milk with MUN increased slightly (0.20, 0.27, and 0.28); but, with DCPun they did not change (-0.46, -0.47, and -0.46). The genetic correlations between milk with DCPun were stronger than with MUN. These results permit us to speculate that DCPun
Table 2. F-value of least squares analysis of variance for MUN and DCPun Factor d.f. MUN DCPun HY (absorb)1 18,994 Month of calving 11 14,267.0 17,092.2 DIM2 32 2,557.3 743.7 Age at calving 1 20,582.5 6,431.5 Lactose yield 1 1,339.4 2,266,790.0 SCS3 1 159,545.0 4,832.8 R2 0.32 1 Effect of hard-year. 2 Stage of lactation classes. 3 SCC linearscore. R2: Ratio of contribution.
Table 3. F-values of ANOVA on parity 1 to ≥4 of MUN and DCPun Parity Factor d.f. MUN DCPun Primiparous HTD
(absorb) 127302
AS×DIM 239 214.4 185.9 Milk yield 1 25,808.8 1,163.6 Fat yield 1 2,775.3 169,692.0 Protein yield 1 9,113.5 19,756.6 R2 0.63 0.762nd parity HTD
(absorb) 127,503
AS×DIM 239 176.9 169.6 Milk yield 1 23,211.3 102.0 Fat yield 1 1,898.4 124,081.0 Protein yield 1 5108.6 25,867.5 R2 0.62 0.773rd parity HTD
(absorb) 126,962
AS×DIM 239 143.8 140.8 Milk yield 1 17,797.7 53.3 Fat yield 1 919.1 84,665.1 Protein yield 1 3,966.1 20,614.5 R2 0.64 0.77≥4th parity HTD
(absorb) 127,689
AS×DIM 239 288.2 284.3 Milk yield 1 26,081.4 407.3 Fat yield 1 574.5 119,602.0 Protein yield 1 6,211.9 32,413.5 R2 0.61 0.761 AS×DIM = Conbinations of 3 age at calving, 2 season of calving, and 40
stage of lactation classes for each parity. R2 = Ratio of contribution.
-0.3
0.0
0.30.5
0.8
1.0
1.3
Jan. Feb. March April May June July August Sept. Oct. Nov. Dec.
% o
r mg/
dl
DCPun(%)
MUN(mg/dl)
-0.3
0.0
0.30.5
0.8
1.0
1.3
Jan. Feb. March April May June July August Sept. Oct. Nov. Dec.
% o
r mg/
dl
DCPun(%)
MUN(mg/dl)
Figure 3. Changes by season.
Figure 4. Changes of MUN and DCPun by DIM.
-8.0
-6.0
-4.0
-2.0
0.0
≤10
21-30
41-50
61-70
81-90
101-1
10
121-1
30
141-1
50
161-1
70
181-1
90
201-2
10
221-2
30
241-2
50
261-2
70
281-2
90
301-3
10≥3
66 DIM
mg/dl
-1.7
-1.3
-0.9
-0.4
0.0%
DCPun (%)
MUN (mg/dl)
-8.0
-6.0
-4.0
-2.0
0.0
≤10
21-30
41-50
61-70
81-90
101-1
10
121-1
30
141-1
50
161-1
70
181-1
90
201-2
10
221-2
30
241-2
50
261-2
70
281-2
90
301-3
10≥3
66 DIM
mg/dl
-1.7
-1.3
-0.9
-0.4
0.0%
DCPun (%)
MUN (mg/dl)
NISHIMURA ET AL.
1214
is more useful than just MUN. Wood et al. (2003) reported extremely low correlations between milk with MUN through the parities (0.11, 0.17, and -0.05) (Table 5).
CONCLUSIONS
For inclusion in a breeding program, a given trait must
be measurable, variable, heritable and economically important. The traits of MUN and DCPun have several of
these qualities. First, MUN can be easily measured objectively and inexpensively. DCPun is possible to calculate from measurements of MUN. Although MUN testing is initially offered to provide farmers with a tool for management of nutrition rather than for genetic selection, the MUN data routinely collected can easily be adapted and used for genetic evaluations.
Phenotypic scores for MUN are also continuously and normally distributed, meaning that standard linear models
Figure 5. Effects of DIM and parities for MUN. P: AS11, AS12, AS21, AS22, AS31, and AS32: see the foot note of Figure 1.
Figure 6. Effects of DIM and parities for DCPun. P: AS11, AS12, AS21, AS22, AS31, and AS32: see the foot note of Figure 1.
GENETIC RELATIONSHIPS BETWEEN MUN PREDICTED DCP
1215
can be applied for statistical analysis; and so data transformations and nonlinear analysis would not be required for genetic evaluations. As there is sufficient variability in the population, it means that differences among animals can be easily identified.
However, the direct economic value of MUN is unclear. Unlike SCC, milk producers do not receive price bonuses or penalties with respect to MUN. High levels of MUN are generally interpreted as an indication of inefficient utilization of protein, which is economically unfavorable. In addition, low DCPun indicates a high level of efficiency of nitrogen in digestive protein, and a high DCPun suggests that the nitrogen was not used for milk production. In theory, a high level DCPun is not effective for utilization of protein. Thus it is not suggested as a favorable factor economically. Increased level of UN would not favor either economics or the environment. However, while rules about DCPun and protein utilization are applicable at a herd level for management purposes, their extension to the genetics of protein utilization at a cow level may not be appropriate.
Previous studies have demonstrated a link between negative energy balance and metabolic problems (Collard et al., 2000). The presence of metabolic disorders is difficult to measure and record on either a consistent or objective basis, or on a continuous quantitative scale. For these
reasons, because metabolic disorders can be caused by a number of nongenetic factors, estimates of heritabilities of metabolic diseases have been low (Lyons et al., 1991; Uribe et al., 1995; Van Dorp et al., 1998) and direct selection to decrease their incidence has not been widely implemented. If a genetic relationship exists between MUN, DCPun and metabolic disorders, EBV for MUN and DCPun could be used for indirect selection to decrease any metabolic disorders, although quantitative estimates for metabolic disorders are not easy to obtain.
A relationship between MUN or energy efficiency (Kinoshita et al., 2001) and fertility has also been noted on a phenotypic scale (Butler et al., 1996; Rajala-Schultz et al., 2001). Assuming genetic factors play a role in this relationship between MUN or DCPun and fertility, perhaps MUN or DCPun can be used to improve the precision and accuracy of EBV for fertility; in addition to possibly providing a selection tool for metabolic disorders.
In conclusion, the results of this study indicate that heritability of MUN is a small for that of yield traits, while strong antagonistic correlations exist between DCPun and milk production. These factors make DCPun a candidate for selection as a determinant factor; however, that the direct economic value of MUN is unclear. Further, as estimates of genetic relationships between DCPun and health and
Table 4. Heritabilitay (h2) and repeatability(r) on parity of various traits (Milk yield, MUN and DCPun) Mean SE Min. Max. Primiparous Milk yield h2 0.15 0.06 0.12 0.19 r 0.67 0.003 0.66 0.67 MUN h2 0.21 0.04 0.18 0.27 r 0.49 0.01 0.47 0.51 DCPun h2 0.16 0.05 0.11 0.20 r 0.45 0.004 0.44 0.46 2nd parity Milk yield h2 0.11 0.07 0.10 0.17 r 0.66 0.005 0.64 0.68 MUN h2 0.20 0.04 0.16 0.25 r 0.49 0.004 0.48 0.50 DCPun h2 0.16 0.04 0.12 0.18 r 0.43 0.01 0.42 0.44 3rd parity Milk yield h2 0.09 0.06 0.07 0.12 r 0.64 0.003 0.63 0.65 MUN h2 0.20 0.04 0.18 0.27 r 0.48 0.004 0.47 0.49 DCPun h2 0.18 0.06 0.14 0.24 r 0.43 0.01 0.41 0.45
Table 5. Genetic and phenotypic correlation between milk yield and MUN and/or DCPun Genetic correlation Phenotipic correlation Mean SE Min. Max. Mean SE Min. Max. Primiparous MUN 0.17 0.09 0.07 0.25 0.21 0.06 0.19 0.22 DCPun -0.25 0.02 -0.13 -0.37 -0.46 0.01 -0.44 -0.49 2nd parity MUN 0.12 0.10 -0.11 0.22 0.27 0.12 0.22 0.30 DCPun -0.30 0.01 -0.12 -0.42 -0.47 0.02 -0.46 -0.48 3rd parity MUN 0.02 0.10 -0.17 0.12 0.28 0.10 0.23 0.29 DCPun -0.39 0.01 -0.26 -0.59 -0.46 0.02 -0.44 -0.47
NISHIMURA ET AL.
1216
fertility traits are currently not available, future research regarding DCPun should examine genetic and phenotypic correlations between DCPun and various fitness traits. Particular attention needs to be paid to the relationships between DCPun and those traits that are related to fertility.
ACKNOWLEDGMENTS
This research was partly supported by a grant from the
local government of Hokkaido. The authors are grateful to the Dairy Cattle Milk Recording and Testing Association in Hokkaido (Sapporo, Japan) for providing data, and the Hokkaido Holstein Agricultural Coop., (Sapporo, Japan) is gratefully acknowledged for providing pedigree information. We also thank Dr. Ignacy Misztal and Dr. Shogo Tsuruta for the use of his software. We are grateful for the assistance of Dr. Shunzoh Miyoshi and Dr. Keigo Kuchida of Obihiro University A and VM, (Obihiro, Japan).
REFERENCES
Baker, L. D., J. D. Ferguson and W. Chalupa. 1995. Responses in
urea and true protein to different feeding schemes for dairy cows. J. Dairy Sci. 78:2424-2434.
Broderick, G. A. and M. K. Clayton. 1997. A statistical evaluation of animal and nutritional factors influencing concentrations of milk urea nitrogen. J. Dairy Sci. 80:2964-2970.
Butler, W. R., J. J. Calaman and S. W. Beam. 1996. Plasma and milk urea nitrogen in relation to pregnancy rate in lactating dairy cattle. J. Anim. Sci. 74:858-865.
Collard, B. L., P. J. Boecttcher, J. C. M.Dekkers, D. Petitckere and L. R. Schaeffer. 2000. Relationships between energy balance and health traits of dairy cattle in early lactation. J. Dairy Sci. 83:2683-2690.
Eicher, R., E. Bouchar and M. Bigras-Poulin. 1999. Factors affecting milk urea nitrogen and protein concentrations in quebec dairy cows. Prv. Vet. Med. 39:53-63.
Fergsun, J. D. 2002. Milk Urea Nitrogen.http://cahpwww.vet.u-penn.edu/mun/mun_info/html.Accessed February 2, 2004.
Jonker, J. S., R. A. Kohn and R. A. Erdman. 1998. Using milk urea nitrogen to predict nitrogen excretion and utilization efficiency in lactating dairy cows. J. Dairy Sci. 81:2681-2692.
Jonker, J. S., R. A. Kohn and R. A. Erdman. 1999. Milk Urea Nitrogen Target Concentrations for Dairy Cows Fed According to National Research Council Recommendations. J. Dairy Sci. 82:1261-1273.
Kinoshita, A., S. Kamimura, H. Imamura, S. Ookutsu, M. Yoshida and Y. Nakanishi. 2001. Influence of different nutrient conditions on ovarian follicular dynamics in dairy cows. Anim. Sci. J. 72(7):J20-J27.
Kohn, R. A., Z. Dou, J. D. Ferguson and R. C. Boston. 1997. Asensitive Analysis of Nitrogen Loses from Dairy Farms. J. Environ. Manag. 50:417-428.
Kohn, R. A., K. F. Kalsheur and E. Russek-Cohen. 2002. Evaluation of Models to Estimate Urinary Nitrogen and Expected Milk Urea Nitrogen. J. Dairy Sci. 85:227-233.
Lyons, D. T., A. E. Freeman and A. L. Kuck. 1991. Genetics of health traits in holstein cattle. J. Dairy Sci. 74:1092-1100.
Mackle, T. R., D. A. Dwyer, K. L. Ingvartsen, P. Y. Chouinard, J. M.Lynch and D. E. Bauman. 1999. Effects of Insulin and Amino Acidos on Milk Protein Concentration and Yield from Dairy Cows. J. Dairy Sci. 82:1512-1524.
Misztal, I. 1999. REMLF90 Manual.ftp://nce.ads.uga.edu/pub/ ignacy/blupf90/. Accesed June 21, 2003.
Ootani, F., K. Ueno and H. Oshio. 2001. Simple monitoring index by un and cp percentage of requirement of milking cows. Info. Anim. 14:51-52.
Rajala-Schultz, P. J., W. J. A. Saville, G. S. Franzer and T. E. Wittum. 2001. Association between milk urea nitrogen and fertility in ohaio dairy cows. J. Dairy Sci. 84:482-489.
SAS Institute Inc. 1990. SAS/STAT User’s Guide. Ver 6.0. Uribe, H. A., B. W. Kennedy, S. W. Martin and D. F. Kelton. 1995.
Genetic parameters for common health disorders of holstein cows. J. Dairy Sci. 78:421-430.
Vagnoni, D. B. and G. A. Broderick. 1997. Effects of supplementation of ruminally undergraded protein to lactating cows fed alfalfa hay or silage. J. Dairy Sci. 80:1703-1712.
Vallimont, E., J. Hyman, W. E. Gorges, L. A. Holden, M. L. O’Connor, C. D. Dechow and J. B. Cooper. 2002. A population study of milk urea nitrogen. J. Dairy Sci. 85. Suppl. 1:323 (Abstr.).
Van Dorp, T. E., J. C. Dekkers, S. W. Martin and J. P. Noordhuizen. 1998. Genetic parameters of health disorders, and relationships with 305-day milk yield and conformation traits of registered holstein cows. J. Dairy Sci. 81:2264-2270.
Wood, G. M., P. J. Boettcher, J. Jamrozik, G. B. Jansen and D. F. Kelton. 2003. Estimation of genetic parameters for concentrations of milk urea nitrogen. J. Dairy Sci. 86:2462-2469.